
Submitted:
31 October 2024
Posted:
01 November 2024
You are already at the latest version
Abstract
It is well understood that near midnight, the Harang Discontinuity separates the auroral duskside eastward electrojet (EEJ) and dawnside westward electrojet (WEJ) and associated plasma flows driven by enhanced magnetospheric convections via Magnetosphere-Ionosphere (M-I) coupling. There are conflicting reports regarding the significance of Region1 (R1) and R2 currents and the enhancement of Sub-Auroral Polarization Streams (SAPS) in the Harang region. We investigate the M-I conjugate Harang and SAPS phenomena using multipoint satellite observations. Results show the inner-magnetosphere (1) Harang region at midnight between the plasmapause and the closed/open field line boundary and (2) strong SAPS electric field (EX≈30 mV/m; in magnitude) in a fast-time voltage generator (VGFT) near the plasmapause, and the topside-ionosphere (3) Harang Discontinuity with R1 and R2 currents flown along, and (4) enhanced SAPS flow (~1,800 m/s) in the underlying VGFT system requiring no R2 currents. From these (1-4) findings we conclude (i) the significance of both R1 and R2 currents in the observed M-I conjugate Harang phenomenon’s development, (ii) the different development of the reversing EEJ-WEJ compared to the regular auroral EEJ and WEJ in the topside-ionosphere R1-R2 system, and (iii) the R2 currents’ absence in the enhanced SAPS flow newly formed in the VGFT system.
Keywords:
plasmasphere
; upper atmosphere
; ionosphere
; magnetosphere–ionosphere coupling
; energy and particle transport
; hot zone
; Harang Discontinuity
; SAPS
; plasmapause
; SAR arc
1. Introduction
Under southward interplanetary magnetic field (IMF) conditions (BZ<0), the polar convection electric (E) field of magnetospheric origin convects the ionospheric plasma in a two-cell convection pattern in which the plasma drifts (E×B) antisunward (from midday to midnight) across the polar cap (between the dusk and dawn convection cells) and then sunward (forming return flows) along the flanks of the dusk and dawn cells [1].
As shown in Figure 1, the azimuthal (eastward-westward) Hall currents (JH) flow dominantly below ~125 km altitude in the negative E×B drift direction along the auroral zone and their concentrated flow forms the auroral electrojet: the eastward electrojet (EEJ) on the duskside and the westward electrojet (WEJ) on the dawnside. Across the oval, the meridional (poleward-equatorward) Pedersen currents (JP) flow dominantly above ~125 km altitude [2] and connect the higher-latitude Region 1 (R1) and lower-latitude R2 field-aligned currents (FACs) as was first described by Iijima & Potemra [3]. On the duskside and within the EEJ’s regime, the poleward JP connects the downward (↓) R2 FACs with the upward (↑) R1 FACs. Oppositely, on the dawnside and within the WEJ’s regime, the equatorward JP connects the ↓R1-↑R2 FACs [4-6]. Since auroral electrojet currents are the main cause of magnetic (B) field disturbances, the magnetic disturbance computed for the horizontal (H) geomagnetic B field component (as ΔH=Hdisturbed-Hquiet) is a good indicator of the auroral electrojet [7]: EEJ (ΔH >0) and WEJ (ΔH <0).
First described by Harang [8], the Harang Discontinuity (HD), called by Heppner [9] but also known Harang Reversal (HR), was depicted by the mapped ΔH contours appearing as a ΔH reversal or discontinuity within a narrow magnetic local time (MLT) sector near magnetic midnight. Within a narrow region of the discontinuity (marked as HD in Figure 1), a reversal in the auroral electrojet appeared where the dominating EEJ became westward directed [8]. This led to a scenario where the EEJ (situated equatorward of the discontinuity) and the WEJ (situated poleward of the discontinuity) appeared to be overlapping within a narrow longitude region or MLT sector (marked as shaded region in yellow in Figure 1). The reversal was also depicted by the JP-related meridional E field as a gradual direction change where the dominating poleward E field became equatorward directed ([9-12]. And likewise, in the azimuthal E×B plasma convection, where the reversal separated oppositely directed convection flows [13] while velocity shear developed along the discontinuity [11]. Since the early study of Maynard [10], it is well understood that the Harang region is magnetosphere-ionosphere (M-I) conjugate. While the discontinuity’s poleward region maps well into the plasmasheet, its equatorward region maps close to the plasmasheet’s inner edge [14]. But in the magnetic midnight sector, where the Harang region maps into the magnetotail, the discontinuity can also be interpreted as a fault line separating the inflated and collapsed magnetic field during substorms [10, 15].
Based on theoretical considerations and Rice Convection Model (RCM) simulations, the M-I conjugate Harang Discontinuity’s development in the magnetosphere was explained by Erickson et al. [14] with the dawn-dusk pressure asymmetry developed in the near-Earth plasmasheet. Due to the domination of magnetic pressure gradient and curvature drift over E×B drift, causing ions drifting westward and electrons eastward, a dawn-dusk ion pressure gradient forms since hot ions build up the plasma pressure in the plasmasheet. Consequently, the dawnside depletion of magnetospheric hot ions provides the primary mechanism for the large-scale ↑FACs to map down from the plasmasheet to the center of the auroral zone in the midnight MLT sector. These large-scale ↑FACs include the ↑R1 and ↑R2 FACs (shown in Figure 1), as was defined by Iijima & Potemra [5].
But there are conflicting results reported by previous studies regarding the large-scale FACs’ locations with respect to the Harang region and their roles played in the development of the Harang Discontinuity. Some studies documented the Harang region’s collocations with sufficiently strong R1 FACs causing converging E fields ([14, 16-17], while others with R2 FACs because of the energy-dependent plasma intrusion [18] and also with subauroral flows [19-20], but also with both R1 and R2 FACs where the R1-R2 demarcation line marks the Harang Discontinuity [21]. Subauroral flows include the Sub-Auroral Polarization Streams (SAPS) [22] that are often associated with the Stable Auroral Red (SAR) arc [23] that is a 630 nm redline emission [24] and that is generated by the same heating mechanism that fuels the inner-magnetosphere hot zone [25].
Although these above-mentioned studies demonstrate the Harang region’s complex nature in the coupled M-I system and greatly increase our understanding, there are still significant gaps in our knowledge and understanding. (i) E field observations depicting the entire Harang E field phenomenon in the inner magnetosphere are still missing along with (ii) M-I conjugate Harang region and SAPS observations, and (iii) the large-scale FAC pattern in the Harang region is still not clear.
Motivated by these (i-iii) existing gaps in our knowledge and understanding, we conducted a detailed study investigating the M-I conjugate Harang and SAPS phenomena based on multipoint satellite observations covering two events that occurred on 3 and 6 September 2014. From our significant results we conclude for the two events investigated that (a) both the R1 and R2 FACs were significant in the development of the M-I conjugate Harang phenomenon observed, (b) the mapped down collocated strong SAPS E field drove strong plasma flows in the SAPS channel, and (c) the reversing EEJ-WEJ across the discontinuity developed differently than the regular auroral EEJ and WEJ away from the discontinuity.
2. Materials and Methods
We used data from two (TH-A and TH-D) of the five THEMIS (Time History of Events and Macroscale Interactions during Substorms) satellites (TH-A—TH-E), which orbit the Earth on their highly elliptical orbits in the magnetosphere [26]. During these events, all the THEMIS satellites were travelling close to the equatorial plane in the inner-magnetosphere tail region, but only TH-A and TH-D observed the Harang and SAPS phenomena in the inner magnetosphere. For observing the large-scale E fields, we used the E field components (EX, EY, EZ; mV/m) measured in Geocentric Solar Magnetospheric (GMS) coordinates and provided by the EFI (Electric Field Instrument) suite. For observing the inner-magnetosphere plasma environment, we used the data of hot ion and electron density (Ni, Ne; cm-3), ion temperature (Ti; eV), and ion and electron flux (eV/cm2-s-sr-eV) from the ESA (Electrostatic Analyzer) suite along with the high-energy Ti measured in the perpendicular (⊥) and parallel (‖) directions (Ti⊥, Ti‖; eV) and hot ion and electron pressure (Pi, Pe; eV/cm3) from the MOM (On Board Moment) and GMOM (Ground Calculated Particle Moment) suites. Magnetic (B) components (BX, BY, BZ; nT) were provided by the SCM (Search Coil Magnetometer) suite.
For observing the Harang Discontinuity and SAPS phenomena in the topside ionosphere (at ~840 km altitude), we used multi-instrument DMSP (Defense Meteorological Satellite Program) [27] data collected by spacecraft F17 and F18 along their ~98.7o inclined and 110 min polar orbits. These data include electron density (Ne; 1/cm3), electron and ion temperature (Te, Ti; K), cross-track horizontal (HOR) ion drift (VHOR), and magnetic deflection components (δBX, δBY, δBZ; nT).
For observing magnetotail reconnection related particle injections, we used electron flux measurements taken by the Geostationary Operational Environmental Satellites (GOES) orbiting the Earth once a day at 6.6 RE. GOES-15 observed the magnetic midnight sector and provided average electron flux values measured at various channels: 40, 75, 150, 275 and 475 keV.
Orbit data provided by THEMIS, GOES and DMSP include spacecraft location in GSM coordinates, magnetic local time (MLT; Hr), northern- and southern-hemisphere footprints in geographic [longitude (GLON), oE; latitude (GLAT), oN] coordinates, geomagnetic latitude (MLAT, oN), and L shell (RE).
We also employed a small collection of imageries including the DMSP SSUSI (Special Sensor Ultraviolet Spectrographic Imager) [28] images for observing the auroral oval and the Redline Geospace Observatory (REGO) [29] images for observing the SAR arc.
For specifying the substorm onset times of interest, we utilized the substorm list of Newell & Gjerloev [30] published by SuperMAG along with the auroral electrojet indices of AE (nT) and AL (nT).
3. Results
3.1. The Harang Reversal observed in the inner magnetosphere by THEMIS in Events 1-2
Figure 2 and Figure 3 are constructed with TH-E and TH-D data respectively and depict the inner-magnetosphere Harang and SAPS phenomena observed near magnetic midnight, close to the magnetic equatorial plane, during the 3 and 6 September 2014 events investigated.
In Figure 2a-Figure 3a the orbit plots show that during these events, THEMIS was traveling tailward, close to the magnetic equatorial plane, and observed the Harang region from its earthward edge (marked as symbol dot) on the duskside and to its tailward edge (marked as symbol diamond) on the dawnside.
In Figures 2b-3b, we show again the previously (in Figure 1) illustrated schematic diagram that we simplified and modified for the event of interest based on the THEMIS observations made in the inner magnetosphere. This modified diagram depicts the Harang Discontinuity (marked as HD in red) mapped across the auroral zone near magnetic midnight. As shown, the Harang region’s equatorward edge (marked as shaded region in magenta) is located on the duskside where the duskside ↓R2 and dawnside ↑R2 FACs are separated by the discontinuity. Oppositely, the Harang region’s poleward edge (marked as shaded region in cyan) is located on the dawnside where the duskside ↑R1 and dawnside ↓R1 FACs are separated by the discontinuity.
In Figures 2c-3c, the MLT versus MLAT polar plot shows the THEMIS footprints that crossed the auroral oval from the duskside to the dawnside near magnetic midnight. We also marked the Harang region’s equatorward and poleward edges (shaded regions in colors) in order to highlight the similarities between the schematic diagram and the polar plot. We also mapped the substorm onsets (as symbol stars in red and magenta) occurred. During Event 1, four substorm onsets occurred on the duskside, just poleward of the mapped-down THEMIS-observed Harang region. During Event 2, two substorm onsets occurred near the mapped-down THEMIS-observed Harang region’s edges.
Figures 2d-3d are constructed with a set of THEMIS time series that cover 2.5 and 3.0 universal time (UT) hours respectively in the tailward direction and depict the entire Harang region (from earthward edge to tailward edge) and its plasma environment in the inner magnetosphere.
By progressing from top to bottom, first we show with the hot (30 - 300 keV) Ne plot how the density of hot (30 - 300 keV) electrons varied in the inner magnetosphere. Based on the classification of Frank [31] and Burrows and McDiarmid [32], we marked the various regimes and boundaries observed by THEMIS. In the tailward direction, the hot Ne decreased significantly, from a maximum near the plasmapause (PP) to a local minimum at the trapping boundary (TB), defining a region in the plasmasheet’s earthward edge (marked as shaded interval in gray) where the electrons are trapped and able to drift around the Earth [33-34]. But the reduced hot Ne became further decreased tailward, between the trapping boundary and the closed-open (C/O) field line boundary, defining a region where the particles are quasi-trapped and able to drift less [33-34].
Next, the E field line plots depict how the E field components (EX, EY, EZ) varied in the Harang region. Here, we marked (as red arrows) the associated oppositely directed FACs (as shown by the schematic diagram in Figures 2b-3b). These include the ↓-↑ R2 FACs (shaded interval in magenta) marking the Harang region’s earthward edge and the ↓-↑ R1 FACs (shaded interval in cyan) marking the Harang region’s tailward edge. These E field line plots depict the two sets of E field reversal observed. One set is located at the Harang region’s earthward edge, near the PP, where the (antisunward, duskward, outward) SAPS E field developed within the ↓R2 FACs and the (sunward, dawnward, inward) convection E field (EC) within the ↑R2 FACs. The other set is located at the Harang region’s tailward edge, across the C/O field line boundary, where the convection E field (EC) reversed from antisunward-duskward-outward (located within the ↓R1 FACs) to sunward-dawnward-inward (located within the ↑R1 FACs). Between the Harang region’s two edges, the absence of strong E field provides observational evidence that THEMIS mainly followed the discontinuity in the tail region.
With the PiXX line plot, we show how the hot (30 – 300 keV) ion pressure varied in the Harang region. Depicting a strong duskside-dawnside asymmetry, first explained by Erickson et al. [14], the line plot shows that the hot ion pressure became enhanced on the duskside within the region of trapped particles and became depleted on the dawnside within the region of quasi-trapped particles. Centered over the PP, the steep positive and shallow negative PiXX gradients depict the signatures of oppositely directed (↓-↑) R2 FACs in the Harang region’s earthward edge. In the region of trapped electrons, the ↑R2 FACs are located.
As the PeXX line plot shows, the hot (30 – 300 keV) electron pressure peaked at the trapping boundary (marked as TB) where the interface of the duskside ↑R2 and dawnside ↓R1 FACs is located [4]. In the region of quasi-trapped electrons, the ↓R1 FACs are located. Across the C/O field line boundary at the Harang region’s tailward edge, the R1 FACs reversed from ↓R1 to ↑R1.
Next, the PiXY and PeXY line plots depict the oscillating amplitudes, which are the signatures of shear flows developed along the discontinuity: mostly in the region of quasi-trapped particles.
Finally, the MLT and L line plots show that THEMIS observed the Harang region’s earthward edge at ~23 MLT and ~4 RE and tailward edge just after magnetic midnight and at ~7 RE. Here, we also plotted the GOES-15 observed substorm onset time (as symbol star in magenta) that occurred just before the SAPS E field observation. For Event 1, we also marked the substorm onset times listed (2nd and 3rd; marked as symbol stars in red) that occurred when TH-E traveled along the discontinuity and observed the strong shear flows.
3.2. Inner-magnetosphere SAPS and the hot zone observed by THEMIS in Events 1-2
Now, we focus on the Harang region’s earthward edge where the SAPS E field developed soon after the GOES-observed substorm onset. With Figure 4, we demonstrate with THEMIS observations that the inner-magnetosphere SAPS developed on a short timescale, via the process of short circuiting, during the unfolding magnetotail reconnection related particle injections [35-36]. Meanwhile, the hot zone developed within the regime of trapped electrons and became most enhanced near the SAPS channel.
Figure 4a-b illustrate Event 1 and Event 2 respectively with the electron flux line plot sets, EX component, hot (6 eV - 30 keV) Ne and hot (5 eV - 25 keV) Ni, BY component, high-energy (30 - 300 keV) field-aligned Ti‖ and lower-energy (5 eV - 25 keV) Ti along with the previously described regions (indicated by the shaded intervals) and boundaries (marked).
As shown by the electron flux line-plot sets, THEMIS observed the Harang region during the unfolding magnetotail reconnection related particle injections. Then, the strongest dispersionless particle injections occurred across the trapping boundary in Event 1 and across the soft electron (0.1-1.0 keV) boundary (SEB) in Event 2. These imply that the trapped and quasi-trapped electrons and the hot ions had been injected from the tail region [33-34]. Meanwhile, the strongest dispersed particle injection occurred across C/O field line boundary in Event 1.
As observed by THEMIS, these reconnection related plasma injections led to the development of the outward SAPS E field on a short timescale via the process of short circuiting. Originally, the short-circuiting theory was put forward by Mishin and Phul-Quinn [37] and was further evolved by Mishin [35-36]. The short-circuiting theory specifies the earthward injected plasma as mesoscale plasma flows (MPFs; ≥1 keV) [38] that are also known from previous studies as bursty bulk flows (BBF) [39]. According to the theory, the MPFs become shorted out (or neutralized) across the plasmapause. Consequently, the earthward traveling hot electrons become stopped at the plasmapause, as depicted by steep gradient formed by the hot (6 eV - 30 keV) Ne. Furthermore, the earthward traveling hot ions, which are the earthward injected hot ring current ions [35-36], are allowed moving across the plasmapause and further inward (or earthward) and then, become stopped earthward of the plasmapause -as depicted by the line plot of hot (5 eV - 25 keV) Ni- by the emerging outward directed SAPS E field (shown by the SAPS EX component).
In Figure 4a, Event 1 demonstrates some further aspects of the short-circuiting phenomenon. As shown by the line plot of hot (6 eV - 30 keV) Ne, near the stopping point (located tailward of PP), the hot (6 eV - 30 keV) Ne becomes locally increased forming a narrow Ne peak upon the Ne pileup. This marrow Ne peak creates diamagnetic electron drifts and drives intense electron density turbulence [40]. As shown by the line plot of hot (5 eV - 25 keV) Ni, at the hot ion stopping point (located earthward of the PP), there is a narrow Ni peak upon the Ni pileup that creates diamagnetic ion drifts and drives intense ion density turbulence [40]. Because of the increased plasma turbulence, driven in the narrow hot Ne and hot Ni peaks by their respective diamagnetic electron and ion drifts, a fast-time voltage generator (VGFT) [36] forms within the resultant turbulent plasmasphere boundary layer (TPBL) [37].
In Figure 4b, Event 2 also demonstrates some additional aspects of the short-circuiting phenomenon. As shown with the line plot of hot (5 eV - 25 keV) Ni, a smaller Ni peak formed upon the Ni pileup, near the PP (as described above). But as the hot ions (i.e. ring current ions) kept moving earthward, a larger Ni peak (marked as shaded interval in light orange) also formed upon the Ni pileup. Thus, in Event 2, the hot (5 eV - 25 keV) Ni stopping point formed more earthward and thus locating the hot ring current ions’ earthward end more earthward. Because of the more earthward moving ring current ions, a phenomenon, appearing in ion spectrograms as a “nose structure” [41], developed. Because of the “nose structure’ developed, the TPBL was wider in this Event 2.
In Figures 4a-b, we marked the region of the TPBL (as dotted line in dark red) developed between the peaks of hot (6 eV - 30 keV) Ne and hot (5 eV - 25 keV) Ni. Within the TPBL, the increased diamagnetic electron and ion drifts drive diamagnetic electron and ion currents, and thus provide energy for the excitation of various waves including electromagnetic ion cyclotron (EMIC) waves [40]. As shown with the SCM BY line plot, where the location of SAPS E field is marked (as symbol dot), a sudden and localized BY increase occurred within the SAPS E field channel: where the hot (5 eV - 25 keV) Ni peak developed in Event 1, but earthward of the SAPS channel: where the larger hot (5 eV - 25 keV) Ni peak (i.e. “nose structure”) developed in Event 2. A subset of the SCM BY line plot illustrates the structured periodic pulsations, which are the typical signatures of EMIC waves [42]. Both the EMIC waves (generated in the ring current core region) and the plasma turbulence (developed in the TPBL) produced rapid bulk plasma heating that fueled the hot zone [38].
In Figures 4a-b, the line plot of high-energy (30 - 300 keV) field-aligned Ti‖ shows the hot zone appearing with a steep gradient on its earthward side and peaking within the TPBL where the EMIC waves developed: both (TPBL and EMIC) providing bulk plasma heating [43]. Meanwhile, the line plot of lower-energy (5 eV - 25 keV) Ti shows that the hot zone’s tailward boundary was located at the trapping boundary. Thus, a larger region of the hot zone developed in the regime of trapped electrons, where the trapped particles’ higher energy provided the bulk plasma heating as was first suggested by the early study of Serbu and Maier [44]. As marked, the region of cold zone [25] was also observed earthward of the hot zone.
3.3. The Harang Reversal observed in the duskside topside ionosphere by DMSP in Events 1-2
Figure 5 and Figure 6 show the Harang region observed in the topside ionosphere by DMSP spacecraft during the two events investigated.
3.3.1. The Harang Reversal observed in the topside ionosphere by DMSP F17 in Event 1
In Figure 5a, the schematic diagram depicts the Harang region in a scenario that DMSP F17 observed in Event 1 in an earlier MLT sector (than TH-E in Event 1). Then, F17 traveled in the dawn-dusk direction and crossed the auroral zone within the Harang region. By crossing the discontinuity (marked as HD in red), F17 observed that the auroral electrojet reversed from a duskside EEJ (marked as shaded region in magenta) to a dawnside WEJ (marked as shaded regions in cyan). Based on the pre and postmidnight THEMIS observations, we suggest that the electrojet reversal occurred in the duskside Harang region because of the flow of ↑R2 FACs (from the equatorward) and ↑R1 FACs (from poleward) into the oval along the discontinuity. We note that the TH-E-observed dawnside ↓R1 FACs. But these ↓R1 FACs become upward directed (i.e. ↑R1 FACs) on the duskside (as was observed here by F17). F17 also observed the regular duskside auroral EEJ along with the SAPS channel in the vicinity of the Harang region, but away from the discontinuity.
In Figure 5a, two sets of MLT versus MLAT polar plots are shown depicting the two-cell convection pattern and the auroral precipitation pattern with the DMSP/SSUSI imagery. In both sets, we mapped the F17 pass (in green) along with the locations of EEJ (marked as symbol square) and WEJ (marked as symbol diamond) within the Harang region and SAPS (marked as symbol dot) near the Harang region.
Figure 5a shows the two-cell convection pattern based on the SuperDARN map generated for 06:20 UT, which is the time of the F17 SAPS detection (6.40 UT or 06:24 UT). Here, we plotted the 3 substorm onset locations (marked as symbol stars in red) situated near the auroral electrojet reversal in the Harang region. The convection pattern depicts the weaker dawn cell (in red) and the stronger dusk cell (in blue) that became quite thin on the duskside (where the Harang region developed) and that intruded into the dawnside across the magnetic midnight meridian.
In Figure 5a, the DMSP/SSUSI imagery depicts the signature of the dawnward intruding dusk cell appearing in the auroral precipitation pattern. As shown, the auroral oval became unusually thin in the Harang region: a phenomenon that was first reported by Nishimura et al. [45] and further investigated by Lyons et al. [46] and that was explained with the large reduction of the electron precipitation energy flux occurring during substorm onset. We also plotted the mapped down THEMIS-observed SAPS location situated near magnetic midnight and equatorward of the auroral precipitation.
In Figure 5b, the southern-hemisphere map shows the mapped F17 ground track (in green) and TH-E footprints (in orange) depicting the M-I conjugate Harang region that was observed (in Event 1) over the South-Eastern Pacific. Because of the MLT difference, the TH-E—F17 correlation is loose.
In Figure 5b, the DMSP F17 time series are constructed with the plasma density (Ne), temperature (Te and Ti), zonal drift (VHOR), and magnetic deflection (δBX and δBY) data. These line plots cover a larger region of the Harang reversal and depict its plasma environment. In the duskside subauroral region, the main ionospheric trough (MIT) developed poleward of the ring ionospheric trough (RIT) where Te peaked at ~4,200 K. Within the MIT, the sunward SAPS flow (shaded interval in yellow) reached ~1,800 m/s in the vicinity of the Harang region. In the duskside auroral zone, F17 observed the regular auroral EEJ appearing as a sunward flow (~800 m/s; shaded interval in light blue) and, by crossing the discontinuity, the reversal of EEJ (sunward flows, ~1,000 m/s; shaded interval in magenta) to WEJ (antisunward flows, ~-1,700 m/s; shaded interval in cyan). In the duskside polar cap region, the zonal plasma flow was minimal. Based on the δBX and δBY gradients, we marked the underlying current flows. As shown, no currents were flowing into the SAPS channel implying that the SAPS flow was newly formed at that time (~25 min after the TH-E SAPS observation) and developed in a fast-time voltage generator [36] where the mapped down poleward subauroral E field drove the plasma in the SAPS channel westward that was streaming sunward, in concert with the dusk cell (as marked in both polar plots). Depicted by the δBX line plot, Hall currents (JH) were flowing antisunward (or eastward) in the two EEJs and sunward (or westward) in the WEJ and changed directions (from antisunward to sunward) across the Harang Discontinuity. Shown by the δBY line plot, the ↓R2-↑R1 FACs connected via the poleward directed Pedersen currents (JP) within the regular duskside auroral EEJ. Because of the flow of ↑R2 (from equatorward) and ↑R1 (from poleward) into the oval along the discontinuity, the demarcation of ↑R2-↑R1 FACs marks the discontinuity’s [21] center where the antisunward Hall currents reversed to sunward (as shown by the δBX line plot). Thus, in the duskside Harang region, the same type of Region currents became oppositely directed and connected via the Pedersen currents (JP): ↓-↑R2 connected within the EEJ via the poleward JP and ↑-↓R1 connected within the WEJ via the equatorward JP. Consequently, these reversing electrojets (from EEJ to WEJ) developed in the Harang region differently from their respective regular auroral duskside EEJ and dawnside WEJ (where the oppositely directed R1 and R2 FACs connect).
3.3.2. The Harang Reversal observed in the topside ionosphere by DMSP F18 in Event 2
Figure 6 is constructed the same way as Figure 5 and shows the F18 observations made in the Harang region in Event 2.
In Figure 6a, the schematic diagram shows that the Harang region developed in a scenario that was described above (in section 3.3.1). But in this event, the Harang region was observed near magnetic midnight in the Australian longitude sector.
Figure 6a shows the polar convection plot drawn based on the SuperDARN convection map generated for 09:26 UT, which is similar to the respective UTs of the F18 Harang observation (made at 09:27 UT) and DMSP/SSUSI imagery (generated for 09:24 UT). These polar plots show that the Harang region was observed within the dusk cell and that the substorm onset mapped to the tip of the dusk cell reaching the magnetic midnight meridian. Depicted by the DMSP/SSUSI imagery, the WEJ developed across an auroral arc (where the convection flow was antisunward) and the EEJ within the auroral oval where the convection flow was sunward. Meanwhile, the TH-D-observed SAPS E field mapped down to the equatorward region of the dusk cell.
In Figure 6b, the F18 line plot sets reveal that because of the alignment of the F18 pass, the duskside plasma density troughs (MIT and RIT) and SAPS along with the regular auroral EEJ were not observed. But in the pre-midnight Harang region, F18 observed the reversal of EEJ (sunward flow, ~1,200 m/s; shaded interval in magenta) to WEJ (antisunward flows, ~-1,200 m/s; shaded interval in cyan) wherein Te locally peaked at ~4,500 K. Depicted by the δBX line plot, the Hall current (JH) reversed across the discontinuity from antisunward (or eastward) in the EEJ and to sunward (or westward) in the WEJ. Meanwhile, the δBZ plot shows that the discontinuity developed (in the same way as in Event 1) because of the flow of ↑R2 (from equatorward) and ↑R1 (from poleward) into the oval along the discontinuity (as described in section 3.3.1).
3.4. The SAR arc developed within the SAPS channel
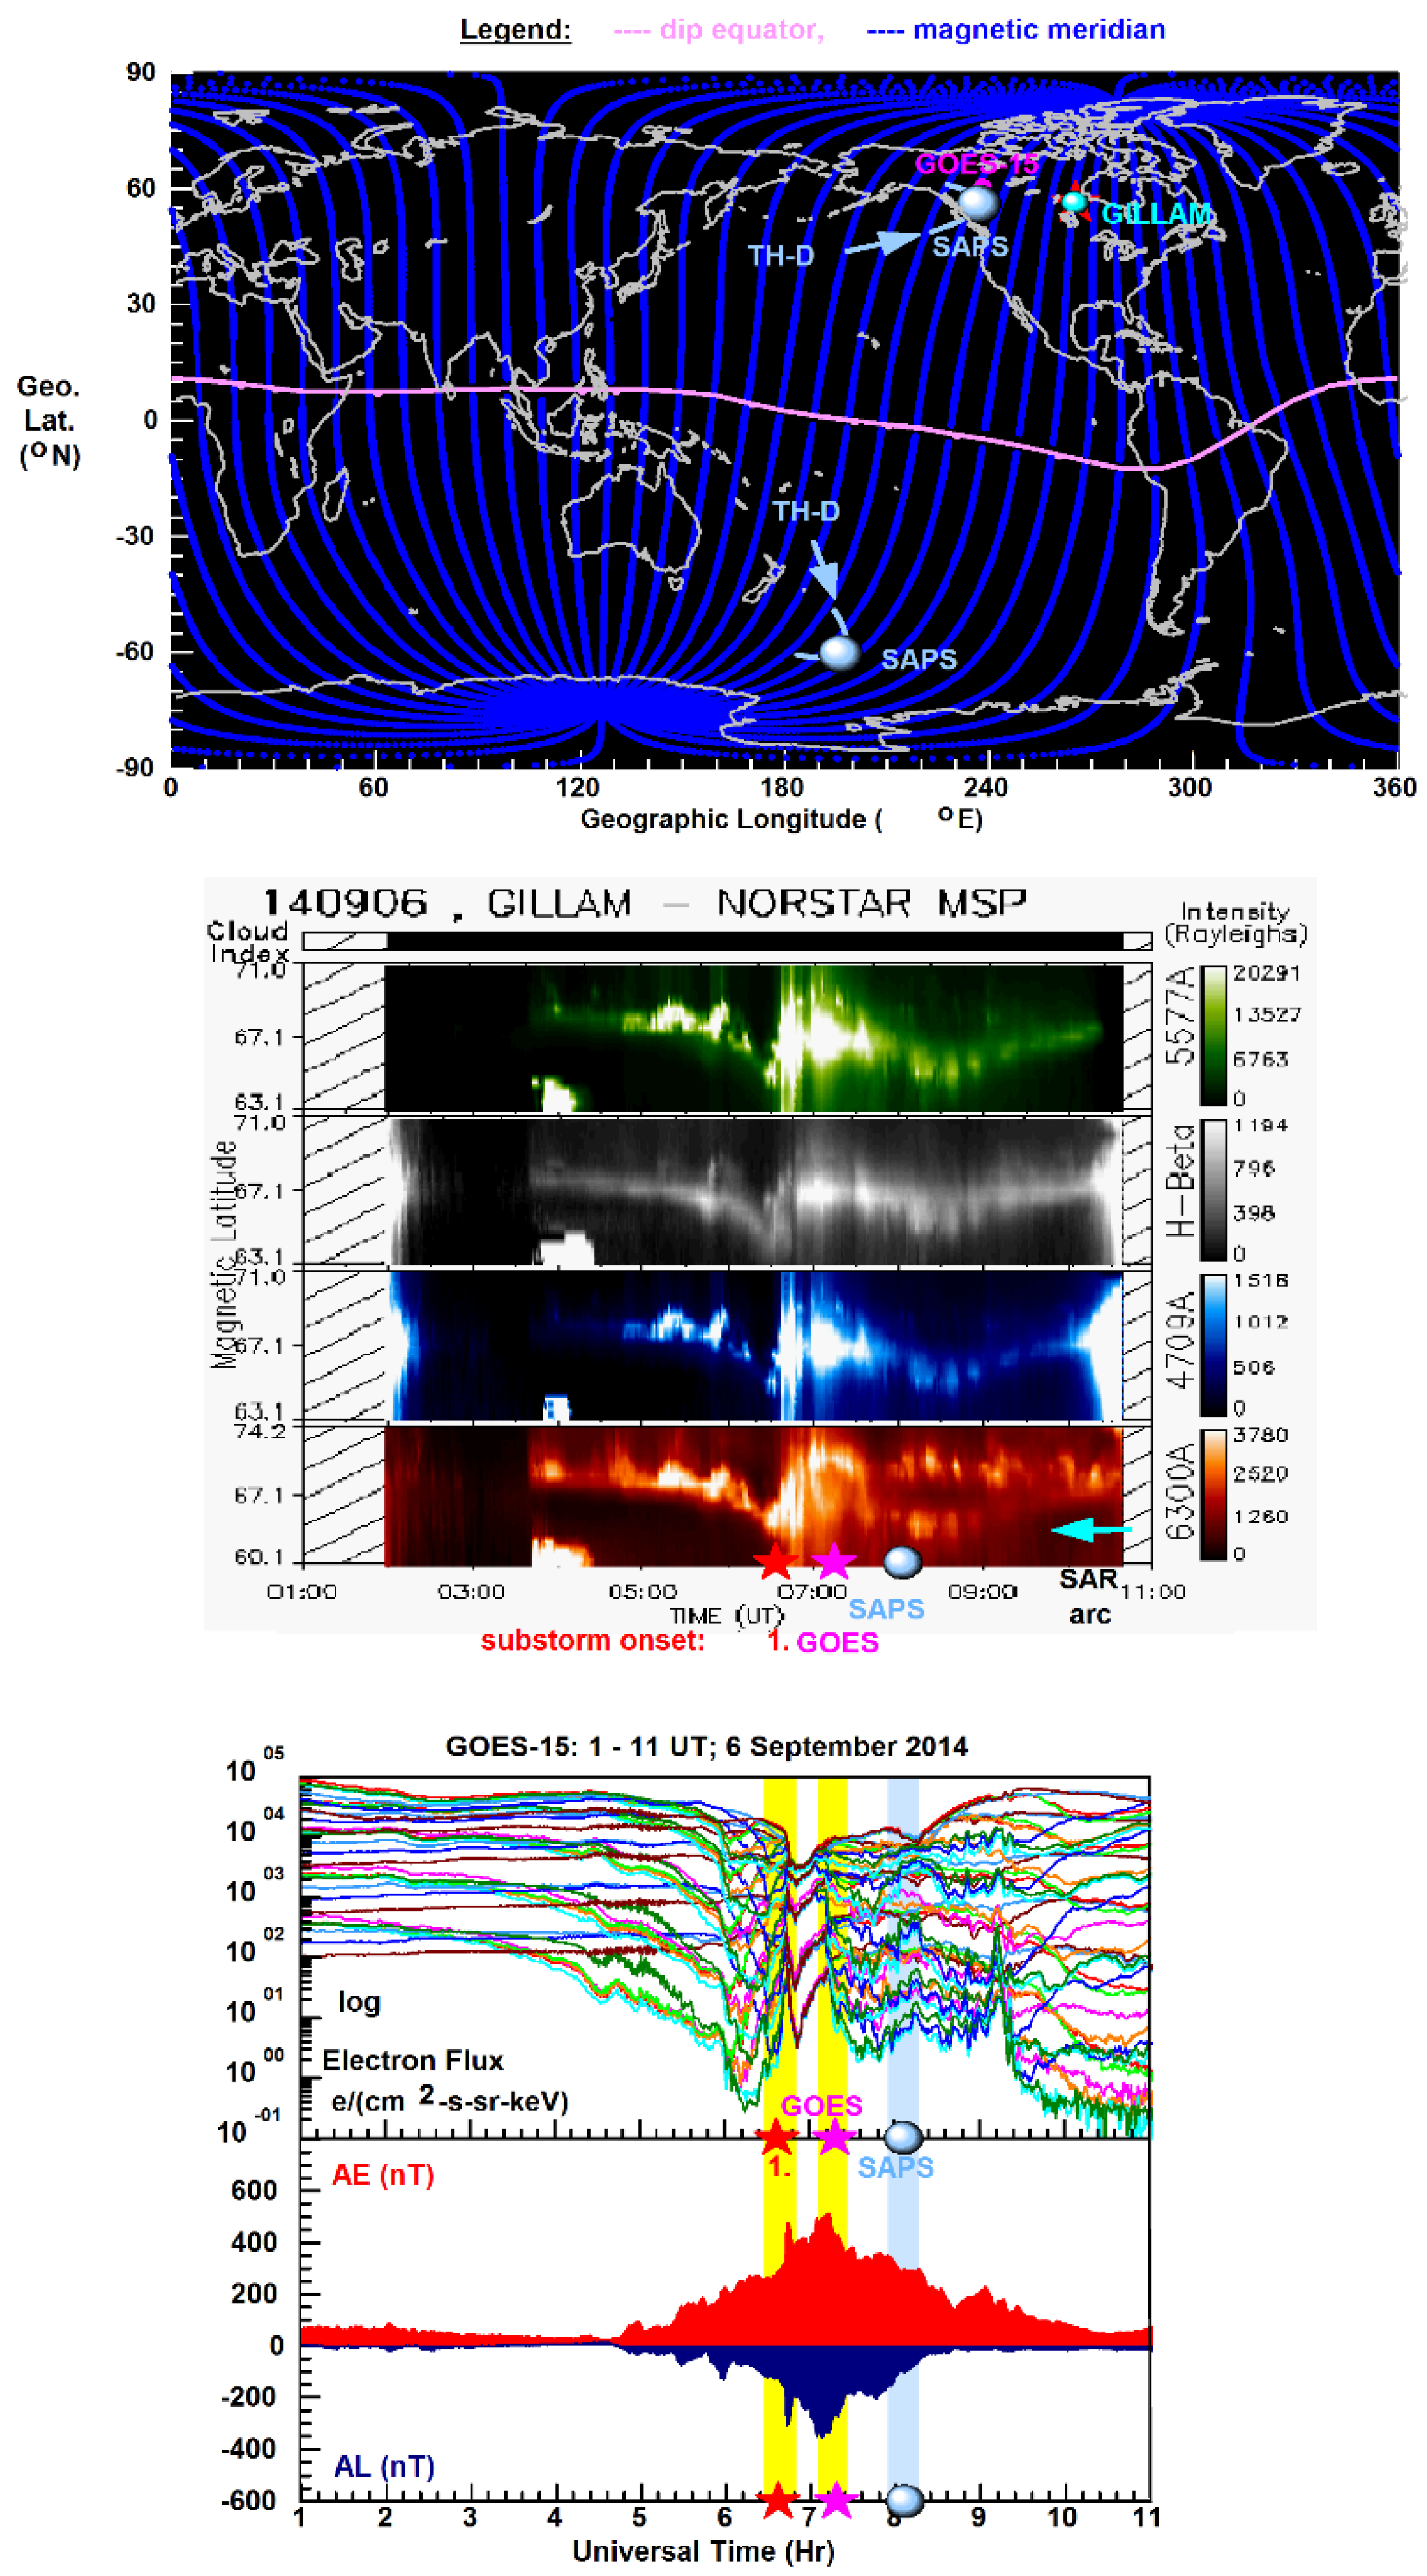
In Figure 7 and Figure 8, the global map shows the northern-southern hemisphere conjugate THEMIS footprints made during the event of interest and the mapped-down northern-southern conjugate SAPS E field locations. In the Northern Hemisphere, THEMIS observed the Harang region along with the SAPS E field channel over the North American continent: close to the Gillam REGO station. Situated near the Harang region, the substorm onset locations (symbol stars in red) and the GOES-15 footprints (in magenta) are also mapped.
In Figure 7 and Figure 8, the REGO imagery recorded from Gillam shows the unstructured diffuse aurora formed as a result of the trapped plasmasheet electrons’ (30 - 300 keV; shown in Figure 2 and Figure 3) pitch angle scattering into the loss cone by the interactions of electron cyclotron harmonic and whistler mode chorus waves resonating with the trapped electrons in that energy range [47-49]. The image of the diffuse aurora appears predominantly in the greenline (557.7 nm) and redline (630.0 nm) emissions from the atomic oxygen (O) but also in the blueline (470.9 nm) emission from ionized molecular nitrogen (N2+) [50].
As depicted by the 630 nm imagery, a series of SAR arc events occurred: commencing at the substorm onset (marked as symbol stars in colors). At the onset of the event, the SAR arc developed at the equatorward edge of the diffuse aurora, which maps to the earthward edge of the plasmasheet where the underlying heat source igniting the SAR arc is located [51]. But later on, the SAR arc deviated from the diffuse aurora’s equatorward edge and moved equatorward during the unfolding substorm (as shown below) when the auroral oval moved equatorward and because of the nature of the underlying M-I coupled interactions [52].
Based on the close correlation obtained, in Event 1, the SAR arc developed because of the downward heat flux produced by (i) the hot ring current and cold plasma density interaction generating EMIC waves and because of (ii) the plasma turbulence developed in the SAPS E field channel (TPBL) as shown in Figure 4a. Thus, the downward heat flux (igniting the SAR arc) was provided by the same heating mechanisms (i.e. TPBL and EMIC waves located in the SAPS E field channel) that fueled the hot zone. Although the SAPS E field channel-SAR arc correlation obtained for Event 2 is quite loose, we speculate that the development of “nose structure” and the consequential earthward extension of the TPBL and EMIC waves could be the cause of the strong deviation of the SAR arc from the diffuse aurora by generating bulk plasma heating more earthward and the resultant downward heat flux more equatorward.
In Figure 7 and Figure 8, the GOES-15 electron flux line plot series along with the AE and AL indices show that a series of dispersionless particle injections occurred during the substorm onsets (marked as shaded intervals in yellow). THEMIS observed the SAPS E field soon after the nearest substorm onset when the SAR arc was already positioned away from the diffuse aurora.
4. Discussion
In this study, we have investigated the M-I conjugate Harang and SAPS phenomena based on the experimental inner-magnetosphere THEMIS and topside-ionosphere DMSP observations made in two events. Significantly, these events of interest occurred during magnetotail reconnection related plasma injections, when the outward SAPS E field develops on a short timescale by short circuiting [35-36]. Our investigation included also the development of SAR arc (in the F region) unfolding in the vicinity of the Harang region. With our new findings we add to the previous studies highlighted in section 1.
Significantly, in each event investigated, the THEMIS satellite followed the Harang Discontinuity along the equatorial plane in the tail region. By crossing the magnetic midnight meridian, the THEMIS orbit was dusk-dawn aligned and therefore THEMIS was able to observe the duskside-dawnside hot ion pressure asymmetry providing the primary mechanism for the mapping down of large-scale FACs to the auroral zone, as was first reported by Erickson et al. [14].
THEMIS also observed the Harang Discontinuity’s basic inner-magnetosphere characteristics: its earthward edge on the duskside (observed just before magnetic midnight) and its tailward edge on the dawnside (observed just after magnetic midnight).
These THEMIS observations provide evidence that in the Harang region’s earthward edge, located in the regime of trapped electrons, the R2 FACs reversed from ↓R2 within the outward SAPS E field to ↑R2 within the inward convection E field. Our findings are in good agreement with the results of Gkioulidou et al. [18] reporting the necessity of the longitudinal overlap between the ↓R2 and ↑R2 FACs in the Harang Reversal’s development.
We demonstrate also that in the Harang region’s tailward edge, the R1 FACs reversed across the closed-open field line boundary from ↓R1 to ↑R1 in concert with their respective inward and outward convection E fields. These findings are in good agreement with the study of Yang et al. [17] reporting that the Harang Reversal’s collocation with the ↑R1 FACs.
Importantly, THEMIS observed the Harang region’s earthward edge during short-circuiting creating a fast-time voltage generator (VGFT) within the SAPS E field channel [36]. In the premidnight sector, at ~23 MLT, the dominating SAPS component was EX. In magnitude, the SAPS EX component reached ~20 mV/m in Event 1 and ~30 mV/m in Event 2 in the antisunward (outward direction). By mapping down to the ionosphere, the large SAPS E field drove unusually strong SAPS flows that we could not demonstrate with closely correlated M-I conjugate THEMIS-DMSP observations. But our results are in good agreement with the studies of Zou et al. [19-20] and Gkioulidou et al. [18] reporting enhanced SAPS flows in the low conductivity subauroral region situated equatorward of the Harang region.
Our new results also include that within the discontinuity (located between the earthward and tailward edges of the Harang region), the trapping boundary separated the duskside ↑R2 FACs (located within the region of trapped electrons) and the dawnside ↓R1 FACs (located within the region of quasi-trapped electrons). These provide observational evidence of the significance of both the R2 and R1 FACs in the Harang Reversal’s development in the inner magnetosphere.
But the trapping boundary maps down to the diffuse-discrete oval boundary separating the R2 FACs in the diffuse auroral zone and the R1 FACs in the discrete auroral zone [53]. We applied the inner-magnetosphere large-scale FAC configuration observed by THEMIS to the topside-ionosphere Harang region observations made by DMSP on the duskside. We specified the flow of ↑R2 from equatorward and ↑R1 from poleward into the oval along the discontinuity and provided observational evidence that the switch from ↑R2 to ↑R1 occurred where the Hall currents reversed from eastward (or antisunward) to westward (or sunward). Consequently, within the Harang region, the ↓-↑R2 FACs connected via the poleward directed Pedersen currents within the EEJ while the ↑-↓R1 FACs connected via the equatorward directed Pedersen currents within the WEJ. These provide observational evidence that within the Harang region, the EEJ and WEJ (separated by the discontinuity) developed differently from the regular auroral duskside EEJ and dawnside WEJ (where the oppositely directed R2-R1 FACs connect via Pedersen currents).
Finally, we also demonstrated that bulk plasma heating occurred due to both the increased plasma turbulence generated in the TPBL and the EMIC waves developed in the core region of the ring current [40] and fueled the hot zone (peaking within the TPBL/SAPS E field channel) and leading to SAR arc development. We provided direct observational evidence with one close correlation, when the outward SAPS E field mapped down to near Gillam in Event 1. Although the correlation obtained for Event 2 was loose, we speculate that the inner magnetosphere “nose structure”, developed because of the more earthward moving ring current ions, possibly led to the intense deviation of the strong SAR arc observed over Gillam, since the “nose structure” has a significant role in the inner-magnetosphere heating mechanism according to studies of Mishin & Streltsov [43, 54].
5. Conclusions
From this study’s significant findings, we obtained the following new results for the inner-magnetosphere Harang region observed by THEMIS in the two events investigated:
1) Aligned in the dusk-dawn direction, the inner-magnetosphere Harang region was characterized:
a) at its earthward edge: by the outward directed SAPS E field developed on a short timescale in a fast-time voltage generator (VGFT) system across the plasmapause and by the inward directed convection E field tailward of the plasmapause
b) at its tailward edge: by the reversal of the convection E field -across the closed-open field line boundary- from outward to inward directed.
2) Large-scale FACs reversed:
a) from ↓R2 to ↑R2 near the plasmapause,
b) from ↑R2 to ↓R1 across the trapping boundary, and
c) from ↓R1 to ↑R1 across the close-open field-line boundary.
3) Along the discontinuity:
a) ↑R2 FACs occupied the region of trapped electrons located between the plasmapause and the trapping boundary
b) ↓R1 FACs occupied the region of quasi-trapped electrons located between the trapping boundary and the closed-open field line boundary.
4) The hot zone developed within the region of trapped electrons and peaked within the turbulent plasmaspheric boundary layer.
From the two DMSP events, loosely correlated with the two THEMIS events in terms of MLT, we obtained the following results for the topside-ionosphere Harang region observed on the duskside:
i) The duskside discontinuity developed because of the flow of ↑R2 from equatorward and ↑R1 from poleward into the auroral oval.
ii) Across the discontinuity, the electrojet reversal from lower-latitude EEJ to higher-latitude WEJ occurred because of the reversal of Hall currents from eastward (or antisunward) to westward (or sunward).
iii) Within the lower-latitude EEJ: ↓R2-↑R2 FACs connected via the poleward directed Pedersen currents.
iv) Within the higher-latitude WEJ: ↑R1-↓R1 FACs connected via equatorward directed Pedersen currents.
v) Away from the Harang region, in the regular duskside auroral EEJ: the Hall currents were flowing eastward (or antisunward) and the ↓R2-↑R1 FACs connected via the poleward directed Pedersen currents.
vi) Located equatorward of the discontinuity, the newly-formed SAPS flow developed in the fast-time voltage generator (VGFT) system where the subauroral ↓R2 FACs were absent.
From the results listed (as 1-4 and i-vi), we conclude for the two events investigated that:
a) Both the R1 and the R2 FACs were collocated with the M-I conjugate Harang phenomenon and were essential to its development.
b) In the duskside ionosphere, the Harang Discontinuity was associated with ↑R2 (at lower altitudes) and with ↑R1 (at higher latitudes) and the ↑R2-↑R1 demarcation corresponded to the Harang Discontinuity.
c) In the Harang region, the reversing EEJ-WEJ developed differently than their respective regular auroral EEJ and WEJ away from the Harang region.
d) The ↓R2 FACs were not essential to the newly-formed enhanced SAPS flow that developed in a fast-time voltage generator.
e) The SAPS flow became enhanced near the Harang region because of the large inner magnetosphere outward SAPS E field developed at the Harang Region’s earthward edge in a fast-time voltage generator.
Finally, we note that in future studies, we plan to conduct more detailed studies based on closely correlated M-I conjugate observations.
Supplementary Materials
Not applicable.
Author Contributions
Conceptualization, I.H..; methodology, I.H.; software, I.H. and B.C.L.; validation, I.H. and B.C.L.; formal analysis, I.H.; investigation, I.H..; resources, B.C.L.; data curation, I.H.; writing—original draft preparation, I.H..; writing—review and editing, B.C.L. and I.H.; visualization, I.H..; supervision, B.C.L.; project administration, B.C.L.; funding acquisition, B.C.L. All authors have read and agreed to the published version of the manuscript.
Funding
This research was funded by the U. S. Office of Naval Research, grant number N62909-23-1-2057.
Institutional Review Board Statement
Not applicable.
Informed Consent Statement
Not applicable.
Data Availability Statement
The DMSP data set can be accessed online through http://cedar.openmadrigal.org The SSUSI auroral images can be accessed online through https://ssusi.jhuapl.edu/gal_AUR. The REGO images can be accessed online through http://sirius.bu.edu/ The SuperDARN convection maps can be accessed online at http://vt.superdarn.org/plot/quickconvection) The THEMIS and GOES data sets can be accessed online through https://cdaweb.gsfc.nasa.gov/cdaweb/istp_public/ The AE and AL indices can be accessed online from the OMNI database: through https://cdaweb.gsfc.nasa.gov/cdaweb/istp_public/ The SuperMAG provided various types of substorm lists can be accessed online from the SuperMAG substorm lists through https://supermag.jhuapl.edu/substorms/.
Acknowledgments
We acknowledge the CEDAR Archival Madrigal Database for the DMSP data. The DMSP particle detectors were designed by Dave Hardy of Air Force Research Laboratory (AFRL). We also gratefully acknowledge the REGO and SSUSI images and the THEMIS and GOES data. We gratefully acknowledge the World Data Center for Geomagnetism at Kyoto (http://wdc.kugi.kyoto-u.ac.jp/wdc/Sec3.html) for providing the AE and AL indices and the use of SuperDARN convection maps. SuperDARN is a collection of radars funded by national scientific funding agencies of Australia, Canada, China, France, Italy, Japan, Norway, South Africa, United Kingdom and the United States of America. We also gratefully acknowledge the SuperMAG provided various types of substorm lists determined from SML index.
Conflicts of Interest
The authors declare no conflicts of interest.
References
- Dungey, J.W. Interplanetary magnetic field and the auroral zones. Physical Review Letters 1961, 6(2), 47–48. [Google Scholar] [CrossRef]
- Cowley, S.W.H. Magnetosphere-ionosphere interactions: A tutorial review. In Ohtani, S.; Fujii, R.; Hesse, M.; Lysak. R.L. (Eds.), Magnetospheric current systems, Geophysical monograph Series 2000, 118, 91–106, American Geophysical Union. [Google Scholar] [CrossRef]
- Iijima, T.; Potemra, T.A. The amplitude distribution of field-aligned currents at northern high latitudes observed by Triad. Journal of Geophysical Research 1976, 81(13), 2165–2174. [Google Scholar] [CrossRef]
- Potemra, T.A. Large-Scale Characteristics of Field-Aligned Currents Determined from the Triad Magnetometer Experiment. In: Grandal, B., Holtet, J.A. (eds) Dynamical and Chemical Coupling Between the Neutral and Ionized Atmosphere. NATO Advanced Study Institutes Series 1977, 35. Springer, Dordrecht. [CrossRef]
- Iijima, T.; Potemra, T.A. Large-scale characteristics of field-aligned currents associated with substorms. Journal of Geophysical Research 1978, 83(2), 599–615. [Google Scholar] [CrossRef]
- Baumjohann, W. Ionospheric and field-aligned current systems in the auroral zone: A concise review. Advances in Space Research 1982, 2(10), 55–62. [Google Scholar] [CrossRef]
- Iijima, T.; Nagata, T. Signatures for substorm development of the growth phase and expansion phase, Planet. Space Science 1972, 20(7), 1095–1112. [Google Scholar] [CrossRef]
- Harang, L. The mean field of disturbance of polar geomagnetic storms. Terrestrial Magnetism and Atmospheric Electricity 1946, 51(3), 353–380. [Google Scholar] [CrossRef]
- Heppner, J. P. The Harang discontinuity in auroral belt; Ionospheric currents. Geofys. Publ. 1972, 29, 105–120. [Google Scholar]
- Maynard, N.C. Electric field measurements across the Harang discontinuity. Journal of Geophysical Research 1974, 79(31), 4620–4631. [Google Scholar] [CrossRef]
- Koskinen, H.E.J.; Pulkkinen, T.I. Midnight velocity shear zone and the concept of Harang discontinuity. Journal of Geophysical Research. 1995, 100(A6), 9,539–9,547. [CrossRef]
- Madsen, M. M. Iversen I. B.; D'Angelo N. Measurements of high-latitude ionospheric electric fields by means of balloon-borne sensors. Journal of Geophysical Research. 1976, 81(22), 3821-3824. [CrossRef]
- Heppner, J.P. Empirical models of high-latitude electric fields. Journal of Geophysical Research 1977, 82(7), 1115–1125. [Google Scholar] [CrossRef]
- . [CrossRef]
- Erickson, G.M.; Spiro, R.W.; Wolf, R.A. The physics of the Harang discontinuity. Journal of Geophysical Research 1991, 96(A2), 1633–1645. [Google Scholar] [CrossRef]
- Lezniak, T.; Winckler, J. Experimental study of magnetospheric motions and the acceleration of energetic electrons during substorms. Journal of Geophysical Research 1970, 75(34), 7075–7098. [Google Scholar] [CrossRef]
- Kunkel, T.; Untiedt, J.; Baumjohann, W. Greenwald, R. Electric fields and currents at the Harang discontinuity: a case study, Journal of Geophysics 1986 59. 73‒86. https://n2t.net/ark:/88439/y096847.
- Yang, J.; Toffoletto, F.; Lu, G.; Wiltberger, M. RCM-E and AMIE studies of the Harang reversal formation during a steady magnetospheric convection event. Journal of Geophysical Research: Space Physics. 2014, 119(9), 7228–7242. [CrossRef]
- Gkioulidou, M.; Wang, C.-P.; Lyons, L.R.; Wolf, R.A. Formation of the Harang reversal and its dependence on plasma sheet conditions: Rice convection model simulations. Journal of Geophysical Research 2009, 114(A7), A07204. [Google Scholar] [CrossRef]
- Zou, S.; Lyons, L.R.; Nicolls, M.J.; Heinselman, C.J.; Mende, S.B. Nightside ionospheric electrodynamics associated with substorms: PFISR and THEMIS ASI observations. Journal of Geophysical Research: Space Physics. 2009, 114(A12), A12301. [CrossRef]
- Zou, S.; Lyons, L.R.; Wang, C.-P.; Boudouridis, A.; Ruohoniemi, J.M.; Anderson, P.C.; Dyson, P.L; Devlin, J.C. On the coupling between the Harang reversal evolution and substorm dynamics: A synthesis of SuperDARN, DMSP, and IMAGE observations. Journal of Geophysical Research 2009, 114(A1), A01205. [Google Scholar] [CrossRef]
- Ohtani, S.; Gkioulidou, M.; Wang, C.-P.; Wolf, R.A. The Harang reversal and the interchange stability of the magnetotail. Journal of Geophysical Research: Space Physics. 2016, 121(4), 3278–3292. [CrossRef]
- Foster, J.; Burke, W. A new categorization for sub-auroral electric fields. Eos, Transactions of the American Geophysical Union. 2002, 83(36), 393-394. [CrossRef]
- Foster, J.; Buonsanto, M.; Mendillo, M.; Notingham, D.; Rich, F.; Denig, W. Coordinated stable auroral red arc observations: Relationship to plasma convection. Journal of Geophysical Research, 1994, 99(A6), 11,429- 11,439. [CrossRef]
- Chandra, S.; Maier, E.; Troy, B., Jr.; Narasinga Rao, B. Subauroral red arcs and associated ionospheric phenomena. Journal of Geophysical Research 1971, 76(4), 920–925. [Google Scholar] [CrossRef]
- Bezrukikh, V. V.; Gringauz, K.I. The hot zone in the outer plasmasphere of the earth. Journal of Atmospheric and Terrestrial Physics, 1976, 38(11), 1,085-1,091. [CrossRef]
- Sibeck, D.G.; Angelopoulos, V. THEMIS science objectives and mission phases. Space Science Reviews 2008, 141(1), 35–59. [Google Scholar] [CrossRef]
- Rich, F.J.; Hairston, M. Large-scale convection patterns observed by DMSP. Journal of Geophysical Research, 1994, 99(A3), 3,827-3,844. [CrossRef]
- Paxton, L.J.; Morrison, D.; Zhang, Y.; Kil, H.; Wolven, B.; Ogorzalek, B.S.; Humm, D.C.; Meng, C.-I. Validation of remote sensing products produced by the Special Sensor Ultraviolet Scanning Imager (SSUSI): a far UV-imaging spectrograph on DMSP F-16. Proceedings 2002, 4485, Optical Spectroscopic Techniques, Remote Sensing, and Instrumentation for Atmospheric and Space Research IV, (30 January 2002). [CrossRef]
- Gillies, D.M.; Knudsen, D.; Donovan, E.; Jackel, B.; Gillies, R.; Spanswick, E. Identifying the 630 nm auroral arc emission height: A comparison of the triangulation, FAC profile, and electron density methods. Journal of Geophysical Research: Space Physics, 2017, 122(8), 8,181-8,197. [CrossRef]
- Newell, P.T.; Gjerloev, J.W. Evaluation of SuperMAG auroral electrojet indices as indicators of substorms and auroral power. Journal of Geophysical Research 2011, 116(A12), A12211. [Google Scholar] [CrossRef]
- Frank, L.A. Relationship of the plasma sheet, ring current, trapping boundary, and plasmapause near the magnetic equator and local midnight. Journal of Geophysical Research, 1971, 76(10), 2,265-2,275. [CrossRef]
- Burrows, J.R.; McDiarmid, I.B. Trapped particle boundary regions. Critical Problems of Magnetospheric Physics E. R. Dyer, 83–106, Inter-Union Committee on Solar--Terrestrial Physics, National Academy of Sciences, Washington, D.C., 1972.
- Roederer, J.G. On the adiabatic motion of energetic particles in a model magnetosphere. Journal of Geophysical Research 1967, 72(3), 981–992. [Google Scholar] [CrossRef]
- Roederer, J. G. , Dynamics of Geomagnetically Trapped Radiation, Springer, New York, 1970; pp. 58-68.
- Mishin, E.V. Interaction of substorm injections with the subauroral geospace: 1. Multispacecraft observations of SAID. Journal of Geophysical Research: Space Physics, 2013, 118(9), 5,782-5,796. [CrossRef]
- Mishin, E.V. The evolving paradigm of the subauroral geospace. Frontiers in Astronomy and Space Sciences, 2023, 10:1118758. [CrossRef]
- Mishin, E.V.; Puhl-Quinn, P.A. SAID: Plasmaspheric short circuit of substorm injections. Geophysical Research Letters 2007, 34(24), L24101. [Google Scholar] [CrossRef]
- Mishin, E.; Sotnikov, V. The turbulent plasmasphere boundary layer and the outer radiation belt boundary. Plasma Physics and Controlled Fusion 2017, 59(12), 124003. [Google Scholar] [CrossRef]
- Angelopoulos, V.; Kennel, C.F.; Coroniti, F.V.; Pellat, R.; Kivelson, M.G.; Walker, R.J.; Russell, C.T.; Baumjohann, W.; Feldman, W.C.; Gosling, J.T. Statistical characteristics of bursty bulk flow events. Journal of Geophysical Research, 1994, 99(A11), 21,257-21,280. [CrossRef]
- Mishin, E.; Streltsov, A. Prebreakup arc intensification due to short circuiting of mesoscale plasma flows over the plasmapause. Journal of Geophysical Research: Space Physics, 2020,125(5), e2019JA027666. [CrossRef]
- Smith, P.H.; Hoffman, R.A. Direct observations in the dusk hours of the characteristics of the storm time ring current particles during the beginning of magnetic storms. Journal of Geophysical Research 1974, 79(7), 966–971. [Google Scholar] [CrossRef]
- Usanova, M.E.; Mann, I.R.; Kale, Z.C.; Rae, I.J; Sydora, R.D.; Sandanger, M.; Søraas, F.; Glassmeier, K.-H.; Fornacon, K.-H.; Matsui, H.; Puhl-Quinn, P.A.; Masson, A.; Vallières, X. Conjugate ground and multisatellite observations of compression-related EMIC Pc1 waves and associated proton precipitation. Journal of Geophysical Research 2010, 115(A7), A07208. [Google Scholar] [CrossRef]
- Mishin, E.; Streltsov, A. Mesoscale and Small-Scale Structure of the Subauroral Geospace. In Huang, C.,; Lu, G. (Eds.), Space Physics and Aeronomy Collection Volume 3: Ionosphere Dynamics and Applications, Geophysical Monograph Series 2021, 260, 135–154 Washington DC: American Geophysical Union. [Google Scholar] [CrossRef]
- Serbu, G.P.; Maier, E.J.R. Observations from Ogo 5 of the thermal ion density and temperature within the magnetosphere. Journal of Geophysical Research 1970, 75(31), 6102–6113. [Google Scholar] [CrossRef]
- Nishimura, Y.; Lyons, L.R.; Zou, S.; Angelopoulos, V.; Mende, S.B. Categorization of the time sequence of events leading to substorm onset based on THEMIS all-sky imager observations. The dynamic magnetosphere 2011, Editors Liu, W.; Fujimoto M. Netherlands Dordrecht: Springer, 133–142. http://www.springerlink.com/content/x170k84772368516/.
- Lyons, L.R.; Nishimura, Y.; Liu, J.; Yadav, S.; Zou, Y.; Bristow, W.A.; Donovan, E.; Nishitani, N. Space weather with an arc’s ∼2 h trip across the nightside polar cap. Frontiers in Astronomy and Space Sciences 2024. [CrossRef]
- Lyons, L.R. General relations for resonant particle diffusion in pitch angle and energy. Journal of Plasma Physics, 1974, 12, 45–49. [Google Scholar] [CrossRef]
- Lyons, L.R. Pitch angle and energy diffusion coefficients from resonant interactions with ion cyclotron and whistler waves. Journal of Plasma Physics 1974, 12, 417–432. [Google Scholar] [CrossRef]
- Thorne, R.M.; Ni, B.; Tao, X.; Horne, R.B.; Meredith, N.P. Scattering by chorus waves as the dominant cause of diffuse auroral precipitation. Nature 2010, 467, 943–946. [Google Scholar] [CrossRef]
- Whiter, D.K.; Partamies, N.; Gustavsson, B.; Kauristie, K. The altitude of green OI 557.7 nm and blue N2+ 427.8 nm aurora. Annales Geophysicae, 2023, 41(1), 1–12. [CrossRef]
- Mendillo, M.; Baumgardner, J.; Wroten, J.; Martinis, C.; Smith, S. ; Merenda, K D.; Fritz, T.; Hairston, M.; Heelis, R.; Barbieri, C.
- Imaging magnetospheric boundaries at ionospheric heights. Journal of Geophysical Research: Space Physics, 2013, 118(11), 7294–7305. [CrossRef]
- Shiokawa, K.; Hosokawa, K.; Sakaguchi, K.; Leda, A.; Otsuka, Y.; Ogawa, T.; Connors, M. The optical mesosphere thermosphere imagers (OMTIs) for network measurements of aurora and airglow, future perspectives of space plasma and particle instrumentation and international collaborations. AIP Conference Proceedings 2009, 1144(1), 212–215. [Google Scholar] [CrossRef]
- Galperin, Yu.I.; Feldstein, Ya.I. Mapping of the precipitation region to the plasma sheet, Journal of geomagnetism and geoelectricity 1996, 48(5-6), 857–875. [CrossRef]
- Mishin, E.V.; Streltsov, A.V. Toward the unified theory of SAID-linked subauroral arcs. Journal of Geophysical Research: Space Physics, 2024, 129(1), e2023JA032196. [CrossRef]
Figure 1.
The schematic diagram modified after Figure 1 of Koskinen and Pulkkinen [11] shows the Harang Discontinuity (HD; in red), appearing as an eastward/westward electrojet (EEJ/WEJ) reversal (shaded interval in yellow), and the various currents and E×B drifts in the auroral zone. .
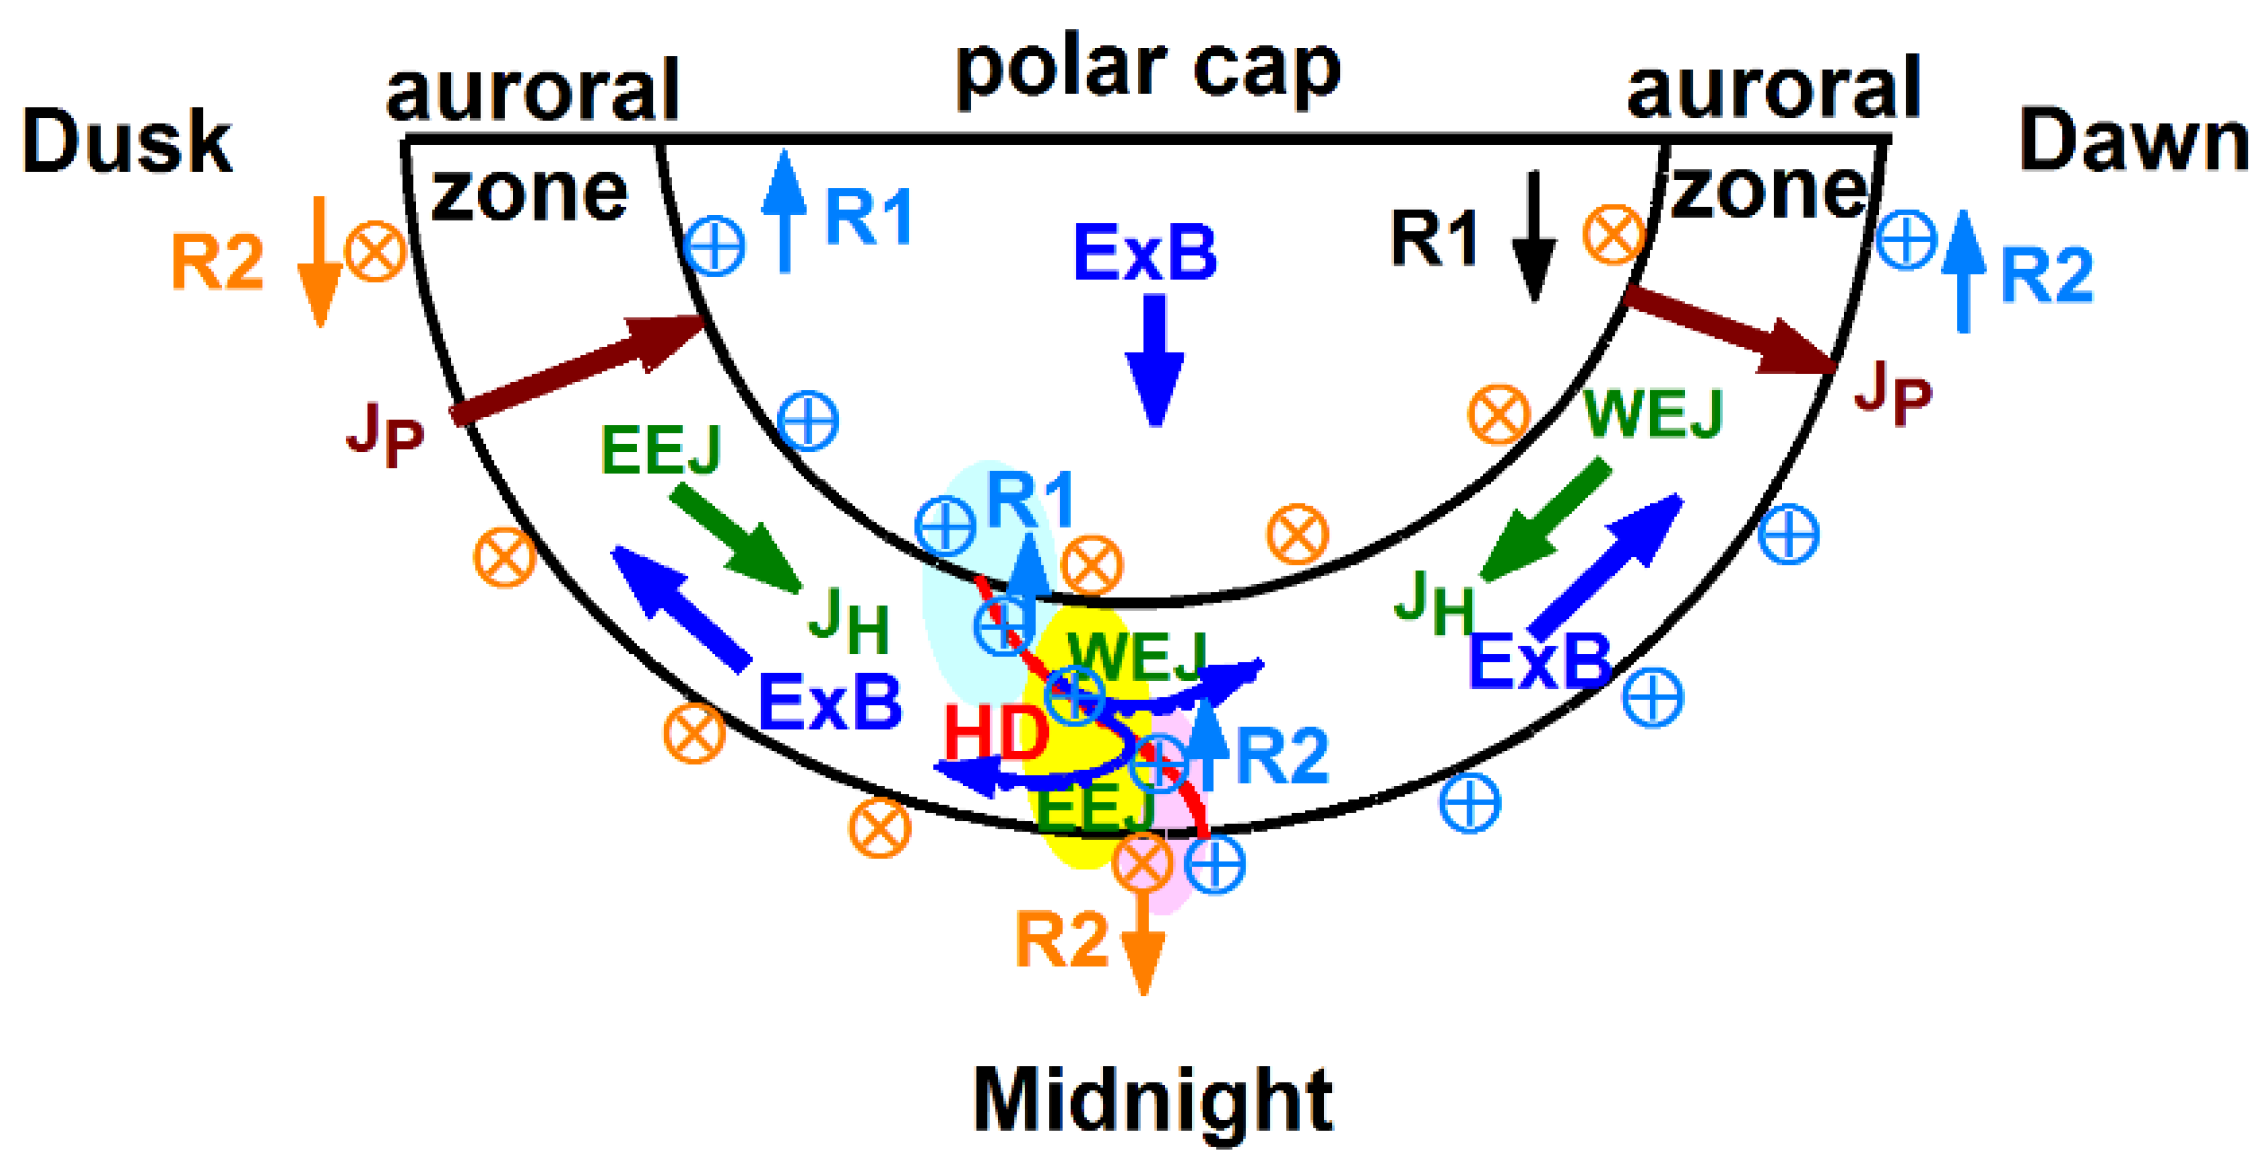
Figure 2.
Illustrating Event 1 observed by TH-E in the inner magnetosphere, (a) the orbit plots depict the earthward and tailward edges of the Harang region, (b) the schematic diagram of the auroral scenario along with the (c) actual TH-E footprints and substorm onset locations (symbol stars) and (d) the Harang region’s E field and plasma environment.
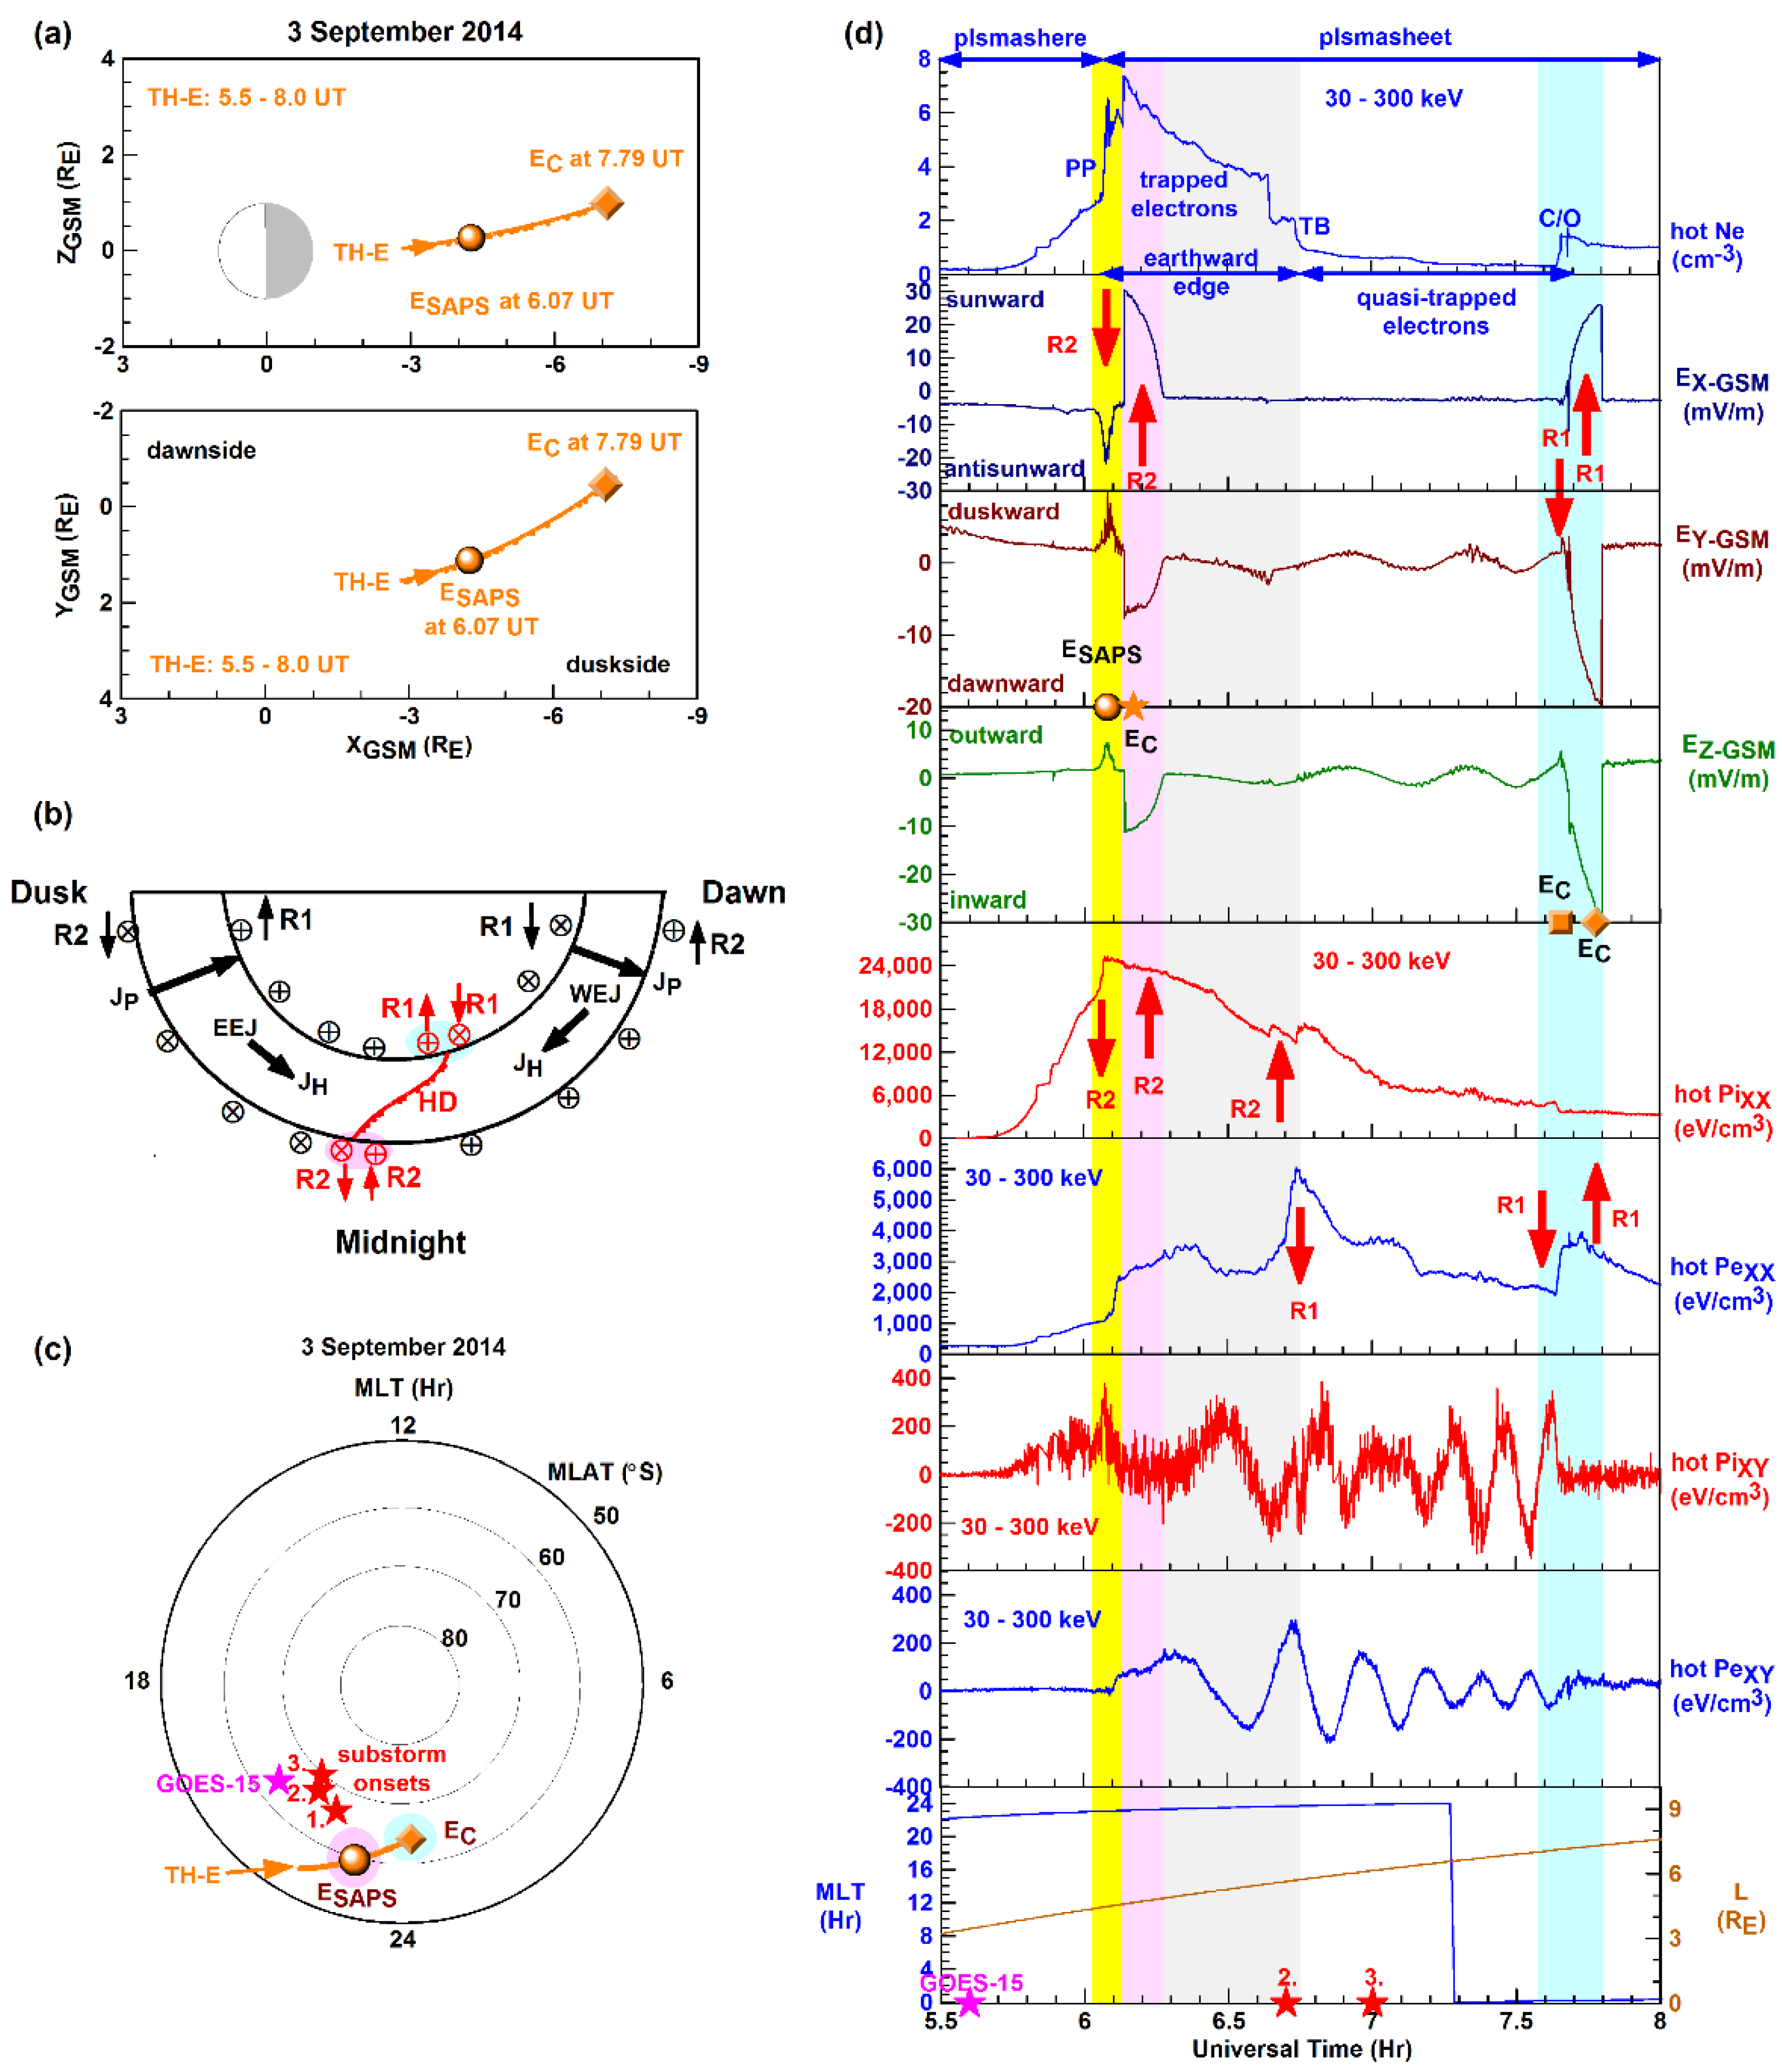
Figure 3.
Illustrating Event 2 observed by TH-D in the inner magnetosphere, (a) the orbit plots depict the earthward and tailward edges of the Harang region, (b) the schematic diagram of the auroral scenario along with (c) the actual TH-D footprints and substorm onset locations (symbol stars) and (d) the Harang region’s E field and plasma environment.
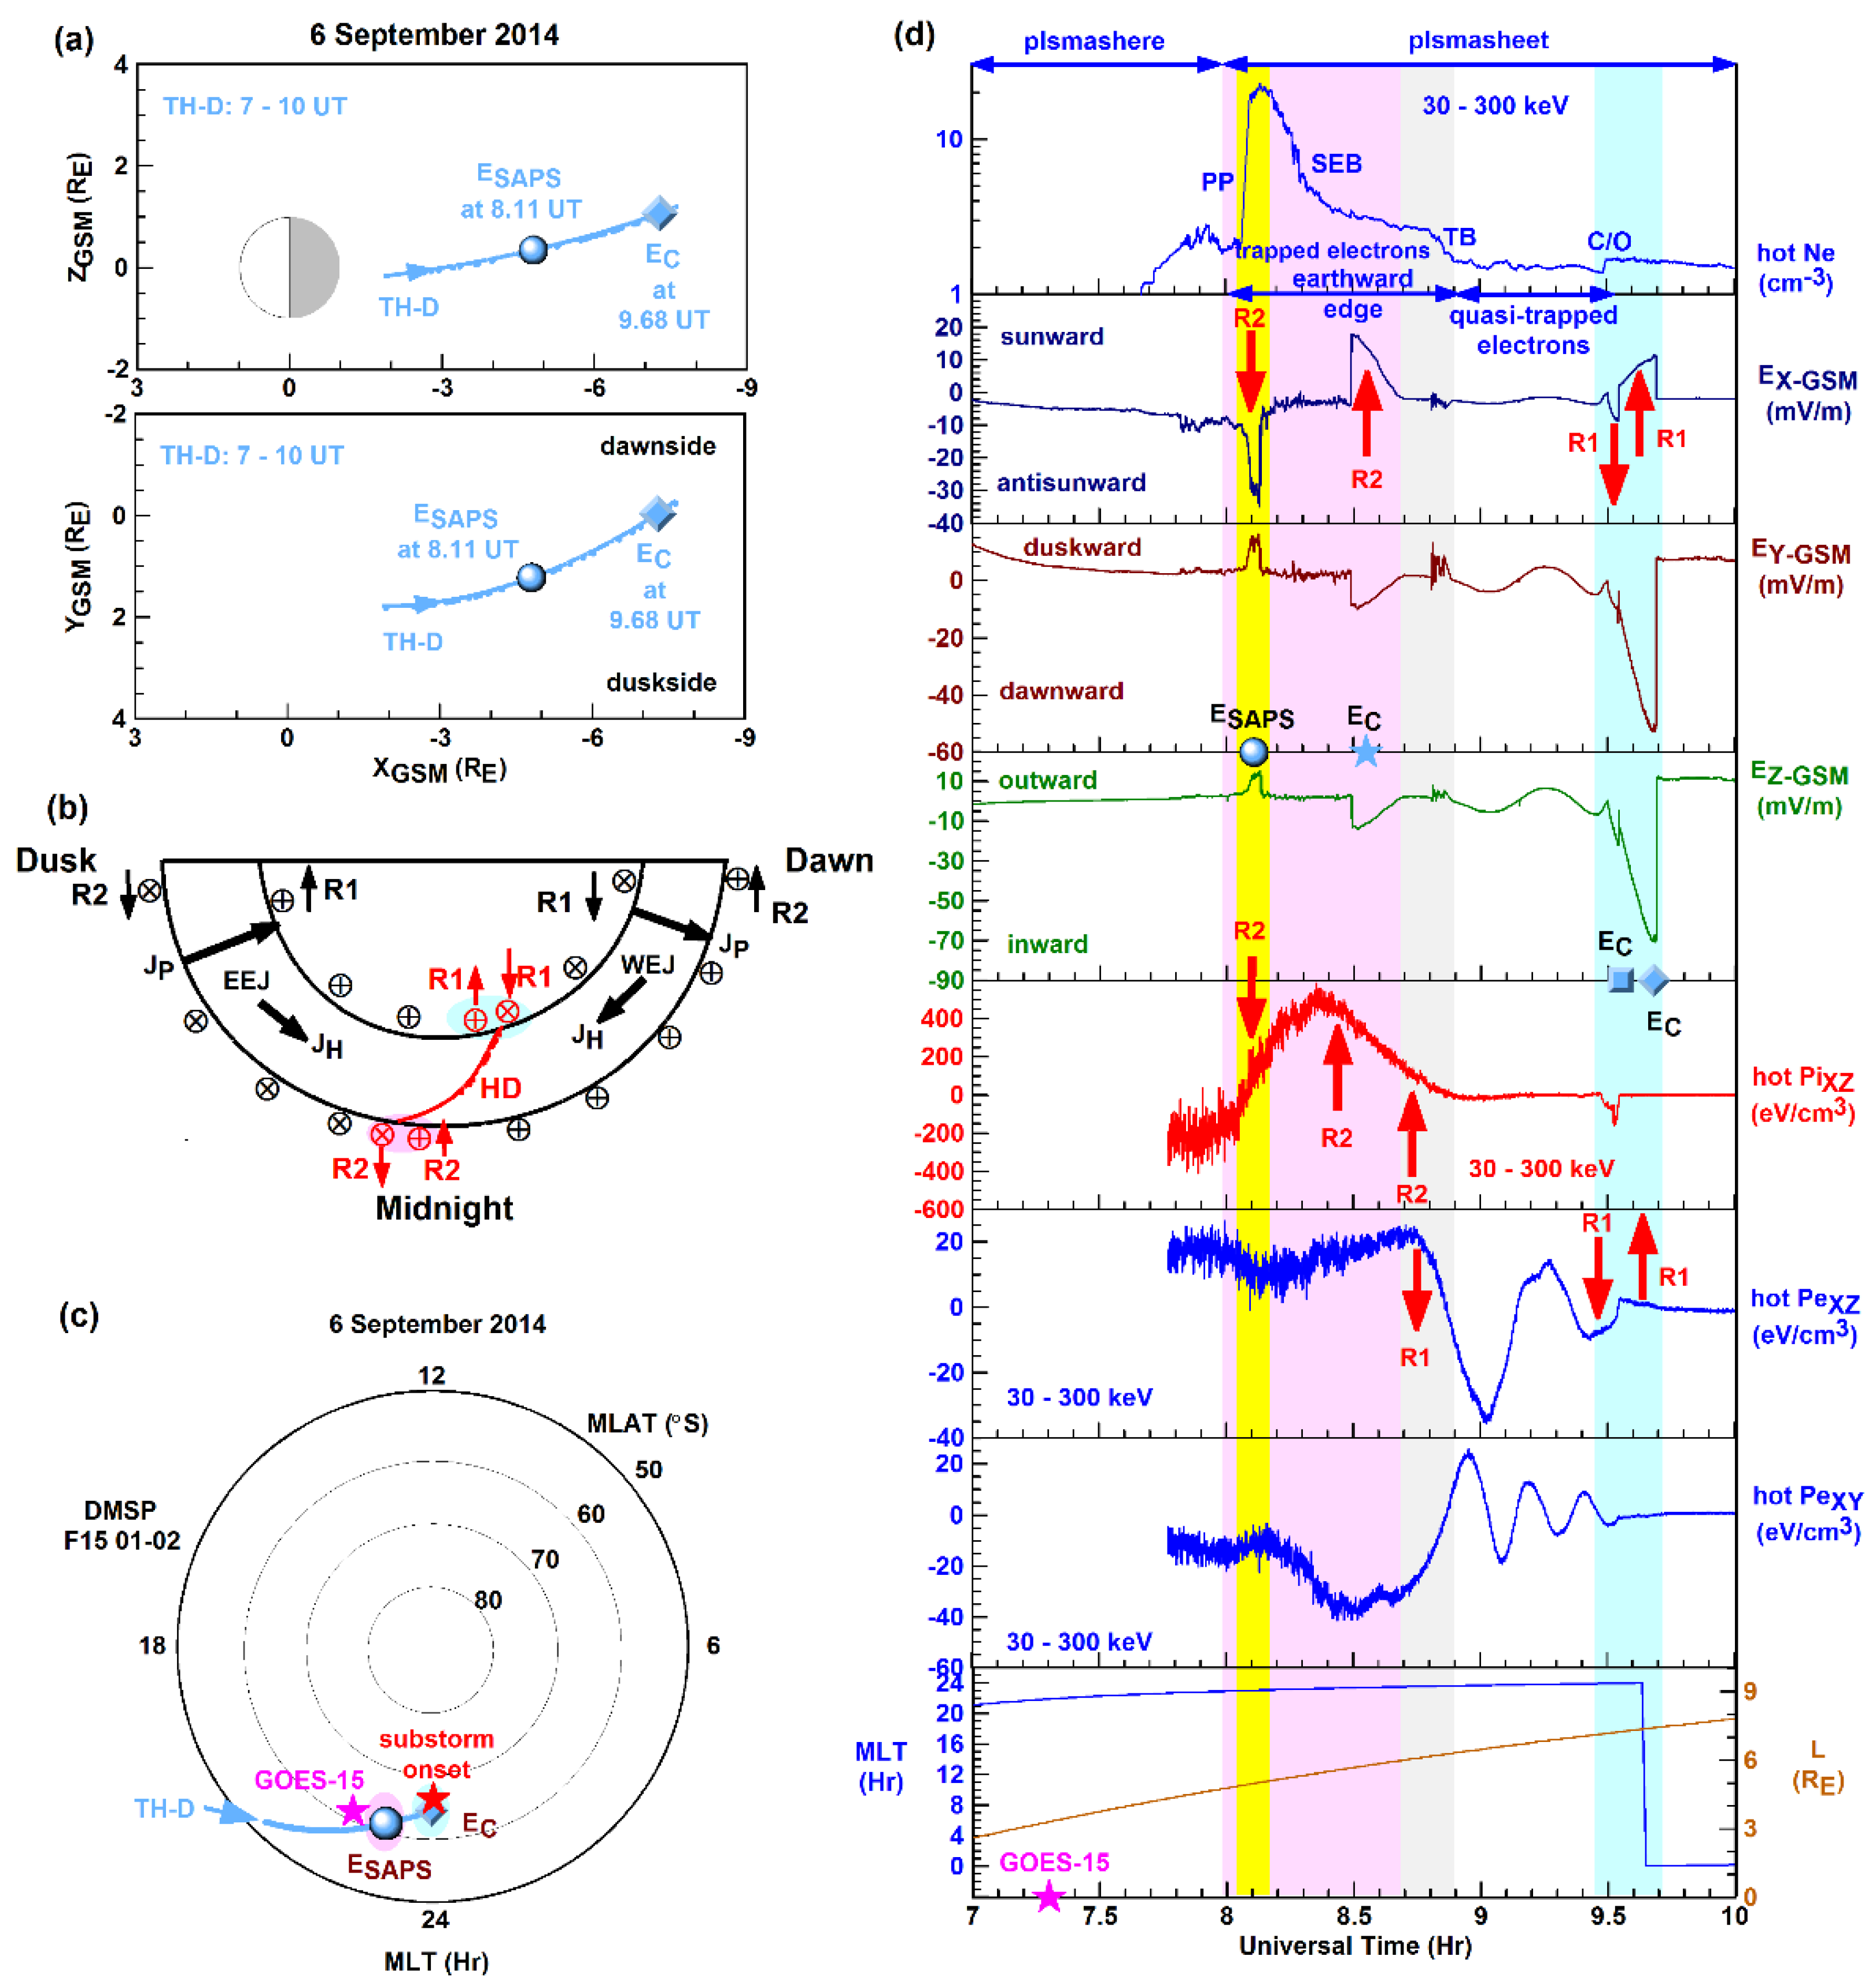
Figure 4.
Illustrating the Harang region’s inner-magnetosphere plasma environment, the THEMIS line plots depict the signatures of short circuiting, TPBL and EMIC waves, and the hot zone during (a) Event 1 and (b) Event 2.
Figure 4.
Illustrating the Harang region’s inner-magnetosphere plasma environment, the THEMIS line plots depict the signatures of short circuiting, TPBL and EMIC waves, and the hot zone during (a) Event 1 and (b) Event 2.
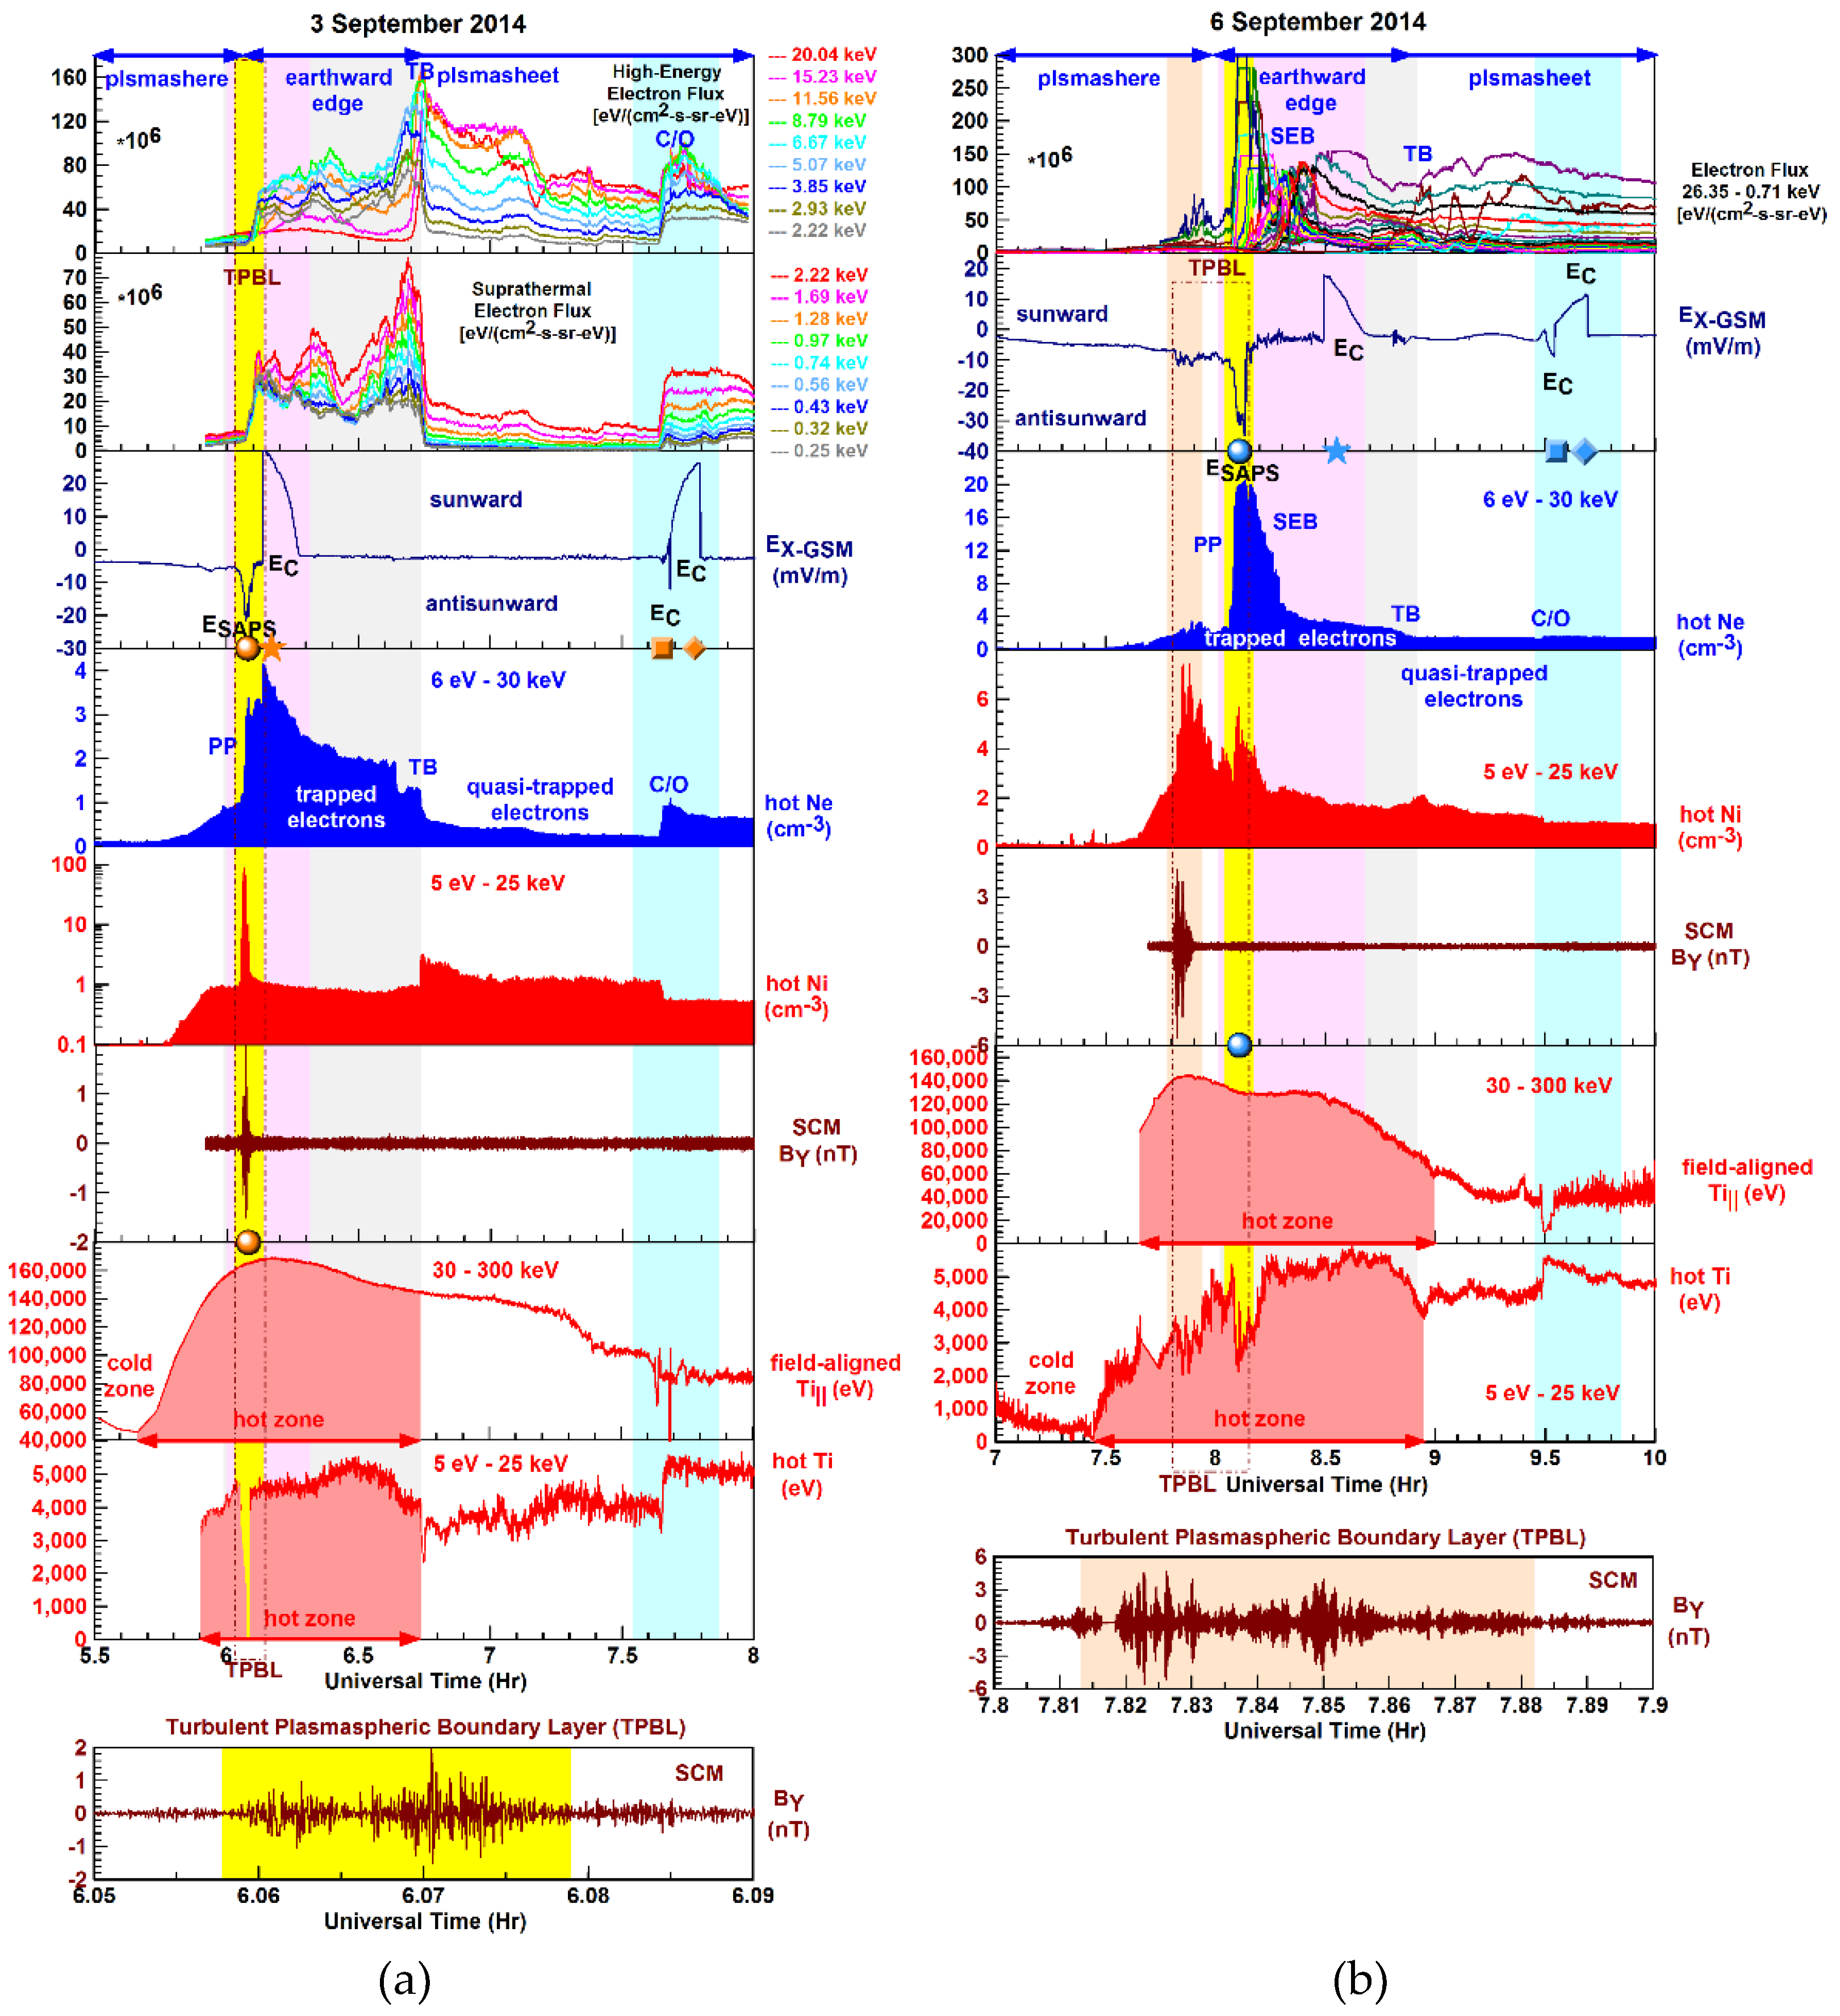
Figure 5.
Illustrating Event 1 observed by DMSP F17 in the topside ionosphere, (a) the schematic diagram of the auroral scenario is shown along with the underlying polar convection and auroral precipitation pattern where the F17 pass are plotted with the SAPS, EEJ, WEJ and substorm onset locations and (b) the F17 line plots depict the Harang region’s plasma environment and underlying currents.
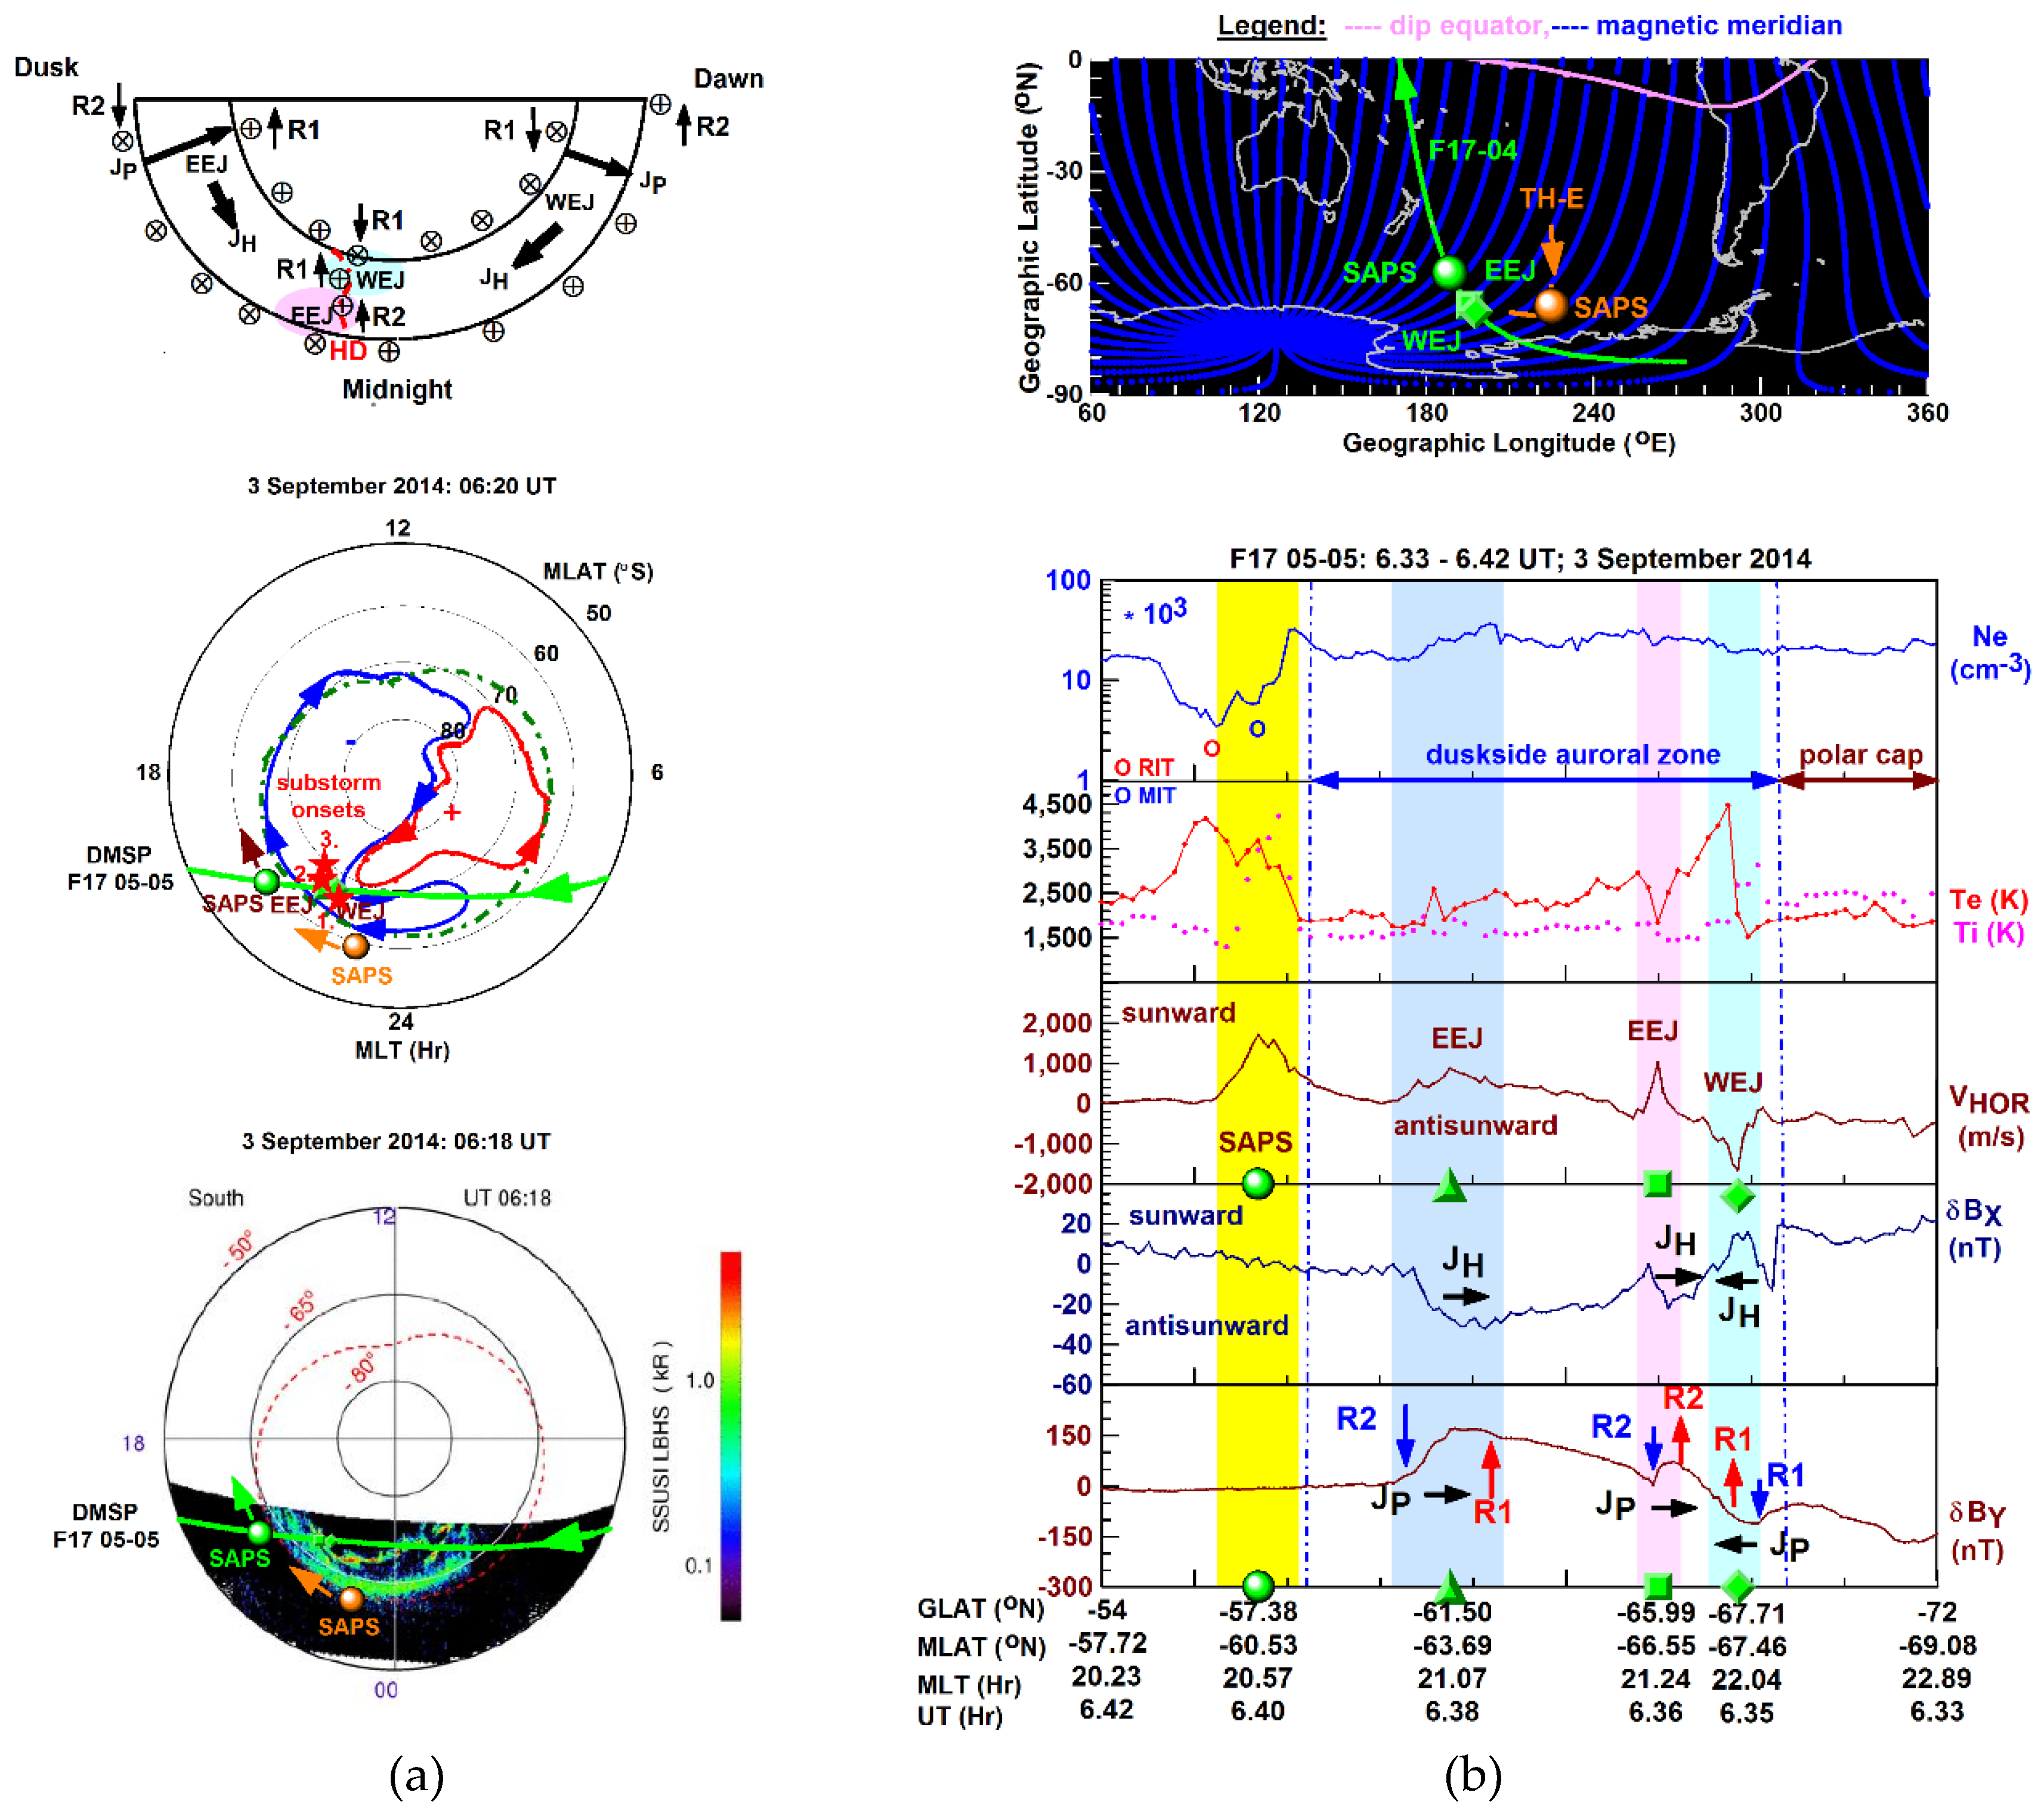
Figure 6.
Illustrating Event 2 observed by DMSP F18 in the topside ionosphere, (a) the schematic diagram of the auroral scenario is shown along with the underlying polar convection and auroral precipitation pattern where the F18 pass are plotted with the SAPS, EEJ, WEJ and substorm onset locations and (b) the F18 line plots depict the Harang region’s plasma environment and underlying currents.
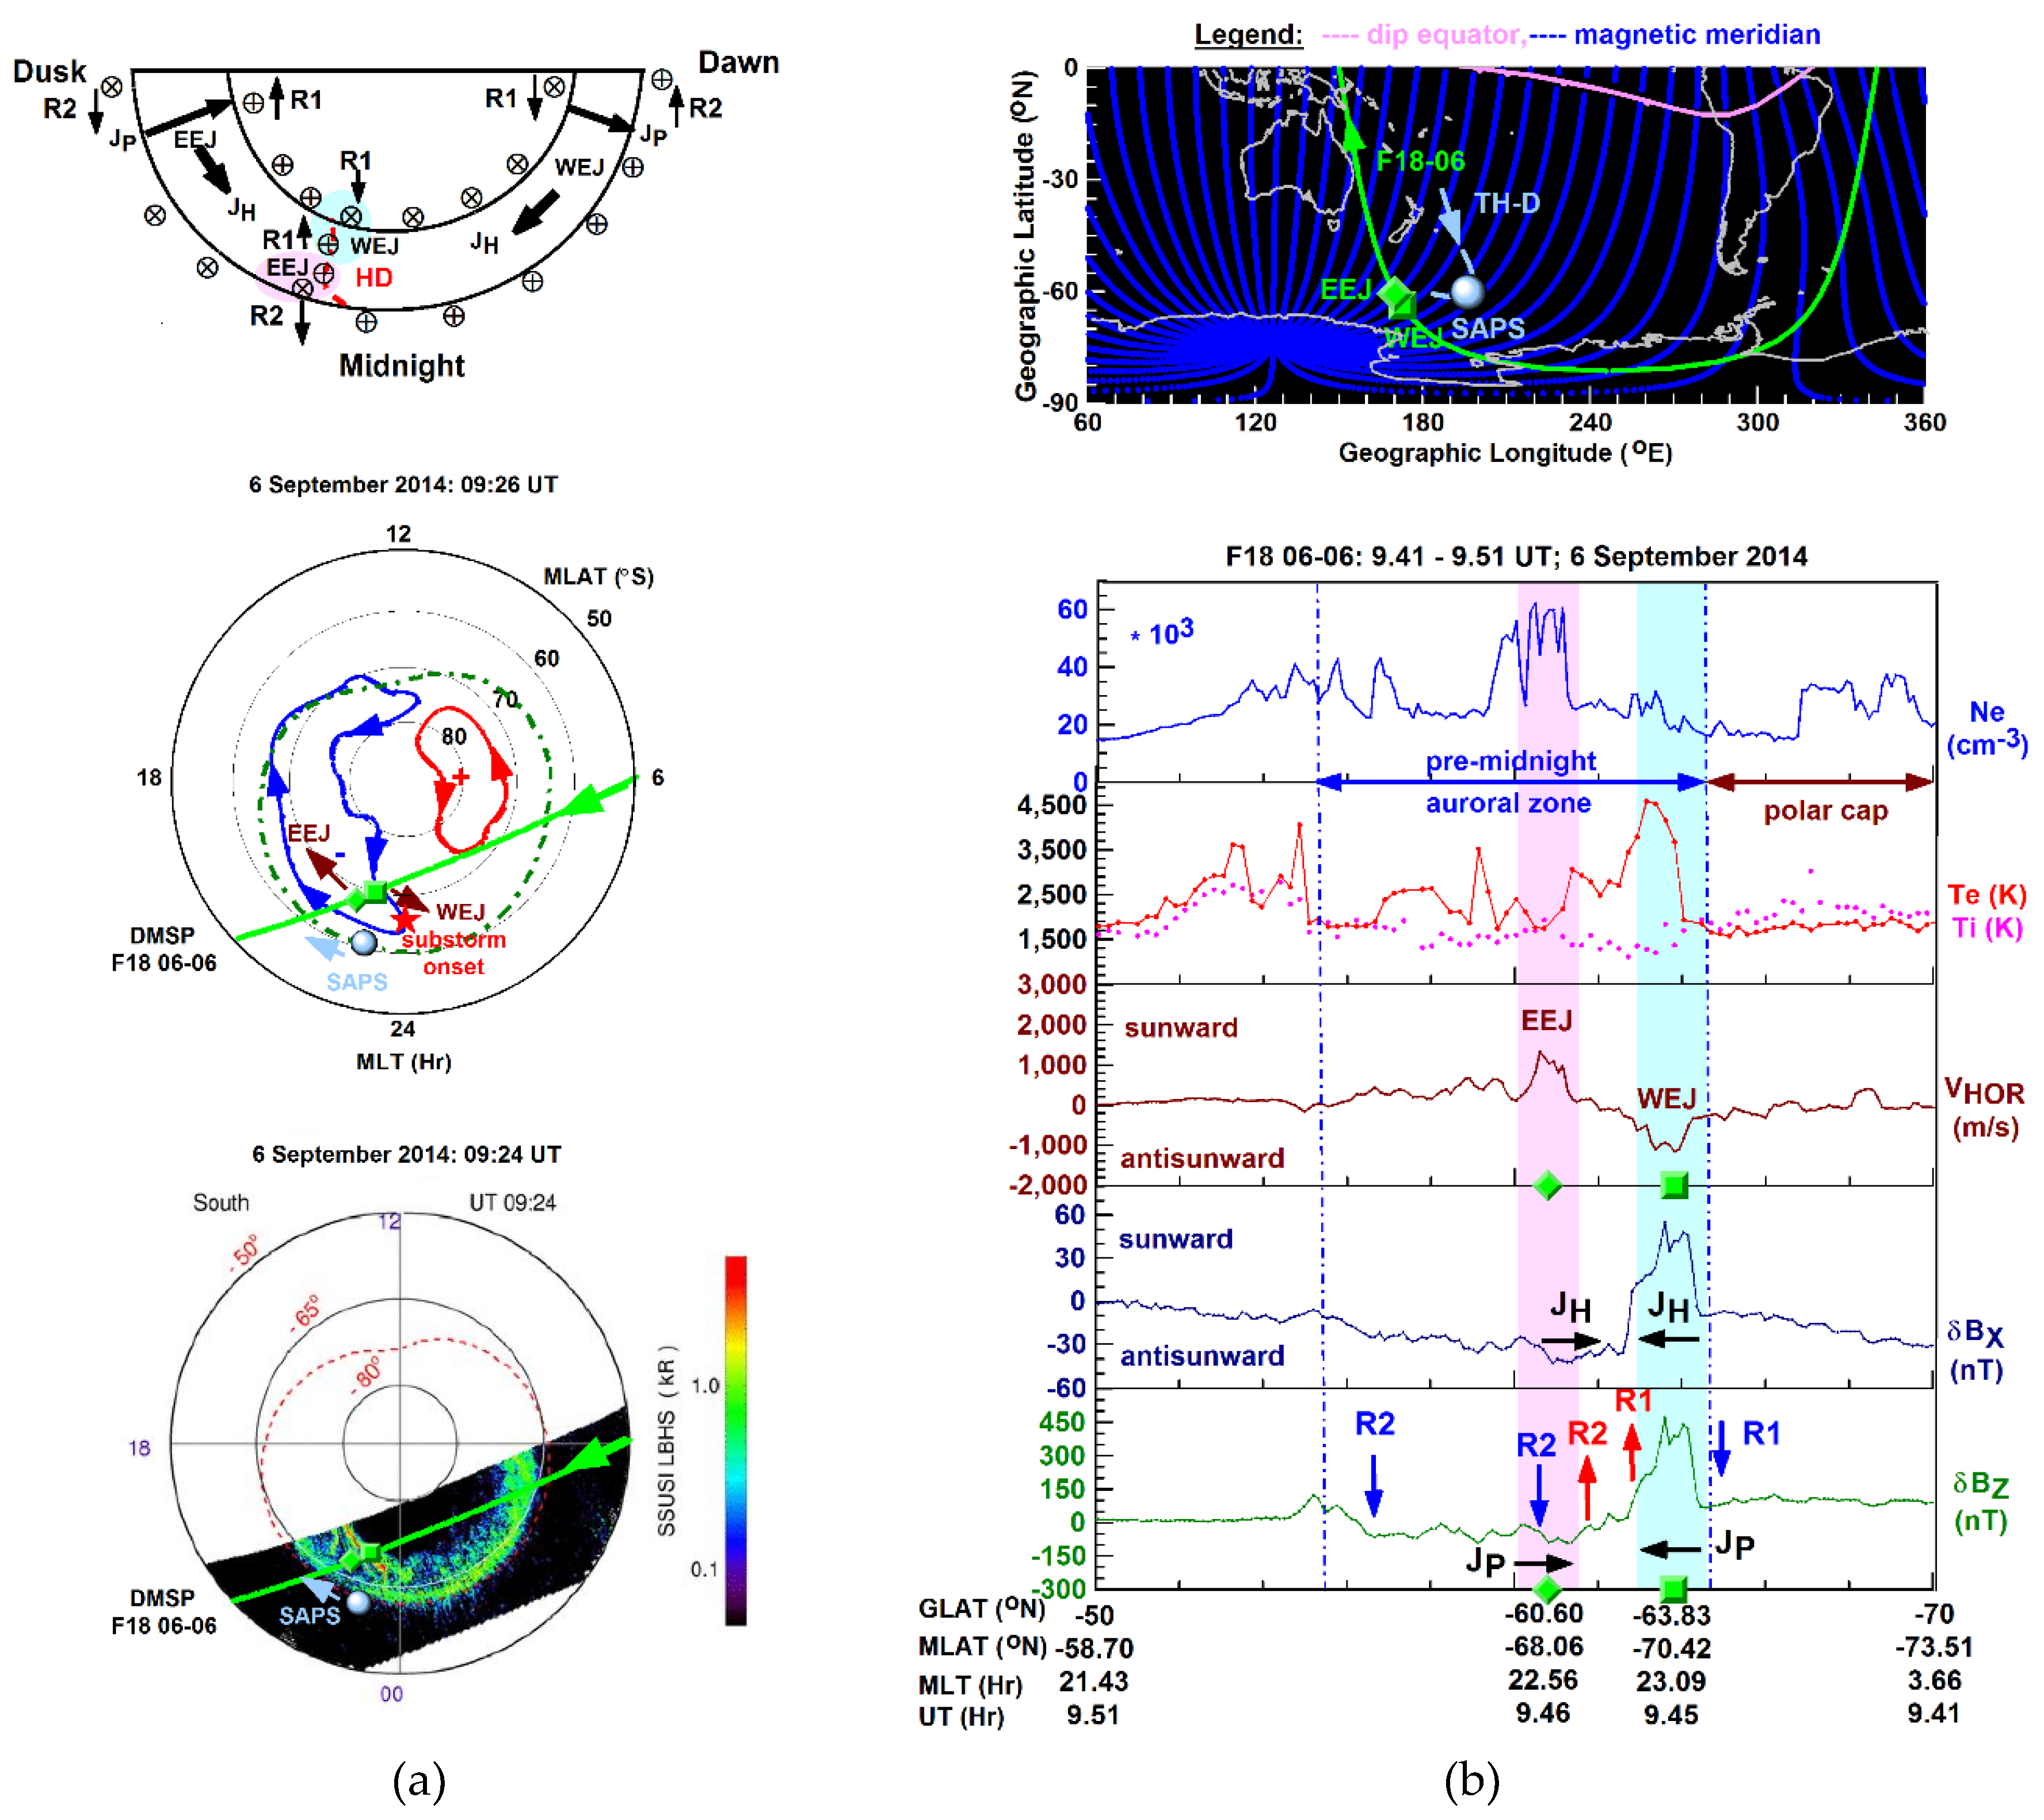
Figure 7.
Illustrating SAR arc development in Event 1 observed over Gillies, near the TH-E-observed SAPS location and substorm onset locations, the REGO image shows a series of SAR arc events occurring during the magnetotail reconnection related particle injections unfolding during a series of substorms.
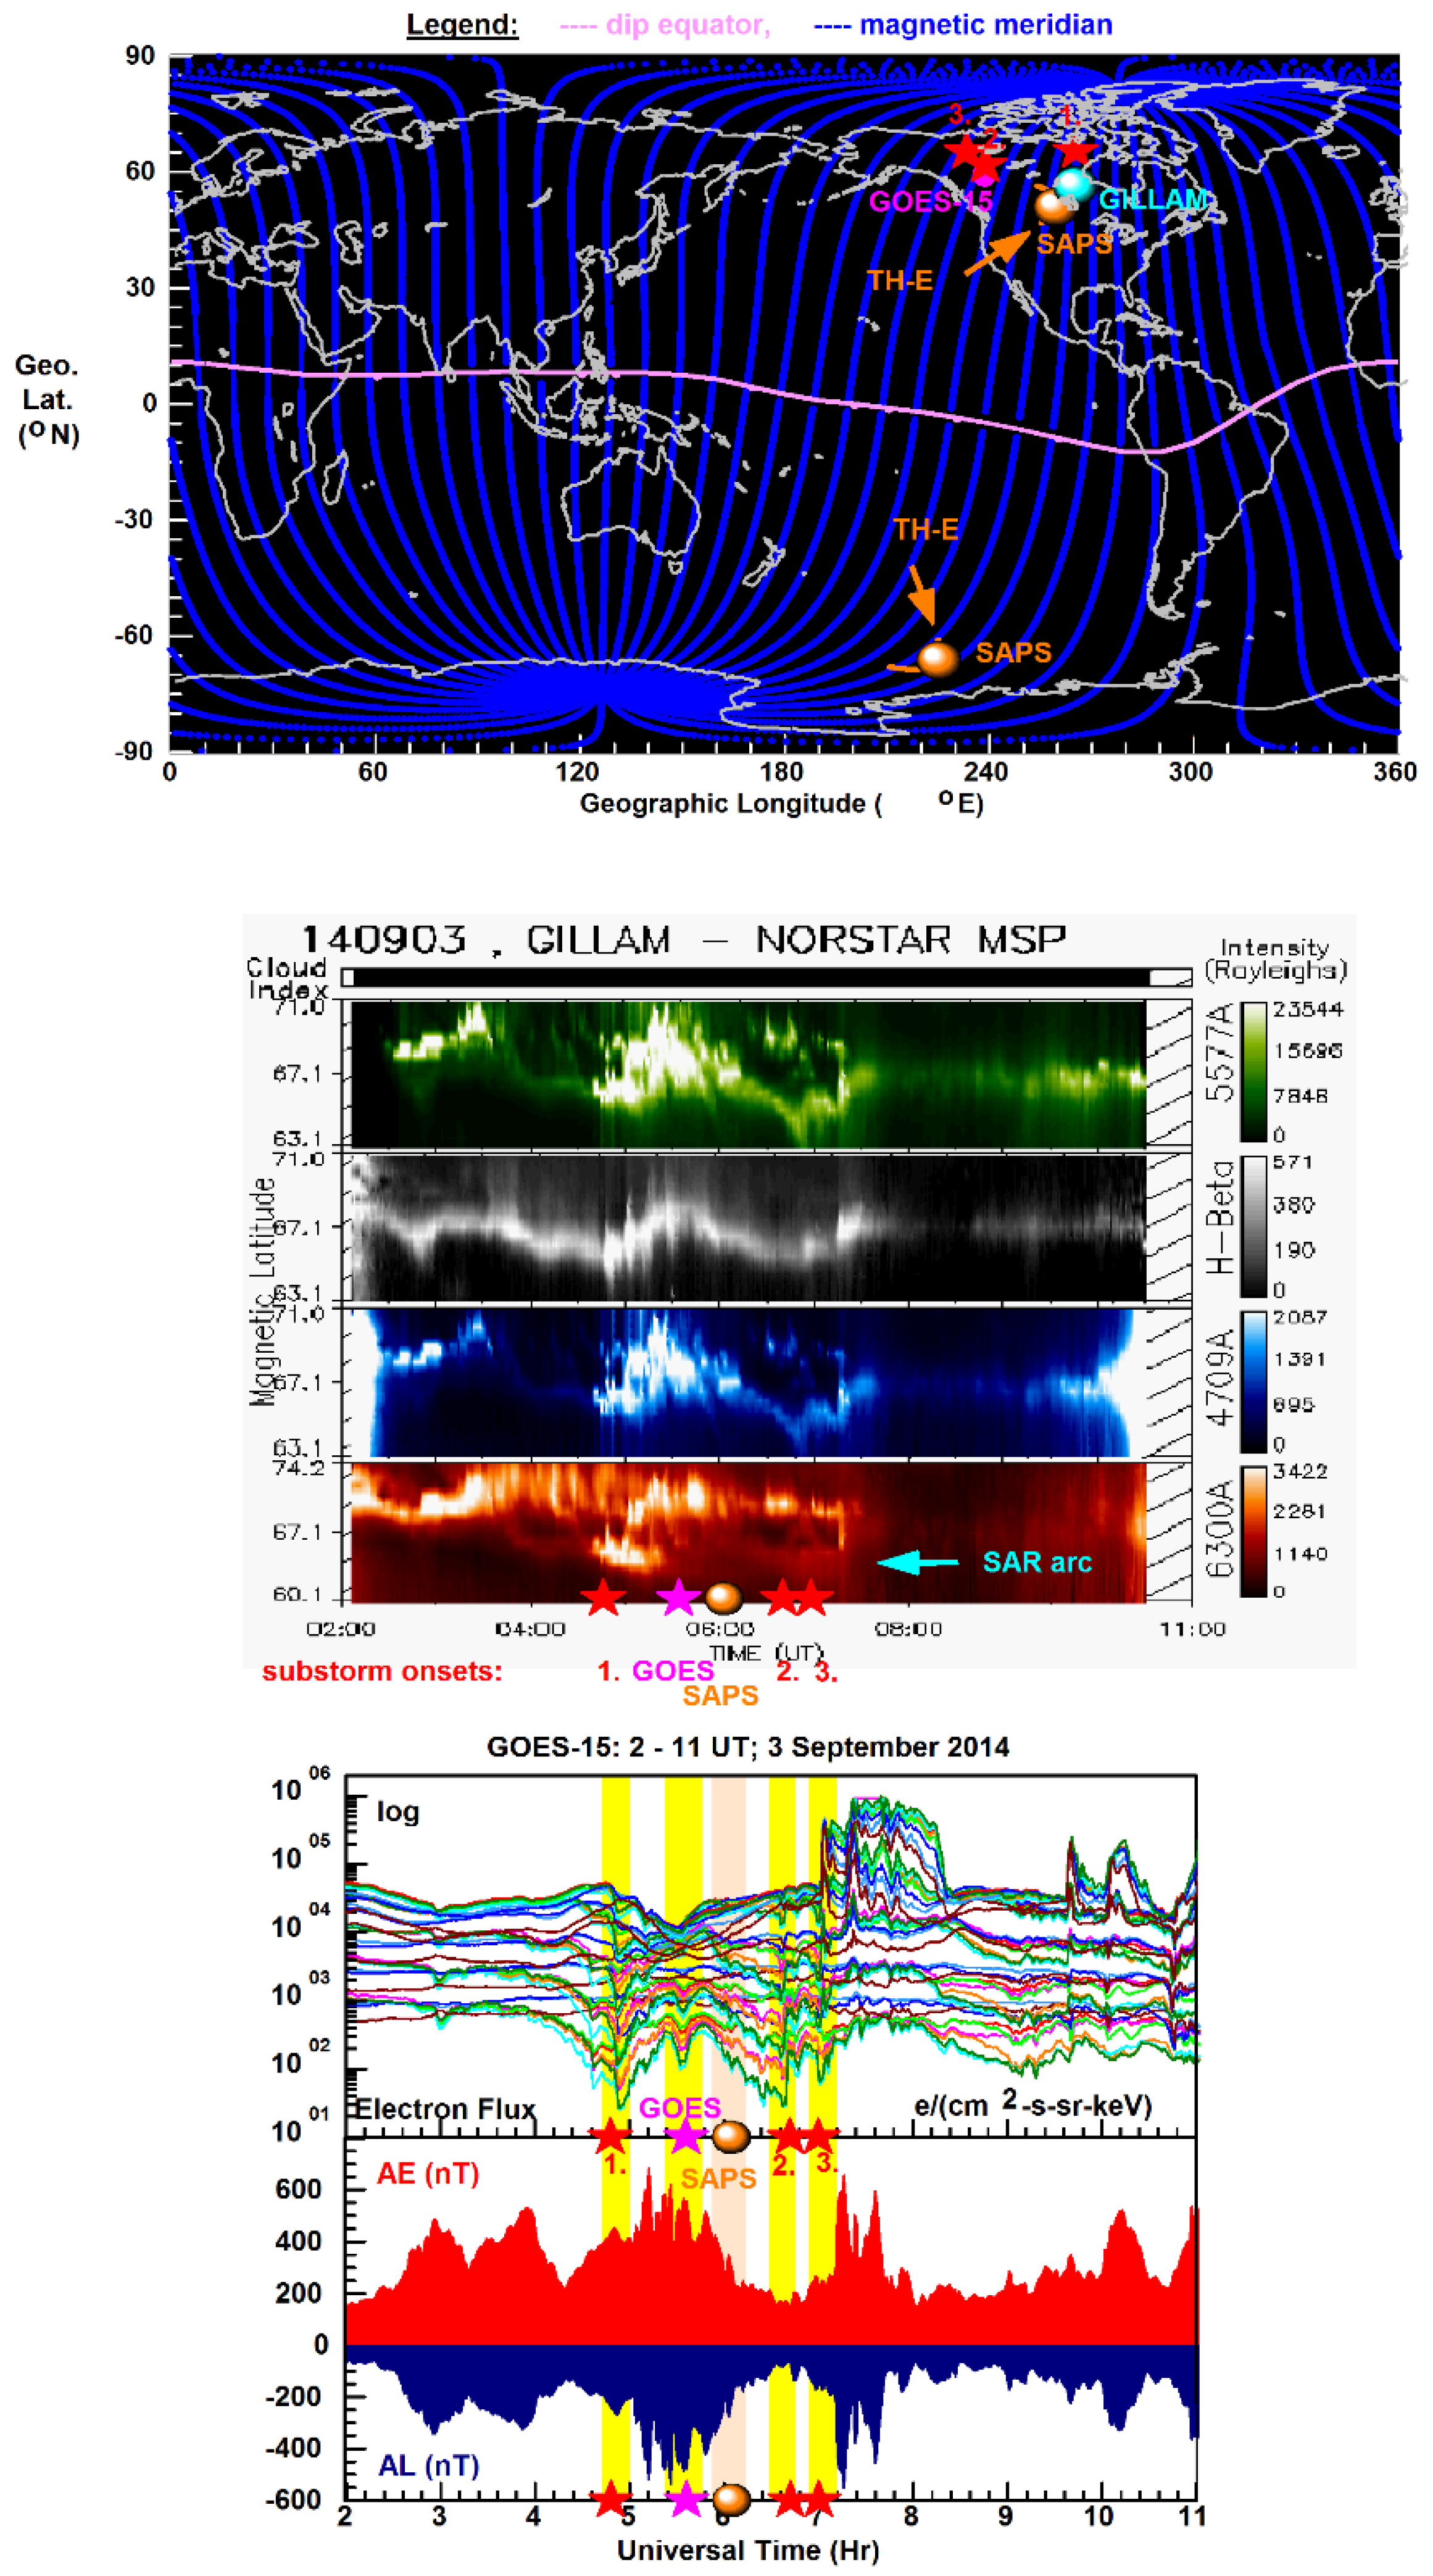
Figure 8.
Illustrating SAR arc development in Event 2 observed over Gillies, away from the TH-D-observed SAPS location but close to one of the substorm onset locations, the REGO image shows a series of SAR arc events occurring during the magnetotail reconnection related particle injections unfolding during a series of substorms.
Disclaimer/Publisher’s Note: The statements, opinions and data contained in all publications are solely those of the individual author(s) and contributor(s) and not of MDPI and/or the editor(s). MDPI and/or the editor(s) disclaim responsibility for any injury to people or property resulting from any ideas, methods, instructions or products referred to in the content. |
© 2024 by the authors. Licensee MDPI, Basel, Switzerland. This article is an open access article distributed under the terms and conditions of the Creative Commons Attribution (CC BY) license (http://creativecommons.org/licenses/by/4.0/).
Copyright: This open access article is published under a Creative Commons CC BY 4.0 license, which permit the free download, distribution, and reuse, provided that the author and preprint are cited in any reuse.


