
Submitted:
13 August 2025
Posted:
14 August 2025
You are already at the latest version
Abstract
Objective: Total bilirubin levels (TBLs) may serve as biomarkers of physiological stress or organ dysfunction in critically ill patients. We aimed to evaluate the association between TBLs and clinical outcomes in patients with severe traumatic brain injury (TBI). Methods: This is a single-center, retrospective study of patients with severe TBI treated between 1 January 2020 and 31 December 2023. Patients were identified using the Glasgow Coma Scale (GCS ≤8) and the Abbreviated Injury Scale (AIS ≥3). TBLs were collected at five clinical time points: hospital admission, ICU admission, ICU discharge, hospital discharge, and at death. Regression models were used to assess associations between TBLs and key outcomes, including emergency department (ED) length of stay (LOS), hospital LOS, ICU LOS, ventilator days, and in-hospital mortality. Results: Elevated TBLs were most common at hospital admission (10.7%) and declined progressively through the hospital stay. In multivariable analysis, higher TBLs at hospital admission and death were significantly associated with in-hospital mortality (OR 1.02, p<0.05 and OR 1.05, p<0.001, respectively). No significant associations were found between bilirubin levels and LOS or ventilator days in adjusted models. Multivariate analyses analyzing the effect of bilirubin levels on various clinical outcomes revealed significant associations among a variety of primary predictors (including total bilirubin level, race, severity score, and drug screen). Conclusions: Elevated TBLs at admission and at the time of death are associated with increased mortality in patients with severe TBI. Bilirubin may hold prognostic value when measured at specific clinical points.
Keywords:
total bilirubin
; traumatic brain injury
; mortality
; length of stay
; severity
; clinical outcomes
Introduction
Traumatic brain injury (TBI) is a major public health concern, affecting approximately 1.4 million individuals annually in the United States alone, resulting in around 235,000 hospitalizations and 50,000 deaths each year [1,2]. Furthermore, more than 40% of TBI survivors experience long-term disabilities, underscoring the substantial and lasting impact of TBI on both patients and healthcare systems [1,2] Despite advances in neurocritical care, severe TBI remains associated with high mortality rates, with nearly one-third of patients dying, and less than half achieving favorable neurological outcome [1,3,4,5]. Given the high incidence and profound long-term effects of TBI, understanding its underlying mechanisms and identifying reliable biomarkers for outcome prediction are crucial for improving patient care.
Bilirubin, a product of heme catabolism, has been increasingly recognized as a potential prognostic biomarker in neurological conditions, including TBI. As a byproduct of hemoglobin breakdown, bilirubin is produced through the action of heme oxygenase-1 (HO-1) [6], which degrades heme into biliverdin and, subsequently, bilirubin [7]. This pathway is essential in the central nervous system, with heme catabolism playing a role in conditions such as ischemic stroke, aneurysmal subarachnoid hemorrhage, and neurodegenerative diseases like Alzheimer’s [8,9,10,11,12]. In response to TBI, the increased oxidative stress can activate HO-1, leading to an elevation in bilirubin levels, which is thought to be part of a protective mechanism [6,13]. Known for its antioxidant, anti-inflammatory, and cytoprotective properties, bilirubin helps mitigate cellular damage following traumatic events [14,16].
Emerging studies have explored the relationship between bilirubin and clinical outcomes in various diseases, suggesting that elevated bilirubin levels may be linked to poor prognosis. In a study by Wang et al. [17], patients with TBI who had higher levels of serum total bilirubin (TBIL) and direct bilirubin (DBIL) exhibited significantly higher mortality rates. Their retrospective analysis of 361 TBI patients revealed that non-survivors had significantly lower Glasgow Coma Scale (GCS) scores and higher serum bilirubin levels compared to survivors (P<0.001 for both). Moreover, multivariate logistic regression analysis identified GCS, glucose levels, lactate dehydrogenase (LDH), and DBIL as significant independent risk factors for mortality. Notably, DBIL was shown to have a comparable area under the curve (AUC) value to GCS (0.778 vs. 0.750), and when combined, the predictive model with GCS and DBIL had an even higher AUC, indicating its potential as a reliable marker for predicting mortality in TBI patients [17].
Despite these findings, the precise role of bilirubin as a prognostic factor in TBI remains underexplored. Therefore, the objective of this study is to evaluate the relationship between serum bilirubin levels and injury severity, mortality, and long-term neurological outcomes in patients with severe TBI. By analyzing bilirubin fluctuations at key clinical timepoints, we aim to better understand its potential as a biomarker for outcome prediction and its role in the pathophysiology of TBI.
Methods
Study Population
This single-center, retrospective review was conducted at Elmhurst Hospital Center, a Level 1 trauma center verified by the American College of Surgeons (ACS) in Queens, New York City. Patient data were obtained from the National Trauma Registry of the ACS (NTRACS) database for our center. When necessary, patient medical charts were reviewed to collect additional pertinent information. We included all patients presenting with severe traumatic brain injury (TBI) between January 1, 2020, and December 31, 2023. Severe TBI was defined as a Glasgow Coma Scale (GCS) score of 8 or less after resuscitation but before sedation. Patients with an Abbreviated Injury Severity (AIS) score of 3 or higher were included. Only patients with recorded total bilirubin levels were analyzed. This study was approved by the institutional review board (IRB) at Elmhurst Facility (IRB number XXX).
Data Collection
For each patient, demographic data (age, sex, race, ethnicity), trauma-related data (mechanism, location, cause), primary mechanism codes, AIS, Injury Severity Score (ISS), clinical outcomes, and total bilirubin levels were collected. Primary mechanism codes were classified according to ICD-9-CM and ICD external cause-of-injury codes (ICD E-codes). Clinical outcomes included emergency department length of stay (ED LOS, hours), intensive care unit length of stay (ICU LOS, days), hospital length of stay (Hospital LOS, days), duration of mechanical ventilation (ventilatory days), and in-hospital mortality.
Normal total bilirubin levels in adults range from 0.0 to 1.2 mg/dL [17], with hyperbilirubinemia defined as levels above 1.2 mg/dL [17]. Any bilirubin values recorded as <0.2 or <0.3 mg/dL were set to 0.0 mg/dL for analysis. Total bilirubin levels were collected at five key time points: hospital admission, ICU admission, ICU discharge, hospital discharge, and patient death, if applicable. Definitions were as follows:
- Hospital admission: first measured bilirubin level after admission to the trauma bay.
- ICU admission: first measured bilirubin level after admission to the ICU.
- ICU discharge: last measured bilirubin level before transfer to a step-down or floor unit.
- Hospital discharge: last measured bilirubin level before discharge.
- Patient death: last measured bilirubin level before death.
In cases of missing bilirubin data, values were occasionally imputed using the most recent bilirubin measurement from the preceding time point.
Statistical Analyses
Descriptive statistics summarized patient demographics, trauma characteristics, and clinical outcomes. Proportions were calculated as the percentage of the total patient cohort.
Associations between total bilirubin levels at different clinical time points and clinical outcomes were evaluated using univariable and multivariable regression models. For continuous outcomes (ED LOS, ICU LOS, Hospital LOS, ventilatory days), generalized linear models were applied. Logistic regression was used for the binary outcome of in-hospital mortality. Multivariable models adjusted for potential confounders, including age, sex, race, ethnicity, trauma type, initial GCS, AIS, ISS, blood alcohol level, drug screen results, and pre-injury functional status.
For continuous outcomes, regression coefficients (β), 95% confidence intervals (CIs), and p-values were reported, representing the change in the outcome per unit increase in bilirubin level. For the logistic models, odds ratios (ORs), 95% CIs, and p-values were reported.
Statistical significance was set at p < 0.05 (95% CI), p < 0.01 (99% CI), and p < 0.001 (99.9% CI). All tests were two-tailed. Data analysis was performed using R version 4.4.2 (“Pile of Leaves”, released October 31, 2024) within the RStudio integrated development environment (version 2025.05.1+513).
Results
A total of 915 patients met the inclusion criteria and were analyzed, as summarized in Table 1. Of these, 703 (77%) were male and 212 (23%) were female. The mean age of the cohort was 51 years. Blunt trauma accounted for the majority of injuries (895 patients, 98%), while penetrating trauma represented 20 cases (2.2%).
The average initial Glasgow Coma Scale (GCS) score in the emergency department was 15, and the median Injury Severity Score (ISS) was 17.0 (± 10.4). During the index hospitalization, 126 patients (14%) died.
The median emergency department length of stay (ED LOS) was 9.6 hours. The median hospital length of stay was 6 days, and the median intensive care unit length of stay (ICU LOS) was 1.3 days.
As shown in Table 2, the vast majority of patients maintained normal total bilirubin levels throughout their hospital stay. The proportion of patients with normal bilirubin levels increased over time, rising from 89.3% at hospital admission to 97.0% at hospital discharge, and reaching 98.4% at the time of death. Elevated bilirubin levels were most prevalent at hospital admission (10.7%) and progressively declined throughout the hospitalization.
The range of total bilirubin levels at any time point was 0.0 to 44.0 mg/dL. As shown in Figure 1, both the mean and median total bilirubin levels at all five time points remained within the normal range. Total bilirubin levels on admission exhibited the widest variability, with a median of 0.4 mg/dL and a mean of 0.7 mg/dL. The maximum recorded values were 20.9 mg/dL at admission, 20.8 mg/dL at the first recorded time point, 44.0 mg/dL at the last recorded time point, 12.1 mg/dL at discharge, and 17.1 mg/dL at death.
Table 3 and Table 4 present the univariable and multivariable analyses, respectively, examining the associations between total bilirubin levels at different clinical time points and various clinical outcomes. In the unadjusted models (Table 3), higher bilirubin levels at patient death were significantly associated with fewer ventilator days (OR = 0.55, p < 0.05) and increased mortality risk (odds ratio [OR] = 1.39, p < 0.01). No other associations reached statistical significance.
In the adjusted models (Table 4), higher bilirubin levels at hospital admission and patient death were independently associated with increased mortality risk, with ORs of 1.02 (p < 0.05) and 1.05 (p < 0.001), respectively. No significant associations were observed between bilirubin levels and other clinical outcomes. Consistently, both unadjusted and adjusted analyses demonstrated that elevated bilirubin at patient death was significantly associated with in-hospital mortality.
Table 5, Table 6, Table 7, Table 8 and Table 9 present multivariable analyses, examining the associations between total bilirubin levels at different clinical time points and various clinical outcomes. In the analysis of the effects of bilirubin on ED LOS (Table 5), increased bilirubin levels were significantly associated with Native Hawaiian or Other Pacific Islander Race, initial GCS score, and positive drug screen for “other drugs” at all time points (p<0.001). In the multivariable regression analysis of effects of bilirubin on Hospital LOS (Table 6), increased bilirubin levels were significantly associated with AIS score (p<0.05), initial GCS score (p<0.001), and functional status before injury of “Not Applicable” (p<0.01) at all time points. Table 7 presents multivariate regression results assessing the effect of bilirubin on ICU LOS. Significant associations were found between increased bilirubin levels and penetrating injury (p<0.05), AIS score (p<0.05), blood alcohol level (p<0.05), initial GCS score (p<0.001), ISS score (p<0.05), and functional status before injury of “Not Applicable” (p<0.01) at all time points. Table 8 presents multivariate regression results assessing the effect of bilirubin on ventilator days. Significant associations were noted between increased bilirubin levels and AIS scores (p<0.05), initial GCS scores (p<0.001), and functional status before injury of “Not Applicable” (p<0.05) at all time points. Finally, i n the multivariable regression analysis of effects of bilirubin on In-Hospital Death (Table 9), increased bilirubin levels were significantly associated with age (p<0.001), black race (p<0.05), initial GCS score (p<0.001), ISS score (p<0.001), and functional status before injury of “Not Applicable” (p<0.001) at all time points. Total bilirubin was statistically significant at Hospital Admission (p<0.05) and Patient Death (p<0.001) time points.
Discussion
Key Findings
In this large, retrospective cohort study of 915 patients with severe traumatic brain injury (TBI), we identified a significant association between elevated total bilirubin levels (TBLs) and in-hospital mortality. Specifically, elevated TBLs at hospital admission and at the time of death were independently associated with higher mortality risk, as demonstrated in both univariable and multivariable regression models. These two time points emerged as the only ones with statistically significant prognostic value after adjusting for critical clinical covariates. Bilirubin levels measured at intermediate stages—ICU admission, ICU discharge, and hospital discharge—did not show a similar association with outcomes.
Importantly, the prevalence of hyperbilirubinemia was highest at admission (10.7%) and declined steadily throughout the hospitalization period, reaching just 1.6% at the time of death. This temporal trend underscores the dynamic behavior of bilirubin in critically ill patients and may reflect evolving physiological and systemic changes throughout TBI management. While prior studies have explored the prognostic implications of direct bilirubin [17], our study shows that even total bilirubin, a routinely available and cost-effective test, holds prognostic significance—particularly when measured at clinically meaningful time points.
These findings support the hypothesis that TBLs serve as a time-sensitive biomarker reflecting different pathophysiological processes at different stages: from initial injury severity at presentation to terminal organ dysfunction at death.
Implications of Study Findings
The clinical implications of these findings are multifaceted. From a pathophysiological perspective, bilirubin is a byproduct of heme catabolism via the heme oxygenase-1 (HO-1) pathway, which is upregulated in response to oxidative stress and inflammation—both of which are hallmark features of TBI [7,13]. This is particularly relevant given the central role of oxidative stress in secondary brain injury. In the early phase post-trauma, elevated TBLs may reflect systemic inflammation, hemolysis, hepatic congestion, or early liver dysfunction due to shock or hypoperfusion.
The strong association between admission bilirubin levels and in-hospital mortality aligns with the view that early bilirubin elevation could serve as a surrogate marker for initial injury burden, systemic insult, or oxidative stress, rather than isolated liver dysfunction. In contrast, elevated bilirubin at the time of death likely reflects end-stage multi-organ failure, cholestasis, or hepatic decompensation in critically ill patients, as similarly observed in other ICU populations [17,19,20,21,22].
The progressive decline in bilirubin levels across time points among surviving patients could represent effective resuscitation, resolution of inflammation, improved hepatic perfusion, or successful metabolic stabilization. Alternatively, this trend may be influenced by survivorship bias, whereby patients with persistently elevated TBLs succumb earlier and thus are underrepresented in later time points. Regardless of the underlying cause, our findings highlight the temporal specificity of bilirubin’s prognostic utility—when the test is performed matters as much as what the result shows.
This insight aligns with emerging trends in critical care research that favor trajectory-based or dynamic biomarkers over static thresholds. Bilirubin, in this context, may act as a “moving window” into the physiological trajectory of a patient, potentially guiding both prognosis and treatment decisions.
Integration with Existing Literature
Our study builds on prior research linking bilirubin to outcomes in neurological diseases, including stroke, subarachnoid hemorrhage, and TBI [6,7,8,9,10,11,12,13]. Wang et al. [17] demonstrated that direct bilirubin, in combination with GCS, was a powerful predictor of mortality in TBI. Our findings extend this by focusing on total bilirubin, which is more widely available and routinely tested. Unlike Wang et al., we assessed bilirubin levels at multiple standardized time points, providing a more nuanced understanding of its behavior over time and highlighting that not all elevations are equally informative.
We also contribute new evidence from a larger, more diverse sample. Our cohort—drawn from a Level 1 trauma center serving a multiethnic population—includes nearly three times as many patients as in prior studies [17]. Additionally, our adjustment for a comprehensive list of clinical confounders (e.g., GCS, AIS, ISS, trauma type, baseline function) increases the robustness of our results and supports the independent prognostic value of TBL.
Strengths and Limitations
Our study possesses several notable strengths that enhance the robustness and clinical relevance of the findings. The relatively large sample size (N=915) provides substantial statistical power, allowing for more precise estimates of associations between bilirubin levels and clinical outcomes. This also enables potential subgroup analyses in future work to investigate how bilirubin’s prognostic value might differ across demographic or injury severity strata. Additionally, the collection of bilirubin measurements at five distinct and clinically meaningful time points—ranging from hospital admission through ICU discharge and patient death—offers a comprehensive view of bilirubin kinetics throughout hospitalization. This longitudinal approach surpasses the limitations of studies relying on single, isolated bilirubin values and provides a dynamic perspective on how bilirubin levels fluctuate in response to injury progression and clinical interventions. Moreover, our multivariable regression models adjusted for a broad spectrum of relevant confounders, including trauma severity (ISS, AIS), neurological status (GCS), demographic factors, pre-injury functional status, and toxicology results. Such adjustment strengthens the validity of observed associations by minimizing potential confounding biases.
Nonetheless, several limitations must be acknowledged to contextualize our findings appropriately. First, the single-center retrospective design inherently limits the generalizability of the results. The patient population, clinical management protocols, and laboratory measurement practices at Elmhurst Hospital Center may not reflect those at other trauma centers, both regionally and internationally. Retrospective studies are also subject to information bias, including inconsistencies in documentation and the potential for missing or incomplete data. Although we employed data imputation methods to address missing bilirubin values, imputation cannot fully substitute for prospectively collected data and may introduce some degree of estimation error.
A further limitation is our reliance exclusively on total bilirubin measurements. While total bilirubin is a widely accessible and clinically useful marker, it lacks the diagnostic granularity provided by fractionated bilirubin (direct and indirect) levels. Fractionation can differentiate whether hyperbilirubinemia arises from hepatic dysfunction (typically elevated direct bilirubin) or increased hemolysis and heme breakdown (usually reflected in indirect bilirubin). Prior research has suggested that direct bilirubin may be a more sensitive predictor of mortality and neurological outcomes in TBI [17], underscoring the need for future studies to include these measures.
Moreover, our dataset lacked key complementary laboratory parameters such as hepatic enzyme panels (e.g., ALT, AST), markers of hemolysis (e.g., lactate dehydrogenase, haptoglobin), volume of blood transfusions administered, and standardized liver function scores (e.g., MELD or Child-Pugh scores) [17]. These metrics could have provided crucial context for interpreting bilirubin fluctuations, distinguishing between primary liver injury, systemic inflammation, or other causes of altered bilirubin metabolism. Without these data, it is challenging to fully elucidate the mechanistic pathways linking bilirubin changes to TBI outcomes.
Finally, while in-hospital mortality remains a critical and objective clinical endpoint, it represents only one facet of patient recovery. We did not evaluate long-term functional and neurocognitive outcomes, such as the Glasgow Outcome Scale (GOS) or measures of quality of life, which are essential for assessing the broader clinical utility of bilirubin as a prognostic biomarker. Future prospective studies incorporating extended follow-up periods and functional outcome assessments are necessary to determine whether bilirubin can also predict meaningful neurological recovery and rehabilitation potential.
In summary, although our study advances understanding of bilirubin’s prognostic role in severe TBI and benefits from robust methodology, its retrospective, single-center nature and limited biomarker scope highlight the need for further research to validate and extend these findings.
Future Perspectives
This study lays the groundwork for multiple promising future research directions aimed at refining the clinical utility of bilirubin as a biomarker in severe traumatic brain injury (TBI).
Firstly, there is a critical need for prospective multicenter studies that can validate our findings across a wider range of patient populations, healthcare systems, and geographical locations. Single-center retrospective analyses, while valuable, are limited in their generalizability. Multicenter trials would not only increase sample size and diversity but also allow standardized protocols for bilirubin measurement and patient management. These future studies should systematically collect both total bilirubin (TBIL) and direct bilirubin (DBIL) levels, as emerging evidence suggests that the different fractions of bilirubin may have distinct pathophysiological roles and prognostic implications. Incorporating dynamic modeling of biomarker trends over time, rather than relying solely on single-time-point measurements, would enhance the ability to capture complex biological responses to injury and treatment.
Secondly, future investigations should focus on characterizing bilirubin trajectories post-TBI. Bilirubin levels are likely influenced by various factors such as ongoing hemolysis, liver function changes, inflammatory responses, and oxidative stress, all of which evolve throughout hospitalization. Tracking these fluctuations longitudinally can provide richer insights into the systemic and central nervous system’s response to trauma. Cutting-edge analytical approaches, including advanced time-series analyses and machine learning algorithms, could identify distinct bilirubin patterns or profiles associated with specific outcomes. These data-driven methods may help uncover predictive biomarkers that surpass conventional clinical scoring in accuracy and reliability, and may even detect subclinical changes heralding complications or recovery.
Thirdly, there is burgeoning interest in therapeutically modulating the heme oxygenase-1 (HO-1) pathway, given the potent antioxidant, anti-inflammatory, and neuroprotective effects of its downstream metabolites, particularly bilirubin and carbon monoxide [23,24,25,26]. Experimental and translational research should explore whether early pharmacologic enhancement of HO-1 activity can mitigate secondary brain injury in TBI patients, especially in those exhibiting early hyperbilirubinemia, which may signify an activated protective response. Investigating the timing, dosage, and delivery mechanisms of such interventions could pave the way for novel treatments that complement standard neurocritical care and improve long-term neurological outcomes.
Finally, integrating bilirubin measurements into existing prognostic models or ICU scoring systems represents an attractive clinical application. Given that bilirubin assays are inexpensive, routinely available, and biologically relevant, their inclusion could enhance the precision of outcome prediction and risk stratification in TBI. Importantly, future studies should extend beyond mortality to evaluate correlations between bilirubin levels and functional, cognitive, and quality-of-life outcomes. Understanding how bilirubin relates to neurological recovery and rehabilitation potential would broaden its utility and support its incorporation into personalized treatment planning.
In summary, advancing our understanding of bilirubin’s role in TBI through prospective, mechanistic, and translational studies promises to improve both prognostication and therapeutic strategies, ultimately benefiting patient care and outcomes.
Conclusions
This large retrospective study demonstrates that elevated total bilirubin levels at hospital admission and at the time of death are independently associated with increased in-hospital mortality among patients with severe traumatic brain injury. These findings suggest that bilirubin, a routinely measured and easily accessible laboratory value, may serve as a valuable prognostic biomarker when assessed at specific clinical time points. The observed decline in bilirubin levels over the hospital course among survivors further highlights its dynamic nature and potential to reflect the severity of systemic injury and physiological stress.
The results underscore the complex role of bilirubin in TBI pathophysiology. While bilirubin has known antioxidant and cytoprotective effects, elevated levels may indicate overwhelming oxidative stress, systemic inflammation, or hepatic dysfunction in critically ill patients. Elevated bilirubin on admission may reflect the initial severity of injury and systemic insult, whereas elevations near death likely signify multi-organ failure and poor prognosis. This temporal specificity reinforces the importance of timing when using bilirubin as a prognostic tool.
Future research should aim to validate these findings prospectively and explore the prognostic utility of direct and indirect bilirubin fractions, as well as longitudinal bilirubin trajectories. Integrating bilirubin measurements with other biomarkers and clinical parameters may improve risk stratification and guide therapeutic interventions targeting oxidative stress pathways in severe TBI. Ultimately, bilirubin holds promise as a cost-effective biomarker to aid clinical decision-making and improve outcomes in this high-risk population.
Author Contributions
Conceptualization—B.S.; Resources: B.S., G.A.; Investigation: B.S., K.T., N.D.B.; Methodology: B.S., M.A.; Formal analysis: B.S., M.A.; writing—original draft preparation—B.S., M.A., M.H. and S.D.M; writing—review and editing—B.S., J.W., and Z.S.; figures and table- B.S. and M.A.; supervision—B.S.; project administration—B.S. All authors have read and agreed to the published version of the manuscript.
Funding
There is no grant support or financial relationship for this manuscript.
Institutional Review Board Statement
This retrospective study was approved by the IRB at Elmhurst Facility on 5 July 2024, with IRB number 24-12-092-05G.
Informed Consent Statement
Retrospective analysis was performed on anonymized data, and informed consent was not applicable.
Data Availability Statement
Data for this study were requested from the Elmhurst Trauma registry and extracted using electronic medical records after receiving approval from the Institutional Review Board at our facility (Elmhurst Hospital Center).
Conflicts of Interest
The authors have no competing interests to declare
References
- Kleindienst, A.; Hannon, M.J.; Buchfelder, M.; Verbalis, J.G. Hyponatremia in Neurotrauma: The Role of Vasopressin. Journal of Neurotrauma. 2016, 33, 615–624. [Google Scholar] [CrossRef] [PubMed]
- Sharma, B.; Jiang, W.; Hasan, M.M.; Agriantonis, G.; Bhatia, N.D.; Shafaee, Z.; Twelker, K.; Whittington, J. Natremia Significantly Influences the Clinical Outcomes in Patients with Severe Traumatic Brain Injury. Diagnostics (Basel, Switzerland). 2025, 15, 125. [Google Scholar] [CrossRef] [PubMed]
- Chen, R.C.; Cai, Y.J.; Wu, J.M.; Wang, X.D.; Song, M.; Wang, Y.Q.; Zheng, M.H.; Chen, Y.P.; Lin, Z.; Shi, K.Q. Usefulness of albumin-bilirubin grade for evaluation of long-term prognosis for hepatitis B-related cirrhosis. Journal of viral hepatitis. 2017, 24, 238–245. [Google Scholar] [CrossRef] [PubMed]
- Phillips, J.; Henderson, A.C. Hemolytic Anemia: Evaluation and Differential Diagnosis. American family physician. 2018, 98, 354–361. [Google Scholar]
- Yang, Z.X.; Lv, X.L.; Yan, J. Serum Total Bilirubin Level Is Associated With Hospital Mortality Rate in Adult Critically Ill Patients: A Retrospective Study. Frontiers in medicine. 2021, 8, 697027. [Google Scholar] [CrossRef]
- Wang, X.; Chowdhury, J.R.; Chowdhury, N.R. Bilirubin metabolism: Applied physiology. Current Paediatrics. 2006, 16, 70–74. [Google Scholar] [CrossRef]
- Mancuso, C. Heme oxygenase and its products in the nervous system. Antioxidants & redox signaling. 2004, 6, 878–887. [Google Scholar]
- Thakkar, M.; Edelenbos, J. ; Doré; S Bilirubin and Ischemic Stroke: Rendering the Current Paradigm to Better Understand the Protective Effects of Bilirubin. Molecular neurobiology. 2019, 56, 5483–5496. [Google Scholar] [CrossRef]
- Suzuki, H.; Muramatsu, M.; Kojima, T.; Taki, W. Intracranial heme metabolism and cerebral vasospasm after aneurysmal subarachnoid hemorrhage. Stroke. 2003, 34, 2796–2800. [Google Scholar] [CrossRef]
- Fest, S.; Soldati, R.; Christiansen, N.M.; Zenclussen, M.L.; Kilz, J.; Berger, E.; Starke, S.; Lode, H.N.; Engel, C.; Zenclussen, A.C.; Christiansen, H. Targeting of heme oxygenase-1 as a novel immune regulator of neuroblastoma. International journal of cancer. 2016, 138, 2030–2042. [Google Scholar] [CrossRef]
- Ghosh, C.; Seal, M.; Mukherjee, S.; Ghosh Dey, S. Alzheimer’s Disease: A Heme-Aβ Perspective. Accounts of chemical research. 2015, 48, 2556–2564. [Google Scholar] [CrossRef]
- Nitti, M.; Piras, S.; Brondolo, L.; Marinari, U.M.; Pronzato, M.A.; Furfaro, A.L. Heme Oxygenase 1 in the Nervous System: Does It Favor Neuronal Cell Survival or Induce Neurodegeneration? International journal of molecular sciences. 2018, 19, 2260. [Google Scholar] [CrossRef]
- Dohi, K.; Satoh, K.; Ohtaki, H.; Shioda, S.; Miyake, Y.; Shindo, M.; Aruga, T. Elevated plasma levels of bilirubin in patients with neurotrauma reflect its pathophysiological role in free radical scavenging. In vivo (Athens, Greece). 2005, 19, 855–860. [Google Scholar]
- Pineda, S.; Bang, O.Y.; Saver, J.L.; Starkman, S.; Yun, S.W.; Liebeskind, D.S.; Kim, D.; Ali, L.K.; Shah, S.H.; Ovbiagele, B. Association of serum bilirubin with ischemic stroke outcomes. Journal of stroke and cerebrovascular diseases: the official journal of the National Stroke Association. 2008, 17, 147–152. [Google Scholar] [CrossRef] [PubMed]
- Orozco-Ibarra, M.; Estrada-Sánchez, A.M.; Massieu, L.; Pedraza-Chaverrí, J. Heme oxygenase-1 induction prevents neuronal damage triggered during mitochondrial inhibition: role of CO and bilirubin. The international journal of biochemistry & cell biology. 2009, 41, 1304–1314. [Google Scholar]
- Chang, E.F.; Claus, C.P.; Vreman, H.J.; Wong, R.J.; Noble-Haeusslein, L.J. Heme regulation in traumatic brain injury: relevance to the adult and developing brain. Journal of cerebral blood flow and metabolism: official journal of the International Society of Cerebral Blood Flow and Metabolism. 2005, 25, 1401–1417. [Google Scholar] [CrossRef]
- Wang, R.; He, M.; Xu, J. Serum bilirubin level correlates with mortality in patients with traumatic brain injury. Medicine. 2020, 99, e21020. [Google Scholar] [CrossRef]
- Stocker, R.; Yamamoto, Y.; McDonagh, A.F.; Glazer, A.N.; Ames, B.N. Bilirubin is an antioxidant of possible physiological importance. Science. 1987, 235, 1043–1046. [Google Scholar] [CrossRef] [PubMed]
- Cadena, A.J.; Rincon, F. Hypothermia and temperature modulation for intracerebral hemorrhage (ICH): pathophysiology and translational applications. Frontiers in neuroscience. 2024, 18, 1289705. [Google Scholar] [CrossRef]
- Chen, S.; Li, L.; Peng, C.; Bian, C.; Ocak, P.E.; Zhang, J.H.; Yang, Y.; Zhou, D.; Chen, G.; Luo, Y. Targeting Oxidative Stress and Inflammatory Response for Blood-Brain Barrier Protection in Intracerebral Hemorrhage. Antioxidants & redox signaling.
- Jia, P.; Peng, Q.; Fan, X.; Zhang, Y.; Xu, H.; Li, J.; Sonita, H.; Liu, S.; Le, A.; Hu, Q.; Zhao, T.; Zhang, S.; Wang, J.; Zille, M.; Jiang, C.; Chen, X.; Wang, J. Immune-mediated disruption of the blood-brain barrier after intracerebral hemorrhage: Insights and potential therapeutic targets. CNS neuroscience & therapeutics. 2024, 30, e14853. [Google Scholar]
- Wan, Y.; Holste, K.G.; Hua, Y.; Keep, R.F.; Xi, G. Brain edema formation and therapy after intracerebral hemorrhage. Neurobiology of disease. 2023, 176, 105948. [Google Scholar] [CrossRef]
- Queiroga, C.S.; Vercelli, A.; Vieira, H.L. Carbon monoxide and the CNS: challenges and achievements. British journal of pharmacology. 2015, 172, 1533–1545. [Google Scholar] [CrossRef]
- Almeida, A.S.; Figueiredo-Pereira, C.; Vieira, H.L. Carbon monoxide and mitochondria-modulation of cell metabolism, redox response and cell death. Frontiers in physiology. 2015, 6, 33. [Google Scholar] [CrossRef] [PubMed]
- Kamat, P.K.; Ahmad, A.S.; Doré, S. Carbon monoxide attenuates vasospasm and improves neurobehavioral function after subarachnoid hemorrhage. Archives of biochemistry and biophysics. 2019, 676, 108117. [Google Scholar] [CrossRef] [PubMed]
- Nakamura, T.; Keep, R.F.; Hua, Y.; Schallert, T.; Hoff, J.T.; Xi, G. Deferoxamine-induced attenuation of brain edema and neurological deficits in a rat model of intracerebral hemorrhage. Neurosurgical focus. 2003, 15, ECP4. [Google Scholar] [CrossRef] [PubMed]
Figure 1.
Distribution of Total Bilirubin Levels (Mean and Median) at Hospital Admission, ICU Admission, ICU Discharge, Hospital Discharge, and Death.
Figure 1.
Distribution of Total Bilirubin Levels (Mean and Median) at Hospital Admission, ICU Admission, ICU Discharge, Hospital Discharge, and Death.
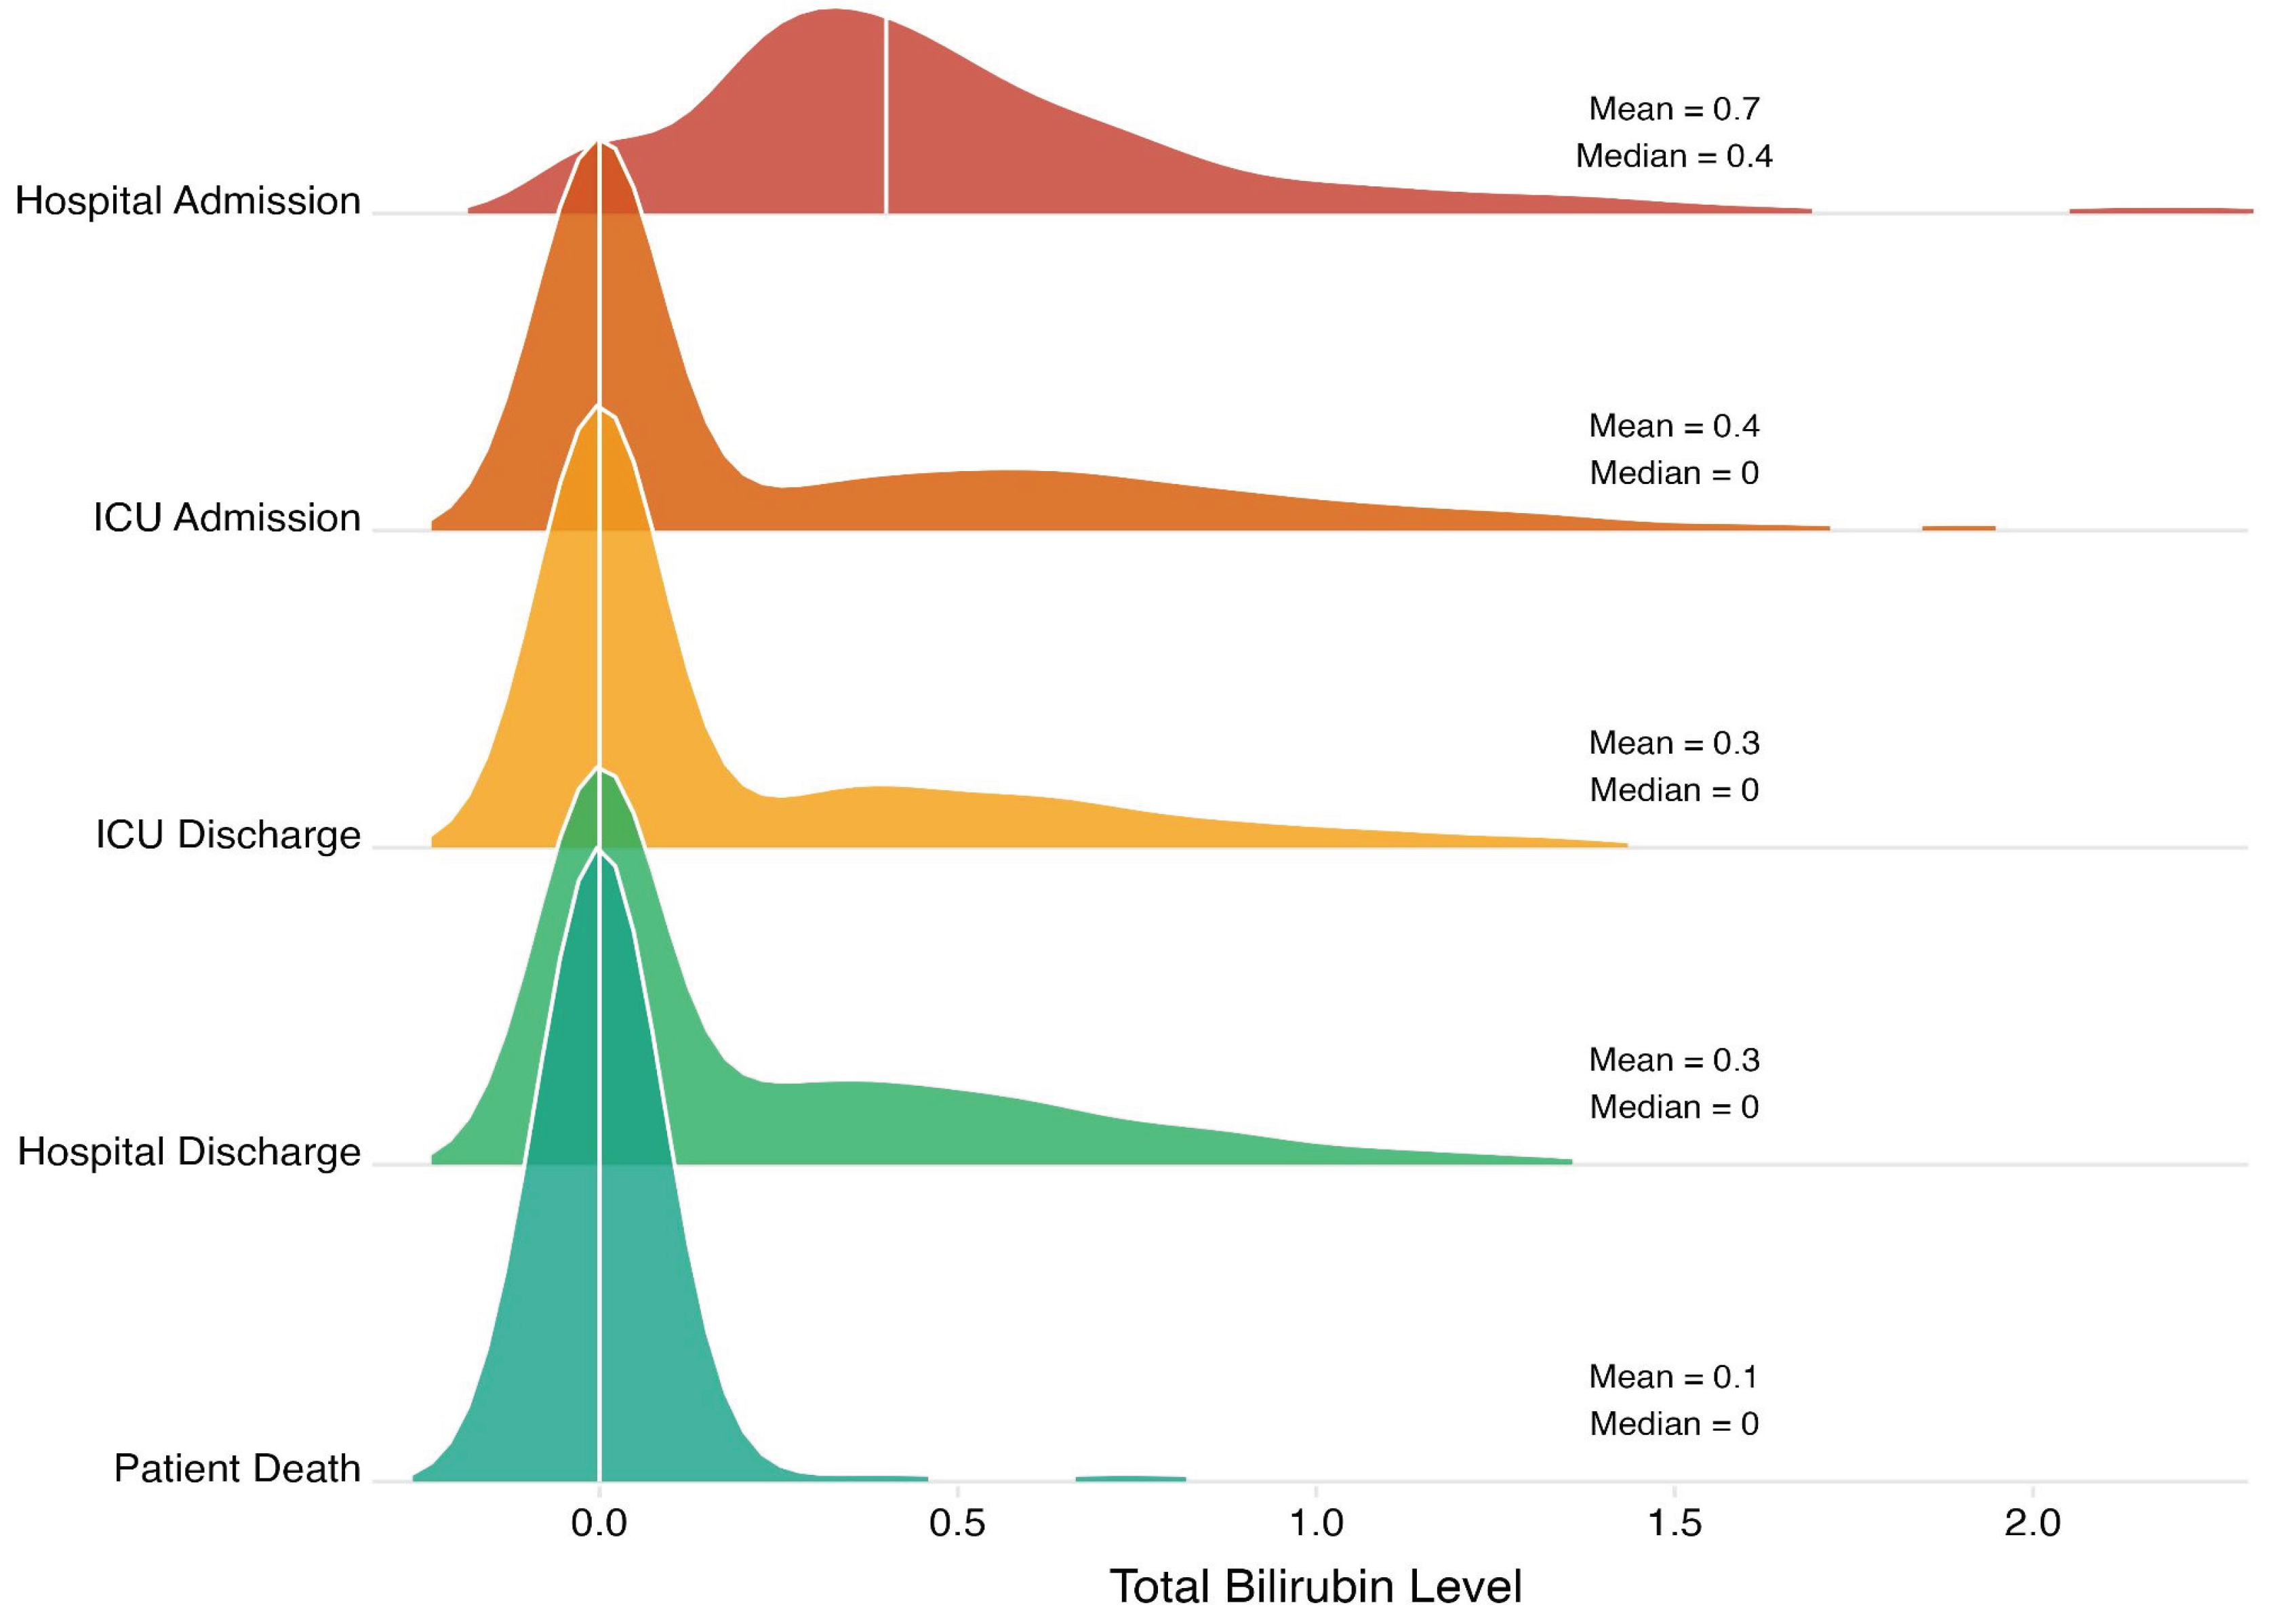

Table 1.
Patient Demographics, Injury Characteristics, and Clinical Outcomes in Severe TBI Cohort.
| Characteristic | N = 9151 |
|---|---|
| Age | 51.0 (22.1) |
| Sex | |
| Male | 703 (77%) |
| Female | 212 (23%) |
| Race | |
| Other | 527 (58%) |
| White | 167 (19%) |
| Asian | 133 (15%) |
| Black | 69 (7.7%) |
| Native Hawaiian or Other Pacific Islander | 4 (0.4%) |
| American Indian | 1 (0.1%) |
| Ethnicity | |
| Non-Hispanic Origin | 449 (51%) |
| Hispanic Origin | 433 (49%) |
| Functional Status Before Injury | |
| Independent | 855 (94%) |
| Partially Dependent | 30 (3.3%) |
| Not Applicable | 21 (2.3%) |
| Dependent | 6 (0.7%) |
| Trauma Type | |
| Blunt | 895 (98%) |
| Penetrating | 20 (2.2%) |
| ED Initial GCS | 15.0 (4.1) |
| ISS | 17.0 (10.4) |
| Drug Screen | |
| Not Tested | 383 (42%) |
| No Drugs Detected | 357 (39%) |
| Alcohol Only | 144 (16%) |
| Other Drugs | 27 (3.0%) |
| Alcohol and Other Drugs | 3 (0.3%) |
| ED LOS (hours) | 9.6 (13.6) |
| Hospital LOS (days) | 6.0 (20.6) |
| ICU LOS (days) | 1.3 (7.3) |
| Ventilator Days (days) | 0.0 (6.4) |
| Hospital Disposition | |
| Routine Discharge | 475 (52%) |
| Rehab or Nursing Facility | 184 (20%) |
| Died in Hospital | 126 (14%) |
| Home with services | 49 (5.4%) |
| Left AMA | 29 (3.2%) |
| Transfer to Another Hospital | 23 (2.5%) |
| Other Health Care Facility | 12 (1.3%) |
| Homeless/Shelter | 6 (0.7%) |
| Police Custody/Jail/Prison | 5 (0.5%) |
| Inpatient Psych Care | 4 (0.4%) |
Note: 1Median (SD); n (%).
Table 2.
Total Bilirubin Levels at Key Clinical Time Points During Hospitalization.
| Total Bilirubin at Time Point, n (%) | |||||
|---|---|---|---|---|---|
| Bilirubin Level | Hospital Admission | ICU Admission | ICU Discharge | Hospital Discharge | Patient Death |
|
Normal (0.0-1.2 mg/dL) |
817 (89.3%) |
833 (91%) |
861 (94.1%) |
888 (97%) |
900 (98.4%) |
|
Hyperbilirubinemia (>1.2 mg/dL) |
98 (10.7%) |
82 (9%) |
54 (5.9%) |
27 (3%) |
15 (1.6%) |
Table 3.
Univariable Analyses of Association of Association of Total Bilirubin Levels on Clinical Outcomes (Unadjusted Models).
Table 3.
Univariable Analyses of Association of Association of Total Bilirubin Levels on Clinical Outcomes (Unadjusted Models).
| Total Bilirubin Measurement Timing1 | |||||
|---|---|---|---|---|---|
| Outcome | Hospital Admission | ICU Admission | ICU Discharge | Hospital Discharge | Patient Death |
| ED LOS | -0.42 (-1.2-0.37) | -0.27 (-1.06-0.53) | -0.16 (-0.63-0.32) | -0.22 (-1.67-1.24) | 0.08 (-1.06-1.21) |
| Hospital LOS | 0.12 (-1.07-1.31) | 0.77 (-0.44-1.97) | 0.12 (-0.6-0.85) | -0.87 (-3.07-1.33) | 0.16 (-1.55-1.88) |
| ICU LOS | -0.07 (-0.49-0.35) | 0.3 (-0.12-0.73) | 0.01 (-0.24-0.26) | -0.48 (-1.26-0.3) | 0.28 (-0.32-0.89) |
| Ventilator Days | 0.06 (-0.31-0.43) | 0.3 (-0.07-0.68) | 0.04 (-0.18-0.27) | -0.33 (-1.02-0.36) | 0.55 (0.01-1.08) * |
| In-Hospital Death | 1.1 (0.96-1.27) | 1.1 (0.95-1.26) | 1.01 (0.88-1.09) | 0.82 (0.51-1.17) | 1.39 (1.12-1.8) ** |
Note: 1. Values shown as OR (95% CI) for binary outcomes and β coefficient (95% CI) for continuous outcomes. 2. Significance levels: * p<0.05, ** p<0.01, *** p<0.001.
Table 4.
Multivariable Analyses of Association of Total Bilirubin Levels on Clinical Outcomes (Adjusted Models).
Table 4.
Multivariable Analyses of Association of Total Bilirubin Levels on Clinical Outcomes (Adjusted Models).
| Total Bilirubin Measurement Timing1 | |||||
|---|---|---|---|---|---|
| Clinical Outcome | Hospital Admission | ICU Admission | ICU Discharge | Hospital Discharge | Patient Death |
| ED LOS | -0.51 (-1.25, 0.23) | -0.26 (-1.02, 0.50) | -0.21 (-0.66, 0.23) | -0.30 (-1.68, 1.08) | 0.29 (-0.76, 1.33) |
| Hospital LOS | -0.02 (-1.26, 1.21) | 0.39 (-0.87, 1.66) | 0.13 (-0.61, 0.87) | -1.27 (-3.56, 1.02) | -0.21 (-1.95, 1.53) |
| ICU LOS | -0.11 (-0.51, 0.30) | 0.13 (-0.29, 0.54) | 0.03 (-0.21, 0.27) | -0.61 (-1.36, 0.14) | 0.16 (-0.41, 0.73) |
| Ventilator Days | 0.05 (-0.33, 0.43) | 0.14 (-0.24, 0.53) | 0.05 (-0.17, 0.28) | -0.36 (-1.06, 0.34) | 0.38 (-0.15, 0.91) |
| In-Hospital Death | 0.02 (0.00, 0.03) * | 0.01 (-0.01, 0.02) | 0.00 (-0.01, 0.01) | -0.01 (-0.04, 0.02) | 0.05 (0.03, 0.07) *** |
Note: 1. Values shown as OR (95% CI) for binary outcomes and β coefficient (95% CI) for continuous outcomes. 2. Models adjusted for age, gender, race, ethnicity, trauma type, initial GCS, AIS, ISS, alcohol level, drug screen results, and functional status before injury. See supplementary tables 1-5 for all results. 3. Significance levels: * p<0.05, ** p<0.01, *** p<0.001.
Table 5.
Multivariate Regression Results: Effect of Bilirubin on ED LOS.
| Total Bilirubin Measurement Timing1 | |||||
|---|---|---|---|---|---|
| Variable | Hospital Admission | Hospital Discharge | ICU Admission | ICU Discharge | Patient Death |
| Primary Predictor | |||||
| Total Bilirubin | -0.51 (-1.25, 0.23) | -0.30 (-1.68, 1.08) | -0.26 (-1.02, 0.50) | -0.21 (-0.66, 0.23) | 0.29 (-0.76, 1.33) |
| Demographics | |||||
| Age | -0.02 (-0.07, 0.03) | -0.02 (-0.07, 0.03) | -0.02 (-0.07, 0.03) | -0.02 (-0.07, 0.03) | -0.02 (-0.07, 0.03) |
| Gender (Reference = Male) | |||||
| Female | 0.16 (-2.17, 2.49) | 0.08 (-2.25, 2.41) | 0.12 (-2.21, 2.45) | 0.09 (-2.23, 2.42) | 0.11 (-2.22, 2.44) |
| Race (Reference = White) | |||||
| American Indian | -3.80 (-28.44, 20.85) | -3.43 (-28.10, 21.23) | -3.51 (-28.17, 21.15) | -3.48 (-28.14, 21.17) | -3.33 (-27.99, 21.33) |
| Asian | -0.04 (-3.11, 3.04) | -0.04 (-3.12, 3.04) | 0.00 (-3.08, 3.08) | -0.00 (-3.08, 3.07) | -0.04 (-3.11, 3.04) |
| Black | -1.90 (-5.75, 1.94) | -1.95 (-5.80, 1.90) | -1.95 (-5.80, 1.90) | -1.97 (-5.82, 1.88) | -1.98 (-5.83, 1.87) |
| Native Hawaiian or Other Pacific Islander | 78.60 (64.32, 92.88)*** | 78.62 (64.32, 92.91)*** | 78.79 (64.49, 93.08)*** | 78.70 (64.41, 92.98)*** | 78.68 (64.39, 92.97)*** |
| Other | -1.73 (-4.85, 1.40) | -1.74 (-4.87, 1.39) | -1.71 (-4.84, 1.42) | -1.71 (-4.83, 1.42) | -1.75 (-4.88, 1.38) |
| Ethnicity (Reference = Non-Hispanic Origin) | |||||
| Hispanic Origin | 1.54 (-1.21, 4.28) | 1.49 (-1.26, 4.24) | 1.49 (-1.26, 4.24) | 1.49 (-1.26, 4.23) | 1.45 (-1.29, 4.20) |
| Trauma Type (Reference = Blunt) | |||||
| Penetrating | -3.03 (-9.18, 3.12) | -2.89 (-9.04, 3.26) | -2.93 (-9.08, 3.22) | -2.88 (-9.03, 3.27) | -2.84 (-8.99, 3.31) |
| Clinical Characteristics | |||||
| AIS Score | -0.79 (-2.42, 0.84) | -0.90 (-2.53, 0.72) | -0.86 (-2.49, 0.77) | -0.89 (-2.51, 0.73) | -0.89 (-2.51, 0.74) |
| Alcohol Level | 0.00 (-0.01, 0.01) | 0.00 (-0.01, 0.01) | 0.00 (-0.01, 0.01) | 0.00 (-0.01, 0.01) | 0.00 (-0.01, 0.01) |
| Initial GCS | 0.87 (0.60, 1.13)*** | 0.86 (0.60, 1.12)*** | 0.86 (0.60, 1.12)*** | 0.86 (0.60, 1.12)*** | 0.86 (0.60, 1.13)*** |
| ISS Score | -0.09 (-0.24, 0.06) | -0.09 (-0.24, 0.06) | -0.09 (-0.24, 0.06) | -0.09 (-0.24, 0.06) | -0.09 (-0.24, 0.06) |
| Drug Screen (Reference Group = No Drugs) | |||||
| Alcohol and Other Drugs | -4.38 (-18.53, 9.77) | -4.31 (-18.47, 9.86) | -4.28 (-18.44, 9.88) | -4.32 (-18.48, 9.84) | -4.20 (-18.36, 9.96) |
| Alcohol Only | -0.95 (-3.85, 1.96) | -0.98 (-3.89, 1.94) | -0.93 (-3.84, 1.98) | -1.05 (-3.96, 1.87) | -0.90 (-3.82, 2.02) |
| Not Tested | 0.63 (-1.41, 2.66) | 0.56 (-1.49, 2.62) | 0.68 (-1.36, 2.72) | 0.61 (-1.42, 2.65) | 0.63 (-1.40, 2.67) |
| Other Drugs | 9.76 (4.45, 15.07)*** | 9.69 (4.37, 15.01)*** | 9.78 (4.46, 15.09)*** | 9.70 (4.39, 15.01)*** | 9.77 (4.46, 15.09)*** |
| Functional Status Before Injury (Reference Group = Independent) | |||||
| Not Applicable | -0.87 (-7.30, 5.55) | -0.80 (-7.23, 5.63) | -0.82 (-7.25, 5.61) | -0.80 (-7.23, 5.63) | -0.73 (-7.16, 5.70) |
| Partially Dependent | 1.49 (-3.86, 6.84) | 1.55 (-3.80, 6.91) | 1.51 (-3.84, 6.86) | 1.54 (-3.81, 6.89) | 1.56 (-3.79, 6.91) |
| Dependent | -5.58 (-17.93, 6.77) | -5.45 (-17.81, 6.91) | -5.45 (-17.80, 6.91) | -5.45 (-17.81, 6.90) | -5.45 (-17.80, 6.91) |
| 1Values shown as β coefficient (95% CI). Significance levels: *** p<0.001, ** p<0.01, * p<0.05. | |||||
Note: 1. Values shown as OR (95% CI) for binary outcomes and β coefficient (95% CI) for continuous outcomes. 2. Significance levels: * p<0.05, ** p<0.01, *** p<0.001.
Table 6.
Multivariable Regression Results: Effect of Bilirubin on Hospital LOS.
| Total Bilirubin Measurement Timing1 | |||||
|---|---|---|---|---|---|
| Variable | Hospital Admission | Hospital Discharge | ICU Admission | ICU Discharge | Patient Death |
| Primary Predictor | |||||
| Total Bilirubin | -0.02 (-1.26, 1.21) | -1.27 (-3.56, 1.02) | 0.39 (-0.87, 1.66) | 0.13 (-0.61, 0.87) | -0.21 (-1.95, 1.53) |
| Demographics | |||||
| Age | 0.05 (-0.03, 0.13) | 0.05 (-0.03, 0.13) | 0.05 (-0.03, 0.13) | 0.05 (-0.03, 0.13) | 0.05 (-0.03, 0.13) |
| Gender (Reference = Male) | |||||
| Female | -1.43 (-5.31, 2.45) | -1.48 (-5.35, 2.40) | -1.48 (-5.36, 2.40) | -1.44 (-5.32, 2.44) | -1.45 (-5.33, 2.43) |
| Race (Reference = White) | |||||
| American Indian | -14.45 (-55.55, 26.64) | -14.71 (-55.76, 26.34) | -14.22 (-55.29, 26.86) | -14.37 (-55.44, 26.71) | -14.46 (-55.54, 26.61) |
| Asian | -1.43 (-6.56, 3.70) | -1.40 (-6.53, 3.72) | -1.51 (-6.64, 3.62) | -1.46 (-6.58, 3.67) | -1.44 (-6.57, 3.69) |
| Black | -0.24 (-6.66, 6.17) | -0.19 (-6.59, 6.22) | -0.27 (-6.68, 6.15) | -0.24 (-6.65, 6.17) | -0.24 (-6.65, 6.18) |
| Native Hawaiian or Other Pacific Islander | 3.14 (-20.66, 26.95) | 2.94 (-20.85, 26.73) | 2.96 (-20.85, 26.76) | 3.13 (-20.68, 26.93) | 3.14 (-20.67, 26.94) |
| Other | 3.40 (-1.81, 8.61) | 3.33 (-1.88, 8.54) | 3.38 (-1.83, 8.59) | 3.39 (-1.82, 8.60) | 3.42 (-1.79, 8.63) |
| Ethnicity (Reference = Non-Hispanic Origin) | |||||
| Hispanic Origin | -3.27 (-7.84, 1.31) | -3.11 (-7.69, 1.47) | -3.33 (-7.90, 1.25) | -3.29 (-7.86, 1.28) | -3.27 (-7.84, 1.30) |
| Trauma Type (Reference = Blunt) | |||||
| Penetrating | 3.41 (-6.84, 13.66) | 3.31 (-6.93, 13.55) | 3.52 (-6.72, 13.77) | 3.43 (-6.81, 13.67) | 3.40 (-6.84, 13.65) |
| Clinical Characteristics | |||||
| AIS Score | 2.99 (0.28, 5.70)* | 2.97 (0.28, 5.67)* | 2.93 (0.22, 5.63)* | 2.98 (0.28, 5.68)* | 2.98 (0.28, 5.68)* |
| Alcohol Level | -0.01 (-0.02, 0.01) | -0.01 (-0.02, 0.01) | -0.01 (-0.02, 0.01) | -0.01 (-0.02, 0.01) | -0.01 (-0.02, 0.01) |
| Initial GCS | -1.52 (-1.96, -1.09)*** | -1.52 (-1.96, -1.09)*** | -1.52 (-1.96, -1.09)*** | -1.52 (-1.96, -1.09)*** | -1.53 (-1.96, -1.09)*** |
| ISS Score | 0.06 (-0.19, 0.31) | 0.06 (-0.19, 0.31) | 0.06 (-0.19, 0.31) | 0.06 (-0.19, 0.31) | 0.06 (-0.19, 0.31) |
| Drug Screen (Reference Group = No Drugs) | |||||
| Alcohol and Other Drugs | -4.12 (-27.71, 19.47) | -4.35 (-27.93, 19.22) | -4.08 (-27.66, 19.51) | -4.07 (-27.66, 19.52) | -4.15 (-27.74, 19.44) |
| Alcohol Only | 2.33 (-2.50, 7.17) | 2.21 (-2.63, 7.05) | 2.31 (-2.52, 7.15) | 2.40 (-2.45, 7.24) | 2.30 (-2.54, 7.15) |
| Not Tested | -1.82 (-5.22, 1.57) | -2.10 (-5.52, 1.33) | -1.91 (-5.31, 1.50) | -1.81 (-5.21, 1.58) | -1.82 (-5.22, 1.57) |
| Other Drugs | -1.97 (- -10.82, 6.88) | -2.21 (-11.06, 6.64) | -2.02 (- -10.87, 6.83) | -1.94 (- -10.79, 6.91) | -1.99 (- -10.84, 6.86) |
| Functional Status Before Injury (Reference Group = Independent) | |||||
| Not Applicable | -17.88 (-28.59, -7.16)** | -18.00 (-28.70, -7.29)** | -17.79 (-28.50, -7.08)** | -17.85 (-28.56, -7.14)** | -17.90 (-28.61, -7.19)** |
| Partially Dependent | 0.29 (-8.63, 9.20) | 0.17 (-8.73, 9.08) | 0.40 (-8.52, 9.32) | 0.32 (-8.60, 9.23) | 0.30 (-8.61, 9.22) |
| Dependent | -9.73 (-30.32, 10.86) | -9.93 (-30.50, 10.64) | -9.65 (-30.22, 10.93) | -9.69 (-30.27, 10.90) | -9.68 (-30.27, 10.90) |
| 1Values shown as β coefficient (95% CI). Significance levels: *** p<0.001, ** p<0.01, * p<0.05. | |||||
Note: 1. Values shown as OR (95% CI) for binary outcomes and β coefficient (95% CI) for continuous outcomes. 2. Significance levels: * p<0.05, ** p<0.01, *** p<0.001.
Table 7.
Multivariable Regression Results: Effect of Bilirubin on ICU LOS.
| Total Bilirubin Measurement Timing1 | |||||
|---|---|---|---|---|---|
| Variable | Hospital Admission | Hospital Discharge | ICU Admission | ICU Discharge | Patient Death |
| Primary Predictor | |||||
| Total Bilirubin | -0.11 (-0.51, 0.30) | -0.61 (-1.36, 0.14) | 0.13 (-0.29, 0.54) | 0.03 (-0.21, 0.27) | 0.16 (-0.41, 0.73) |
| Demographics | |||||
| Age | 0.00 (-0.03, 0.03) | 0.00 (-0.02, 0.03) | 0.00 (-0.03, 0.03) | 0.00 (-0.03, 0.03) | 0.00 (-0.03, 0.03) |
| Gender (Reference = Male) | |||||
| Female | -0.78 (-2.05, 0.50) | -0.81 (-2.08, 0.46) | -0.81 (-2.08, 0.47) | -0.79 (-2.06, 0.48) | -0.78 (-2.05, 0.49) |
| Race (Reference = White) | |||||
| American Indian | -6.50 (-19.98, 6.99) | -6.54 (-20.00, 6.93) | -6.34 (-19.82, 7.15) | -6.39 (-19.88, 7.09) | -6.38 (-19.87, 7.10) |
| Asian | -0.93 (-2.62, 0.75) | -0.92 (-2.61, 0.76) | -0.96 (-2.65, 0.72) | -0.94 (-2.63, 0.74) | -0.93 (-2.61, 0.75) |
| Black | -0.02 (-2.13, 2.08) | -0.01 (-2.11, 2.09) | -0.04 (-2.15, 2.06) | -0.03 (-2.14, 2.07) | -0.04 (-2.15, 2.06) |
| Native Hawaiian or Other Pacific Islander | 0.32 (-7.49, 8.14) | 0.24 (-7.56, 8.04) | 0.28 (-7.54, 8.09) | 0.33 (-7.48, 8.15) | 0.35 (-7.47, 8.16) |
| Other | -0.48 (-2.19, 1.23) | -0.52 (-2.22, 1.19) | -0.49 (-2.20, 1.22) | -0.48 (-2.19, 1.23) | -0.49 (-2.21, 1.22) |
| Ethnicity (Reference = Non-Hispanic Origin) | |||||
| Hispanic Origin | 0.40 (-1.10, 1.90) | 0.46 (-1.04, 1.96) | 0.36 (-1.14, 1.86) | 0.38 (-1.12, 1.88) | 0.38 (-1.12, 1.88) |
| Trauma Type (Reference = Blunt) | |||||
| Penetrating | 3.72 (0.35, 7.08)* | 3.70 (0.34, 7.06)* | 3.79 (0.42, 7.15)* | 3.75 (0.39, 7.12)* | 3.76 (0.40, 7.13)* |
| Clinical Characteristics | |||||
| AIS Score | 0.95 (0.06, 1.84)* | 0.92 (0.04, 1.81)* | 0.91 (0.02, 1.79)* | 0.93 (0.04, 1.81)* | 0.93 (0.04, 1.82)* |
| Alcohol Level | -0.00 (-0.01, -0.00)* | -0.00 (-0.01, -0.00)* | -0.00 (-0.01, -0.00)* | -0.00 (-0.01, -0.00)* | -0.00 (-0.01, -0.00)* |
| Initial GCS | -0.57 (-0.71, -0.43)*** | -0.57 (-0.71, -0.43)*** | -0.57 (-0.72, -0.43)*** | -0.57 (-0.72, -0.43)*** | -0.57 (-0.71, -0.43)*** |
| ISS Score | 0.09 (0.01, 0.17)* | 0.09 (0.01, 0.17)* | 0.09 (0.01, 0.17)* | 0.09 (0.01, 0.17)* | 0.09 (0.01, 0.17)* |
| Drug Screen (Reference Group = No Drugs) | |||||
| Alcohol and Other Drugs | -3.54 (-11.29, 4.20) | -3.63 (-11.36, 4.10) | -3.50 (-11.25, 4.24) | -3.51 (-11.25, 4.24) | -3.49 (-11.23, 4.26) |
| Alcohol Only | 0.99 (-0.59, 2.58) | 0.93 (-0.65, 2.52) | 0.99 (-0.60, 2.57) | 1.01 (-0.59, 2.60) | 1.02 (-0.57, 2.61) |
| Not Tested | -0.30 (-1.41, 0.81) | -0.43 (-1.55, 0.69) | -0.32 (-1.44, 0.79) | -0.30 (-1.41, 0.82) | -0.30 (-1.41, 0.82) |
| Other Drugs | -1.40 (-4.31, 1.50) | -1.52 (-4.42, 1.38) | -1.42 (-4.32, 1.49) | -1.40 (-4.30, 1.51) | -1.39 (-4.29, 1.52) |
| Functional Status Before Injury (Reference Group = Independent) | |||||
| Not Applicable | -5.42 (-8.93, -1.90)** | -5.45 (-8.97, -1.94)** | -5.37 (-8.88, -1.85)** | -5.39 (-8.91, -1.87)** | -5.37 (-8.89, -1.86)** |
| Partially Dependent | -1.28 (-4.21, 1.64) | -1.32 (-4.24, 1.60) | -1.23 (-4.15, 1.70) | -1.26 (-4.18, 1.67) | -1.27 (-4.20, 1.65) |
| Dependent | -2.12 (-8.88, 4.64) | -2.18 (-8.93, 4.57) | -2.06 (-8.81, 4.70) | -2.07 (-8.83, 4.68) | -2.11 (-8.87, 4.65) |
| 1Values shown as β coefficient (95% CI). Significance levels: *** p<0.001, ** p<0.01, * p<0.05. | |||||
Note: 1. Values shown as OR (95% CI) for binary outcomes and β coefficient (95% CI) for continuous outcomes. 2. Significance levels: * p<0.05, ** p<0.01, *** p<0.001.
Table 8.
Multivariable Regression Results: Effect of Bilirubin on Ventilator Days.
| Total Bilirubin Measurement Timing1 | |||||
|---|---|---|---|---|---|
| Variable | Hospital Admission | Hospital Discharge | ICU Admission | ICU Discharge | Patient Death |
| Primary Predictor | |||||
| Total Bilirubin | 0.05 (-0.33, 0.43) | -0.36 (-1.06, 0.34) | 0.14 (-0.24, 0.53) | 0.05 (-0.17, 0.28) | 0.38 (-0.15, 0.91) |
| Demographics | |||||
| Age | 0.01 (-0.01, 0.04) | 0.01 (-0.01, 0.04) | 0.01 (-0.01, 0.04) | 0.01 (-0.01, 0.04) | 0.01 (-0.01, 0.04) |
| Gender (Reference = Male) | |||||
| Female | -1.01 (-2.19, 0.18) | -1.01 (-2.20, 0.17) | -1.02 (-2.20, 0.17) | -1.00 (-2.19, 0.18) | -0.97 (-2.16, 0.21) |
| Race (Reference = White) | |||||
| American Indian | -8.18 (-20.72, 4.36) | -8.30 (-20.83, 4.22) | -8.15 (-20.68, 4.39) | -8.20 (-20.74, 4.34) | -8.17 (-20.69, 4.35) |
| Asian | -0.89 (-2.46, 0.67) | -0.88 (-2.45, 0.68) | -0.92 (-2.48, 0.65) | -0.90 (-2.47, 0.66) | -0.87 (-2.44, 0.69) |
| Black | -1.51 (-3.47, 0.45) | -1.49 (-3.44, 0.47) | -1.51 (-3.47, 0.45) | -1.50 (-3.46, 0.46) | -1.52 (-3.47, 0.44) |
| Native Hawaiian or Other Pacific Islander | -1.12 (-8.39, 6.14) | -1.19 (-8.45, 6.07) | -1.20 (-8.46, 6.07) | -1.14 (-8.40, 6.13) | -1.11 (-8.36, 6.15) |
| Other | -0.09 (-1.68, 1.50) | -0.11 (-1.70, 1.48) | -0.09 (-1.68, 1.50) | -0.09 (-1.68, 1.50) | -0.12 (-1.71, 1.47) |
| Ethnicity (Reference = Non-Hispanic Origin) | |||||
| Hispanic Origin | -0.33 (-1.72, 1.07) | -0.27 (-1.67, 1.12) | -0.34 (-1.74, 1.06) | -0.33 (-1.72, 1.07) | -0.32 (-1.71, 1.07) |
| Trauma Type (Reference = Blunt) | |||||
| Penetrating | 0.98 (-2.15, 4.11) | 0.94 (-2.19, 4.06) | 1.00 (-2.12, 4.13) | 0.97 (-2.16, 4.10) | 0.99 (-2.13, 4.11) |
| Clinical Characteristics | |||||
| AIS Score | 0.90 (0.07, 1.73)* | 0.91 (0.09, 1.73)* | 0.89 (0.06, 1.72)* | 0.91 (0.09, 1.73)* | 0.92 (0.10, 1.75)* |
| Alcohol Level | -0.00 (-0.01, 0.00) | -0.00 (-0.01, 0.00) | -0.00 (-0.01, 0.00) | -0.00 (-0.01, 0.00) | -0.00 (-0.01, 0.00) |
| Initial GCS | -0.67 (-0.80, -0.54)*** | -0.67 (-0.80, -0.53)*** | -0.67 (-0.80, -0.53)*** | -0.67 (-0.80, -0.54)*** | -0.66 (-0.80, -0.53)*** |
| ISS Score | 0.01 (-0.06, 0.09) | 0.01 (-0.06, 0.09) | 0.01 (-0.06, 0.09) | 0.01 (-0.06, 0.09) | 0.01 (-0.06, 0.09) |
| Drug Screen (Reference Group = No Drugs) | |||||
| Alcohol and Other Drugs | -1.81 (-9.01, 5.39) | -1.89 (-9.09, 5.30) | -1.81 (-9.01, 5.39) | -1.81 (-9.01, 5.39) | -1.76 (-8.95, 5.43) |
| Alcohol Only | 0.58 (-0.89, 2.06) | 0.55 (-0.93, 2.02) | 0.57 (-0.90, 2.05) | 0.61 (-0.87, 2.08) | 0.64 (-0.84, 2.12) |
| Not Tested | 0.56 (-0.48, 1.59) | 0.48 (-0.57, 1.52) | 0.53 (-0.51, 1.56) | 0.56 (-0.47, 1.60) | 0.56 (-0.47, 1.59) |
| Other Drugs | 0.08 (-2.62, 2.78) | 0.01 (- -2.69, 2.72) | 0.06 (-2.64, 2.76) | 0.09 (-2.61, 2.79) | 0.12 (-2.58, 2.82) |
| Functional Status Before Injury (Reference Group = Independent) | |||||
| Not Applicable | -3.99 (-7.26, -0.72)* | -4.03 (-7.30, -0.77)* | -3.97 (-7.23, -0.70)* | -3.99 (-7.26, -0.72)* | -3.95 (-7.21, -0.68)* |
| Partially Dependent | -2.11 (-4.83, 0.61) | -2.15 (-4.87, 0.57) | -2.08 (-4.80, 0.65) | -2.10 (-4.82, 0.62) | -2.14 (-4.86, 0.57) |
| Dependent | -3.18 (-9.46, 3.11) | -3.25 (-9.53, 3.02) | -3.17 (-9.45, 3.11) | -3.18 (-9.46, 3.10) | -3.26 (-9.53, 3.01) |
| 1Values shown as β coefficient (95% CI). Significance levels: *** p<0.001, ** p<0.01, * p<0.05. | |||||
Note: 1. Values shown as OR (95% CI) for binary outcomes and β coefficient (95% CI) for continuous outcomes. 2. Significance levels: * p<0.05, ** p<0.01, *** p<0.001.
Table 9.
Multivariable Regression Results: Effect of Bilirubin on In-Hospital Death.
| Total Bilirubin Measurement Timing1 | |||||
|---|---|---|---|---|---|
| Variable | Hospital Admission | Hospital Discharge | ICU Admission | ICU Discharge | Patient Death |
| Primary Predictor | |||||
| Total Bilirubin | 0.02 (0.00, 0.03)* | -0.01 (-0.04, 0.02) | 0.01 (-0.01, 0.02) | 0.00 (-0.01, 0.01) | 0.05 (0.03, 0.07)*** |
| Demographics | |||||
| Age | 0.00 (0.00, 0.00)*** | 0.00 (0.00, 0.00)*** | 0.00 (0.00, 0.00)*** | 0.00 (0.00, 0.00)*** | 0.00 (0.00, 0.00)*** |
| Gender (Reference = Male) | |||||
| Female | -0.05 (-0.10, 0.00) | -0.05 (-0.10, 0.00) | -0.05 (-0.10, 0.00) | -0.05 (-0.10, 0.01) | -0.04 (-0.09, 0.01) |
| Race (Reference = White) | |||||
| American Indian | -0.26 (-0.79, 0.27) | -0.28 (-0.81, 0.26) | -0.27 (-0.80, 0.26) | -0.27 (-0.80, 0.26) | -0.27 (-0.79, 0.26) |
| Asian | -0.01 (-0.08, 0.06) | -0.01 (-0.08, 0.06) | -0.01 (-0.08, 0.06) | -0.01 (-0.08, 0.06) | -0.01 (-0.07, 0.06) |
| Black | -0.09 (-0.17, -0.01)* | -0.09 (-0.17, -0.01)* | -0.09 (-0.17, -0.01)* | -0.09 (-0.17, -0.01)* | -0.09 (-0.17, -0.01)* |
| Native Hawaiian or Other Pacific Islander | -0.08 (-0.39, 0.23) | -0.08 (-0.39, 0.23) | -0.08 (-0.39, 0.22) | -0.08 (-0.39, 0.23) | -0.08 (-0.38, 0.23) |
| Other | 0.01 (-0.06, 0.07) | 0.01 (-0.06, 0.07) | 0.01 (-0.06, 0.07) | 0.01 (-0.06, 0.07) | 0.00 (-0.07, 0.07) |
| Ethnicity (Reference = Non-Hispanic Origin) | |||||
| Hispanic Origin | -0.02 (-0.08, 0.04) | -0.01 (-0.07, 0.04) | -0.02 (-0.08, 0.04) | -0.02 (-0.08, 0.04) | -0.02 (-0.07, 0.04) |
| Trauma Type (Reference = Blunt) | |||||
| Penetrating | 0.11 (-0.02, 0.24) | 0.10 (-0.03, 0.24) | 0.11 (-0.03, 0.24) | 0.11 (-0.03, 0.24) | 0.11 (-0.02, 0.24) |
| Clinical Characteristics | |||||
| AIS Score | 0.02 (-0.01, 0.06) | 0.02 (-0.01, 0.06) | 0.02 (-0.01, 0.06) | 0.02 (-0.01, 0.06) | 0.03 (-0.01, 0.06) |
| Alcohol Level | -0.00 (-0.00, 0.00) | -0.00 (-0.00, 0.00) | -0.00 (-0.00, 0.00) | -0.00 (-0.00, 0.00) | -0.00 (-0.00, 0.00) |
| Initial GCS | -0.03 (-0.03, -0.02)*** | -0.03 (-0.03, -0.02)*** | -0.03 (-0.03, -0.02)*** | -0.03 (-0.03, -0.02)*** | -0.03 (-0.03, -0.02)*** |
| ISS Score | 0.01 (0.00, 0.01)*** | 0.01 (0.00, 0.01)*** | 0.01 (0.00, 0.01)*** | 0.01 (0.00, 0.01)*** | 0.01 (0.00, 0.01)*** |
| Drug Screen (Reference Group = No Drugs) | |||||
| Alcohol and Other Drugs | -0.03 (-0.33, 0.28) | -0.03 (-0.34, 0.27) | -0.03 (-0.34, 0.28) | -0.03 (-0.34, 0.28) | -0.02 (-0.32, 0.28) |
| Alcohol Only | -0.04 (-0.11, 0.02) | -0.05 (-0.11, 0.02) | -0.04 (-0.11, 0.02) | -0.04 (-0.11, 0.02) | -0.04 (-0.10, 0.03) |
| Not Tested | 0.00 (-0.04, 0.04) | -0.00 (-0.05, 0.04) | -0.00 (-0.05, 0.04) | 0.00 (-0.04, 0.04) | 0.00 (-0.04, 0.04) |
| Other Drugs | 0.05 (-0.07, 0.16) | 0.05 (-0.07, 0.16) | 0.05 (-0.07, 0.16) | 0.05 (-0.07, 0.16) | 0.05 (-0.06, 0.17) |
| Functional Status Before Injury (Reference Group = Independent) | |||||
| Not Applicable | 0.54 (0.41, 0.68)*** | 0.54 (0.40, 0.68)*** | 0.54 (0.40, 0.68)*** | 0.54 (0.40, 0.68)*** | 0.55 (0.41, 0.68)*** |
| Partially Dependent | -0.06 (-0.17, 0.06) | -0.06 (-0.18, 0.06) | -0.06 (-0.17, 0.06) | -0.06 (-0.17, 0.06) | -0.06 (-0.18, 0.05) |
| Dependent | 0.04 (-0.23, 0.30) | 0.03 (-0.24, 0.30) | 0.03 (-0.23, 0.30) | 0.03 (-0.23, 0.30) | 0.02 (-0.24, 0.29) |
| 1Values shown as OR (95% CI). Significance levels: *** p<0.001, ** p<0.01, * p<0.05. | |||||
Note: 1. Values shown as OR (95% CI) for binary outcomes and β coefficient (95% CI) for continuous outcomes. 2. Significance levels: * p<0.05, ** p<0.01, *** p<0.001.
Disclaimer/Publisher’s Note: The statements, opinions and data contained in all publications are solely those of the individual author(s) and contributor(s) and not of MDPI and/or the editor(s). MDPI and/or the editor(s) disclaim responsibility for any injury to people or property resulting from any ideas, methods, instructions or products referred to in the content. |
© 2025 by the authors. Licensee MDPI, Basel, Switzerland. This article is an open access article distributed under the terms and conditions of the Creative Commons Attribution (CC BY) license (http://creativecommons.org/licenses/by/4.0/).
Copyright: This open access article is published under a Creative Commons CC BY 4.0 license, which permit the free download, distribution, and reuse, provided that the author and preprint are cited in any reuse.


