
Submitted:
11 August 2025
Posted:
13 August 2025
You are already at the latest version
Abstract
Background/Objectives: Conventional imaging assesses therapy response in stage IV solid-tumor patients in 8–12-week intervals, delaying detection of non-responders. We evaluated a real-time quantitative PCR (RT-qPCR) assay that interrogates size-distributed cell-free DNA (cfDNA) fragments to provide earlier insights into treatment efficacy. Methods: In this prospective study, 128 patients with metastatic lung, breast, or colorectal cancer provided plasma 12–21 days after the first dose of a new systemic regimen. RTqPCR targets multicopy retrotransposon elements in cfDNA fragments >80 bp, >105 bp, >265 bp, and internal control. A model integrates these quantities into a Progression Score (PS) ranging from 0–100; higher values indicate probable disease progression. Results: The PS model yielded an area under (AUC) the receiver-operating-characteristic (ROC) curve of 0.93 for predicting radiographic progression at first imaging. Scores were strongly bimodal: 92 % of patients with PS > 90 progressed, whereas 95 % with PS < 10 did not. Intermediate scores (10–90) comprised a mixed cohort. Assay performance was unaffected by tumor genomic profile. Conclusions: This cfDNA-based Progression Score (PS) assay enables tumor- and therapy-agnostic, non-invasive monitoring of treatment response as early as two weeks after initiation. By flagging ineffective regimens well before standard imaging, the test can accelerate clinical decision-making, reduce exposure to fu-tile therapy, and potentially improve outcomes in stage IV cancer. Early treatment plan changes may also avoid the high drug and administration costs of ineffective treatments, prevent downstream toxicity-related hospitalizations, and free up limited imaging and infusion-suite capacity—yielding savings for patients, payers, and healthcare systems.
Keywords:
tumor response
; cfDNA
; therapy monitoring
; fragmentomics
; retrotransposons
; metastatic cancer
; liquid biopsy
1. Introduction
Cell-free DNA (cfDNA) has been widely studied as a cancer biomarker and has been proposed for oncologic applications, including early detection, recurrence monitoring, prognosis, and therapy monitoring [1,2,3,4]. Unfortunately, until recently, unlike circulating-tumor DNA (ctDNA), cfDNA has lacked the clinical specificity required for practice [5,6,7,8,9]. With the advent of fragmentomics as a cancer biomarker, there has been renewed interest in cfDNA combined with fragmentomics as a cancer biomarker [10,11,12,13,14,15]. Here, a cfDNA fragmentomics assay is proposed, hereafter referred to as the Progression Score (PS) assay, with the analytic sensitivity and clinical specificity necessary to provide clinicians, in real time, the ability to identify stage IV cancer patients who are experiencing disease progression.
Disease progression is a commonly used endpoint for determining the efficacy of therapeutic agents. Response evaluation criteria in solid tumors (RECIST 1.1) are a widely used criterion for assessing the status of a patient’s disease for clinical studies [16,17]. In clinical practice, while most physicians do not strictly follow RECIST criteria for determining whether to adjust a patient’s treatment plan, almost all periodically image their patients to assess whether the patient’s disease remains under control. It is generally recognized that imaging for assessing therapy efficacy has weaknesses.[18]. For example, some patients with so-called stable disease frequently have progressive disease, or patients start to develop progressive disease long before imaging can detect tumor growth [19,20]. With the rapid expansion of immunotherapy, clinicians are increasingly acknowledging that standard imaging often fails to distinguish between true progression and treatment-related changes in the early phases of care. Notably, pseudo-progression may mimic tumor enlargement on radiographic studies even when the underlying disease is improving [21]. This is particularly problematic for immunotherapy clinical studies that use disease progression as an endpoint. “Mixed responses” on imaging – where cancer seems to be growing in one area but perhaps stable in another – is another challenging clinical area, as is residual positivity on PET scan. In clinical practice, physicians are left with difficult treatment decisions when an image shows a patient as progressing. Clinical decision making can be made more difficult if the patient experiences hyper-progression from immunotherapy.
Cancer biomarkers such as CEA, PSA, CA19-9, and CA-125 are often used to monitor patients, but their lack of sufficient clinical specificity makes them inadequate for use in clinical decision-making [22,23]. Up to one third of patients do not express these tumor markers.
A blood-based assay that quantifies tumor-derived circulating cell-free DNA and demonstrates high clinical specificity for the early detection of disease progression would satisfy a critical unmet need in oncologic care. Earlier insight would enable timely chang-es to the treatment plan, lessen toxicity from ineffective drugs, lower the cost of futile care, and make better use of therapeutic, hospital, and administrative resources.
2. Materials and Methods
Following two previously successful proof of concept studies [24,25,26] demonstrating the potential for a cfDNA fragmentomics assay to identify in real-time stage IV cancer patients whose disease has progressed, we prospectively enrolled participants into an observational study to develop a practical assay that could be used by physicians in clinical practice to monitor the tumor response of the patient’s under their care.
2.1. Study Design
An observational study was designed to prospectively collect blood samples from cancer patients at two time points during treatment. Patients could be enrolled at any point in a patient’s treatment regardless of the patient’s treatment plan. Two blood draws were collected. The first draw was taken within two days prior to the infusion of the first cycle of treatment delivered following the baseline scan. The second blood draw was taken 12 to 21 days following the first treatment and prior to the next infusion of therapy.
Patients were only enrolled if a CT scan was planned between 9- and 12-weeks following the first blood draw. Participants were enrolled regardless of which drugs were delivered, regardless of the line of therapy, and regardless of where they were even starting a new line of therapy. The enrollment period for each patient was from baseline scan to assessment scan, which was required to be performed between 9 to 12 weeks apart. Board-certified radiologists measured lesions from each scan. Oral medications were taken according to the regular schedule. The flow diagram of the CADEX-0001 study is pro-vided in Figure 1.
2.2. Participants
We enrolled 146 stage IV breast, colorectal, and lung cancer patients at 11 sites. For most sites, the study was approved by the Institutional Review Board (IRB) for human subjects at WCG Clinical. For all remaining sites, the study was approved by the respective IRBs of the institution. All study participants provided signed consent for the collection and cfDNA analysis of their blood.
Patients were excluded from the study if they had a secondary malignancy, were being actively treated for autoimmune disease, or had DVT, PE, or sepsis within the past 12 days. Participants were withdrawn from the study if these conditions developed within 12 days of the second blood draw. Of the 146 patients enrolled in the study, 128 were included in the analysis; for a variety of reasons, 18 were not included in analysis – see Table A1 in the supplementary section provides a summary of patients enrolled in the cancer cohort.
2.3. Sample Collection and Transportation
One to three tubes of 8-10 ml of peripheral blood samples in each tube were collected in a StreckTM tube. The specimens were transported at ambient temperature via overnight courier service to Cadex Genomics’ lab in New Orleans. Since the delay in the processing of blood samples affects the concentrations of cell-free DNA [27]. Any participant whose first or second blood draw sample was received at the laboratory more than 120 hours after the blood sample was collected was excluded from the study.
2.4. Plasma Separation
A two-step centrifugation protocol was used to separate plasma. First, the Cell-Free DNA BCT (Streck) tubes were centrifuged at 1,600 × g for 10 min at 15°C. Then, the plasma was centrifuged again in a 1.5 mL tube at 16,000 × g for 10 min at room temperature. The plasma aliquots were transferred to 2 mL cryogenic tubes and stored at -800C
2.5. Cell-free DNA Extraction
cfDNA was extracted from 500 µL of plasma using the QIAamp Circulating Nucleic Acid Kit (Qiagen, Germantown, MD) following the kit protocol for a plasma volume of 1 mL with the following modifications: (1) omission of carrier RNA from the ACL buffer, (2) addition of 500 µL of 1 X PBS buffer (Molecular Biologicals International, Inc. / Growcells.com, Irvine, CA) to the 500 µL of plasma to increase the sample volume to 1 mL, and (3) extend the proteinase K digestion time from 30 minutes to a 1-hour incubation. Subsequently, cfDNA was eluted in 60 µL of the kit elution buffer. Each plasma sample was extracted in duplicate. Baseline and after-treatment samples from the same patient were extracted together to avoid batch effects.
2.6. Analytical Methods
Two human-specific retrotransposons, Alu Yb8 and SVA[28,29,30,31], were selected as amplification targets to quantify different fragment sizes of cell-free DNA in patient plasma. qPCR primers and probes for each target were designed using the PrimerQuest™ Tool from Integrated DNA Technologies (Coralville, IA). Short (Alu Yb8 = 80 bp, Alu Yb8 = 105 bp) and long (SVA = 265 bp) primers were multiplexed to create two primer mixes: an 80-265 primer mix and a 105-265 primer mix. The SVA primers and probes present in the multiplex serve as both a quality control measure and an enhancement for Alu marker amplification by blocking non-specific amplification.
To detect inhibitors in the sample, a 172-bp synthetic nucleotide sequence was used as an internal positive control (IPC) and added to each primer mix. The hybridization probe for the short target was labeled with FAM, the long target with Cy5, and the IPC with HEX. All HPLC purified primers and probes were purchased from Integrated DNA Technologies (Coralville, IA). The primer mixes contain primers and probes for each target (short, long, and IPC) along with PCR enhancer additives. Standard curve assays were conducted on the ABI 7500 or the QuantStudio™ 5 Real-Time qPCR system (Applied Biosystems, ThermoFisher Scientific, Waltham, MA).
Standard DNA was extracted from a single donor's blood using organic extraction (Proteinase K/SDS digestion, phenol/chloroform extraction, ethanol precipitation, and dissolution in Tris-EDTA buffer - 10 mM Tris, 0.1 mM EDTA, pH 8.0) and calibrated against NIST Human DNA Quantitation Standards SRM 2372 Components B (National Institute of Standards and Technology, Gaithersburg, MD). Two microliters (2 μL) of standard DNA or unknown extracted cfDNA were amplified in triplicate in a 20 μL reaction volume, which included 7.7 μL of primer mix, 0.3 μL of the ROX reference standard (diluted to 6 μM), and 10 μL of Brilliant Multiplex QPCR Master Mix (Agilent Technologies). The PCR conditions consisted of one enzyme activation cycle for 10 minutes at 95°C, followed by 40 cycles of a 2-step qPCR (15 seconds at 96°C and 2 minutes at 64°C combined annealing/extension time). DNA samples were quantified using both the 80-265-IPC primer mix and the 105-265-IPC primer mix. qPCR data analysis was performed using the automatic baseline feature of the QuantStudio-5 Design and Analysis Software v1.5.1 (Applied Biosystems, ThermoFisher Scientific, Waltham, MA).
The results of the analytical evaluation of the qPCR multiplex 80-265-IPC are presented in the supplementary section (Table A2).
2.6. Statistical Analyses
The following were measured in each blood sample.
- SM1 - Concentration level for >80bp cfDNA levels, first blood draw
- MM1 - Concentration level for >105bp cfDNA levels, first blood draw
- SM2 - Concentration level for >80bp cfDNA levels, second blood draw
- MM2 - Concentration level for >105bp cfDNA levels, second blood draw
These four derived variables were used in logistic regression models to find the best predictor of progression.
- Frag1 = SM1 - MM1 (Frag1 floor = 0.0)
- Frag2 = SM2 - MM2 (Frag2 floor = 0.0)
- FragDiff = Frag2 - Frag1
- MMDiff = MM2 - MM1
Models were fit using R version 4.4. The area under the curve [AUC] was calculated for each model, and the model with the highest AUC was selected as the preferred model. The selected model was then analyzed using the bootstrap method[32] to determine the cut-point for making a progression call.
3.1. Model Selection
Using data analyzed from blood samples collected from the cancer patient cohort, a statistical model was developed to predict which patients would exhibit disease progression, as confirmed by CT scans, at 8 to 12 weeks. The radiology reports from each patient were analyzed to identify whether a patient’s disease had progressed during the 8- to 10-week period between scans. A patient’s disease was determined to have progressed if and only if the sum of the diameters of the tumor lesions had increased by 20% or more. Several potential logit regression models were pre-identified based on biological hypotheses. These models were statistically tested with the best result from the model with FragDiff + MMDiff as the predictors with the ROC AUC = 0.93, p-value < 0.001, being selected (Figure 2). The Bonferroni multiple testing adjustment was used to control the error rate.
Following the example of the 21-gene recurrence score assay[33]a progression score was generated with a range of 0 to 100.
3.2. Progression Score Cut-Point Selection
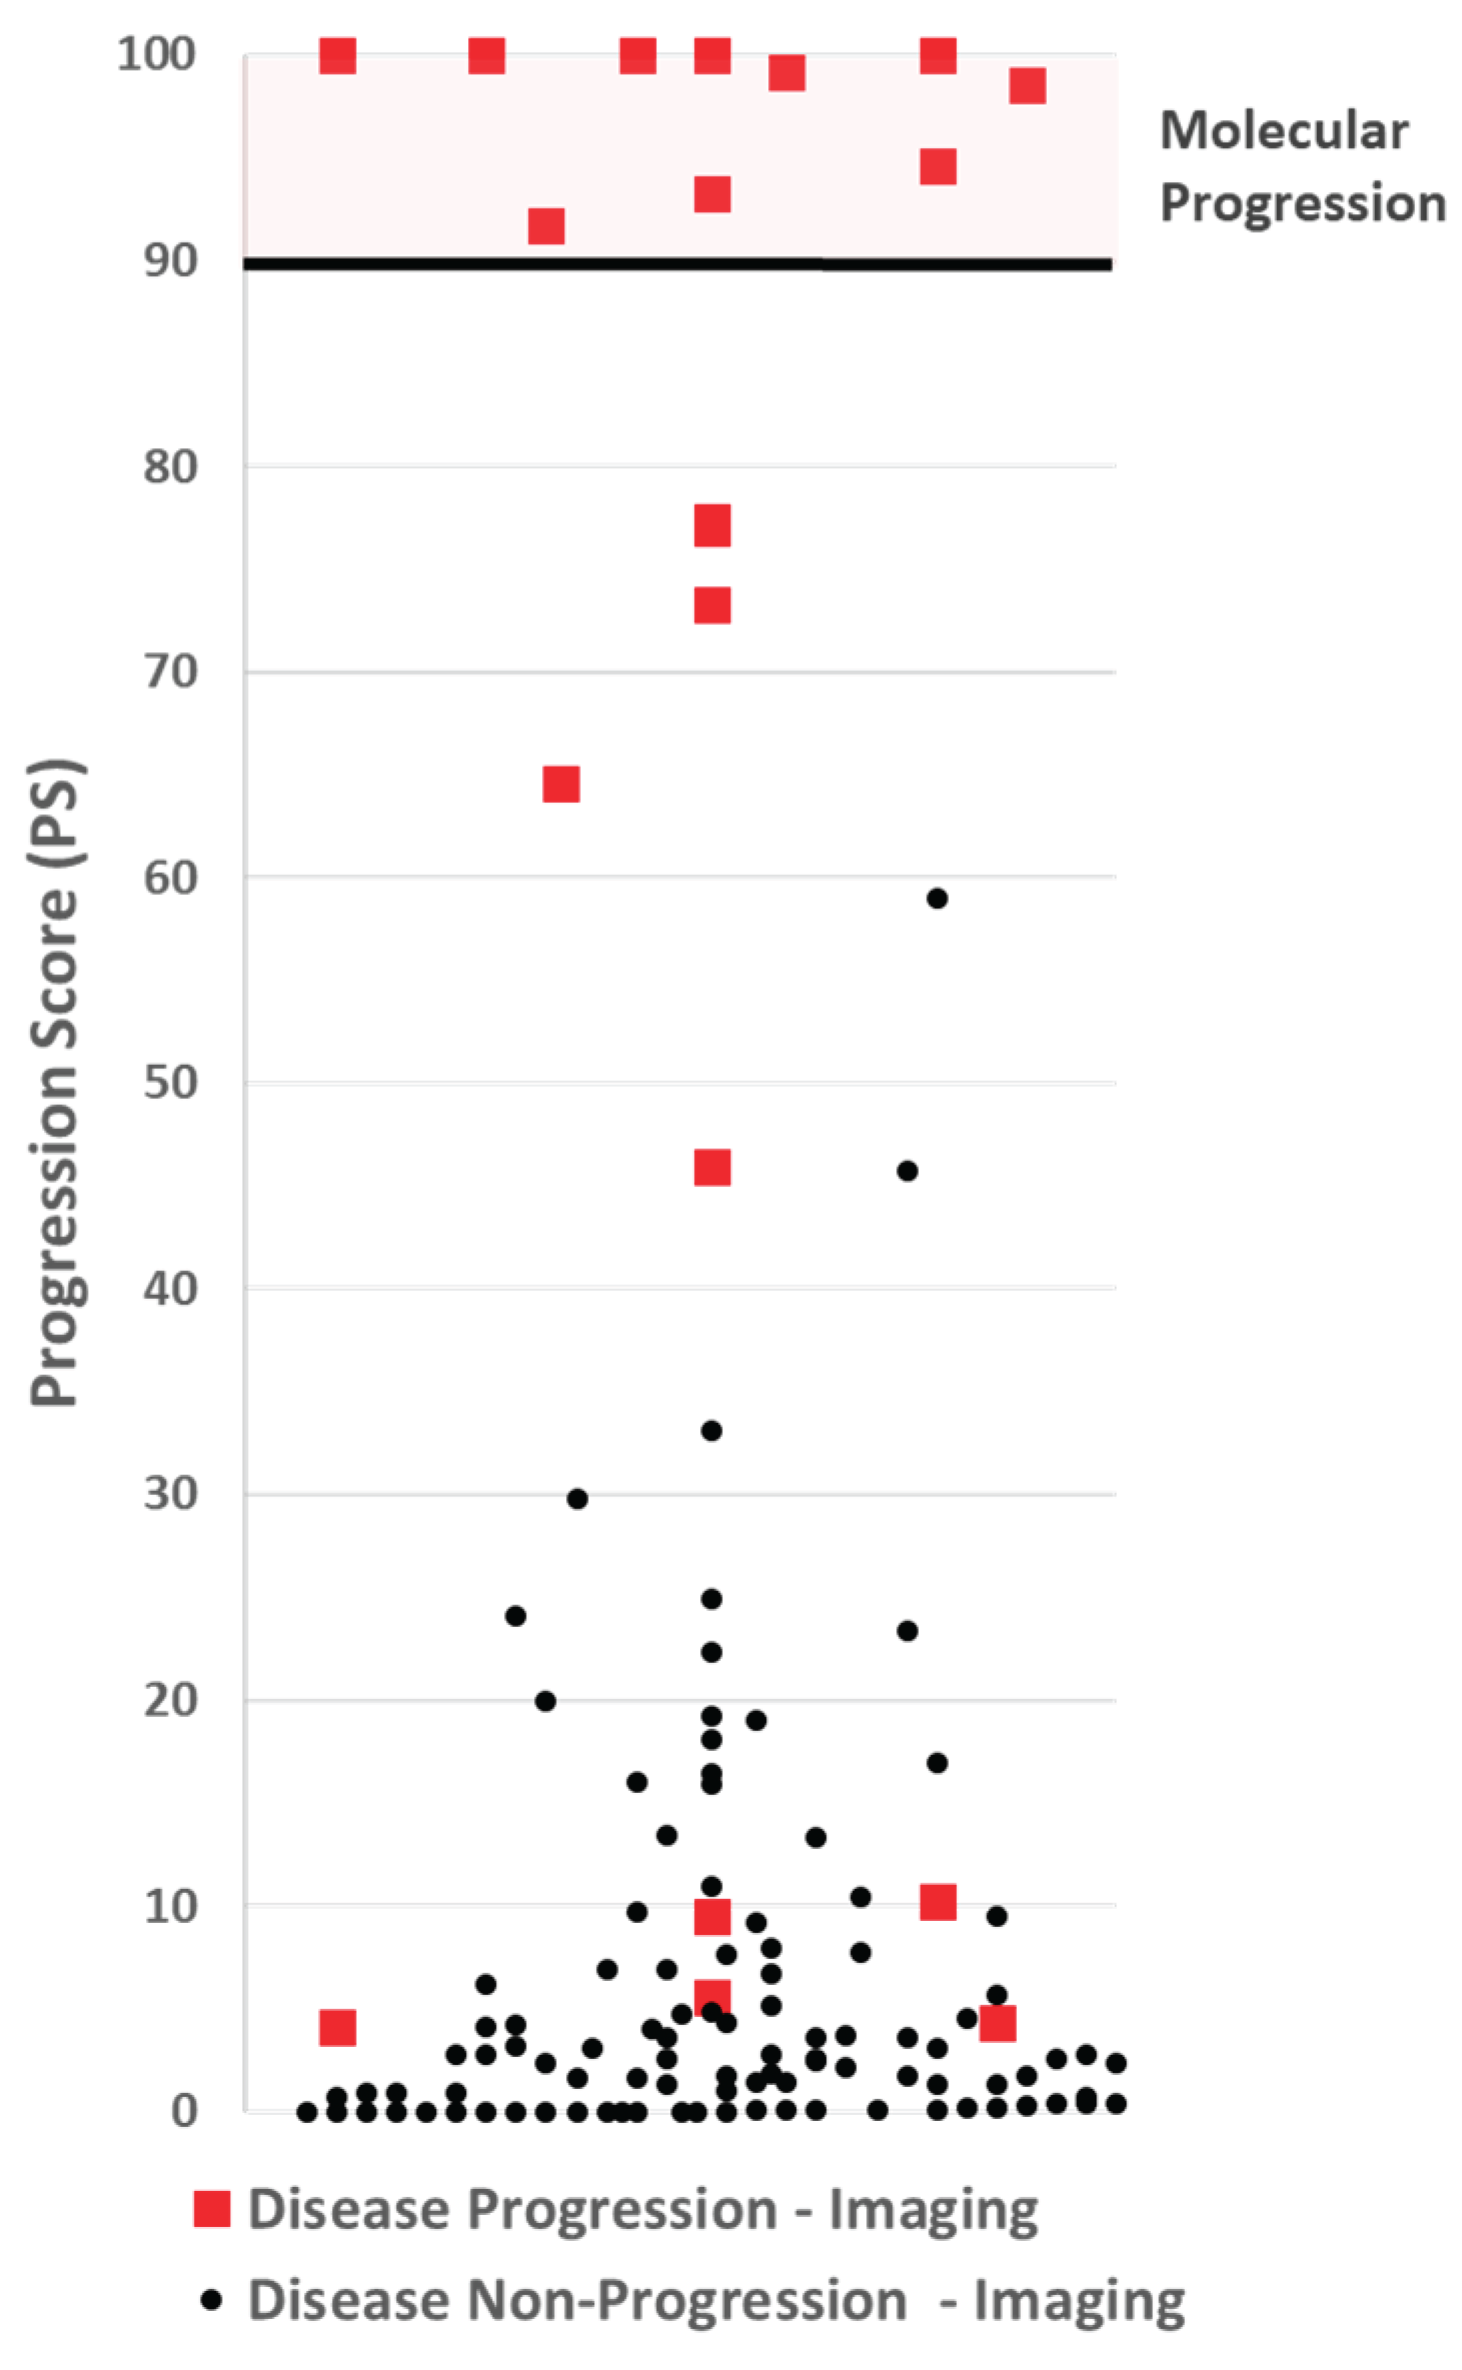
The model with the highest ROC value was analyzed to determine the appropriate cut-point for making a disease progression call. A cut-off was selected to optimize the assay for specificity and positive predictive value (PPV). Using 1,000 iterations of the bootstrap method, the expected PPV for each PS was calculated, and a cut-point with an expected PPV ≥99% was selected. The cut-point selected was 90.
Figure 3.
A scatter plot of Progression Scores (PS). No participate with non-progressive disease by imaging (black dots), had a PS over 60, well below the PS cut-off of 90 for making a molecular progression call. Five participants with progressive disease by imaging had a PS at or below 10.
Figure 3.
A scatter plot of Progression Scores (PS). No participate with non-progressive disease by imaging (black dots), had a PS over 60, well below the PS cut-off of 90 for making a molecular progression call. Five participants with progressive disease by imaging had a PS at or below 10.
3.3. Assay Performance
By design, a cut-off threshold was set to avoid false-positives, making the PPV 100%. Nine (9) patients with disease progression by imaging had a PS below 90, making the negative predictive value, 92%. The results are summarized in Table 1.
4. Discussion
4.1. Role and Limitations of Fragmentomics
Our previous work has shown that cfDNA can identify disease progression and therapy futility reliably [24]. However, that work was conducted under sample handling conditions that are impractical for a commercial assay. In that study, plasma was separated at a CLIA lab within an academic medical center within hours of specimen collection. For most oncology clinics, this is not practical and in many cases impossible. Consequently, to be clinically viable, a cfDNA-based assay targeting disease progression must be able to accommodate the shipment of blood over several days without the risk of producing false-positive results. Furthermore, the clinical utility for non-response to therapy requires that common conditions unrelated to a patient’s cancer do not result in producing invalid results, especially false positive results. Fragmentomics plays a significant role in the PS assay’s ability to avoid generating false-positive results. The following data is intended to illustrate this.
Table 2 presents four study participants whose blood arrived at our lab with evidence of common-shipment white blood cell lysis. The first three participants (2022, 4019 and 8003), when measuring the concentration levels of all cfDNA above 80 bp, exhibited strong evidence of disease progression. However, by imaging, none of those patients had disease progression. Conversely, participant 2021 had a small decrease in the cfDNA concentration levels above 80bp, evidence of non-progression. By imaging, that patient was experiencing disease progression. By employing the fragmentomics components of the assay, the PS Assay made the correct call on all four of these patients.
While fragmentomics clearly improves the performance of the PS assay, there is evidence that limitations exist in making cfDNA cancer specific. Several non-cancer clinical conditions are known to increase cfDNA in the patient's plasma [34,35]. We evaluated the plasma of non-cancer patients for cfDNA concentrations using fragment analysis. Using a third-party vendor, blood was drawn from 30 consenting adult patients who had the following events in the past 12 days: acute stroke (3 patients), asthma requiring hospitalization (2 patients), COPD exacerbation requiring hospitalization (3 patients), diabetic ketoacidosis (3 patients), severe inflammatory bowel disease (4 patients), myocardial infarction, severe rheumatoid arthritis (5patients), severe seizure (3 patients), and viral infection (5 patients). Additionally, blood was drawn from nine healthy adults with consent. Using the average values from the nine healthy patients as the baseline for the PS assay, we measured the PS score for each of the 30 patients suffering an acute event. The results are presented in Table A3 of the Appendix in the supplementary section. While comparing the cfDNA from a healthy patient to that of a patient who has just experienced a severe event is a suboptimal way to understand how these events impact the PS assay, it is a good indicator of which events are likely to have the most significant impact (keeping in mind these are events that occur between the first and second blood draw). It also highlights the fact that additional work is required to understand the types of events that will provide an inaccurate PS assay test result. Our investigation indicates that conditions such as Acute Stroke, Myocardial Infarction, COPD – hydroxyurea, and Rheumatoid Arthritis patients undergoing treatment with methotrexate may interfere with the proposed CfDNA assay. However, this was a minimal study with only 2-5 patients in each category and needs further investigation. Ideally, a validation study would be performed on treated cancer patients who develop various conditions before blood draws. There are practical limitations to conducting such a study due to the infrequency of such conditions occurring in this population.
This study demonstrates that cfDNA combined with fragmentomics can be highly cancer-specific to measure tumor burden changes in stage IV cancer patients accurately. The study, however, is preliminary and has limitations; further studies are needed. One such limitation is the broad time difference between the timing of PS testing and radiographic imaging. For some participants, it is possible that the tumor only began to grow after the second blood draw was collected. In those cases, the results would appear as a false negative. In an earlier study conducted with MD Anderson, where the blood was collected longitudinally at various time points, there was evidence of this occurring in some subjects[24].
Finally, this study does not consider the impact of the PS assay on clinical decision-making or how it affects patient quality of life and outcomes.
The assay presents four clear opportunities to enhance clinical management. First, it enables the rapid identification of patients experiencing disease progression, allowing clinicians to promptly transition them to alternative therapeutic strategies. Its real-time monitoring capability further permits the evaluation of low-probability treatment regimens after a single cycle, thereby providing early insight into patient responsiveness.
Second, there is a growing awareness of the overtreatment of stage IV cancer patients. In addition to the potential toxicological harm of a treatment on a patient’s health, there is the time toxicity and financial toxicity of cancer treatments. This PS assay may give physicians additional flexibility to remove agents or reduce the dosing of a patient's treatment plan or give patients a break from treatment altogether. This can potentially lower the level of toxicity and morbidity delivered to patients, improving their quality of life and perhaps extending overall survival. Two-arm randomized clinical studies could potentially demonstrate that the PS assay improves patient outcomes and quality of life while reducing the cost of cancer treatment. The ability to “de-escalate” treatment – to stop ineffective treatment without changing the survival of patients can improve quality of life and minimize financial toxicity. This is particularly important in LMIC (Low and Middle Income Countries) where patients often pay for treatment out of pocket.
Third, the PS assay alleviates both patient burden and clinical trial costs by swiftly identifying non-responders. Early recognition of ineffective treatment spares participants unnecessary exposure to therapy and reduces overall study expenses. Moreover, incorporating the PS assay into dose-finding and pharmacodynamic investigations provides real-time feedback, streamlining study design and accelerating decision-making in clinical trials.
Finally, immune checkpoint inhibitors (ICIs) have revolutionized cancer therapy by harnessing the patient’s own immune system to eradicate tumor cells. To date, the U.S. Food and Drug Administration has approved three classes of ICIs - targeting CTLA-4, PD-1/PD-L1, and LAG-3 - with more agents in development, across over 20 tumor types in the neoadjuvant, adjuvant and metastatic settings [31,32]. Unlike cytotoxic therapies, ICIs can precipitate immune-related adverse events (irAEs) of varying severity (grades 1–4), which may occur at any point during or even after treatment, reflecting excessive immune activation [33,34]. Moreover, unconventional response patterns such as pseudoprogression - an initial increase in tumor size followed by regression - and hyperprogression - accelerated disease growth seen in up to 30% of patients - pose significant clinical challenges, often leading to premature discontinuation of effective therapy and poorer outcomes [35,36]. By providing an early, dynamic readout of tumor-derived cfDNA changes, the PS assay could help distinguish true progression from transient immune phenomena and identify non-responders before severe irAEs arise, thereby optimizing patient selection and improving the safety and efficacy of ICI treatment.[36–38]
5. Conclusions
The PS assay has the potential to be a powerful tool to provide clinically valuable information to physicians regarding disease progression and non-progression in real time, helping physicians to optimize treatment plans and improve drug-development studies. By combining cfDNA with fragmentomics, the PS assay can identify stage IV breast, colorectal, and lung cancer patients with disease progression as quickly as 12 days after initiation of treatment. These findings demonstrate that, when combined with fragmentomic information, cfDNA is potentially an important cancer marker for measuring tumor burden.
Author Contributions
Conceptualization, SKS, WH, KK, WS, PH and HB; methodology, SKS, HB, WH, PH, KK and WS.; software, WH and WS; validation, SKS, HB, PH, WH and WS data curation, HB, WH, PH, SKS and WS; writing—original draft preparation SKS, WH; writing—review and editing, SKS, PH, WH, KK, HB and WS; supervision, SKS and WH. All authors have read and agreed to the published version of the manuscript.
Funding
This research received no external funding.
Institutional Review Board Statement
The blood samples were collected in accordance with the Declaration of Helsinki and approved by the Institutional Review Board. Blood samples from normal individuals were collected with informed consent using Advera corporation IRB Approval #201601790, with an approval date of September 14, 2016. The patient samples for the prospective clinical study were collected using the protocol and the consent form approved by the Institutional Review Board (IRB) for human subjects at the WCG clinical corporation (WIRB Tracking Number: 20183188), approved on November 11, 2018. The protocol and consent forms were also reviewed and approved by some of the study's participating institutions.
Informed Consent Statement
Informed consent was obtained from all human subjects involved in the study.
Data Availability Statement
All data and supporting results reported in this article, excluding confidential patient information, are available from the authors upon request.
Acknowledgments
The authors express their gratitude for the valuable suggestions, support, and guidance of the late Dr. Gary Spitzer.
Conflicts of Interest
SKS, BH, and PH are present or former employees of Cadex Genomics. SKS and HB are employees of InnoGenomics, and KK and BS are consultants to Cadex Genomics.
Abbreviations
The following abbreviations are used in this manuscript:
| Bp | Base pair |
| ctDNA | Cell-free circulating tumor DNA |
| cfDNA | Cell-free DNA |
| DNA | Deoxyribonucleic acid |
| ICI | Immune checkpoint inhibitors |
| IPC | Internal positive control |
| PCR | Polymerase chain reaction |
| PS | Progression score |
| qPCR | Quantitative polymerase chain reaction |
Appendix A
A Novel Cell-Free DNA Fragmentomics Assay and Its Application for Monitoring Disease Progression in Real-Time for Stage IV Cancer Patients.

Table A1.
Participant Summary.
| Participant Outcome | # | % |
|---|---|---|
| Protocol violations, incomplete follow-up | 4 | 2.8% |
| Withdrawn / Death / Hospice | 12 | 8.3% |
| Exceeded 72-hour sample stability threshold | 2 | 1.4% |
| Completed | 128 | 88.9% |
| Total | 146 | 100.0% |
| Age | 128 | 100.0% |
| <60 | 41 | 32.0% |
| ≥60 | 87 | 68.0% |
| Average | 62.75 | |
| Sex | 128 | 100.0% |
| Female | 73 | 57.0% |
| Male | 55 | 43.0% |
| Race and Ethnicity | 128 | 100.0% |
| Asian | 2 | 1.6% |
| Black | 21 | 16.4% |
| Hispanic | 0 | 0% |
| Non-Hispanic | 19 | 14.8% |
| Not Reported | 2 | 1.6% |
| White | 102 | 79.7% |
| Hispanic | 1 | 0.8% |
| Non-Hispanic | 95 | 74.2% |
| Not Reported | 6 | 4.7% |
| Other | 3 | 2.3% |
| Tumor Type | 128 | 100.0% |
| Breast | 20 | 15.6% |
| Colorectal | 50 | 39.1% |
| Lung | 58 | 45.3% |
| NSCLC | 50 | 39.1% |
| SCLC | 8 | 6.3% |
| Therapy Type | 128 | 100.0% |
| Chemotherapy | 63 | 49.2% |
| Targeted Therapy | 7 | 5.5% |
| Targeted Therapy + Chemotherapy | 7 | 5.5% |
| Immunotherapy | 14 | 10.9% |
| Immunotherapy + Chemotherapy | 37 | 28.9% |
Table A2.
Analytic Validation summary.
| Metric | Value |
|---|---|
| Limit of Blank (LoB) | 95th percentile:
|
| Limit of Detection (LoD) | LoD=LoB+CβSD:
|
| Limits of Quantitation (LoQ) |
|
| Linearity and Reportable Range |
|
Table A3.
Confounding conditions (Progression Score PS impact).
| Events (within 12 days of blood draw) | n | PS Change |
|---|---|---|
| Acute Stroke | 3 | +/-100.0 |
| Asthma | 2 | +/-4.5 |
| COPD exacerbation | 2 | +/-43.4 |
| COPD - hydroxyurea | 1 | +/-98.1 |
| Diabetes out of control, diabetic ketoacidosis | 3 | +/-26.0 |
| Inflammatory Bowel Disease | 4 | +/-47.1 |
| Myocardial Infarction | 2 | +/-100.0 |
| Rheumatoid Arthritis | 3 | +/-14.4 |
| Rheumatoid Arthritis - methotrexate | 2 | +/-87.2 |
| Seizure | 3 | +/-45.0 |
| Viral Infection | 5 | +/-15.1 |
References
- Akamatsu, S.; Mizuno, K.; Sumiyoshi, T.; Goto, T.; Kobayashi, T. The Current State and Future of Plasma Cell-Free DNA Analysis in Urologic Malignancies. The Korean Journal of Urological Oncology 2023, 21, 23–31. [Google Scholar] [CrossRef]
- Dasari, A.; Morris, V.K.; Allegra, C.J.; Atreya, C.; Benson, A.B.; Boland, P.; et al. ctDNA applications and integration in colorectal cancer: an NCI Colon and Rectal–Anal Task Forces whitepaper. Nat Rev Clin Oncol. 2020, 17, 757–770. [Google Scholar] [CrossRef] [PubMed]
- Cisneros-Villanueva, M.; Hidalgo-Pérez, L.; Rios-Romero, M.; Cedro-Tanda, A.; Ruiz-Villavicencio, C.A.; Page, K.; et al. Cell-free DNA analysis in current cancer clinical trials: a review. Br J Cancer 2022, 126, 391–400. [Google Scholar] [CrossRef] [PubMed]
- Martins, I.; Ribeiro, I.P.; Jorge, J.; Gonçalves, A.C.; Sarmento-Ribeiro, A.B.; Melo, J.B.; et al. Liquid Biopsies: Applications for Cancer Diagnosis and Monitoring. Genes 2021, 12, 349. [Google Scholar] [CrossRef] [PubMed]
- Bredno, J.; Lipson, J.; Venn, O.; Aravanis, A.M.; Jamshidi, A. Clinical correlates of circulating cell-free DNA tumor fraction. PLoS ONE 2021, 16. [Google Scholar] [CrossRef]
- Parikh, A.R.; Van Seventer, E.E.; Siravegna, G.; Hartwig, A. V. , Jaimovich, A.; He, Y.; et al. Minimal Residual Disease Detection using a Plasma-only Circulating Tumor DNA Assay in Patients with Colorectal Cancer. Clinical Cancer Research 2021, 27, 5586–5594. [Google Scholar] [CrossRef]
- Zhang, X.; Li, J.; Zhuang, Z.; Wang, J.; Bu, Z.; Lan, X. Challenges and prospects of cell-free DNA in precision oncology. Medicine Plus 2024, 1, 100059. [Google Scholar] [CrossRef]
- Fan, W.; Xia, Z.; Chen, R.; Lin, D.; Li, F.; Zheng, Y.; et al. Circulating tumor DNA analysis predicts recurrence and avoids unnecessary adjuvant chemotherapy in I–IV colorectal cancer. Ther Adv Med Oncol. 2024, 16. [Google Scholar] [CrossRef]
- Dong, S.; Wang, Z.; Zhang, J.T.; Yan, B.; Zhang, C.; Gao, X.; et al. Circulating Tumor DNA-Guided De-Escalation Targeted Therapy for Advanced Non-Small Cell Lung Cancer: A Nonrandomized Clinical Trial. JAMA Oncol. 2024. [Google Scholar] [CrossRef]
- Liu, X.; Liu, L.; Ji, Y.; Li, C.; Wei, T.; Yang, X.; et al. Enrichment of short mutant cell-free DNA fragments enhanced detection of pancreatic cancer. EBioMedicine 2019, 41, 345–356. [Google Scholar] [CrossRef]
- Han DSC, Ni, M. ; Chan RWY, Chan VWH, Lui, K.O.; Chiu RWK, et al. The Biology of Cell-free DNA Fragmentation and the Roles of DNASE1, DNASE1L3, and DFFB. Am J Hum Genet. 2020, 106, 202–214. [Google Scholar] [CrossRef]
- Higazi, A.M.; El Hini, S.H.; El-Sharkawy, E.A.; Gayyed, M.F.; Aziz, N.A.; Matta, R.A. Diagnostic Role of Cell-free DNA Integrity in Thyroid Cancer Particularly for Bethesda IV Cytology. Endocrine Practice 2021, 27, 673–681. [Google Scholar] [CrossRef] [PubMed]
- Leal AIC, Mathios, D. ; Jakubowski, D.; Johansen, J.S.; Lau, A.; Wu, T.; et al. Cell-Free DNA Fragmentomes in the Diagnostic Evaluation of Patients With Symptoms Suggestive of Lung Cancer. Chest 2023, 164, 1019–1027. [Google Scholar] [CrossRef] [PubMed]
- Ding, S.C.; Lo YMD. Cell-Free DNA Fragmentomics in Liquid Biopsy. Diagnostics 2022, 12, 978. [Google Scholar] [CrossRef] [PubMed]
- Qi, T.; Pan, M.; Shi, H.; Wang, L.; Bai, Y.; Ge, Q. Cell-Free DNA Fragmentomics: The Novel Promising Biomarker. Int J Mol Sci. 2023, 24, 1503. [Google Scholar] [CrossRef]
- Choi, H.; Charnsangavej, C.; Faria, S.C.; Macapinlac, H.A.; Burgess, M.A.; Patel, S.R.; et al. Correlation of Computed Tomography and Positron Emission Tomography in Patients With Metastatic Gastrointestinal Stromal Tumor Treated at a Single Institution With Imatinib Mesylate: Proposal of New Computed Tomography Response Criteria. Journal of Clinical Oncology 2007, 25, 1753–1759. [Google Scholar] [CrossRef]
- Eisenhauer, E.A.; Therasse, P.; Bogaerts, J.; Schwartz, L.H.; Sargent, D.; Ford, R.; et al. New response evaluation criteria in solid tumours: Revised RECIST guideline (version 1.1). Eur J Cancer 2009, 45, 228–247. [Google Scholar] [CrossRef]
- Villaruz, L.C.; Socinski, M.A. The clinical viewpoint: Definitions, limitations of RECIST, practical considerations of measurement. Clinical Cancer Research 2013. [Google Scholar] [CrossRef]
- Bartolomucci, A.; Nobrega, M.; Ferrier, T.; Dickinson, K.; Kaorey, N.; Nadeau, A.; et al. Circulating tumor DNA to monitor treatment response in solid tumors and advance precision oncology. npj Precision Oncology 2025. [Google Scholar] [CrossRef]
- Frank, M.S.; Andersen CSA, Ahlborn, L. B.; Pallisgaard, N.; Bodtger, U.; Gehl, J. Circulating Tumor DNA Monitoring Reveals Molecular Progression before Radiologic Progression in a Real-life Cohort of Patients with Advanced Non–small Cell Lung Cancer. Cancer Research Communications 2022, 2, 1174–1187. [Google Scholar] [CrossRef]
- Anagnostou, V.; Ho, C.; Nicholas, G.; Juergens, R.A.; Sacher, A.; Fung, A.S.; et al. ctDNA response after pembrolizumab in non-small cell lung cancer: phase 2 adaptive trial results. Nat Med. 2023, 29, 2559–2569. [Google Scholar] [CrossRef]
- Fritsche, H.A.; Bast, R.C. CA 125 in Ovarian Cancer: Advances and Controversy. Clin Chem. 1998, 44, 1379–1380. [Google Scholar] [CrossRef] [PubMed]
- Fakih, M.G.; Padmanabhan, A. CEA Monitoring in Colorectal Cancer. Oncology. 2006, 20, 579–587. [Google Scholar] [PubMed]
- Pereira AAL, Lam, M, Kanikarla Marie, P.; Raghav KPS, Morris, V.K.; Brown, H.; et al. Circulating tumor DNA (ctDNA) as an early marker to monitor clinical benefit of regorafenib and TAS-102 in patients with metastatic colorectal cancer (mCRC). Journal of Clinical Oncology 2018, 36 (Suppl. 15), 3533. [CrossRef]
- Sinha, S.; Brown, H.; Tabak, J.; Fang, Z. ; Tertre MC du, McNamara, S. ; et al. Multiplexed real-time polymerase chain reaction cell-free DNA assay as a potential method to monitor stage IV colorectal cancer. Surgery. 2019, 166, 534–539. [Google Scholar] [CrossRef]
- Sinha, S.; Brown, H.; Knopf, K.B.; Hall, P.; Shannon, W.G.; Haack, W. Development of a novel cell-free DNA fragmentomics assay for monitoring disease progression in real-time for stage IV cancer patients. Journal of Clinical Oncology. 2024, 42 (Suppl. 16), e14544. [Google Scholar] [CrossRef]
- Gerber, T.; Taschner-Mandl, S.; Saloberger-Sindhöringer, L.; Popitsch, N.; Heitzer, E.; Witt, V.; et al. Assessment of Pre-Analytical Sample Handling Conditions for Comprehensive Liquid Biopsy Analysis. Journal of Molecular Diagnostics. 2020, 22, 1070–1086. [Google Scholar] [CrossRef]
- Pineda, G.M.; Montgomery, A.H.; Thompson, R.; Indest, B.; Carroll, M.; Sinha, S.K. Development and validation of InnoQuantTM, a sensitive human DNA quantitation and degradation assessment method for forensic samples using high copy number mobile elements Alu and SVA. Forensic Sci Int Genet. 2014, 13, 224–235. [Google Scholar] [CrossRef]
- Batzer, M.A.; Deininger, P.L. Alu repeats and human genomic diversity. Nat Rev Genet. 2002, 3, 370–379. [Google Scholar] [CrossRef]
- Deininger, P.L.; Batzer, M.A. Mammalian Retroelements. Genome Res. 2002, 12, 1455–1465. [Google Scholar] [CrossRef]
- Shewale, J.G.; Schneida, E.; Wilson, J.; Walker, J.A.; Batzer, M.A.; Sinha, S.K. Human genomic DNA quantitation system, H-Quant: Development and validation for use in forensic casework. J Forensic Sci. 2007, 52, 364–370. [Google Scholar] [CrossRef]
- Efron, B. The Bootstrap and Modern Statistics. J Am Stat Assoc. 2000, 95, 1293–1296. [Google Scholar] [CrossRef]
- Paik, S.; Shak, S.; Tang, G.; Kim, C.; Baker, J.; Cronin, M.; et al. Expression of the 21 genes in the Recurrence Score assay and tamoxifen clinical benefit in the NSABP study B-14 of node negative, estrogen receptor positive breast cancer. Journal of Clinical Oncology. 2005, 23 (Suppl. 16), 510. [Google Scholar] [CrossRef]
- Fujihara, J.; Takinami, Y.; Kimura-Kataoka, K.; Kawai, Y.; Takeshita, H. Cell-free DNA Release in the Plasma of Patients with Cardiac Disease is Associated with Cell Death Processes. Indian Journal of Clinical Biochemistry. 2023, 38, 67–72. [Google Scholar] [CrossRef] [PubMed]
- Long, Y.; Zhang, Y.; Gong, Y.; Sun, R.; Su, L.; Lin, X.; et al. Diagnosis of Sepsis with Cell-free DNA by Next-Generation Sequencing Technology in ICU Patients. Arch Med Res. 2016, 47, 365–371. [Google Scholar] [CrossRef] [PubMed]
Figure 1.
CADEX-0001 study flow diagram.
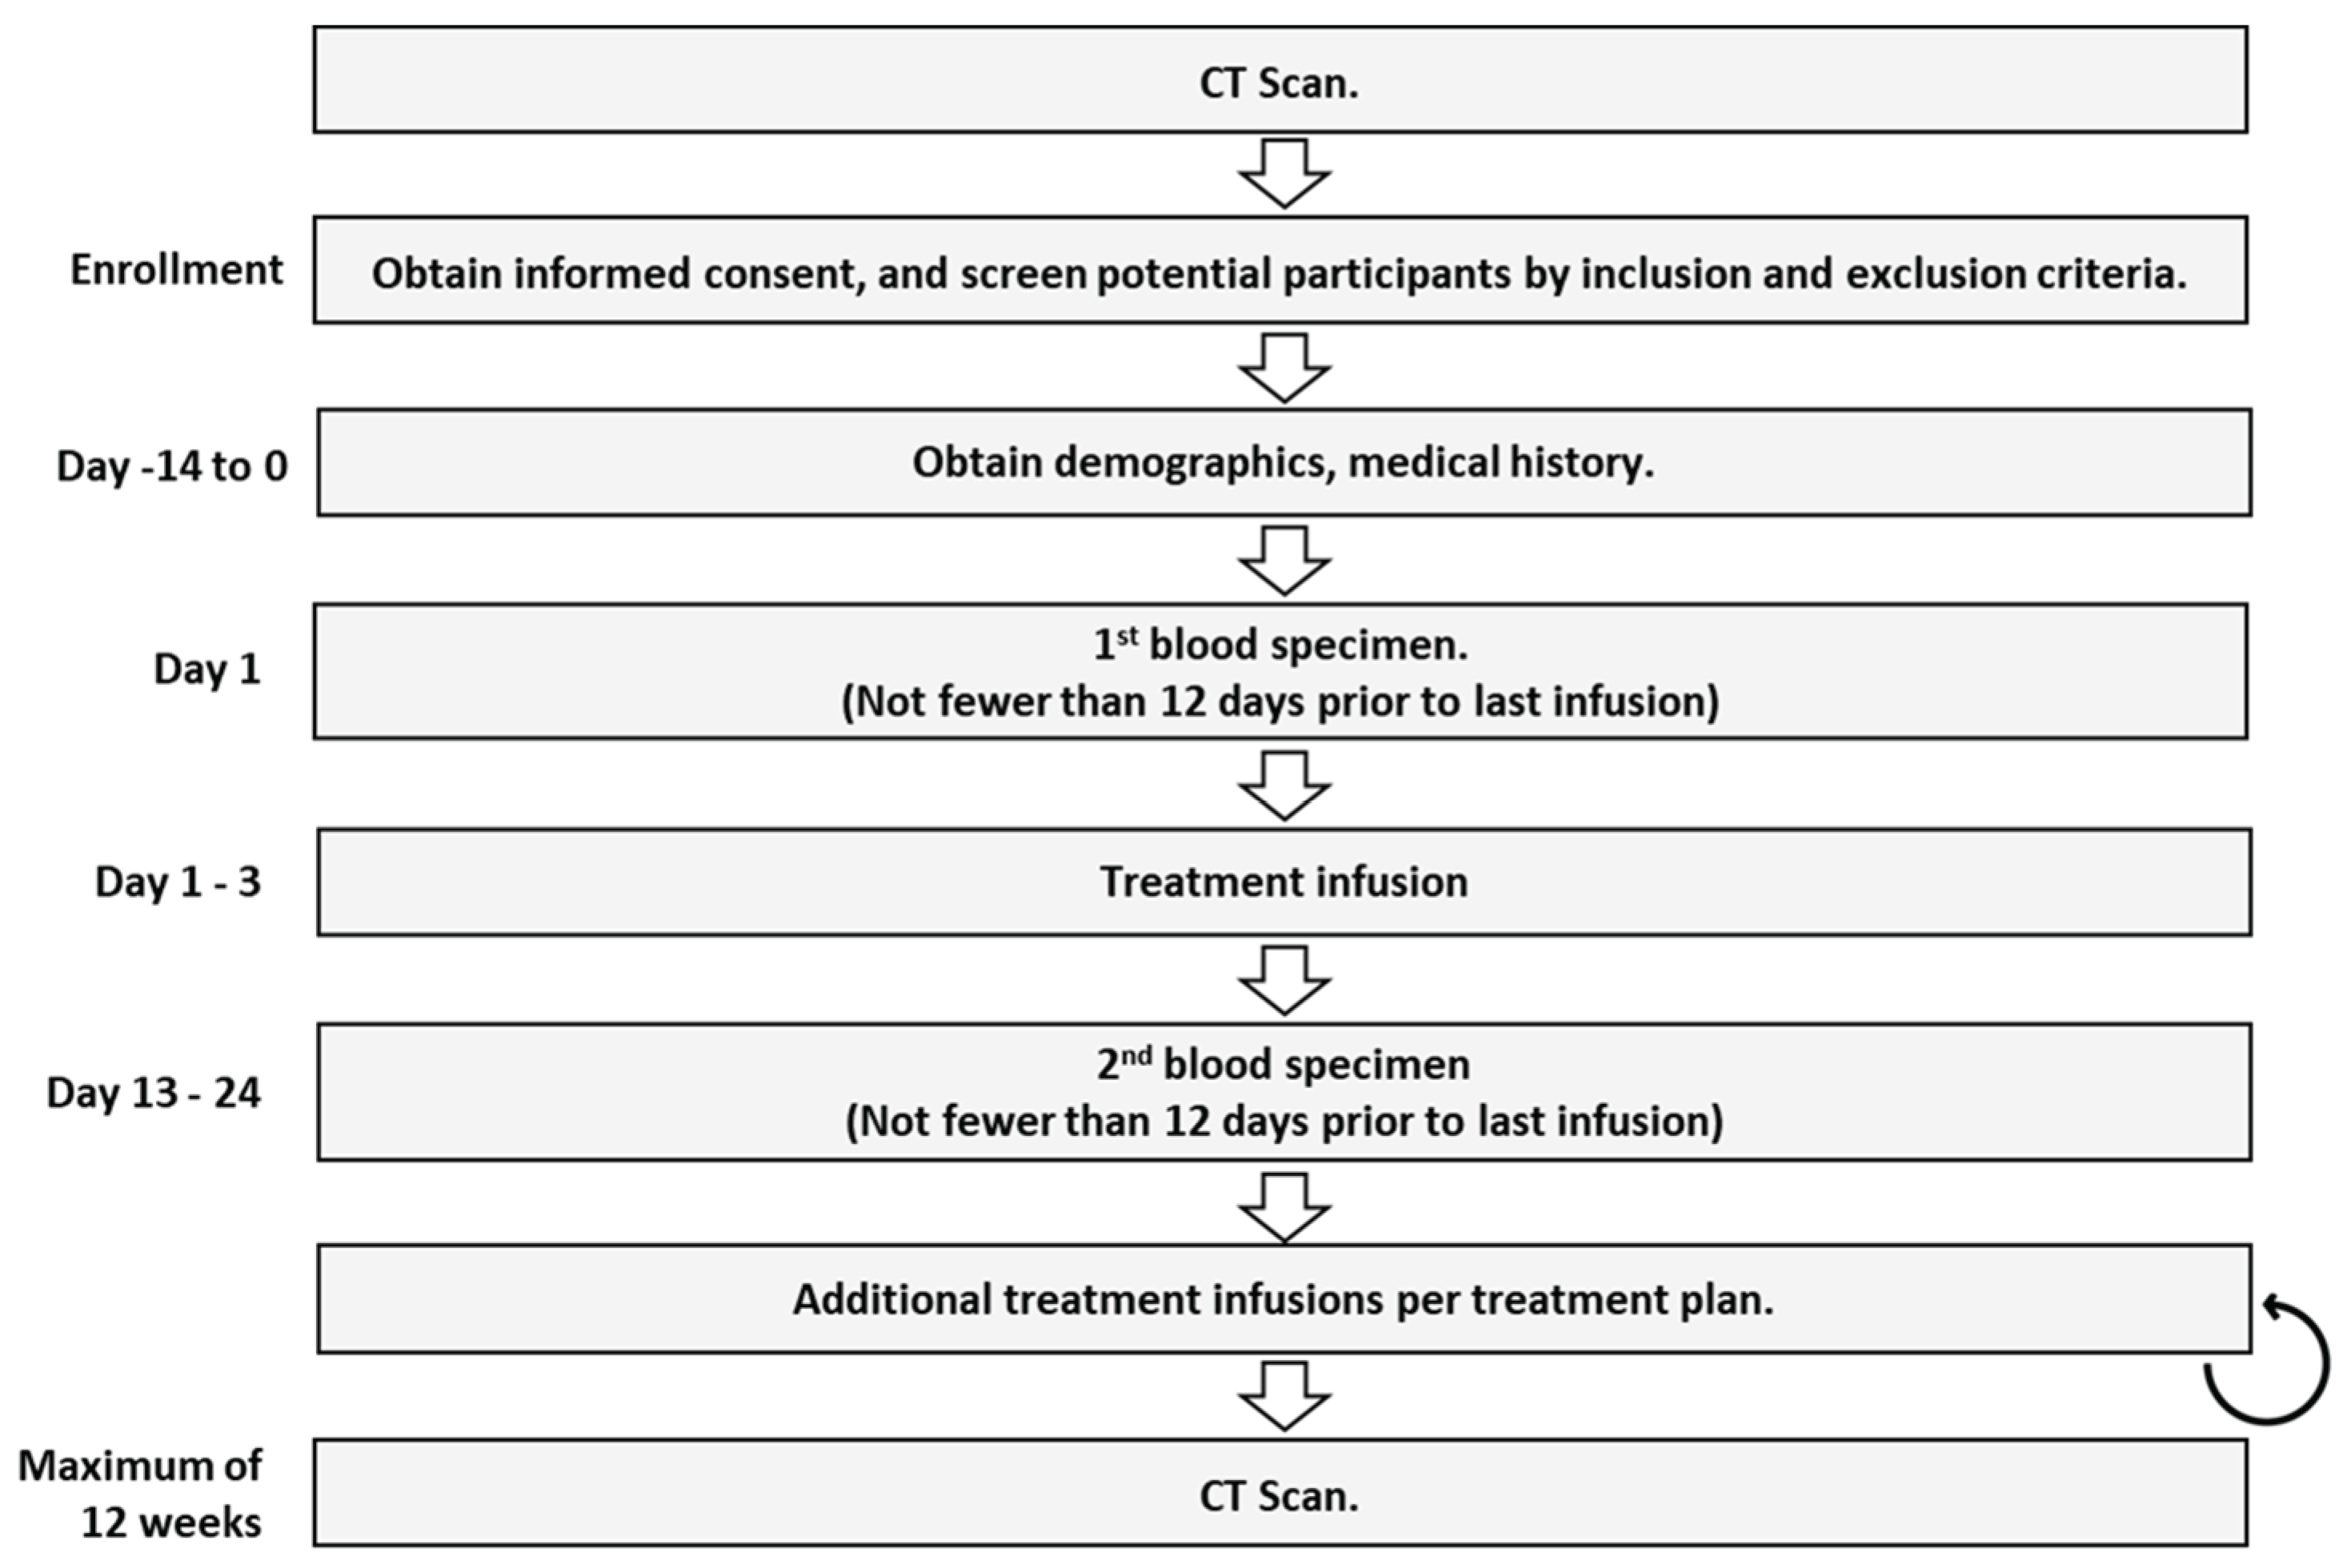
Figure 2.
ROC Curve for the best-performing model.
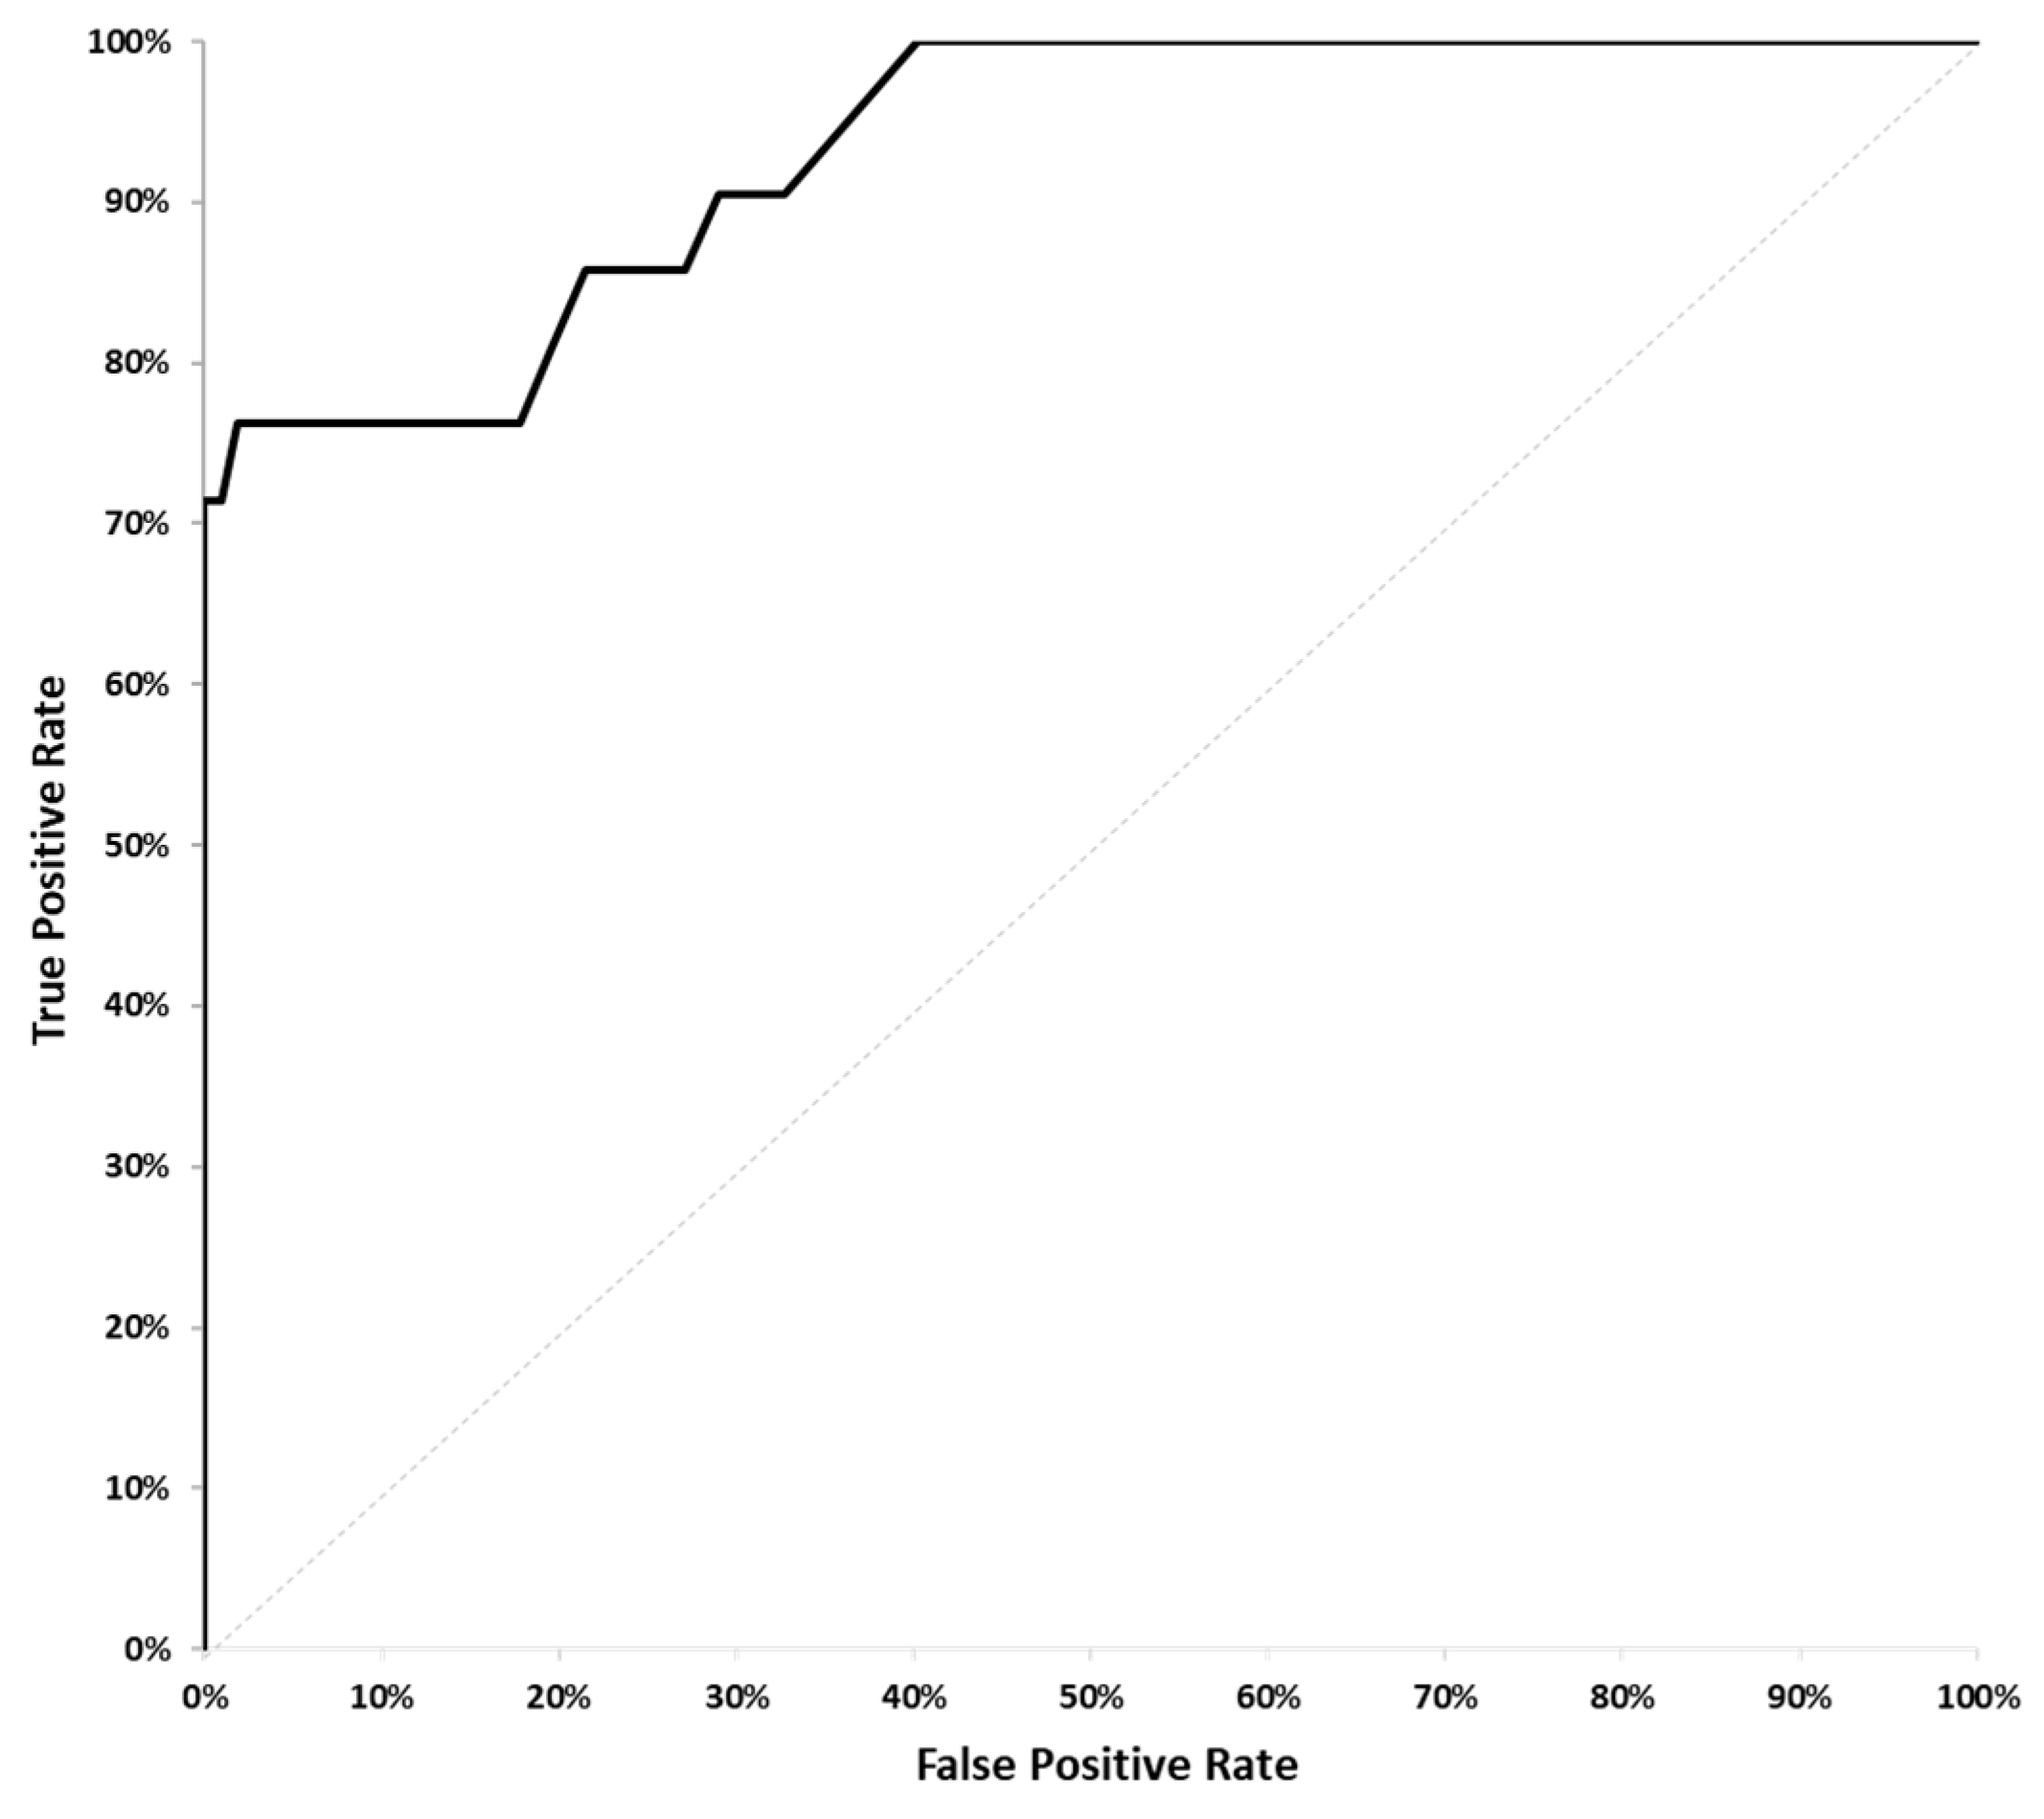
Table 1.
Progression Score Assay Result Interpretation.
| Progression Score (PS) | # | Interpretation | Performance |
|---|---|---|---|
| ≥90 | 11 | Progression | PPV = 100% |
| <90 | 117 | Likely non-progression | NPV = 92% |
Table 2.
A sample of participants with high levels of short and long cfDNA changes due to high levels of white blood cells lysis, and the impact of fragmentomics on assay performance. Considering only the change in concentration levels of >80bp cfDNA fragments, versus the Progression Score.
Table 2.
A sample of participants with high levels of short and long cfDNA changes due to high levels of white blood cells lysis, and the impact of fragmentomics on assay performance. Considering only the change in concentration levels of >80bp cfDNA fragments, versus the Progression Score.
| Participant | PD by Imaging | Δ >80bp cfDNA | PS |
|---|---|---|---|
| 2022 | No | 10.1-fold increase | 8.6 |
| 4019 | No | 8.8-fold increase | 0.0 |
| 8003 | No | 3.8-fold increase | 0.1 |
| 2021 | Yes | 2.2% decrease | 100.0 |
Disclaimer/Publisher’s Note: The statements, opinions and data contained in all publications are solely those of the individual author(s) and contributor(s) and not of MDPI and/or the editor(s). MDPI and/or the editor(s) disclaim responsibility for any injury to people or property resulting from any ideas, methods, instructions or products referred to in the content. |
© 2025 by the authors. Licensee MDPI, Basel, Switzerland. This article is an open access article distributed under the terms and conditions of the Creative Commons Attribution (CC BY) license (http://creativecommons.org/licenses/by/4.0/).
Copyright: This open access article is published under a Creative Commons CC BY 4.0 license, which permit the free download, distribution, and reuse, provided that the author and preprint are cited in any reuse.


