
Submitted:
11 August 2025
Posted:
13 August 2025
You are already at the latest version
Abstract
Background: Vitamin D supplementation may influence oxidative stress, but evidence in populations following specific dietary patterns is limited. Methods: In this 16-week intervention, 50 Orthodox nuns, received vitamin D supplementation (2000 IU/day orally) and 50 age-matched women following time-restricted eating (TRE) served as controls receiving no supplementation. Anthropometric parameters, serum 25-hydroxyvitamin D [25(OH)D], and oxidative stress markers — total antioxidant capacity (TAC), glutathione (GSH), and thiobarbituric acid reactive substances (TBARS) — were measured at baseline and post-intervention. Results: At baseline, both groups were comparable in anthropometric and oxidative stress markers, except for serum 25-hydroxyvitamin D [25(OH)D], which was lower in the intervention group. Following supplementation, serum 25(OH)D increased from 15.77±5.21 to 31.24±7.87 ng/mL (p = 0.031) in Οrthodox nuns.No significant changes were observed for TAC (0.93±0.11 to 0.97±0.09, p = 0.081),and GSH (6.01±1.55 to 5.81±1.41, p = 0.069), whereas TBARS decreased significantly (7.32±1.31 to 6.94±1.21, p = 0.041). No significant changes were observed in controls under TRE. Changes (Δ) in all variables represented the post–pre difference over the 16-week period.Pearson correlations showed no significant associations between Δ25(OH)D and ΔTAC (r = −0.244, p = 0.346), ΔGSH (r = 0.110, p = 0.675), or ΔTBARS (r = −0.116, p = 0.657). In multivariable regression adjusted for age, weight, body fat percentage, and baseline 25(OH)D, Δ25(OH)D was not an independent predictor of oxidative stress marker changes; however, weight (β = 0.08, p = 0.011) and body fat percentage (β = −0.13, p = 0.014) were associated with reductions in TBARS. Conclusions: Sixteen weeks of vitamin D supplementation in nuns adhering to Orthodox Christian fasting increased serum 25(OH)D concentrations and had neutral effects on oxidative stress markers. TBARS improvements could be attributed more closely linked to adiposity reductions than to vitamin D changes per se.
Keywords:
Vitamin D
; oxidative stress
; TAC
; GSH
; TBARS
; fasting
; women
; supplementation
1. Introduction
Vitamin D, a fat-soluble ketosteroid, plays an essential role not only in calcium and bone homeostasis but also in various non-skeletal functions, including regulation of immune responses and modulation of oxidative stress [1]. Oxidative stress, defined as an imbalance between reactive oxygen species (ROS) production and antioxidant defense mechanisms, contributes to the pathogenesis of numerous chronic diseases such as cardiovascular disorders, diabetes, and cancer [2].There is growing interest in understanding how nutritional interventions may influence oxidative stress, particularly in populations adhering to alternative dietary patterns such as religious or intermittent fasting [3].
Christian Orthodox fasting (COF) and time-restricted eating (TRE) represent structured dietary behaviors with potential implications for oxidative metabolism. The COF regimen involves abstinence from animal products and consumption of plant-based foods within a defined time window [4,5], while TRE often imposes a daily feeding schedule within 8 hours [6].These dietary practices may lead to alterations in energy intake, macronutrient composition, and antioxidant consumption, ultimately affecting redox status. Furthermore, both regimens may reduce inflammation and improve metabolic markers [7,8]. While several studies have examined the impact of fasting on glucose and lipid metabolism [9], less is known about its interaction with vitamin D metabolism and oxidative stress [10].
Vitamin D deficiency has been linked to increased oxidative damage through mechanisms involving NADPH oxidase inhibition and glutathione regulation [11,12,13,14]. Thus, vitamin D supplementation during fasting could theoretically attenuate oxidative damage and enhance antioxidant defense.
The present study investigates the effect of 16-week vitamin D supplementation on key oxidative stress markers — total antioxidant capacity (TAC), glutathione (GSH), and thiobarbituric acid reactive substances (TBARS) — in Orthodox nuns compared to a control non-supplemented group of women following TRE dietary patterns for promoting health. We aimed to determine whether vitamin D affects redox homeostasis and to assess whether baseline vitamin D status influences this response.
2. Design
This was a cross-sectional study before a period of 16-week implementation of COF and TRE in two groups of adult female nuns and lay women.We included a group of Orthodox nuns from monasterial communities of Northern Greece, which received a 2,000 IU daily dose of vitamin D₃ in the form of oral soft gel capsules for 16 weeks,and a control group of lay women did not receive any vitamin D supplement during the study period,following only TRE dietary regimens.
3. Study Population
We included 50 Christian Orthodox female adult nuns, from two different monasteries, 30–50 years of age, residing in Central and Northern Greece and an age-matched cohort of 50 adult lay women from the same region. Orthodox nuns (but not lay women), with a baseline 25-hydroxyvitamin D concentrations ≥ 20 ng/mL (as initially evaluated from the same initial cohort—results published previously [15,16,17,18] were excluded. Women from the control group followed TRE dietary patterns at least for the last year for heapth promoting reasons. Additional exclusion criteria for both groups were the following: Body mass index (BMI) ≤ 25, amenorrhea ≥ 3 months, pregnancy, presence of chronic kidney disease, severe liver disease, diagnosis of prediabetes or diabetes mellitus according to ADA criteria, dyslipidemia, arterial hypertension, uncontrolled hypothyroidism, recent surgery, severe infections (during the past 3 months), administration of medications that can alter weight, glucose and lipid metabolism (e.g., statins, corticosteroids, and antipsychotics), intake of vitamins or mineral supplements, physical disabilities and/or neurodegenerative disorders that could affect physical activity, acute infections, and chronic degenerative diseases.
4. Dietary Patterns
Orthodox nuns with at least 16 weeks adherence to COF were included in the study, whereas women from the general population followed TRE for 16 weeks, after a wash-out period of 3 weeks, before inclusion in the study. Orthodox nuns followed the Athonian type of fasting as previously described [19,20,21,22], abstaining from consumption of animal products (meat, poultry, eggs, dairy, and cheese), with the exception of seafood and fish, which fasters were permitted to eat on two specific weekdays, while the general population group was allowed to eat low-fat meat products without specific distribution and cut-offs of macronutrients and daily caloric intake. Orthodox nuns group adopted an 8 h eating interval (08:00 to 16:00), as dictated by typical monastery dietary rules, which are obligatory for all residents of the monastery, while the control groups followed a TRE regimes consumed food from 09:00 to 17:00. Adherence to dietary plans was evaluated with a 3-day food record (two weekdays and one weekend day) at the end of the study period, while the Nutrition Analysis Software Food Processor [https://esha.com/products/food-processor/ (accessed on 2 August 2024)] [23] was used to analyze food records. Finally, levels, frequency, and duration of physical activity, divided into light, moderate, and intense physical activity, were recorded for all participants according to AHA recommendations [24].
5. Anthropometric Measurements and Biochemical Analysis
Anthropometric measurements and biochemical analyses were performed in both groups using standardized procedures. Exact methods, reference ranges, equipment used, and other details were previously analytically described [25]. In brief, body weight (BW) was recorded to the nearest 0.01 kg using a calibrated computerized digital balance (K-Tron P1-SR, Onrion LLC, Bergenfield, NJ, USA); each participant was barefoot and lightly dressed during measurement.Body mass index (BMI), was calculated as the ratio of weight in kilograms divided by the height in meters squared (kg/m2) [26]. Body fat (BF) mass and percentage, visceral fat (VF), muscle mass, fat-free mass, and total body water were measured using bioelectrical impedance analysis (SC-330 S, Tanita Corporation, Tokyo, Japan) [27]. Blood samples were drawn in the morning, after a 12 h overnight fast by antecubital venipuncture, and the samples were stored at −20 °C prior to analysis. Samples were centrifuged and immediately frozen and then measured after one instance of defrosting, except from whole blood. Calcium (Ca) concentrations were evaluated using the COBAS8000 automated analyzer system (Roche Diagnostics GmbH, Mannheim, Germany). Parathyroid hormone (PTH) and 25(OH)D were tested in the COBAS e 602 immunochemistry module using electro-chemiluminescence (ECL) technology (Roche Diagnostics GmbH, Mannheim, Germany). Reference ranges of values as well as inter- and intra-assay coefficients of variation for the examined parameters are as follows: Ca: 8.4–10.2 mg/dL, 0.8–1.3%, and 0.5–1.3%; PTH: 15–65 pg/mL (or 1.6–6.9 pmol/L), 1.1–2.0%, and 2.5–3.4%; 25(OH)D: ≥30 ng/mL, 2.2–6.8%, and 3.4–13.1%. Insulin resistance was calculated using the homeostasis model assessment (HOMA-IR) formula described by Matthews et al. [28] as follows: FPI (mU/mL) × FPG (mmol/L)/22.5, where FPI stands for fasting plasma insulin and FPG for fasting plasma glucose.
6. Markers of Oxidative Status
6.1. Determination of Glutathione (GSH) Concentration in Red Blood Cells
GSH concentration was determined according to the method of Reddy et al. [29] as previously described [30]. At first, 400 μL of RBCL was mixed with 400 μL of 5% trichloroacetic acid (TCA), respectively, and centrifuged (1500× g, 5 min, 5 °C). Afterwards, 300 μL of the supernatant was mixed with 90 μL of 5% TCA and centrifuged (1500× g, 5 min, 5 °C). The samples were vortexed and incubated for 45 min in the dark at room temperature (RT), and the optical density was measured at 412 nm. GSH concentration was calculated based on the millimolar extinction coefficient of 2-nitro-5-thiobenzoate (TNB) (13.6 L/mmol/cm).
6.2. Determination of Total Antioxidant Capacity (TAC) Concentrations in Plasma
TAC levels were evaluated based on the protocol of Janaszewska and Bartosz [31]. More elaborately, 20 μL of plasma was mixed with 480 μL or 460 μL of phosphate buffer (10 mM, pH = 7.4), respectively, and, immediately, 500 μL of 2,2-diphenyl-1-picrylhydrazyl radical (DPPH•) solution (0.1 mM) was added. The samples were vortexed, incubated for 1 h in the dark at RT, and centrifuged (1500× g, 3 min, 25 °C). Finally, the optical density was measured at 520 nm. TAC levels were expressed as the mmol of DPPH• reduced to the corresponding hydrazine by the antioxidant compounds present in plasma or tissue homogenates.
6.3. Determination of Thiobarbituric Acid Reactive Substances (TBARSs) Concentrations in Plasma
TBARS levels were determined by a slightly modified method by Keles et al. [32]. Specifically, 100 μL of plasma was mixed with 500 μL of Tris-HCl (200 mM, pH = 7.4) and 500 μL of 35% TCA and incubated for 10 min at RT. After that, 1 mL of sodium sulfate (Na2SO4) (2 M) and thiobarbituric acid (TBA) (55 mM) solution was added, and the samples were placed in a water bath for 45 min at 95 °C. The resulting supernatant was used to measure the optical density at 530 nm. TBARS levels were calculated by applying the molar extinction coefficient of malonyl dialdehyde (ΜDA) (156,000 L/mol/cm).
7. Ethical Considerations
The study was conducted in accordance with the Declaration of Helsinki on the human trial performance. Written informed consent for inclusion in the study was provided by participants. Official written approval for the inclusion of the Orthodox nuns group was provided by the Holy Supervision Council of the monasteries after submission of the full study protocol 12 months before study initiation.
8. Statistical Analysis
Continuous variables were reported as means and SDs. Dietary and nutrient intake were compared using paired samples t-test. Age differences between the groups with light, moderate, and intense physical activity were tested using one-way analysis of variance with Tukey post hoc test. The effect of level of physical activity on overall health markers was tested with analysis of covariance to control for age. Normality of distribution was assessed using the Shapiro–Wilk test. Parametric tests were used where assumptions were met; otherwise, appropriate non-parametric tests or transformations were applied. Residuals from regression models were checked to ensure valid interpretation. The among-group comparison was undertaken using nonparametric Mann–Whitney U test. Linear regression was used for multi-adjusted analysis. Assumptions were checked for each statistical analysis. Level of significance was set at p < 0.05 (non-directional). Data were analyzed using SPSS v22.
9. Results
Orthodox nuns were older than lay women (median age 42±5.8 vs. 38± 2.9,p < 0.015) but did not differ in median weight and BMI. At baseline, both groups were comparable in terms of anthropometric and oxidative stress markers, except for vitamin D concentration, which were lower in the intervention group. Following the 16-week vitamin D supplementation, the Orthodox nuns exhibited a significant increase in serum 25(OH)D levels (from 15.77±5.21 to 31.2±7.87 ng/mL, p<0.001).Body weight, BMI, and body fat percentage showed modest but statistically significant reductions in the intervention group (all p < 0.05), while no changes were observed in the control group. As for oxidative stress markers, non -significant changes were observed, with the exception of a slight TBARS reduction. In specific, TAC increased (from 0.93±0.11 to 0.97±0.09, p = 0.081), whereas concentrations of GSH and TBARS declined (6.01±1.55 to 5.81±1.41, p = 0.069), and (7.32±1.31 to 6.94±1.21, p = 0.041) accordingly, following supplementation in the intervention group. No significant differences were observed in the control group across any of these markers.

Table 1.
Anthropometric and oxidative stress-related parameters before and after vitamin D supplementation in Orthodox nuns compared to the control group.
Table 1.
Anthropometric and oxidative stress-related parameters before and after vitamin D supplementation in Orthodox nuns compared to the control group.
| Variable | Supplementation-Baseline | Supplementation - Post | p | Controls - Baseline | Controls - Post | p |
|---|---|---|---|---|---|---|
| Weight (kg) | 71.52 ± 9.85 | 70.16 ± 9.51 | 0.021 | 68.75 ± 8.62 | 69.6 ± 8.29 | 0.287 |
| BMI (kg/m²) | 27.02 ± 3.96 | 26.47 ± 3.75 | 0.194 | 26.53 ± 3.54 | 26.8 ± 3.54 | 0.476 |
| Body fat (%) | 34.71 ± 8.42 | 33.96 ± 8.23 | 0.163 | 33.12 ± 7.97 | 32.6 ± 7.93 | 0.312 |
| 25(OH)D (ng/mL) | 15.77 ± 5.21 | 31.24 ± 7.87 | 0.031 | 26.41 ± 7.56 | 28.9 ± 7.58 | 0.534 |
| TAC | 0.93 ± 0.11 | 0.97 ± 0.09 | 0.081 | 0.79 ± 0.08 | 0.79 ± 0.08 | 0.267 |
| GSH | 6.01 ± 1.55 | 5.81 ± 1.41 | 0.069 | 7.11 ± 1.74 | 6.74 ± 1.74 | 0.453 |
| TBARS | 7.32 ± 1.31 | 6.94 ± 1.21 | 0.041 | 7.4 3± 1.11 | 7.26 ± 1.12 | 0.634 |
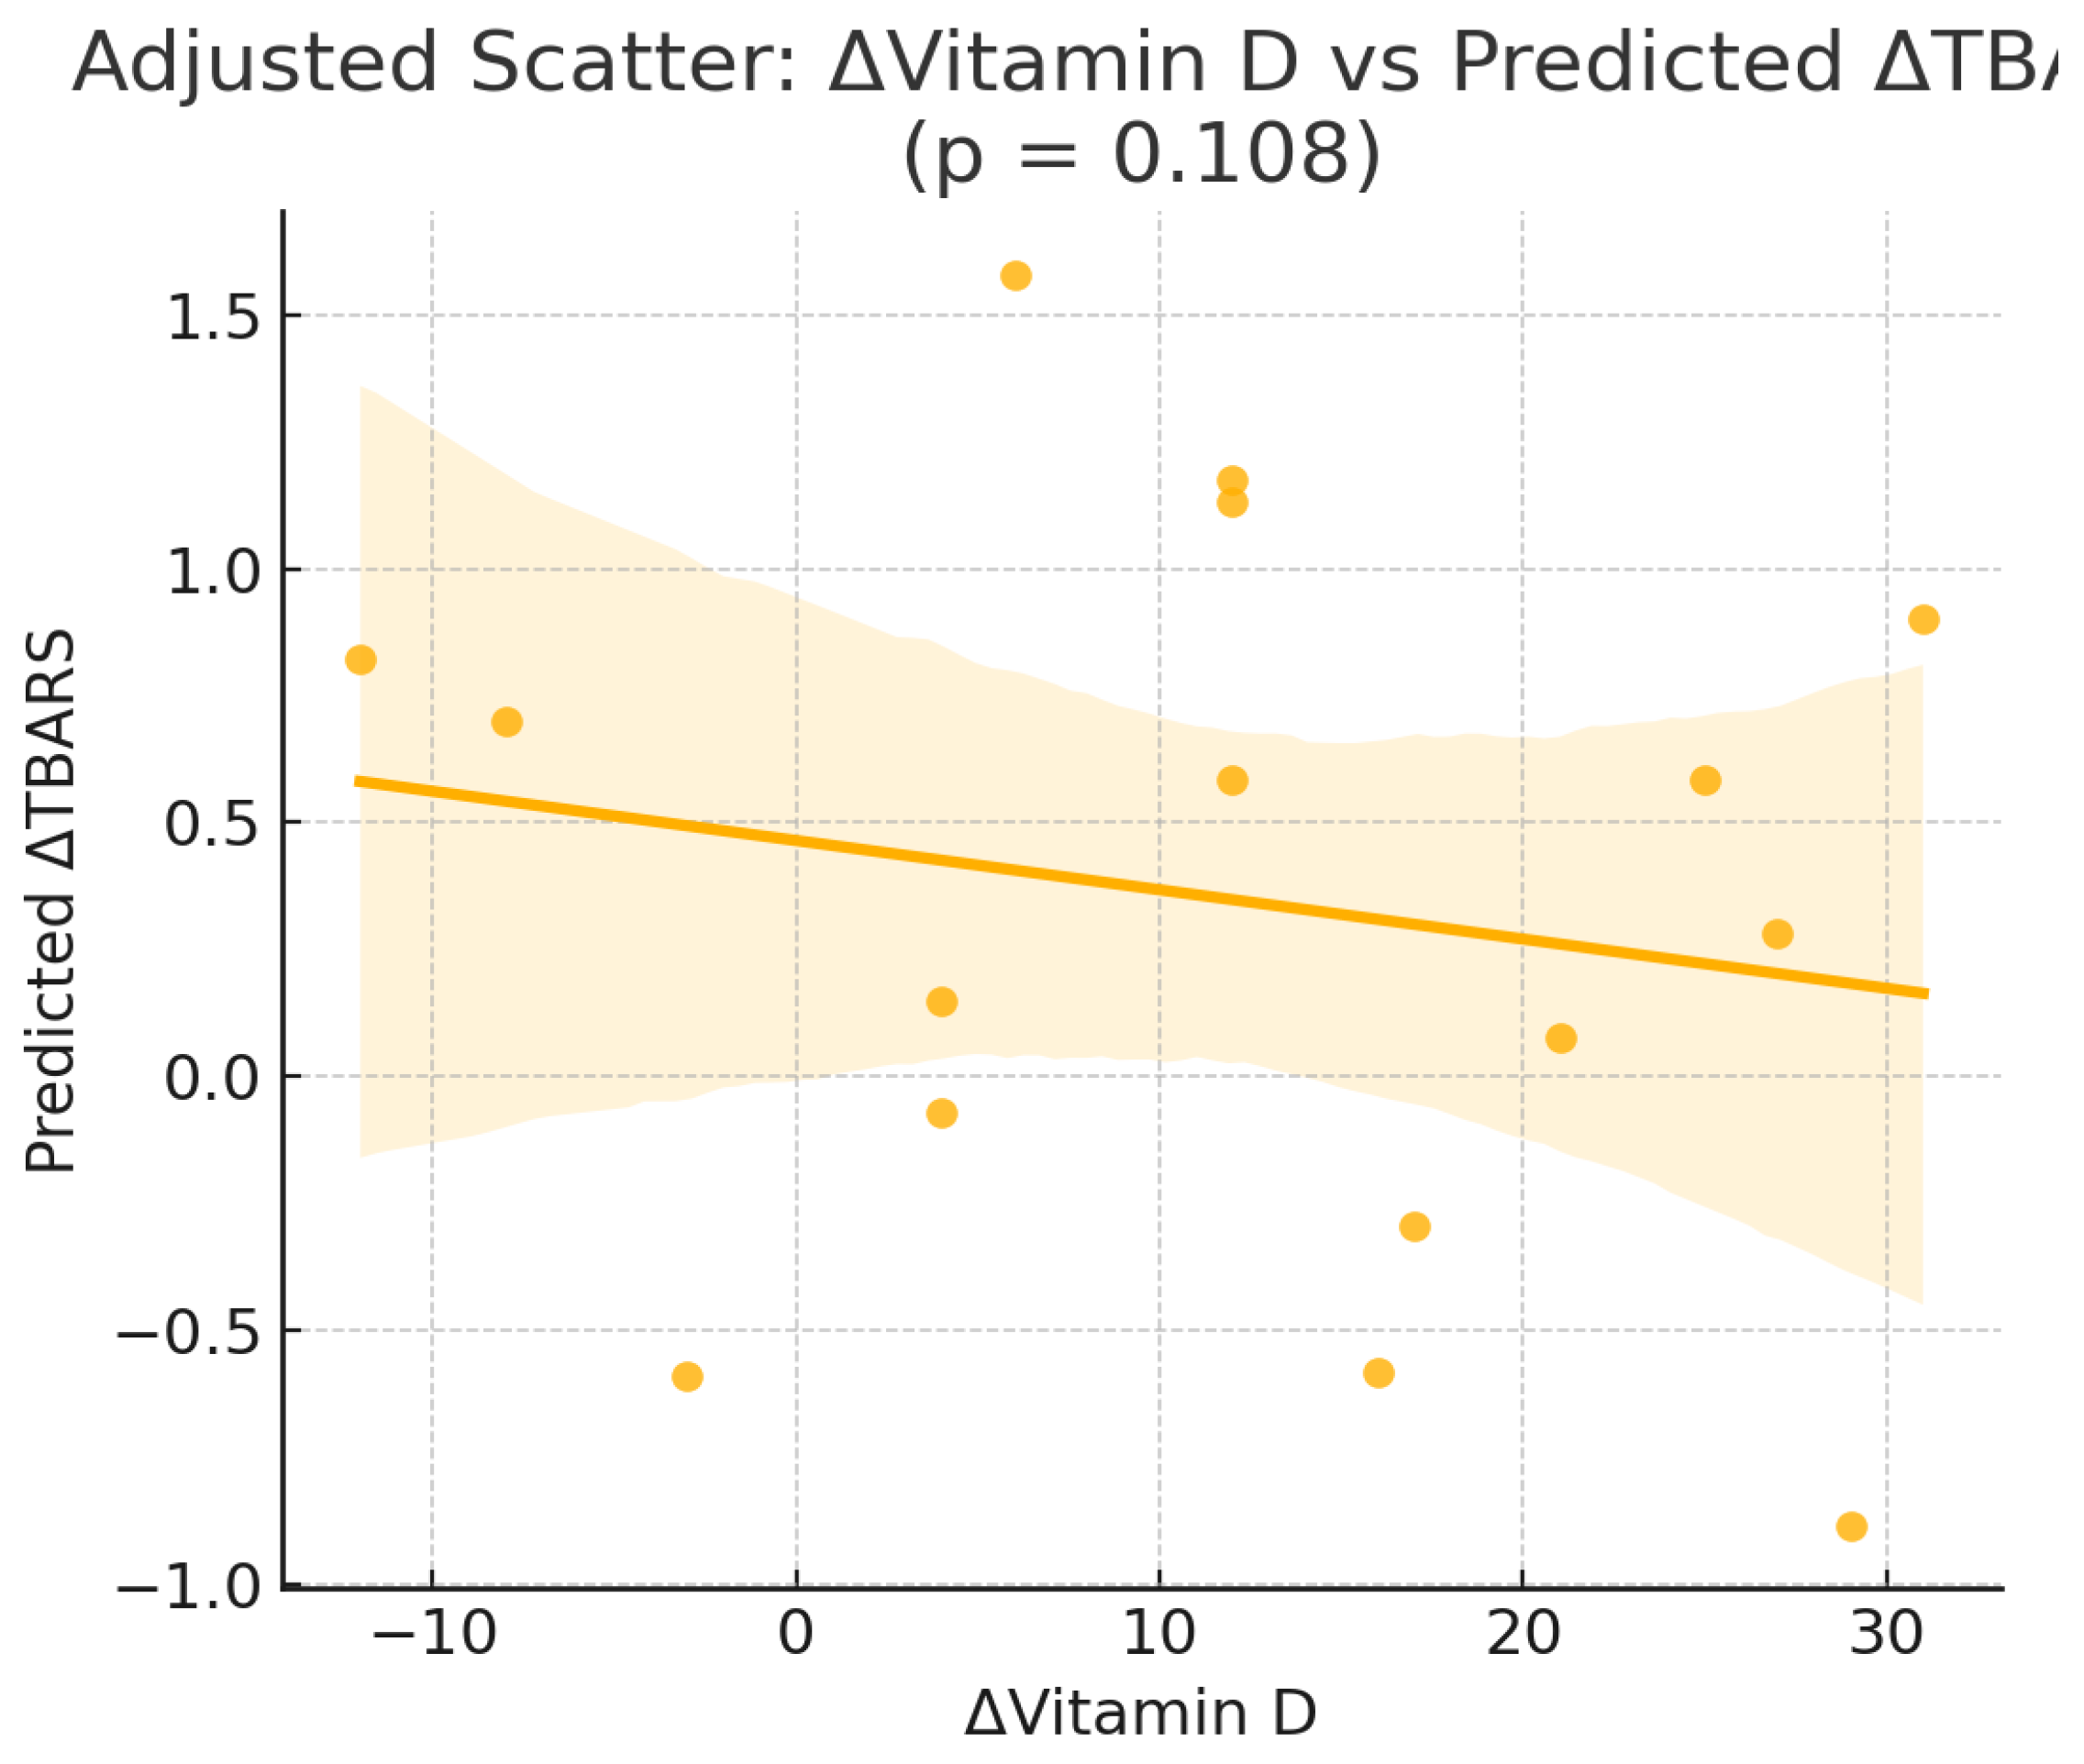
To explore whether changes in serum vitamin D concentrations were independently correlated or predicted changes in oxidative stress markers,we performed correlation and multivariable linear regression models in the intervention group (Orthodox nuns), adjusting for age, body weight, body fat percentage, and baseline 25(OH)D concentrations (Table 2 and Table 3).Pearson correlation analysis in the intervention group (Orthodox nuns) showed no significant linear associations between the change in serum 25-hydroxyvitamin D [Δ25(OH)D] and changes in TAC (r = −0.244, p = 0.346), GSH (r = 0.110, p = 0.675), or TBARS (r = −0.116, p = 0.657) (Table 2).
In multivariable linear regression models adjusted for age, weight, body fat percentage, and baseline 25(OH)D (Table 3), Δ25(OH)D did not emerge as an independent predictor of ΔTAC, ΔGSH, or ΔTBARS. For ΔGSH, none of the included predictors reached statistical significance. For ΔTAC, no variables were significantly associated with changes in antioxidant capacity. In contrast, for ΔTBARS, both weight (β = 0.08, p = 0.011) and body fat percentage (β = −0.13, p = 0.014) were independently associated with reductions in lipid peroxidation.
Subgroup analysis by baseline 25(OH)D levels (<20 ng/mL vs. ≥20 ng/mL) showed no significant differences in the post-supplementation changes in TAC, GSH, or TBARS.
Figure 1.
Scatterplot of the change in serum 25-hydroxyvitamin D [Δ25(OH)D] versus the change in glutathione (ΔGSH) in the intervention group (Orthodox nuns). (r = 0.110, p = 0.675).
Figure 1.
Scatterplot of the change in serum 25-hydroxyvitamin D [Δ25(OH)D] versus the change in glutathione (ΔGSH) in the intervention group (Orthodox nuns). (r = 0.110, p = 0.675).
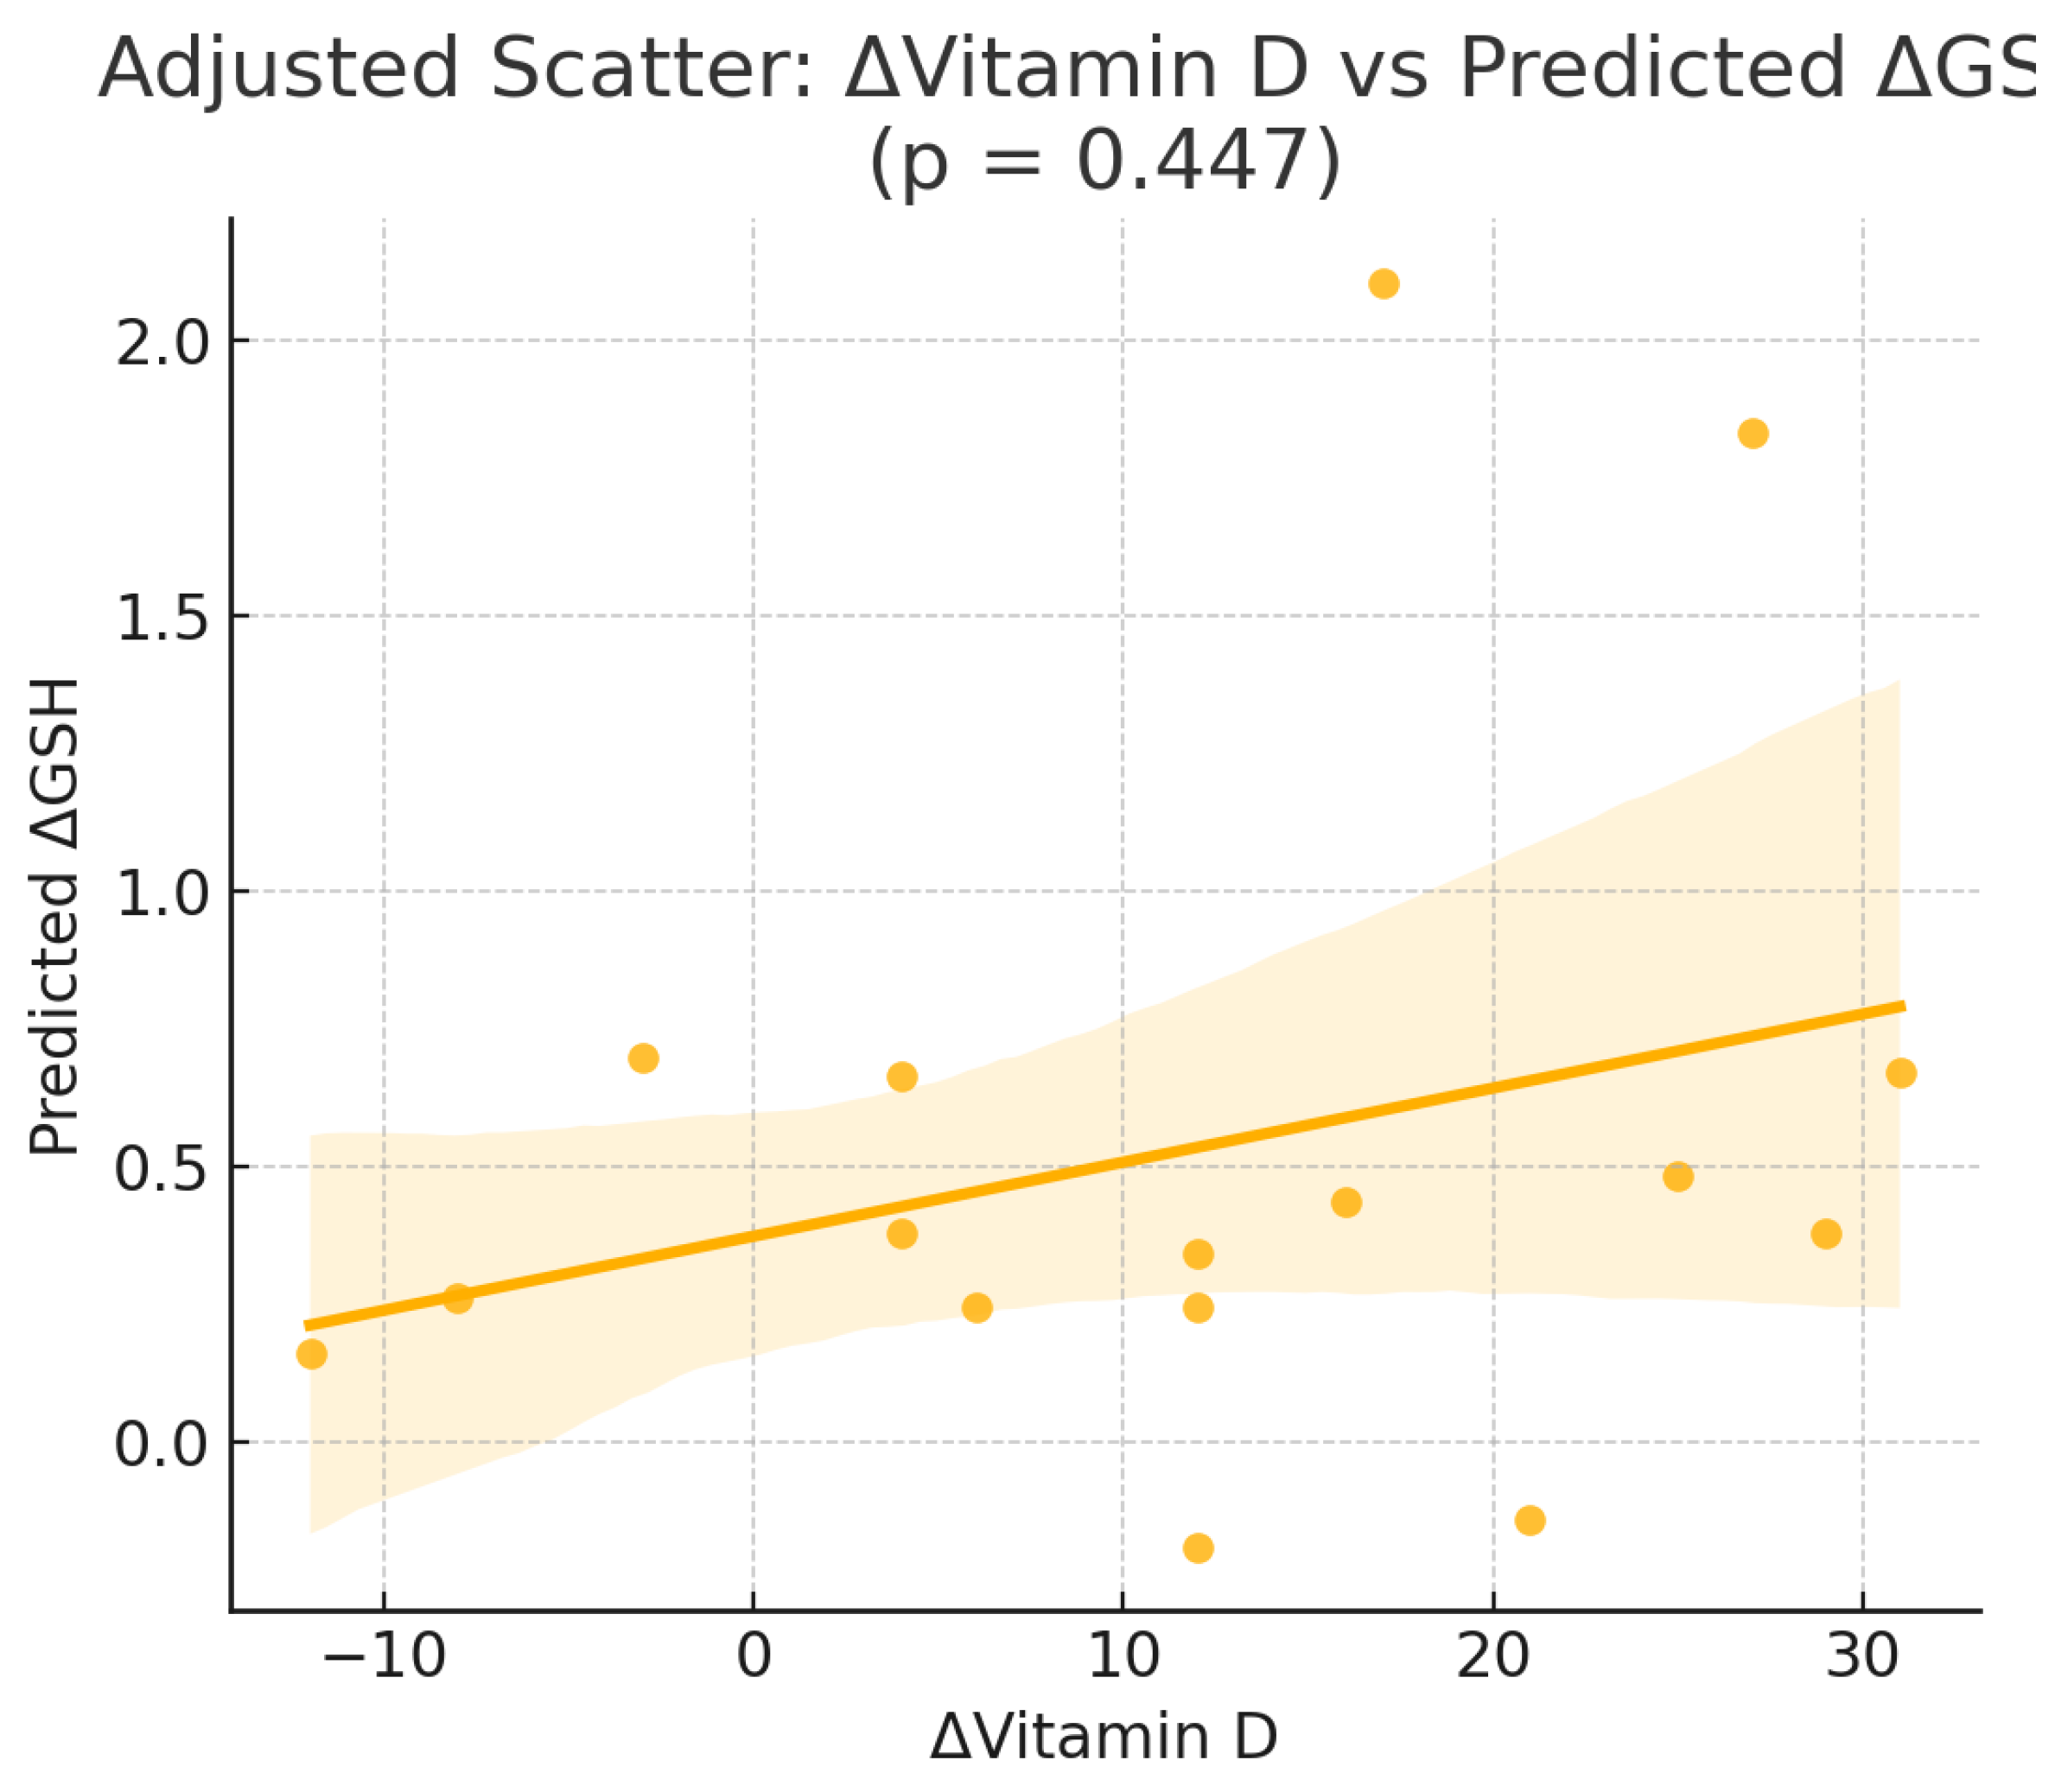
Figure 2.
Scatterplot of the change in serum 25-hydroxyvitamin D [Δ25(OH)D] versus the change in thiobarbituric acid reactive substances (ΔTBARS) in the intervention group (Orthodox nuns). (r = −0.116, p = 0.657).
Figure 2.
Scatterplot of the change in serum 25-hydroxyvitamin D [Δ25(OH)D] versus the change in thiobarbituric acid reactive substances (ΔTBARS) in the intervention group (Orthodox nuns). (r = −0.116, p = 0.657).
10. Discussion
Vitamin D is a multi-potent factor initially considered as a vitamin, but gradually recognized as a hormone affecting multiple states of the body, apart from skeletal effects. Vitamin D exerts various roles on metabolic parameters, as well as oxidative stress, whose reduction is beneficial on endothelial and cardiac function [33,34,35].
When the body’s oxidative processes outweigh its antioxidant defenses, which should normally be in balance, oxidative stress causes cellular damage through the activity of reactive oxygen species (ROS). Glutathione peroxidase, superoxide dismutase, and other vitamins, including vitamin D, are all part of the antioxidant defense system. In particular, vitamin D has anti-oxidant properties by positively regulating superoxide dismutase and glutathione in cells [2].
Recent research has also focused on TRE and its possible positive impacts on cardiometabolic health. A calorie-restricting diet and an intermittent-fasting diet, which limits feeding times during specific hours, have different levels of metabolic and stress hormones [10]. Measurements of inflammation, oxidative stress, and cardiometabolic health hormones and cytokines (insulin, ghrelin, leptin, glucagon, adiponectin, resistin, advanced glycated-end products (AGE), advanced oxidation protein products, total ni-trite-nitrate levels, tumor necrosis factor-α, interleukin (IL)-6, IL-8, and IL-10) were made in order to examine the effects of intermittent fasting and demonstrated that feeding under time restriction led to notable decreases in AGEs (approximately 25%) and advanced oxidation protein products (approximately 31%) [25].The findings of this current study demonstrate that short-term vitamin D supplementation in Orthodox nuns adhering to religious fasting patterns had no effects in improving oxidative status under COF compared to TRE,with an exception of a potential subtle effect on TBARS concentrations. These results suggest a neutral effect of vitamin D on oxidative stress markers in a unique population adhering to restrictive dietary and lifestyle regimens.
TBARS levels, which reflect lipid peroxidation and serve as a general index of oxidative stress [36,37], decreased significantly following vitamin D supplementation. This finding aligns with previous studies showing antioxidant effects of vitamin D through mechanisms that suppress reactive oxygen species [38,39] and downregulate pro-oxidant enzymes such as NADPH oxidase [40,41].
Multivariable regression analysis revealed that the change in TBARS was independently associated with vitamin D supplementation, even after controlling for age, weight, fat percentage, and baseline vitamin D status, indicating a potential mechanistic link.Interestingly, our subgroup analysis found no differential response in oxidative stress markers based on baseline vitamin D status (<20 ng/mL vs. ≥20 ng/mL). This suggests that the antioxidative effects of vitamin D may occur regardless of deficiency thresholds and supports its pleiotropic action across a range of vitamin D levels.Furthermore, no significant changes were observed in the control group, supporting the conclusion that observed shifts in oxidative stress biomarkers are attributable to the supplementation rather than time of feeding or fasting alone. In addition,this pilot study provides evidence for the effects of TRE for 16-weeks,demonstrating no effects on oxidative equilibrium. It is important to note that participants in the intervention group also experienced reductions in body weight and fat mass, which are known as crucial modulators of oxidative stress [45,46].
While these findings are promising, limitations should be acknowledged. The relatively small sample size may limit statistical power for subgroup or interaction effects. Moreover, the study was not randomized, and although both groups followed structured fasting protocols, residual confounding may persist.
Oxidative stress biomarkers used provide only a partial picture of the redox system, and further studies should explore additional markers such as catalase, superoxide dismutase, or 8-isoprostane [47,48].An additional limitation of the present study is the relatively short intervention period of 16 weeks, which may not have been sufficient to capture the full extent of potential changes in oxidative stress biomarkers, particularly for parameters that respond more slowly to nutritional interventions. Furthermore, the study population consisted exclusively of middle-aged women adhering to specific religious dietary practices, which may limit the generalizability of the findings to other populations with different lifestyles, age ranges, or health statuses. Lastly, the lack of dietary intake assessment for antioxidant-rich foods or other supplements prevents us from fully accounting for potential dietary confounders that could have influenced oxidative stress outcomes.
In conclusion, the findings of the present study indicate that 16 weeks of vitamin D supplementation in women following an Orthodox religious fasting regimen had an overall neutral effect on oxidative stress markers. Although a small but statistically significant reduction in TBARS levels was observed, the other markers (TAC, GSH) showed no significant changes. Multivariable regression analysis did not identify the change in vitamin D status as an independent predictor of oxidative stress marker variation, while reductions in TBARS were mainly associated with changes in body weight and body fat percentage.
Overall, these results suggest that the impact of vitamin D supplementation on the oxidative profile of this specific population is limited and potentially secondary to body composition changes. Future studies with larger sample sizes and a broader panel of biomarkers are warranted to further explore the potential antioxidant properties of vitamin D in conjunction with different dietary patterns.
References
- Jacquillet, G.; Unwin, R.J. Physiological regulation of phosphate by vitamin D, parathyroid hormone (PTH) and phosphate (Pi). Pfl?gers Arch. Eur. J. Physiol. 2018, 471, 83–98. [Google Scholar] [CrossRef]
- Renke, G.; Starling-Soares, B.; Baesso, T.; Petronio, R.; Aguiar, D.; Paes, R. Effects of Vitamin D on Cardiovascular Risk and Oxidative Stress. Nutrients 2023, 15, 769. [Google Scholar] [CrossRef]
- Karras, S.N.; Michalakis, K.; Tekos, F.; Skaperda, Z.; Vardakas, P.; Ziakas, P.D.; Kypraiou, M.; Anemoulis, M.; Vlastos, A.; Tzimagiorgis, G.; et al. Effects of Religious Fasting on Markers of Oxidative Status in Vitamin D-Deficient and Overweight Orthodox Nuns versus Implementation of Time-Restricted Eating in Lay Women from Central and Northern Greece. Nutrients 2024, 16, 3300. [Google Scholar] [CrossRef]
- Giaginis, C.; Mantzorou, M.; Papadopoulou, S.K.; Gialeli, M.; Troumbis, A.Y.; Vasios, G.K. Christian Orthodox Fasting as a Traditional Diet with Low Content of Refined Carbohydrates That Promotes Human Health: A Review of the Current Clinical Evidence. Nutrients 2023, 15, 1225. [Google Scholar] [CrossRef] [PubMed]
- Kokkinopoulou, A.; Rodopaios, N.E.; Koulouri, A.-A.; Vasara, E.; Papadopoulou, S.K.; Skepastianos, P.; Dermitzakis, E.; Hassapidou, M.; Kafatos, A.G. Impact of Christian Orthodox Church Fasting on Metabolic Syndrome Components in Adults Aged 18–49 Years. Nutrients 2023, 15, 1755. [Google Scholar] [CrossRef] [PubMed]
- Cheng, W.; Desmet, L.; Depoortere, I. Time-restricted eating for chronodisruption-related chronic diseases. Acta Physiol. 2023, 239, e14027. [Google Scholar] [CrossRef] [PubMed]
- Gabel, K.; Cienfuegos, S.; Kalam, F.; Ezpeleta, M.; Varady, K.A. Time-Restricted Eating to Improve Cardiovascular Health. Curr. Atheroscler. Rep. 2021, 23, 1–9. [Google Scholar] [CrossRef]
- Trabelsi K, Ammar A, Boujelbane MA, Puce L, Garbarino S, Scoditti E, Boukhris O, Khanfir S, Clark CCT, Glenn JM, Alhaj OA, Jahrami H, Chtourou H, Bragazzi NL. Religious fasting and its impacts on individual, public, and planetary health: Fasting as a "religious health asset" for a healthier, more equitable, and sustainable society. Front Nutr. 2022 Nov 24;9:1036496.
- Wang, X.; Li, Q.; Liu, Y.; Jiang, H.; Chen, W. Intermittent fasting versus continuous energy-restricted diet for patients with type 2 diabetes mellitus and metabolic syndrome for glycemic control: A systematic review and meta-analysis of randomized controlled trials. Diabetes Res. Clin. Pr. 2021, 179, 109003. [Google Scholar] [CrossRef]
- Karras, S.N.; Michalakis, K.; Kypraiou, M.; Vlastos, A.; Anemoulis, M.; Koukoulis, G.; Mouslech, Z.; Talidis, F.; Haitoglou, C.; Michos, G.; et al. Predictors of Vitamin D Status in Religious and Intermittent Fasting: A Comparative Study in Orthodox Nuns and Women from the General Population. Nutrients 2025, 17, 1656. [Google Scholar] [CrossRef]
- Ignacio-Mejía, I.; Bandala, C.; González-Zamora, J.F.; Chavez-Galan, L.; Buendia-Roldan, I.; Pérez-Torres, K.; Rodríguez-Díaz, M.Z.; Pacheco-Tobón, D.X.; Quintero-Fabián, S.; Vargas-Hernández, M.A.; et al. Association of Vitamin D Supplementation with Glutathione Peroxidase (GPx) Activity, Interleukine-6 (IL-6) Levels, and Anxiety and Depression Scores in Patients with Post-COVID-19 Condition. Int. J. Mol. Sci. 2025, 26, 4582. [Google Scholar] [CrossRef]
- Ai, J.; Yin, Z.; Gao, J.; Wang, W.; Lu, F.; Qin, H.-M.; Mao, S. Redesigning CYP109E1 for Improving Catalytic Performance in 25-Hydroxyvitamin D3 Synthesis Through Synergistic Enhancement of Electron Transfer and NADPH Regeneration. ACS Synth. Biol. 2025, 14, 1240–1249. [Google Scholar] [CrossRef] [PubMed]
- McAllister, M.J.; Gonzalez, A.E.; Waldman, H.S. Impact of Time Restricted Feeding on Markers of Cardiometabolic Health and Oxidative Stress in Resistance-Trained Firefighters. J. Strength Cond. Res. 2020, 36, 2515–2522. [Google Scholar] [CrossRef] [PubMed]
- Liu, Y. , Hyde A.S., Simpson M.A., Barycki J.J. Emerging regulatory paradigms in glutathione metabolism. Adv. Cancer Res. 2014;122:69–101.
- Karras, S.N.; Persynaki, A.; Petróczi, A.; Barkans, E.; Mulrooney, H.; Kypraiou, M.; Tzotzas, T.; Tziomalos, K.; Kotsa, K.; A Tsioudas, A.; et al. Health benefits and consequences of the Eastern Orthodox fasting in monks of Mount Athos: a cross-sectional study. Eur. J. Clin. Nutr. 2017, 71, 743–749. [Google Scholar] [CrossRef] [PubMed]
- Karras, S.N.; Koufakis, T.; Adamidou, L.; Dimakopoulos, G.; Karalazou, P.; Thisiadou, K.; Zebekakis, P.; Makedou, K.; Kotsa, K. Different patterns of changes in free 25-hydroxyvitamin D concentrations during intermittent fasting among meat eaters and non-meat eaters and correlations with amino acid intake. Int. J. Food Sci. Nutr. 2023, 74, 257–267. [Google Scholar] [CrossRef]
- Karras, S.N.; Koufakis, T.; Popovic, D.S.; Adamidou, L.; Karalazou, P.; Thisiadou, K.; Zebekakis, P.; Makedou, K.; Kotsa, K. A Mediterranean Eating Pattern Combining Energy and Time-Restricted Eating Improves Vaspin and Omentin Concentrations Compared to Intermittent Fasting in Overweight Individuals. Nutrients 2023, 15, 5058. [Google Scholar] [CrossRef]
- Karras, S.N.; Koufakis, T.; Dimakopoulos, G.; Popovic, D.S.; Kotsa, K. Changes in dietary intake of aspartic acid during and after intermittent fasting correlate with an improvement in fasting glucose in overweight individuals. J. Diabetes 2023, 15, 181–184. [Google Scholar] [CrossRef]
- Trepanowski, J.F.; Bloomer, R.J. The impact of religious fasting on human health. Nutr. J. 2010, 9, 57–57. [Google Scholar] [CrossRef]
- Sarri, K.O.; Linardakis, M.K.; Bervanaki, F.N.; Tzanakis, N.E.; Kafatos, A.G. Greek Orthodox fasting rituals: a hidden characteristic of the Mediterranean diet of Crete. Br. J. Nutr. 2004, 92, 277–284. [Google Scholar] [CrossRef]
- Sarri, K.; E Tzanakis, N.; Linardakis, M.K.; Mamalakis, G.D.; Kafatos, A.G. Effects of Greek orthodox christian church fasting on serum lipids and obesity. BMC Public Heal. 2003, 3, 16–16. [Google Scholar] [CrossRef]
- Sarri, K.; Linardakis, M.; Codrington, C.; Kafatos, A. Does the periodic vegetarianism of Greek Orthodox Christians benefit blood pressure? Prev. Med. 2007, 44, 341–348. [Google Scholar] [CrossRef]
- Greek National Dietary Guidelines for Adults. []. Available online: http://www.fao. (accessed on 25 July 2024).
- Jensen, M.D. , Ryan D.H., Apovian C.M., Ard J.D., Comuzzie A.G., Donato K.A., Hu F.B., Hubbard V.S., Jakicic J.M., Kushner R.F., et al. 2013 AHA/ACC/TOS guideline for the management of overweight and obesity in adults: A report of the American College of Cardiology/American Heart Association Task Force on Practice Guidelines and The Obesity Society. Circulation. 2014;129:S102–S138.
- Karras, S.N.; Koufakis, T.; Petróczi, A.; Folkerts, D.; Kypraiou, M.; Mulrooney, H.; Naughton, D.P.; Persynaki, A.; Zebekakis, P.; Skoutas, D.; et al. Christian Orthodox fasting in practice: A comparative evaluation between Greek Orthodox general population fasters and Athonian monks. Nutrition 2019, 59, 69–76. [Google Scholar] [CrossRef]
- WHO Global Database on Body Mass Index. Available online: https://www.who.int/data/gho/data/themes/topics/topic-details/GHO/body-mass-index. (accessed on 5 February 2016).
- Tanita Academy Understanding Your Measurements. Available online: http://tanita.eu/. (accessed on 25 May 2018).
- Matthews, D.R. , Hosker J.P., Rudenski A.S., Naylor B.A., Treacher D.F., Turner R.C. Homeostasis model assessment: Insulin resistance and b-cell function from fasting plasma glucose and insulin concentrations in man. Diabetologia. 1985;28:412–419.
- Reddy, Y. , Murthy S., Krishna D., Prabhakar M.C. Role of Free Radicals and Antioxidants in Tuberculosis Patients. Indian J.Tuberc. 2004;51:213–218.
- Veskoukis, A.S. , Kyparos A., Paschalis V., Nikolaidis M.G. Spectrophotometric assays for measuring redox biomarkers in blood. Biomarkers. 2016;21:208–217.
- Janaszewska, A. , Bartosz G. Assay of Total Antioxidant Capacity: Comparison of Four Methods as Applied to Human Blood Plasma. Scand. J. Clin. Lab. Investig. 2002;62:231–236.
- Keles, M. , Taysi S., Sen N., Aksoy H., Akçay F. Effect of Corticosteroid Therapy on Serum and CSF Malondialdehyde and Antioxidant Proteins in Multiple Sclerosis. Can. J. Neurol. Sci. 2001;28:141–143.
- Rasouli N, Brodsky IG, Chatterjee R, Kim SH, Pratley RE, Staten MA, Pittas AG; D2d Research Group. Effects of Vitamin D Supplementation on Insulin Sensitivity and Secretion in Prediabetes. J Clin Endocrinol Metab. 2022 Jan 1;107(1):230-240.
- Pusceddu, I.; Farrell, C.-J.L.; Di Pierro, A.M.; Jani, E.; Herrmann, W.; Herrmann, M. The role of telomeres and vitamin D in cellular aging and age-related diseases. cclm 2015, 53, 1661–1678. [Google Scholar] [CrossRef]
- Wimalawansa, SJ. Vitamin D Deficiency: Effects on Oxidative Stress, Epigenetics, Gene Regulation, and Aging. Biology (Basel). 2019 ;8(2):30. 11 May.
- De Leon, J.A.D.; Borges, C.R. Evaluation of Oxidative Stress in Biological Samples Using the Thiobarbituric Acid Reactive Substances Assay. J. Vis. Exp. 2020, e61122. [Google Scholar] [CrossRef]
- Oyeleye IS, Bolarinde AA, Ademiluyi AO, Oboh G, Ojo OR. Bitter Leaf (Vernonia amygdalina) and Siam Weed (Chromolaena odorata) Aqueous Extracts Alleviate Testicular Damage Induced by Plasmodium berghei in Male Mice via Modulation of Oxidative Stress Pathways. J Ethnopharmacol. 2025 Jul 24:120326.
- Zhou, Y.; Liao, Q.; Li, D.; Chen, L.; Zhang, H.; Yi, B. Vitamin D receptor alleviates lipid peroxidation in diabetic nephropathy by regulating ACLY/Nrf2/Keap1 pathway. FASEB J. 2024, 38, e70060. [Google Scholar] [CrossRef]
- Zhan D, Zhao J, Shi Q, Lou J, Wang W. 25-hydroxyvitamin D3 inhibits oxidative stress and ferroptosis in retinal microvascular endothelial cells induced by high glucose through down-regulation of miR-93. BMC Ophthalmol. 2023 Jan 13;23(1):22.
- Liu C, Zhu R, Liu H, Li L, Chen B, Jia Q, Wang L, Ma R, Tian S, Wang M, Fu M, Niu J, Orekhov AN, Gao S, Zhang D, Zhao B. Aqueous Extract of Mori Folium Exerts Bone Protective Effect Through Regulation of Calcium and Redox Homeostasis via PTH/VDR/CaBP and AGEs/RAGE/Nox4/NF-κB Signaling in Diabetic Rats. Front Pharmacol. 2018 Nov 6;9:1239.
- Cui, C.; Song, S.; Cui, J.; Feng, Y.; Gao, J.; Jiang, P.; Fernández-López, A. Vitamin D Receptor Activation Influences NADPH Oxidase (NOX2) Activity and Protects against Neurological Deficits and Apoptosis in a Rat Model of Traumatic Brain Injury. Oxidative Med. Cell. Longev. 2017, 2017, 9245702. [Google Scholar] [CrossRef]
- Mackei M, Huber F, Oláh B, Neogrády Z, Mátis G. Redox metabolic disruptions in the honey bee brain following acute exposure to the pyrethroid deltamethrin. Sci Rep. 2025 Aug 3;15(1):28322.
- Uzun L, Kutlu R, Ataseven A, Aydemir FHY. Total oxidant capacity, total antioxidant capacity, ischemic modified albumin, microRNA levels, and their relationship with psoriasis area and severity index. Indian J Dermatol Venereol Leprol. 2023 Jul-Aug;89(4):501-509.
- Brighenti F, Valtueña S, Pellegrini N, Ardigò D, Del Rio D, Salvatore S, Piatti P, Serafini M, Zavaroni I. Total antioxidant capacity of the diet is inversely and independently related to plasma concentration of high-sensitivity C-reactive protein in adult Italian subjects. Br J Nutr. 2005 May;93(5):619-25.
- Márquez Álvarez CM, Hernández-Cruz EY, Pedraza-Chaverri J. Oxidative stress in animal models of obesity caused by hypercaloric diets: A systematic review. Life Sci. 2023 Oct 15;331:122019.
- Cui X, Xiao W, You L, Zhang F, Cao X, Feng J, Shen D, Li Y, Wang Y, Ji C, Guo X. Age-induced oxidative stress impairs adipogenesis and thermogenesis in brown fat. FEBS J. 2019 Jul;286(14):2753-2768.
- Kolusari A, Kurdoglu M, Yildizhan R, Adali E, Edirne T, Cebi A, Demir H, Yoruk IH. Catalase activity, serum trace element and heavy metal concentrations, and vitamin A, D and E levels in pre-eclampsia. J Int Med Res. 2008 Nov-Dec;36(6):1335-41.
- Dahiri B, Hinojosa MG, Carbonero-Aguilar P, Cerrillos L, Ostos R, Bautista J, Moreno I. Assessment of the oxidative status in mother-child couples from Seville (Spain): A prospective cohort study. Free Radic Biol Med. 2023 Oct;207:308-319.
Table 2.
Pearson correlation coefficients between changes in serum 25-hydroxy-vitamin D (ΔVitamin D) and changes in oxidative stress markers (ΔTAC, ΔGSH, ΔTBARS) following vitamin D supplementation in Orthodox nuns.
Table 2.
Pearson correlation coefficients between changes in serum 25-hydroxy-vitamin D (ΔVitamin D) and changes in oxidative stress markers (ΔTAC, ΔGSH, ΔTBARS) following vitamin D supplementation in Orthodox nuns.
| Outcome | Pearson r | 95% CI | p-Value |
|---|---|---|---|
| TAC | -0.244 | -0.58 to 0.237 | 0.3463 |
| GSH | 0.11 | -0.435 to 0.64 | 0.6748 |
| TBARS | -0.116 | -0.535 to 0.318 | 0.6572 |
Table 3.
Multivariable linear regression models predicting changes in oxidative stress markers (Δ_TAC, Δ_GSH, Δ_TBARS) based on ΔVitamin D, adjusted for age, weight, body fat percentage, and baseline 25(OH)D. Each row displays the coefficient (β), standard error, and p-value for each predictor.
Table 3.
Multivariable linear regression models predicting changes in oxidative stress markers (Δ_TAC, Δ_GSH, Δ_TBARS) based on ΔVitamin D, adjusted for age, weight, body fat percentage, and baseline 25(OH)D. Each row displays the coefficient (β), standard error, and p-value for each predictor.
| Outcome | Variable | Coef. | Std.Err. | P-Value |
|---|---|---|---|---|
| ΔGSH | const | -1.11 | 4.58 | 0.814 |
| ΔGSH | ΔVitD | 0.05 | 0.06 | 0.447 |
| ΔGSH | AGE (y) | 0.01 | 0.05 | 0.866 |
| ΔGSH | WEIGHT (kg) | -0.0 | 0.06 | 0.948 |
| ΔGSH | BODY FAT % | -0.02 | 0.11 | 0.856 |
| ΔGSH | 25(OH)-D3 (ng/mL) | 0.06 | 0.07 | 0.375 |
| ΔTBARS | const | -1.18 | 1.89 | 0.548 |
| ΔTBARS | ΔVitD | -0.05 | 0.03 | 0.108 |
| ΔTBARS | AGE (y) | 0.03 | 0.02 | 0.128 |
| ΔTBARS | WEIGHT (kg) | 0.08 | 0.02 | **0.011** |
| ΔTBARS | BODY FAT % | -0.13 | 0.05 | **0.014** |
| ΔTBARS | 25(OH)-D3 (ng/mL) | -0.03 | 0.03 | 0.246 |
| ΔTAC | const | -0.21 | 0.11 | 0.087 |
| ΔTAC | ΔVitD | 0.0 | 0.0 | 0.991 |
| ΔTAC | AGE (y) | 0.0 | 0.0 | 0.107 |
| ΔTAC | WEIGHT (kg) | 0.0 | 0.0 | 0.244 |
| ΔTAC | BODY FAT % | -0.0 | 0.0 | 0.999 |
| ΔTAC | 25(OH)-D3 (ng/mL) | 0.0 | 0.0 | 0.966 |
Disclaimer/Publisher’s Note: The statements, opinions and data contained in all publications are solely those of the individual author(s) and contributor(s) and not of MDPI and/or the editor(s). MDPI and/or the editor(s) disclaim responsibility for any injury to people or property resulting from any ideas, methods, instructions or products referred to in the content. |
© 2025 by the authors. Licensee MDPI, Basel, Switzerland. This article is an open access article distributed under the terms and conditions of the Creative Commons Attribution (CC BY) license (http://creativecommons.org/licenses/by/4.0/).
Copyright: This open access article is published under a Creative Commons CC BY 4.0 license, which permit the free download, distribution, and reuse, provided that the author and preprint are cited in any reuse.


