
Submitted:
20 May 2025
Posted:
20 May 2025
You are already at the latest version
Abstract
Background: Oxidative stress is a key driver of aging and metabolic dysfunction, modulated by diet, lifestyle, and body composition. While structured dietary practices such as intermittent fasting and plant-based regimens have demonstrated antioxidative benefits, the biological impact of long-term religious fasting remains underexplored. Orthodox Christian fasting, characterized by periodic abstention from animal products and alignment with circadian rhythms, offers a unique naturalistic model for examining redox adaptation in humans. Objective:To evaluate predictors of oxidative stress markers in Orthodox Christian monastic women compared to age-matched controls, focusing on the roles of adiposity, insulin, vitamin D status, and age. Methods: In this cross-sectional study, 52 Orthodox nuns and 56 women from the general population were assessed. Serum levels of total antioxidant capacity (TAC), reduced glutathione (GSH), and thiobarbituric acid reactive substances (TBARS) were measured. Anthropometric indices (BMI, body fat percentage, visceral fat), fasting insulin, 25-hydroxyvitamin D [25(OH)D], and age were recorded. Statistical analyses included group comparisons, Spearman correlations, and multivariable linear regression models. Results: In the monastic group, body fat percentage (beta coefficient = 0.387, p = 0.003) and age (beta coefficient = 0.301, p = 0.014) independently predicted TAC, accounting for 28% of its variance. Among controls, insulin positively correlated with GSH (ρ = 0.480, p = 0.0035) and marginally inversely with TAC (ρ = -0.321, p = 0.060). No significant associations were found between 25(OH)D and oxidative markers in either group. Conclusions: Orthodox monastic fasting is associated with enhanced antioxidant capacity and reduced lipid peroxidation, independent of vitamin D or insulin levels. These findings highlight the potential of long-term, culturally structured fasting to modulate redox homeostasis and suggest a complex interplay between age, adiposity, and antioxidant defenses. Further research is needed to elucidate underlying mechanisms and long-term clinical implications.
Keywords:
oxidative stress
; religious fasting
; monastic lifestyle
; total antioxidant status
; glutathione
; insulin
; body fat
; tbars
1. Introduction
Oxidative stress, resulting from an imbalance between the generation of reactive oxygen species (ROS) and the body’s antioxidant defenses, is a well-established factor in the pathogenesis of cardiovascular disease, insulin resistance, and age-related disorders [1,2,3]. Dietary practices and lifestyle interventions that modulate oxidative stress are increasingly being studied as non-pharmacological strategies for enhancing metabolic health and delaying aging-related decline [4].
Religious fasting, particularly within the Orthodox Christian tradition, represents a unique long-term dietary model characterized by periodic abstention from animal products, limited caloric intake, and simplified meal structure for over 180 days annually [5]. In monastic populations, fasting is practiced consistently throughout adulthood, often accompanied by reduced exposure to environmental toxins, lower psychosocial stress, and enhanced physical routine, making them an ideal model to examine metabolic adaptation to sustained dietary restriction [6,7].
Prior evidence suggests that intermittent fasting and plant-based diets may improve antioxidant capacity and reduce oxidative biomarkers [8,9]. However, the mechanistic relationship between religious fasting and oxidative status in real-life human cohorts remains underexplored. Most studies to date have focused on short-term interventions or surrogate metabolic endpoints, with limited data on validated oxidative biomarkers such as total antioxidant capacity (TAC), reduced glutathione (GSH), and lipid peroxidation by-products (TBARS) [10,11,12]. Body composition is an important determinant of oxidative balance. Adipose tissue, particularly visceral fat, is metabolically active and contributes to low-grade inflammation and excess ROS production [13,14]. At the same time, physiological factors such as age and insulin resistance may independently modulate antioxidant defenses, either through mitochondrial dysfunction or impaired enzymatic detoxification pathways [15,16]. Vitamin D, via its nuclear receptor (VDR), has also been implicated in the transcriptional regulation of antioxidant enzymes such as glutathione peroxidase and superoxide dismutase. However, data regarding the impact of vitamin D status on oxidative biomarkers remain inconsistent, especially in populations with modified dietary patterns [17,18]. The interplay between vitamin D, insulin, and adiposity in influencing oxidative stress is still poorly understood in the context of long-term religious fasting.
We have recently described, that both Orthodox religious fasting and intermittent fasting practiced by the general population, exert beneficial effects on oxidative equilibrium [10], however evidence on the potential bio regulators in monastic and lay populations, remain scarce. In this context, the current study aimed to investigate oxidative stress markers and their physiological determinants in a real-world model of prolonged Orthodox fasting. We hypothesized that women following the monastic lifestyle would exhibit improved oxidative profiles compared to controls, and that factors such as body composition, insulin, and 25(OH)D levels would differentially predict oxidative stress across groups.
2. Materials and Methods
2.1. Study Design and Participants
This was a cross-sectional, observational study conducted between [insert months/year] in Northern Greece. A total of 108 adult women were enrolled, consisting of 52 Orthodox Christian nuns and 56 age-matched women from the general population, serving as controls. Inclusion criteria for both groups were: female sex, age 30–75 years, and absence of chronic systemic illness or current use of antioxidant supplements. Participants with known endocrine disorders (e.g., thyroid dysfunction, diabetes mellitus), autoimmune disease, or recent acute infection were excluded. Monastic participants were recruited from two female Orthodox convents in the region, all of whom had practiced the traditional fasting regimen continuously for more than 15 years. Control women were recruited through community outreach, matched for age but not for BMI or body composition, to reflect real-world differences.
2.2. Anthropometric and Biochemical Assessments
Both study groups underwent systematic evaluation of anthropometric parameters and laboratory indices, using uniform and validated protocols. Details regarding instruments, calibration, and protocols have been extensively documented in prior publications [8,9,10,11]. Briefly, body weight was measured to the nearest 10 grams with a certified electronic scale (K-Tron P1-SR, Onrion LLC, USA), with participants in light clothing and without footwear. Body mass index (BMI) was derived as weight divided by squared height (kg/m2). Body composition metrics—including fat mass and percentage, visceral adiposity, skeletal muscle, lean mass, and total body water—were quantified using bioelectrical impedance analysis (BIA) via the SC-330 S model (Tanita Corp., Tokyo, Japan). Venous blood was collected after a 12-hour overnight fast, and samples were stored at −20 °C until analysis.
All samples were centrifuged and frozen immediately, except whole blood samples which were processed fresh. Biochemical assays included serum calcium, which was quantified with the COBAS8000 autoanalyzer (Roche Diagnostics, Germany), while parathyroid hormone (PTH) and 25-hydroxyvitamin D [25(OH)D] were measured using electrochemiluminescence immunoassays on the COBAS e 602 platform (Roche Diagnostics). The analytical performance (inter- and intra-assay CVs) and clinical reference intervals were: Ca: 8.4–10.2 mg/dL (CVs: 0.8–1.3% and 0.5–1.3%), PTH: 15–65 pg/mL (1.6–6.9 pmol/L; CVs: 1.1–2.0% and 2.5–3.4%), and 25(OH)D: ≥30 ng/mL (CVs: 2.2–6.8% and 3.4–13.1%). Insulin resistance was assessed via the HOMA-IR formula: fasting insulin (µU/mL) × fasting glucose (mmol/L) ÷ 22.5 [28].
2.3. Oxidative Stress Biomarkers
2.3.1. Measurement of Reduced Glutathione (GSH) in Erythrocytes
GSH levels were determined following the method previously described [11]. A volume of 400 µL of erythrocyte lysate was mixed with an equal volume of 5% trichloroacetic acid (TCA) and centrifuged (1500×g, 5 min, 5 °C). The supernatant was further processed with TCA and incubated in the dark for 45 minutes. Absorbance was read at 412 nm, and concentrations were derived using the molar extinction coefficient for TNB (13.6 L/mmol/cm).
2.3.2. Total Antioxidant Capacity (TAC)
Plasma TAC was assessed using the DPPH radical scavenging assay, as described [11]. Specifically, 20 µL of plasma was diluted in phosphate buffer (10 mM, pH 7.4), followed by the addition of 0.1 mM DPPH solution. After incubation for one hour at room temperature in the dark, absorbance was measured at 520 nm. TAC values were expressed in terms of DPPH reduction equivalents.
2.3.3. TBARS (Thiobarbituric Acid Reactive Substances)
Lipid peroxidation was estimated via TBARS using a modified protocol [11. Each 100 µL plasma sample was mixed with Tris-HCl buffer and TCA, followed by addition of sodium sulfate and thiobarbituric acid. After heating at 95 °C for 45 minutes in a water bath, samples were centrifuged and read at 530 nm. The MDA concentration was calculated using its known molar extinction coefficient (156,000 L/mol/cm).
2.4. Ethical Compliance
The study protocol adhered to the principles set forth in the Declaration of Helsinki. All participants provided written informed consent. Approval for the inclusion of the monastic cohort was obtained in writing from the central ecclesiastical authority following submission of the full study documentation one year prior to study initiation. The study protocol was approved by the Institutional Review Board of Aristotle University of Thessaloniki, Greece, (Approval No.25224/2019).
2.5. Statistical Analysis
Data distribution was assessed using the Shapiro–Wilk test. Continuous variables are presented as mean ± standard deviation (SD) or median (interquartile range), depending on normality. Categorical variables are shown as counts and percentages.
Group comparisons were performed using Student’s t-test or Mann–Whitney U test for continuous variables, and chi-square test for categorical data. Multivariable linear regression models were constructed for each oxidative stress marker, adjusted for age, body fat percentage, visceral fat, and either insulin or 25(OH)D depending on the model. Adjusted R2 and standardized β-coefficients were reported. Spearman’s rank correlation coefficients were calculated to examine bivariate associations between oxidative stress markers (TAC, GSH, TBARS) and predictors including 25(OH)D, insulin, age, and adiposity indices. A p-value < 0.05 was considered statistically significant. Statistical analyses were performed using IBM SPSS Statistics v.25 (IBM Corp., Armonk, NY, USA).
3. Results
3.1. Predictors of Stress Markers
A total of 108 female participants were included in the analysis, comprising 52 women living in monastic communities and 56 from the general population. Multiple linear regression models were used to evaluate the influence of metabolic and demographic variables on oxidative stress biomarkers (TAC, GSH, TBARS) in each group. Figure 1 and Figure 2 present dot-whisker plots of the standardized regression coefficients along with their 95% confidence intervals, separately for the monastic (Figure 1) and control (Figure 2) groups. Significant predictors of total antioxidant capacity (TAC) included body fat percentage and age for Orthodox nuns. No statistically significant predictors were identified for the general population group.
3.2. Correlations Between Oxidative Stress Markers and Metabolic Parameters
Spearman correlations between oxidative stress markers and clinical parameters are detailed in Table 1 and Table 2. In the monastic group, TAC showed statistically significant positive correlations with body fat percentage (ρ = 0.387, p = 0.041), visceral fat (ρ = 0.317, p = 0.031), and age (ρ = 0.301, p = 0.014), but no association with 25(OH)D levels or insulin. Similarly, GSH levels were positively correlated with body fat percentage (ρ = 0.387, p = 0.041), visceral fat (ρ = 0.317, p = 0.031), and age (ρ = 0.301, p = 0.014) in the monastic group, mirroring the pattern observed for TAC. No significant association was observed between GSH and either 25(OH)D (ρ = 0.026, p = 0.729) or insulin (ρ = -0.112, p = 0.321). In contrast, TBARS did not demonstrate any significant correlations with any of the variables assessed (e.g., 25(OH)D: ρ = -0.038, p = 0.617; insulin: ρ = 0.041, p = 0.676). In the control group, the correlation pattern was somewhat different. A significant negative association was observed between TAC and age (ρ = -0.629, p = 0.0001), suggesting that antioxidant defenses decline with advancing age in non-fasting women. GSH showed a moderate but significant positive correlation with insulin levels (ρ = 0.480, p = 0.0035). No other statistically significant associations were observed for GSH or TBARS, and correlations with body fat percentage and visceral fat could not be assessed due to unavailability of these measurements in the control dataset.
3.3.Regression Analysis of Oxidative Stress Markers
Table 3 and Table 4, present the fit indices (R2 and adjusted R2) from multiple linear regression models assessing whether age, BMI, and serum 25(OH)D levels predict variability in oxidative stress markers (TAC, GSH, TBARS) in the monastic and control groups. For each outcome, two models were evaluated: a basic model including age and BMI, and an extended model with the addition of serum 25(OH)D.
In the monastic group (Table 3), none of the models demonstrated meaningful predictive power. All adjusted R2 values were negative or close to zero, indicating that neither age, BMI, nor vitamin D levels could adequately explain the variability in oxidative status among fasting individuals. For example, the extended model for TAC yielded R2 = 0.019 and Adj R2 = -0.067, while the GSH model showed similarly low values (R2 = 0.023, Adj R2 = -0.063). In contrast, the control group (Table 4) showed a more nuanced pattern. The GSH model that included age, BMI, body fat percentage, and visceral fat explained a modest proportion of variance (R2 = 0.157, Adj R2 = 0.055), but this was not improved by the inclusion of vitamin D concentrations. Models predicting TAC and TBARS in the control group, remained weak, with negative adjusted R2 values (e.g., TAC: R2 = 0.019, Adj R2 = -0.099), indicating poor fit.
3.4. Bivariate Associations Between Oxidative Stress and Metabolic Variables
Figure 3, Figure 4 and Figure 5, illustrate selected bivariate relationships between oxidative stress markers and key metabolic indicators, based on Spearman correlation analysis.
In the monastic group (Figure 3), a significant inverse correlation was observed between serum 25(OH)D concentrations and body fat percentage (ρ = -0.178, p = 0.018).In the control group, Figure 4 demonstrated a statistically significant positive association between insulin and GSH levels (ρ = 0.480, p = 0.0035). Figure 5 showed a borderline inverse correlation between insulin and TAC (ρ = -0.321, p = 0.060).
4. Discussion
This study examined oxidative stress status and its clinical determinants in Orthodox Christian women following long-term religious fasting, in comparison to age-matched women from the general population. We assessed three validated markers of redox balance—total antioxidant capacity (TAC), reduced glutathione (GSH), and lipid peroxidation (TBARS)—and explored their associations with age, insulin, 25(OH)D, and adiposity indices. Among the monastic participants, body fat percentage and age emerged as significant determinants of TAC, suggesting an adaptive antioxidant response potentially shaped by lifestyle and dietary patterns.
In contrast, insulin and 25(OH)D did not predict oxidative status in either group.
Our previous findings demonstrated that the monastic group exhibited significantly higher TAC and lower TBARS concentrations than controls, indicating a more favorable oxidative profile [11]. These differences are consistent with prior research suggesting that prolonged adherence to plant-based or calorically restricted diets may enhance endogenous antioxidant defenses and attenuate lipid peroxidation [19,20].
The fasting regimen observed by Orthodox monastics includes extended abstention from animal-derived foods, reduced caloric density, and natural circadian dietary rhythm—all factors implicated in oxidative modulation [21].
Interestingly, no significant differences were observed between groups in GSH levels or 25(OH)D status. This may reflect the combined influence of sunlight exposure, vitamin D intake variability, and antioxidant homeostasis mechanisms beyond glutathione recycling [22]. Despite prior hypotheses that 25(OH)D enhances redox control via nuclear factor erythroid 2–related factor 2 (Nrf2)-dependent pathways [22], our analysis did not identify vitamin D as an independent predictor of any oxidative stress marker in either group. This aligns with a growing body of literature showing conflicting associations between serum 25(OH)D and redox biomarkers in humans [23,24].
In multivariate models, we identified body fat percentage and age as significant positive predictors of TAC among monastics, with an adjusted R2 of 0.28. This observation appears paradoxical, as increased adiposity is generally associated with greater oxidative burden [25,26]. However, the specific composition and functionality of adipose tissue in long-term fasters may differ metabolically. Prior work has shown that non-obese individuals adhering to Mediterranean or ascetic dietary patterns may develop compensatory upregulation of antioxidant systems, including increased expression of catalase and superoxide dismutase [10]. Furthermore, mild lipid peroxidation may serve as a hormetic stimulus for antioxidant enzyme production [27], potentially explaining the enhanced TAC in older, slightly more adipose monastics. In contrast, in the control group, insulin levels were significantly positively correlated with GSH and marginally inversely with TAC. These findings reflect the known dual role of insulin in oxidative regulation. On one hand, insulin resistance promotes ROS generation through NADPH oxidase activation and mitochondrial overload [28]. On the other hand, insulin also upregulates the expression of glutathione synthetase and supports cysteine availability [29], which may explain the positive correlation between insulin and GSH observed in our study. Importantly, these associations were not retained in adjusted models, suggesting that insulin’s redox effects are confounded by underlying adiposity or age.
The absence of strong associations between oxidative stress markers and vitamin D levels in both groups further supports the notion that vitamin D may not act as a consistent predictor of redox status across populations. While in vitro studies suggest that vitamin D upregulates glutathione synthesis and inhibits pro-oxidant pathways [30], clinical trials have yielded inconsistent results [31]. A recent meta-analysis found only marginal effects of vitamin D supplementation on TAC and GSH, and no effect on TBARS [32]. Taken together, our results suggest that long-term adherence to Orthodox fasting may promote a more balanced oxidative status, independent of vitamin D or insulin levels. The role of body composition appears to be more complex than previously assumed, potentially modulated by dietary quality, inflammation, and mitochondrial function.
This highlights the need to go beyond simple BMI metrics in oxidative stress research and consider metabolic phenotyping of adipose tissue. Another consideration is the physiological role of TAC as an integrative measure of both enzymatic and non-enzymatic antioxidant defense. While elevated TAC is typically interpreted as beneficial, it may also reflect compensatory responses to subtle redox imbalances or subclinical inflammation [33]. This nuance is particularly relevant in monastic populations, where unique environmental exposures and long-term dietary patterns may upregulate antioxidant enzymes or increase the availability of dietary polyphenols and endogenous scavengers. Indeed, studies have demonstrated that plant-based fasting regimens are associated with increased plasma levels of polyphenols, vitamins C and E, and selenium—micronutrients contributing significantly to TAC [34]. Future studies should assess dietary antioxidant intake and relate it quantitatively to serum antioxidant potential. The absence of group differences in GSH concentrations contrasts with findings in studies of Ramadan fasting or intermittent energy restriction, where GSH levels often increase post-intervention [35,36]. One explanation may be that GSH homeostasis is tightly regulated under stable metabolic conditions, as seen in monastics, and may not fluctuate in response to chronic but balanced dietary restrictions. Moreover, GSH levels are sensitive to intracellular redox status, hepatic function, and sulfur amino acid availability—all of which may differ subtly between individuals despite similar body composition or insulin levels [37].
The borderline inverse correlation between insulin and TAC observed in the control group also warrants further discussion. This relationship may indicate early oxidative dysregulation in the context of mild insulin resistance. While not statistically significant after adjustment, such trends support existing literature linking hyperinsulinemia to impaired redox signaling, via inhibition of AMP-activated protein kinase (AMPK) and induction of ROS-producing enzymes [38,39]. It is plausible that in controls with higher visceral adiposity and lower metabolic flexibility, elevated insulin serves as a marker of systemic oxidative load. Furthermore, although visceral fat did not emerge as an independent predictor of oxidative markers in our models, it remains a well-established source of pro-inflammatory cytokines and oxidative mediators [40]. The lack of association in our cohort may reflect limited variance in visceral fat across groups or insufficient statistical power. Alternatively, the influence of visceral adiposity may be masked by overriding factors such as age and overall dietary pattern.
From a public health perspective, the findings of this study lend support to the hypothesis that sustained religious fasting, when practiced in a structured and culturally integrated way, may confer antioxidant benefits. Unlike short-term diets or commercial detox regimens, Orthodox fasting is embedded in the rhythm of daily life and practiced across decades. The biological implications of such long-term behavioral regularity—especially in relation to redox adaptation, metabolic resilience, and healthy aging—deserve further longitudinal investigation.
Finally, it is noteworthy that our findings parallel results from studies on calorie restriction and Mediterranean-style diets, both of which are characterized by low animal protein intake, high fiber, and an emphasis on plant-derived antioxidants [41]. Whether the benefits observed in monastic women stem primarily from caloric content, macronutrient balance, timing of meals, or psychosocial harmony remains to be clarified. Nonetheless, these data suggest that the monastic model may serve as a naturalistic framework for exploring sustainable dietary strategies to improve redox balance and possibly reduce long-term cardiometabolic risk.
Our study has several strengths, including the use of validated oxidative biomarkers, detailed body composition analysis, and comparison of a relatively homogeneous monastic population with real-world controls. To our knowledge, this is the first study to evaluate predictors of oxidative stress in Orthodox nuns using both bivariate and multivariate approaches. However, several limitations should be acknowledged. First, the cross-sectional design precludes causal inference. Second, dietary intake data were not quantified, preventing nutrient-level correlations. Third, the sample size, while adequate for primary comparisons, limits the detection of smaller interaction effects. Finally, we did not assess gene expression or enzymatic activity of antioxidant systems, which could offer mechanistic insights.
5. Conclusions
This study provides novel evidence that long-term adherence to Orthodox Christian fasting is associated with a more favorable oxidative stress profile, characterized by higher antioxidant capacity and reduced lipid peroxidation. These findings underscore the complexity of redox regulation in humans and support the potential health-promoting role of structured, culturally embedded fasting practices. Future longitudinal and mechanistic studies are warranted to explore the causal links between fasting, adiposity, and oxidative resilience. Future studies should aim to evaluate longitudinal changes in oxidative status in fasting populations, incorporate dietary assessment tools, and include functional assays such as glutathione peroxidase or SOD activity. The role of microbiota, circadian eating patterns, and physical activity in modulating redox balance during fasting also warrants exploration.
Author Contributions
Conceptualization, S.N.K. and M.A.; methodology, S.N.K., K.M. and M.K.; software, S.N.K.; validation, S.N.K., G.T., C.H., N.G., E.G.P., F.T., Z.S., D.K. and M.A.; formal analysis, N.G., K.M., M.K. and S.N.K..; investigation, S.N.K., A.V., Z.S., F.T., D.K., P.V. and M.A.; resources, N.G.; data curation, Z.S., F.T., P.V. and C.H.; writing—original draft preparation, S.N.K., K.M. and M.K.; writing—review and editing, S.N.K., K.M., G.T., C.H., N.G., E.G.P., F.T. and Z.S.; visualization, S.N.K., G.T., C.H., N.G., E.G.P., F.T. and Z.S.; supervision: K.M., E.G.P., M.A. and C.H.; project administration, M.K., M.A. and D.K.; funding acquisition S.N.K. All authors have read and agreed to the published version of the manuscript.
Funding
This research received no external funding.
Institutional Review Board Statement
The study was conducted in accordance with the Declaration of Helsinki, and approved by the Aristotle University of Thessaloniki (approval number 25224/2019, approval date 14 August 2019).
Informed Consent Statement
Informed consent was obtained from all subjects involved in the study.
Data Availability Statement
The original contributions presented in the study are included in the article, further inquiries can be directed to the corresponding author.
Conflicts of Interest
The authors declare no conflict of interest.
References
- Trepanowski, J.F.; Bloomer, R.J. The impact of religious fasting on human health. Nutr. J. 2010, 9, 57–57. [CrossRef]
- Sarri, K.O.; Linardakis, M.K.; Bervanaki, F.N.; Tzanakis, N.E.; Kafatos, A.G. Greek Orthodox fasting rituals: a hidden characteristic of the Mediterranean diet of Crete. Br. J. Nutr. 2004, 92, 277–284. [CrossRef]
- O. Sarri, K.; E Tzanakis, N.; Linardakis, M.K.; Mamalakis, G.D.; Kafatos, A.G. Effects of Greek orthodox christian church fasting on serum lipids and obesity. BMC Public Heal. 2003, 3, 16–16. [CrossRef]
- Sarri, K.; Linardakis, M.; Codrington, C.; Kafatos, A. Does the periodic vegetarianism of Greek Orthodox Christians benefit blood pressure?. Prev. Med. 2007, 44, 341–348. [CrossRef]
- Karras, S.N.; Koufakis, T.; Adamidou, L.; Antonopoulou, V.; Karalazou, P.; Thisiadou, K.; Mitrofanova, E.; Mulrooney, H.; Petróczi, A.; Zebekakis, P.; et al. Effects of orthodox religious fasting versus combined energy and time restricted eating on body weight, lipid concentrations and glycaemic profile. Int. J. Food Sci. Nutr. 2020, 72, 82–92. [CrossRef]
- Mehta LH, Roth GS. Caloric restriction and longevity: the science and the ascetic experience. Ann N Y Acad Sci. 2009 Aug;1172:28-33.
- Papadaki, A.; Vardavas, C.; Hatzis, C.; Kafatos, A. Calcium, nutrient and food intake of Greek Orthodox Christian monks during a fasting and non-fasting week. Public Health Nutr 2008, 11, 1022–1029. [CrossRef]
- de Toledo, F.W.; Grundler, F.; Goutzourelas, N.; Tekos, F.; Vassi, E.; Mesnage, R.; Kouretas, D. Influence of Long-Term Fasting on Blood Redox Status in Humans. Antioxidants 2020, 9, 496. [CrossRef]
- Romeu, M.; Aranda, N.; Giralt, M.; Ribot, B.; Nogues, M.R.; Arija, V. Diet, iron biomarkers and oxidative stress in a representative sample of Mediterranean population. Nutr. J. 2013, 12, 102. [CrossRef]
- Karras, S.N.; Michalakis, K.; Tekos, F.; Skaperda, Z.; Vardakas, P.; Ziakas, P.D.; Kypraiou, M.; Anemoulis, M.; Vlastos, A.; Tzimagiorgis, G.; et al. Effects of Religious Fasting on Markers of Oxidative Status in Vitamin D-Deficient and Overweight Orthodox Nuns versus Implementation of Time-Restricted Eating in Lay Women from Central and Northern Greece. Nutrients 2024, 16, 3300. [CrossRef]
- He J, Deng R, Wei Y, Zhang S, Su M, Tang M, Wang J, Nong W, Lei X. Efficacy of antioxidant supple-mentation in improving endocrine, hormonal, inflammatory, and metabolic statuses of PCOS: a me-ta-analysis and systematic review. Food Funct. 2024 Feb 19;15(4):1779-1802.
- He, C.-T.; Chen, F.-Y.; Kuo, C.-H.; Lin, C.-Y.; Pei, D.; Pitrone, P.; Chen, J.-S.; Wu, C.-Z. Association between gamma-glutamyl transferase and diabetes factors among elderly nonobese individuals. Medicine 2025, 104, e41913. [CrossRef]
- Lin, S.; Jensen, M.D. Human Adipose Tissue Metabolism in Obesity. J. Obes. Metab. Syndr. 2025, 34, 105–119. [CrossRef]
- Colamatteo, A.; Fusco, C.; Matarese, A.; Matarese, G. Obesity and Autoimmunity Epidemic: The Role of Immunometabolism. Annu. Rev. Nutr. 2025. [CrossRef]
- Ježek, P. Physiological Fatty Acid-Stimulated Insulin Secretion and Redox Signaling Versus Lipotoxicity. Antioxidants Redox Signal. 2025, 42, 566–622. [CrossRef]
- Iheagwam, F.N.; Joseph, A.J.; Adedoyin, E.D.; Iheagwam, O.T.; Ejoh, S.A. Mitochondrial Dysfunction in Diabetes: Shedding Light on a Widespread Oversight. Pathophysiology, 32, 9. [CrossRef]
- Karras, S.N.; Michalakis, K.; Katsiki, N.; Kypraiou, M.; Vlastos, A.; Anemoulis, M.; Koukoulis, G.; Mouslech, Z.; Talidis, F.; Tzimagiorgis, G.; et al. Interrelations of Leptin and Interleukin-6 in Vitamin D Deficient and Overweight Orthodox Nuns from Northern Greece: A Pilot Study. Nutrients 2025, 17, 1144. [CrossRef]
- Hertiš Petek T, Homšak E, Svetej M, Marčun Varda N. Metabolic Syndrome, Inflammation, Oxidative Stress, and Vitamin D Levels in Children and Adolescents with Obesity. Int J Mol Sci. 2024 Oct 1;25(19):10599.
- Mattson, M.P. Roles of the lipid peroxidation product 4-hydroxynonenal in obesity, the metabolic syndrome, and associated vascular and neurodegenerative disorders. Exp. Gerontol. 2009, 44, 625–633. [CrossRef]
- Yu, B.P. Membrane alteration as a basis of aging and the protective effects of calorie restriction. Mech. Ageing Dev. 2005, 126, 1003–1010. [CrossRef]
- Licker, M.; Ellenberger, C. Impact of the Circadian Rhythm and Seasonal Changes on the Outcome of Cardiovascular Interventions. J. Clin. Med. 2025, 14, 2570. [CrossRef]
- Wu, M.; Wu, Y.; Xu, K.; Lin, L. Protective Effects of 1,25 Dihydroxyvitamin D3 against High-Glucose-Induced Damage in Human Umbilical Vein Endothelial Cells Involve Activation of Nrf2 Antioxidant Signaling. J. Vasc. Res. 2021, 58, 267–276. [CrossRef]
- Asghari, S.; Hamedi-Shahraki, S.; Amirkhizi, F. Vitamin D status and systemic redox biomarkers in adults with obesity. Clin. Nutr. ESPEN 2021, 45, 292–298. [CrossRef]
- Alvarez, J.A.; Chowdhury, R.; Jones, D.P.; Martin, G.S.; Brigham, K.L.; Binongo, J.N.; Ziegler, T.R.; Tangpricha, V. Vitamin D status is independently associated with plasma glutathione and cysteine thiol/disulphide redox status in adults. Clin. Endocrinol. 2014, 81, 458–466. [CrossRef]
- McLeod, K.; Datta, V.; Fuller, S. Adipokines as Cardioprotective Factors: BAT Steps Up to the Plate. Biomedicines 2025, 13, 710. [CrossRef]
- Blasco-Roset, A.; Quesada-López, T.; Mestres-Arenas, A.; Villarroya, J.; Godoy-Nieto, F.J.; Cereijo, R.; Rupérez, C.; Neess, D.; Færgeman, N.J.; Giralt, M.; et al. Acyl CoA-binding protein in brown adipose tissue acts as a negative regulator of adaptive thermogenesis. Mol. Metab. 2025, 96, 102153. [CrossRef]
- Zhang Y, Humes F, Almond G, Kavazis AN, Hood WR. A mitohormetic response to pro-oxidant expo-sure in the house mouse. Am J Physiol Regul Integr Comp Physiol. 2018 Jan 1;314(1):R122-R134.28.
- Zhou, M.; Lv, J.; Chen, X.; Shi, Y.; Chao, G.; Zhang, S. From gut to liver: Exploring the crosstalk between gut-liver axis and oxidative stress in metabolic dysfunction-associated steatotic liver disease. Ann. Hepatol. 2025, 30, 101777. [CrossRef]
- Zavarzadeh, P.G.; Panchal, K.; Bishop, D.; Gilbert, E.; Trivedi, M.; Kee, T.; Ranganathan, S.; Arunagiri, A. Exploring proinsulin proteostasis: insights into beta cell health and diabetes. Front. Mol. Biosci. 2025, 12, 1554717. [CrossRef]
- Pawlukianiec C, Lauko KK, Michalak D, Żendzian-Piotrowska M, Zalewska A, Maciejczyk M. A com-parative study on the antioxidant and antiglycation properties of different vitamin D forms. Eur J Med Chem. 2025 Mar 5;285:117263.
- Della Nera G, Sabatino L, Gaggini M, Gorini F, Vassalle C. Vitamin D Determinants, Status, and Anti-oxidant/Anti-inflammatory-Related Effects in Cardiovascular Risk and Disease: Not the Last Word in the Controversy. Antioxidants (Basel). 2023 Apr 18;12(4):948.
- Moslemi, E.; Musazadeh, V.; Kavyani, Z.; Naghsh, N.; Shoura, S.M.S.; Dehghan, P. Efficacy of vitamin D supplementation as an adjunct therapy for improving inflammatory and oxidative stress biomarkers: An umbrella meta-analysis. Pharmacol. Res. 2022, 186, 106484. [CrossRef]
- Byrne, N.J.; Soni, S.; Takahara, S.; Ferdaoussi, M.; Al Batran, R.; Darwesh, A.M.; Levasseur, J.L.; Beker, D.; Vos, D.Y.; Schmidt, M.A.; et al. Chronically Elevating Circulating Ketones Can Reduce Cardiac Inflammation and Blunt the Development of Heart Failure. Circ. Hear. Fail. 2020, 13, e006573. [CrossRef]
- Karras, S.N.; Koufakis, T.; Adamidou, L.; Dimakopoulos, G.; Karalazou, P.; Thisiadou, K.; Zebekakis, P.; Makedou, K.; Kotsa, K. Different patterns of changes in free 25-hydroxyvitamin D concentrations during intermittent fasting among meat eaters and non-meat eaters and correlations with amino acid intake. Int. J. Food Sci. Nutr. 2023, 74, 257–267. [CrossRef]
- Al-Shafei, A.I. Ramadan fasting ameliorates oxidative stress and improves glycemic control and lipid profile in diabetic patients. Eur. J. Nutr. 2014, 53, 1475–1481. [CrossRef]
- Al-Shafei, A.I.M. Ramadan fasting ameliorates arterial pulse pressure and lipid profile, and alleviates oxidative stress in hypertensive patients. Blood Press. 2013, 23, 160–167. [CrossRef]
- Lapenna, D. Glutathione and glutathione-dependent enzymes: From biochemistry to gerontology and successful aging. Ageing Res. Rev. 2023, 92, 102066. [CrossRef]
- Peifer-Weiß, L.; Al-Hasani, H.; Chadt, A. AMPK and Beyond: The Signaling Network Controlling RabGAPs and Contraction-Mediated Glucose Uptake in Skeletal Muscle. Int. J. Mol. Sci. 2024, 25, 1910. [CrossRef]
- Weinberg Sibony R, Segev O, Dor S, Raz I. Overview of oxidative stress and inflammation in diabetes. J Diabetes. 2024 Oct;16(10):e70014.
- Jain, U.; Srivastava, P.; Sharma, A.; Sinha, S.; Johari, S. Impaired Fibroblast Growth Factor 21 (FGF21) Associated with Visceral Adiposity Leads to Insulin Resistance: The Core Defect in Diabetes Mellitus. Curr. Diabetes Rev. 2025, 21, 1–12. [CrossRef]
- Gonçalves M, Vale N, Silva P. Neuroprotective Effects of Olive Oil: A Comprehensive Review of Antioxidant Properties. Antioxidants (Basel). 2024 Jun 24;13(7):762.
Figure 1.
Dot-whisker plot showing standardized regression coefficients and 95% confidence intervals for predictors of oxidative stress markers in the monastic group.
Figure 1.
Dot-whisker plot showing standardized regression coefficients and 95% confidence intervals for predictors of oxidative stress markers in the monastic group.
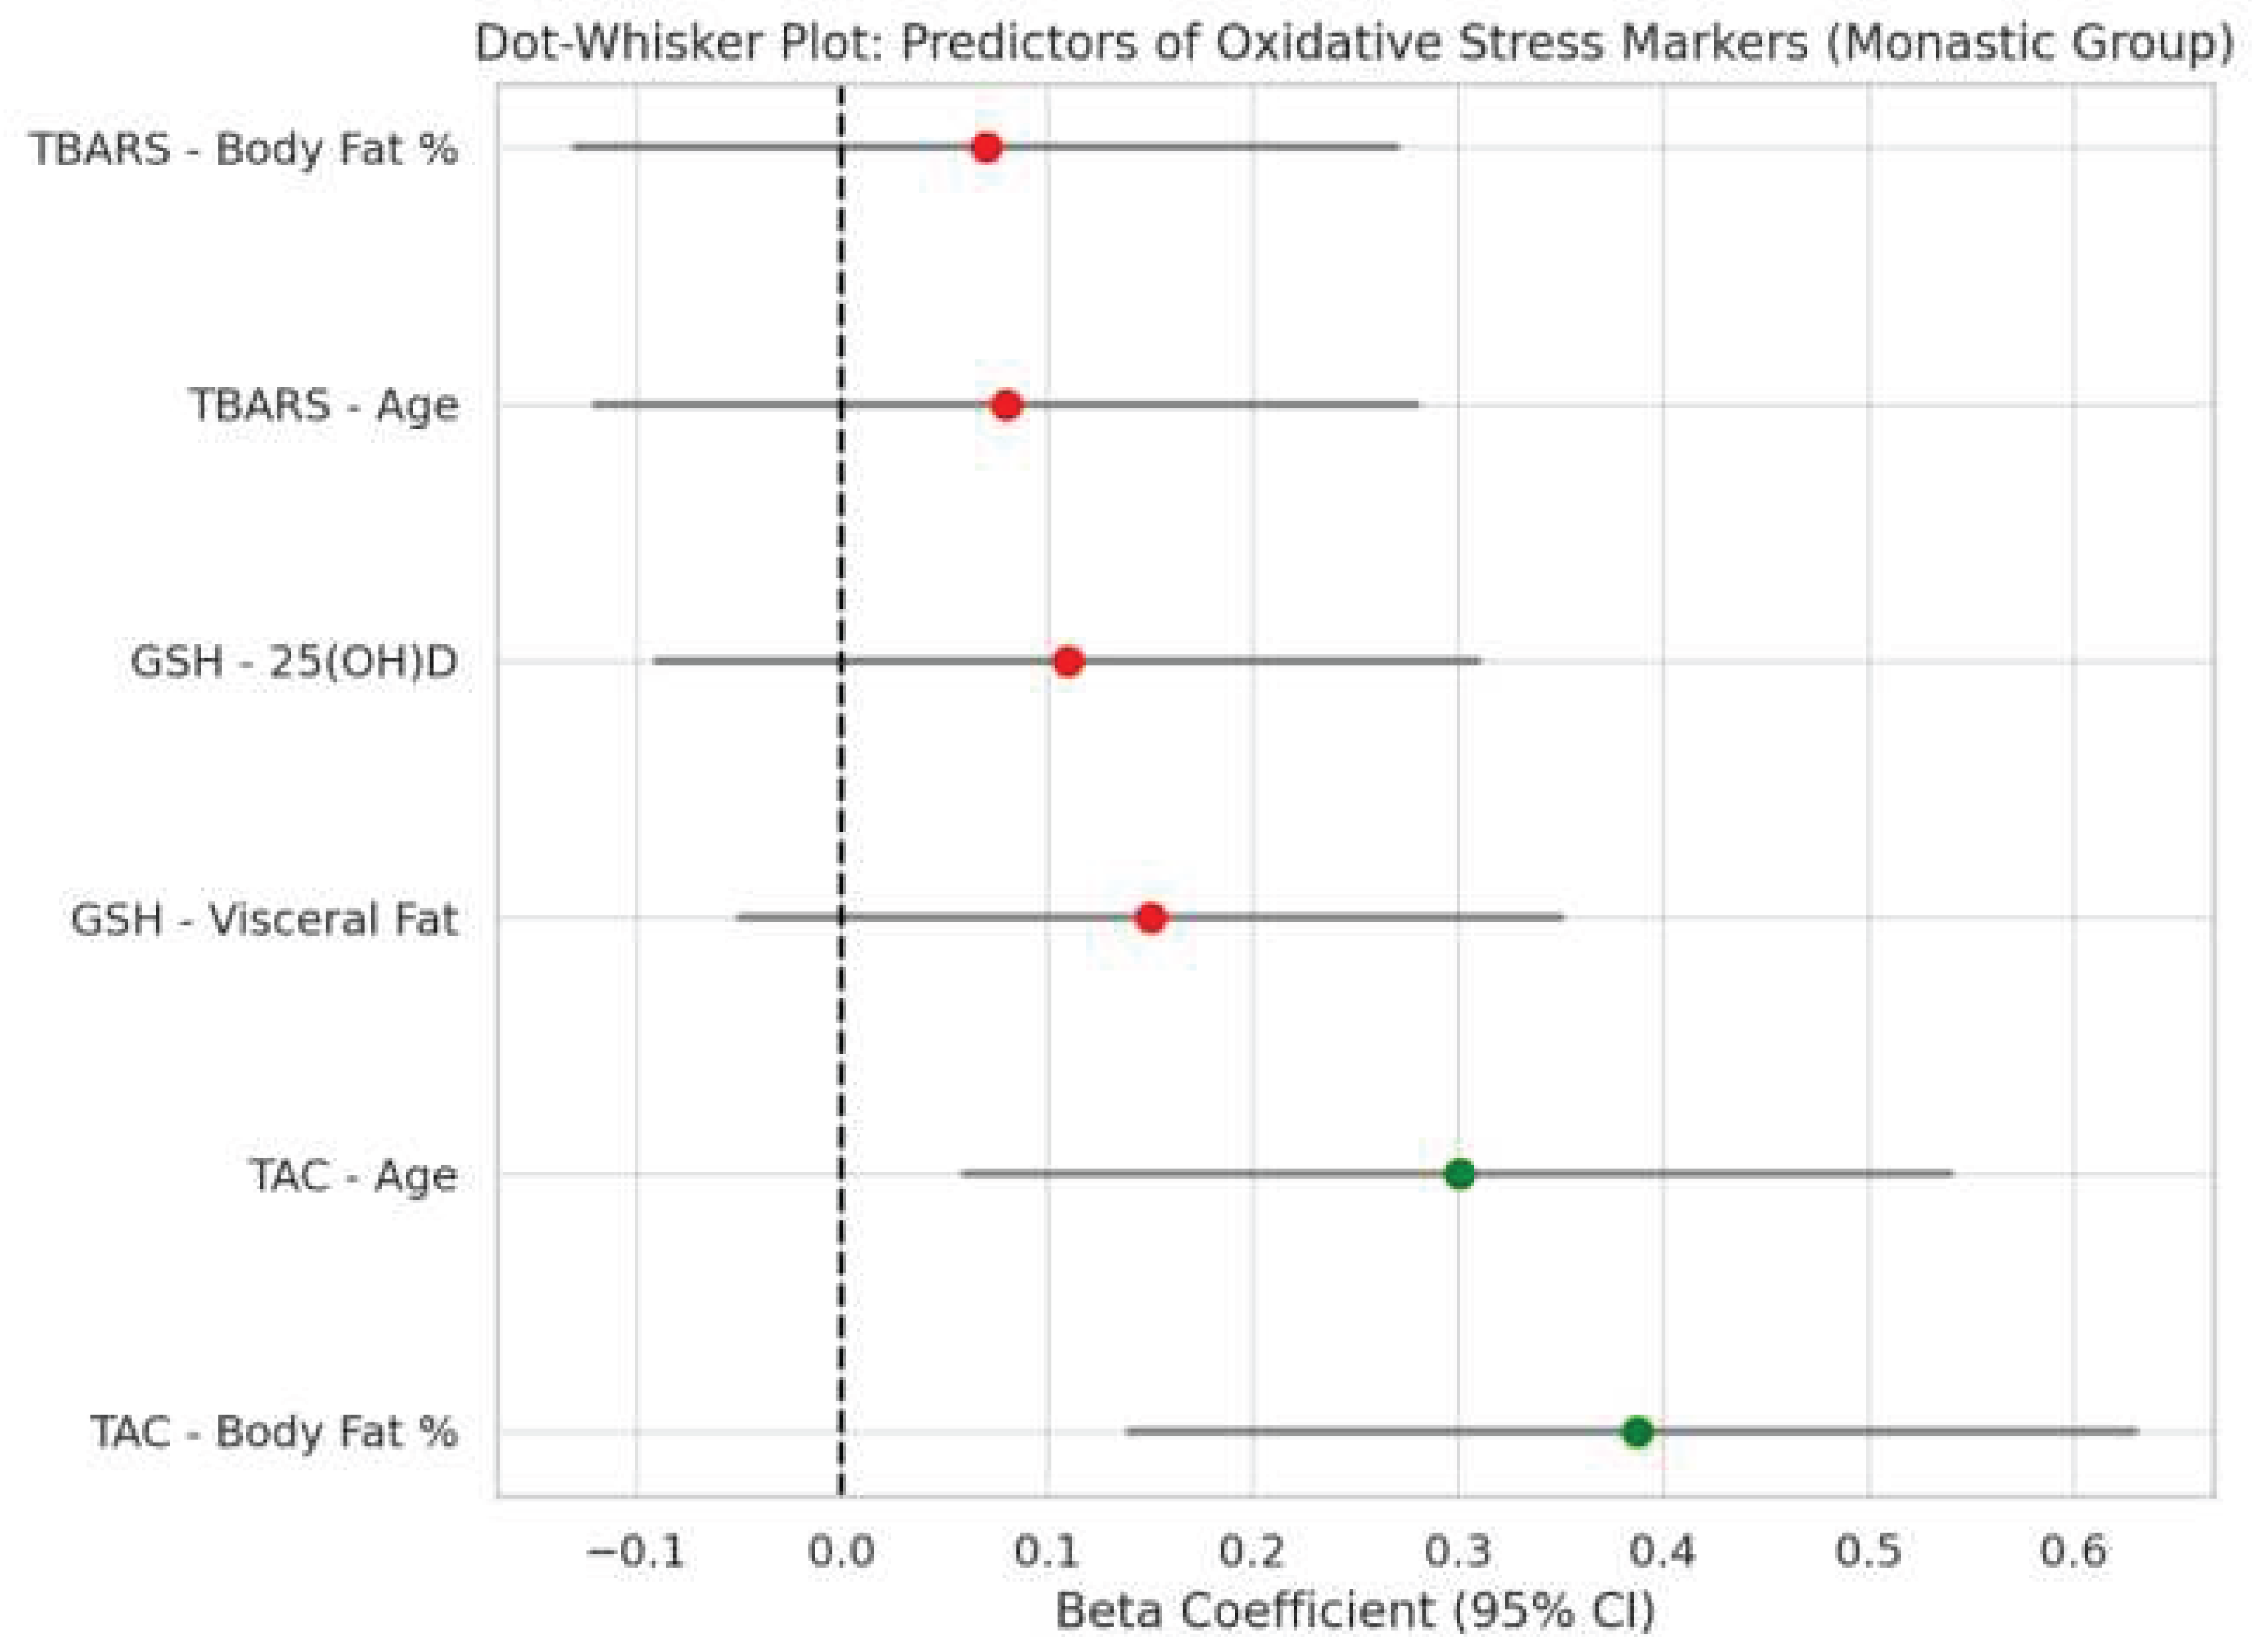
Figure 2.
Dot-whisker plot showing standardized regression coefficients and 95% confidence intervals for predictors of oxidative stress markers in the control group.
Figure 2.
Dot-whisker plot showing standardized regression coefficients and 95% confidence intervals for predictors of oxidative stress markers in the control group.
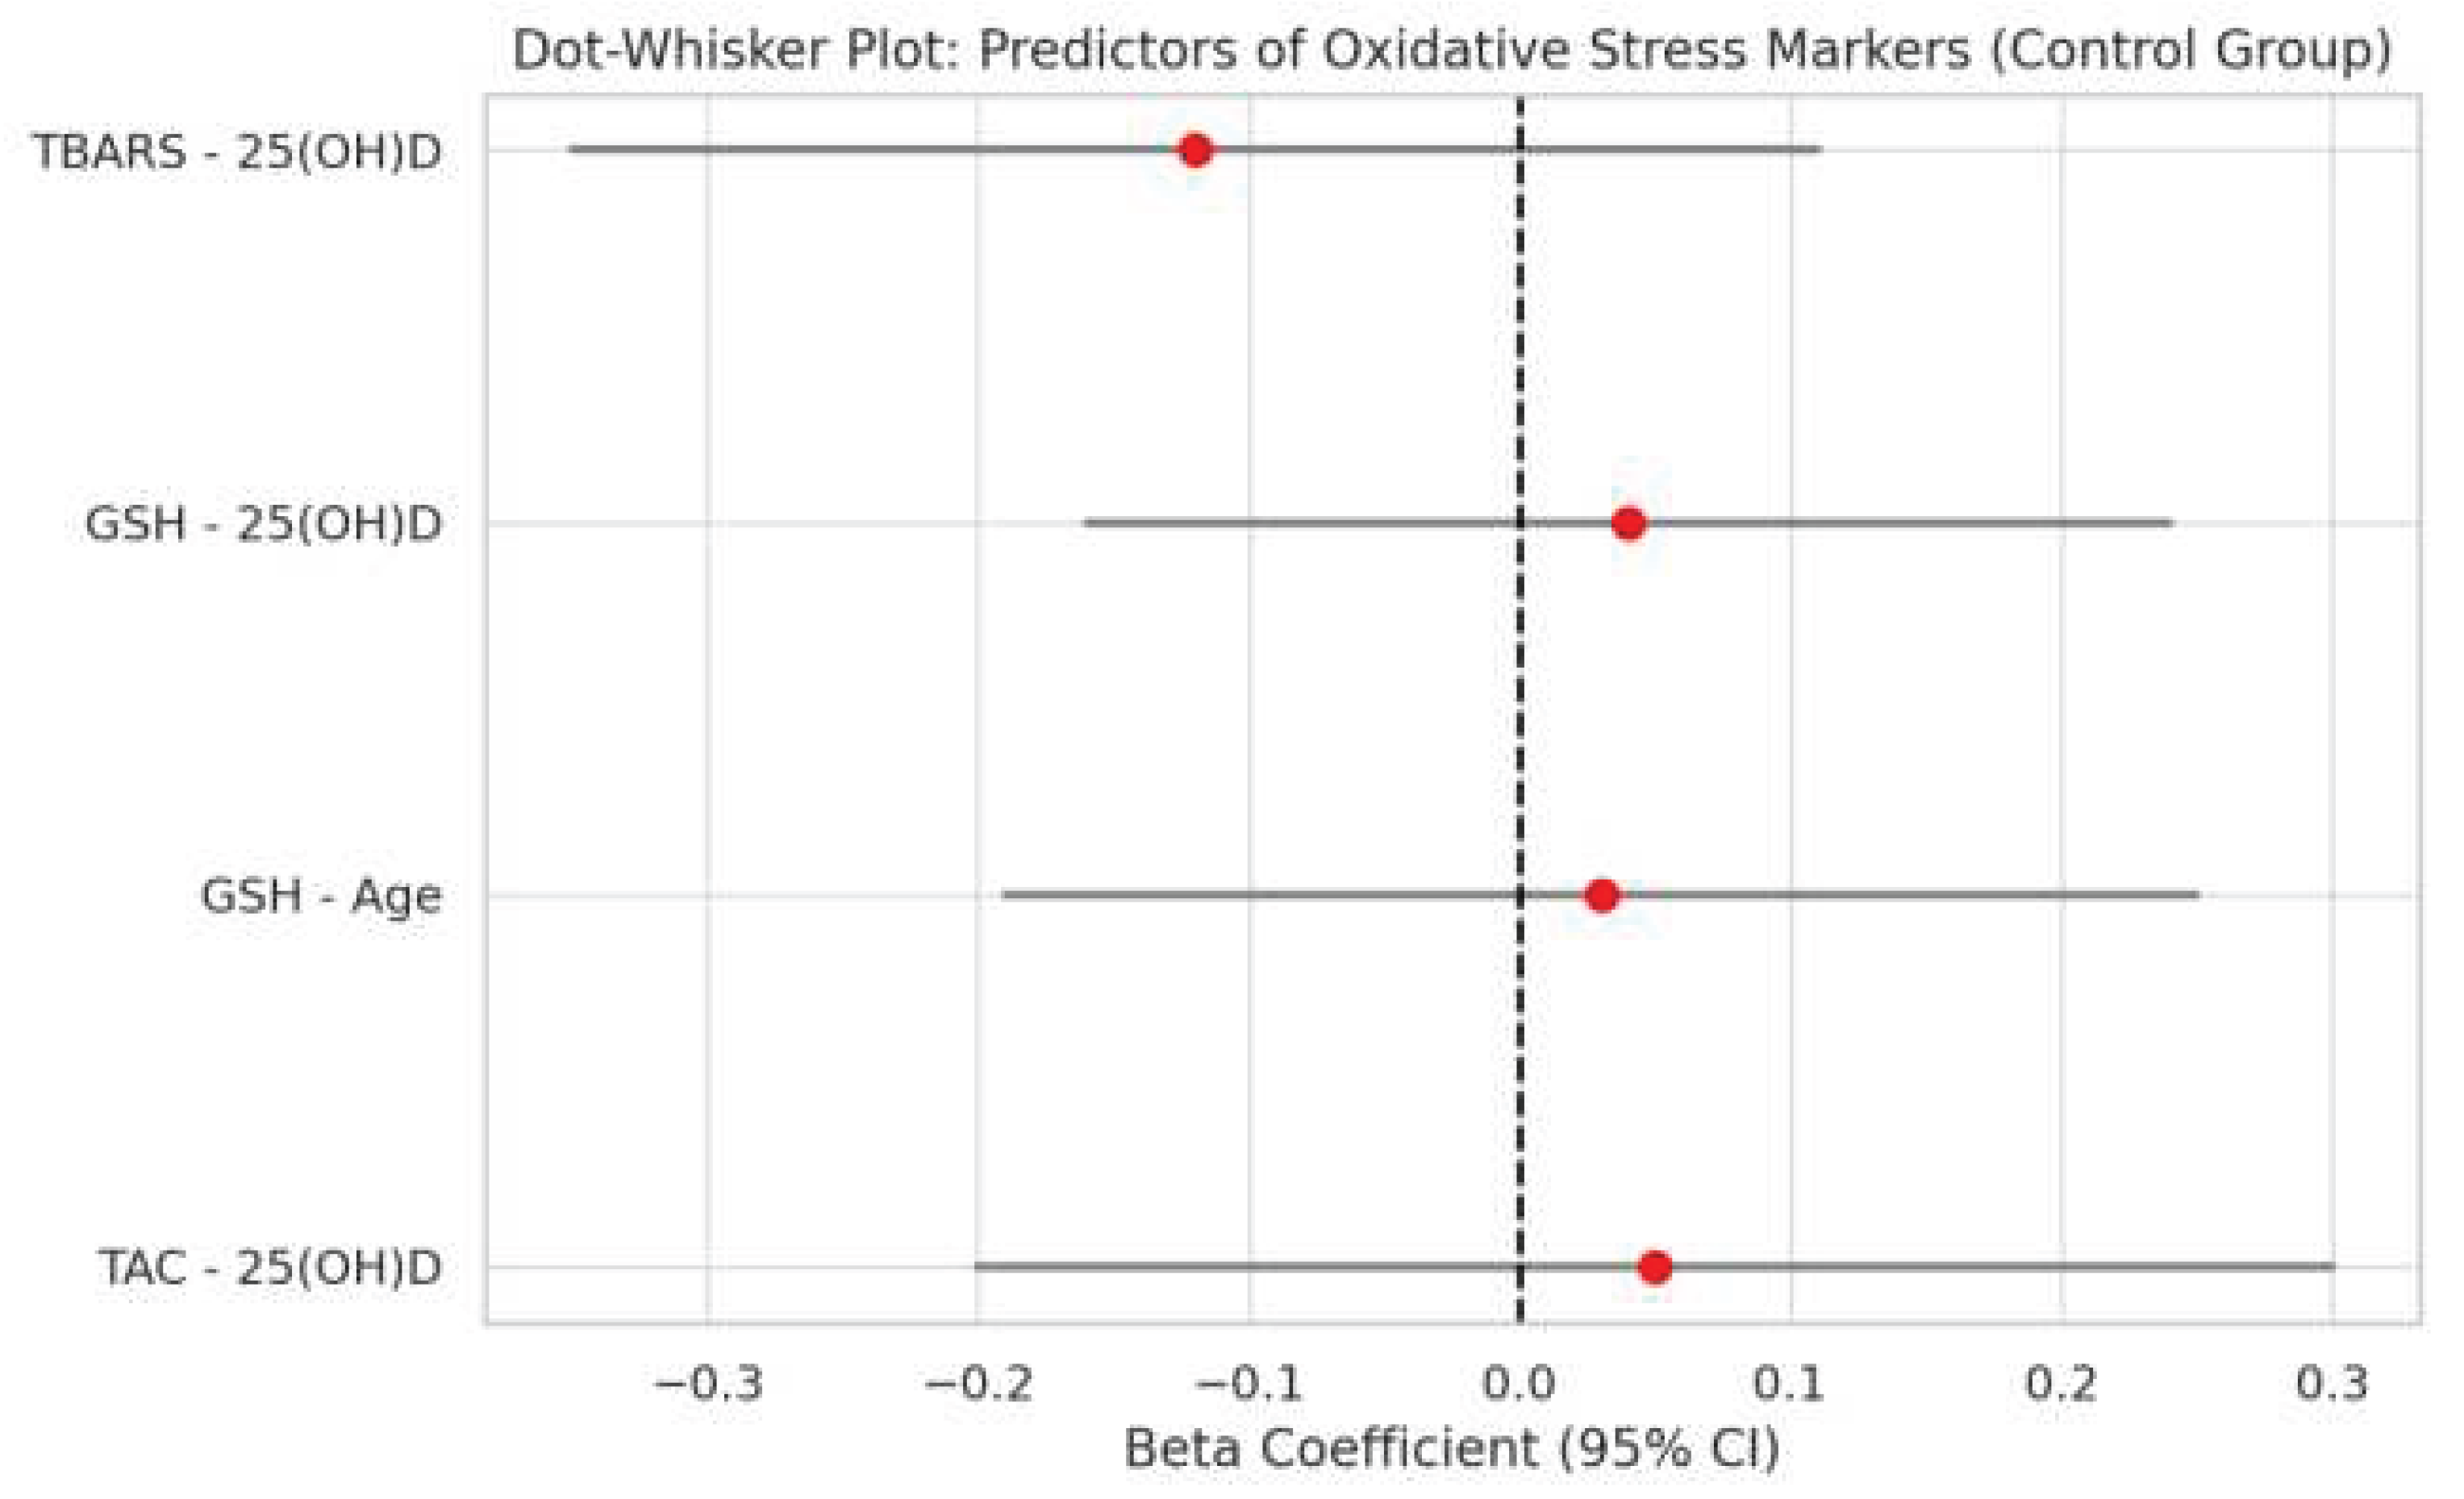
Figure 3.
Scatterplot illustrating a negative correlation between serum 25-hydroxyvitamin D [25(OH)D] levels and body fat percentage in the monastic group (ρ = -0.178, p = 0.018).
Figure 3.
Scatterplot illustrating a negative correlation between serum 25-hydroxyvitamin D [25(OH)D] levels and body fat percentage in the monastic group (ρ = -0.178, p = 0.018).
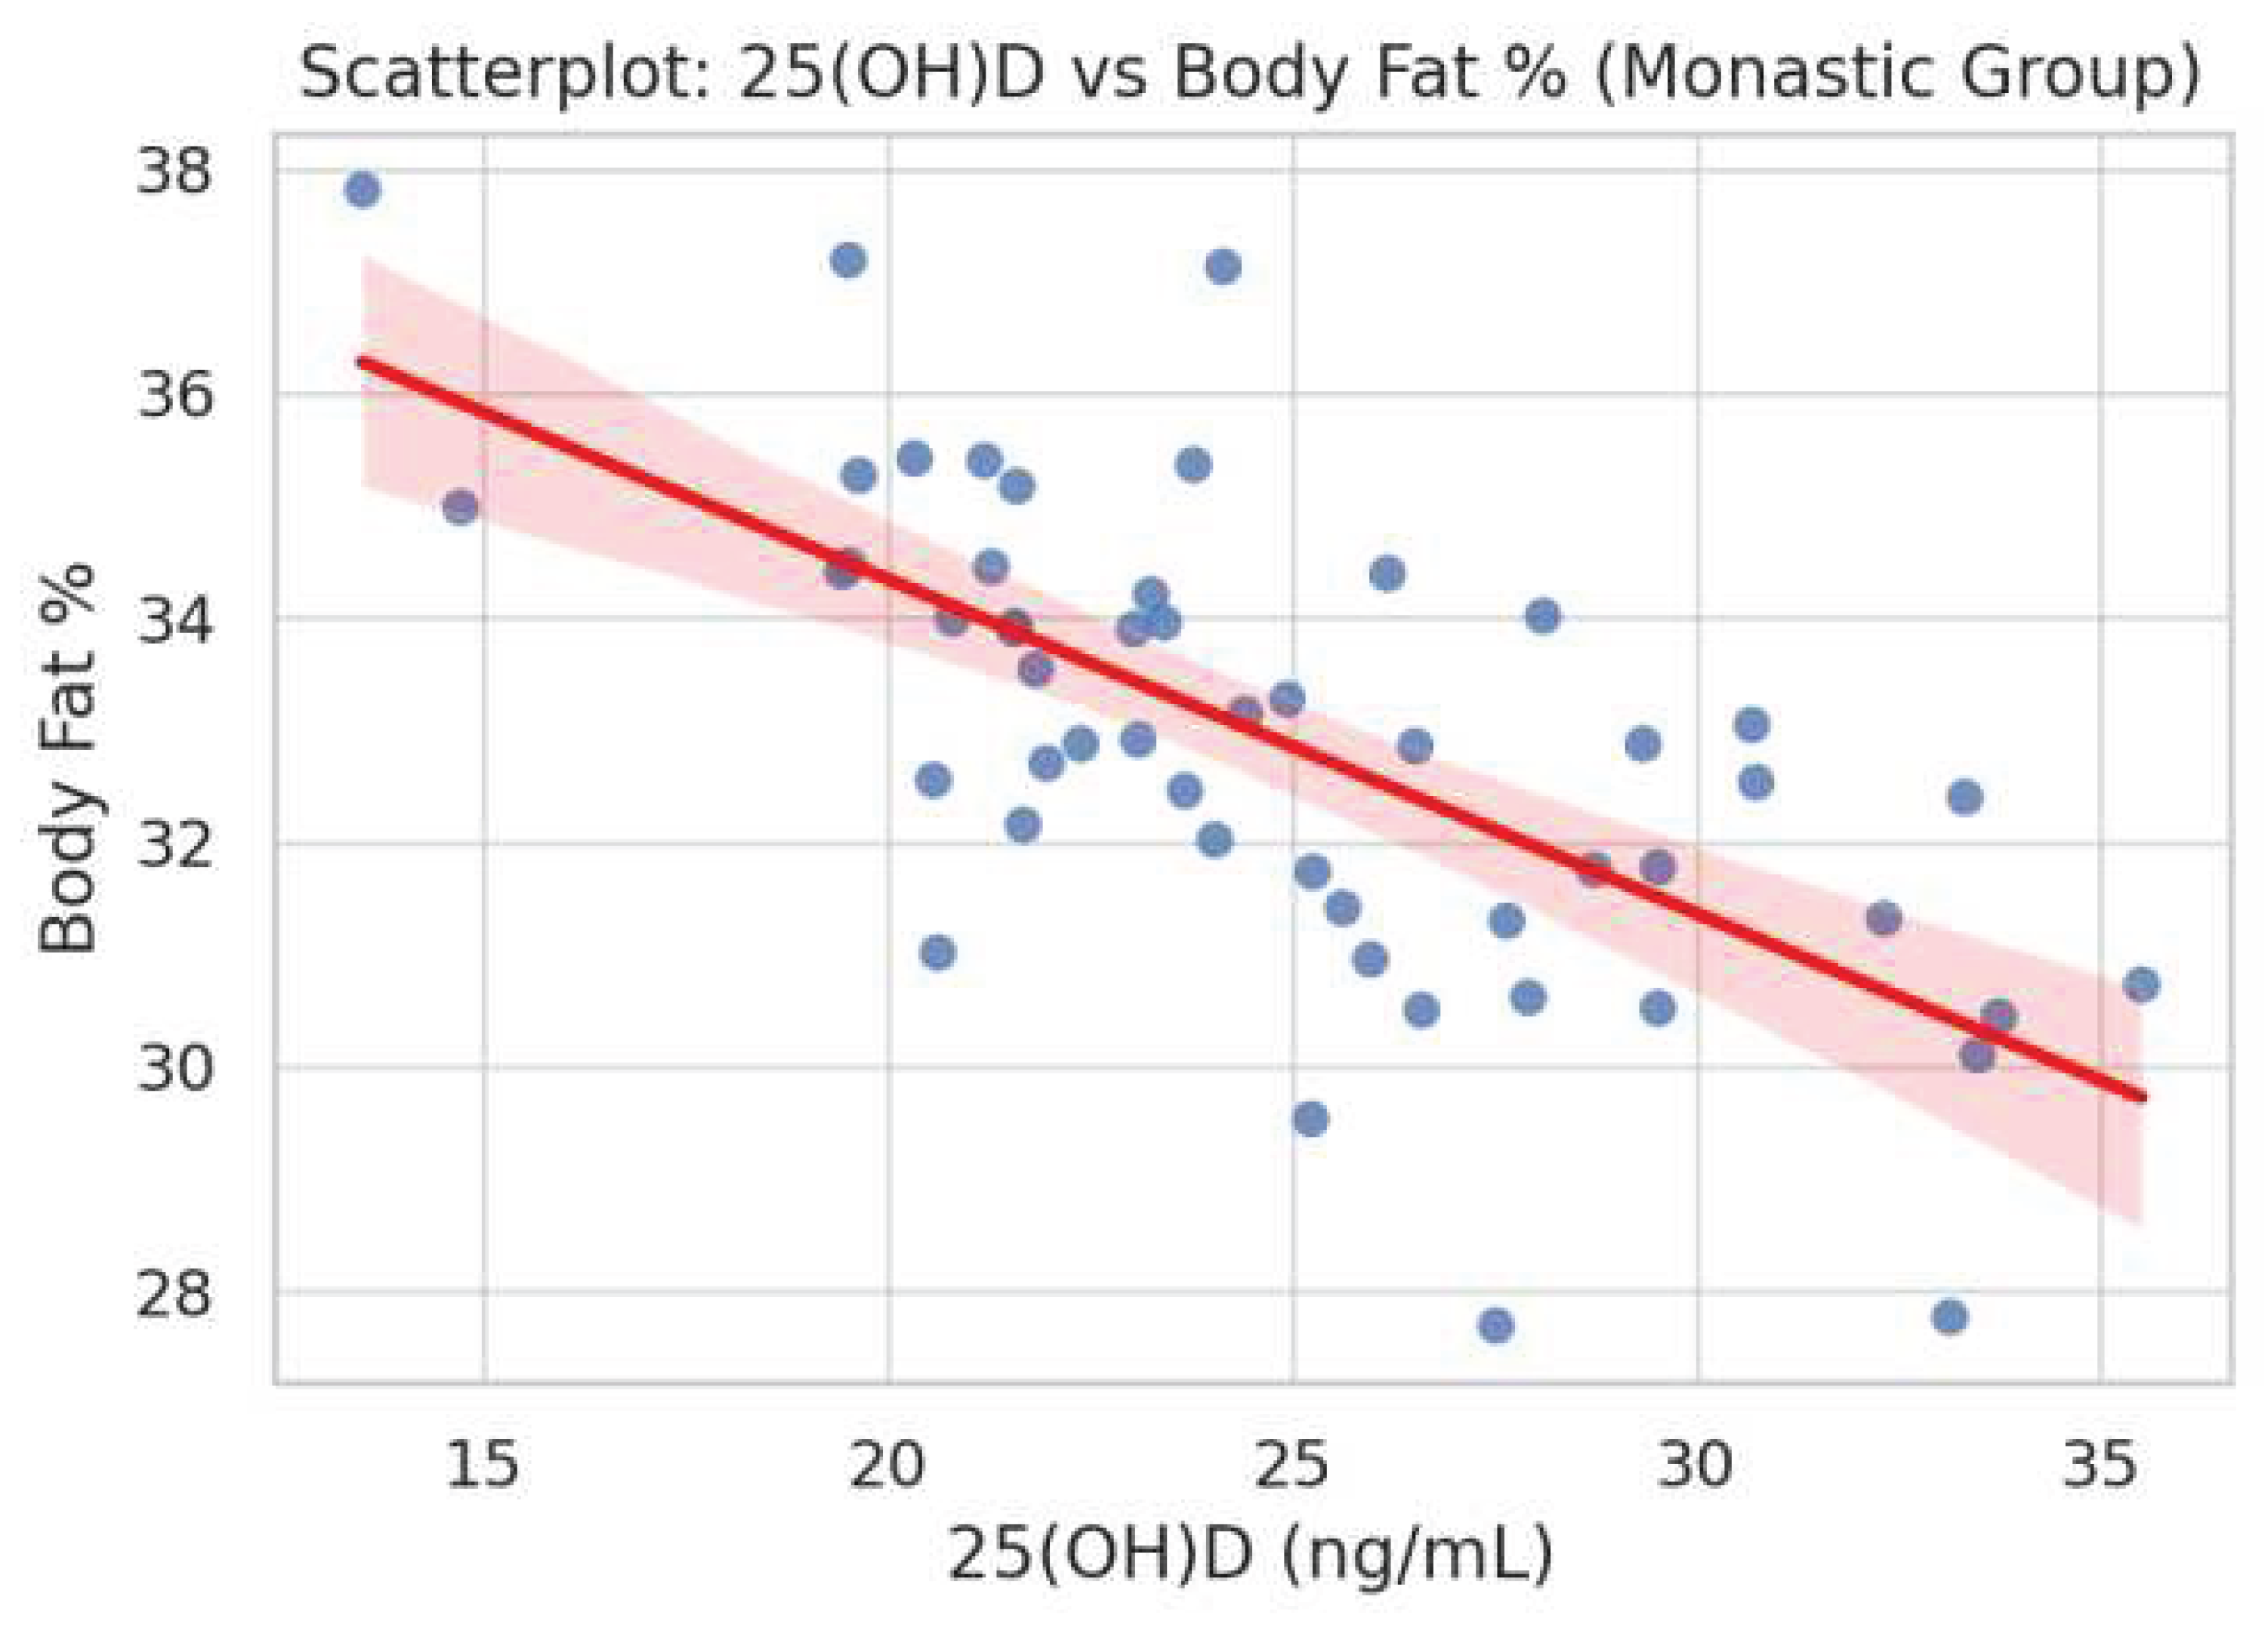
Figure 4.
Scatterplot showing a significant positive correlation between fasting insulin levels and reduced glutathione (GSH) in the control group (ρ = 0.480, p = 0.0035).
Figure 4.
Scatterplot showing a significant positive correlation between fasting insulin levels and reduced glutathione (GSH) in the control group (ρ = 0.480, p = 0.0035).
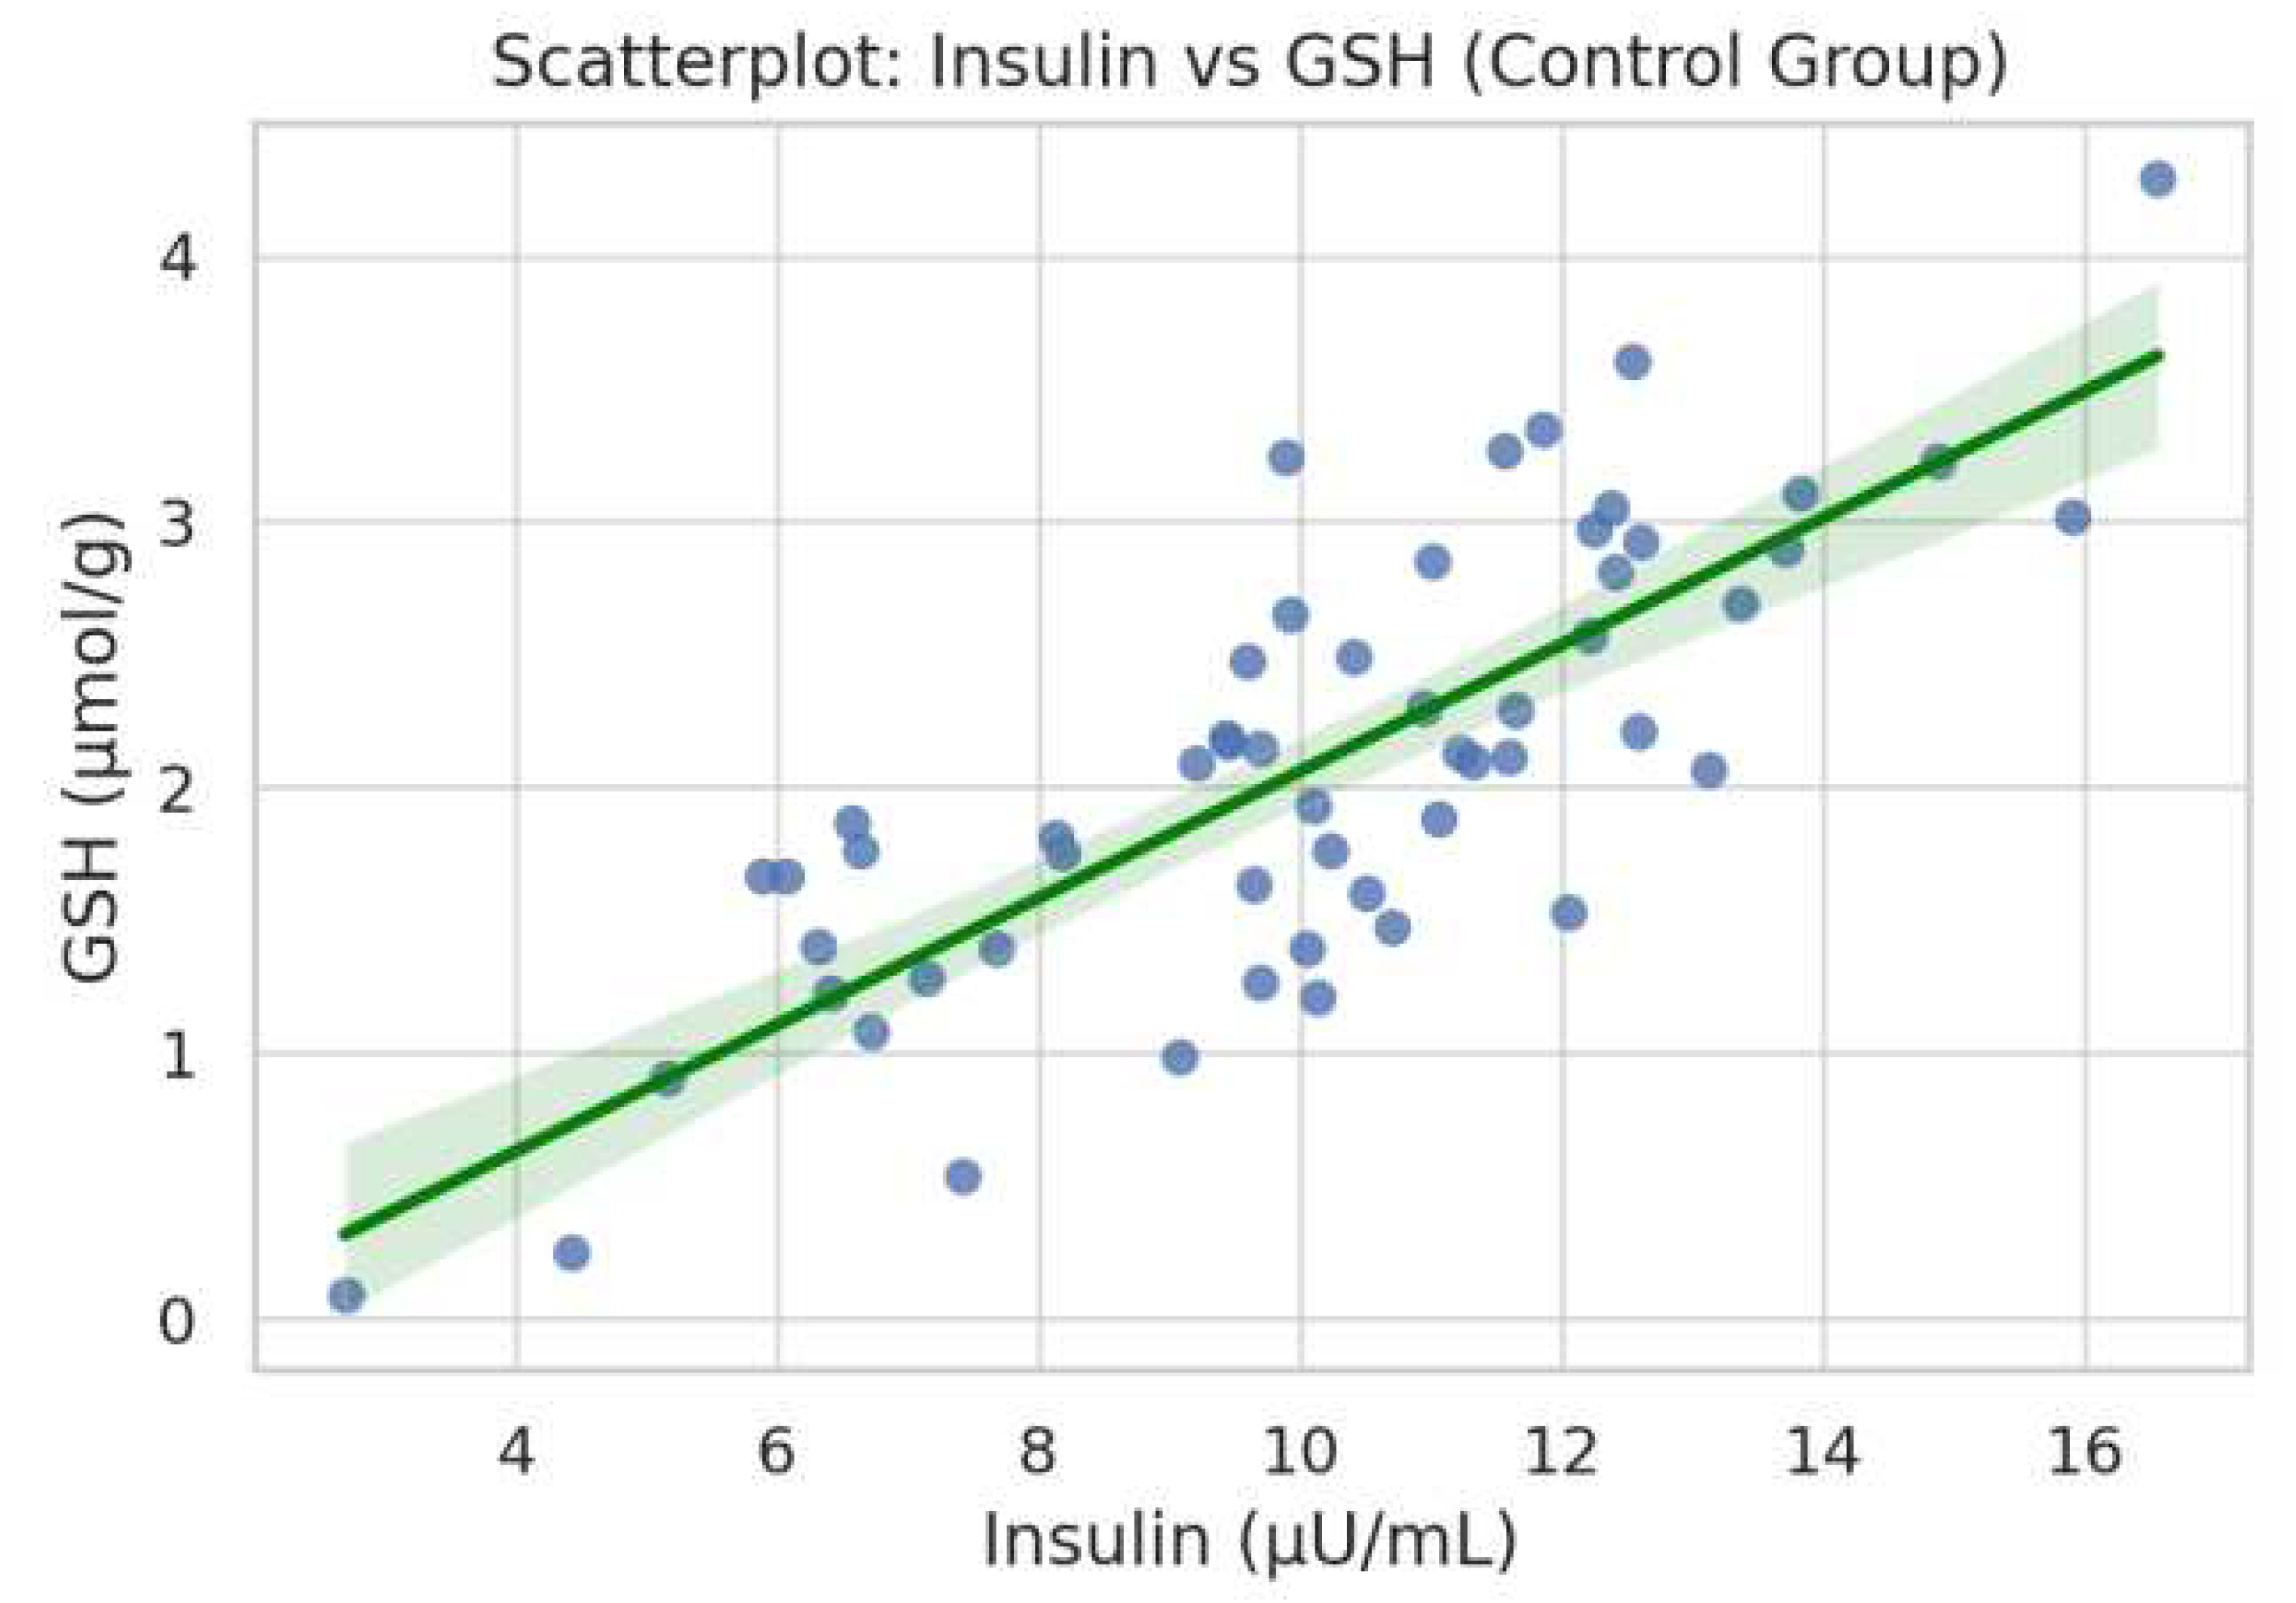
Figure 5.
Scatterplot depicting a borderline inverse correlation between fasting insulin and total antioxidant capacity (TAC) in the control group (ρ = -0.321, p = 0.060).
Figure 5.
Scatterplot depicting a borderline inverse correlation between fasting insulin and total antioxidant capacity (TAC) in the control group (ρ = -0.321, p = 0.060).
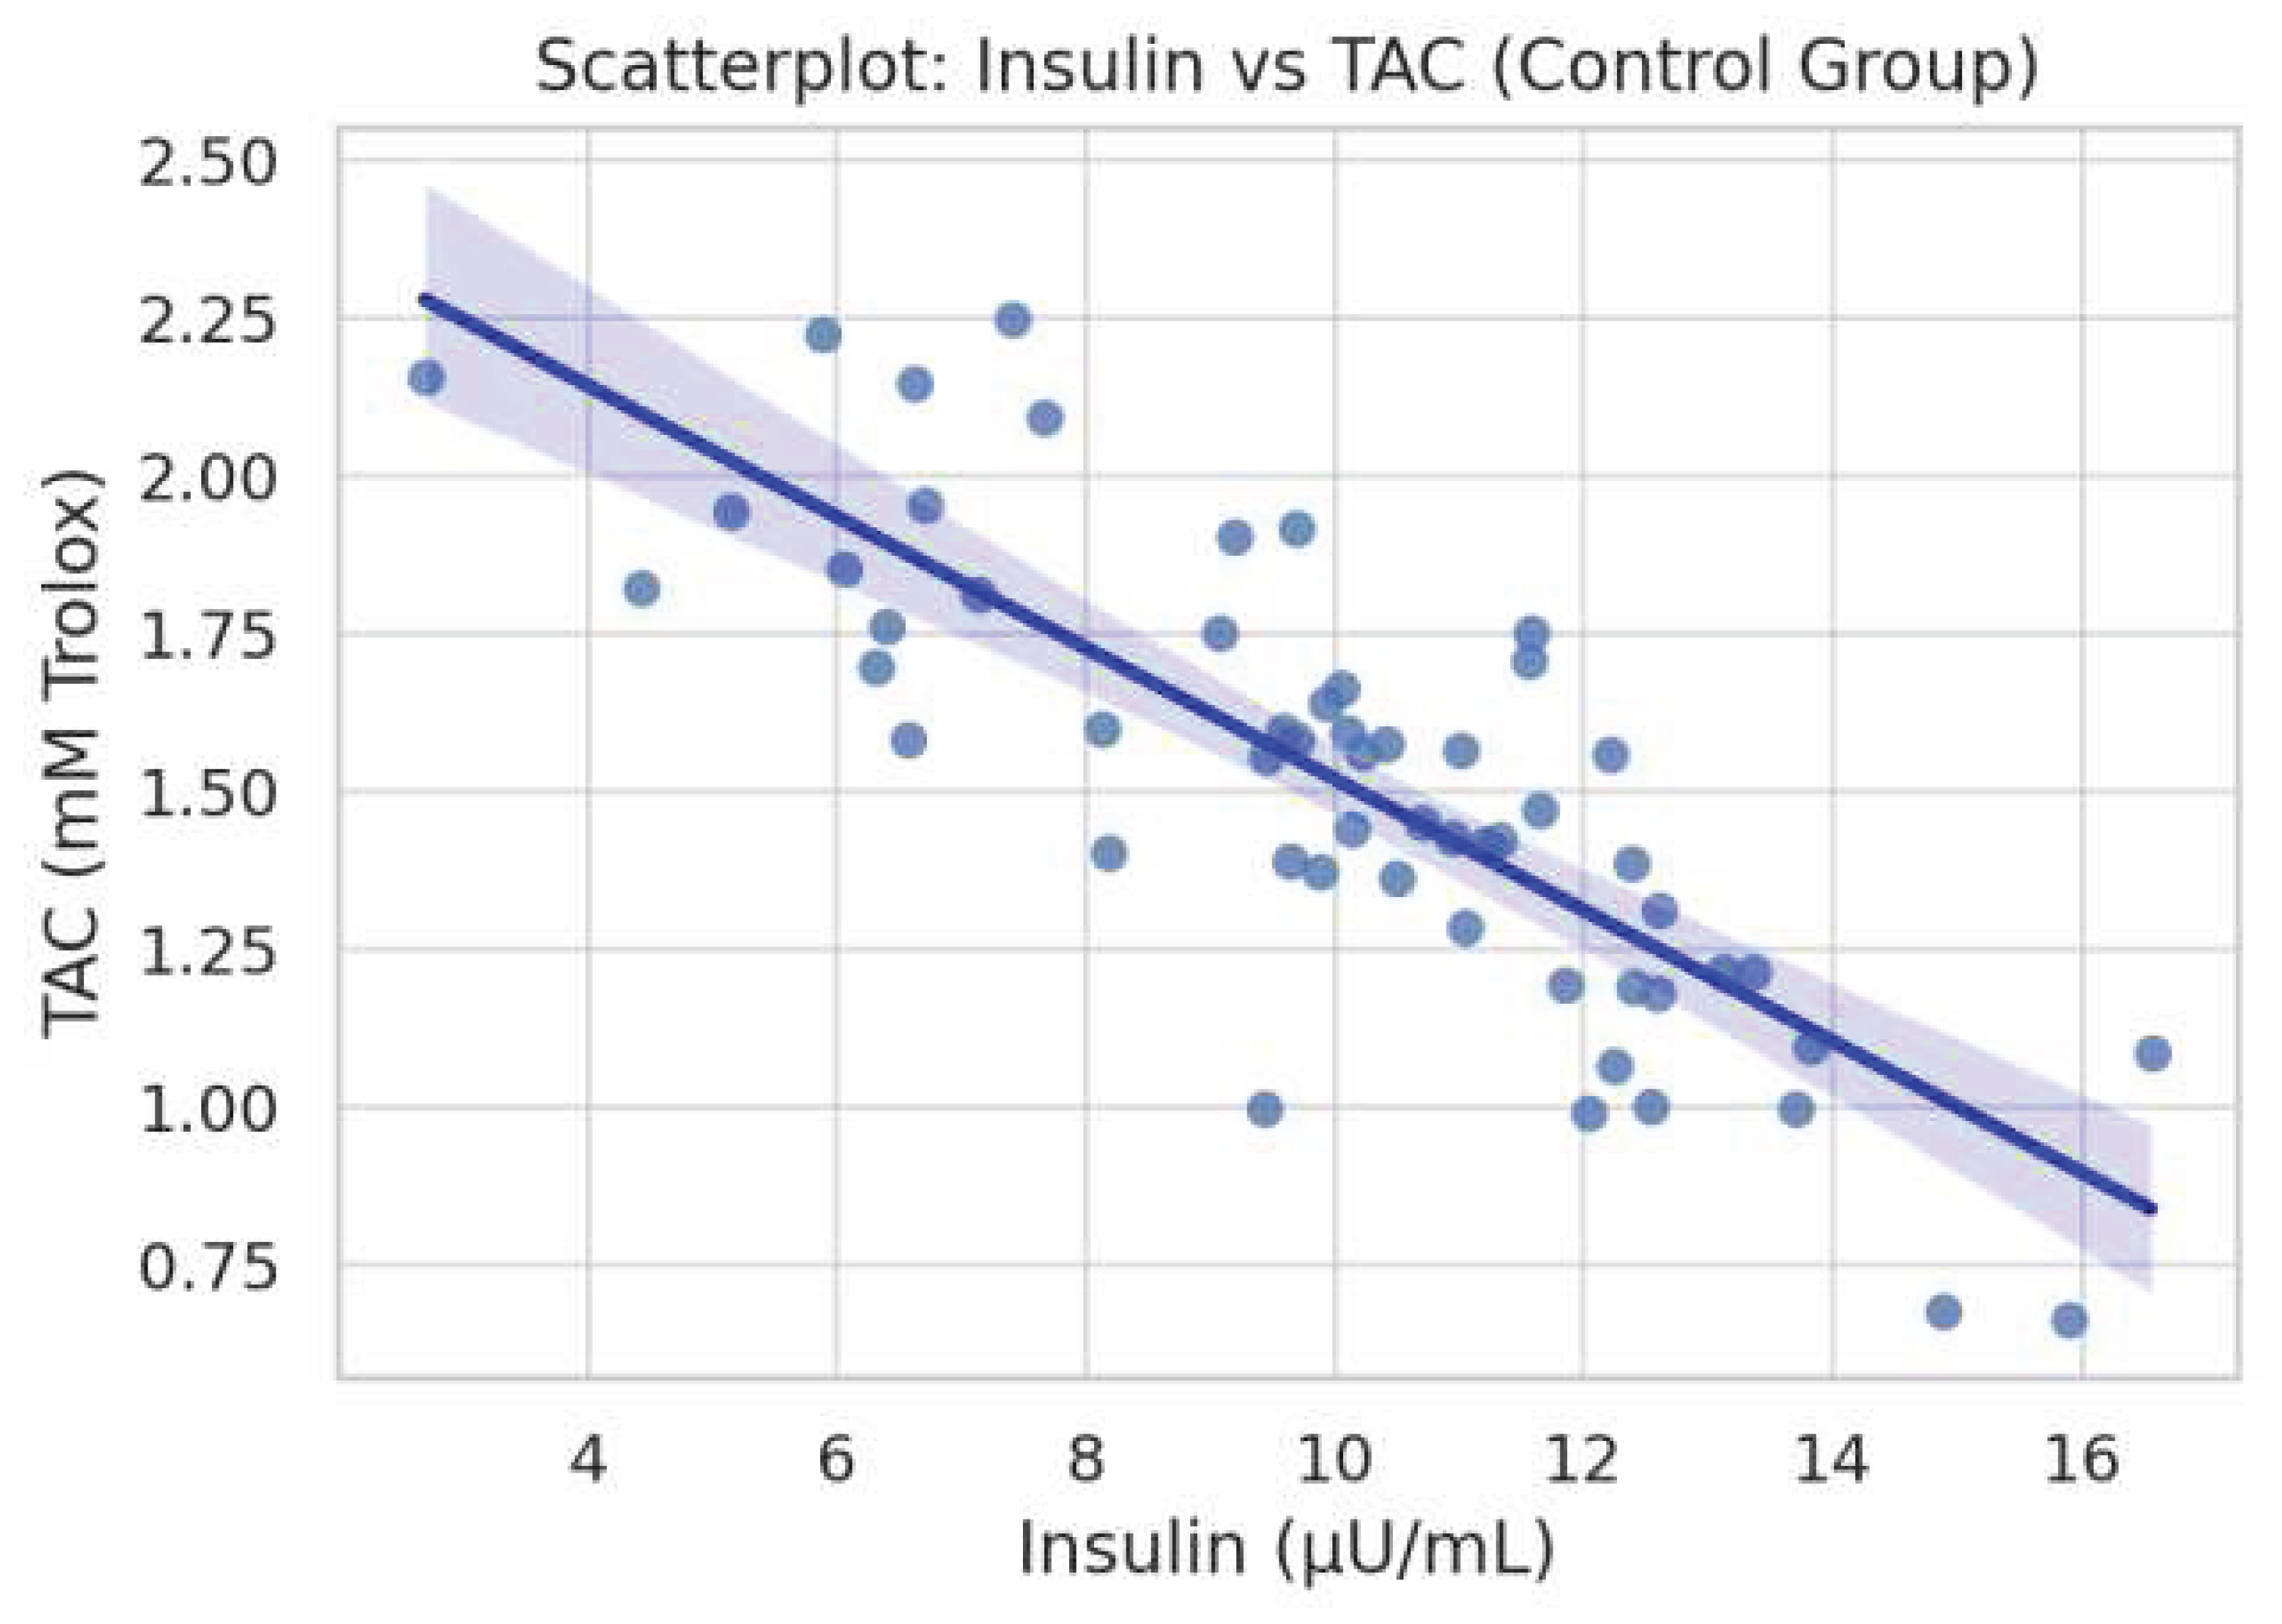

Table 1.
Spearman’s rho (ρ) coefficients and corresponding p-values illustrating the strength and direction of monotonic correlations between key oxidative stress markers (TAC, GSH, TBARS) and metabolic parameters (25(OH)D levels, body fat percentage, visceral adiposity, and age) in the monastic cohort.
| Marker | Variable | ρ | p |
| TAC | 25(OH)D | 0.074 | 0.331 |
| TAC | Body Fat % | 0.387 | 0.041 |
| TAC | Visceral Fat | 0.317 | 0.031 |
| TAC | Age | 0.301 | 0.014 |
| GSH | 25(OH)D | 0.026 | 0.729 |
| GSH | Body Fat % | 0.387 | 0.041 |
| GSH | Visceral Fat | 0.317 | 0.031 |
| GSH | Age | 0.301 | 0.014 |
| TBARS | 25(OH)D | -0.038 | 0.617 |
| TBARS | Body Fat % | N/A | 0.061 |
| TBARS | Visceral Fat | N/A | N/A |
| TBARS | Age | N/A | N/A |
Table 2.
Spearman’s rho (ρ) and p-values for correlations between oxidative stress markers and metabolic variables in the control group. The table is structured identically to Table 1 for comparability. Parameters for which data were not available are marked as ‘N/A’. Significant correlations included a negative association between TAC and age, and a positive correlation between GSH and insulin levels.
| Marker | Variable | ρ | p |
| TAC | 25(OH)D | -0.293 | 0.0875 |
| TAC | Insulin | -0.321 | 0.0598 |
| TAC | Body Fat % | N/A | N/A |
| TAC | Visceral Fat | N/A | N/A |
| TAC | Age | -0.629 | 0.0001 |
| GSH | 25(OH)D | 0.212 | 0.2225 |
| GSH | Insulin | 0.480 | 0.0035 |
| GSH | Body Fat % | N/A | N/A |
| GSH | Visceral Fat | N/A | N/A |
| GSH | Age | N/A | N/A |
| TBARS | 25(OH)D | -0.120 | 0.110 |
| TBARS | Insulin | 0.209 | 0.229 |
| TBARS | Body Fat % | N/A | N/A |
| TBARS | Visceral Fat | N/A | N/A |
| TBARS | Age | N/A | N/A |
Table 3.
Multiple linear regression results evaluating the contribution of age, BMI, and serum 25(OH)D levels to oxidative stress markers (TAC, GSH, TBARS) in the monastic group. Two models were constructed for each outcome: a basic model including age and BMI, and an extended model that additionally incorporated 25(OH)D concentrations. In all cases, the explained variance was low, and adjusted R2 values were negative or near-zero, indicating poor model fit.
| Outcome | Model | R2 | Adj R2 |
| TAC (Monastics) | Age + BMI | 0.009 | -0.046 |
| TAC + 25(OH)D | Extended | 0.019 | -0.067 |
| GSH (Monastics) | Age + BMI | 0.02 | -0.035 |
| GSH + 25(OH)D | Extended | 0.023 | -0.063 |
| TBARS (Monastics) | Age + BMI | 0.005 | -0.051 |
| TBARS + 25(OH)D | Extended | 0.024 | -0.062 |
Table 4.
Multiple linear regression results evaluating the contribution of age, BMI, and serum 25(OH)D levels to oxidative stress markers (TAC, GSH, TBARS) in the control group. Two models were tested for each oxidative outcome: a base model including age and BMI, and an extended model that additionally incorporated 25(OH)D levels. While model fit was poor for TAC and TBARS (with negative adjusted R2 values), the model predicting GSH showed modest explanatory power (R2 = 0.157, Adj R2 = 0.055), which was not improved with the addition of vitamin D.
| Outcome | Model | R2 | Adj R2 |
| TAC (Controls) | Age + BMI + Fat + VF | 0.019 | -0.099 |
| TAC + 25(OH)D | Extended | 0.026 | -0.126 |
| GSH (Controls) | Age + BMI + Fat + VF | 0.157 | 0.055 |
| GSH + 25(OH)D | Extended | 0.157 | 0.026 |
| TBARS (Controls) | Age + BMI + Fat + VF | 0.101 | -0.007 |
Disclaimer/Publisher’s Note: The statements, opinions and data contained in all publications are solely those of the individual author(s) and contributor(s) and not of MDPI and/or the editor(s). MDPI and/or the editor(s) disclaim responsibility for any injury to people or property resulting from any ideas, methods, instructions or products referred to in the content. |
© 2025 by the authors. Licensee MDPI, Basel, Switzerland. This article is an open access article distributed under the terms and conditions of the Creative Commons Attribution (CC BY) license (http://creativecommons.org/licenses/by/4.0/).
Copyright: This open access article is published under a Creative Commons CC BY 4.0 license, which permit the free download, distribution, and reuse, provided that the author and preprint are cited in any reuse.


