
Submitted:
09 August 2025
Posted:
11 August 2025
You are already at the latest version
Abstract
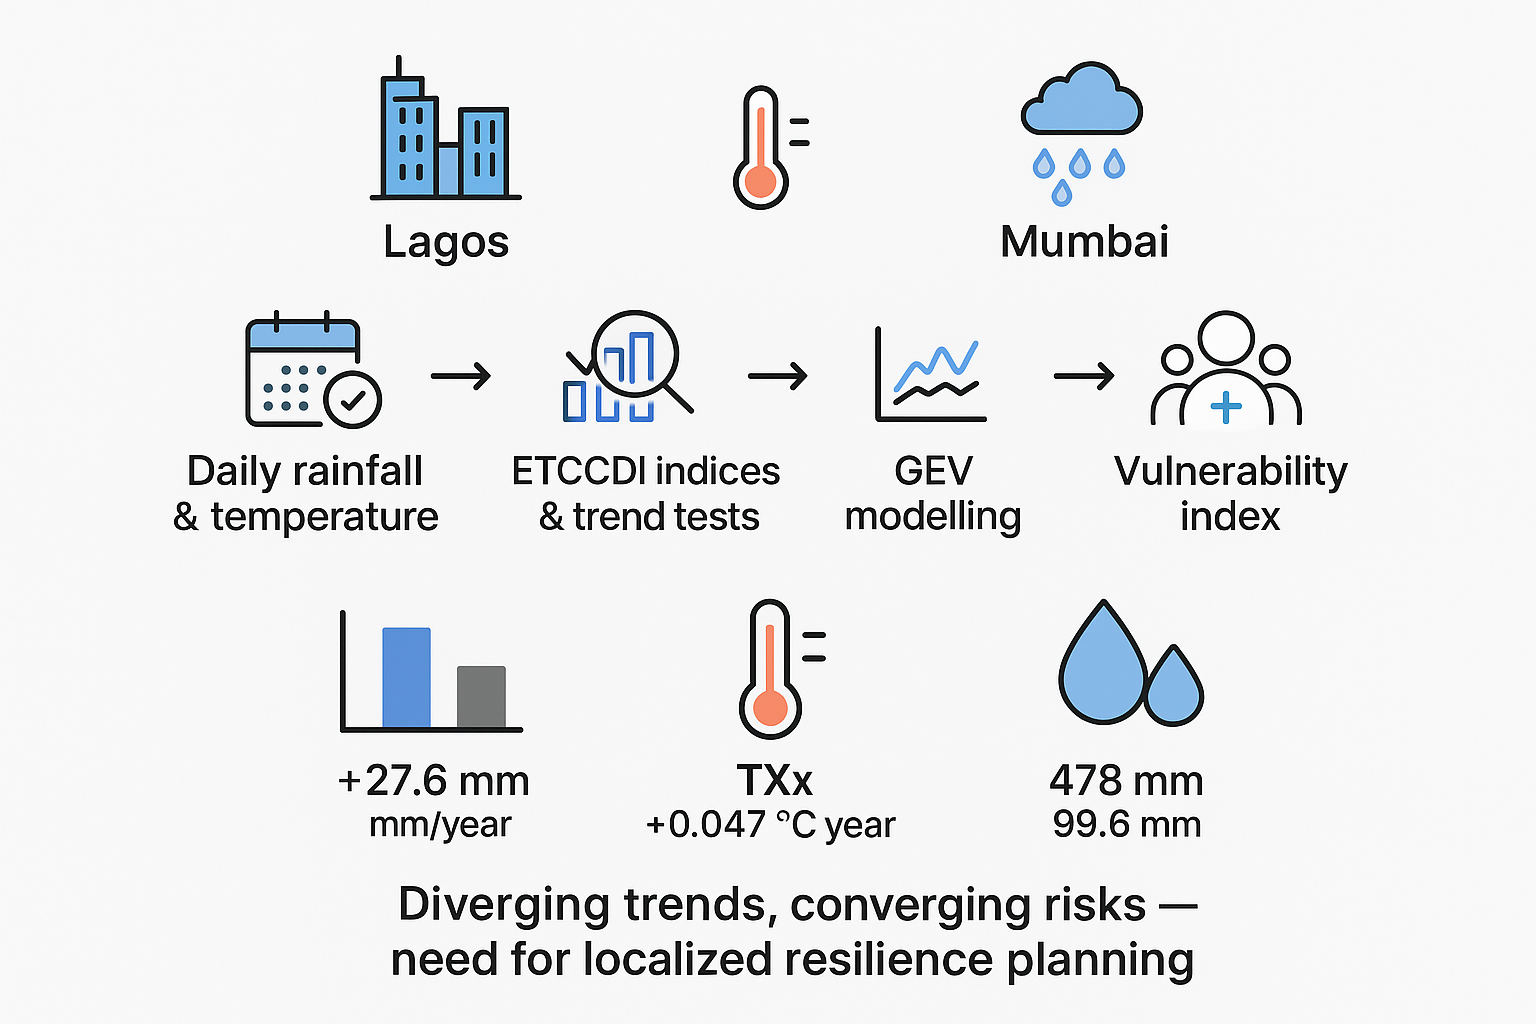
Coastal megacities are expected to experience higher and more frequent asymmetric hydroclimatic extremes with global warming, but few studies have assessed trends, extremes, and vulnerabilities under contrasting climatic regimes rigorously. This paper provides the first high-resolution comparative assessment of Lagos (Tropical West Africa) and Mumbai (monsoonal South Asia) using standardized indices and multi-decadal records (1981–2023). Daily temperatures and rainfall data were analyzed using ETCCDI extreme indices, non-parametric trend tests, and change-point detection methods. Stationary and non-stationary Generalized Extreme Value (GEV) models were fitted to provide estimates of evolving return levels of extreme rain and heat, and a composite socio-environmental vulnerability index which includes population density, infrastructure, and healthcare accessibility was generated. The results reflect opposing climate trends: Mumbai experienced a steeper increase in rainfall (+27.6 mm/year) versus Lagos (+4.07 mm/year), whereas the two cities both warmed significantly—nighttime temperatures in particular. Lagos experienced rising extreme heat (TXx, +0.047 °C/year), whereas Mumbai reflected a rise in chronic wet spells (CWD, +0.133 days/year). A regime shift was identified using change-point analysis in Mumbai around 2003–2005, corresponding with strengthening monsoons. Intense events grew more prominent and remained clustered in both cities, although Lagos exhibits larger interannual variability. GEV-based return level estimation reveals much higher 100-year threshold rainfall in Mumbai (478 mm) than in Lagos (99.6 mm). Spatial analysis revealed that flood exposure heavily overlaps with high social vulnerability areas in both cities. This paper contributes new insights to understanding how urban climate risks are diverging in character but converging in effect. It emphasizes the need for synchronized, place-based resilience planning for cities facing compounding extremes and diverse capacities for adaptation.
Keywords:
climate extremes
; urban flooding
; GEV modeling
; compound events
; vulnerability mapping
; Lagos
; Mumbai
1. Introduction
Climate extremes in cities are on the rise in terms of both frequency and intensity globally, posing growing risks to cities—especially those in the Global South. Coastal megacities, in particular, face threats from a mix of hydroclimatic hazards such as excess rain, flooding, and increasing heatwaves compounded by high population, poor infrastructure, and state challenges (Swain et al., 2025; Wang et al., 2022). Lagos and Mumbai exemplify these problems in two different climatic regimes: humid tropical West Africa and monsoon South Asia. Despite their atmospheric driver variations, both cities experience frequent urban flooding, heat stress, and systematic exposure of vulnerable groups (Halder et al., 2023).
There is growing literature on climate change-induced rainfall variability, heat waves, and flooding in Mumbai (R. Mann et al., 2023; Yadav et al., 2024), but Lagos literature has emphasized community exposure and localized flood resilience (Adegun, 2022; Ndimele et al., 2024; Obe et al., 2024). There are, nonetheless, significant gaps. There is not much comparative urban climate science that utilizes standardized indices—e.g., the ones delineated by the Expert Team on Climate Change Detection and Indices (ETCCDI)—to examine contrasting risk pathways in megacities globally. While Mumbai has benefited from the decades of monsoon-oriented climate model simulation, African cities such as Lagos are under-represented in terms of trend attribution with rigorous approaches such as non-parametric homogeneity tests or non-stationary generalized extreme value (GEV) models (Alexander et al., 2006; Coles, 2001; Katz et al., 2002). In addition, hardly any research integrates physical climate risks with socio-environmental exposure at the intra-urban scale despite increasing evidence that resilience planning must factor in both and their interdependence (Manandhar et al., 2023; Meerow et al., 2016).
This study bridges these gaps by conducting a comparative high-resolution analysis of climate extremes in Lagos and Mumbai from 1981 to 2023. The paper reports three innovations. It has two firsts. First, it is the first longitudinal comparison of humid tropical and monsoonal megacities using ETCCDI indices, Mann–Kendall trend tests, and change-point detection methods. Second, it employs non-stationary GEV modeling for comparing how return levels of rainfall and heat extremes are evolving in the context of climate change. Third, it applies a novel socio-environmental vulnerability index—based on metrics such as population density, informal settlement, access to drainage, and healthcare facilities—and intersects this with spatially interpolated climate risks to reveal compound hazard hotspots.
The study seeks to answer: How do socio-spatial vulnerabilities and climate extremes evolve in Lagos and Mumbai, and what do their varying hydroclimatic trajectories imply for urban resilience to come? To this end, it detects changes in trends and regimes of temperature and precipitation extremes; estimates changed return levels; measures compound event frequency and clustering; and maps hotspots of vulnerability by spatial integrated analysis. Ultimately, the results lay the data-driven foundation for adaptive risk governance in rapidly expanding coastal cities.
2. Methodology
2.1. Description of Study Areas
Lagos, Nigeria, sits on the Gulf of Guinea and is Africa's largest metropolis with a tropical monsoon climate with a distinct wet and dry season. Urbanization has brought on large-scale land reclamation and occupation of low-lying floodplains so that regular flash floods happen during the rainy season months of peak rainfall (Njoku et al., 2023; Olukunga et al., 2024). Conversely, Mumbai on India's western coast along the Arabian Sea features a monsoon regime in which over 80% of rainfall throughout the year occurs between June and August. The city is highly developed with limited permeable surfaces, and hence, urban runoff easily exceeds drainage capacity during heavy rainfalls (Halder et al., 2023; Ranger et al., 2010). These cities have been selected due to their comparable exposure to climate-driven flood hazard but differing climatic regimes—monsoon (Mumbai) versus tropical (Lagos)—exemplifying a compelling motivation for cross-regional examination of climate extremes and vulnerability. The spatial extent of the study area is shown in Figure 1.
2.2. Datasets and Sources
We employed high-resolution gridded climate information to assess rainfall and temperature trends in the 43-year study period. These were retrieved from the Climate Hazards Group InfraRed Precipitation with Station Data (CHIRPS v2.0), a satellite-situation station combined product that is applied to generate high-quality rain estimates in data-limited tropics (Funk et al., 2015) Maximum and minimum air temperature values (Tmax, Tmin) were obtained from ERA5-Land, a global reanalysis product of the ECMWF that offers long-term consistent, urban-scale climate information (Muñoz-Sabater et al., 2021). Administrative boundaries were sourced from national GIS repositories: Local Government Areas (LGAs) for Lagos and district boundaries for Mumbai. Socio-environmental data—in particular, population, percentage of informal housing, healthcare accessibility, and drainage coverage—was sourced from national censuses and peer-reviewed literature (Halder et al., 2023; Ndimele et al., 2024), see 1.

Table 1.
Datasets Used in the Study (1981–2023).
| Dataset | Variables | Source | Resolution | Period |
| CHIRPS v2.0 | Daily Rainfall | UCSB | 0.05° (5.5 km | 1981–2023 |
| ERA5-Land | Tmax, Tmin | ECMWF | 0.1° (9 km) | 1981–2023 |
| Administrative | Lagos and Mumbai | GDAM Level2 | shapefiles | Current |
| Socio-environmental | Population, drainage, health, housing | Census & literature | Administrative | Latest available |
Note: This table summarizes the primary datasets used for analyzing precipitation and temperature extremes, and for constructing vulnerability layers for Lagos and Mumbai. Source: Authors’ compilation based on UCSB, ECMWF, GDAM, and national census data.
2.3. Climate Trend Analysis
Linear regression and Theil–Sen slope estimator were employed to time series of daily and seasonal totals of rainfall, Tmax, Tmin, and diurnal temperature range (DTR) in an attempt to determine long-term trends in rainfall and temperature. The trends were examined for the four climatological seasons: December–February (DJF), March–May (MAM), June–August (JJA), and September–November (SON). Even though linear regression is classically used for trend estimation, it is highly susceptible to outliers and also asks for residuals to be normally distributed—two conditions often violated in hydroclimatic data. The Theil–Sen estimator, however, is a non-parametric estimator which puts forward the median of all the pairwise slopes:
Its robustness against non-normality and outlying observations makes it more suitable for climate work, particularly in high interannual variability regions like Lagos and Mumbai (Oke, 1982; Sen, 1968). Both approaches are used dually with both interpretability and resistance to data abnormalities.
2.4. Climate Extremes Using ETCCDI Indices
To determine the frequency, persistence, and intensity of hydroclimatic extremes, five ETCCDI indices were calculated: TXx, TNn, RX1day, CWD, and CDD. These indices, calculated with the RClimDex package of R, are based on WMO standard definitions (Zhang et al., 2011). Other techniques like percentile-based threshold exceedances or region-dependent definitions have also been investigated, but ETCCDI indices have global inter-comparability, are thoroughly tested, and are appropriate for long-term gridded data. Their standardization makes it possible for them to compare inter-city and inter-decadal, and hence, they are perfectly suitable for this comparative analysis. Mann–Kendall tests have been used to check trends in these indices due to their non-parametric nature, which is more suitable for non-normal, autocorrelated climate time series(Hamed & Ramachandra Rao, 1998; R. Mann et al., 2023; Yue & Wang, 2004).
2.5. Homogeneity and Change-Point Detection
Three tests were employed to identify potential structural breaks in climate series, i.e., regime shifts or long-term breaks: Pettitt's test, the Standard Normal Homogeneity Test (SNHT), and the Buishand Range Test (H. B. Mann, 1945). Pettitt's test is capable of detecting single sudden changes and is non-parametric, while SNHT and Buishand are better suited to detect stepwise mean shifts assuming normality (Arnfield, 2003). This triangulated approach ensures that observed changes are not artifacts of a single approach's assumptions or limitations. Techniques such as Bayesian Change Point or regime-switching models were considered but proved too advanced for year-resolution series with a single or double breaks expected.
2.6. Frequency and Cluster of Extreme Events
Extreme events were defined days on which rainfall or temperature were higher than the 95th percentile of the relevant variable's long-term distribution:
We estimated annual frequencies and analyzed seasonal concentration by Chi-square goodness-of-fit tests. Compound events—two or more extremes within five days—were tallied so that cascading risk scenarios could be investigated. Unlike threshold-based fixed values (e.g., rainfall >50mm/day), the percentile method is adaptive to local climatology and permits asymmetry of distribution. Clustering analysis captures stress build-up that cannot be deciphered by analyzing independent single events—critical in flood-prone cities with low recovery time.
2.7. Return Level Estimation Using GEV
Annual maxima of RX1day and TXx were fit to Generalized Extreme Value (GEV) distributions by maximum likelihood estimation (MLE) using the extRemes package in R (Katz et al., 2002). Models both stationary and non-stationary were employed. The latter added time to the location parameter as a covariate:
The full GEV distribution is defined as:
GEV analysis is the default method for back level estimation of climate extremes (Coles, 2001). Generalized Pareto distributions (GPD) require threshold selection and are more affected by sample size constraints. The GEV annual-maxima method provides conservative, interpretable return levels suitable for urban development goals like the 100-year flood.
2.8. Flood Exposure Spatial Mapping
To approximate exposure, RX1day mean raster layers and selected extreme rainfall indices were overlaid on LGA and district boundaries in QGIS 3.28. Administrative boundaries were subsequently quintiled into relative exposure levels (very low to very high), enabling governance-scale flood risk comparisons. While physically based hydrodynamic models such as HEC-RAS can yield more spatially detailed flood inundation predictions, their application in the current study was hindered by the following limitations: (i) lack of harmonized high-resolution topographic data availability (e.g., LiDAR-based DEMs), (ii) lack of availability of open-source city-wide drainage network data, and (iii) differences in the availability of hydraulic data across cities. These limit the robust parameterization and calibration of HEC-RAS for inter-city comparison in a consistent manner. Therefore, our approach promotes methodological consistency with rainfall extremes and administrative overlays—comparing both cities by identical, globally available datasets.
2.9. Composite Socio-Environmental Vulnerability Index
The vulnerability index was built with four indicators: population density, informal housing, drainage access, and healthcare availability. All variables were normalized using min–max scaling and weighted equally to produce the overall zone-level variables:
where is the vulnerability score for zone i, and represents each normalized indicator.
Compared to other more complex multi-criteria decision analysis (MCDA) or PCA-based indices, the equal-weight min–max method offers policy relevance and simplicity with analytical coherence (Halder et al., 2023; Meerow et al., 2016). The spatially defined vulnerability is inclusive of equitable adaptation planning by setting boundaries in which social vulnerability and hazard exposure converge.
2.10. Software and Tools
All statistical analyses, trend detection, and extreme value modeling were conducted in R (version 4.3) using the relevant packages RClimDex, Kendall, and extRemes. Geospatial computation including raster clipping, zonal analysis, and exposure mapping was performed on QGIS (version 3.28). Python (xarray, pandas) was used when appropriate for preprocessing giant NetCDF datasets, while Microsoft Excel was used for tabulation and data cleaning.
Summary of the methodological process is provided in Figure 2 (flowchart of methodology).
3. Results
3.1. Climate Trends
Annual regimes of rainfall in Lagos and Mumbai show varying hydroclimatic regimes conditioned by their geographical and monsoonal backgrounds. Lagos, in the humid tropics of West Africa, received an average annual precipitation of 1616.14 mm (SD = 210.38 mm) from 1981 to 2023. Interannual amounts ranged from 1220.44 mm to 2052.02 mm with a slight but positive trend of +4.07 mm/year. This reflects a moderately stable regime of rainfall with progressive increasing intensity over time (Figure 3a). Mumbai, in contrast, experiences much higher rainfall from the South Asian monsoon. The city's mean annual total was 2499.16 mm (SD = 601.39 mm) with highly extreme variation ranging from 1571.61 mm to a record of 4057.04 mm. There was a positive increasing trend of +27.60 mm/year reflecting a statistically significant intensification of monsoonal rainfall. This concurs with current studies that document the re-emergence of monsoon intensity and heavy rainfall events in coastal India.
Seasonal distribution of rainfall also highlights hydroclimatic divergence between the two cities (Figure 3b). For Lagos, September–November (SON) received the highest rainfall at an average of 503.60 mm (SD = 116.07 mm), followed by June–August (JJA) at 637.71 mm. A notable positive trend of +3.89 mm/year in SON was recorded, reflecting enhanced late-season convection. The March–May (MAM) season, on the other hand, experienced a small downwards trend (–0.64 mm/year), which might reflect diminished early-season rain mechanisms, potentially associated with the changes in Atlantic sea surface temperatures or local convection regimes. Mumbai rainfall was highly localized in JJA with a mean of 2002.22 mm (SD = 470.30 mm), which reflects its dependence on the Southwest Monsoon. The season contributed the maximum rising trend (+20.48 mm/year). SON contributed a moderate 482.83 mm, and MAM and DJF (December–February) were very small contributors with means of 13.28 mm and 0.82 mm, respectively, possessing merely marginal trends over the course of the study.
Long-term temperature research also exhibited long-established warming signals for the two cities (Figure 4a), much the same as for rainfall. Lagos's mean maximum and minimum temperatures on an annual basis were 29.38°C and 24.13°C, respectively. A warming trend of +0.023°C/year was observed for Tmax and +0.018°C/year for Tmin, consistent with broader regional warming trends observed over West Africa. Mumbai exhibited a slightly warmer Tmax mean (30.92°C), Tmin being 22.69°C. Notably, while the Tmin trend at Mumbai agreed with that at Lagos at +0.023°C/year, its Tmax trend was lower (+0.013°C/year), an illustration of an asymmetric warming trend — a process often referred to as increased retention of night heat over urban environments.
Further seasonal division of Tmax trends (Figure 4b) showed great differences. DJF was Lagos' warmest season with average Tmax of 31.26°C and maximum season warming rate of +0.042°C/year. MAM and SON followed, with JJA experiencing minimum Tmax (27.33°C) and smallest trend (+0.013°C/year) presumably due to increased cloud cover and convection during peak rains. During the MAM season, the highest Tmax (33.66°C) was recorded in Mumbai, with a significant upward trend (+0.023°C/year), aligning with intensifying pre-monsoon heatwaves over South Asia. During the JJA season, despite being warm (28.62°C), the trend was marginal (+0.003°C/year), probably subdued by frequent monsoonal cloud cover and precipitation.
To these temperature trends, diurnal temperature range (DTR) — the difference Tmax – Tmin — provides information on nighttime warming and the urban heat island process (Figure 5). Lagos possesses an average DTR of 5.25°C with a faint but positive trend of +0.004°C/year. This widening gap may be evidence of reduced nighttime cooling or increased daytime heating due to land use conversion or urban expansion. On the other hand, Mumbai had a greater mean DTR of 8.23°C but one that declined at –0.010°C/year, reflecting increasing night temperatures and a reduction in the thermal difference, as would be predicted with increased urban heat retention and radiative pollution and infrastructure intensity effects.
3.2. ETCCDI Climate Extremes
The extreme climate analysis from five basic ETCCDI indices—Consecutive Dry Days (CDD), Consecutive Wet Days (CWD), Maximum 1-Day Precipitation (RX1day), Annual Maximum of Daily Maximum Temperature (TXx), and Annual Minimum of Daily Minimum Temperature (TNn)—determined spatial variation and asymmetric trends between Lagos and Mumbai during 1981-2023 (Figure 6; Table 2).
In Lagos, trends show a statistically significant increase in TXx (Sen's slope = +0.047 °C/year, p = 0.0003), reflecting the improvement of extreme daytimes heat. Conversely, CWD exhibited a minimal negative trend (–0.091 days/year, p = 0.077), which means decreased wet spell length, albeit statistically insignificant at 5%. RX1day and TNn had negligible trends (p > 0.05), while CDD remained unchanged, implying minimal dry spell length variation.
In Mumbai, CWD increased significantly (+0.133 days/year, p = 0.0075), potentially indicating more persistent monsoonal rainfall. However, the trends in TXx and RX1day—though positive—were not statistically significant, suggesting variability rather than directional change. CDD showed a flat, non-significant trend, despite Mumbai’s high baseline dry-day average (144.93 days). TNn exhibited a weak upward trend (p = 0.18), hinting at milder extreme cold events.
These tendencies imply a warming message concentrated in daytime maxima for Lagos, but Mumbai has stronger messages in persistent wet extremes. The discrepancy should stem from differential responses to tropical Atlantic and Indian Ocean SSTs, and local land-use structures.
For identifying the temporal stability of annual rainfall series, three statistical homogeneity tests were applied to Lagos and Mumbai (Table 3). In Lagos, both the Standard Normal Homogeneity Test (SNHT) and Buishand Range Test identified a suspected change point in year 2005 with respective test statistics of Tₘₐₓ = 10.74 and Q = 11.64. Pettitt's test, nonetheless, suggested a probable shift in 1996, even though the result wasn't statistically significant (p = 0.3323), revealing no clear suggestion of any abrupt change in Lagos rainfall over the period.
In contrast, Mumbai showed consistent indications of a structural break. Both SNHT and Buishand tests also identified 2005 as the likely breakpoint, while Pettitt’s test detected a statistically significant shift in 2003 (U = 169, p = 0.0043*). This suggests a potential regime change in Mumbai’s hydroclimate, possibly linked to broader monsoonal variability or teleconnection patterns such as the Indian Ocean Dipole.
3.3. Frequency of Extreme Events
The frequency and distribution of daily extreme events, as exceedances above the 99th percentile, vary extensively across Lagos and Mumbai from 1981 to 2023. Over the 43-year period, Lagos recorded 465 extreme events, corresponding to a mean of 10.81 events per year (SD = 13.38), while Mumbai recorded a similar figure of 469 events (mean = 10.91; SD = 5.87). Although both cities exhibit positive trends in annual event recurrence — +0.36/year for Lagos and +0.22/year for Mumbai — the more significant variability for Lagos places emphasis on stronger between-year oscillations potentially associated with Atlantic Ocean modes and local convection (Figure 7a).
Month-by-month patterns highlight the varying seasonal signatures of extreme event occurrence. For Lagos, the extremes are concentrated in dry season and pre-monsoon months of February (mean = 5.37) and March (mean = 4.89), while monsoon-season months (June–October) experience lower and less variable frequencies, with several months restricted to just 1–2 events. Mumbai, in contrast, experiences a more symmetrical distribution with a peak in May (mean = 3.85) and April (2.89), consistent with pre-monsoonal heat build-up and early convective rain. Surprisingly, July and August, the months of peak monsoon, continue to have moderate event counts, which is indicative of a weaker but persistent tail of extremes (Figure 7b).
In order to test the seasonal concentration of extremes, a χ² goodness-of-fit test was conducted on the monthly distribution of events. Results were highly significant (p < 2.2×10⁻¹⁶ for all variables in both cities), testifying to strong departures from uniformity (Table 4). This is suggestive of the concentration of events in specific months, confirming the seasonally skewed nature of rainfall and temperature extremes in tropical megacities.
Further analysis of compound or sequential extreme events — extremes that occur in close succession — identified 171 in Lagos and 173 in Mumbai. In Lagos, the earliest was recorded on June 26, 1981, and the latest on December 25, 2023, while Mumbai’s first and last events occurred on April 9, 1981, and June 11, 2023, respectively (Figure 8). These sequences may indicate a rising likelihood of flood-prone clustered rainfall, intensifying the hazard risk in both urban systems.
3.4. Return Level Analysis
Extreme value theory was applied to model the recurrence of extreme climate extremes through the Generalized Extreme Value (GEV) distribution. Return levels were computed under stationary assumptions for 2-, 5-, 10-, 50-, and 100-year return periods for daily maximum rainfall (RX1day) and annual temperature maxima (TXx) (Figure 9a). These metrics offer practical information on the magnitude of future extreme events under baseline climate variability.
In Lagos, the 2-year return period of rainfall is approximately 52.53 mm, increasing to 99.55 mm for the 100-year event. Temperature extremes, however, are slightly less steep, with TXx return levels ranging from 33.73°C (2-year) to 36.00°C (100-year), indicating a slim but upward distribution tail likely tempered by coastal tropical buffering. In Mumbai, the GEV model identifies a more extreme tail in rainfall extremes. The 2-year return period of rainfall is 201.93 mm, increasing to 477.98 mm for 100-year events — nearly a factor of five higher than Lagos — consistent with monsoonal intensification and short-duration flash flood hazard. TXx return levels in Mumbai also suggest a steady increase, from 38.64°C to 40.11°C, with the implication of possible future heat wave intensification despite their modest incremental slope.
To investigate non-stationary behavior in extremes, a time-dependent GEV model was fitted by allowing the location parameter (μ) to vary linearly over time (Figure 9b). For rainfall, Lagos experienced a small μ increase from 60 mm to 66.3 mm, representing a slope of +0.15 mm/year. Mumbai experienced a greater shift with μ increasing from 230 mm to 240.5 mm, representing a slope of +0.25 mm/year. These findings reveal directionally increased intensification of extreme rainfall intensity, especially in Mumbai, which could be because of oceanic warming and urban-induced convection
3.5. Socio-Environmental and Spatial Vulnerability Overlay
District-level administrative boundaries in Lagos and Mumbai were spatially overlaid with a gridded flood risk index to assess intra-urban flood susceptibility. Highlighted in Figure 10, the geospatial overlay visualizes localized flood hotspots through mean exposure scores.
In Lagos, all 20 Local Government Areas (LGAs) have high flood risk, with the highest values for Agege and Ikeja (160), followed by Mushin (159) and Alimosho (158.67). Surprisingly, coastal towns such as Ibeju-Lekki (158.14) and Lagos Island (158.10) are also among the top ranks, reflecting compounded exposure to coastal surge, fluvial overflow, and pluvial flash flooding. The spatial aggregation of high-risk LGAs — coastal and inland — reflects the synergistic effect of uncontrolled land-use conversion, drainage deficiency, and urban sprawl.
In Mumbai, the risk is similarly elevated in five inner city municipalities. Even though a few units remain administratively unlabeled, spatial codes (e.g., 1556, 1565, 1569) identify central flood hazard zones with mean risk scores varying between 155.5 and 158.4. These areas intersect with low-lying historic flood areas, where high monsoonal oscillations and high-density urban construction converge to increase surface runoff and drainage failure. The relatively limited range of risk values indicates consistently high exposure across the metropolitan interior, which most likely reflects consistently impervious land use and highly concentrated rainfalls.
To complement the physical flood exposure estimation, a composite index was developed using population density, informal housing, drainage infrastructure coverage, and healthcare accessibility by districts. Figure 11 is the comparative heatmap of socio-environmental vulnerability between Lagos and Mumbai.
The most vulnerable districts in Lagos were Mushin (0.79), Alimosho (0.73), and Agege (0.71) according to a combination of high levels of informal housing (45–55%) and low coverage of drainage (<35%). Conversely, districts like Ikeja and Lagos Island displayed lower vulnerability, benefiting from better infrastructure and services. Mumbai’s core wards exhibited similarly elevated vulnerability scores (0.69–0.76), largely driven by extreme population densities (>25,000/km²) and limited formal housing. Despite better healthcare access than Lagos, deficient drainage in high-density areas intensified their composite risk profiles.
The spatial association of flood exposure zones and high-vulnerability districts means that comprehensive reduction of risk is needed. While this analysis presents a first-order assessment, the addition of social capital, income disparity, and institutional readiness would further enhance district-level planning of resilience.
4. Discussion
This paper provides a comparative, multi-scalar analysis of climate extremes and spatial vulnerability within Lagos and Mumbai, two rapidly expanding coastal megacities under increased hydroclimatic stressors. The results show asymmetric but converging risks driven by climatic, infrastructural, and socio-economic factors. These remarks have considerable implications for urban adaptation planning, infrastructure engineering, and climate risk management.
4.1. Diverging Hydroclimatic Extremes
The contrasting rain regimes in Mumbai and Lagos reflect their varying climatic contexts—West African tropical rain and South Asian monsoon-precipitation. The intensification of rainfall in Mumbai (+27.6 mm/year), especially for JJA, confirms previous conclusions of the recovery of the monsoon in South Asia (Beck et al., 2017; Dinku et al., 2018; Njoku et al., 2023; Schumacher, 2017). Our findings add to this by showing that such intensification is also altering the return periods of extreme events, pushing Mumbai’s 100-year rainfall return level near 478 mm, nearly five times that of Lagos. Lagos, while exhibiting more moderate trends (+4.07 mm/year), shows seasonal intensification during SON (+3.89 mm/year), possibly linked to shifting Atlantic sea surface temperatures. This builds on prior regional assessments (Obe et al., 2024) by presenting city-scale, high-resolution analysis of West Africa's coastal belt rainfall trends—often underrepresented in hydroclimate research.
Temperature trends in both cities are warming but with dramatically different patterns. Lagos shows steady increases in Tmax and Tmin, while Mumbai has stronger nocturnal warming, evidenced in its diminished diurnal temperature range (DTR). It supports urban heat island processes according to (Guo et al., 2022; Shahfahad et al., 2023; Zhao & He, 2022), especially in high-density cities with extensive impervious surfaces. Our study builds on this evidence by comparing two global South cities and linking DTR changes directly to spatial vulnerability profiles.
4.2. Climate Extremes and Regime Shifts
Analysis of the ETCCDI index provides varied climate extreme paths. Lagos has robust rising trends in TXx (+0.047 °C/year, p < 0.01), which supports earlier observations of enhanced heat stress over West Africa (Ogunjo et al., 2021). Mumbai, however, has robust rising trends in CWD (+0.133 days/year, p < 0.01), indicating prolonged wet spells. This corroborates evidence by (Dharmarathne et al., 2024; Donat et al., 2013) regarding sustained monsoon rainfall and adds support to the increasing awareness of wet extremes as a primary flood driver in coastal India.
Identification of a statistically significant breakpoint in the Mumbai rainfall series near 2003 corroborates evidence of hydroclimatic regime change triggered by the Indian Ocean Dipole and aerosol forcing (Trenberth, 2011; Xiong & Yang, 2024). Lagos exhibits indication of progression in Buishand and SNHT tests (Aguilar et al., 2005) but absence of verification in Pettitt's test suggests a more gradual evolution. This divergence contributes to the scholarship on the temporal evolution of climate hazards in cities and suggests differential temporal windows for adaptive planning. These results emphasize that both cities are warming and experiencing extreme rainfall but the nature and direction of those extremes vary. The policymakers thus have to localize adaptation measures instead of using universal climate risk frameworks.
4.3. Extremes Clustering and Rising Flood Hazard
Although driven by different rainfall drivers, both cities have recorded over 170 compound extreme events between 1981 and 2023. Whereas in Lagos they are more concentrated in the dry-to-wet transition months (Feb–Mar), in Mumbai, pre-monsoon (Apr–May) is the peak for these compound events with their extension to monsoon months. These compound events, with nearness in time, are likely to be worse than individual extremes since they can cause cumulative strain on drainage systems, infrastructure, and emergency services.
GEV analysis affirms this necessity. The steep gradient in Mumbai’s RX1day return levels—from ~202 mm (2-year) to ~478 mm (100-year)—underscores the growing flash flood potential, while non-stationary GEV models reveal rising location parameters in both cities. The increase in Mumbai (+0.25 mm/year) is particularly concerning and aligns with growing calls in climate risk literature for dynamic design standards that reflect shifting baselines (Adegun, 2022; Ndimele et al., 2024). Our findings validate the incorporation of non-stationary risk models in urban drainage design, floodplain zoning, and building codes. They also validate the use of early warning systems and rainfall thresholds for emergency preparedness in high-density, low-lying zones.
4.4. Socio-Spatial Inequality and Compounded Urban Vulnerability
Spatial overlap among physical flood exposure and socio-environmental vulnerability reveals striking inequalities. In Lagos, the most hazard-risk districts such as Mushin, Alimosho, and Agege also have the highest scores of vulnerability—characterized by dense informal settlements, inadequate drainage, and inadequate access to healthcare. Similarly, in Mumbai, urban center wards that are most exposed to high floods are indicative of the poorest infrastructure and most densely populated areas. Such co-location of hazard and vulnerability supports existing theories of socially constructed risk (Daniel, 2009; Kelbaugh, 2019; Olukunga et al., 2024). It also validates the concept of "double exposure" in climate literature, wherein populations are exposed both physically and structurally (Yadav et al., 2024).
Through the integration of social data and climate extremes, our study contributes to an ever-strengthening body of research that advocates for equity-based adaptation. Differing from traditional hazard mapping, our vulnerability overlay identifies "hotspots of concern" where targeted investment in social services, affordable housing, and participatory planning will yield the highest returns on resilience. Urban adaptation must go beyond the infrastructure to include social infrastructure and capacity of institutions.
4.5. Policy Implications
The findings of this study offer policy suggestions for urban planning that is resilient to climate change. The determination of wards that are socially vulnerable, as well as being at high flood risk, requires specific adaptation policy at the sub-city level. In both Lagos and Mumbai, integrating climate risk maps with social infrastructure planning has the potential to inform prioritization of investments in drainage infrastructure, early warning systems, and public health facilities(Jay et al., 2021; Rezvani et al., 2023). Moreover, recognizing growing extremes—namely compound rainstorms and rising return levels—requires revising design criteria for floods, zoning codes, and insurance coverage to reflect non-stationary climate baselines.
Urban planners ought to adopt participatory risk mapping to involve traditionally marginalized groups within informal settlements. Hazard-vulnerability overlap necessitates that technical solutions alone are insufficient; inclusive government, enhanced data transparency, and local institutional capacity building must accompany structural adaptation. Future studies can examine the mediating effect of governance quality and institutional response capacity on these risks and including climate model projections to provide estimates of future scenario-based planning needs.
5. Conclusions
This research provides the first multi-decadal comparative, standardized analysis of hydroclimatic extremes, return levels, and spatial vulnerability for Lagos and Mumbai—two megacities typical of the collective risks facing rapidly developing regions in the Global South. Our findings sketch out increasingly different but intensifying climate trajectories: Mumbai faces an increase in rainfall extremes at a higher rate, while Lagos faces more warming and heat extremes. Despite these differences, both cities exhibit increasing recurrence and clustering of compound events and extensive overlaps between physical exposure and socio-environmental vulnerability. These results highlight the urgent need for joined-up urban resilience interventions addressing climate extremes as much as social inequalities at the same time. Classic flood control and temperature decrease measures are not sufficient without addressing underlying vulnerabilities such as informal settlement, inadequate drainage, and health inequalities. Policy designers need to set a priority for spatially focused interventions that link climate adaptation with other development objectives.
5.1. Major Implications for Policy and Practice
The results demand immediate, targeted action to avert systemic urban crises:
- i.
- Develop flood control strategies specifically for high-risk areas, such as Mushin and Agege in Lagos and low-lying areas in Mumbai, where extreme rainfall and clustering are most significant.
- ii.
- Integrate heat resilience into housing and urban design standards, particularly in densely populated informal settlements undergoing nighttime warming and declining diurnal temperature ranges.
- iii.
- Enhance early warning systems to counteract compound hazards, using rainfall, temperature, and drainage data in more effective disaster preparation.
- iv.
- Utilize composite vulnerability indexes when allocating resources to invest in flood mitigation to target specifically the most socio-environmentally vulnerable communities.
- v.
- Revise zoning and building laws to account for non-stationary climate risks, adding updated return levels and shifting hazard patterns into policies.
- vi.
- Promote coordinated South-South collaboration between megacities to share lessons from one another on translatable urban adaptation planning across different climatic environments.
5.2. Future Research Recommendations
To address critical knowledge gaps, subsequent studies should:
- i.
- Extend comparative analysis to other Global South cities to learn about consistent resilience deficiencies across different hydroclimatic regimes.
- ii.
- Track temporal patterns in city vulnerability, merging land use, poverty alleviation, population growth, and urban infrastructure development trends.
- iii.
- Employ high-resolution urban climate models to simulate localized flooding and heat impacts in dense, data-poor neighborhoods.
- iv.
- Validate extreme event models with ground-level effect observations, such as hospital discharge data, insurance claims, and flood occurrence reports.
- v.
- Extrapolate compound risk hazards from downscaled climate scenarios, to estimate future exposure under alternative emissions pathways.
- vi.
- Analyze how scientific evidence informs urban governance, including institutional barriers, policy translation, and adaptation financing.
Author Contributions
All authors contributed to the study conception and design. Material preparation, data collection, and analysis were performed by Auwal Ahmad Musa. The vulnerability framework and spatial analysis were developed collaboratively by Auwal Ahmad Musa and Khaldoon A. Mourad. The first draft of the manuscript was written by Auwal Ahmad Musa, and both authors commented on and reviewed previous versions of the manuscript. All authors read and approved the final manuscript.
Funding
The authors declare that no funds, grants, or other support were received during the preparation of this manuscript.
Data Availability Statement
The datasets and R scripts supporting this study are publicly available via Zenodo at: https://doi.org/10.5281/zenodo.15420636 . This includes climate data (CHIRPS, ERA5-Land), processed ETCCDI indices, and the R scripts used for trend analysis, GEV modeling, and vulnerability mapping.
Conflicts of Interest
The authors have no relevant financial or non-financial interests to disclose.
References
- Adegun, O. B. (2022). Climatic disasters within a flood-prone coastal slum in Lagos: coping capacities and adaptation prospects. International Journal of Disaster Resilience in the Built Environment. [CrossRef]
- Aguilar, E. , Peterson, T. C., Obando, P. R., Frutos, R., Retana, J. A., Solera, M., Soley, J., García, I. G., Araujo, R. M., Santos, A. R., Valle, V. E., Brunet, M., Aguilar, L., Álvarez, L., Bautista, M., Castañón, C., Herrera, L., Ruano, E., Sinay, J. J., … Mayorga, R. (2005). Changes in precipitation and temperature extremes in Central America and northern South America, 1961–2003. Journal of Geophysical Research: Atmospheres. [CrossRef]
- Alexander, L. V, Zhang, X., Peterson, T. C., Caesar, J., Gleason, B., Klein Tank, A. M. G., Haylock, M., Collins, D., Trewin, B., Rahimzadeh, F., Tagipour, A., Rupa Kumar, K., Revadekar, J., Griffiths, G., Vincent, L., Stephenson, D. B., Burn, J., Aguilar, E., Brunet, M., … Vazquez-Aguirre, J. L. (2006). Global observed changes in daily climate extremes of temperature and precipitation. Journal of Geophysical Research: Atmospheres. [CrossRef]
- Arnfield, A. J. (2003). Two decades of urban climate research: a review of turbulence, exchanges of energy and water, and the urban heat island. International Journal of Climatology. [CrossRef]
- Beck, H. E. , Vergopolan, N., Pan, M., Levizzani, V., van Dijk, A. I. J. M., Weedon, G. P., Brocca, L., Pappenberger, F., Huffman, G. J., & Wood, E. F. (2017). Global-scale evaluation of 22 precipitation datasets using gauge observations and hydrological modeling. Hydrology and Earth System Sciences. [CrossRef]
- Coles, S. (2001). An Introduction to Statistical Modeling of Extreme Values. In Springer Series in Statistics. Springer London. [CrossRef]
- Daniel, H. (2009). World Meteorological Organization (WMO). In Max Planck Encyclopedia of Public International Law. Oxford University Press. [CrossRef]
- Dharmarathne, G. , Waduge, A. O., Bogahawaththa, M., Rathnayake, U., & Meddage, D. P. P. (2024). Adapting cities to the surge: A comprehensive review of climate-induced urban flooding. Results in Engineering. [CrossRef]
- Dinku, T., Funk, C., Peterson, P., Maidment, R., Tadesse, T., Gadain, H., & Ceccato, P. (2018). Validation of the CHIRPS satellite rainfall estimates over eastern Africa. Quarterly Journal of the Royal Meteorological Society, 144(S1), 292–312. [CrossRef]
- Donat, M. G. , Alexander, L. V, Yang, H., Durre, I., Vose, R., & Caesar, J. (2013). Global Land-Based Datasets for Monitoring Climatic Extremes. Bulletin of the American Meteorological Society. [CrossRef]
- Funk, C. , Peterson, P., Landsfeld, M., Pedreros, D., Verdin, J., Shukla, S., Husak, G., Rowland, J., Harrison, L., Hoell, A., & Michaelsen, J. (2015). The climate hazards infrared precipitation with stations—a new environmental record for monitoring extremes. Scientific Data. [CrossRef]
- Guo, L. , Di, L., Zhang, C., Lin, L., Chen, F., & Molla, A. (2022). Evaluating contributions of urbanization and global climate change to urban land surface temperature change: a case study in Lagos, Nigeria. Scientific Reports. [CrossRef]
- Halder, D., Garg, R. D., & Fedotov, A. (2023). Latitudinal Trend Analysis of Land Surface Temperature to Identify Urban Heat Pockets in Global Coastal Megacities. Remote Sensing, 15(5), 1355. [CrossRef]
- Hamed, K. H. , & Ramachandra Rao, A. (1998). A modified Mann-Kendall trend test for autocorrelated data. Journal of Hydrology. [CrossRef]
- Jay, O. , Capon, A., Berry, P., Broderick, C., de Dear, R., Havenith, G., Honda, Y., Kovats, R. S., Ma, W., Malik, A., Morris, N. B., Nybo, L., Seneviratne, S. I., Vanos, J., & Ebi, K. L. (2021). Reducing the health effects of hot weather and heat extremes: from personal cooling strategies to green cities. The Lancet. [CrossRef]
- Katz, R. W. , Parlange, M. B., & Naveau, P. (2002). Statistics of extremes in hydrology. Advances in Water Resources. [CrossRef]
- Kelbaugh, D. (2019). The Urban Fix: Resilient Cities in the War Against Climate Change, Heat Islands and Overpopulation. Routledge. [CrossRef]
- Manandhar, B. , Cui, S., Wang, L., & Shrestha, S. (2023). Urban Flood Hazard Assessment and Management Practices in South Asia: A Review. Land. [CrossRef]
- Mann, H. B. (1945). Nonparametric Tests Against Trend. Econometrica. [CrossRef]
- Mann, R. , Gupta, A., Dhorde, A., & Sharma, S. (2023). Observed trends and coherent changes in daily rainfall extremes over Greater Mumbai, 1985–2020. Theoretical and Applied Climatology. [CrossRef]
- Meerow, S. , Newell, J. P., & Stults, M. (2016). Defining urban resilience: A review. Landscape and Urban Planning. [CrossRef]
- Muñoz-Sabater, J. , Dutra, E., Agustí-Panareda, A., Albergel, C., Arduini, G., Balsamo, G., Boussetta, S., Choulga, M., Harrigan, S., Hersbach, H., Martens, B., Miralles, D. G., Piles, M., Rodríguez-Fernández, N. J., Zsoter, E., Buontempo, C., & Thépaut, J.-N. (2021). ERA5-Land: a state-of-the-art global reanalysis dataset for land applications. Earth System Science Data. [CrossRef]
- Ndimele, P. E. , Ojewole, A. E., Mekuleyi, G. O., Badmos, L. A., Agosu, C. M., Olatunbosun, E. S., Lawal, O. O., Shittu, J. A., Joseph, O. O., Ositimehin, K. M., Ndimele, F. C., Ojewole, C. O., Abdulganiy, I. O., & Ayodele, O. T. (2024). Vulnerability, Resilience and Adaptation of Lagos Coastal Communities to Flooding. Earth Science, Systems and Society. [CrossRef]
- Njoku, C. A. , Ojeh, V. N., Naabil, E., Ekwe, M. C., Joshua, M. M., Elijah, E., & Malgwi, M. W. (2023). Analysis of Rainfall Trend and Variability in Lagos, Southwestern Nigeria. In Climate Change Impacts on Nigeria (pp. 115–134). Springer International Publishing. [CrossRef]
- Obe, O. B. , Morakinyo, T. E., & Mills, G. (2024). An assessment of WRF-urban schemes in simulating local meteorology for heat stress analysis in a tropical sub-Saharan African city, Lagos, Nigeria. International Journal of Biometeorology. [CrossRef]
- Oke, T. R. (1982). The energetic basis of the urban heat island. Quarterly Journal of the Royal Meteorological Society. [CrossRef]
- Olukunga, O. A., Adewumi, B. J., & Hassan, T. (2024). Comparative Analysis of Flood Mitigation Strategies for Residential Housing in Lagos State. African Journal of Environmental Sciences and Renewable Energy, 15(1), 209–225. [CrossRef]
- Ranger, N. , Hallegatte, S., Bhattacharya, S., Bachu, M., Priya, S., Dhore, K., Rafique, F., Mathur, P., Naville, N., Henriet, F., Herweijer, C., Pohit, S., & Corfee-Morlot, J. (2010). An assessment of the potential impact of climate change on flood risk in Mumbai. Climatic Change. [CrossRef]
- Rezvani, S. , de Almeida, N., & Falcão, M. (2023). Climate Adaptation Measures for Enhancing Urban Resilience. Buildings 13(9), 2163. [CrossRef]
- Schumacher, R. S. (2017). Heavy Rainfall and Flash Flooding. In Oxford Research Encyclopedia of Natural Hazard Science. Oxford University Press. [CrossRef]
- Sen, P. K. (1968). Estimates of the Regression Coefficient Based on Kendall’s Tau. Journal of the American Statistical Association. [CrossRef]
- Shahfahad, Bindajam, A. A., Naikoo, M. W., Talukdar, S., Asif, Mallick, J., & Rahman, A. (2023). Analysing diurnal temperature range and extreme temperature events over Delhi and Mumbai mega cities. Natural Hazards. [CrossRef]
- Swain, D. L. , Prein, A. F., Abatzoglou, J. T., Albano, C. M., Brunner, M., Diffenbaugh, N. S., Singh, D., Skinner, C. B., & Touma, D. (2025). Hydroclimate volatility on a warming Earth. Nature Reviews Earth & Environment. [CrossRef]
- Trenberth, K. E. (2011). Changes in precipitation with climate change. Climate Research. [CrossRef]
- Wang, S. , Ancell, B., Yang, Z.-L., Duan, Q., & Anagnostou, E. N. (2022). Hydroclimatic extremes and impacts in a changing environment: Observations, mechanisms, and projections. Journal of Hydrology. [CrossRef]
- Xiong, J. , & Yang, Y. (2024). Climate Change and Hydrological Extremes. Current Climate Change Reports. [CrossRef]
- Yadav, N. , Wu, J., Banerjee, A., Pathak, S., Garg, R. D., & Yao, S. (2024). Climate uncertainty and vulnerability of urban flooding associated with regional risk using multi-criteria analysis in Mumbai, India. Environmental Research. [CrossRef]
- Yue, S. , & Wang, C. (2004). The Mann-Kendall Test Modified by Effective Sample Size to Detect Trend in Serially Correlated Hydrological Series. Water Resources Management. [CrossRef]
- Zhang, X. , Alexander, L., Hegerl, G. C., Jones, P., Tank, A. K., Peterson, T. C., Trewin, B., & Zwiers, F. W. (2011). Indices for monitoring changes in extremes based on daily temperature and precipitation data. WIREs Climate Change 2(6), 851–870. [CrossRef]
- Zhao, P. , & He, Z. (2022). A First Evaluation of ERA5-Land Reanalysis Temperature Product Over the Chinese Qilian Mountains. Frontiers in Earth Science. [CrossRef]
Figure 1.
Geographic location and administrative boundaries of the study areas: Lagos (a) and Mumbai (b). Source: Authors’ compilation using GDAM Level 2 shapefiles and QGIS.
Figure 1.
Geographic location and administrative boundaries of the study areas: Lagos (a) and Mumbai (b). Source: Authors’ compilation using GDAM Level 2 shapefiles and QGIS.
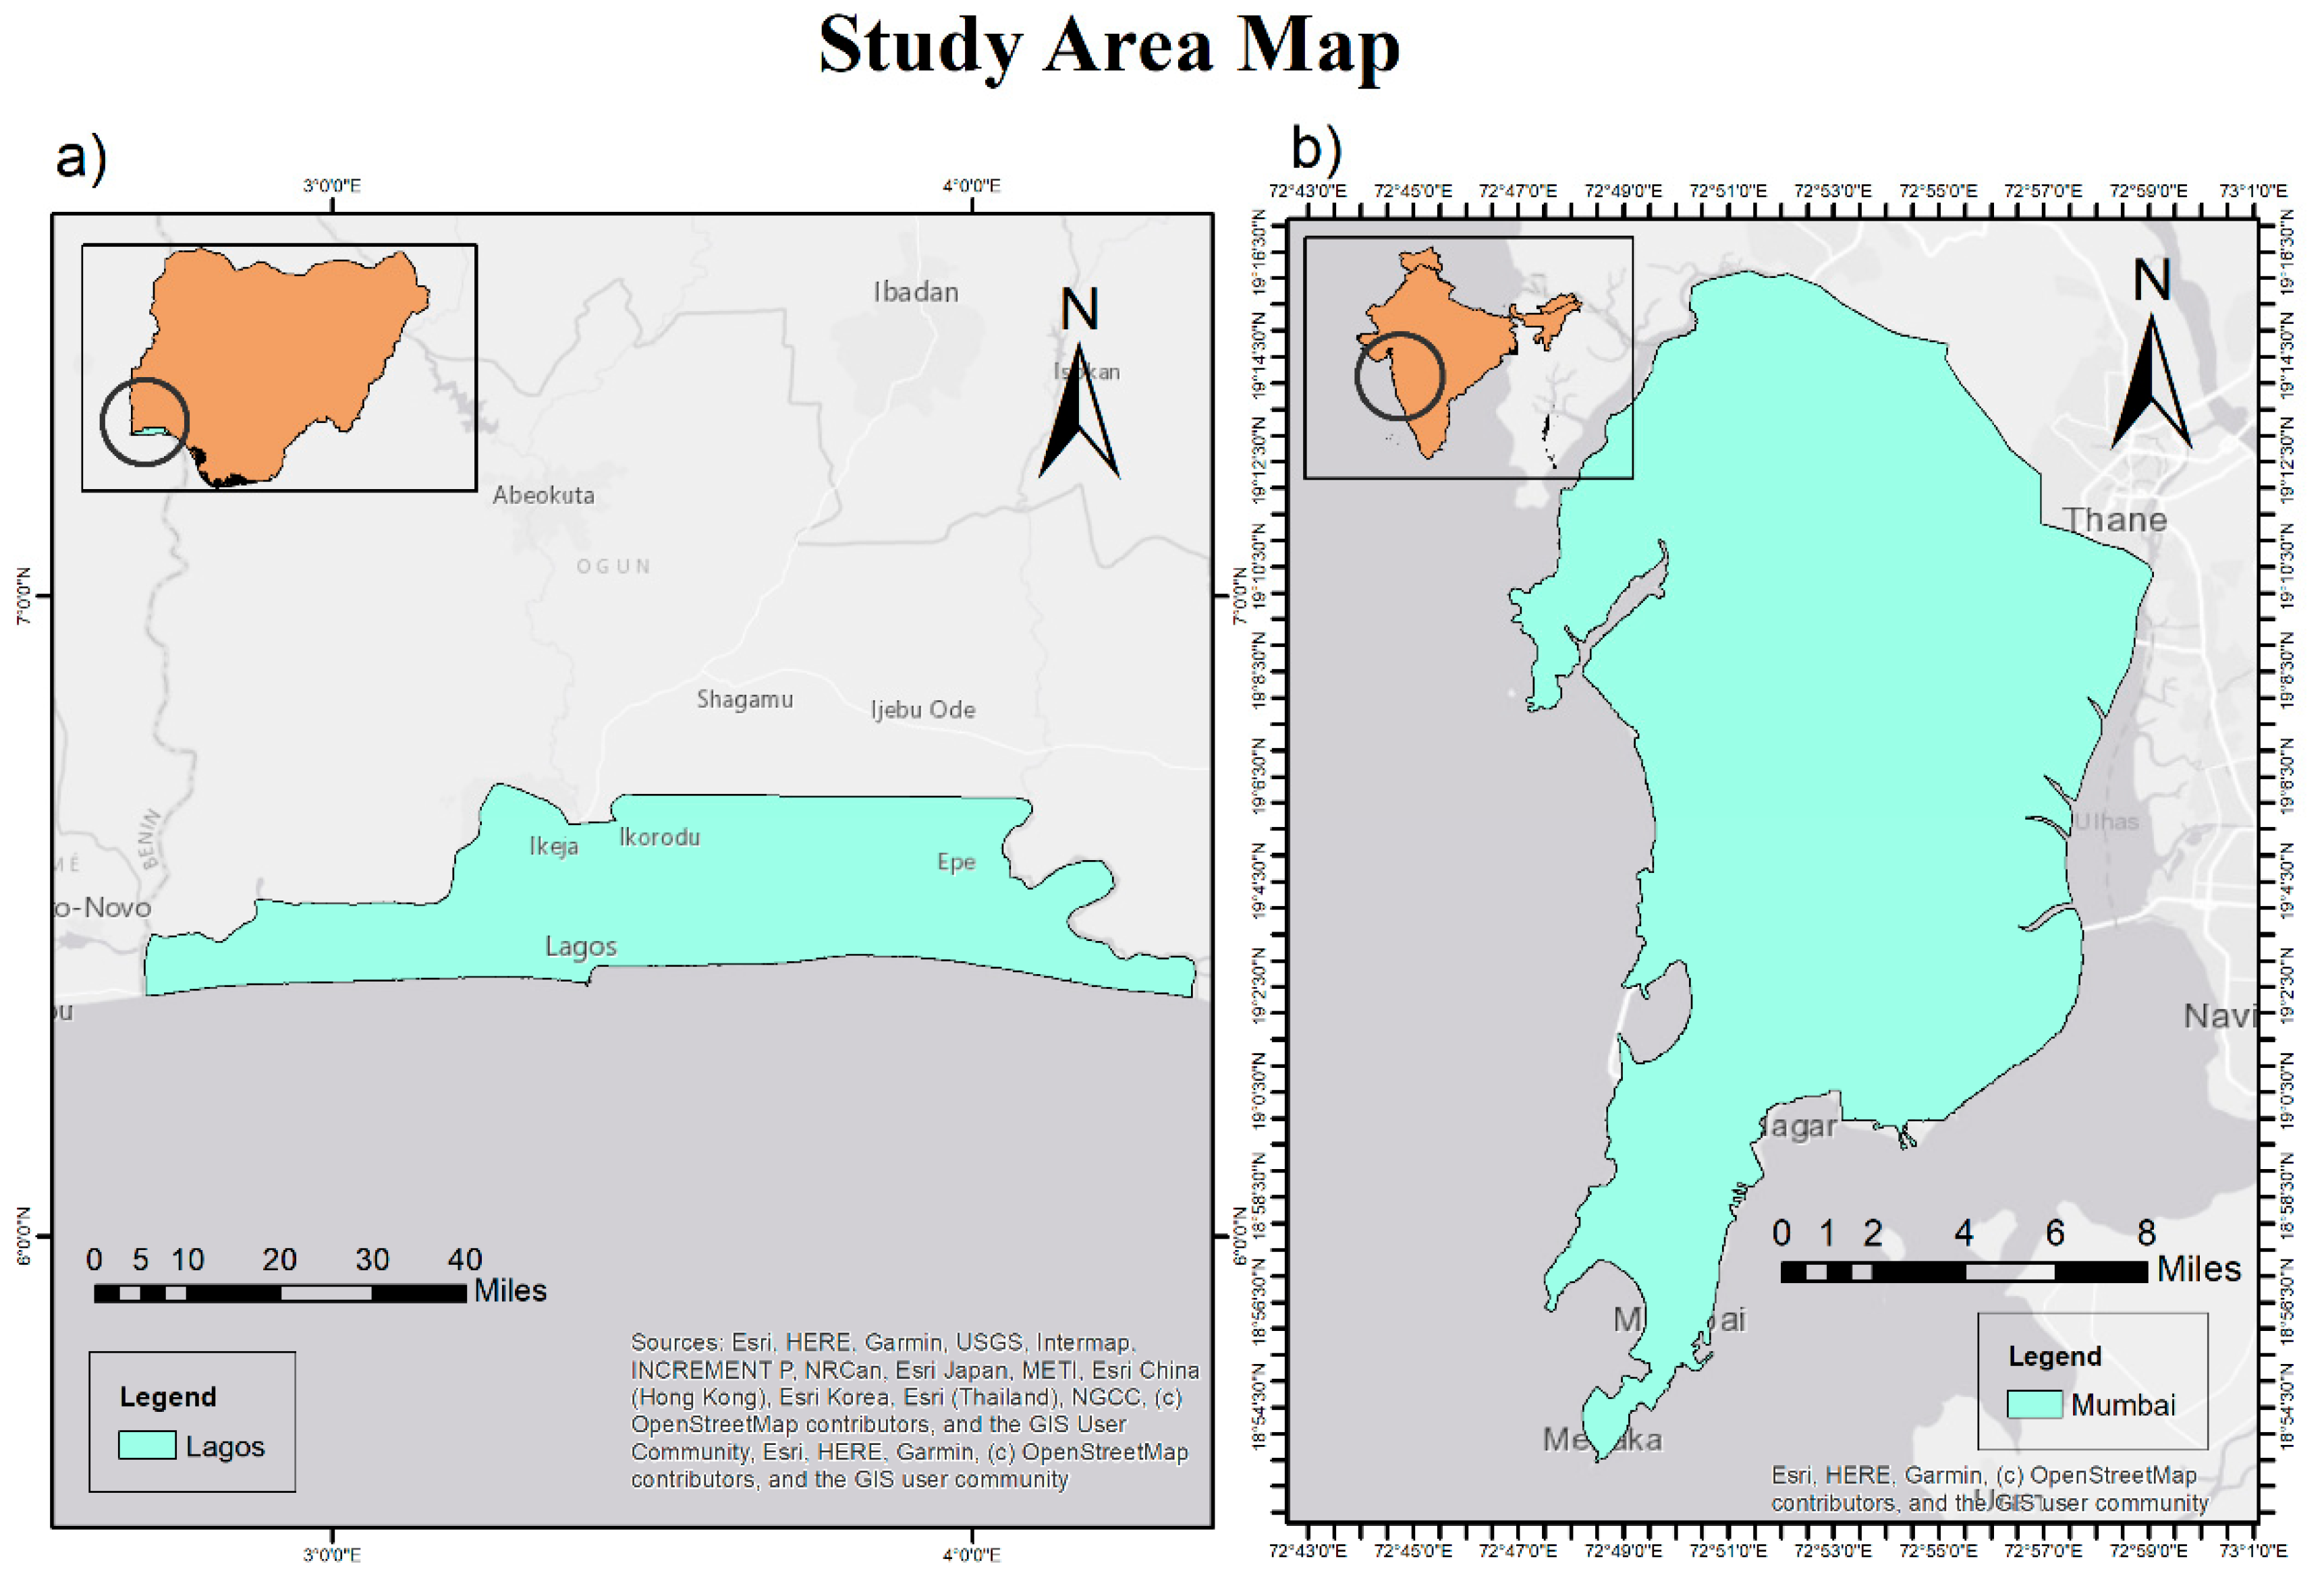
Figure 2.
Methodological workflow showing data sources, processing steps, and analytical methods used in the study.
Figure 2.
Methodological workflow showing data sources, processing steps, and analytical methods used in the study.
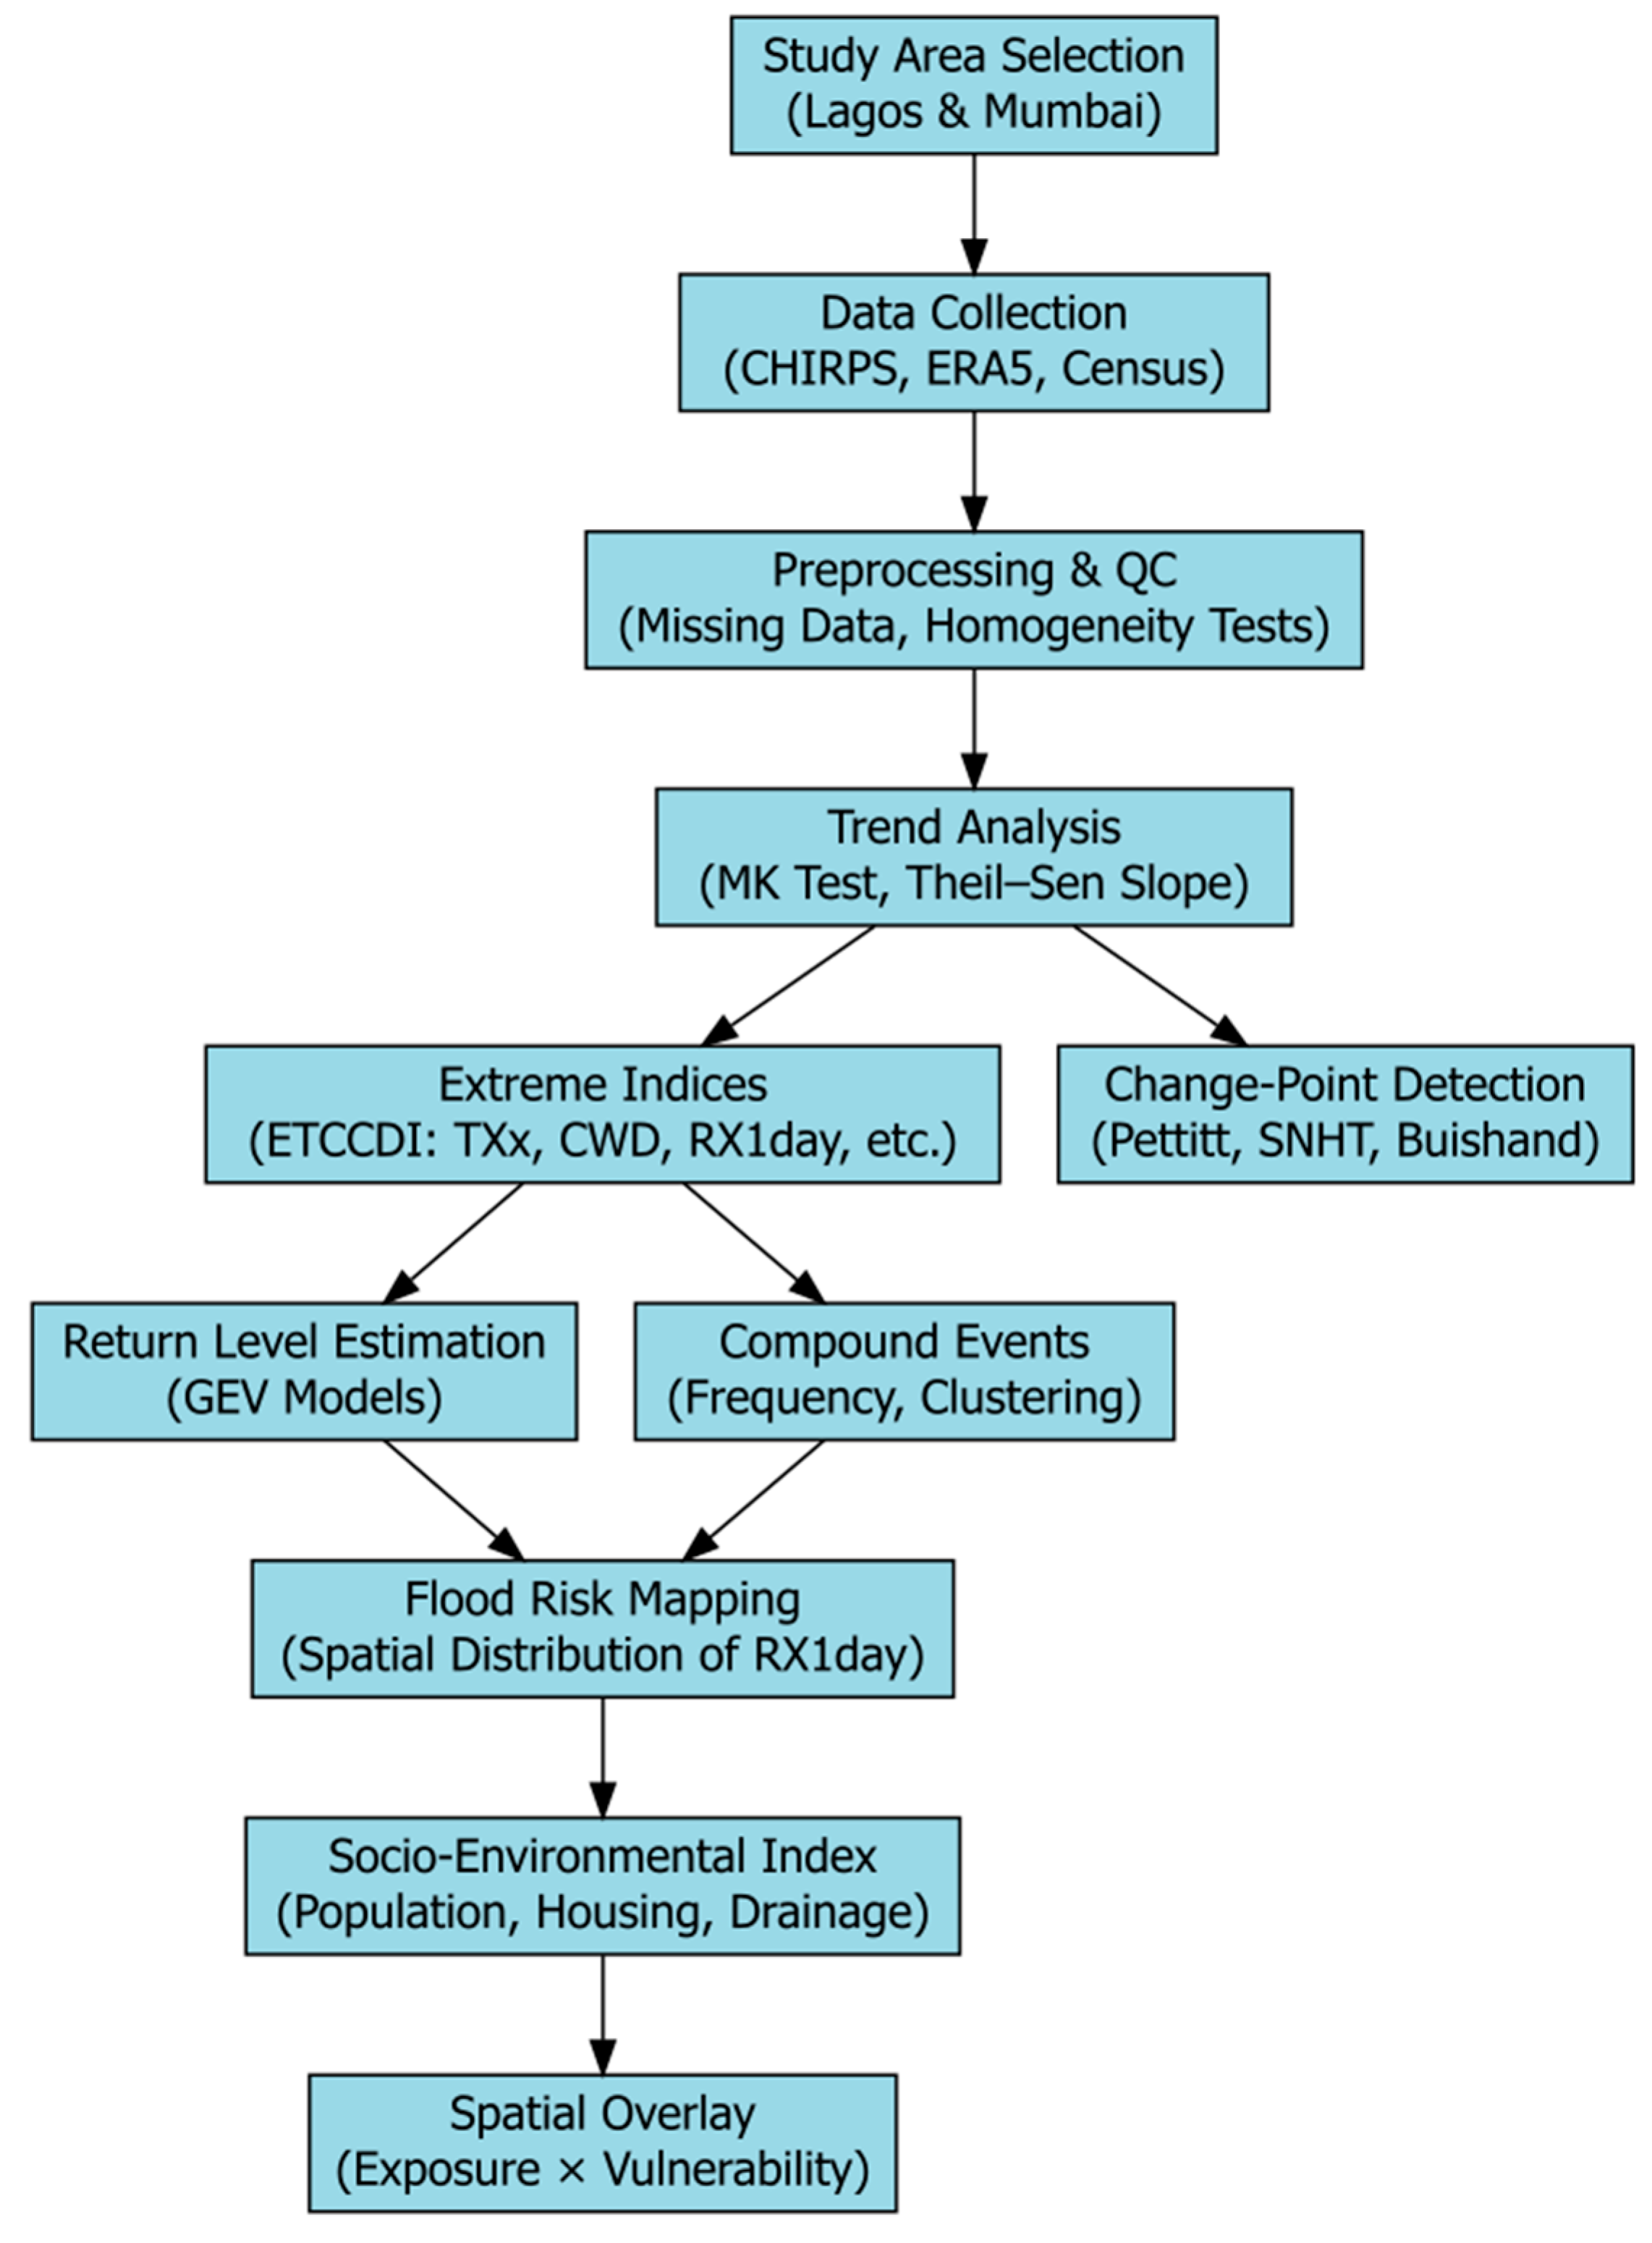
Figure 3.
Annual and seasonal rainfall trends for Lagos and Mumbai from 1981 to 2023: (a) Annual rainfall with linear Sen’s slope trend line, (b) Seasonal rainfall totals across SON, JJA, MAM, and DJF. Source: CHIRPS v2.0 dataset (1981–2023).
Figure 3.
Annual and seasonal rainfall trends for Lagos and Mumbai from 1981 to 2023: (a) Annual rainfall with linear Sen’s slope trend line, (b) Seasonal rainfall totals across SON, JJA, MAM, and DJF. Source: CHIRPS v2.0 dataset (1981–2023).
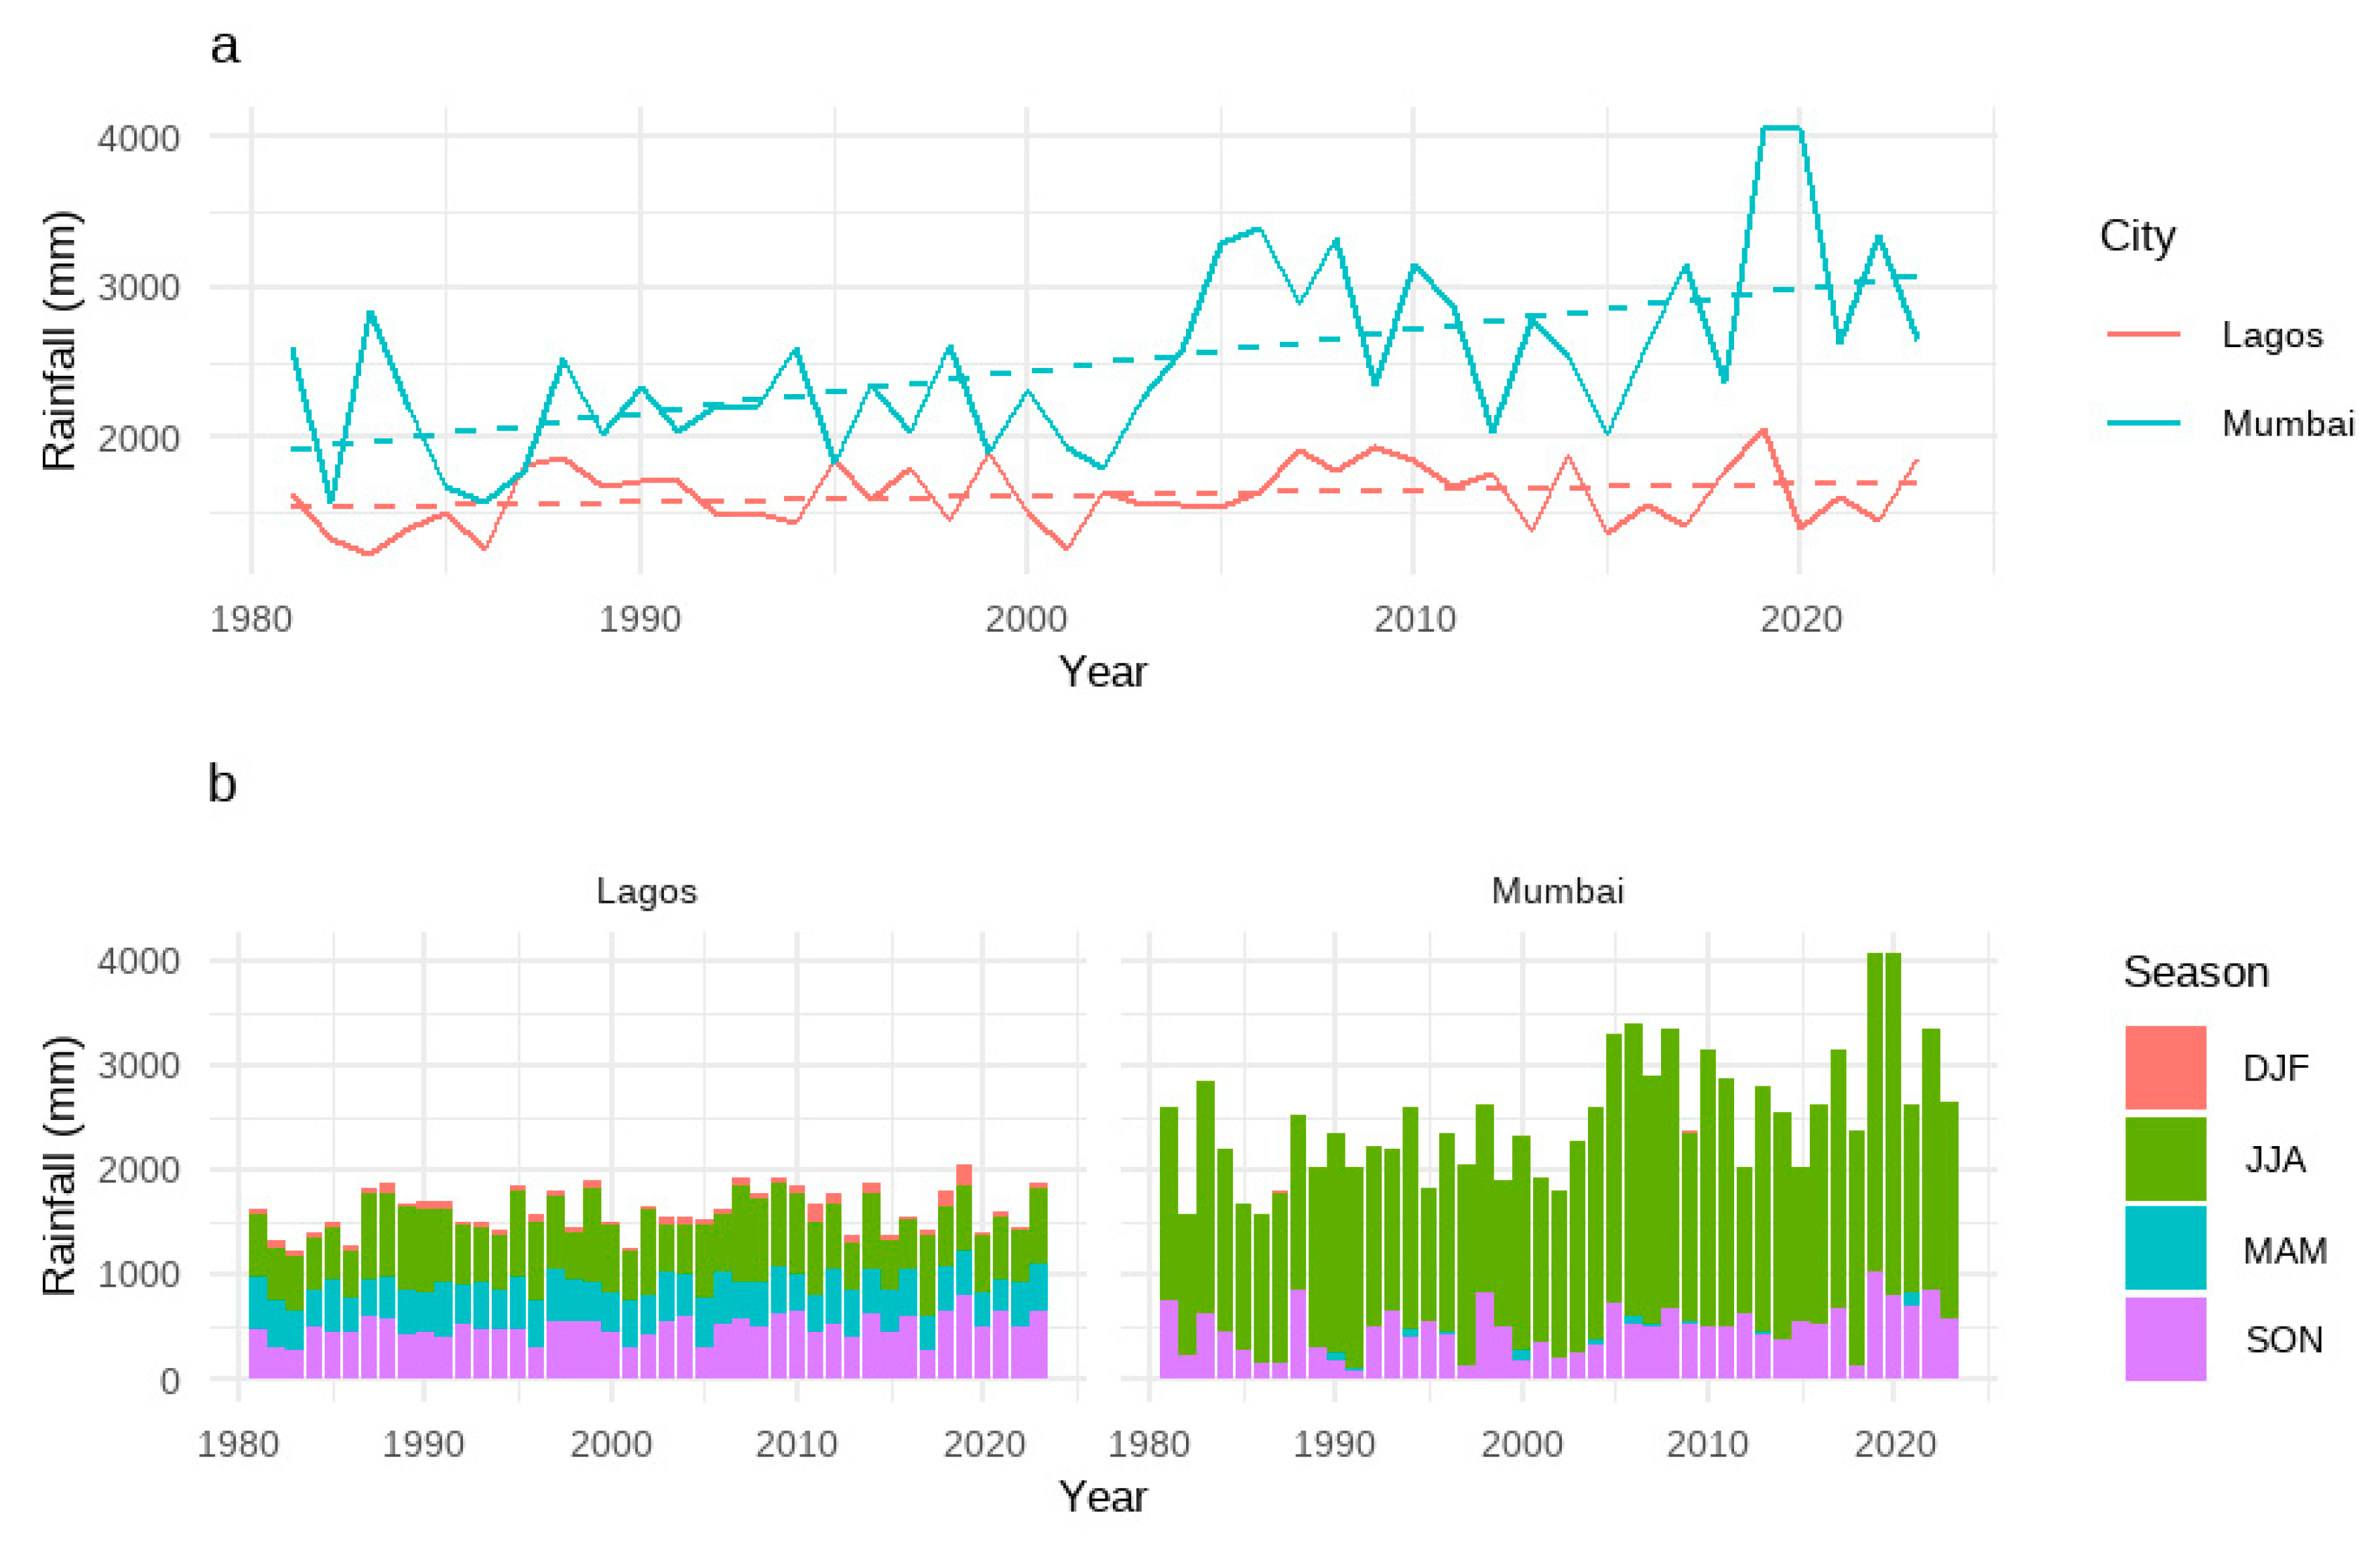
Figure 4.
Temperature trends in Lagos and Mumbai: (a) Annual Tmax and Tmin trends by city, (b) Mean seasonal Tmax changes across the four climatological seasons. Source: ERA5-Land dataset (1981–2023).
Figure 4.
Temperature trends in Lagos and Mumbai: (a) Annual Tmax and Tmin trends by city, (b) Mean seasonal Tmax changes across the four climatological seasons. Source: ERA5-Land dataset (1981–2023).
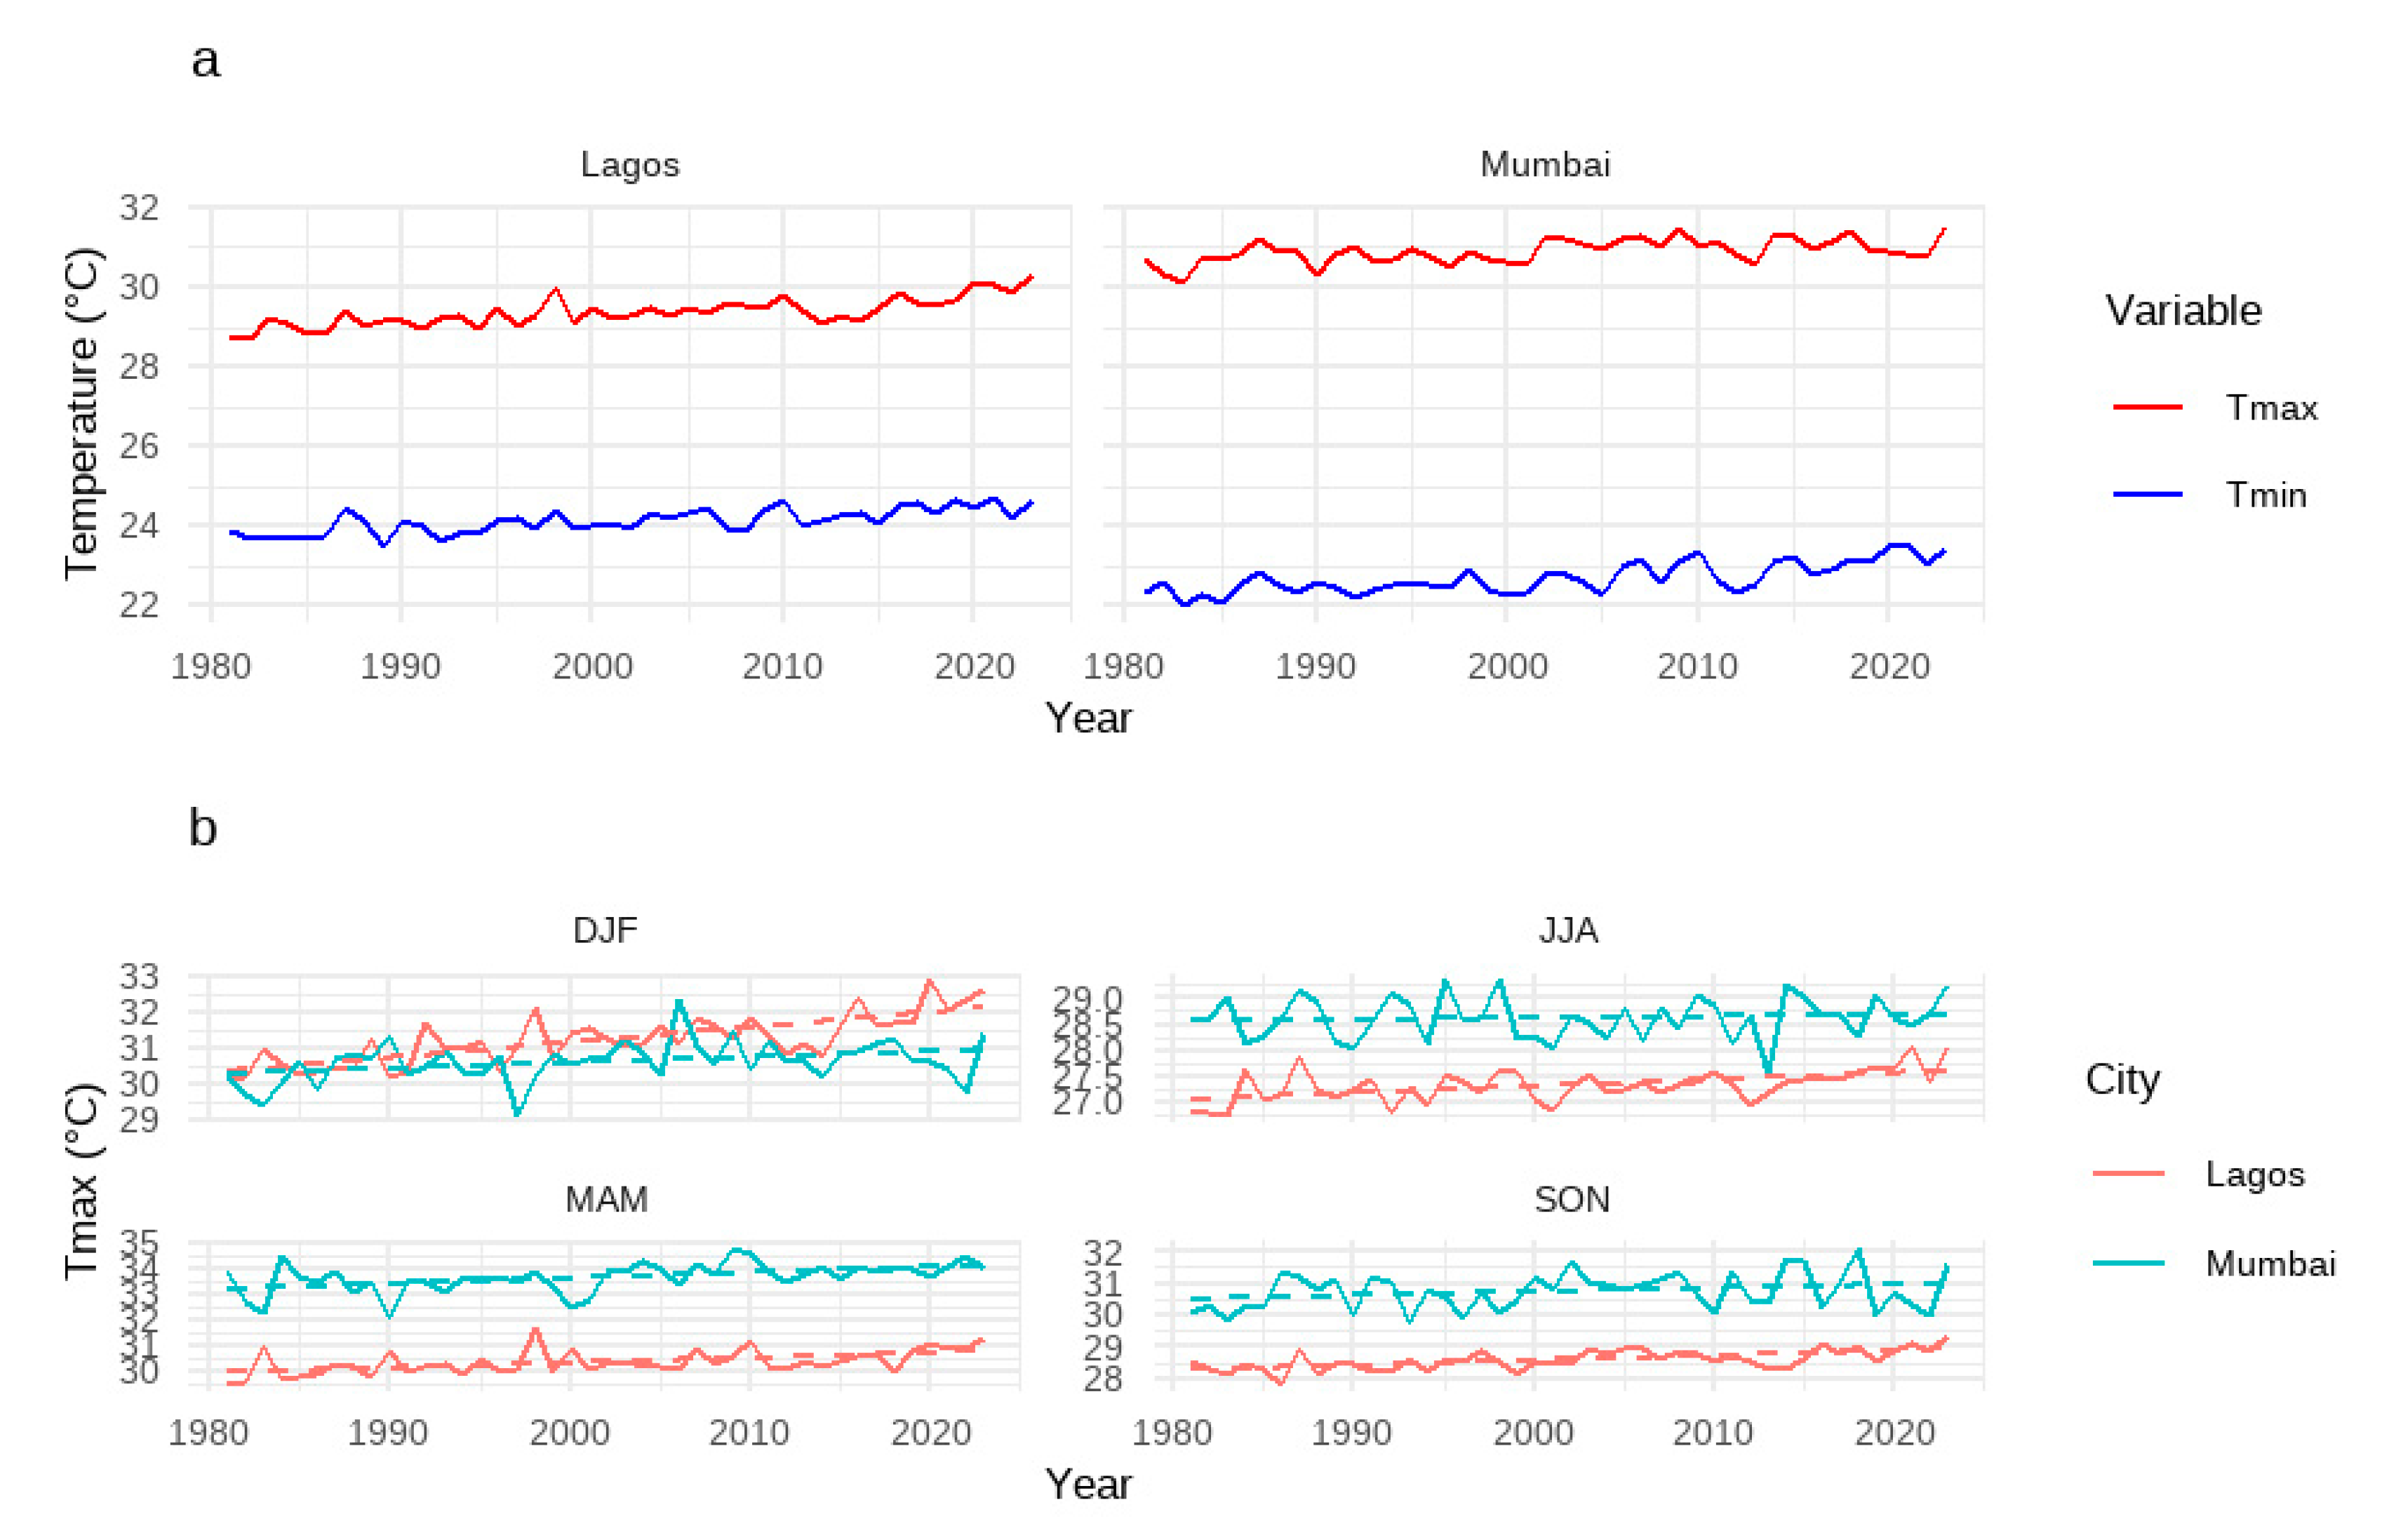
Figure 5.
Interannual trend in Diurnal Temperature Range (DTR) for Lagos and Mumbai, with linear trendlines showing potential urban heat island effects. Source: ERA5-Land dataset (1981–2023).
Figure 5.
Interannual trend in Diurnal Temperature Range (DTR) for Lagos and Mumbai, with linear trendlines showing potential urban heat island effects. Source: ERA5-Land dataset (1981–2023).
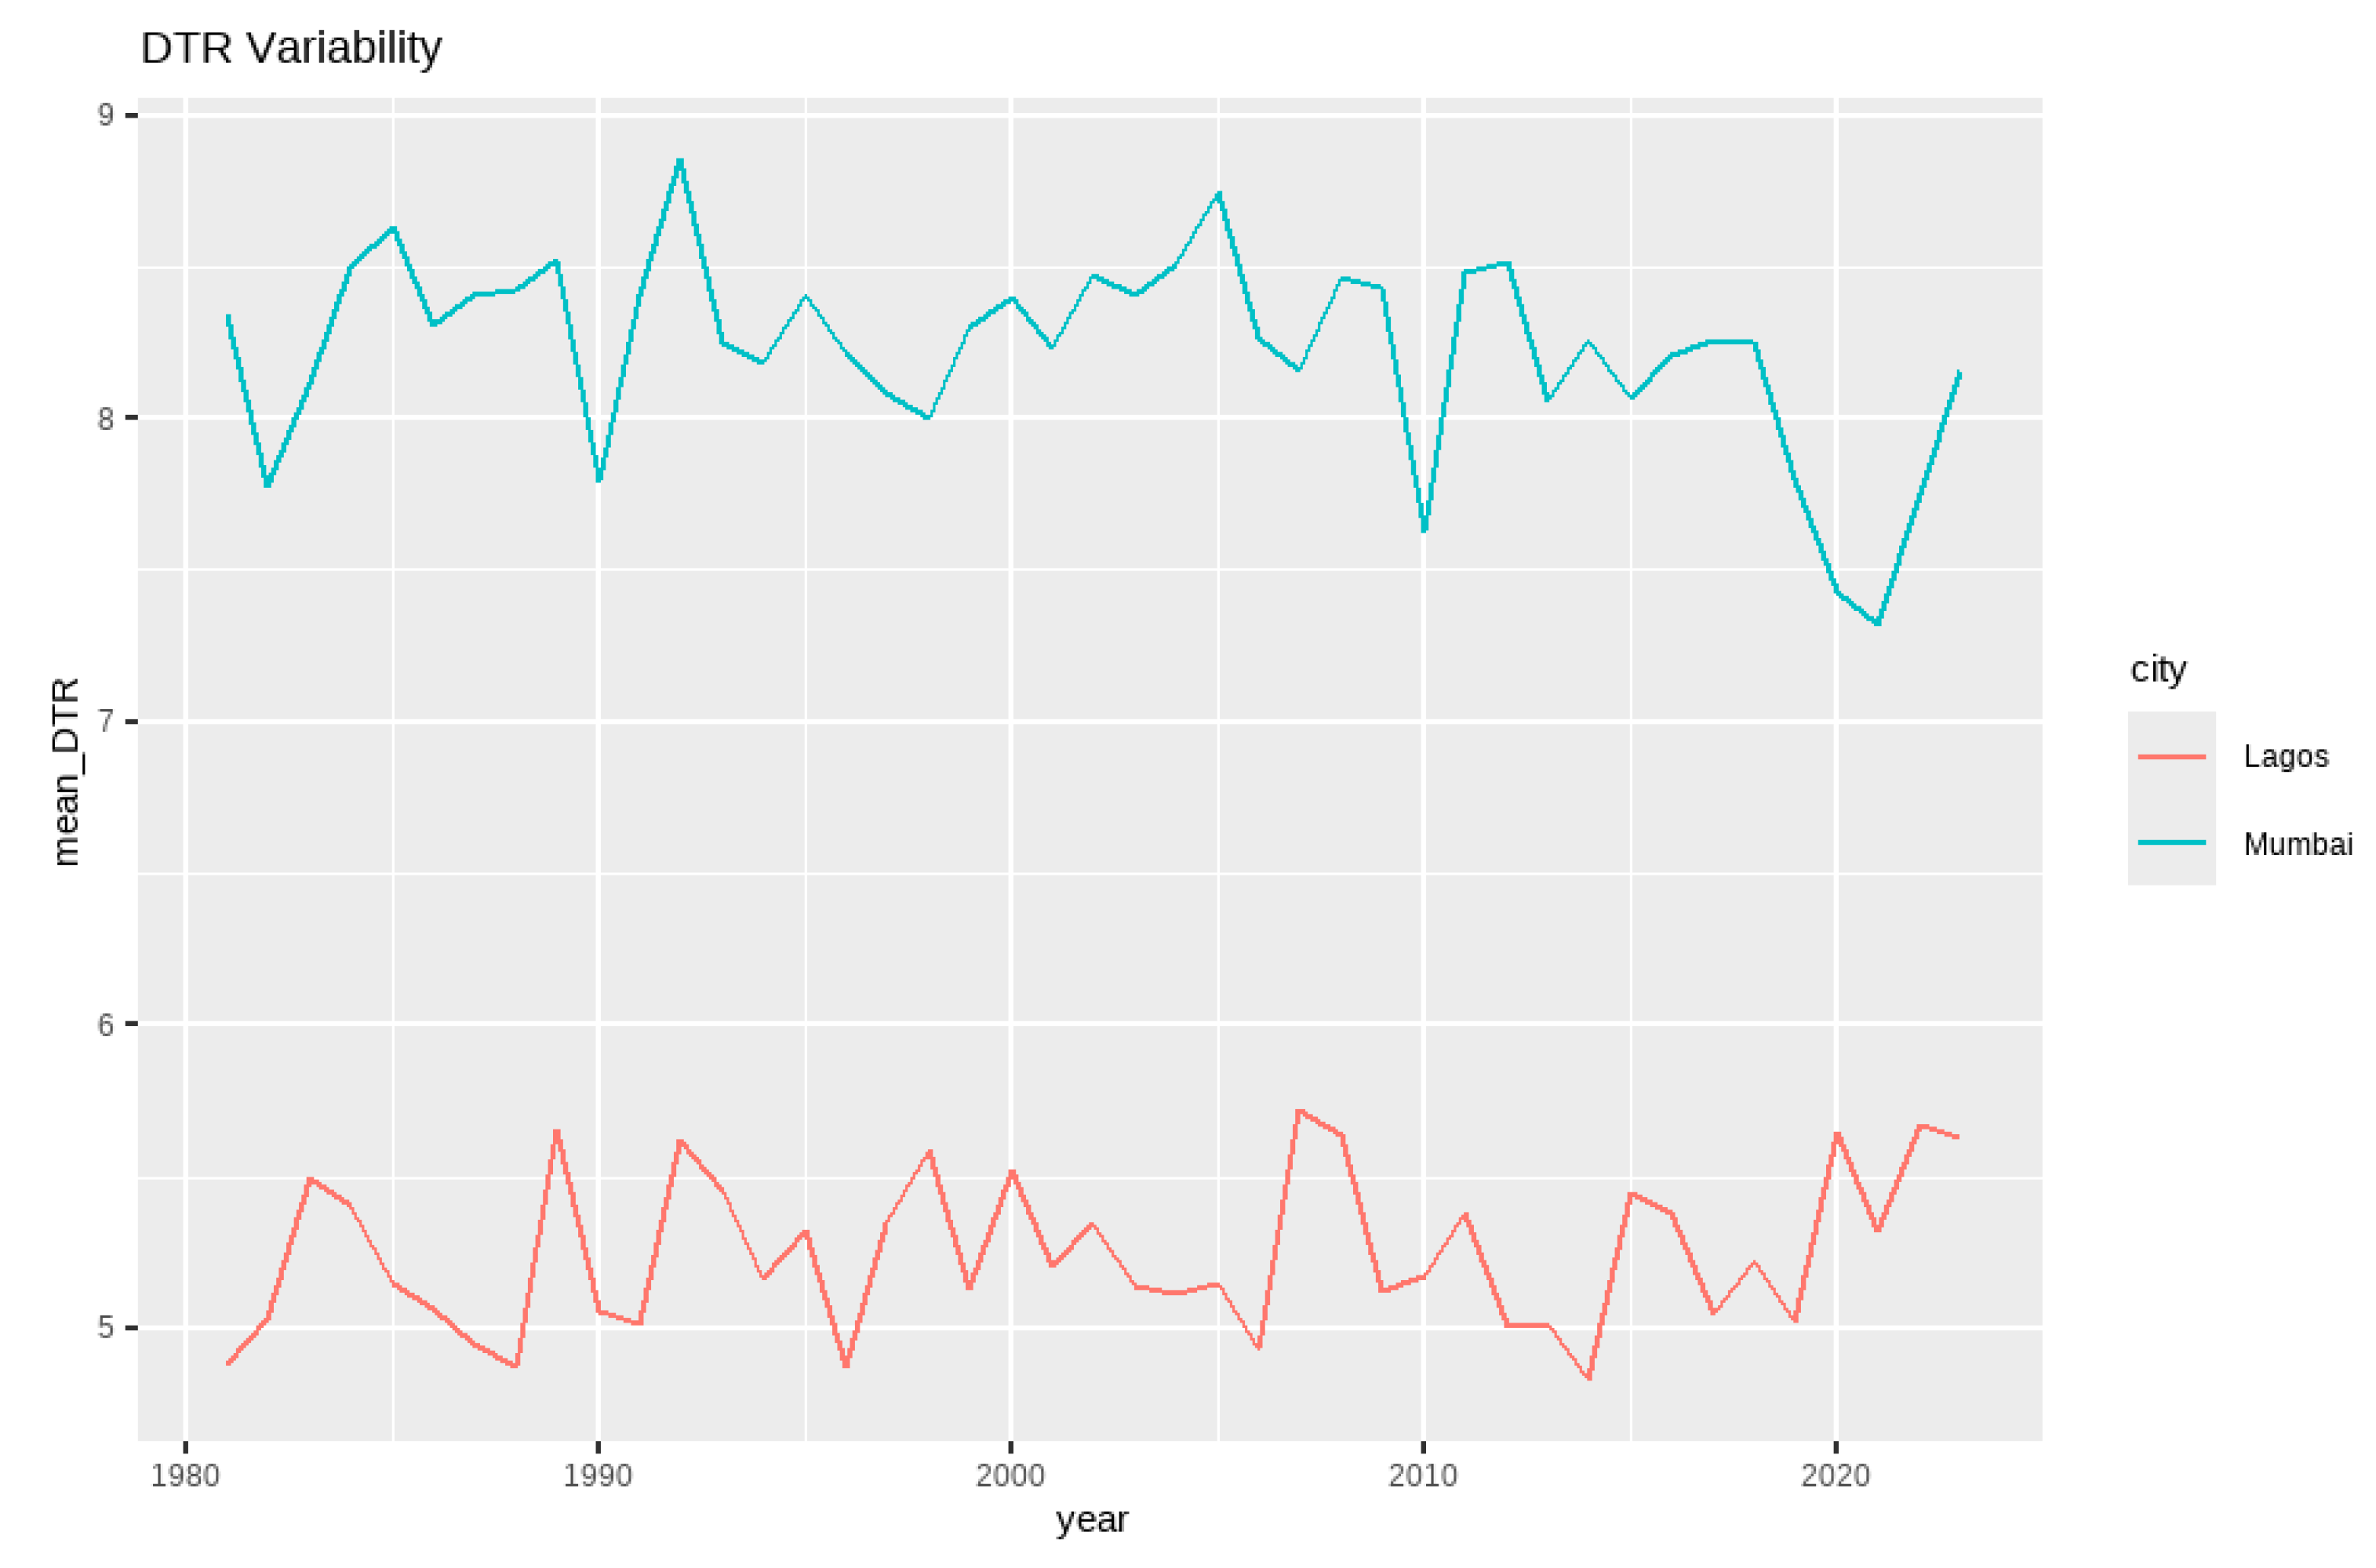
Figure 6.
Long-term trends of ETCCDI extreme climate indices: CDD, CWD, RX1day, TXx, and TNn in Lagos and Mumbai from 1981 to 2023. Source: Derived from CHIRPS and ERA5-Land via RClimDex.
Figure 6.
Long-term trends of ETCCDI extreme climate indices: CDD, CWD, RX1day, TXx, and TNn in Lagos and Mumbai from 1981 to 2023. Source: Derived from CHIRPS and ERA5-Land via RClimDex.
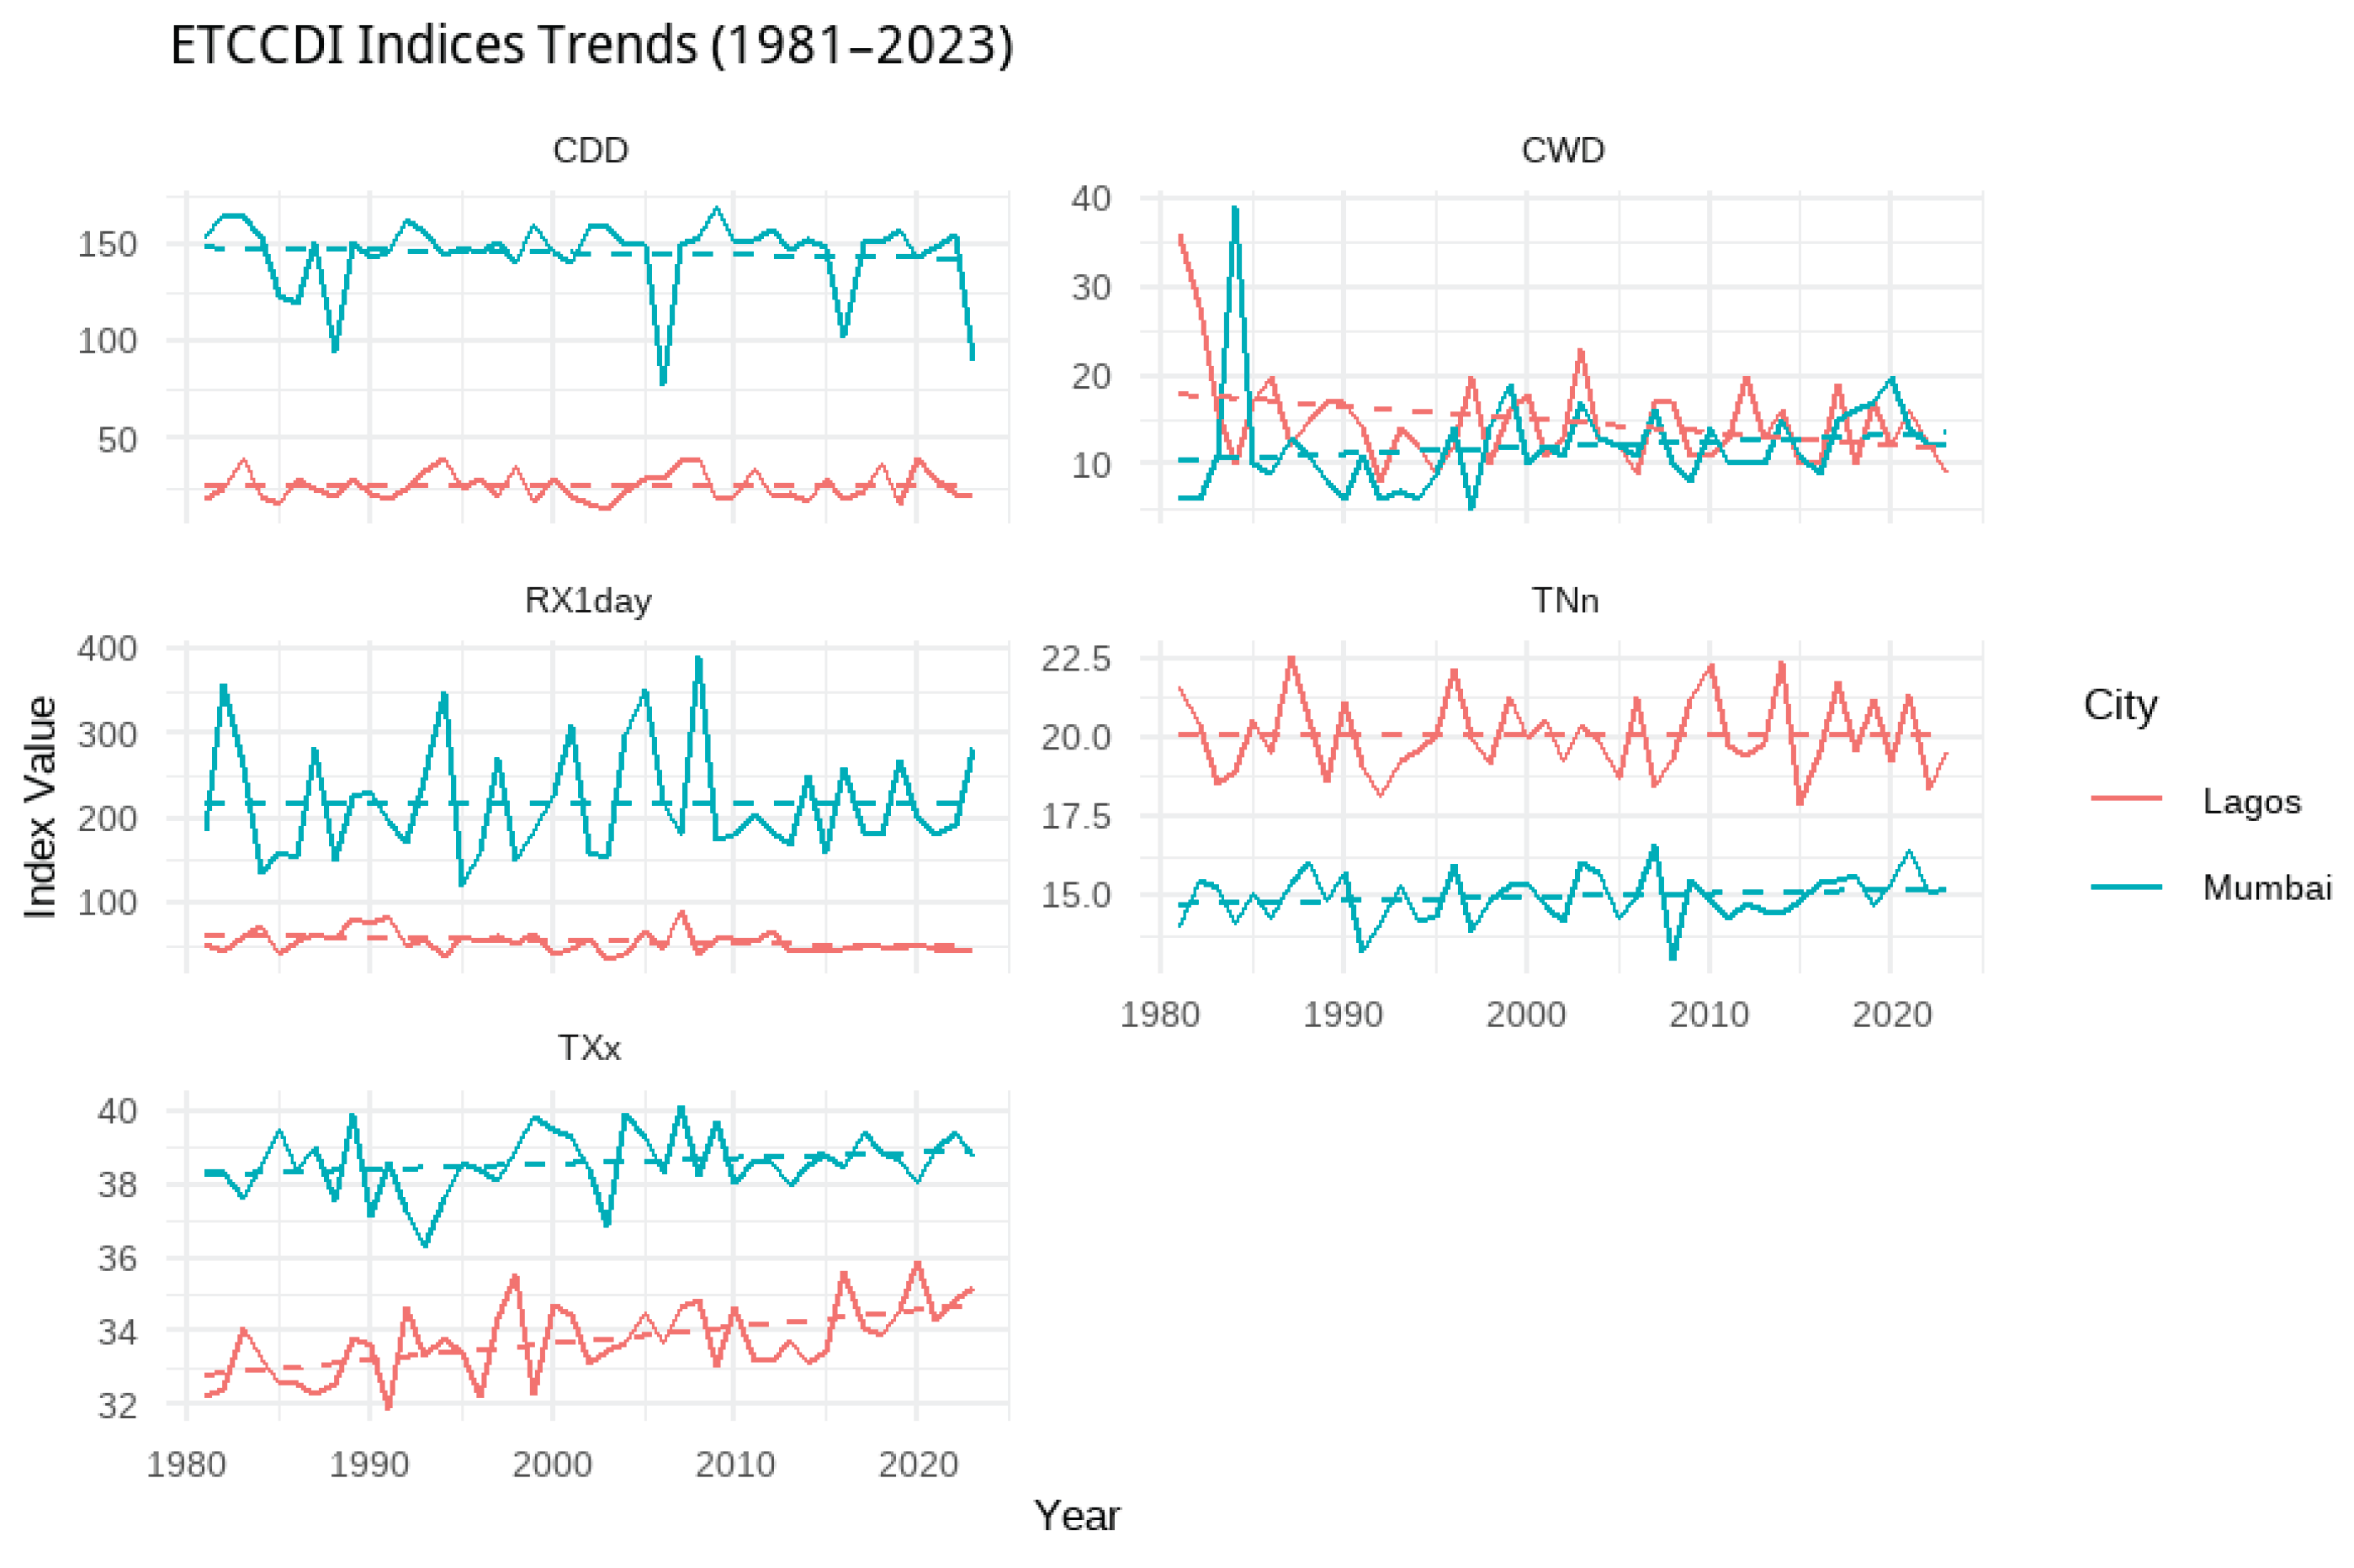
Figure 7.
Frequency of extreme climate events: (a) Annual event count based on threshold exceedance, (b) Heatmaps of monthly event intensity over the study period. Source: ETCCDI indices calculated from CHIRPS and ERA5-Land.
Figure 7.
Frequency of extreme climate events: (a) Annual event count based on threshold exceedance, (b) Heatmaps of monthly event intensity over the study period. Source: ETCCDI indices calculated from CHIRPS and ERA5-Land.
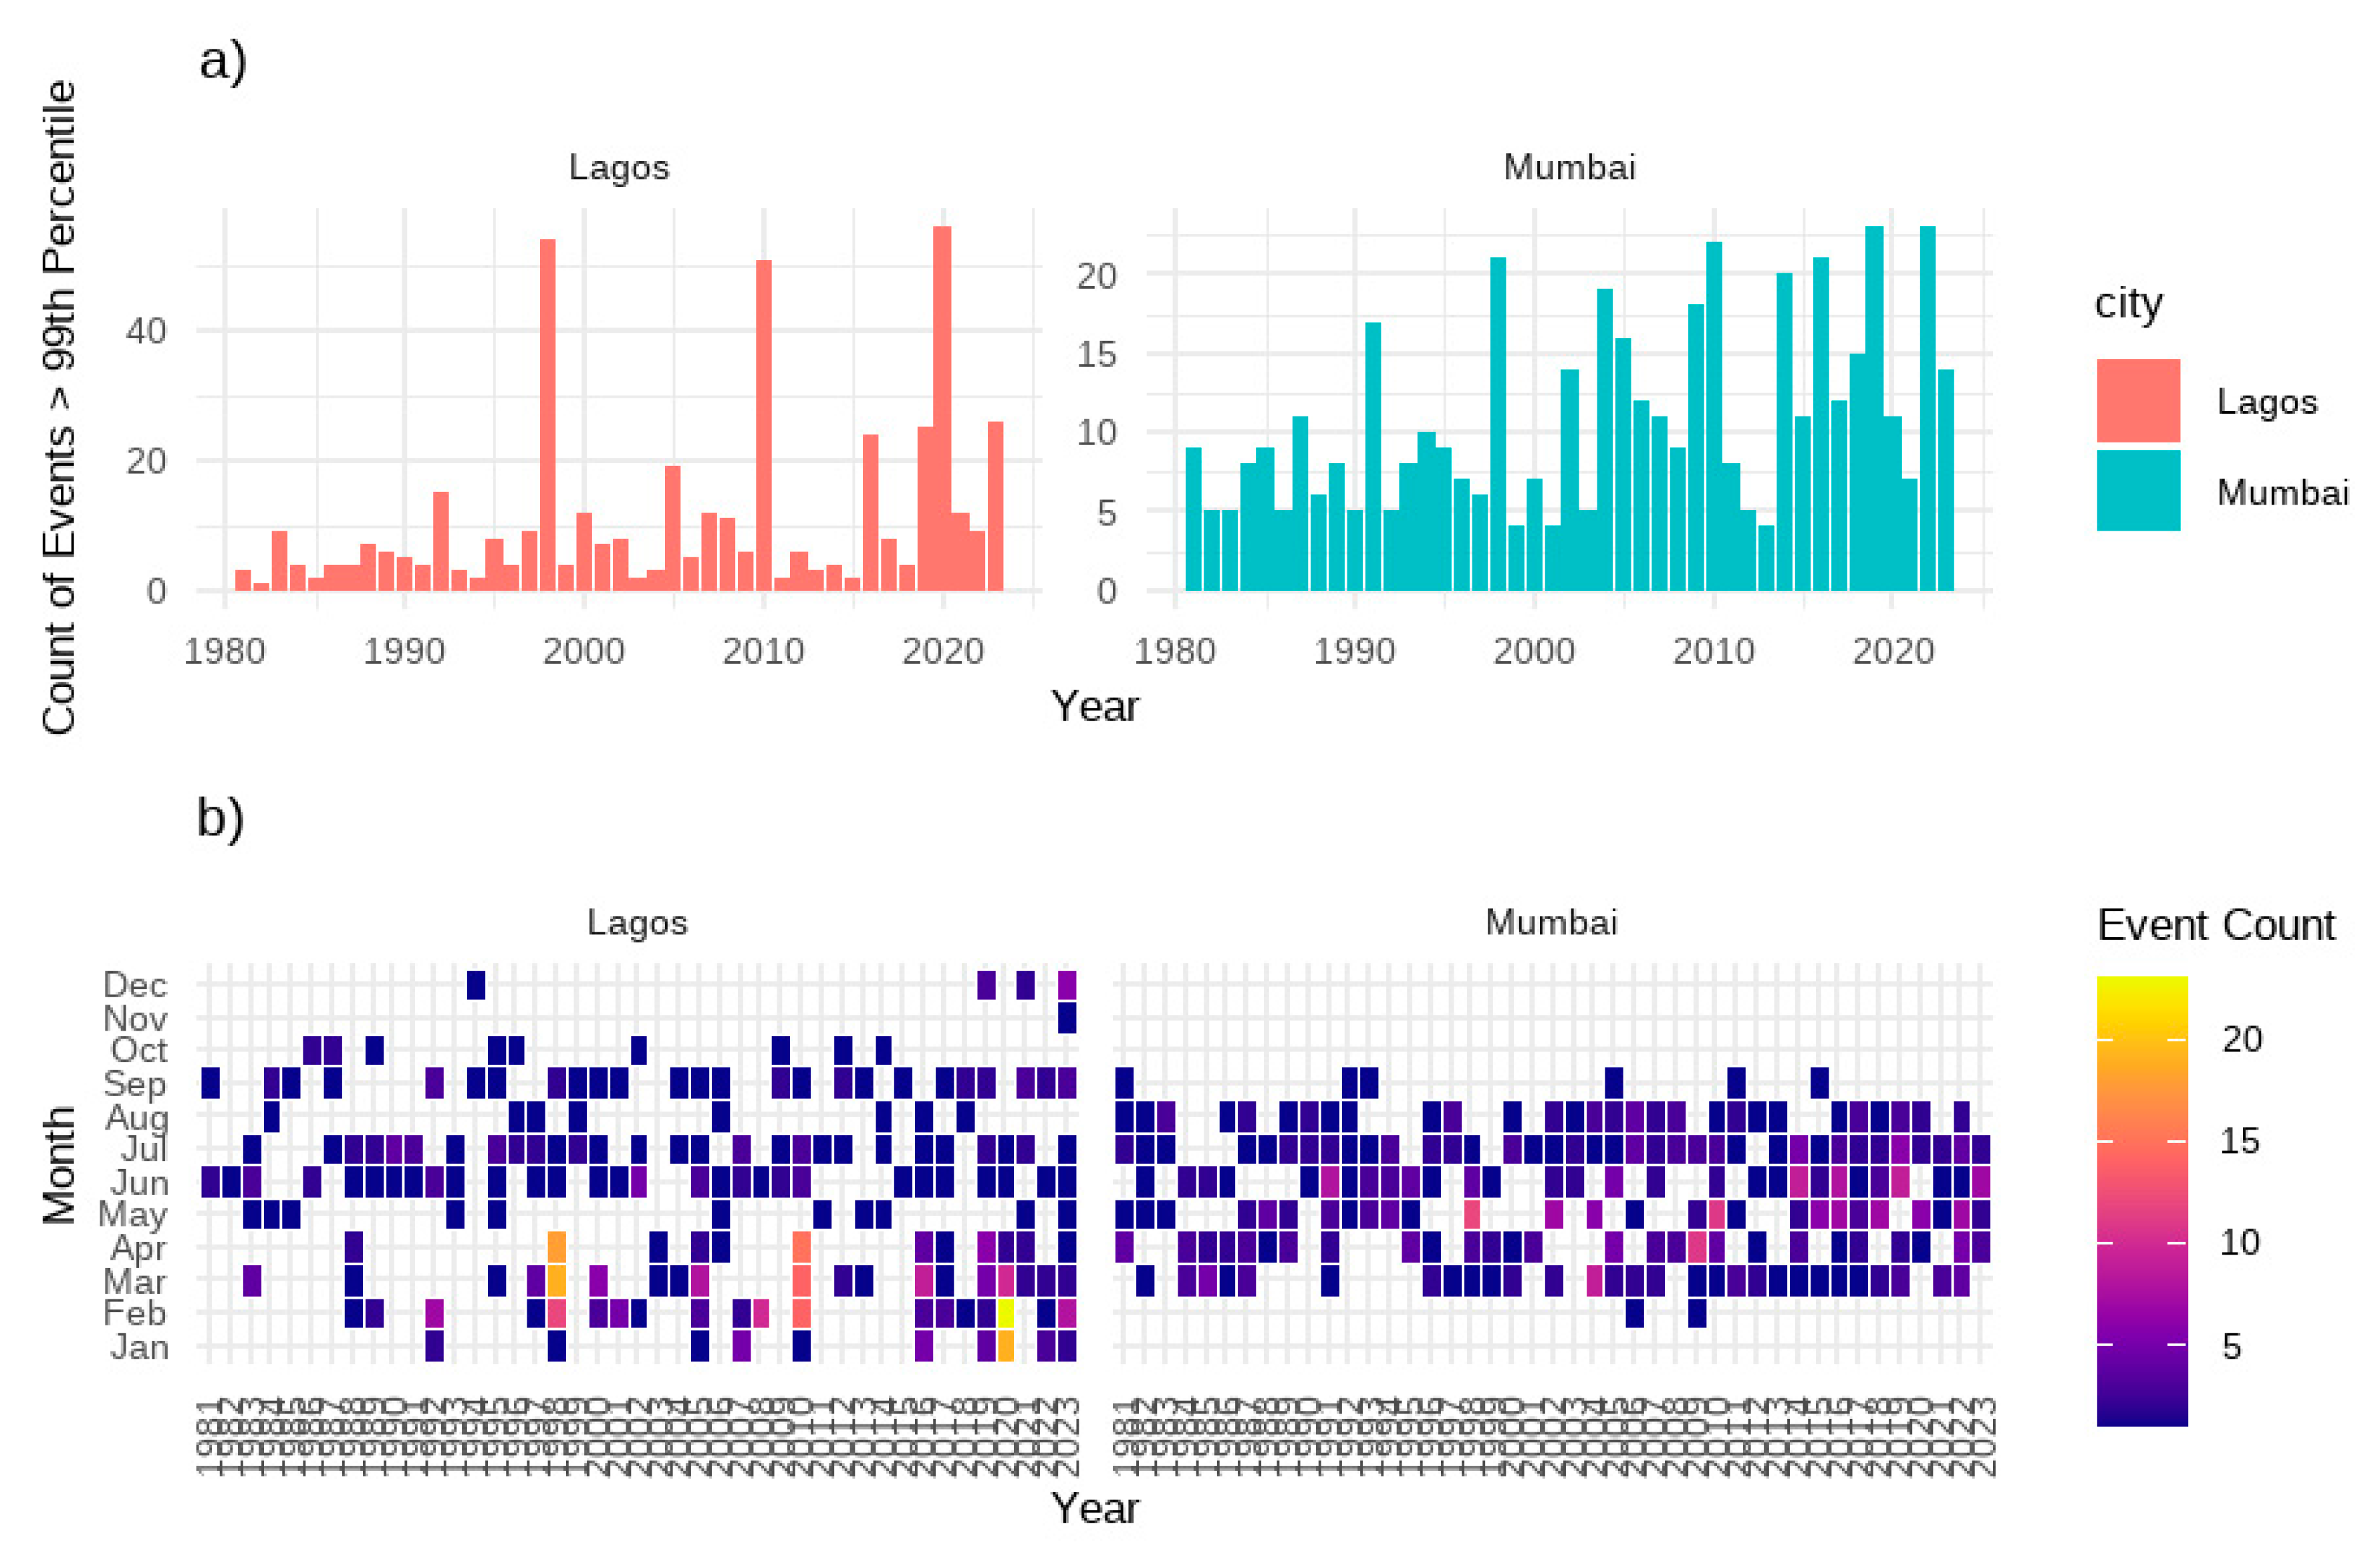
Figure 8.
Timeline plot showing co-occurrence of sequential and compound extreme rainfall and heat events in both cities over the 1981–2023 period.
Figure 8.
Timeline plot showing co-occurrence of sequential and compound extreme rainfall and heat events in both cities over the 1981–2023 period.
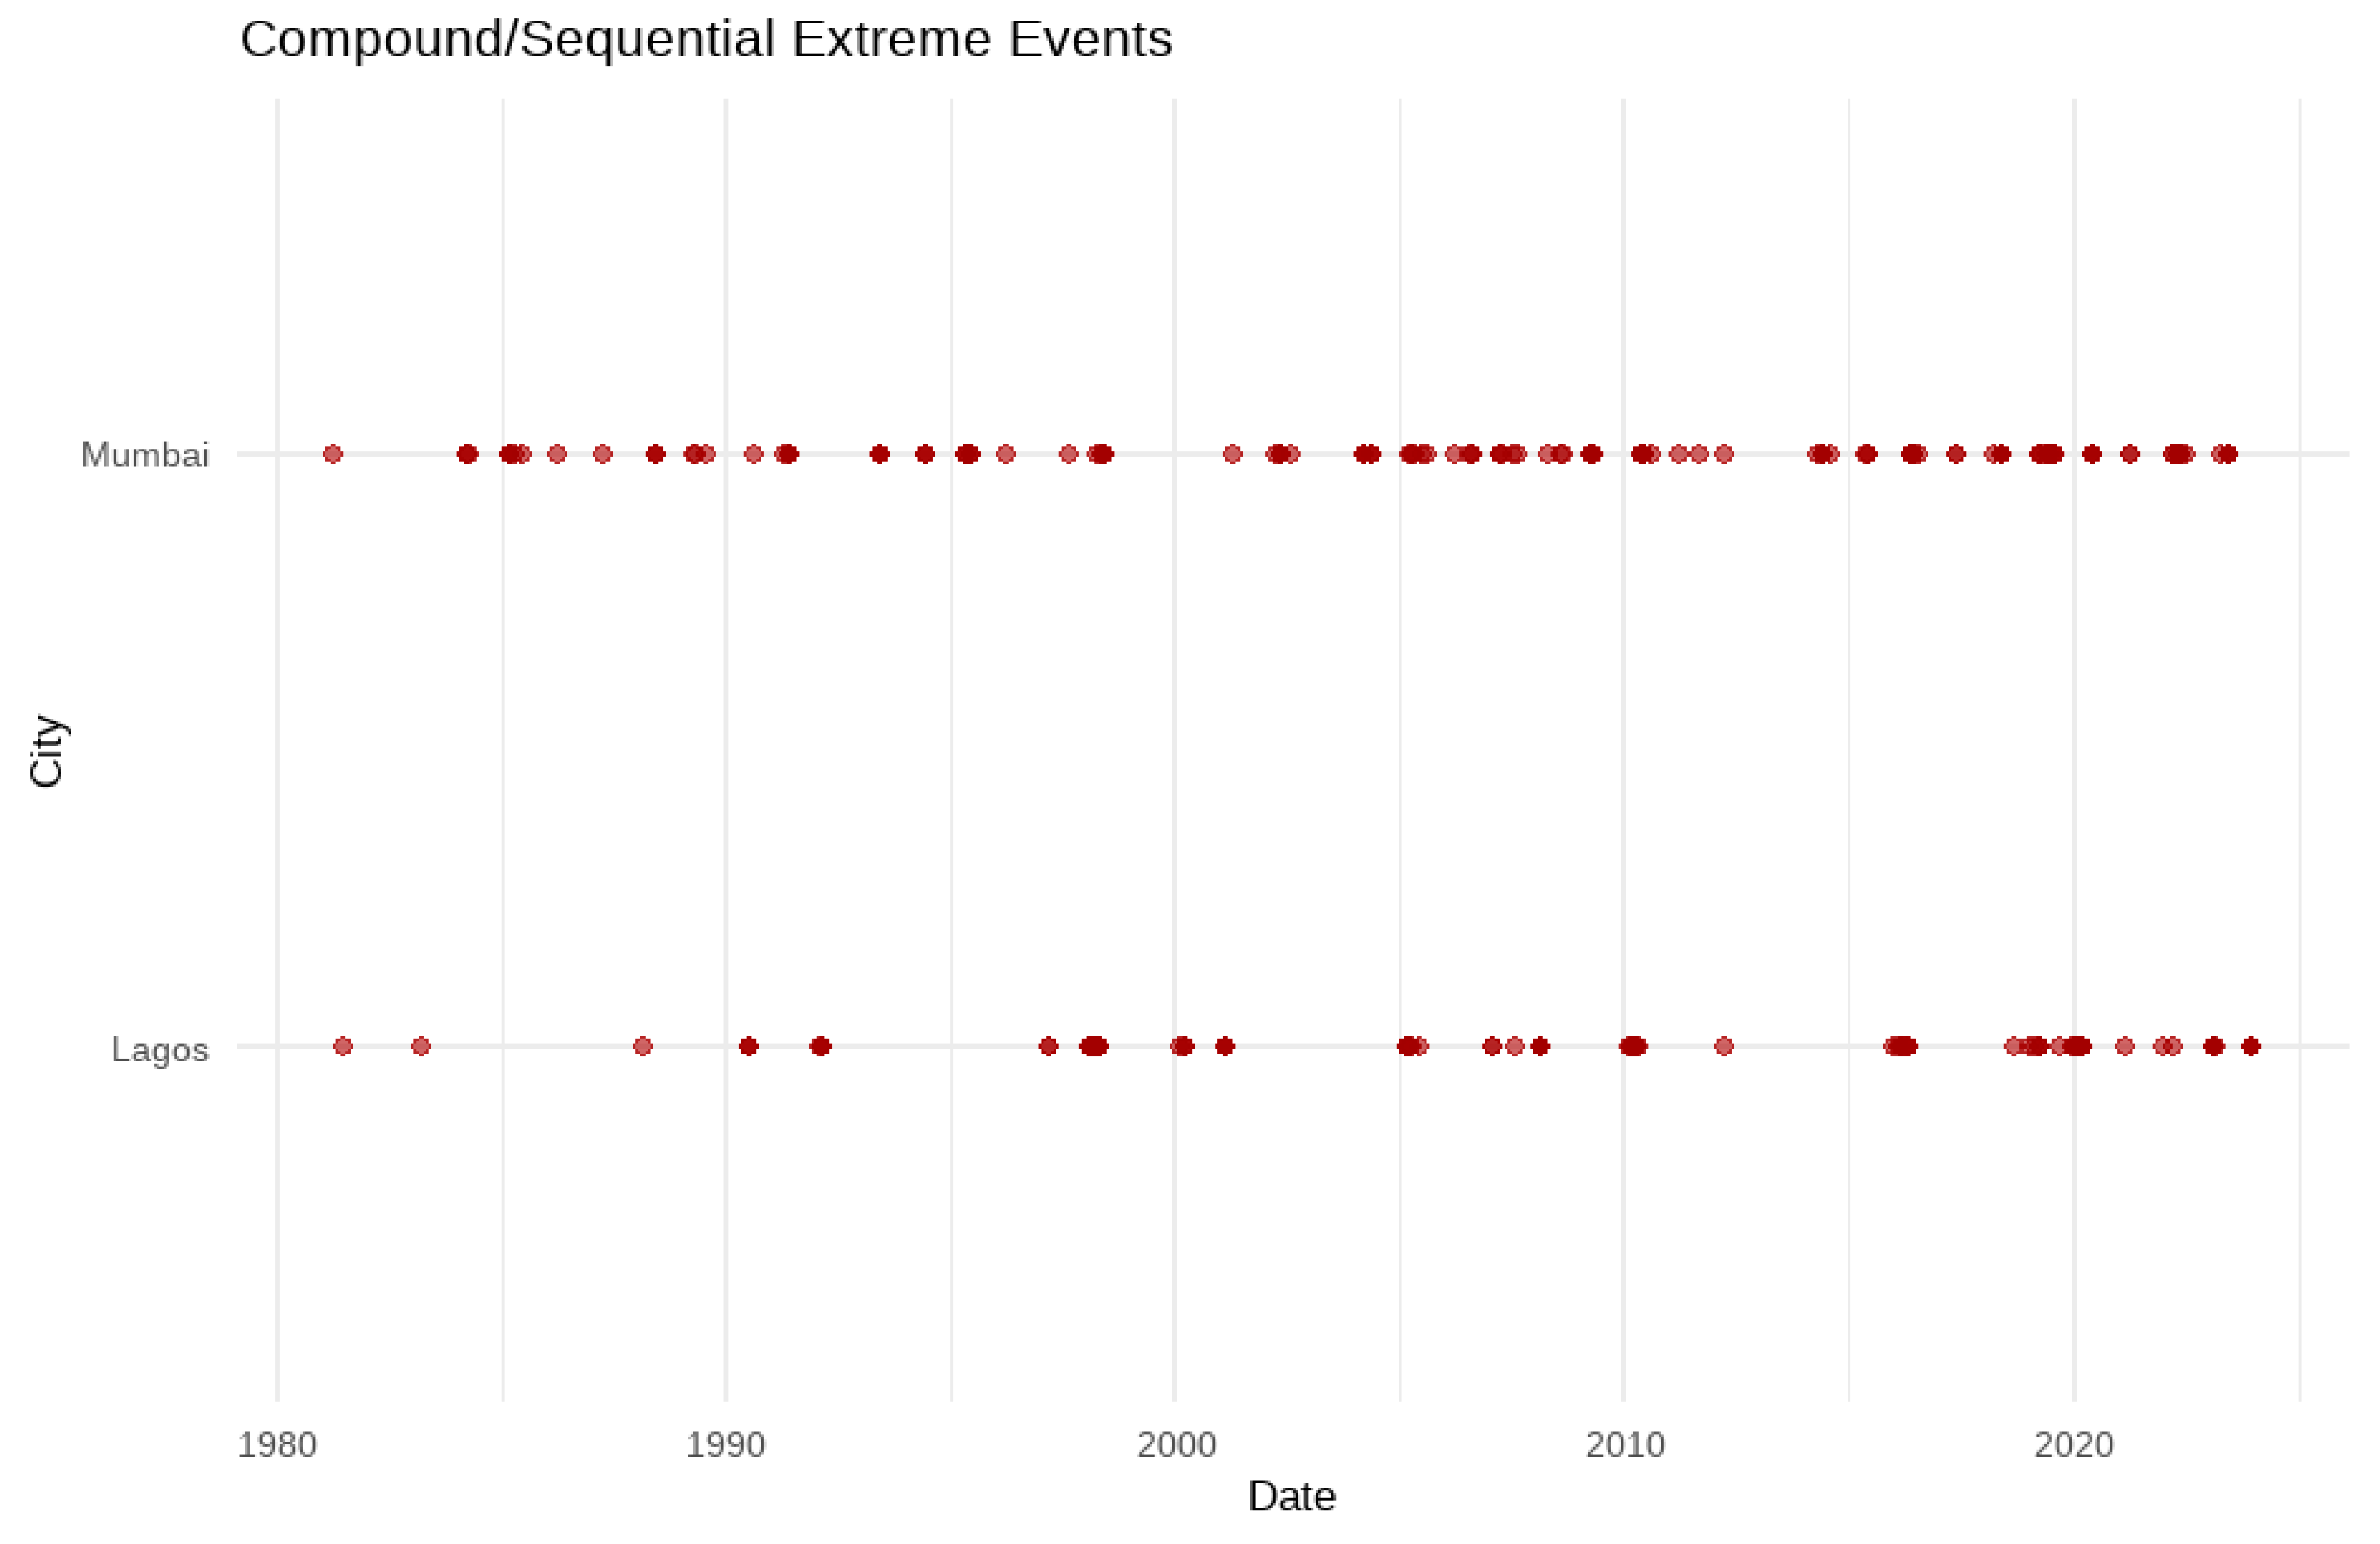
Figure 9.
Generalized Extreme Value (GEV) model results for Lagos and Mumbai: (a) Stationary GEV return level curves for RX1day and TXx, (b) Non-stationary GEV location parameter (μ) trends highlighting directional changes over time. Source: Authors’ GEV model fitted using extRemes package in R.
Figure 9.
Generalized Extreme Value (GEV) model results for Lagos and Mumbai: (a) Stationary GEV return level curves for RX1day and TXx, (b) Non-stationary GEV location parameter (μ) trends highlighting directional changes over time. Source: Authors’ GEV model fitted using extRemes package in R.
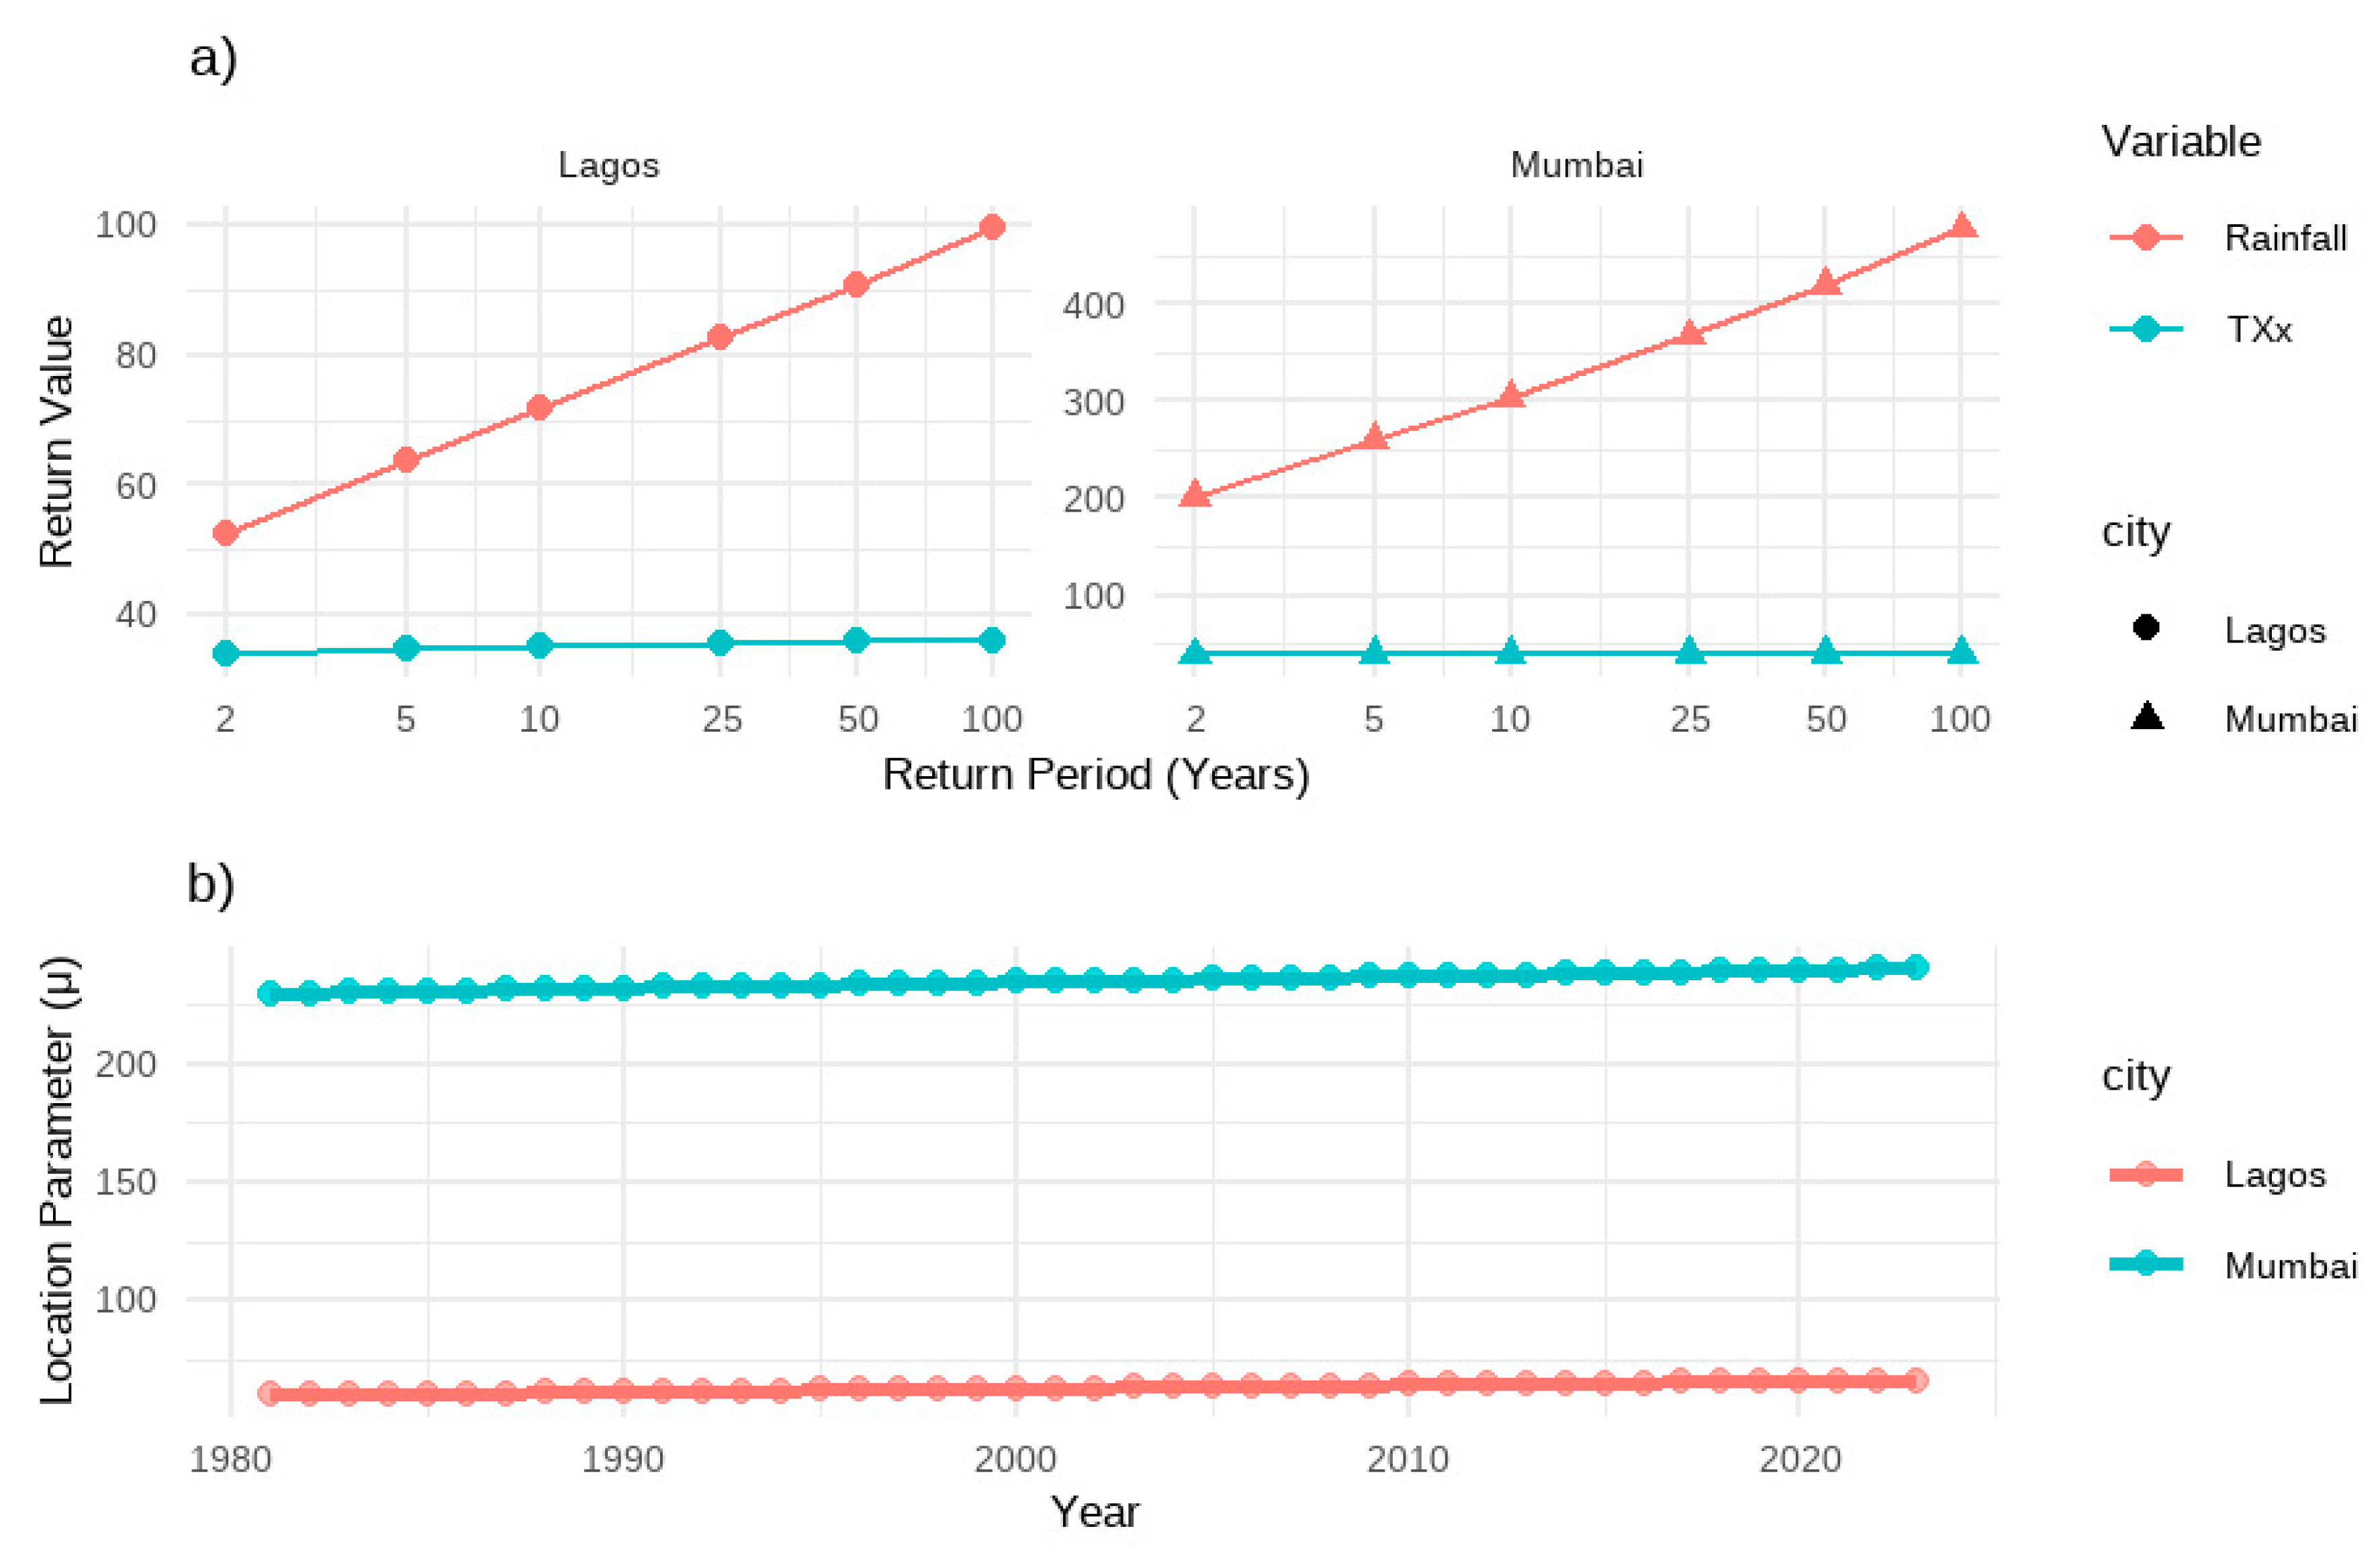
Figure 10.
Flood exposure hotspots identified from spatial overlays in: (a) Lagos (20 Local Government Areas), (b) Mumbai (5 municipal districts). Source: Authors’ spatial analysis using urban infrastructure and elevation data.
Figure 10.
Flood exposure hotspots identified from spatial overlays in: (a) Lagos (20 Local Government Areas), (b) Mumbai (5 municipal districts). Source: Authors’ spatial analysis using urban infrastructure and elevation data.
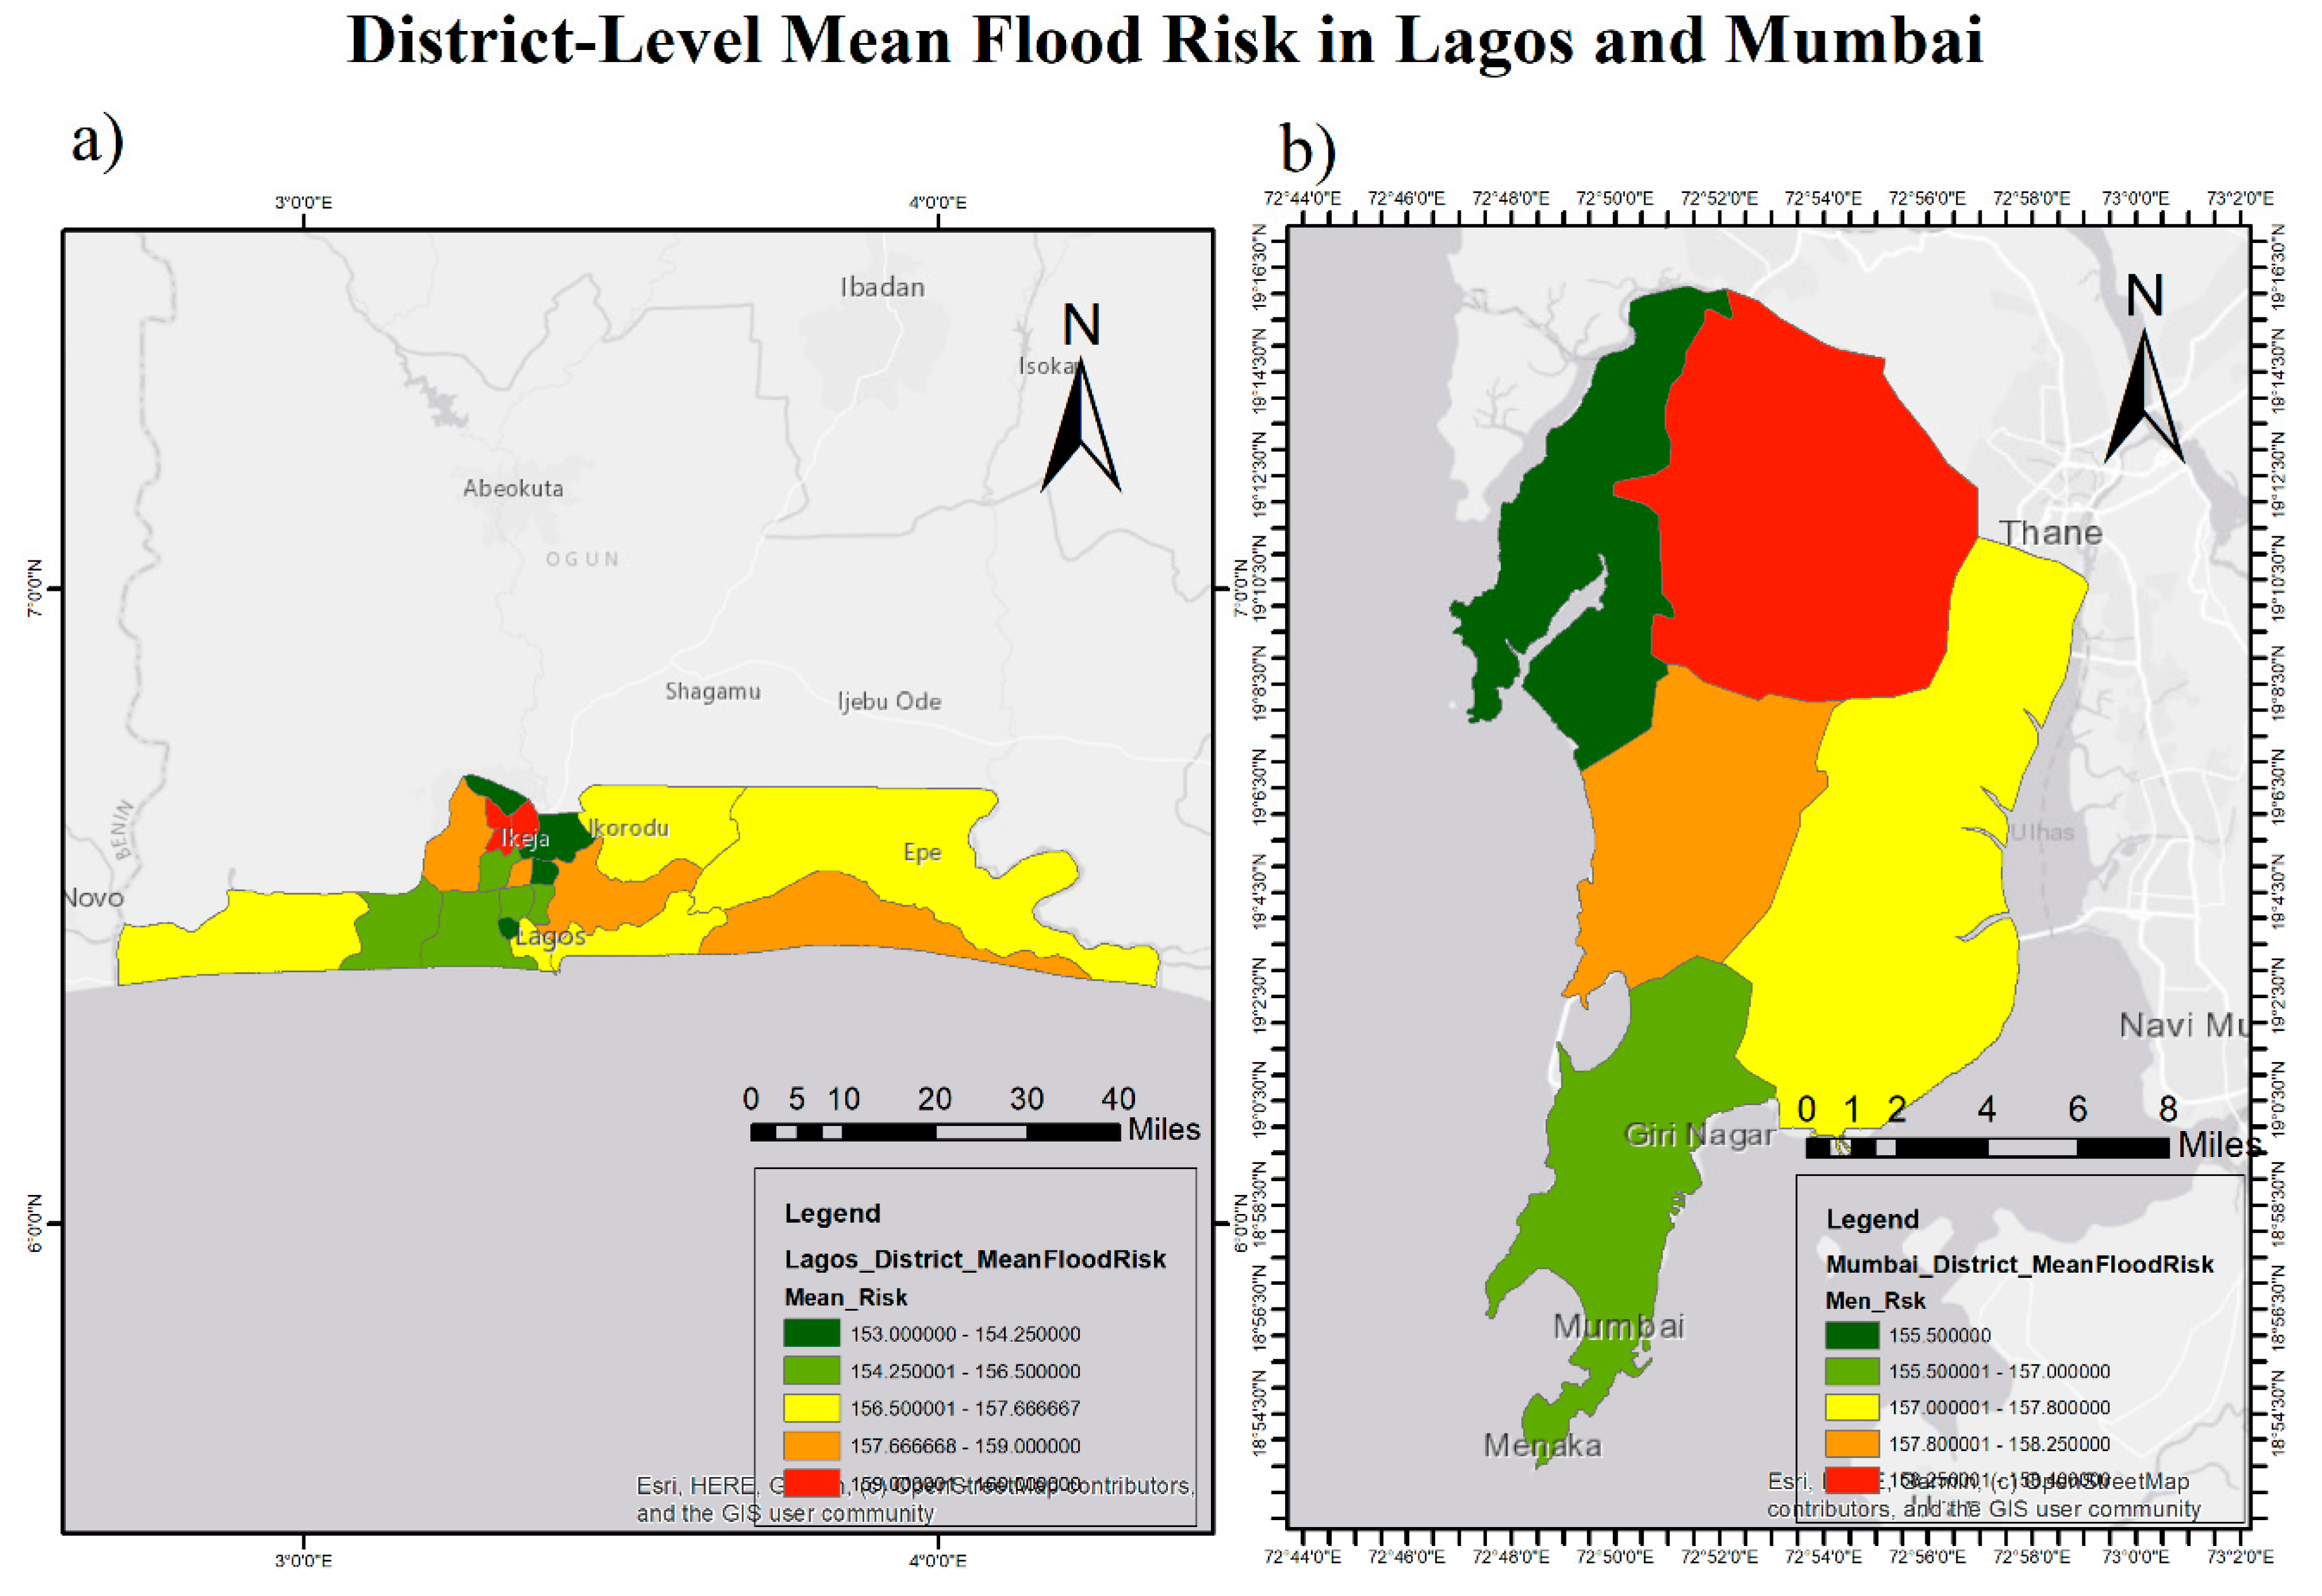
Figure 11.
Composite bar chart of socio-environmental vulnerability indicators for Lagos and Mumbai including population density, drainage conditions, health facility access, and housing quality. Source: National census data and compiled literature.
Figure 11.
Composite bar chart of socio-environmental vulnerability indicators for Lagos and Mumbai including population density, drainage conditions, health facility access, and housing quality. Source: National census data and compiled literature.
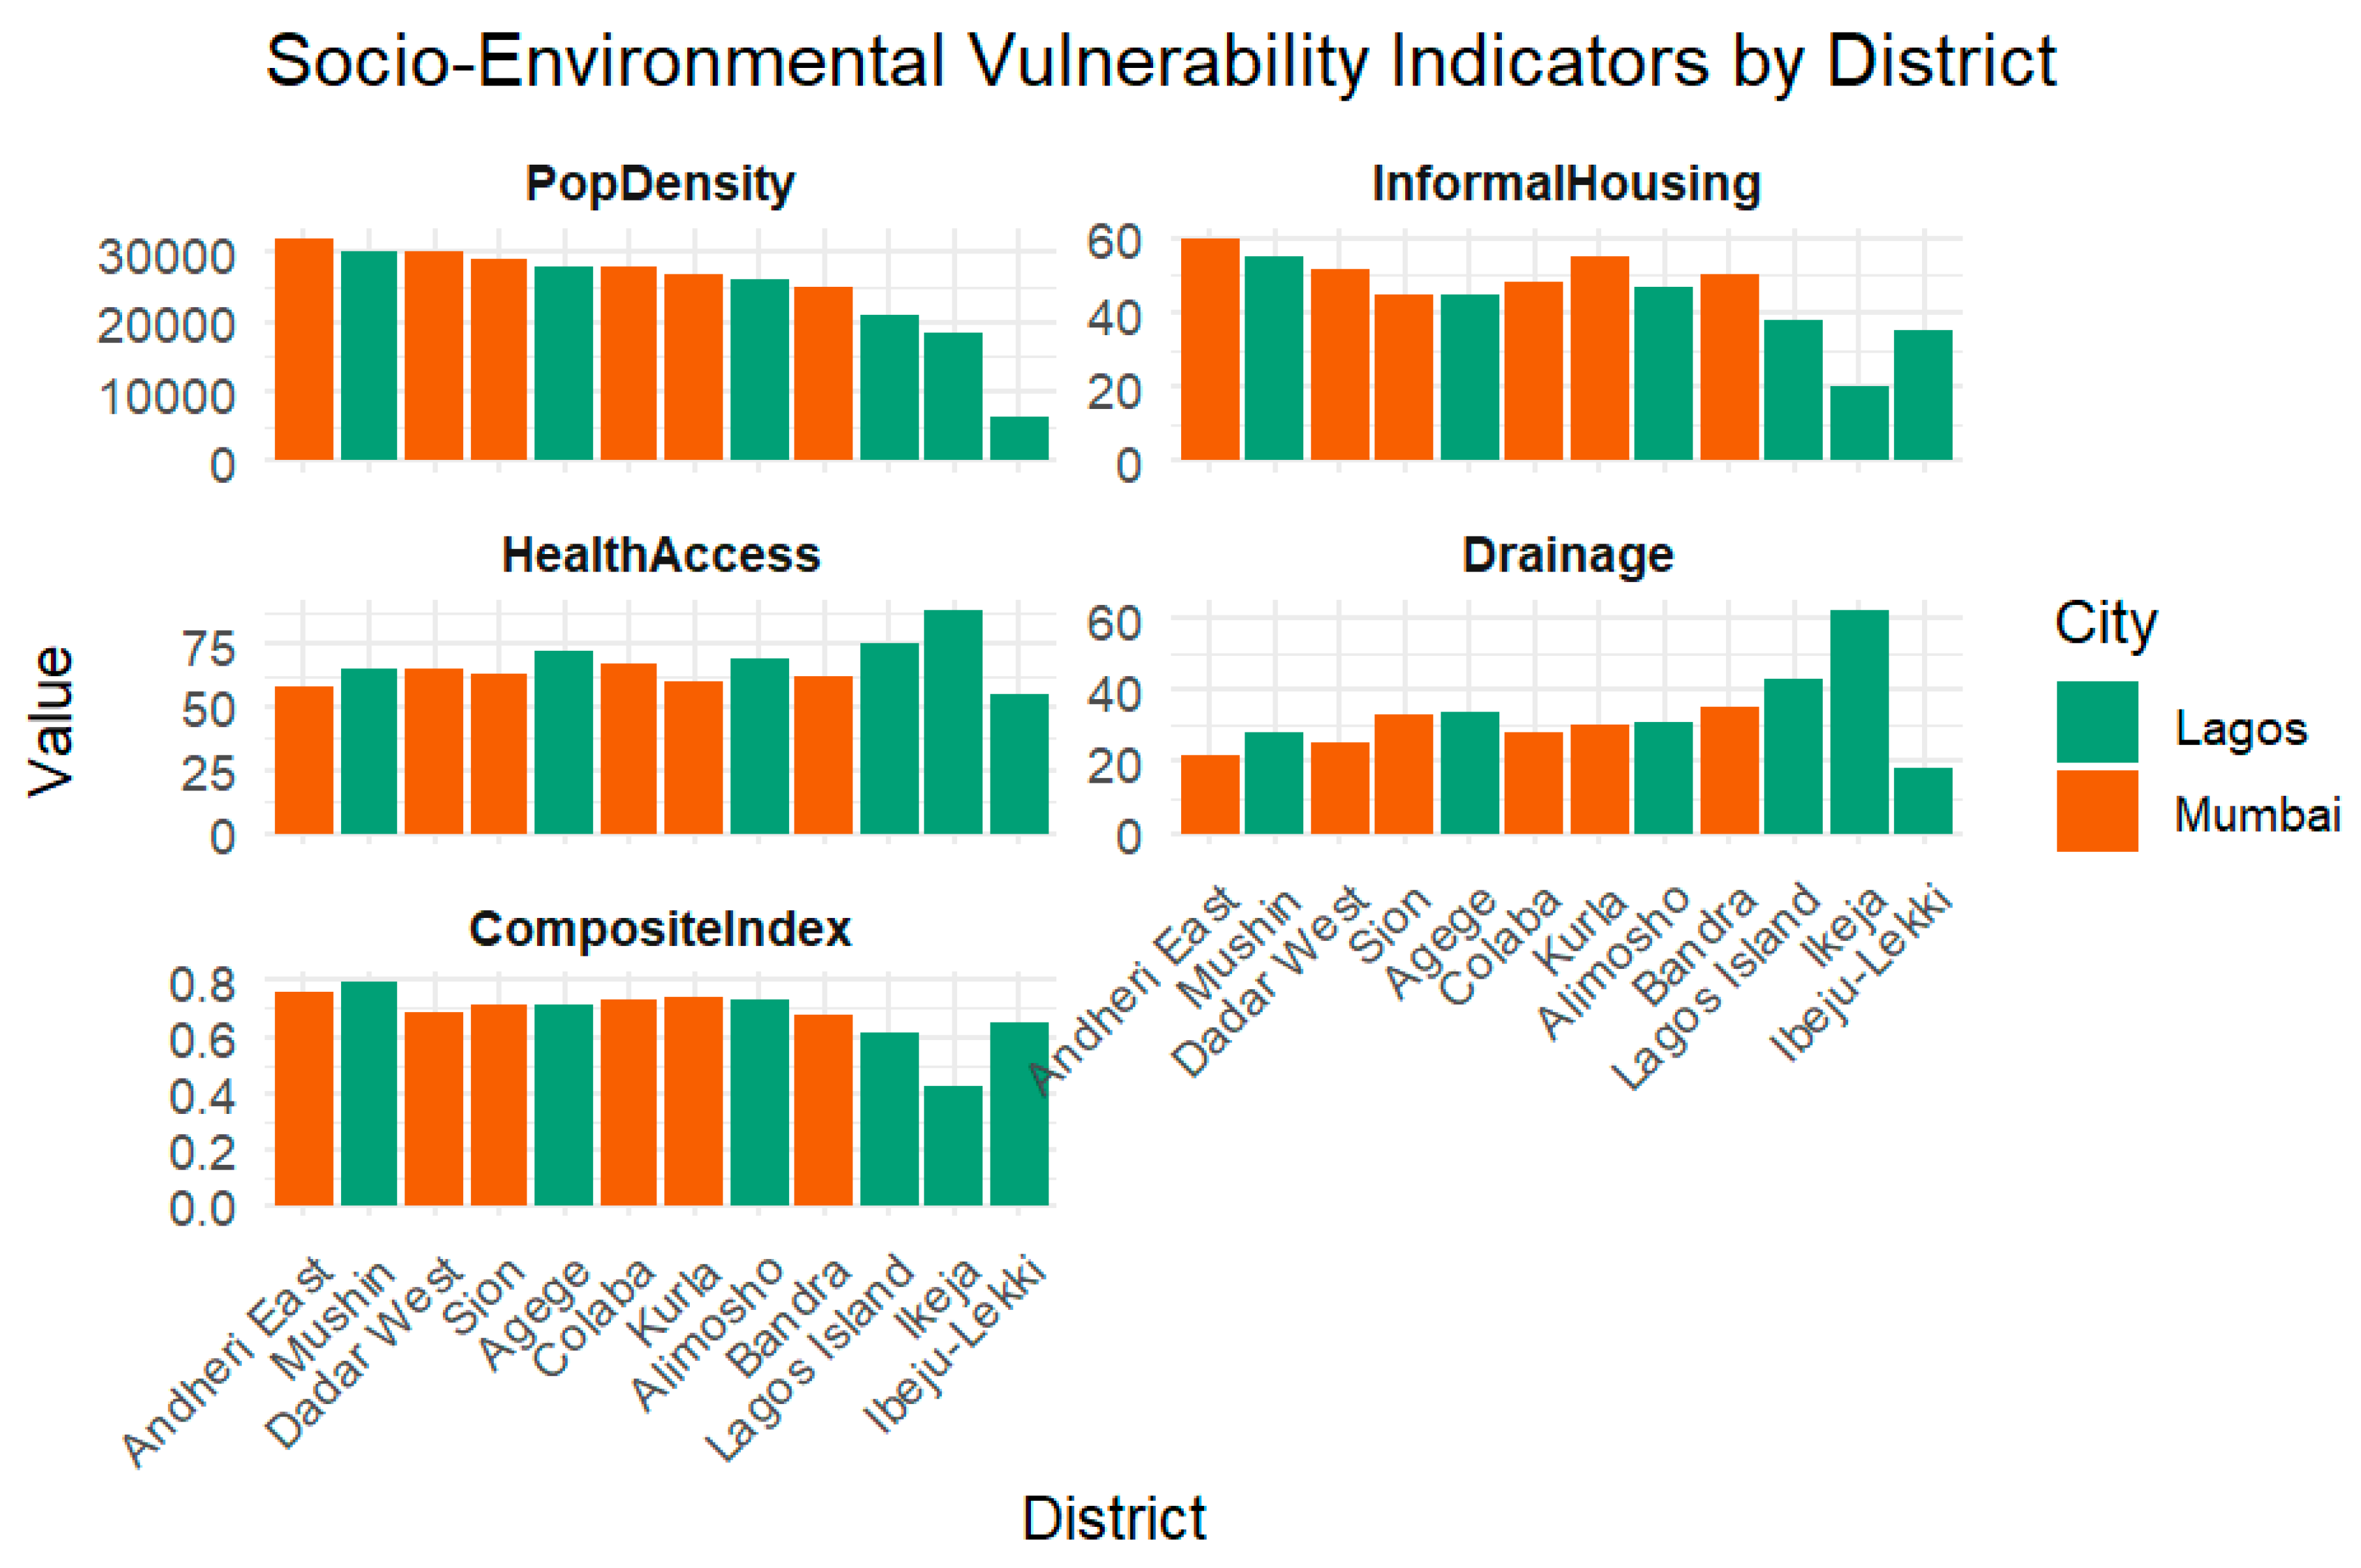
Table 2.
Summary of ETCCDI Indices and Sen’s Slope Trends (1981–2023).
| Index | Lagos Mean | Lagos Slope | Lagos p-value | Mumbai Mean | Mumbai Slope | Mumbai p-value |
| CDD | 25.74 | +0.0000 | 0.9498 | 144.93 | –0.0330 | 0.7610 |
| CWD | 14.77 | –0.0910 | 0.0770 | 11.98 | +0.1330 | 0.0075 |
| RX1day | 55.13 | –0.3070 | 0.0625 | 218.05 | +0.4080 | 0.5301 |
| TNn | 20.07 | +0.0010 | 0.9666 | 14.95 | +0.0110 | 0.1804 |
| TXx | 33.75 | +0.0470 | 0.0003 | 38.57 | +0.0140 | 0.1373 |
Significant trends at p < 0.05 are shown in bold. This table shows the average value of each climate extreme index, the Sen’s slope (rate of change per year), and its significance level for both cities. Source: Authors’ analysis using RClimDex and Mann-Kendall test.
Table 3.
Homogeneity Test Results for Annual Rainfall Time Series.
| Test | Lagos Statistic | Lagos Year | Lagos p-value | Mumbai Statistic | Mumbai Year | Mumbai p-value |
| SNHT | 10.74 | 2005 | — | 10.74 | 2005 | — |
| Buishand Range Test | 11.64 | 2005 | — | 11.64 | 2005 | — |
| Pettitt’s Test | 156 | 1996 | 0.3323 | 169 | 2003 | 0.0043 |
Note: Dashes (—) indicate tests where p-values are not provided by the output. Source: Computed using RHtests and standard homogeneity test packages in R.
Table 4.
χ² Goodness-of-Fit Test for Monthly Distribution of Extreme Events (1981–2023).
| Variable | Lagos χ² | df | p-value | Mumbai χ² | df | p-value |
| Precipitation | 425.29 | 11 | < 2.2×10⁻¹⁶ | 624.28 | 11 | < 2.2×10⁻¹⁶ |
| Tmax | 495.01 | 11 | < 2.2×10⁻¹⁶ | 614.10 | 11 | < 2.2×10⁻¹⁶ |
| Tmin | 531.92 | 11 | < 2.2×10⁻¹⁶ | 791.37 | 11 | < 2.2×10⁻¹⁶ |
Note: All p-values < 2.2×10⁻¹⁶ indicate highly significant monthly variability. Source: Authors’ computation in R using the chisq.test function.
Disclaimer/Publisher’s Note: The statements, opinions and data contained in all publications are solely those of the individual author(s) and contributor(s) and not of MDPI and/or the editor(s). MDPI and/or the editor(s) disclaim responsibility for any injury to people or property resulting from any ideas, methods, instructions or products referred to in the content. |
© 2025 by the authors. Licensee MDPI, Basel, Switzerland. This article is an open access article distributed under the terms and conditions of the Creative Commons Attribution (CC BY) license (http://creativecommons.org/licenses/by/4.0/).
Copyright: This open access article is published under a Creative Commons CC BY 4.0 license, which permit the free download, distribution, and reuse, provided that the author and preprint are cited in any reuse.


