
Submitted:
08 August 2025
Posted:
11 August 2025
You are already at the latest version
Abstract
Bamboo invasion is known to affect soil properties; however, its impact on soil solution chemistry remains poorly understood. This study investigated how bamboo invasion affects major ion concentrations, their vertical distribution, and the distinct ionic compositions maintaining charge balance in soil solution by comparing Moso bamboo (BF) and adjacent Japanese cedar (CF) forests. In the surface soil solution (5 cm) , most ions were significantly higher in CF than in BF, possibly due to the accelerated rock weathering and greater NO₃⁻ accumulation resulting from lower N uptake in CF. Regarding vertical distribution patterns, in CF, almost all ion concentrations were significantly higher in the surface soil solution than in the soil leachate (50 cm), whereas in BF, this phenomenon was observed solely for NO₃⁻, NH₄⁺, and K⁺, likely due to bamboo's high demand for these primary macronutrients. A significant correlation between NO₃⁻ and Ca²⁺/Mg²⁺ concentrations was absent only in the soil leachate of BF. Conversely, anion deficit showed a significant correlation with Ca²⁺/Mg²⁺ in BF soil leachate, with HCO₃⁻ identified as a major component of this deficit. Our study indicates that bamboo invasion could alter soil solution chemistry, leading to impacts on forest soil nutrient availability and downstream water quality.
Keywords:
soil solution chemistry
; calcium
; Nitrate
; anion deficit
; Moso bamboo
; Japanese cedar plantation
1. Introduction
Bamboo species are widely recognized for their commercial value, including providing timber and bamboo shoots, primarily due to their rapid growth characteristics [1]. Due to their versatility, bamboos are cultivated globally, with approximately 35 million hectares of bamboo forest distributed across tropical, subtropical, and temperate regions [2,3]. Despite their significant socio-economic role, some monopodial bamboos species also pose a threat to the adjacent habitat [4]. For example, Moso bamboo (Phyllostachys edulis), a widespread large bamboo species predominantly found in East Asia including China and Japan [5,6,7], is known to be invasive to adjacent forest ecosystems through extensive rhizome systems enabling clonal recruitment [3,4]. This issue is particularly pronounced in Japan's Satoyama, a unique socio-ecological forest landscape [4,8,9]. Here, reduced market demand for bamboo timber and labor shortages have led to the widespread abandonment of bamboo forest management and harvesting [10]. Consequently, bamboo forests rapidly expand into neighboring forests, and their invasion poses a growing threat to species composition and ecological functions of forest ecosystems, raising increasing concern [5,11,12].
Bamboo invasion is generally reported to negatively affect species diversity and aboveground plant biomass in forest [4,11,13]. Regarding impacts on nutrient cycling, many research focuses on how bamboo's superior clonal reproduction and flexible fine-root competition strategy, accompanied by substantial resource acquisition abilities [11,14,15,16], leads to subsequent changes in soil nutrient storage and cycling rates [4,12,17]. A meta-analysis of 72 local studies on the impact of bamboo invasion on soil biochemical properties [18] indicates that, overall, bamboo invasion leads to increases in soil pH and NH₄⁺ and decreases in NO₃⁻ and available potassium. Most of these studies focus on soil as the primary carrier of nutrients. However, although soil solution serves as the direct medium for the movement and transformation of nutrients in the soil [19], the effects of bamboo invasion on soil solution chemistry remain poorly understood. Bamboo invasion significantly affects hydrological processes [20]; its high proportion of stemflow contributes to a unique rainwater distribution and significantly alters rainwater pH and ion concentrations [21,22]. This may have a significant impact on soil solution chemistry as all rainfall portioning reaches the soil surface. Despite this, research on the impact of bamboo invasion on soil solution chemistry is limited to Zhou et al [23] and Fu and Chiwa [16]. Their studies also focus on nitrogen (N) cycling, reporting that bamboo forests reduce NO₃⁻ concentrations in soil leachate. The effects on other major ionic components, including Ca²⁺, Mg²⁺, and K⁺, remain less clear.
Soil solution chemistry is crucial for understanding nutrient cycling in forests. Surface soil solution chemistry reflects soil fertility, as it represents the net effect of nutrient inputs from rainwater and litter decomposition and nutrient uptake by plants [19]. Less mobile ions, such as NH₄⁺, are readily adsorbed by the surface soil exchange complex and exchange with other cations [24]. Highly mobile nutrients, like NO₃⁻ and Ca²⁺, conversely, percolate downwards with soil water into deeper layers, endowing soil leachate with distinct chemical properties [25,26,27]. This soil leachate is also considered a direct pathway for nutrient leaching into streams [28].
Tree species are a primary factor influencing soil solution chemistry in forests because tree roots directly absorb dissolved nutrients from the soil solution, rather than from the solid soil matrix [29,30,31]. Additionally, differences in litter quality and quantity among tree species lead to variations in decomposition and nutrient leaching rates, which are consequently reflected in the soil solution [27,31]. For example, Japanese cedar (Cryptomeria japonica), a common commercial plantation species in East Asia, is reported to have unique calcium cycling characteristics [27,32]. It releases more organic acids that promote weathering, leading to increased Ca in the soil [33]. Furthermore, as Ca²⁺ acts as a primary counter-ion for NO₃⁻ in forest soil [34,35], both frequently move downwards into deeper layers with percolating soil water, resulting in higher soil NO₃⁻ concentrations in deeper layer in cedar forests compared to natural forests [35]. This cedar-driven Ca mobilization mechanism also contributes to increased Ca²⁺ concentrations in headwater streams [27], illustrating that forest soil nutrient cycling significantly influences adjacent aquatic ecosystems. Considering these complex relationships, alterations in species composition induced by bamboo invasion could substantially impact the chemical composition of soil solution and even stream water, highlighting the need for significant attention.
Our previous study in Japan investigated the differences in NO₃⁻ concentrations in surface soil solutions (5 cm) and soil leachate (50 cm) between bamboo forests and adjacent forests [16]. This was achieved by employing a space-for-time substitution method [36], treating bamboo-dominated forests as invaded forests and adjacent woody forests as uninvaded forests, thereby indirectly predicting changes after bamboo invasion. NO₃⁻ concentrations were lower in both surface and deep layers of bamboo forests compared to adjacent forests, attributed to high NO₃⁻ uptake by the abundant fine roots of bamboo. To maintain electroneutrality in the solution, cations like Ca²⁺ and Mg²⁺ in cedar forests need to remain sufficiently high to maintain their counter-ion relationship with NO₃⁻. Therefore, we hypothesize that major cation concentrations (e.g., Ca²⁺ and Mg²⁺) may differ between bamboo forests and adjacent forests, in both surface and deeper layers. Conversely, in bamboo forests, a significant portion of Ca²⁺ and Mg²⁺ may originate from rock weathering [37], and the low levels of NO₃⁻ may be insufficient to support a counter-ion relationship with these cations. Thus, we hypothesize that other anions are required in bamboo forests to maintain the counter-ion relationship with Ca²⁺ and Mg²⁺. Furthermore, as a highly mobile ion, the downward movement of NO₃⁻ with percolation in cedar forests may promote the co-leaching of cations such as Ca²⁺ and Mg²⁺. Consequently, differences in the vertical distribution of ions between surface soil solution and soil leachate may also occur, which needs to be verified.
To test these hypotheses, this study aims to compare the concentrations of major ions in soil solution between Moso bamboo forests and adjacent Japanese cedar plantations. Our objectives are: (1) to compare the concentrations and vertical distribution patterns of major cations (e.g., Ca²⁺, K⁺, Mg²⁺, Na⁺, NH₄⁺) and anions (e.g., NO₃⁻, Cl⁻, SO₄²⁻, anion deficit) in soil solution between Moso bamboo (BF) and Japanese cedar (CF) forests at different depths (5 cm and 50 cm) and (2) to evaluate the counter-ion relationship between major anions (NO₃⁻ and anion deficit) and major cations (Ca²⁺ and Mg²⁺) in soil solution within each forest type and at both soil depths.
2. Methods
2.1. Site Description and Sampling Points for Soil Solution
This study was conducted in an abandoned Moso bamboo forest (BF) and an adjacent Japanese cedar plantation (CF), both located in the Kasuya Research Forest (33° 37′N, 130° 32′E) of Kyushu University, Kyushu Island, Japan (Figure 1). There have been high levels of atmospheric N deposition in this area, reaching a maximum of 15.3 kg N ha⁻¹ yr⁻¹ in 2006 (Chiwa 2021). The mean annual temperature and precipitation were 17.4 °C and 1880 mm, respectively (Japan Meteorological Agency). The soil and substrate were brown forest soil and Sangun metamorphic rock, respectively [38]. Both BF and CF were located on a steep slope (~40°) at 180–280 m a.s.l [11] (Figure 1). The BF was a abandoned Moso bamboo forest without fertilization, thinning, or cutting. The CF was approximately 75 years old and dominated by the evergreen coniferous tree Cryptomeria japonica, the main plantation species in Japan. Understory cover was very low in both BF and CF. Based on our observations, new bamboo shoots and culms were confirmed within the margins of both BF and CF (Figure 1a). This suggests that bamboo invasion in these areas is in the initial stages. However, as Japanese cedar remained the dominant tree species in the transition area, we did not establish experimental sites in the transition area. For soil solution sampling, in April 2021, we randomly selected nine points (10 cm × 10 cm) within both BF and CF, located along an elevation of 200–250 meters. Within each forest type, the distance between any two points was greater than 10 m (Figure 1).
2.2. Soil Solution Collection and Chemical Analysis
We conducted soil solution samplings on 11 separate dates between April 2021 and October 2022. Soil solution was collected by a tension lysimeter with a porous cup and a pressure syringe from the randomly selected points (Figure 1). At each point, a lysimeter (50-cm length) was inserted at a depth of 50 cm to collect soil leachate samples. Another lysimeter (5-cm length) was installed in the shallow forest soil layer (0–5 cm) to collect surface soil solutions. In each sampling date, all lysimeters were set up for over 24 h, and then the soil solutions in the syringes were collected by bottles. After collection, the samples in bottles were transported to the laboratory within 2 h and immediately filtered through syringe filters (0.45-μm, Ekicrodisc, Acro LC3CR, Nihon Pall Ltd., Tokyo, Japan). The pH of soil solution in November 2021 was measured using a pH meter (F-54, Horiba, Japan). The concentrations of major cations (Ca²⁺, K⁺, Mg²⁺, Na⁺, NH₄⁺) and anion (NO₃⁻, Cl⁻, SO₄²⁻) were measured by Ion chromatography (Cation, Dionex ICS-1000, Thermo Fisher Scientific; Anion, Dionex Aquion, Thermo Fisher Scientific, Waltham, MA, USA). Anion deficit (AD) was calculated by subtracting total anion (NO₃⁻, Cl⁻, SO₄²⁻) concentration from total cation (Ca²⁺, K⁺, Mg²⁺, Na⁺, NH₄⁺) concentration, following a modified method based on Chiwa et al. (2016) and Inagaki et al. (2023). We did not include H⁺ concentration in the calculation of anion deficit, as the pH of the soil solution ranged from 6.08 to 7.05 (Table 1).
2.3. Statistical Analysis
We employed Linear Mixed-Effects Models (LMMs) to examine the effects of forest type (BF vs CF), sampling depth of soil solution (Surface soil solution vs Soil leachate), and their interaction on the concentrations of each ion. In the models, forest type, sampling depth were treated as fixed effects, while sampling date and sampling point were included as random effects to account for variation due to repeated measures across time and space. Tukey-adjusted post-hoc pairwise comparisons were conducted within each location (BF vs CF) and within each forest type (Surface soil solution vs Soil leachate). Statistical significance was set at p < 0.05. To assess the correlation relationships between major anions concentrations (NO₃⁻ and anion deficit) and major cations (Ca²⁺ and Mg²⁺), data were analyzed separately for each forest type (Moso bamboo forest, BF; Japanese cedar plantation, CF) and soil depth (surface soil solution, 5 cm; soil leachate, 50 cm). Pearson correlation analysis was performed. For visualization, linear regression models (LMs) were also fitted to the data. The resulting regression equations, along with Pearson's r and its associated p-values (for statistical significance at p < 0.05), were presented on the figures. All statistical analyses were conducted in R version 4.3.3 software [40].
3. Results
3.1. Soil Solution Chemistry in Different Forest Types
In the surface soil solution (0-5 cm), concentrations of Na+, Mg2+, Ca2+, Cl-, and NO3- were significantly lower in BF (e.g., 200.9, 69.1, 128.1, 284.7, 110.3 μmol L-1) than in CF (e.g., 233.2, 88.7, 257.6, 383.9, 354.1 μmol L-1) (Figure 2; Table 2). In contrast, K+, NH4+, and SO42- concentrations were significantly higher in BF (e.g., 80.6, 24.5, 56.2 μmol L-1) than in CF (e.g., 50.0, 6.8, 47.5 μmol L-1). In the soil leachate (50 cm), only Ca²⁺ and NO3- concentrations were significantly lower in BF (e.g., 126.0, 47.5 μmol L-1) than in CF (e.g., 189.8, 305.6 μmol L-1). While NH4+ concentrations were lower in CF, NH₄⁺ concentration in both BF and CF were notably low (1.7 ~ 24.5 μmol L⁻¹) when compared to other ion concentrations at these two depths.
3.2. Vertical Distribution Patterns of Soil Solution Chemistry
In BF, only NH₄⁺ and K⁺ concentrations were significantly higher in the surface soil solution than in the soil leachate (Table 2). However, in CF, almost all anion and cation concentrations were significantly higher in the surface layer than in the deeper layer, with SO₄²⁻ being the only exception that did not show a significant difference.
3.3. Correlations Between NO₃⁻ and Major Cations (Ca²⁺, Mg²⁺)
In the surface soil solution of BF, NO₃⁻ was positively and significantly correlated with both Ca²⁺ (e.g., slope = 0.68, r² = 0.80) and Mg²⁺ (e.g., slope = 0.41, r² = 0.68) (Figure 3a,b), and their slopes were significant. However, in the soil leachate of BF, NO₃⁻ did not exhibit a significant correlation with either. In CF, significant positive correlations between NO₃⁻ with both Ca²⁺ and Mg²⁺ were observed in both the surface soil solution (e.g., for Ca²⁺, slope = 0.83, r² = 0.55; for Mg²⁺, slope = 0.29, r² = 0.67) and soil leachate (e.g., for Ca²⁺, slope = 0.60, r² = 0.55; for Mg²⁺, slope = 0.23, r² = 0.54).
3.4. Anion Deficit Dynamics and Its Correlations with Ca²⁺ and Mg²⁺
Anion deficit in soil solution showed distinct patterns between forest types and depths (Figure S1). In the surface soil solution, anion deficit in BF was higher than in CF, but this difference was not significant. In the soil leachate, the anion deficit in BF was significantly higher than in CF.
For Ca²⁺, anion deficit exhibited a significant correlation only in the BF soil leachate (e.g., slope = 0.17, r² = 0.58) (Figure 4a). This relationship was not observed in the BF surface solution, nor in either the surface soil solution or soil leachate of CF. For Mg²⁺, significant correlations were identified between anion deficit and Mg²⁺ in the soil leachate of both BF (e.g., slope = 0.10, r² = 0.72) and CF (e.g., slope = 0.10, r² = 0.40) (Figure 4b). Conversely, no significant correlation was found in the surface soil solution of either BF or CF.
4. Discussion
4.1. Mechanisms Underlying Different Soil Solution Chemistry Between BF and CF
In surface soil solutions, concentrations of major cations (e.g., Mg2+, Ca2+) in CF were significantly higher than in BF (Figure 2). This can be explained by several mechanisms. Primarily, rock weathering is the main source of major cations in forest soil. The Sangun metamorphic rock, which is the predominant rock type at this study site, consists primarily of silicate minerals that may release Ca²⁺, Mg²⁺, and other cations upon reaction with acids [40]. The study site, located approximately 15 km from the nearby city of Fukuoka, is an area experiencing high atmospheric N deposition (maximum: 15.3 kg N ha-1 yr-1 in 2006) [41]. Therefore, atmospheric N deposition may have promoted a faster rock weathering rate. Particularly, Japanese cedar trees are known for their physiological characteristics that can alter the chemical weathering rate of bedrock [27]. For instance, Japanese cedar exhibits particularly strongly acidic stemflow [42] and rapidly exudates organic acids from its roots [33]. Both these processes can accelerate the rate of chemical weathering in CF.
Secondly, NO₃⁻ concentrations in the CF surface soil solution were approximately three times higher than in BF (Figure 2), requiring the acquisition of more Ca²⁺ and Mg²⁺ to maintain electroneutrality in the soil solution. This study site has experienced high levels of atmospheric acid deposition and are documented as N-saturated ecosystems [43]. N saturation implies that atmospheric N input exceeds the uptake capacity of plants and microbes, leading to abundant NO₃⁻ availability in the surface soil [28]. In BF, bamboo develops extensive root systems for their rapid growth and substantial nutrient uptake [14,17]. Conversely, Japanese cedar employs a more conservative nutrient uptake strategy [25,44]; indeed, fine root biomass in Japanese cedar plantation has been reported to be sixteen times lower than in adjacent bamboo forests [11]. Consequently, due to lower NO₃⁻ uptake in CF compared to BF, NO₃⁻ accumulates in CF surface soil [16]. To maintain electroneutrality in the soil solution, more cations, such as Ca²⁺ and Mg²⁺, may be consequently released from the soil cation exchange complex and litter decomposition. This is further supported by the positive correlations observed between NO₃⁻ and Ca²⁺/Mg²⁺ in the surface soil solution (Figure 3a,b).
In soil leachate, only Ca²⁺ and NO₃⁻ concentrations were significantly lower in BF than in CF (Fig 2b). Given that NO₃⁻ is a highly mobile ion, moving readily with water flow [45], the sustained high concentrations of NO₃⁻ in the CF soil leachate may suggest substantial downward percolation and leaching of surface NO₃⁻ into deeper layers. Currently, Ca²⁺, as a primary counter-ion for NO₃⁻, moves together with it. This can be supported by the positive correlation between NO₃⁻ and Ca²⁺ observed in both the surface soil solution and soil leachate of CF (Figure 3a). In contrast, in BF, the soil leachate NO₃⁻ concentration was only approximately half of that in the surface soil solution (Figure 2b), which may indicate significant NO₃⁻ uptake by bamboo roots during downward percolation. Correspondingly, Ca²⁺ concentration of surface soil solution in BF showed no significant difference from that of soil leachate (Table 2), possibly suggesting limited Ca²⁺ downward percolation.
4.2. Differences in Vertical Distribution Patterns for Major Ions Between BF and CF
In CF, almost all major cations and anions (excluding SO₄²⁻) exhibited significantly higher concentrations in the surface soil solution than in the soil leachate (Table 2). This indicates a typical pattern of nutrient surface enrichment, where the surface soil receives nutrient input from atmospheric deposition, litter decomposition, and high biological activity [45,46,47]. Even with the observed downward percolation and leaching of NO₃⁻ and Ca²⁺ in CF, nutrient ions appear to be continuously supplied to the surface soil water. However, in BF, only NO₃⁻, NH₄⁺, and K⁺ exhibited significantly higher concentrations in the surface soil solution than in the soil leachate (Table 2). This reflects the high productivity and vigorous nutrient demand of bamboo, especially for the primary macronutrients like N and K, which may be required in higher demand compared to other nutrients such as Ca and Mg. Bamboo's extensive root system efficiently absorbs N and K, facilitating a rapid nutrient cycling where elements are quickly reabsorbed and integrated into biomass after input from litter decomposition in surface soil [11,16,48]. This rapid nutrient cycling may lead to a short residence time for soluble ions in the soil, resulting in less accumulation in deeper soil layers, thus explaining the low NO₃⁻ and K⁺ concentrations at BF soil leachate.
4.3. Possible Mechanisms for Vertical Differences in Ionic Composition Maintaining Charge Balance (Ca²⁺, Mg²⁺, NO₃⁻, Anion Deficit) Between BF and CF
In CF, NO₃⁻ concentration was significantly positively correlated with Ca²⁺ and Mg²⁺ concentrations in both surface soil solution and soil leachate (Figure 3a,b). As discussed in section 4.1, to maintain electroneutrality in soil solution, Ca²⁺ and Mg²⁺ move vertically downward along with the substantial NO₃⁻ percolation. This mechanism explains the significant positive correlation between NO₃⁻ and these cations observed even in the soil leachate of CF (Figure 3a,b).
In BF, the significant positive correlation between NO₃⁻ and Ca²⁺/Mg²⁺ was altered in the soil leachate due to the substantial NO₃⁻ uptake by bamboo roots during percolation (Figure 3a,b). Consequently, the Ca²⁺ and Mg²⁺ derived from rock weathering in the BF leachate need be balanced by other anions to maintain electroneutrality. We observed a significant positive correlation between Ca²⁺ and Mg²⁺ with anion deficit in BF (Figure 4a,b), suggesting the presence of unmeasured anions serving as counter-ions for Ca²⁺ and Mg²⁺. In this study, the pH of the soil leachate in BF was 7.05 (Table 1). Under such near-neutral pH conditions, concentration of H+ is considered to be negligible, thus HCO₃⁻ likely constitutes a significant portion of the anion deficit [49,50]. Therefore, we infer that HCO₃⁻ served as the dominant counter-ion for cations in the BF soil leachate. This inference is supported by previous research. Firstly, according to Nye [51], when plant roots absorb NO₃⁻, the total anion influx (e.g., NO₃⁻ + SO₄²⁻ + Cl⁻) into the root often exceeds the total cation influx (e.g., K⁺ + Na⁺ + Mg²⁺ + Ca²⁺). Thus, to maintain electroneutrality in the rhizosphere, plants commonly release HCO₃⁻ from their roots [51]. Secondly, to meet its rapid biomass growth and high nutrient uptake, bamboo may requires vigorous root respiration to provide energy [52]. The CO₂ produced during soil respiration, in a near-neutral pH environment, may readily form HCO₃⁻ in soil solution. Previous studies also reported that atmospheric N deposition significantly increased soil respiration in Moso bamboo forests [53]. Huang et al. [54] also reported that fertilization significantly increased both heterotrophic and autotrophic respiration in Moso bamboo forests. As our study site is in an area with high atmospheric N deposition, this likely promoted soil respiration in BF. In summary, we attribute the potentially higher soil respiration rate in BF, promoted by high atmospheric N deposition, led to the formation of HCO₃⁻. This HCO₃⁻ then served as the dominant counter-ion for cations, maintaining charge balance in the BF soil leachate where NO₃⁻ was limited.
5. Conclusions
This study investigated distinct soil solution chemistry in bamboo forests and adjacent conifer forests, showing clear differences in major ion concentration, their distribution with depth, and the distinct ionic compositions maintaining charge balance. We found CF generally showed higher ion concentrations in surface soil solution, driven by possibly accelerated rock weathering and greater NO₃⁻ accumulation due to its lower N uptake. In contrast, BF exhibited lower cation concentrations and distinct vertical patterns, with bamboo's high NO₃⁻ uptake altering the counter-ion relationship between NO₃⁻ and Ca/Mg in the deeper soil layer, where HCO₃⁻ likely serves as the dominant counter-ion for Ca/Mg. The findings of this study thus indicate that bamboo invasion may alter anion and cation concentrations in soil solutions and their counter-ion relationships at different depths. Its impacts on forest soil nutrient availability and the nutrients leached into stream water require significant attention.
Supplementary Materials
The following supporting information can be downloaded at the website of this paper posted on Preprints.org.
Author Contributions
Conceptualization, D.F. and M.C.; Methodology, D.F. and M.C.; Investigation, D.F. and M.C.; Data Curation, D.F. and M.C..; Writing – Original Draft Preparation, D.F.; Writing – Review & Editing, M.C.; Visualization, D.F.; Supervision, M.C.
Funding
This study was financially supported by JST SPRING (grant number JPMJSP2136) and by JSPS KAKENHI (grant numbers JP22H02386).
Data Availability
Data is available from the Kyushu University Institutional Repository (QIR) (https://rds.dx.kyushu-u.ac.jp/en/qir).
Acknowledgements
We thank the faculty members, staffs and students of the Laboratory of Ecohydrology, Kyushu University Forest, especially Dr. Hayato Abe, Mr. Zhouqiang Li and Dr. Tomonori Kume for their help with data acquisition and helpful discussions. We also thank Dr. Ayumi Katayama of Kyushu University and Dr. Takuo Hishi of Fukuoka University for their constructive suggestions on statistical analysis.
Competing Interests
The authors declare no conflict of interests.
References
- Gao, J. Breeding Status and Strategies of Moso Bamboo. In The Moso Bamboo. In The Moso Bamboo Genome; Gao, J., Ed.; Springer International Publishing: Cham, 2021; pp. 193–208. ISBN 978-3-030-80836-5. [Google Scholar]
- Lee, S.H.; Md Tahir, P.; Osman Al-Edrus, S.S.; Uyup, M.K.A. Bamboo Resources, Trade, and Utilisation. In Multifaceted Bamboo: Engineered Products and Other Applications; Md Tahir, P., Lee, S.H., Osman Al-Edrus, S.S., Uyup, M.K.A., Eds.; Springer Nature: Singapore, 2023; pp. 1–14. ISBN 978-981-19-9327-5. [Google Scholar]
- Buziquia, S.T.; Lopes, P.V.F.; Almeida, A.K.; De Almeida, I.K. Impacts of Bamboo Spreading: A Review. Biodivers Conserv 2019, 28, 3695–3711. [Google Scholar] [CrossRef]
- Xu, Q.-F.; Liang, C.-F.; Chen, J.-H.; Li, Y.-C.; Qin, H.; Fuhrmann, J.J. Rapid Bamboo Invasion (Expansion) and Its Effects on Biodiversity and Soil Processes +. Global Ecology and Conservation 2020, 21, e00787. [Google Scholar] [CrossRef]
- Ouyang, M.; Eziz, A.; Xiao, S.; Fang, W.; Cai, Q.; Ma, S.; Zhu, J.; Yang, Q.; Hu, J.; Tang, Z.; et al. Effects of Bamboo Invasion on Forest Structures and Diameter–Height Allometries. Forest Ecosystems 2025, 12, 100256. [Google Scholar] [CrossRef]
- Isagi, Y.; Torii, A. Range Expansion and Its Mechanisms in a Naturalized Bamboo Species, Phyllostachys Pubescens, in Japan. Journal of Sustainable Forestry 1997, 6, 127–141. [Google Scholar] [CrossRef]
- Li, P.; Zhou, G.; Du, H.; Lu, D.; Mo, L.; Xu, X.; Shi, Y.; Zhou, Y. Current and Potential Carbon Stocks in Moso Bamboo Forests in China. Journal of Environmental Management 2015, 156, 89–96. [Google Scholar] [CrossRef]
- Kamada, M. Satoyama Landscape of Japan—Past, Present, and Future. In Landscape Ecology for Sustainable Society; Hong, S.-K., Nakagoshi, N., Eds.; Springer International Publishing: Cham, 2017; pp. 87–109. ISBN 978-3-319-74328-8. [Google Scholar]
- Suzuki, S. Chronological Location Analyses of Giant Bamboo (Phyllostachys Pubescens) Groves and Their Invasive Expansion in a Satoyama Landscape Area, Western Japan. Plant Species Biology 2015, 30, 63–71. [Google Scholar] [CrossRef]
- Manabe, T., Shibata, S., Hasegawa, H., & Itoh, K. Trends and issues of landscape ecological studies on range expansion of bamboo forests in Japan—perspective for sustainable use of bamboo forests—. Jpn. J. Landsc. Ecol. 2020, 25:119–135. [CrossRef]
- Shimono, K.; Katayama, A.; Kume, T.; Enoki, T.; Chiwa, M.; Hishi, T. Differences in Net Primary Production Allocation and Nitrogen Use Efficiency between Moso Bamboo and Japanese Cedar Forests along a Slope. Journal of Forest Research 2022, 27, 28–35. [Google Scholar] [CrossRef]
- Song, Q.; Ouyang, M.; Yang, Q.; Lu, H.; Yang, G.; Chen, F.; Shi, J.-M. Degradation of Litter Quality and Decline of Soil Nitrogen Mineralization after Moso Bamboo (Phyllostachys Pubscens) Expansion to Neighboring Broadleaved Forest in Subtropical China. Plant Soil 2016, 404, 113–124. [Google Scholar] [CrossRef]
- Yen, T.-M.; Lee, J.-S. Comparing Aboveground Carbon Sequestration between Moso Bamboo (Phyllostachys Heterocycla) and China Fir (Cunninghamia Lanceolata) Forests Based on the Allometric Model. Forest Ecology and Management 2011, 261, 995–1002. [Google Scholar] [CrossRef]
- Zuo, K.; Fan, L.; Guo, Z.; Zhang, L.; Duan, Y.; Zhang, J.; Chen, S.; Lin, H.; Hu, R. High Nutrient Utilization and Resorption Efficiency Promote Bamboo Expansion and Invasion. Journal of Environmental Management 2024, 362, 121370. [Google Scholar] [CrossRef]
- Ni, H.; Su, W.; Fan, S.; Chu, H. Effects of Intensive Management Practices on Rhizosphere Soil Properties, Root Growth, and Nutrient Uptake in Moso Bamboo Plantations in Subtropical China. Forest Ecology and Management 2021, 493, 119083. [Google Scholar] [CrossRef]
- Fu, D.; Chiwa, M. Contrasting Nitrate Leaching from an Abandoned Moso Bamboo Forest and a Japanese Cedar Plantation: Role of Vegetation in Mitigating Nitrate Leaching. Plant Soil 2023, 492, 229–240. [Google Scholar] [CrossRef]
- Song, Q.; Lu, H.; Liu, J.; Yang, J.; Yang, G.; Yang, Q. Accessing the Impacts of Bamboo Expansion on NPP and N Cycling in Evergreen Broadleaved Forest in Subtropical China. Scientific Reports 2017, 7, 40383. [Google Scholar] [CrossRef] [PubMed]
- Luo, W.; Zhang, Q.; Wang, P.; Luo, J.; She, C.; Guo, X.; Yuan, J.; Sun, Y.; Guo, R.; Li, Z.; et al. Unveiling the Impacts Moso Bamboo Invasion on Litter and Soil Properties: A Meta-Analysis. Science of The Total Environment 2024, 909, 168532. [Google Scholar] [CrossRef] [PubMed]
- Smethurst, P.J. Soil Solution and Other Soil Analyses as Indicators of Nutrient Supply: A Review. Forest Ecology and Management 2000, 138, 397–411. [Google Scholar] [CrossRef]
- Ichihashi, R.; Komatsu, H.; Kume, T.; Onozawa, Y.; Shinohara, Y.; Tsuruta, K.; Otsuki, K. Stand-Scale Transpiration of Two Moso Bamboo Stands with Different Culm Densities. Ecohydrology 2015, 8, 450–459. [Google Scholar] [CrossRef]
- Yang, T.; Li, Y.; Ouyang, X.; Wang, B.; Ge, X.; Tang, L. Bamboo Plantation Establishment Changes Rainfall Partitioning and Chemistry. Ecosystems 2023, 26, 1326–1334. [Google Scholar] [CrossRef]
- Chiwa, M.; Onozawa, Y.; Otsuki, K. Hydrochemical Characteristics of Throughfall and Stemflow in a Moso-Bamboo (Phyllostachys Pubescens) Forest. Hydrological Processes 2010, 24, 2924–2933. [Google Scholar] [CrossRef]
- Zhou, Z.; Liu, Y.; Zhu, Q.; Lai, X.; Liao, K. Comparing the Variations and Controlling Factors of Soil N2O Emissions and NO3–-N Leaching on Tea and Bamboo Hillslopes. CATENA 2020, 188, 104463. [Google Scholar] [CrossRef]
- Adsorption of Dissolved Nitrogen by Forest Mineral Soils Available online:. Available online: https://cdnsciencepub.com/doi/abs/10.1139/x09-147 (accessed on 24 July 2025).
- Chiwa, M.; Tateno ,Ryunosuke; Hishi ,Takuo; and Shibata, H. Nitrate Leaching from Japanese Temperate Forest Ecosystems in Response to Elevated Atmospheric N Deposition. Journal of Forest Research 2019, 24, 1–15. [CrossRef]
- Gundersen, P.; Schmidt, I.K.; Raulund-Rasmussen, K. Leaching of Nitrate from Temperate Forests Effects of Air Pollution and Forest Management. Environ. Rev. 2006, 14, 1–57. [Google Scholar] [CrossRef]
- Ohta, T.; Shin, K.-C.; Saitoh, Y.; Nakano, T.; Hiura, T. The Effects of Differences in Vegetation on Calcium Dynamics in Headwater Streams. Ecosystems 2018, 21, 1390–1403. [Google Scholar] [CrossRef]
- Aber, J.; McDowell, W.; Nadelhoffer, K.; Magill, A.; Berntson, G.; Kamakea, M.; McNulty, S.; Currie, W.; Rustad, L.; Fernandez, I. Nitrogen Saturation in Temperate Forest Ecosystems: Hypotheses Revisited. BioScience 1998, 48, 921–934. [Google Scholar] [CrossRef]
- Hagen-Thorn, A.; Callesen, I.; Armolaitis, K.; Nihlgård, B. The Impact of Six European Tree Species on the Chemistry of Mineral Topsoil in Forest Plantations on Former Agricultural Land. Forest Ecology and Management 2004, 195, 373–384. [Google Scholar] [CrossRef]
- Strobel, B.W.; Hansen, H.C.B.; Borggaard, O.K.; Andersen, M.K.; Raulund-Rasmussen, K. Composition and Reactivity of DOC in Forest Floor Soil Solutions in Relation to Tree Species and Soil Type. Biogeochemistry 2001, 56, 1–26. [Google Scholar] [CrossRef]
- Legout, A.; van der Heijden, G.; Jaffrain, J.; Boudot, J.-P.; Ranger, J. Tree Species Effects on Solution Chemistry and Major Element Fluxes: A Case Study in the Morvan (Breuil, France). Forest Ecology and Management 2016, 378, 244–258. [Google Scholar] [CrossRef]
- Ohta, T.; Niwa, S.; Hiura, T. Calcium Concentration in Leaf Litter Affects the Abundance and Survival of Crustaceans in Streams Draining Warm–Temperate Forests. Freshwater Biology 2014, 59, 748–760. [Google Scholar] [CrossRef]
- Ohta, T.; Hiura, T. Root Exudation of Low-Molecular-Mass-Organic Acids by Six Tree Species Alters the Dynamics of Calcium and Magnesium in Soil. Can. J. Soil. Sci. 2016, 96, 199–206. [Google Scholar] [CrossRef]
- D’Amore, D.V.; Hennon, P.E.; Schaberg, P.G.; Hawley, G.J. Adaptation to Exploit Nitrate in Surface Soils Predisposes Yellow-Cedar to Climate-Induced Decline While Enhancing the Survival of Western Redcedar: A New Hypothesis. Forest Ecology and Management 2009, 258, 2261–2268. [Google Scholar] [CrossRef]
- Liu, Y.; Chiwa, M. Influence of Surface Soil Chemistry on Nutrient Leaching from Japanese Cedar Plantations and Natural Forests. Landscape Ecol Eng 2024, 20, 187–194. [Google Scholar] [CrossRef]
- Space-for-Time Substitution as an Alternative to Long-Term Studies. In Long-Term Studies in Ecology; Springer New York: New York, NY, 1989; pp. 110–135 ISBN 978-1-4615-7360-9.
- Dijkstra, F.A.; Van Breemen, N.; Jongmans, A.G.; Davies, G.R.; Likens, G.E. Calcium Weathering in Forested Soils and the Effect of Different Tree Species. Biogeochemistry 2003, 62, 253–275. [Google Scholar] [CrossRef]
- Chiwa, M. Long-Term Changes in Atmospheric Nitrogen Deposition and Stream Water Nitrate Leaching from Forested Watersheds in Western Japan. Environmental Pollution 2021, 287, 117634. [Google Scholar] [CrossRef] [PubMed]
- Shinohara, Y.; Misumi, Y.; Kubota, T.; Nanko, K. Characteristics of Soil Erosion in a Moso-Bamboo Forest of Western Japan: Comparison with a Broadleaved Forest and a Coniferous Forest. CATENA 2019, 172, 451–460. [Google Scholar] [CrossRef]
- R Core Team (2024). _R: A Language and Environment for Statistical Computing_. R Foundation for Statistical Computing, Vienna, Austria.
- Asiedu, D.K.; Suzuki, S.; Shibata, T. Provenance of Sandstones from the Lower Cretaceous Sasayama Group, Inner Zone of Southwest Japan. Sedimentary Geology 2000, 131, 9–24. [Google Scholar] [CrossRef]
- Nakanishi, A.; Shibata, H.; Inokura, Y.; Nakao, T.; Toda, H.; Satoh, F.; Sasa, K. Chemical Characteristics in Stemflow of Japanese Cedar in Japan. Water, Air, & Soil Pollution 2001, 130, 709–714. [Google Scholar] [CrossRef]
- Ding, W.; Tsunogai, U.; Nakagawa, F.; Sambuichi, T.; Chiwa, M.; Kasahara, T.; Shinozuka, K. Stable Isotopic Evidence for the Excess Leaching of Unprocessed Atmospheric Nitrate from Forested Catchments under High Nitrogen Saturation. Biogeosciences 2023, 20, 753–766. [Google Scholar] [CrossRef]
- Yang, R.; Fukuzawa, K.; Nakayama, M.; Tateno, R.; Hishi, T.; Shibata, H.; Chiwa, M. Nitrate Leaching and Its Susceptibility in Response to Elevated Nitrogen Deposition in Japanese Forests. Journal of Forest Research 2024, 29, 81–88. [Google Scholar] [CrossRef]
- Jobbágy, E.G.; Jackson, R.B. The Distribution of Soil Nutrients with Depth: Global Patterns and the Imprint of Plants. Biogeochemistry 2001, 53, 51–77. [Google Scholar] [CrossRef]
- Farooq, T.H.; Xincheng, X.; Shakoor, A.; Rashid, M.H.U.; Bashir, M.F.; Nawaz, M.F.; Kumar, U.; Shahzad, S.M.; Yan, W. Spatial Distribution of Carbon Dynamics and Nutrient Enrichment Capacity in Different Layers and Tree Tissues of Castanopsis Eyeri Natural Forest Ecosystem. Environ Sci Pollut Res 2022, 29, 10250–10262. [Google Scholar] [CrossRef]
- Wang, W.; Wang, H.; Zu, Y. Temporal Changes in SOM, N, P, K, and Their Stoichiometric Ratios during Reforestation in China and Interactions with Soil Depths: Importance of Deep-Layer Soil and Management Implications. Forest Ecology and Management 2014, 325, 8–17. [Google Scholar] [CrossRef]
- Guan, F.; Xia, M.; Tang, X.; Fan, S. Spatial Variability of Soil Nitrogen, Phosphorus and Potassium Contents in Moso Bamboo Forests in Yong’an City, China. CATENA 2017, 150, 161–172. [Google Scholar] [CrossRef]
- Inagaki, Y.; Sakai, H.; Shinomiya, Y.; Yoshinaga, S.; Torii, A.; Yamada, T.; Noguchi, K.; Morishita, T.; Fujii, K. Effects of Climate and Acidic Deposition on Interannual Variations of Stream Water Chemistry in Forested Watersheds in the Shimanto River Basin, Southern Japan. Ecological Research 2025, 40, 249–263. [Google Scholar] [CrossRef]
- Urakawa, R.; Toda, H.; Cao, Y. Long-term Changes in Stream Water Chemistry in Small Forested Watersheds in the Northern Kanto Region. Ecological Research 2025, 40, 264–276. [Google Scholar] [CrossRef]
- Nye, P.H. Changes of pH across the Rhizosphere Induced by Roots. Plant Soil 1981, 61, 7–26. [Google Scholar] [CrossRef]
- Bassirirad, H. Kinetics of Nutrient Uptake by Roots: Responses to Global Change. New Phytologist 2000, 147, 155–169. [Google Scholar] [CrossRef]
- Li, Q.; Song, X.; Chang, S.X.; Peng, C.; Xiao, W.; Zhang, J.; Xiang, W.; Li, Y.; Wang, W. Nitrogen Depositions Increase Soil Respiration and Decrease Temperature Sensitivity in a Moso Bamboo Forest. Agricultural and Forest Meteorology 2019, 268, 48–54. [Google Scholar] [CrossRef]
- Huang, K.; Li, Y.; Hu, J.; Tang, C.; Zhang, S.; Fu, S.; Jiang, P.; Ge, T.; Luo, Y.; Song, X.; et al. Rates of Soil Respiration Components in Response to Inorganic and Organic Fertilizers in an Intensively-Managed Moso Bamboo Forest. Geoderma 2021, 403, 115212. [Google Scholar] [CrossRef]
Figure 1.
Schematic illustration of the study site and experimental design. (a) Map of the Japanese archipelago showing the location of Kasuya Research Forest (SRF) study site, marked with a red square; (b, c) photograph of Japanese cedar plantation site (CF) and Moso bamboo forest site (BF).In panel a, contour intervals are 10 m and obtained from the Geospatial Information Authority of Japan; circles represent selected sampling points for soil solution collection, and different colors represent forest types, including CF and BF.
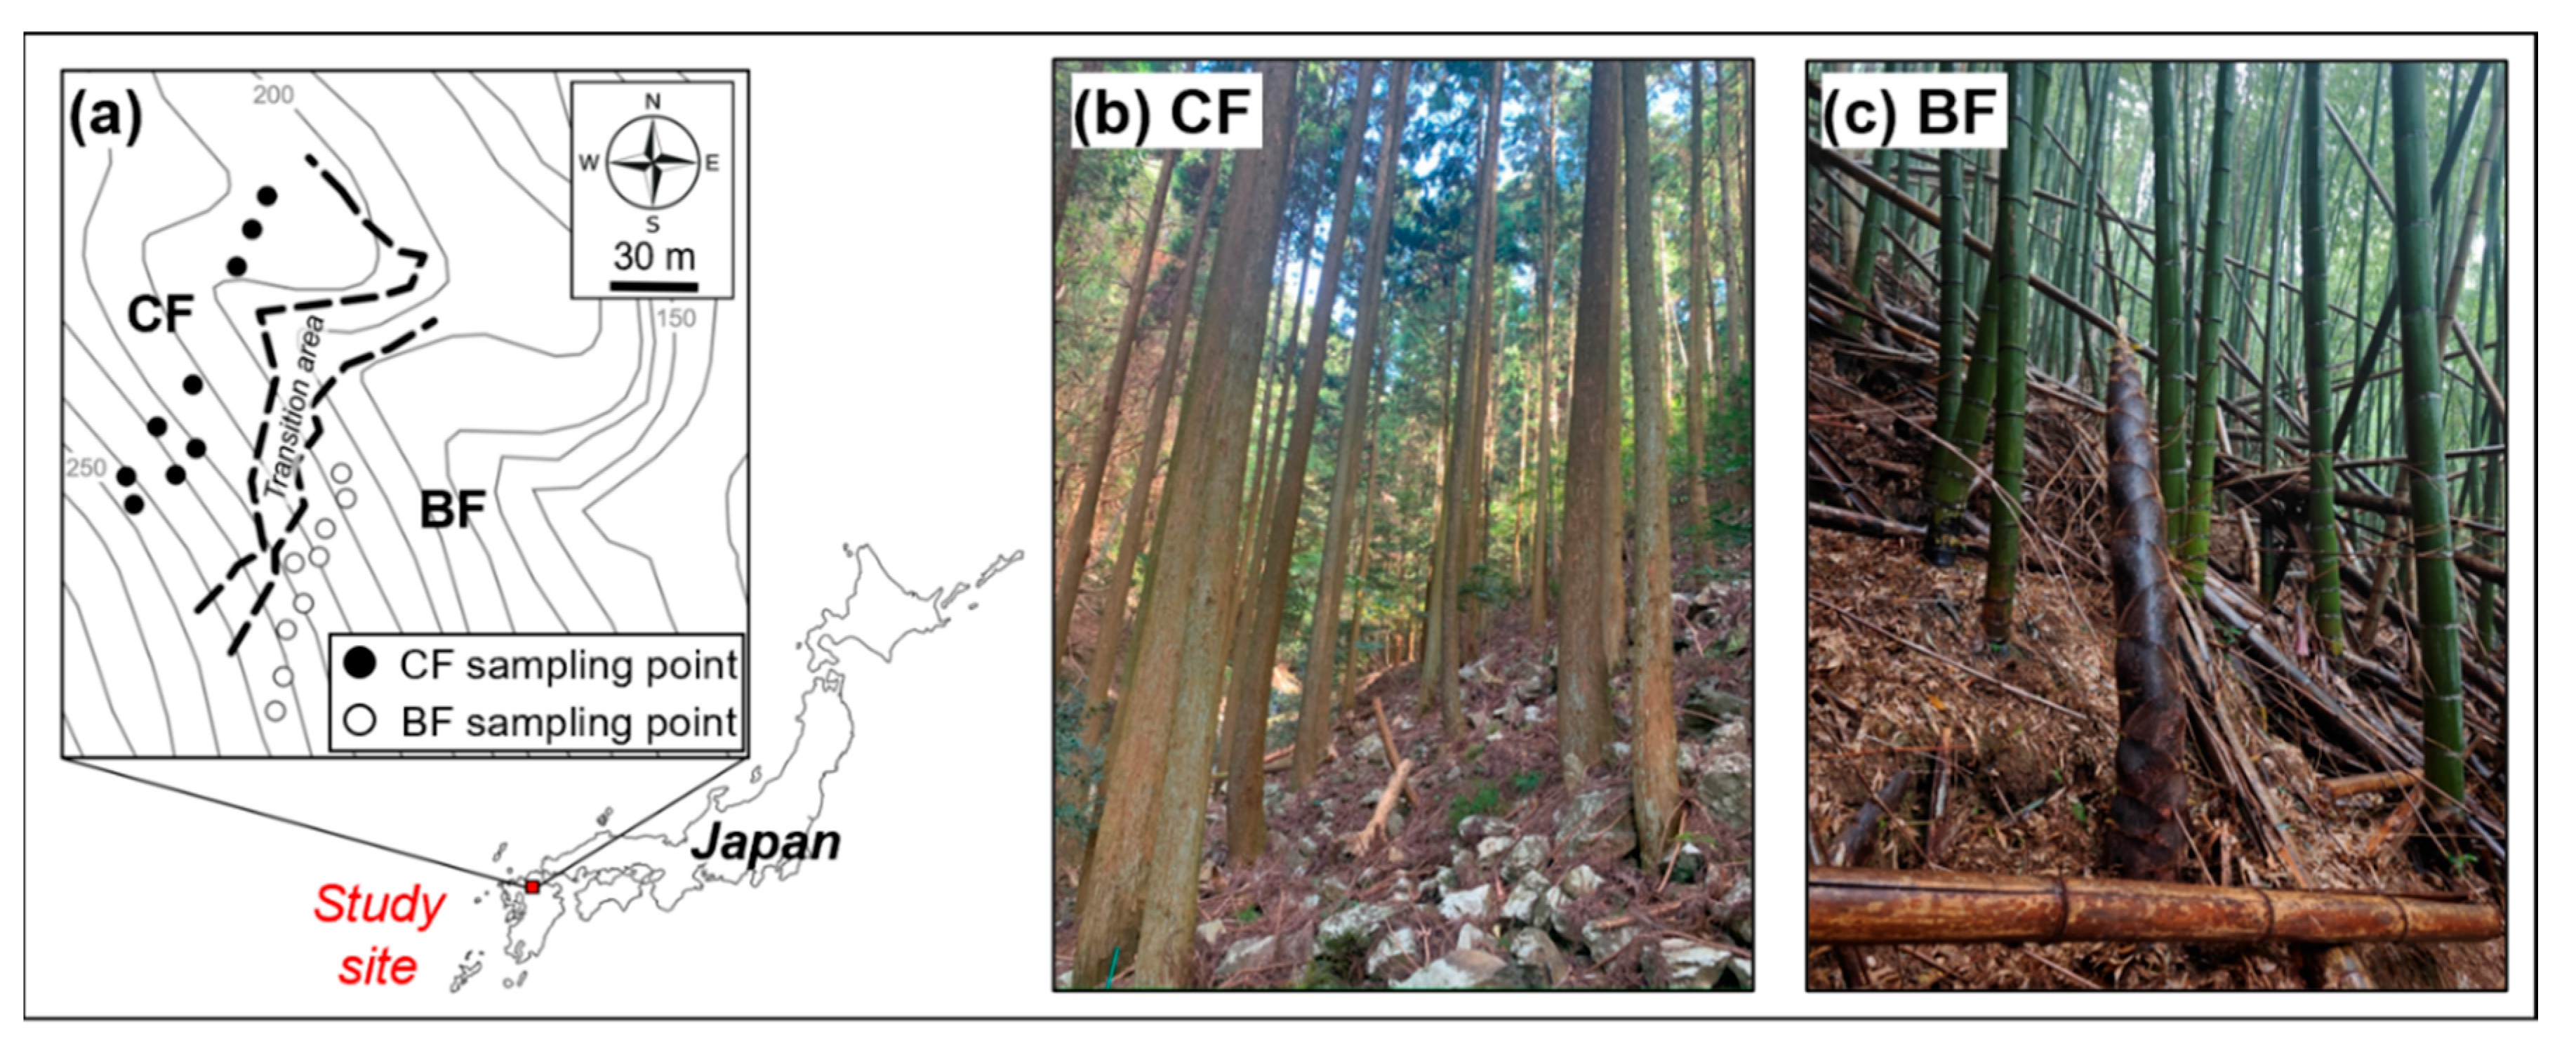
Figure 2.
Mean concentrations (μmol L-1) of major cations and anions in Moso bamboo forest (BF) and adjacent Japanese cedar plantation (CF). The left panel presents results for surface soil solution, and the right panel for soil leachate. Vertical error bars represent standard error. Red asterisks over the same element indicate significant differences between BF and CF at the 0.05 level. Statistical differences were based on Tukey-adjusted post-hoc pairwise comparisons (BF versus. CF, conducted within each soil depth) following a Linear Mixed-Effects Model (LMMs) analysis. In the LMMs, forest type (i.e., BF and CF) and soil depth (i.e., surface soil solution and soil leachate) were treated as fixed effects, and sampling date (n = 11) and sampling points (n = 9) were included as random effects.
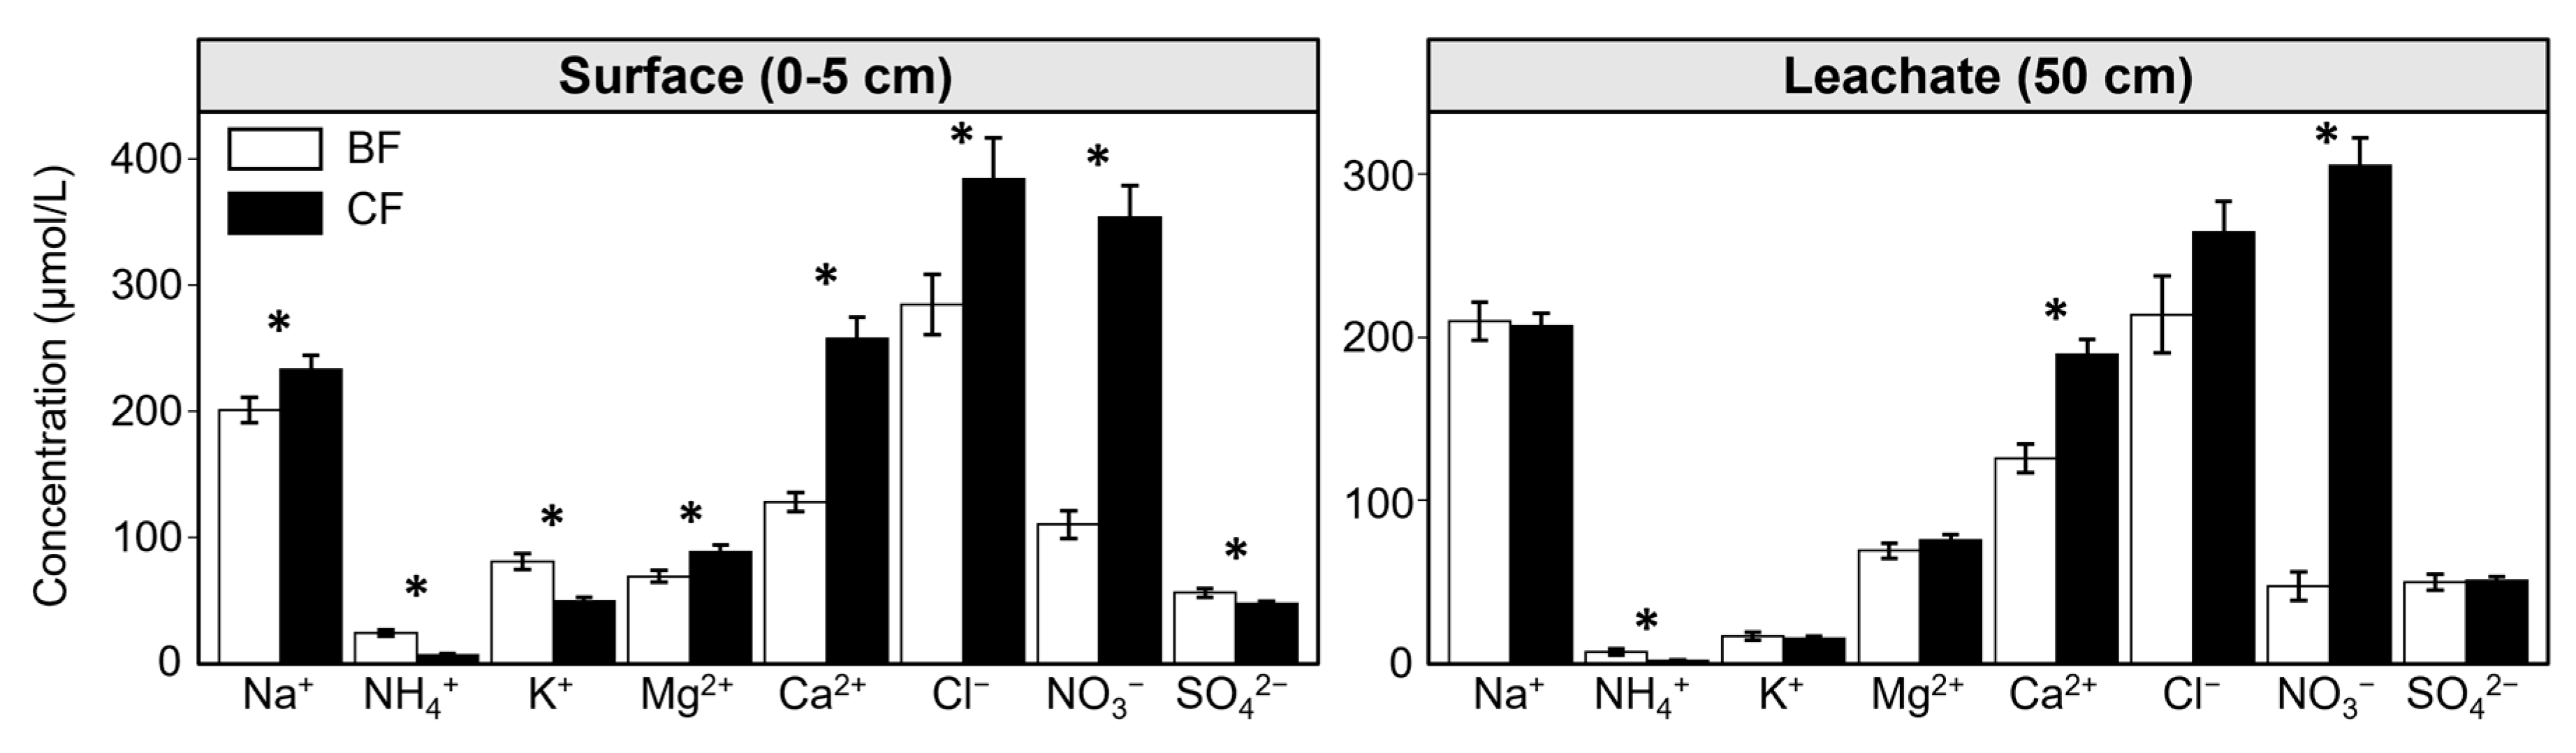
Figure 3.
Correlation relationships between NO₃⁻ concentrations and (a) Ca²⁺ and (b) Mg²⁺ concentrations. BF and CF represent different forest types (i.e., Moso bamboo forest and Japanese cedar forest). Surface and Leachate represent different sampling depths of soil solution (i.e., surface soil solution and soil leachate). R² values and p values correspond to the results of Pearson correlation analysis. The formula represents the linear regression equation. A black solid line indicates the linear regression trend line when the relationship is statistically significant (p < 0.05).
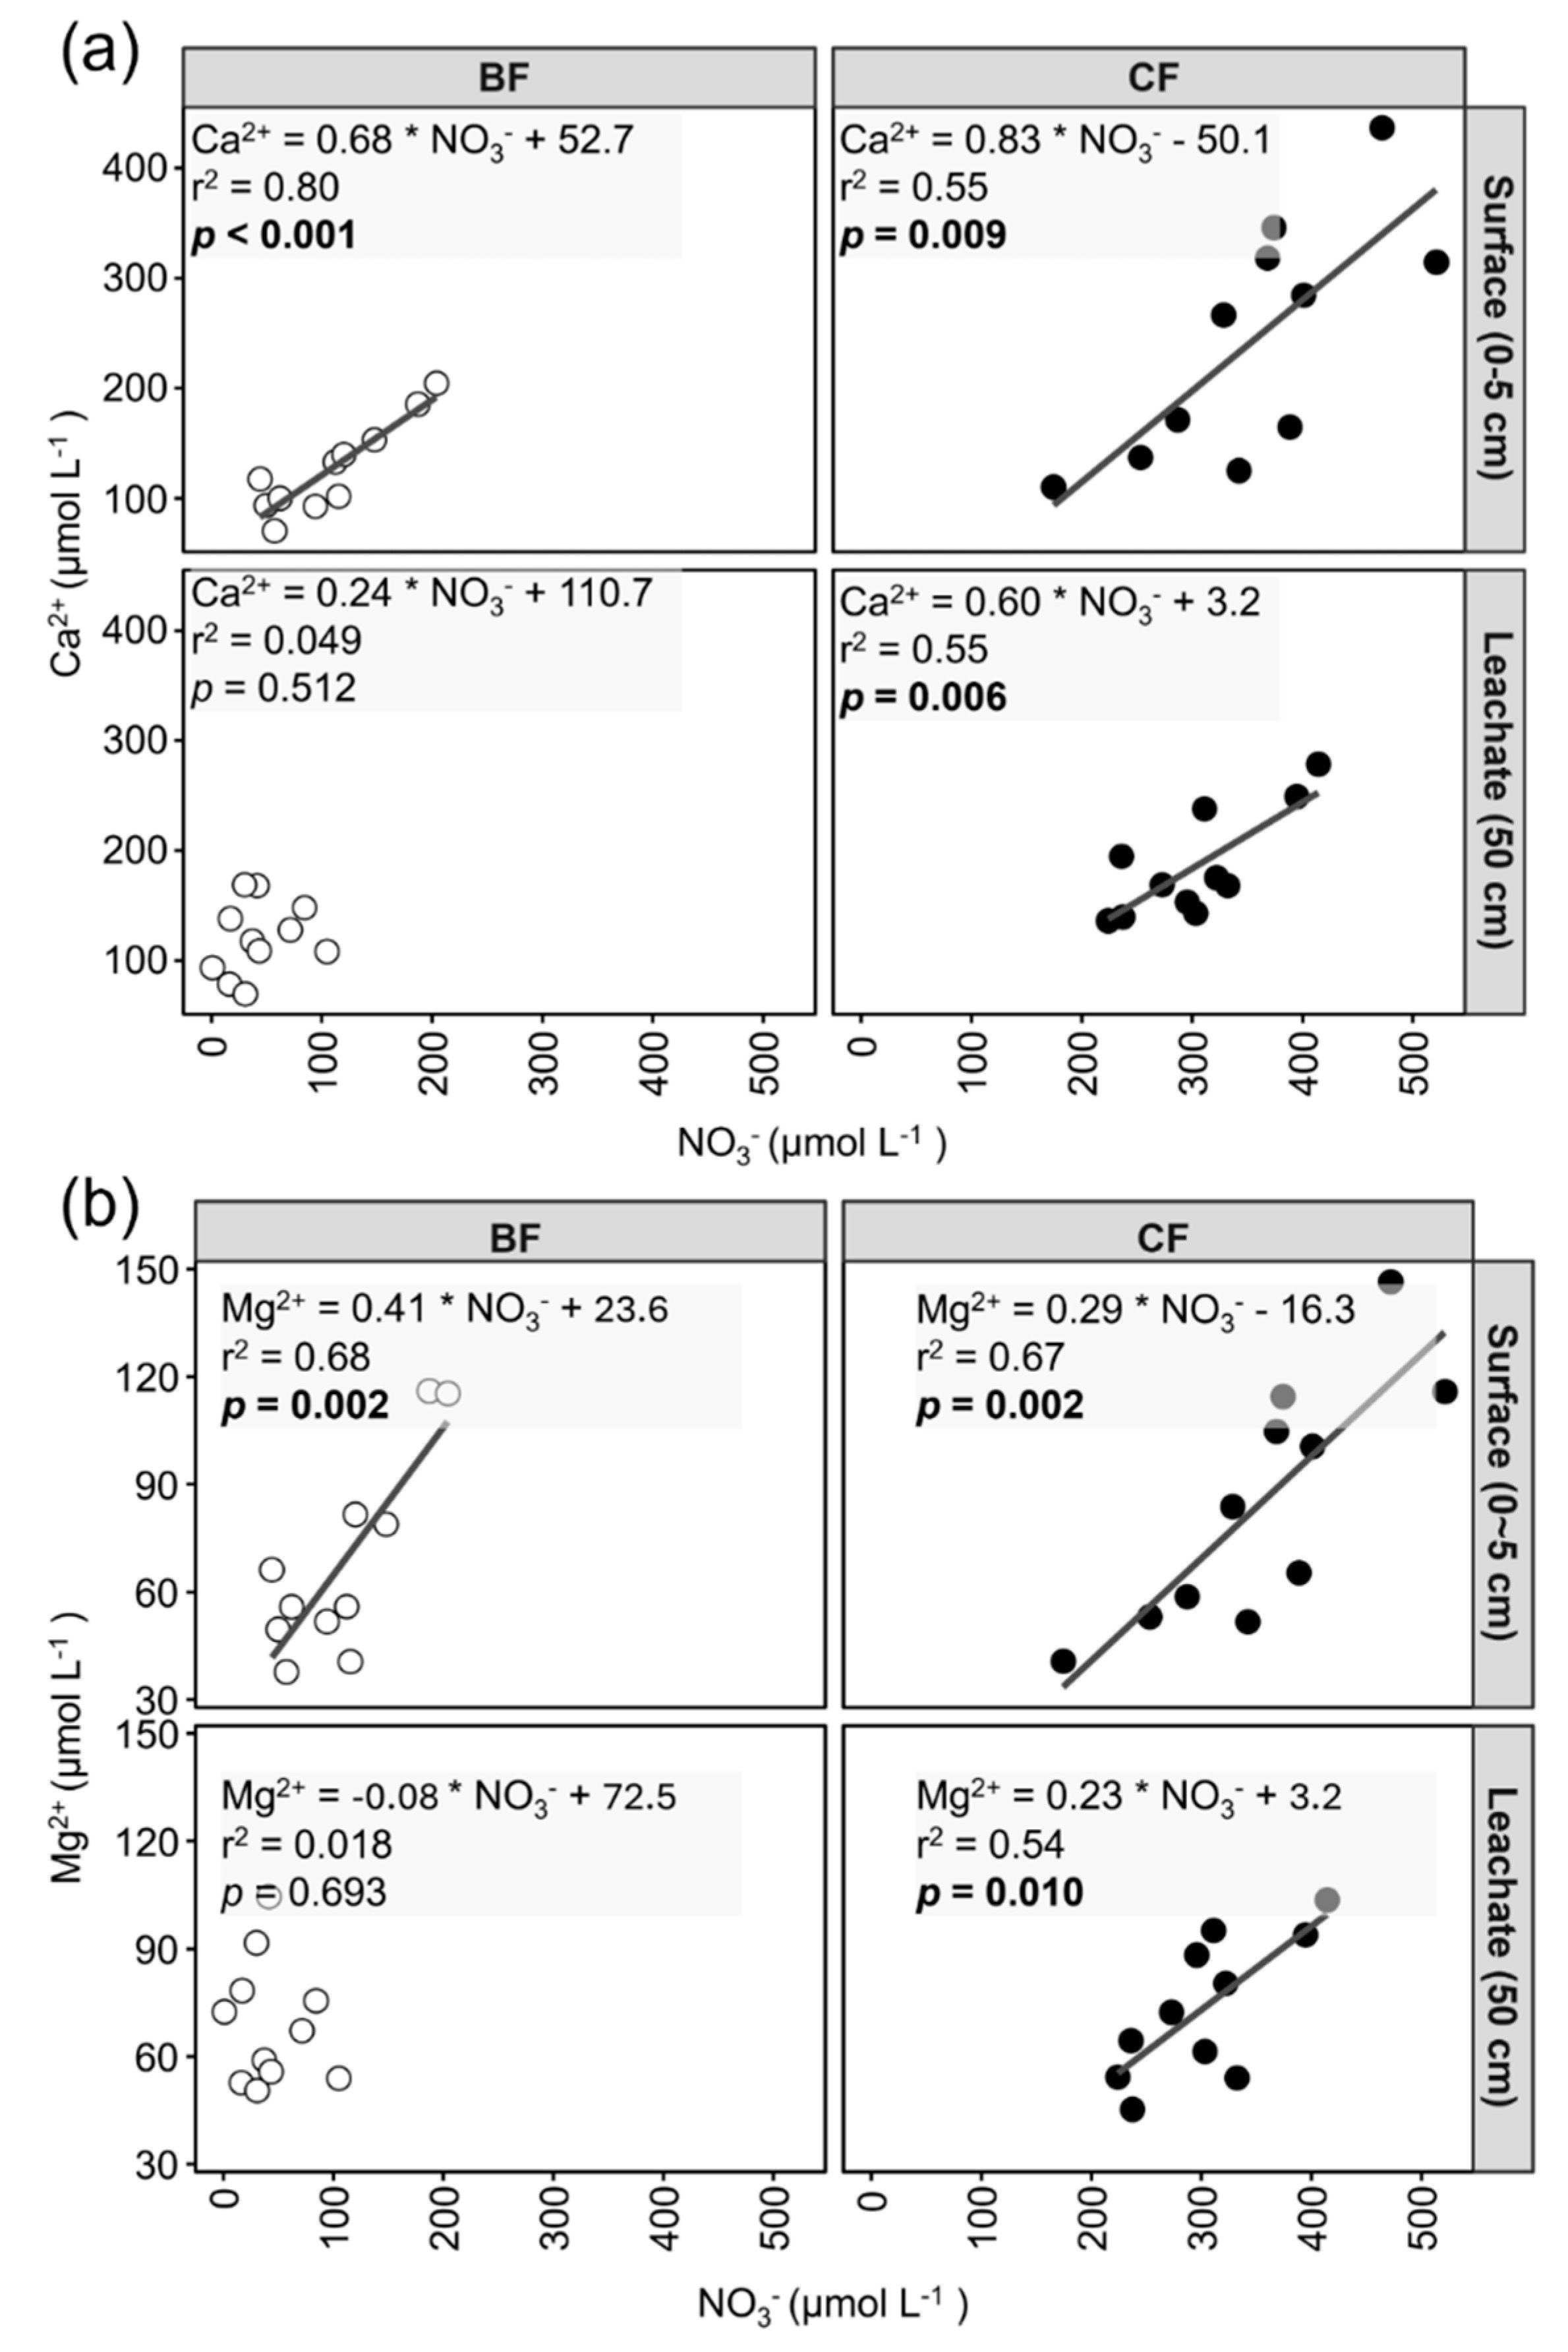
Figure 4.
Correlation relationships between anion deficit (AD) and (a) Ca²⁺ and (b) Mg²⁺ concentrations. BF and CF represent different forest types (i.e., Moso bamboo forest and Japanese cedar forest). Surface and Leachate represent different sampling depths of soil solution (i.e., surface soil solution and soil leachate). R² values and p values correspond to the results of Pearson correlation analysis. The formula represents the linear regression equation. A black solid line indicates the linear regression trend line when the relationship is statistically significant (p < 0.05).
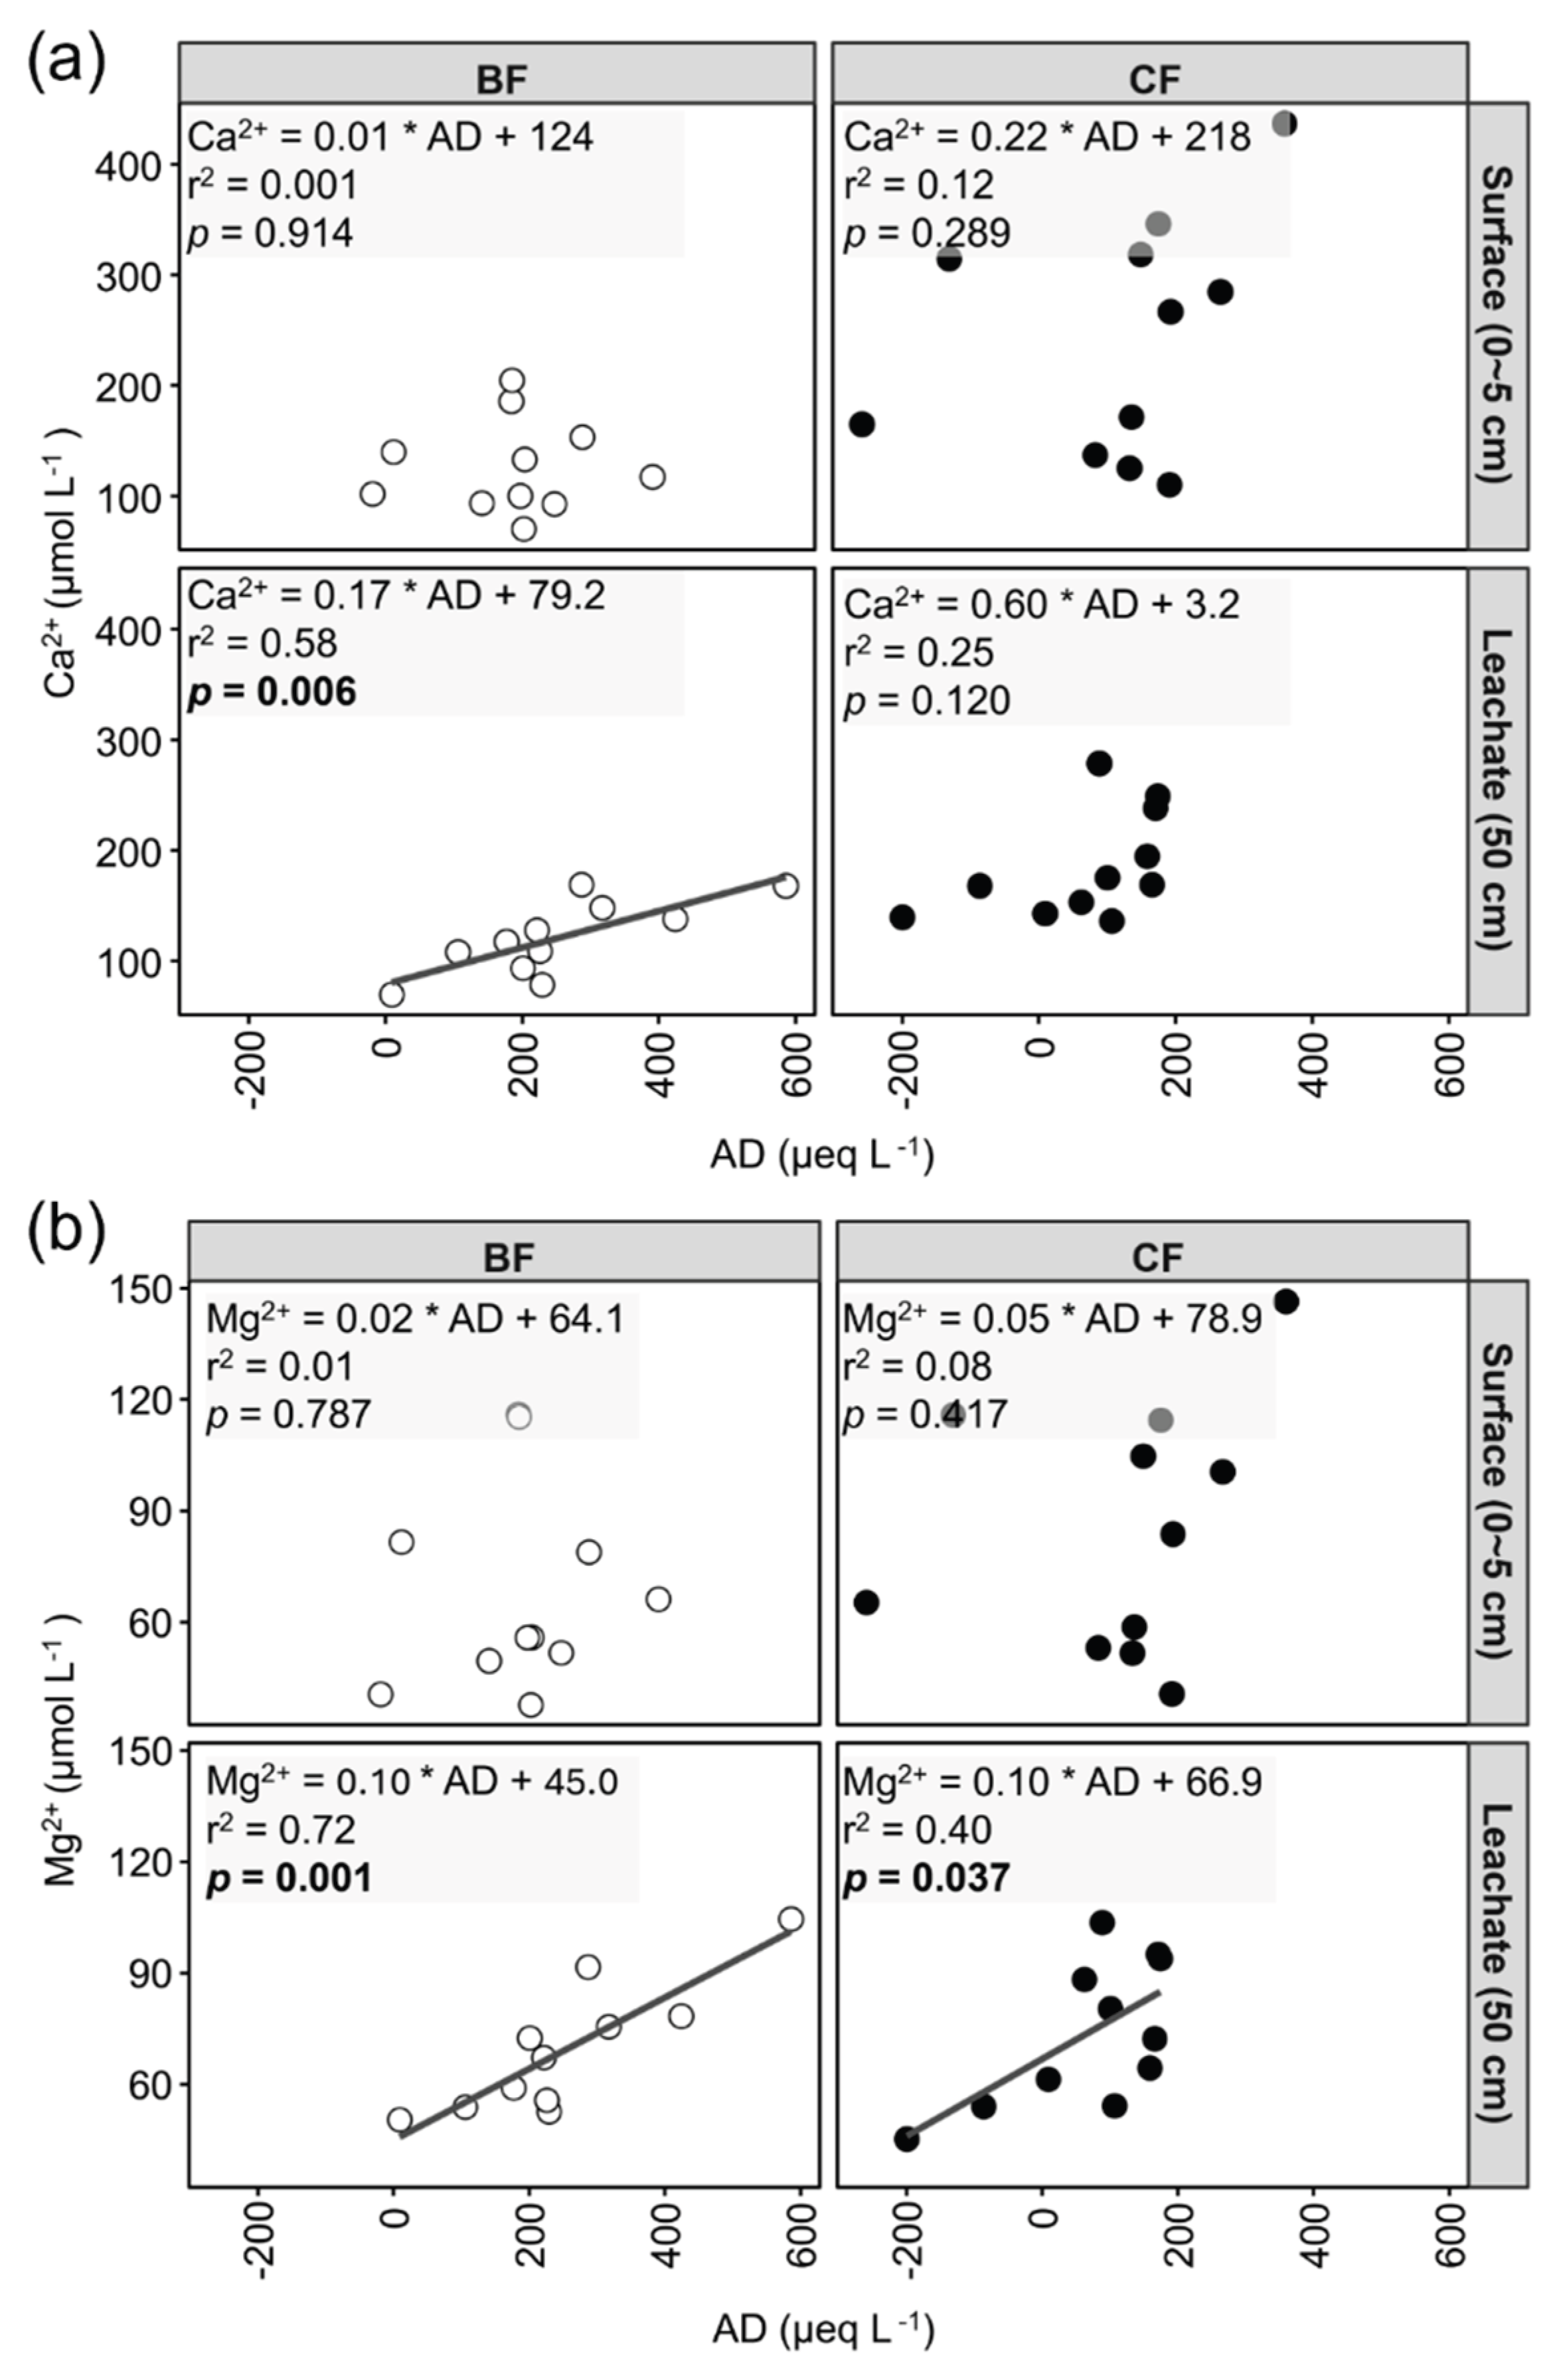

Table 1.
Stand characteristics and pH of mineral soil and soil solution in Moso bamboo forest (BF) and Japanese cedar plantation (CF). Data of stem density, stem diameter, plant height, and soil pH were obtained from Shimono et al. (2022).
Table 1.
Stand characteristics and pH of mineral soil and soil solution in Moso bamboo forest (BF) and Japanese cedar plantation (CF). Data of stem density, stem diameter, plant height, and soil pH were obtained from Shimono et al. (2022).
| BF | CF | |
| Stem density (No. ha-1) | 6900 | 1020 |
| Stem diameter (cm) | 8.6 | 34.1 |
| Plant height (m) (m) |
10.9 | 23.6 |
| Soil pH (H2O) | 5.33 | 5.47 |
| Soil solution pH (5 cm depth) | 6.08 | 6.32 |
| Soil solution pH (50 cm depth ) | 7.05 | 6.82 |
Table 2.
Mean concentrations (μmol L-1) of major cations and anions in soil solutions with different depths (Surface soil solution, 5-cm; Soil leachate, 50-cm) in Moso bamboo forest (BF) and in Japanese cedar plantation (CF). Bold p values represent significant differences between different depths at the 0.05 level. Statistical differences were based on Tukey-adjusted post-hoc pairwise comparisons (Surface versus. Leachate, conducted within each forest type) following a Linear Mixed-Effects Model (LMMs) analysis. In the LMMs, forest type (i.e., BF and CF) and soil depth (i.e., surface soil solution and soil leachate) were treated as fixed effects, and sampling date (n = 11) and sampling points (n = 9) were included as random effects.
| Surface | Leachate | p | |
| BF | |||
| Na+ | 200.9 | 210.1 | 0.336 |
| NH4+ | 24.5 | 7.0 | <0.001 |
| K+ | 80.6 | 16.7 | <0.001 |
| Ca2+ | 128.1 | 126.0 | 0.773 |
| Mg2+ | 69.1 | 69.2 | 0.706 |
| Cl- | 284.7 | 214.1 | 0.186 |
| NO3- | 110.3 | 47.5 | 0.030 |
| SO42- | 56.2 | 50.1 | 0.259 |
| CF | |||
| Na+ | 233.2 | 207.4 | 0.044 |
| NH4+ | 6.8 | 1.7 | 0.008 |
| K+ | 50.0 | 15.4 | <0.001 |
| Ca2+ | 257.6 | 189.8 | <0.001 |
| Mg2+ | 88.7 | 75.7 | 0.045 |
| Cl- | 383.9 | 264.4 | <0.001 |
| NO3- | 354.1 | 305.6 | 0.036 |
| SO42- | 47.5 | 50.9 | 0.394 |
Disclaimer/Publisher’s Note: The statements, opinions and data contained in all publications are solely those of the individual author(s) and contributor(s) and not of MDPI and/or the editor(s). MDPI and/or the editor(s) disclaim responsibility for any injury to people or property resulting from any ideas, methods, instructions or products referred to in the content. |
© 2025 by the authors. Licensee MDPI, Basel, Switzerland. This article is an open access article distributed under the terms and conditions of the Creative Commons Attribution (CC BY) license (http://creativecommons.org/licenses/by/4.0/).
Copyright: This open access article is published under a Creative Commons CC BY 4.0 license, which permit the free download, distribution, and reuse, provided that the author and preprint are cited in any reuse.


