
Submitted:
29 July 2025
Posted:
08 August 2025
You are already at the latest version
Abstract
Mineral dust plays a vital role in the Earth’s climate system, influencing radiation, cloud formation, biogeochemical cycles, and air quality. Accurately simulating dust transport in atmospheric models remains challenging, particularly for coarse and super-coarse parti-cles, which are often underrepresented due to limitations in model physics and numerical treatment. Observations have shown that particles larger than 20 μm can remain airborne longer than expected, suggesting that standard gravitational settling formulations may be insufficient. One potential contributor to this discrepancy is the numerical diffusion introduced by advection schemes used to model sedimentation processes. In this study, we compare the commonly used first-order upwind advection scheme, which is highly diffusive, to a third-order scheme (UNO3) that reduces numerical diffusion while maintaining computational efficiency. Using 2-D sensitivity tests, we show that UNO3 retains up to 50% more dust mass for the coarsest particles compared to the default scheme, although overall dust lifetime shows little change. In 3-D simulations of the ASKOS 2022 dust campaign, both schemes reproduced similar large-scale dust patterns, with UNO3 yielding slightly lower dust loads near sources and slightly higher loads over the Caribbean. Overall, domain-averaged dust load differences remain small (less than 2%), with minor decreases in fine dust and slight increases in coarse dust, indicating that reducing numerical diffusion modestly enhances long-range transport of larger particles. Near the surface, UNO3 leads to small decreases in fine particle concentrations and modest increases for coarse particles, with local differences up to 50 μg/m³. These results highlight that while numerical diffusion does affect dust transport—especially for super-coarse fractions—its impact is relatively small compared to the larger underestimation of super-coarse dust commonly observed in models compared to measurements. Addressing the fundamental physics of super-coarse dust emission and lofting may therefore be a higher priority for improving dust model fidelity than further refining advection numerics. Future studies may also consider implementing more computationally intensive schemes, such as the Prather scheme, to further minimise numerical diffusion where highly accurate size-resolved transport is critical.
Keywords:
dust transport
; dust settling
; numerical diffusion
; WRF-Chem
1. Introduction
Mineral dust primarily originates from dry soils with low vegetation. It belongs to the major natural contributors to the global atmospheric aerosol burden, and it plays a pivotal role in the Earth's atmosphere. Dust mass burden is estimated at around 22-20 Tg [1] affecting human health, transportation and various atmospheric processes such as weather patterns [2,3,4], solar radiation levels [5], biochemistry [6,7] and overall climate forcing [8,9]. On the one hand, mineral dust can both absorb and scatter radiation [3,10,11], leading to alternating effects of warming and cooling on the planet [8]. On the other hand, dust alternates cloud properties acting as nucleate for cloud and ice formation [12,13,14].
The atmospheric interactions of dust are sensitive to the total dust mass burden along with the particle size distribution (PSD) of dust. The dust particles can be divided into separate modes regarding the size of their volume equivalent diameter (D): fine dust particles with D < 2.5μm , coarse particles with 2.5 < D <= 10μm, super-coarse particles with 10μm<D≤62.5μm and giant dust particles with D>62.5μm [15]. In the SW, super coarse and giant dust particles with diameters above 10μm tend to have a warming effect, while finer particles tend to have an increasing cooling effect as the size diminishes. In the context of long-wave interactions, dust particles have a cooling effect which strongly depends on size, with coarse particles tending to cool the atmosphere more.[15]
The size of dust particles influences the cloud characteristics, their abundance and their spatial distribution, thereby shaping global precipitation patterns and climate conditions [16,17]. Although less abundant in the atmosphere, coarser dust is more hygroscopic than finer particles [18] and can act more effectively as cloud condensation nuclei (CCN) [18] and ice nuclei (IN) [19]. Moreover, when larger dust particles are activated as CCN, they produce larger cloud droplets. In turn, larger cloud droplets can accelerate the collision coalescence process and initiate rain faster, also affecting cloud lifetime[20,21].
Last but not least, larger dust particles increase the overall dust mass, which influences the extent to which dust affects the oceanic carbon cycle, as well as ocean and tropical rainforest ecosystems [22,23,24].
During the last decade, observations have shown that super-coarse and giant dust particles are transported over significant distances within the Saharan Air Layer (SAL) [24,25,26,27,28]. However, atmospheric dust models, a fundamental tool for studying dust interactions, either ignore particles with diameters larger than 20 μm or struggle to realistically represent their contribution to the atmospheric dust load [29,30,31]. Dust PSDs measurements, during FENNEC and AER-D campaigns, showed a significant proportion of coarse and giant mode particles, both above the Sahara sources and within the Saharan Air Layer (SAL) [27]. By ignoring the particles with diameters greater than 20 μm, mass concentration is underestimated by up to 60 %, and scattering calculations showed that both shortwave and longwave extinction are underestimated by up to 18 % and 26 %, respectively [27].
The retention of mineral dust coarse and giant modes in the atmosphere exceeds initial expectations based solely on gravitational sedimentation [24,25,30]. In [30] authors developed the WRF-L model, a modified version of the WRF-Chem v4.2.1 [32,33] model that extends the dust PSD up to 100μm. By deploying the WRF-L model for the case of the AER-D campaign, they found that if there is a missing physical mechanism opposing gravity then a reduction of 60-80% in the gravitational settling velocity is needed.
Many studies have demonstrated that dust models remove too fast the coarser dust particles. The reasons behind this deficiency have not been clarified yet. Many physical mechanisms have been proposed that potentially counteract gravity. Among them are the numerical challenges that are plagued with the numerical modelling of constituent transport [34], like dust aerosol. In the realm of numerical advection modelling, the most significant goal, after ensuring stability, is to make algorithms as accurate as possible. This means that the results they produce should be very close to the actual solution of the advection equation. Yet, the presence of numerical errors can compromise the accuracy of advection algorithms. In many cases, efforts to eliminate one type of error, like diffusion can amplify other errors like dispersion, thereby rendering the achievement of a perfect advection scheme impractical in reality [34]. Uncertainty in modelling mineral dust transport stems not only from parameterisations of emission and deposition processes but also from the choice of numerical advection scheme. In a sensitivity study using the CHIMERE-DUST model, [35] demonstrated that different horizontal transport schemes—such as UPWIND, Van Leer, and PPM—can lead to substantial variations in modeled dust concentration fields. Lower-order schemes tended to produce more spatially diffuse dust plumes with reduced peak concentrations compared to higher-order methods like PPM, though the differences in total dust load were limited to about 1–2.5%. An earlier study by [36] evaluated the influence of advection schemes on dust settling by replacing the UPWIND scheme with the less diffusive Prather scheme in the standalone GOCART model. The results indicated a doubling of the modeled dust load with the Prather scheme, highlighting the potential of less diffusive methods to better represent dust transport, particularly for super-coarse particles. The Prather scheme assumes a sub-grid polynomial distribution and conserves the second moments of tracer concentration, thereby addressing the limitations of uniform concentration assumptions within grid cells. Despite its advantages, its implementation is memory-intensive and poses challenges in models using operator splitting, such as WRF-Chem [37].
Another advective scheme, which, from its implementation on 1-D and 2-D idealised tests, presents low self-constrained numerical diffusion, is the 3rd order Upstream Upstream non-oscillatory (UNO3) advection scheme [38]. UNO3 has been derived by optimising existing classical advection schemes and combining them in different monotonic zones to avoid flux limiters for simplicity. It is also extended to irregular grids in the form of upstream mid-flux linear interpolation with symmetrical gradients and is adapted to multidimensions with an advective–conservative operator. UNO3 is given in finite-volume flux form and thus is consistent and conservative.
In this study, we conduct both 2-D idealised experiments and 3-D real-case simulations to assess the performance of the new scheme in representing dust particle transport. Our analysis focuses on evaluating changes in simulated dust load, surface dust concentrations, and the vertical structure of dust distributions, with special attention to how these metrics are affected for the larger particle size classes. Our results highlight the modelling aspects of dust transport by using a computationally efficient and less diffusive scheme for the advection of gravitational settling losses.
The paper is organised as follows. Section 2 provides a description of the implemented advective schemes and an overview of the applied methodology to realise the objectives of the study. Section 3 provides an analysis of the differences in the simulated dust distribution using the different numerical schemes. Section 4 provides a discussion of the results, and Section 5 provides a summary of the study along with the main concluding remarks.
2. Materials and Methods
2.1. Transport of Mineral Dust in WRF-L
The continuity equations that govern mineral dust aerosols account for various external factors influencing their behavior. Mineral dust particles are introduced into the atmosphere through emission processes, while their removal occurs primarily through sedimentation, and dry deposition onto water, soil, and other surfaces. Additionally, model equations often incorporate supplementary mechanisms such as particle washout, cloud and ice nucleation, and droplet evaporation which serve as additional sources or sinks in the model.
Where the first left-side term is the local time derivative of mineral dust concentration C, the second left-side term is the change due to transport, the first right-side term are changes in mineral dust concentration due to turbulent diffusion, with the Eddy diffusivity, and is the time rate of change of the mineral dust concentration due to the th external sinks and sources (emission and sedimentation in this study).
The concentration C can be related to the tracer mixing ratio τ and the density of atmospheric air by Eq.(2):
Sedimentation occurs when particles fall through the atmosphere due to their mass (gravitational settling). The losses due to gravitational settling in WRF-L (and WRF-Chem in general) are calculated as the vertical advection of the mineral dust concentration due to the settling velocity, assuming that all particles within each transport size bin in a model grid cell share the same settling velocity. The corresponding equation in flux form is given below:
Where is the settling velocity vector of the particles, calculated for the effective diameter of each model transport size bin, as described in [30].
By expressing Eq. (3) in terms of the mixing ratio τ, we obtain:
In the WRF-L (WRF-Chem) ARAKAWA-C grid (Figure 1a, b), the mineral dust mixing ratio is computed at the mass grid points indicated by In the WRF-L (WRF-Chem) ARAKAWA-C grid (Figure 1a, b), the mineral dust mixing ratio is computed at the mass grid points indicated by points in Figure 1a, b and the orange lines in Figure 1c. Therefore, we can derive an equation using the discretization scheme of the interpolation approach to represent Eq. 1 as follows:
Or
Here, and represent the mixing ratio of mineral dust and the atmospheric air density at the center of grid point and at time and , respectively. is the vector of settling velocity of the particle. The () terms are evaluated at the grid cell faces between and ( and ) cell faces. The grid cell width at grid point and time is denoted as , and represents the time step. Since the vertical coordinates of the WRF model are hybrid-pressure levels , there is a temporal and spatial dependency on the value.
2.1.1. The Default 1st Order UPWIND Advective Scheme of WRF-L
The determination of the term (and ) can be accomplished using the following straightforward approach:
The above approach, with the additional assumption that , leads to the following equations, which describe the default advective scheme of WRF-L (based on WRF-Chem v4.2.1) for the calculation of the changes in dust mixing ratio due to gravitational settling:
2.1.2. The Upstream Non-Oscillating Scheme III (UNO3) in WRF-L Context
The UNO3 scheme has been developed based on a combination of already existing interpolation numerical schemes to cure the problem of numerical oscillations, which attributed to the evaluation of the term in Eq.11. The cell notation in UNO3 follows that initially proposed by [39] and is presented here in Figure 2.
Written in terms of concentration, the trace concentration in level l at integration time t is given by Eq.11:
The cell coordinate represents the cell center, with a positive cell width Δ that may vary for non-uniform grids. Consequently, a cell face is positioned at half the cell width from its respective cell center. Because of the sigma pressure vertical coordinates in WRF model grid, a modification is needed in the definition of the grid cell width Δ in the WRF model grid to align with the midpoint between the two bounding cells:
Other than the above modification, the implementation of UNO3 has been done as described in Li (2008), with the settling velocities to be evaluated in the cell center (model “mass” grid) and the cell face velocities are interpolated from the settling velocity of the neighbouring cell centers, weighting their relative distance from the cell face according to Eq. 13 and Eq.14. We should note that in our implementation, we assume that refers to the bottom model level, thus settling velocity is negative .
To set the boundary conditions, we add extra levels outside the bottom and top boundaries (ghost levels) with the same cell width and the same settling velocity as the first (bottom) and the last (top) model grid level, respectively. We assume that zero tracer concentration comes from the top and a zero-gradient boundary condition at the bottom. To implement this, the tracer concentration at the top ghost levels is set to zero and the tracer concentration of the bottom ghost cells equal to the concentration of the first model level.
2.2. Model Experimental Set-Up
In this work, we use the WRF-L [30] model in both 2-D and 3-D configurations. In the 2-D configuration the model simulates the transport and the deposition of the dust particles, while in the 3-D configuration the model simulates additionally the emission of dust based on the GOCART-AFWA modified scheme [30].
Before we apply the new UNO3 scheme in real 3-D dust transport cases, we performed a set of 2-D idealized dust transport simulations to test the performance of the new advective scheme and provide a benchmark for its comparison with the default upwind scheme in WRF-L. Following the implementation of both schemes into WRF-L, we apply the model for simulations covering the period ASKOS 2022 experimental campaign.
2.2.1. WRF-L/2D Benchmark Sensitivity Tests
To test the performance of the code, we performed 2-D idealized simulations with WRF-L coupled with the dust mode component. A list of the 2-D sensitivity tests is presented in Table 1.
The model domain consists of 91 grid points with 50 km horizontal spacing. We performed several sensitivity tests by varying the number of the vertical levels (30, 60, 120 and 240) to examine the sensitivity of the vertical spatial resolution on the dust transport. In the simulation, we reproduce the transport of a dust plume that travels approximately at 4-6 km altitudes from Cabo Verde Island towards Barbados. The dust plume is initialized in 2, 4, 8, or 15 vertical layers in the model with a total mass mixing ratio normalized to 1000 μg/kg of dry air. The vertical resolution is approximately 1 km for the configuration with 30 vertical layers, and 500 m, 250 m and 125 m for the configurations with 60, 120 and 240 levels, respectively. When applying both numerical schemes (UPWIND and UNO3) a constant timestep is applied. A more detailed description of the simulation setup is given in Table 2.
To initialise the meteorological conditions in the model, we used a radiosonde of Tenerife from the database of the University of Wyoming (Figure 2) with a modified wind profile. The wind profile has been replaced with the zonal wind speed profile, calculated based on the average wind speed and direction, of the area of Cabo Verde provided by the Final Analysis (FNL) Operational Global Analysis data, at 1°×1° grid and for the years 2014-2018. Simplified physics are used within the model and the dust scheme linked to the dust simulation is that of WRF-L.
For the time integration, the RK3 scheme is activated. A fifth-order advection scheme is used for the horizontal advection of momentum and scalars, whereas a 3rd order scheme is utilized for the vertical advection [33]. Monotonic filters are applied to sustain monotonicity in the advection of turbulent kinetic energy, moisture, scalars and chemical variables (e.g mineral dust). Open lateral boundaries are assumed and an implicit Rayleigh damping for the vertical velocity [33].
2.2.2. WRF-L/3D: Real Cases
Using the WRF-L code in a 3-D configuration, we first ran the CONTROL experiment using the default UPWIND scheme for the gravitational settling of dust followed by identical experiments using the UNO3 scheme as described in Sect. 2.1.2. Our simulation period coincides with the ASKOS campaign of 2022.
After we performed the control set of simulations activating the UPWIND scheme (UPWIND_ASKOS experiment), we performed an additional set of simulations applying the UNO3 scheme for the calculation of gravitational losses of dust (UNO3_ASKOS). The two sets of runs differ only in the application of the advective scheme for sedimentation. We follow the same model configuration as in Drakaki et al., (2022), regarding the selected physics and dynamics in the model and the simulation cycle structure. Moreover, we use the fifth generation ECMWF (ERA5) reanalysis data to set the initial and boundary conditions every 6 hours, in a spatial grid resolution of 0.25×0.25o. The domain is an equal-distance grid with a spatial grid spacing of 15 km × 15 km consisting of 620 × 320 points, and 33 vertical sigma pressure levels (automatically defined) of up to 50 hPa. Approximate heights of the levels are provided in Table 3. As in 2-D simulations, when applying both numerical schemes (UPWIND and UNO3) we keep a constant timestep.
The simulation comprises nine 84-hour forecast runs, with each run initialized at 12:00 UTC. The first cycle is a cold start for dust field, while in the next cycles the dust field is initialized based on the previous cycle. The 30-second Global Multi-resolution Terrain Elevation Data 2010 (GMTED2010, Danielson and Gesch, 2011) are used to represent model topography while land use is determined using modified Moderate-resolution Imaging Spectroradiometer (MODIS) observational data from the University of Boston (Gilliam and Pleim, 2010). The initial 12 hours of each 84-hour cycle serve as a model spinup and are neglected. Similarly, the first week of the simulation is designated as a spinup period to accumulate background dust loading and is therefore omitted from the analysis. The simulation runs are performed in dust-only mode, neglecting aerosol-radiation interactions. Dust source strength is scaled by tuning the empirical proportionality constant in the horizontal saltation flux equation [40] to obtain the best match between the modelled DOD and the AERONET AOD (RMSE = 0.44, bias = 0.05) acquired at eight desert stations: Banizoumbou (13.54693 oN, 2.66519 oW), Izana (28.30932 oN, 16.49906oE), IER_Cinzana (13.278433 oN, 5.933867 oE), Saada (31.62583 oN, 8.15583 oE), Tamanrasset_INM (22.79 oN, 5.53 oW), Ben_Salem (35.55055 oN, 9.914003 oW), Medenine-IRA (33.499633 oN, 10.642547 oE), Dakar_Belair (14.7017 oN, 17.4256 oE). Only AERONET records with AOD > 0.2 (Version 3.0, Level 1.5, Giles et al., 2019; Sinyuk et al., 2020) and Angström exponent < 0.75 are used in the comparison, targeting dust-dominated conditions. The tuning constant is equal to 1.6 and is applied throughout the model domain and the simulation period.
The simulation area for all experiments encompasses the major Saharan desert, also including the downwind areas in the eastern tropical Atlantic. The complete configuration options for the runs (UPWIND_ASKOS, UNO3_ASKOS) are listed in Table 4.
The series of the above sensitivity runs has been performed, aiming to resemble possible numerical errors that are responsible for the differences between the simulated dust field and the observed in terms of their spatial and vertical distribution. The comparison between the CONTROL and UNO3 runs is expected to reveal the effect of the numerical diffusion on the transport of dust particles, with a particular focus on the behavior of super coarse and giant dust particles. Finally, the full list of the 3-D performed experiments is given in Table 5.
# of vertical levels
3. Results
3.1. Benchmark 2-D WRF-L Dust Simulations
To evaluate the influence of numerical formulation on dust sedimentation, we conducted a series of idealized simulations with varying vertical resolutions and advection schemes, as described in Subsection 2.2.1 (Table 1 and Table 2). Figure 3 presents results for simulations using two different numerical schemes—UNO3 and UPWIND—applied to the vertical advection associated with gravitational settling. Simulations were performed with 30, 60, 120, and 240 vertical levels.
The simulations demonstrate that numerical errors do not enable significant long-range transport of coarser particles (bins 4 and 5) to distant locations such as Barbados . Within the simulation time range the full lifecycle is simulated only for bins 4 and 5. The smaller particles, at bins 1, and 3, have lower settling velocities and more time is required to simulate their total lifetime, but the behavior is expected to be the same.
Increasing the vertical resolution (i.e., number of vertical levels) extends the retention time of dust mass in the atmosphere, reflecting increased particle lifetimes. This is attributed to the reduction of numerical diffusion: finer vertical resolution results in sharper gradients in dust concentration, limiting artificial smoothing and facilitating faster deposition at lower altitudes (as illustrated in Figure A1). The dependence of the simulated dust concentration on the number of vertical levels selected in the model configuration is also shown in Figure 3. With increasing number of levels, non-zero dust mass is retained in the model domain for longer period, indicating higher particle lifetime for both schemes. This can be explained by the reduced numerical diffusion associated with the lower vertical resolution (or the higher number of model vertical levels). With less numerical diffusion, the dust concentration peaks of the dust waves are less smoothed out and the wave is narrower. In that case, dust mass reaches lower altitudes and deposits faster, as depicted in Figure 3.
Both schemes converge as the number of model levels increases. The UPWIND scheme converges at 240 levels, while UNO3 converges sooner at 120 levels. As the number of vertical levels increases while keeping a constant timestep, the Courant number also increases. A higher Courant number leads to reduced numerical diffusion, especially in the first-order UPWIND scheme. This also helps explain the retention of higher dust mass in the atmosphere in UPWIND simulations.
While high-order schemes such as UNO3 are designed to provide accurate and non-oscillatory solutions, particularly in the presence of discontinuities, our experiments reveal a counterintuitive behavior: as spatial resolution increases, UNO3 may exhibit faster degradation of mass conservation compared to a first-order UPWIND scheme. This is attributed to the activation of nonlinear limiters in UNO3, which introduce localised smoothing in steep regions to suppress spurious oscillations. As the grid becomes finer, these steep features become more pronounced, triggering stronger limiter action and effectively reducing the total transported quantity over time.
Importantly, in our configuration, both UNO3 and UPWIND are applied exclusively to the vertical advection due to gravitational settling of dust, not to the full three-dimensional transport. Therefore, the observed mass loss originates solely from the numerical treatment of sedimentation. Although UNO3 is theoretically more accurate, the limiter-induced smoothing under grid refinement can outweigh this benefit. In contrast, the UPWIND scheme, despite being more diffusive in nature, maintains better mass conservation under resolution increase due to its linear and conservative formulation, especially in the context of pure vertical sedimentation without particle mass variation.
It should also be noted that the number of vertical levels may influence other components of the WRF model beyond the sedimentation scheme. Coarser vertical resolution can degrade the representation of vertical wind structures, stability profiles, and moist processes, which in turn may indirectly affect dust transport and deposition. While our analysis isolates the numerical effects of the sedimentation scheme, such interactions between vertical resolution and physical parameterisations may further modulate the total dust mass budget.
In Figure 3, we can see the effect of the numerical diffusion in the dust plume concentrations to be positive in high concentration regions and negative during the dissipation phase of the transport of the plume (Figure 3). This effect is expected, since the effect of numerical diffusion in the transport of a square beam produces greater maxima and reduces the width of the beam spread (Figure A1). Considering the varying lifetimes of the dust particles in the size bins, the effect of diffusion varies depending on particle size. In the transport of the dust plume in the 2-D simulations, the effect of diffusion can be identified by the higher dust mass concentration throughout the transport period in the case of UNO3 and the low concentration values that are kept longer in the case of UPWIND. In our 5-day transport, the benefit of a less diffusive scheme is identified in the simulation of the coarser dust particles of bin4 and bin5. The total mass in the atmosphere can be approximately 50% more when using the UNO3 scheme. The large relative differences observed between the different schemes in the 240-level simulations result from small absolute differences combined with reference values that are near zero. Consequently, these differences are negligible.
3.2. Changes in Atmospheric Dust Fields Due to Advection Scheme
We extended our analysis to 3D simulations under realistic meteorological conditions (Section 2.3), comparing two four-month runs (June–September 2022) labeled ASKOS_UPWIND and ASKOS_UNO3. The model configuration and dust emission setup are identical in both runs, differing only in the vertical advection scheme. Our simulations consist of two four-month runs, covering the period from June to September 2022, in alignment with the ASKOS 2022 campaign (Table 2). These simulations are designed to evaluate dust transport under realistic meteorological conditions, focusing on how the choice of advective scheme for dust sedimentation, influences particle transport. The experiments use identical model configurations and differ only in the applied advection scheme, as described in Section 2.1. Accordingly, the experiments are labeled ASKOS_UPWIND and ASKOS_UNO3.
With the current configuration, WRF-L produces a total dust emission of 300 Tg in each experiment. The dust sources in the domain are in the Saharan desert. Therefore, a high dust load (columnar integral of dust concentration) is simulated over northern Africa, which is being reduced further away. The dust plume travels towards the West, within 5o and 25o degrees of latitude, a typical pattern for that year's season. The spatial distribution pattern is similar for all three simulations using the different advective schemes. The UNO3 scheme produces lower mean total atmospheric dust loads (sum of dust load across all five size bins) from June to September 2022 near the dust sources and higher in the Caribbean Sea, compared to the default UPWIND scheme. The relative differences near the sources reach up to approximately -20%, while greater differences are observed in the Niger, Chad and Sudan. Besides, the relative increase in the Caribbean is close to 20–40%, indicating higher lifetimes for dust particles. Although, these positive differences correspond to low dust-load absolute differences close to 0.3 g/m2. The domain-averaged dust load differences between UPWIND and UNO3 schemes remained relatively modest (~-1.44%), with a slight decrease in bins 1 and 2, which correspond to finer particles and a slight increase for coarser particles in bins 3, 4 and 5 (Table A1).
The observed reduction of the average dust load for the period (June to September) using the UNO3 scheme, which is depicted in Figure 4, can be attributed to the fact that dust particles under less diffusion are transported at less high altitudes and thus travel at shorter distances. This process is also supported by the increase of the average near-surface concentrations in Figure 5. Positive differences in the 4-month surface dust concentration dominate above the Sahara Desert reaching up to approximately 50 μg/m3 corresponding to 3%, indicating that particles either deposit more or, stay at lower heights. On the other hand, negative differences in near surface concentration dominate over the Atlantic Ocean, reaching up to 30 μg/m3 corresponding to 6-9%, which are consistent with the decreased dust load, as well. Moreover, the contrasting behavior of finer and coarser particles can be attributed to the distinct vertical dynamics of dust particles. Coarser particles, which are primarily transported near the surface, experience limited vertical movement. With reduced numerical diffusion in UNO3, their vertical transport is further suppressed, leading to quicker deposition and, consequently, increased dust load over source regions. In contrast, finer particles, which can be lifted to higher altitudes, rely more on vertical motion for long-range transport. The suppression of vertical mixing due to lower numerical diffusion limits their ascent and thus their horizontal dispersion, ultimately reducing their dust loads.
To assess the relative impact of numerical diffusion on particle size and the model’s particle size distribution (PSD), we compute the coarse-to-fine dust load ratio (C2F), as shown in Figure 6. The C2F ratio is defined as the sum of dust loads in model bins 3, 4, and 5, di-vided by the sum of dust loads in bins 1 and 2.
A comparison between the two experiments reveals an increase in the C2F ratio when using the UNO3 scheme, suggesting that numerical diffusion affects fine and coarse particles differently. Specifically, the C2F ratio shows a consistent, increase with the less diffusive UNO3 scheme across all regions. The magnitude of difference is up to 2%, over the dust sources and in the outflow of dust towards the Atlantic Ocean, while higher observed values are artifacts that correspond to low C2F ratio values. These C2F ratio differences come from a reduction in dust load in bins 1 and 2 (finer particles) and an increase in bins 3, 4, and 5 (coarser particles), as illustrated in Figure A3, suggesting modelst changes in the dust particle size distribution.
4. Discussion
Mineral dust, particularly coarse and super-coarse particles, plays a pivotal role in climate processes, yet remains difficult to simulate accurately. This study focused on quantifying the effect of numerical diffusion—arising from sedimentation advection schemes—on the transport of mineral dust particles of varying sizes. By comparing the standard first-order UPWIND scheme to the less diffusive third-order UNO3 scheme in both idealized 2D and realistic 3D setups, we assessed how reducing numerical diffusion influences dust mass retention, vertical and horizontal redistribution, and optical properties.
In the 3D simulations of the ASKOS 2022 campaign, both advection schemes yielded similar large-scale dust load distributions, with domain-averaged total dust loads differing by less than 1%. However, this minimal global discrepancy conceals notable regional and size-dependent effects. The UNO3 scheme produced up to 20% lower dust load near Saharan sources and up to 20–40% higher loads over the tropical Atlantic and Caribbean—a redistribution pattern indicative of reduced artificial dispersion and enhanced long-range transport capacity.
The size-resolved behavior of dust under UNO3 shows an important distinction. For fine particles (D = 0.2–5.5 μm; bins 1–2), UNO3 simulations yield small decreases in atmospheric and surface concentrations (~1–2% domain-averaged), reflecting a slightly more efficient deposition due to reduced vertical mixing. In contrast, coarse particles (D = 5.5–40 μm; bins 3–4) are better preserved in the atmosphere under UNO3, with increases in both column and surface concentrations reaching up to 2–3%, and local surface differences up to 50 μg/m³. These trends affirm that numerical diffusion disproportionately affects larger particles, likely because their stronger gravitational settling is more sensitive to vertical smearing induced by low-order advection schemes.
This differential behavior is further illustrated by the coarse-to-fine (C2F) dust load ratio, which consistently increases in UNO3 simulations—especially in long-range transport regions like the Atlantic outflow. The lower C2F ratio implies that the relative contribution of coarse particles increases, confirming that reduced diffusion helps retain these larger particles during westward transport. While absolute changes remain modest, this has important implications for aerosol radiative forcing, sedimentation rates, and ocean fertilization studies that rely on accurate coarse dust representation.
Our findings align with previous studies on the role of numerical diffusion, however there are differences in the impact magnitude. [36] showed that reducing numerical diffusion using a second-order moment scheme significantly increased simulated dust mass loading by up to a factor of two compared to a first-order upwind scheme. In contrast, our study finds more modest differences (maximum 20%), likely due to differences in model setup. [36] used a global standalone model with coarser resolution and shorter simulation periods, whereas we used a high-resolution, regional, online-coupled simulation over four months. Additionally, the two studies used different advective scheme. It should be noted that, the UNO3 scheme performs higher numerical diffusion when it is applied on an irregular grid. This can explain the lower differences found in this study compared to the default UPWIND scheme. Despite these differences, both studies emphasize the importance of minimizing numerical diffusion to better represent the transport of coarse dust particles, however the effects appear to be scale- and resolution-dependent, suggesting that the sensitivity to numerical diffusion may vary under different model configurations or grid structures.
Similarly, [35] evaluated the impact of different transport schemes on modeled dust concentrations using the CHIMERE-DUST model. They found that while numerical diffusion significantly affected dust plume spread and peak concentrations, the domain-averaged dust burden differences between high- and low-diffusion schemes remained relatively modest (~1–2.5%). Their results are consistent with ours, showing that numerical diffusion has a measurable but moderate impact under realistic atmospheric conditions.
Overall, our study shows that numerical diffusion has a measurable but moderate influence on the simulation of dust transport, particularly in terms of regional redistribution and the preservation of coarse particles during long-range transport. While it does not substantially alter domain-averaged dust budgets, it systematically affects the spatial distribution and size-resolved behavior of dust plumes. The magnitude and significance of these effects may depend on specific modelling conditions, such as the advective scheme, model configuration or grid resolution. As such, further investigations involving additional numerical schemes and a broader range of test cases are warranted to better quantify the role of numerical diffusion and guide the selection of appropriate advection methods in dust modelling applications.
5. Summary and Conclusions
This study assessed the impact of numerical diffusion in vertical sedimentation schemes on the simulation of mineral dust transport, using the WRF-Chem model with the ASKOS 2022 campaign as a reference. By comparing the commonly used first-order UPWIND scheme to the less diffusive third-order UNO3 scheme, we evaluated how reducing numerical diffusion affects dust mass retention, distribution, and optical properties, with a focus on particle size sensitivity.
While domain-averaged differences in total dust load were small (~-1.44%), UNO3 produced notable regional and size-resolved effects. Specifically, it led to reduced dust concentrations near source regions and enhanced dust transport over the Atlantic and Caribbean—particularly for coarse particles—indicating that reducing numerical diffusion can improve the representation of long-range dust plume structure and coarse particle retention. These effects were also reflected in the higher coarse-to-fine (C2F) dust load ratio in UNO3 simulations, highlighting its ability to better preserve super-coarse dust during transport.
Despite these improvements, a large underestimation remains relative to broader model challenges, such as the persistent underrepresentation of super-coarse dust. This underscores the need to improve physical parameterisations related to emission and lofting processes in addition to refining numerical schemes.
The results demonstrate that the sensitivity to numerical diffusion is highly dependent on model configuration, grid structure, and resolution. Therefore, further investigation involving additional advection schemes, different modelling frameworks, and a range of meteorological regimes is essential to better understand the scale-dependent behavior of numerical diffusion and to guide the development of robust dust transport modelling strategies.
Author Contributions
Conceptualization, E.D., S.M. and V.A.; methodology, E.D., S.M.; software, E.D.; investigation, E.D., S.M., C.P.G.P.; visualization, E.D.; resources, E.D, V.A.; writing—original draft preparation, E.D.; writing—review and editing, E.D, C.P.G.P., P.K., S.M., V.A.; All authors have read and agreed to the published version of the manuscript.
Funding
E.D acknowledges support by the Hellenic Foundation for Research and Innovation (H.F.R.I.) under the "2nd Call for H.F.R.I. Research Projects to support Post-Doctoral Researchers" (Project Acronym: StratoFIRE, Project number: 3995). This paper has partially received funding from Horizon Europe programme under Grant Agreement No 101137680 via project CERTAINTY (Cloud-aERosol inTeractions & their impActs IN The earth sYstem); the HFRI Research Projects to support postdoctoral researchers (project acronym: REVEAL; Project number: 07222); the AIRSENSE (Aerosol and aerosol cloud Interaction from Remote SENSing Enhancement) project, funded from the European Space Agency under Contract number 4000142902/23/I-NS; and the CiROCCO project funded by the European Union under Grant Agreement number 101086497
Data Availability Statement
Data are available upon request to eldrakaki@noa.gr.
Acknowledgments
This work is supported by computational time granted from the National Infrastructures for Research and Technology S.A. (GRNET S.A.) in the National HPC facility - ARIS - under project ID pr016030_thin-MIAMI.
Conflicts of Interest
The authors declare no conflicts of interest.
Abbreviations
The following abbreviations are used in this manuscript:
| UNO3 | Upstream Non-Oscillating III |
| C2F | Coarse to Fine dustload ratio |
Appendix A
Figure A1.
Transport of a square beam using the UPWIND and the UNO3 schemes for Courant number C=0.2. We use constant transport velocity, while the timestep is adjusted to the levels’ width and the Courant number. (a) 60 (59), (b) 120 (119), (c) 240 (239) and (d) 480 (478) full (mid) levels during the transport of the beam at the approximate same height.
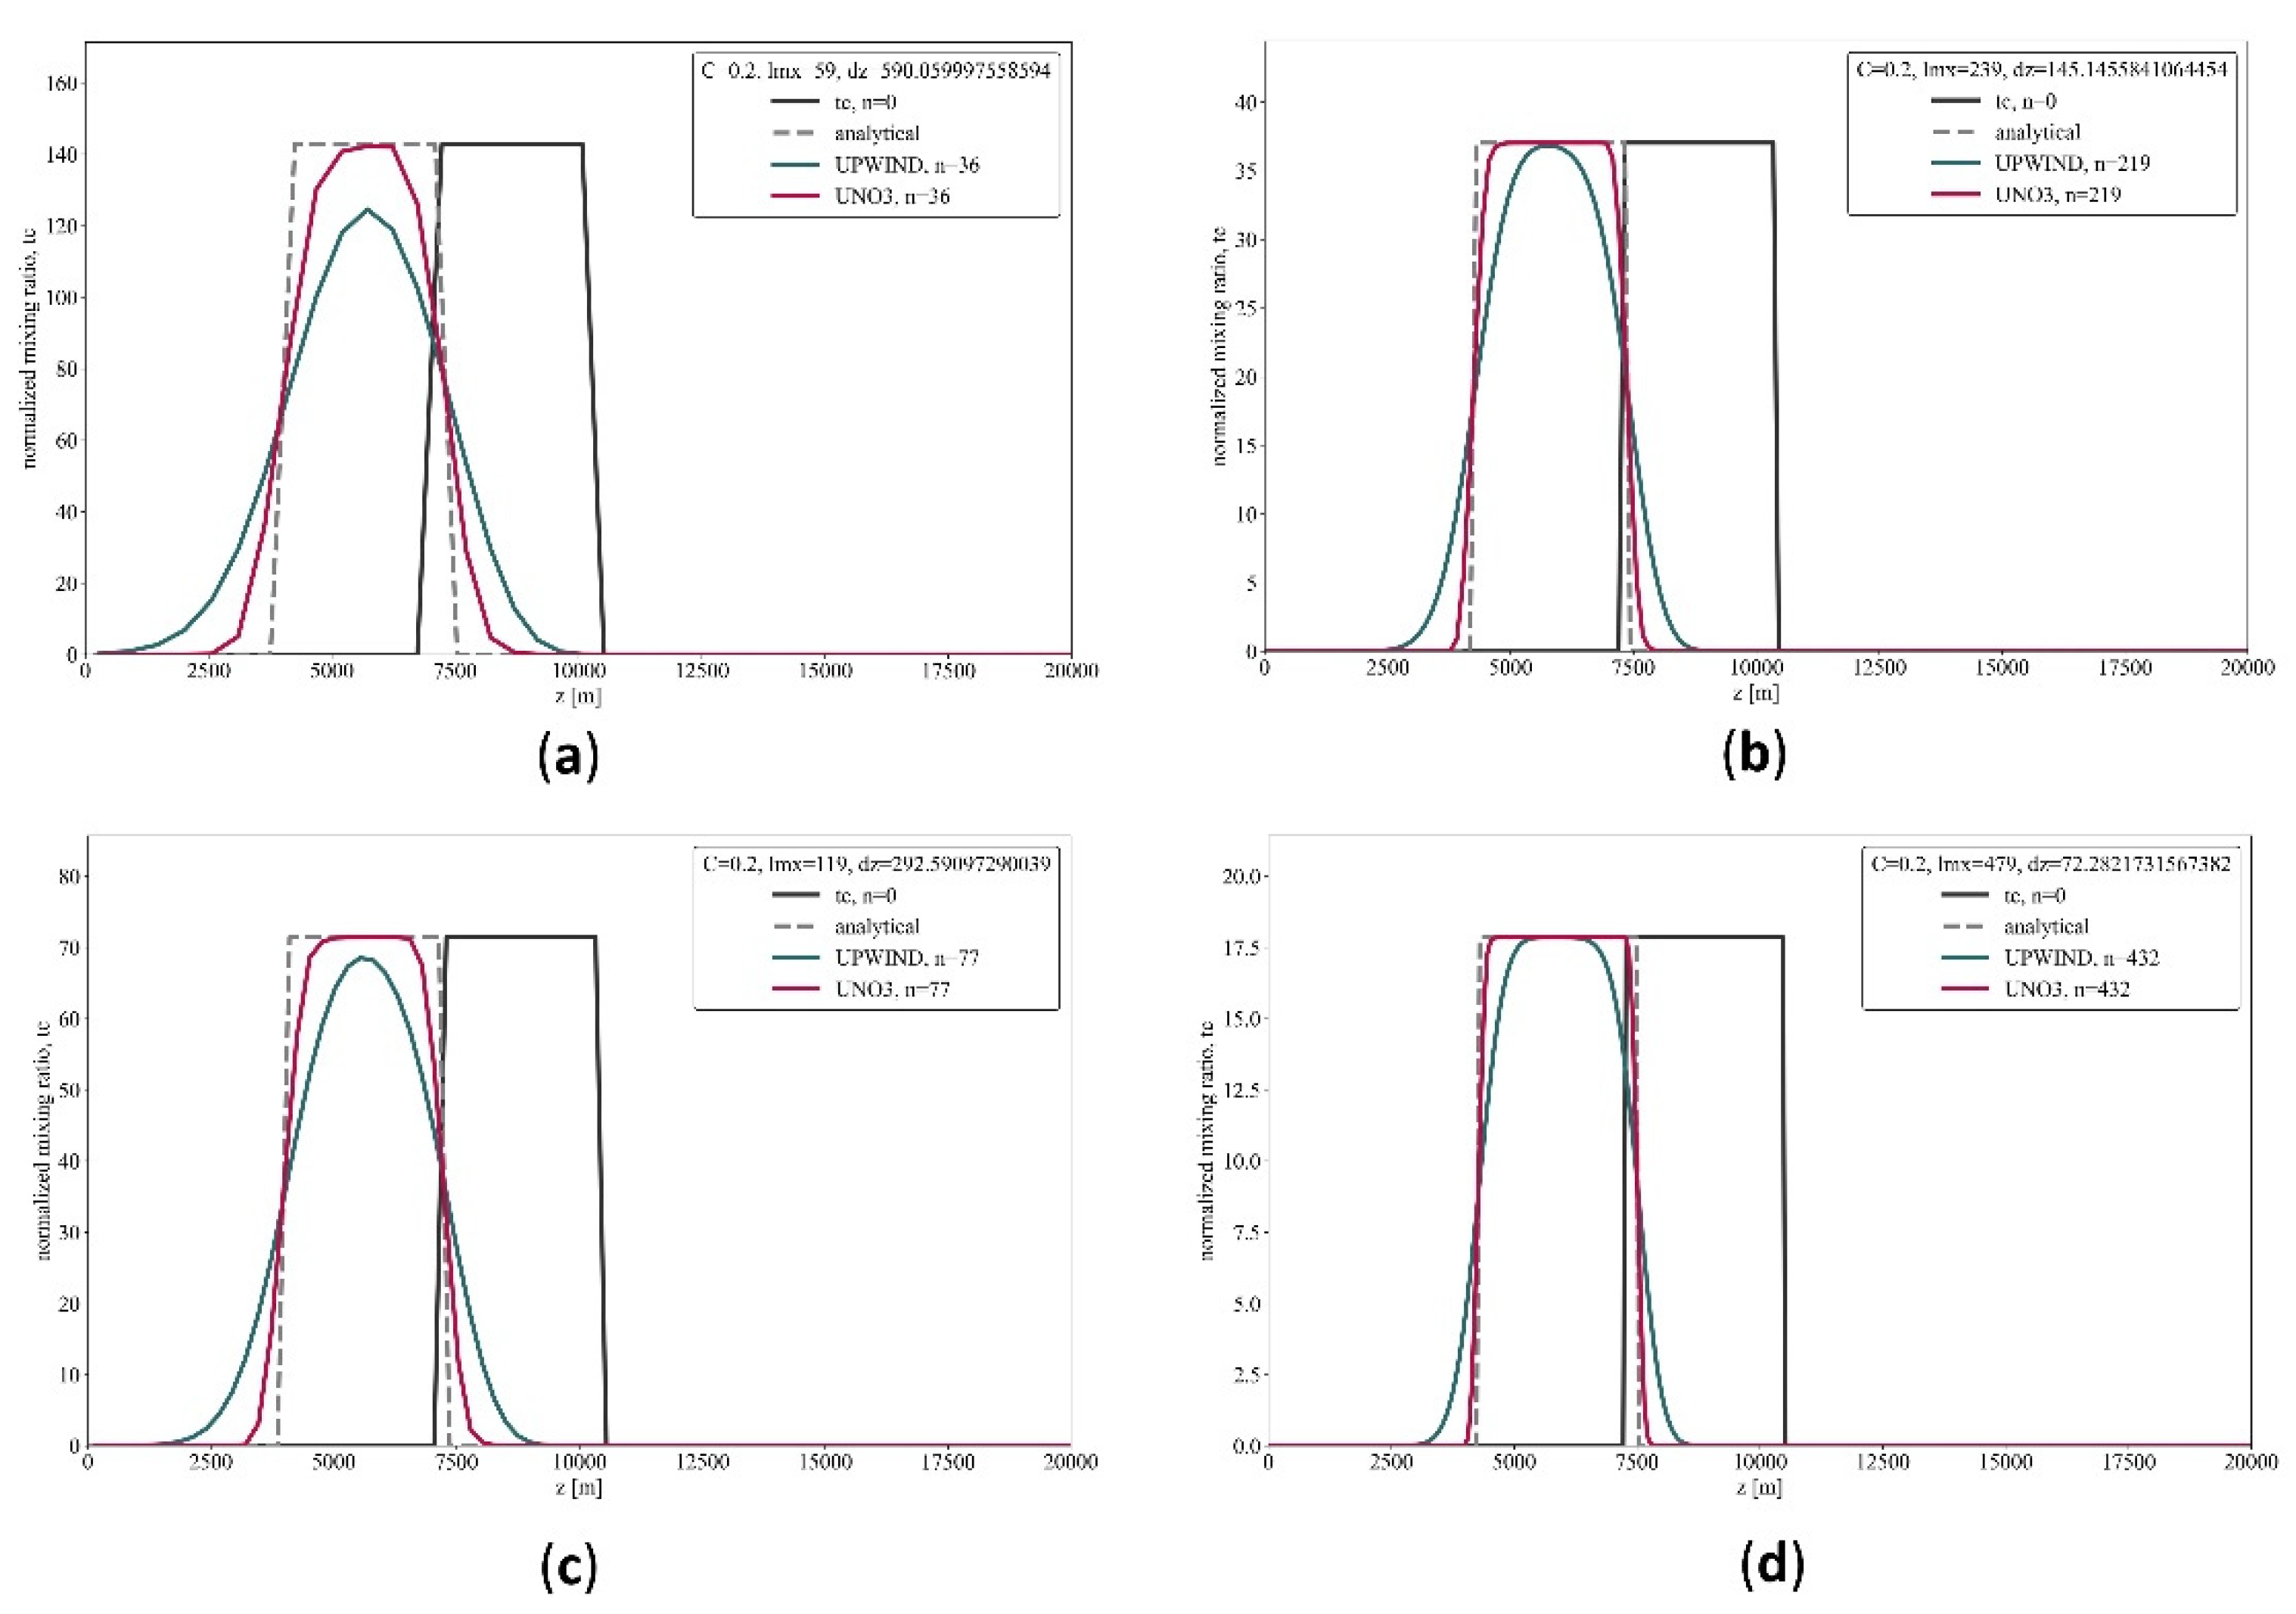
Figure A2.
The spatial distribution of the temporal mean dust load of June, July, August and September 2022 for bin 1 is presented for the experiments using the UPWIND (upper left) and UNO3 (upper right) schemes. The absolute and relative differences, respectively, between the simulated dust load using the UNO3 scheme and those using the UPWIND scheme are presented in lower left and right.
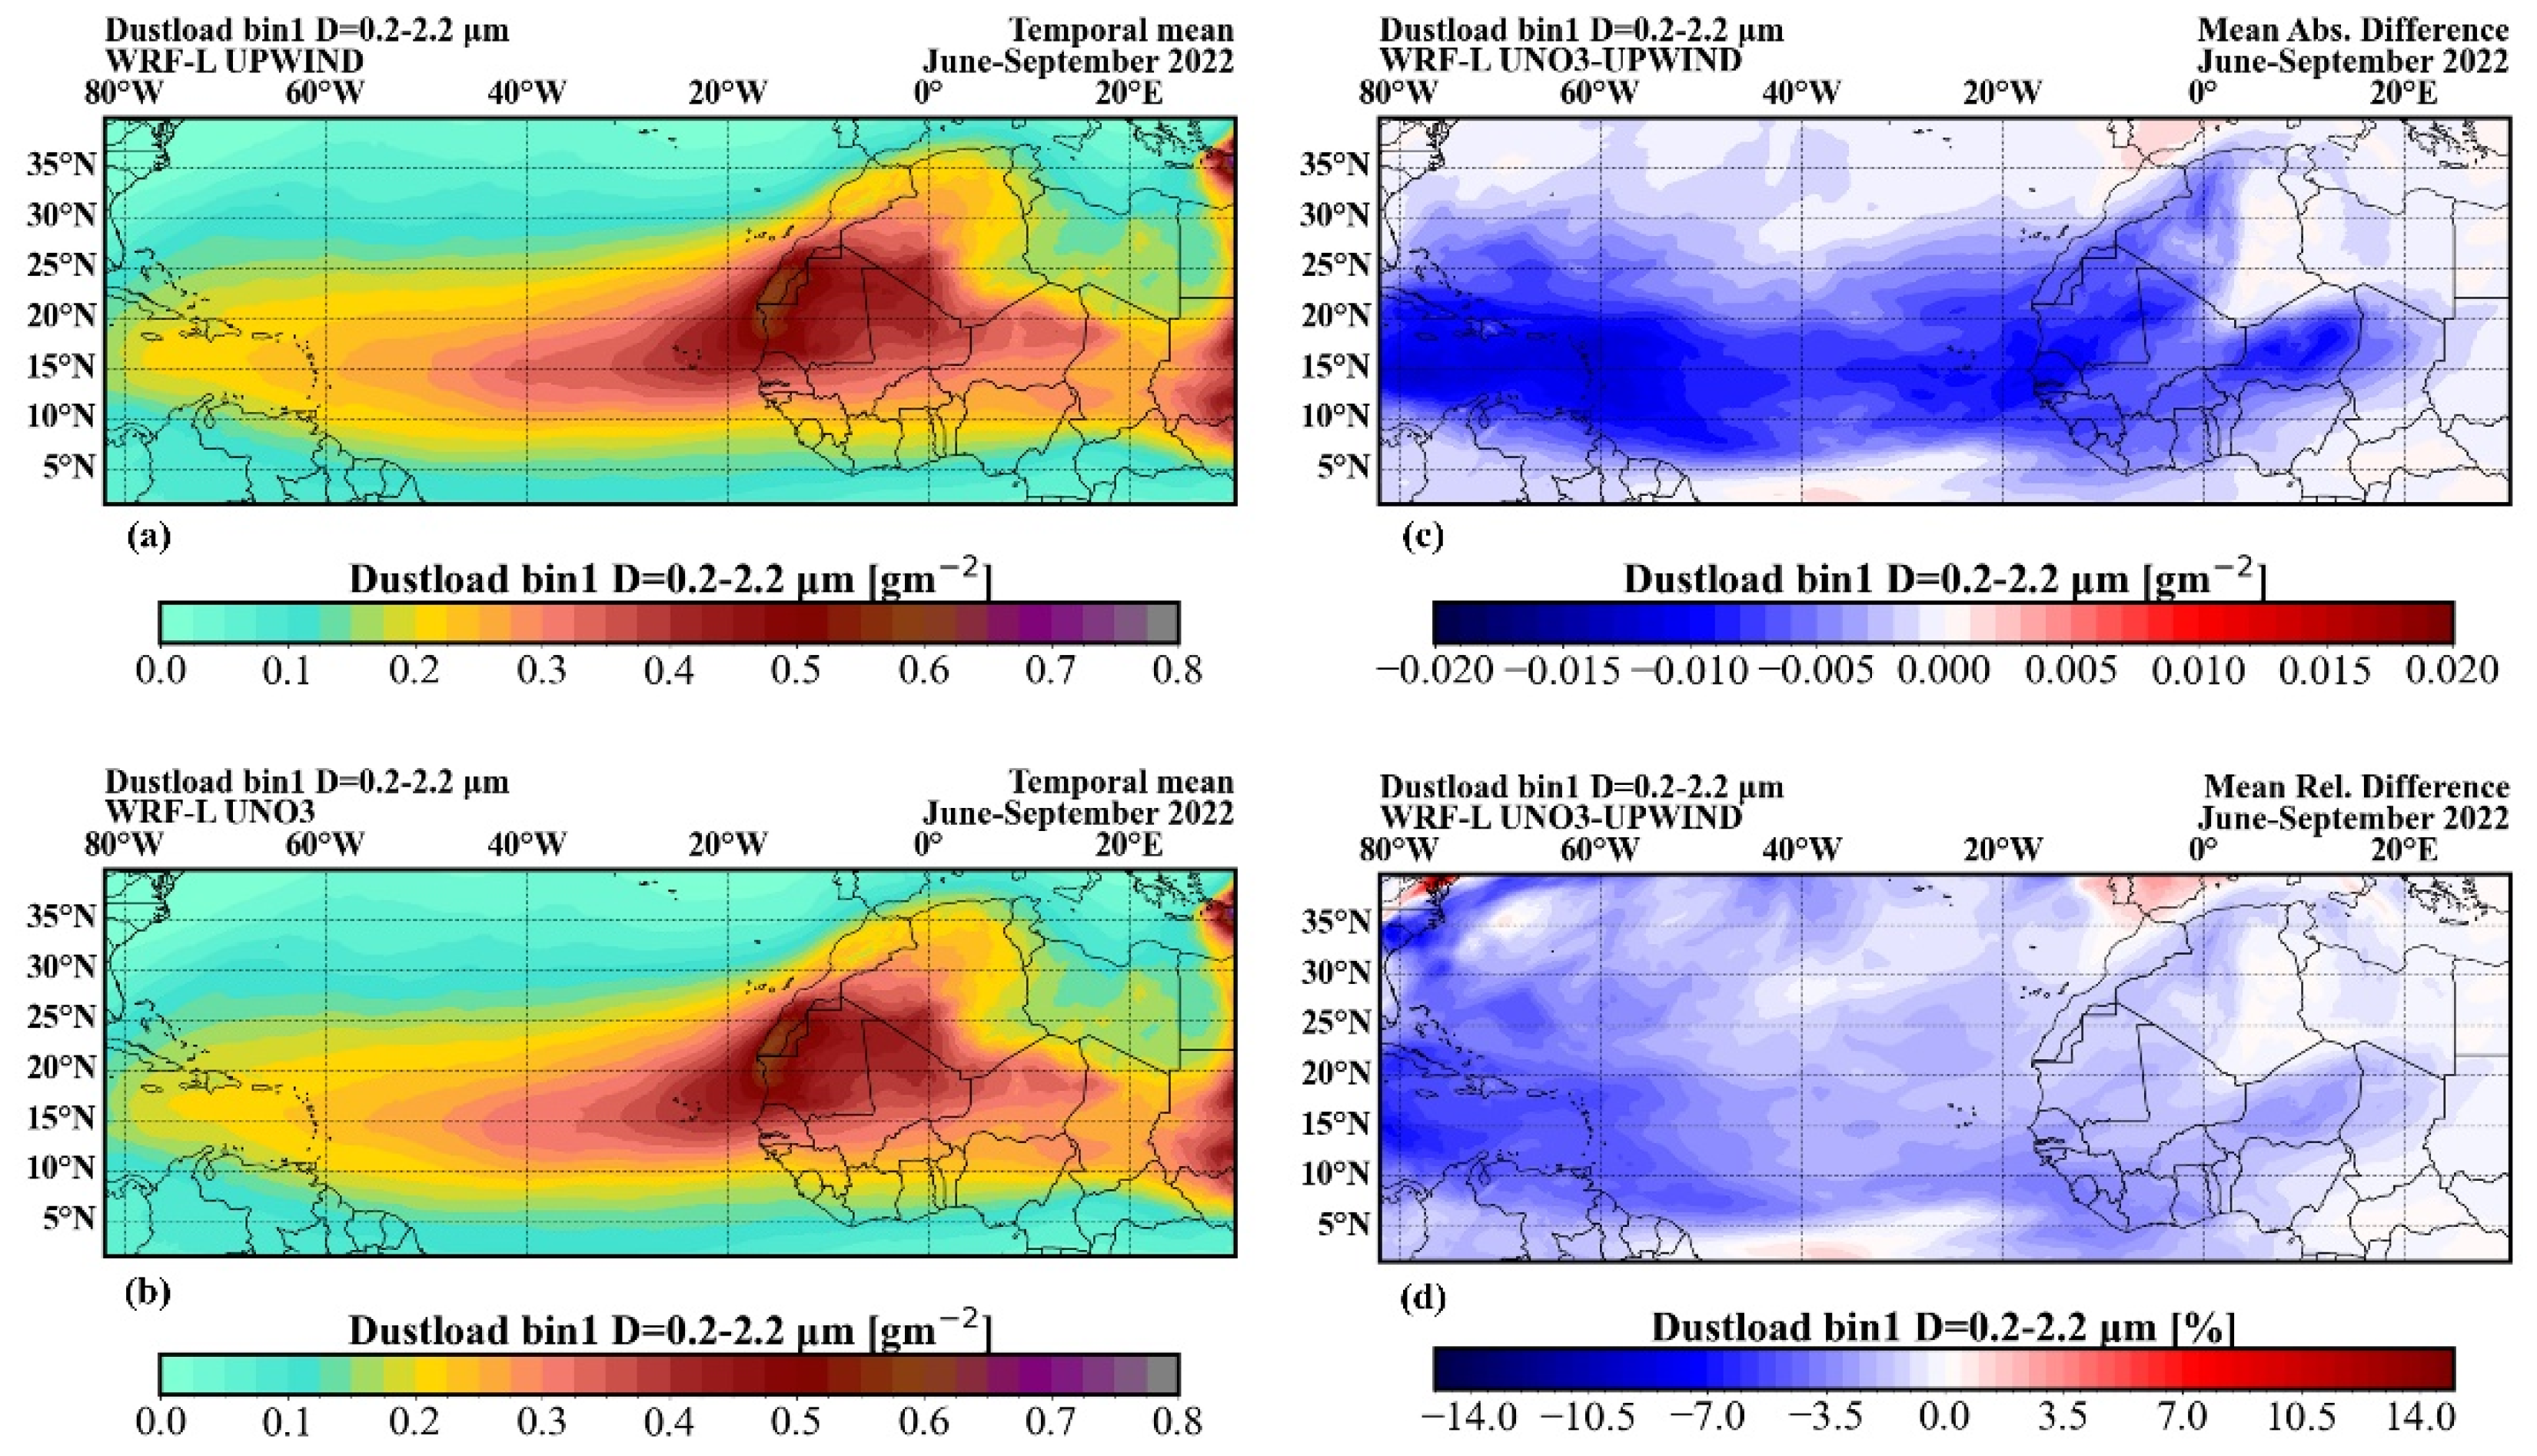
Figure A3.
Same as A2, for model bin 2.
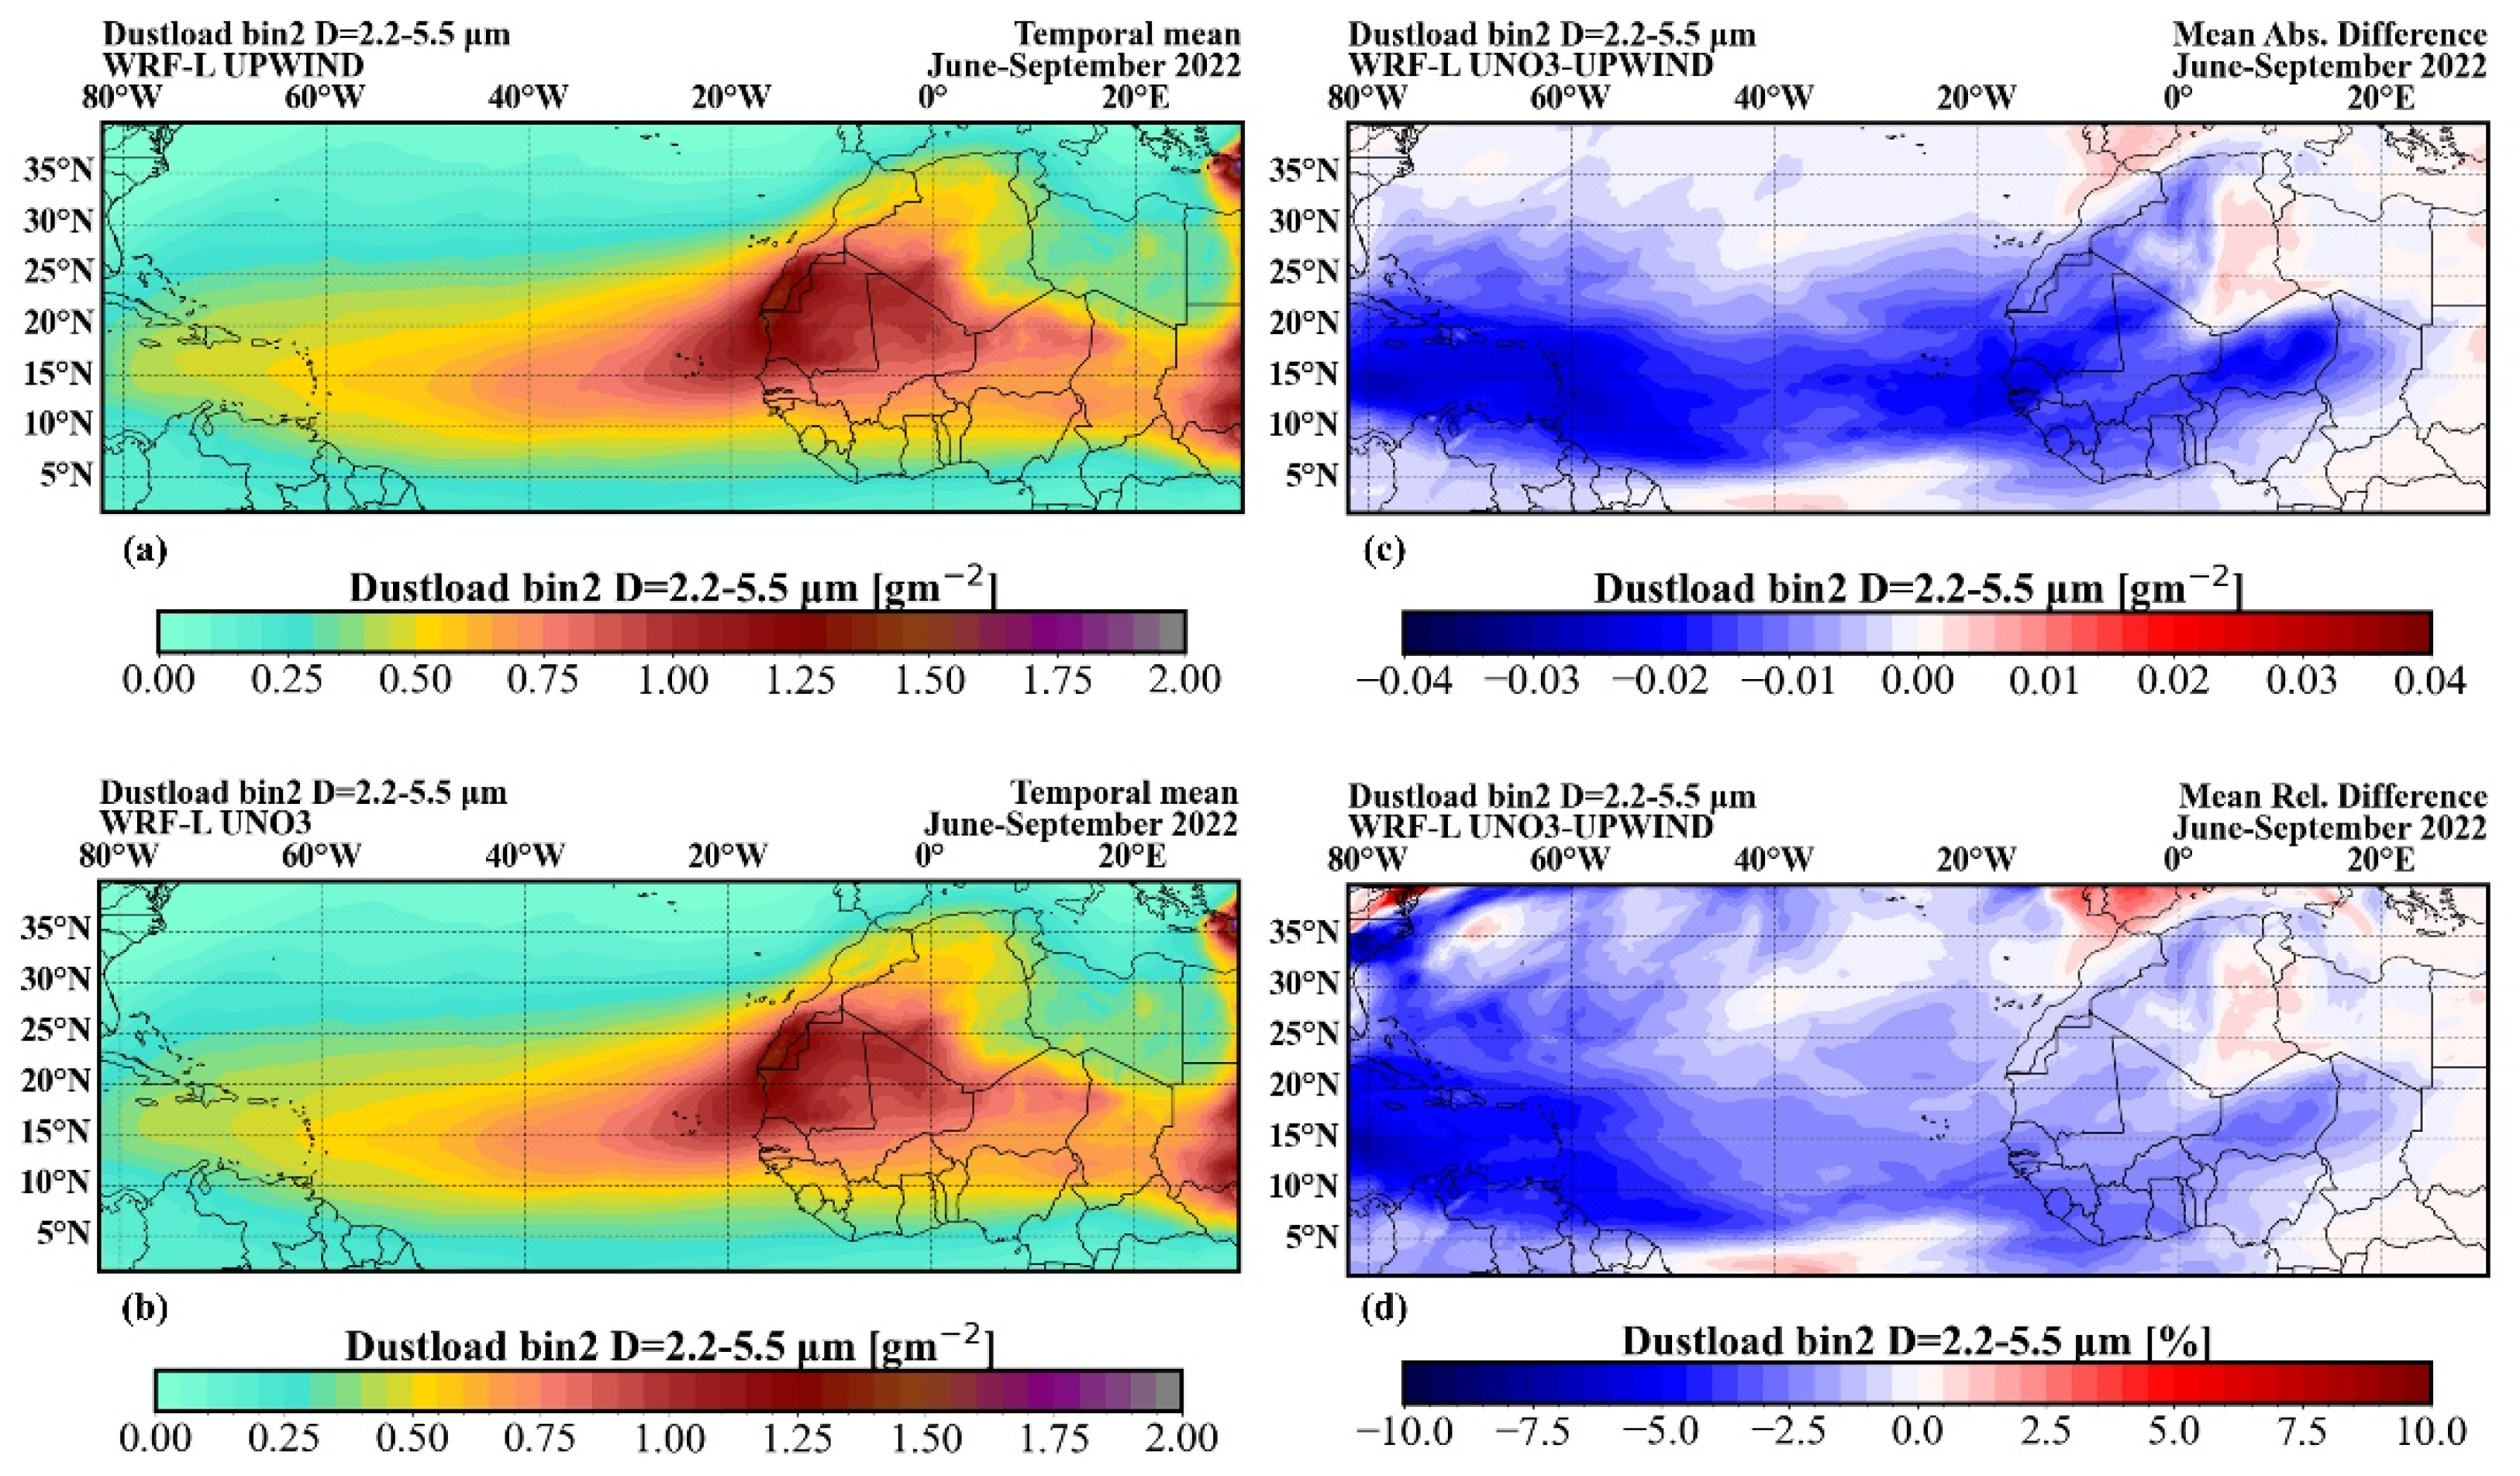
Figure A4.
Same as A2, for model bin 3.
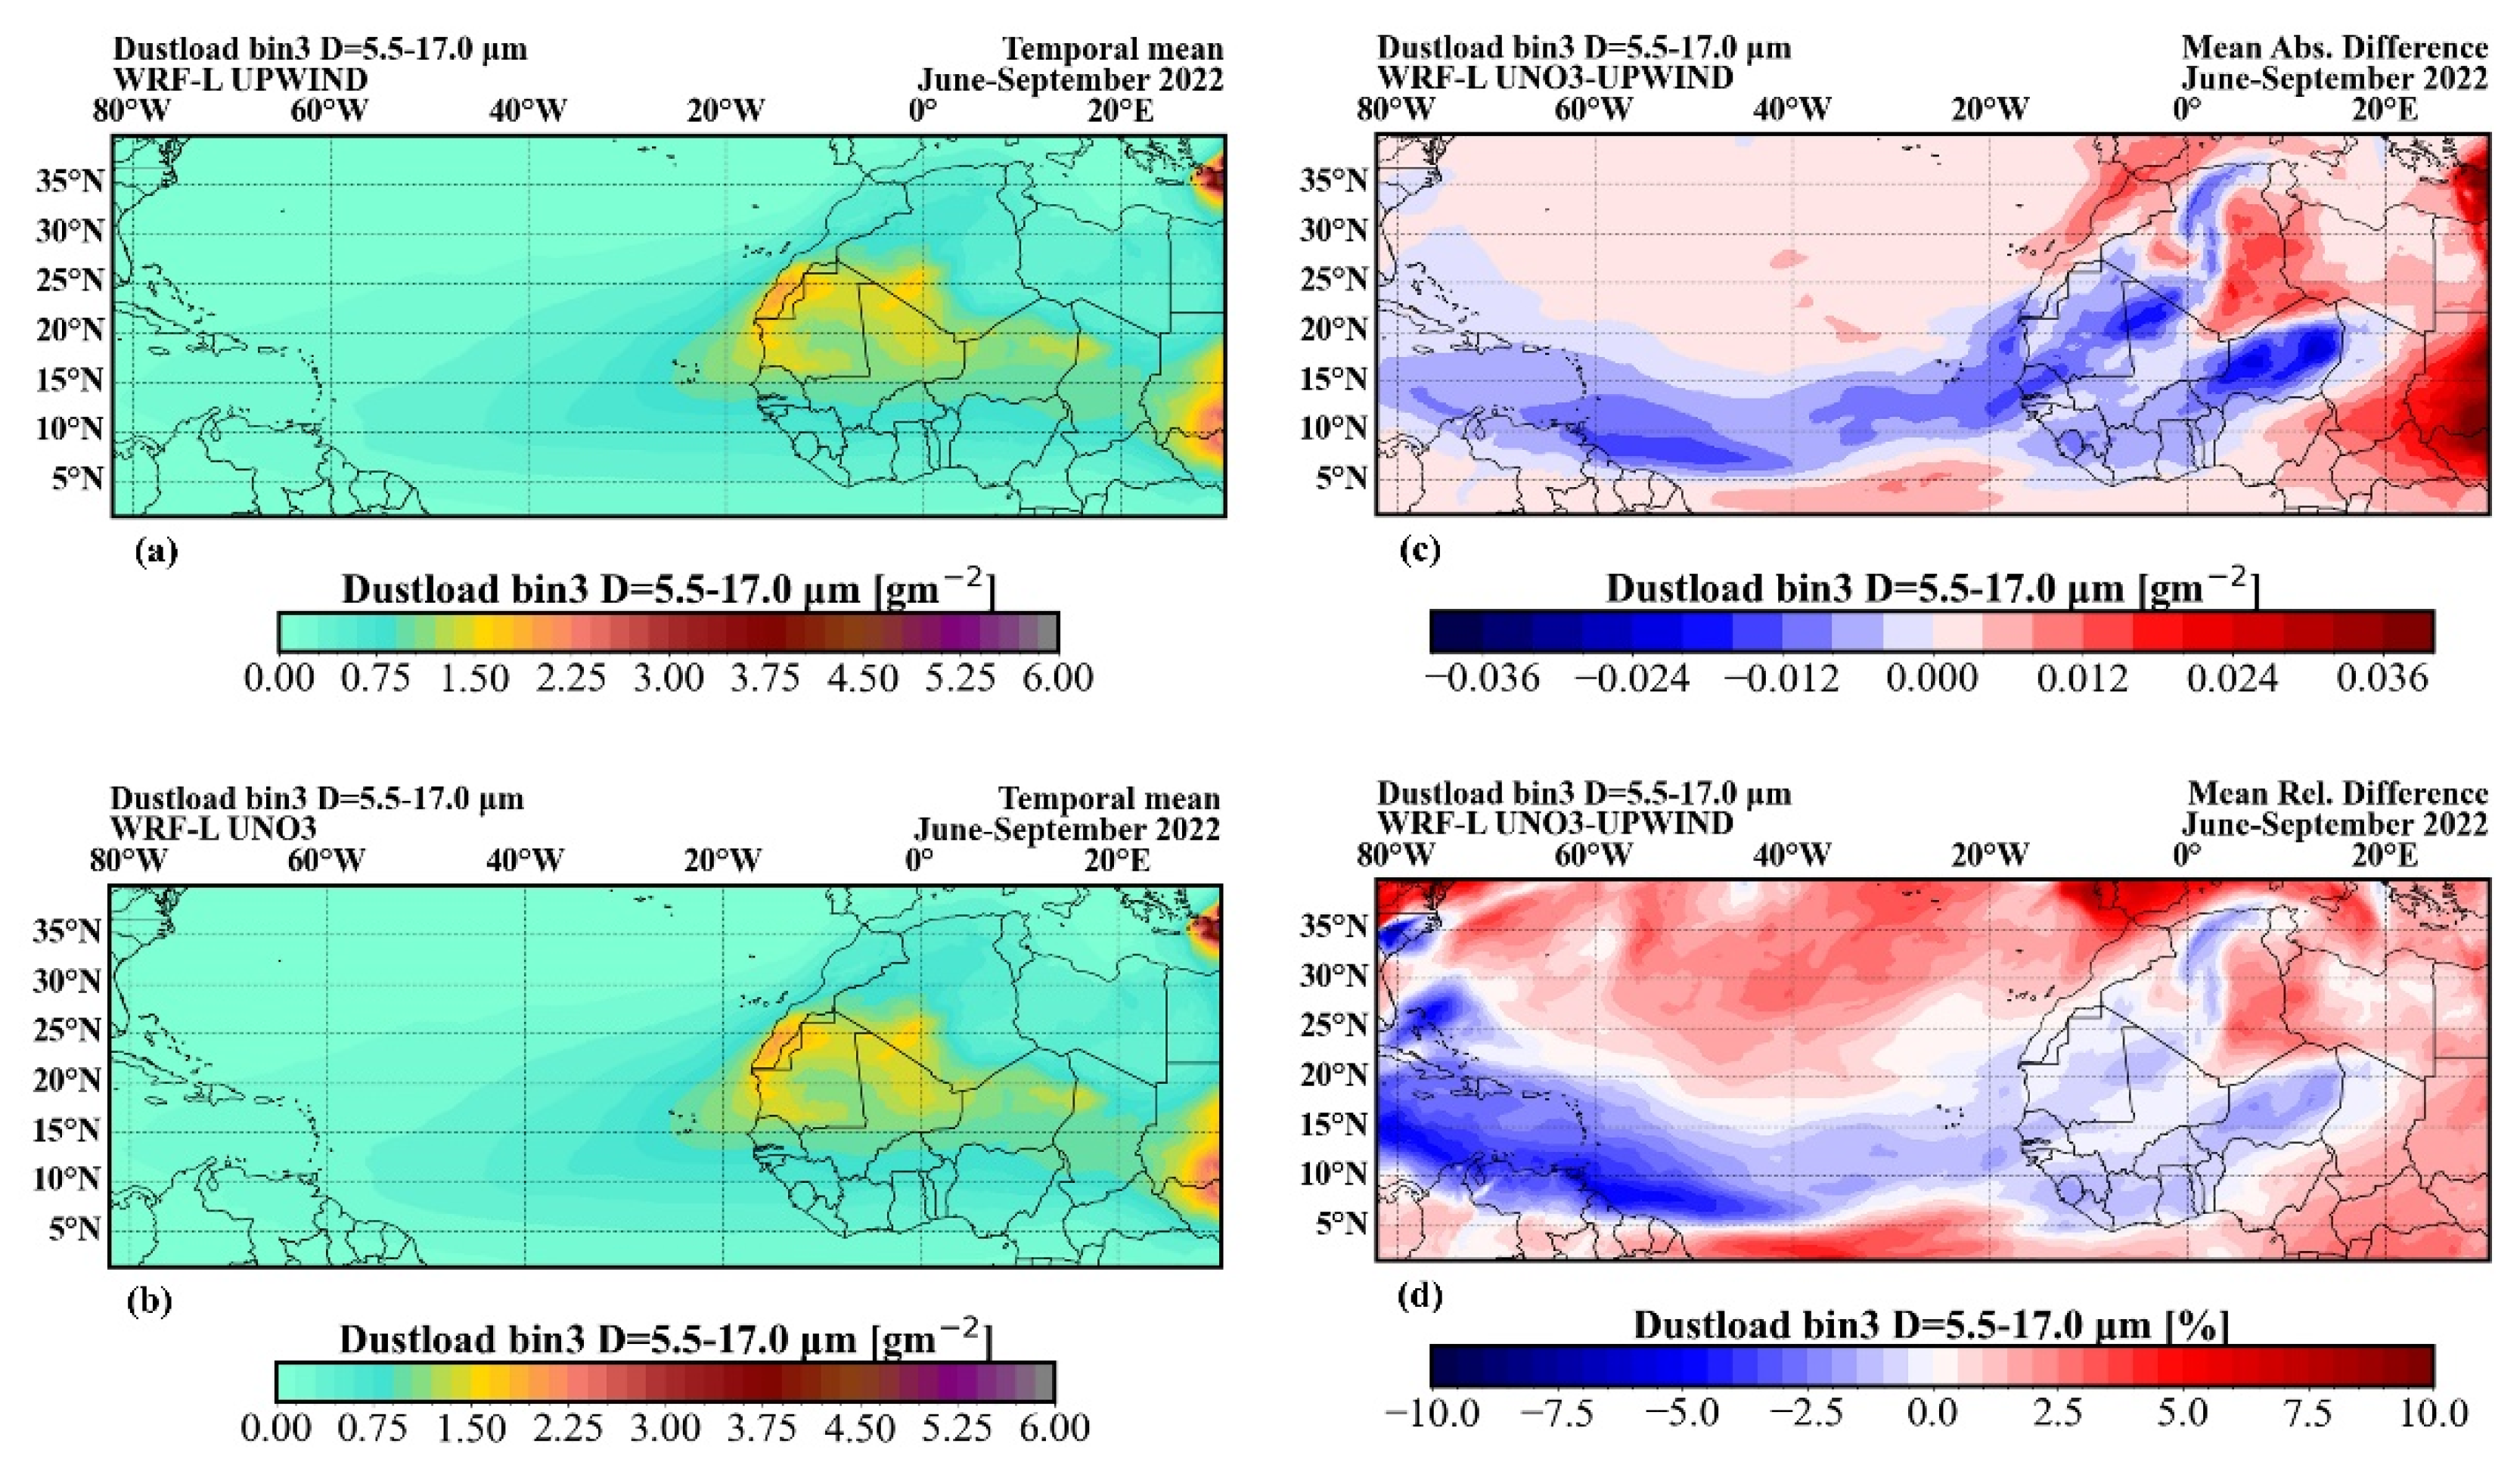
Figure A5.
Same as A2, for model bin 4.
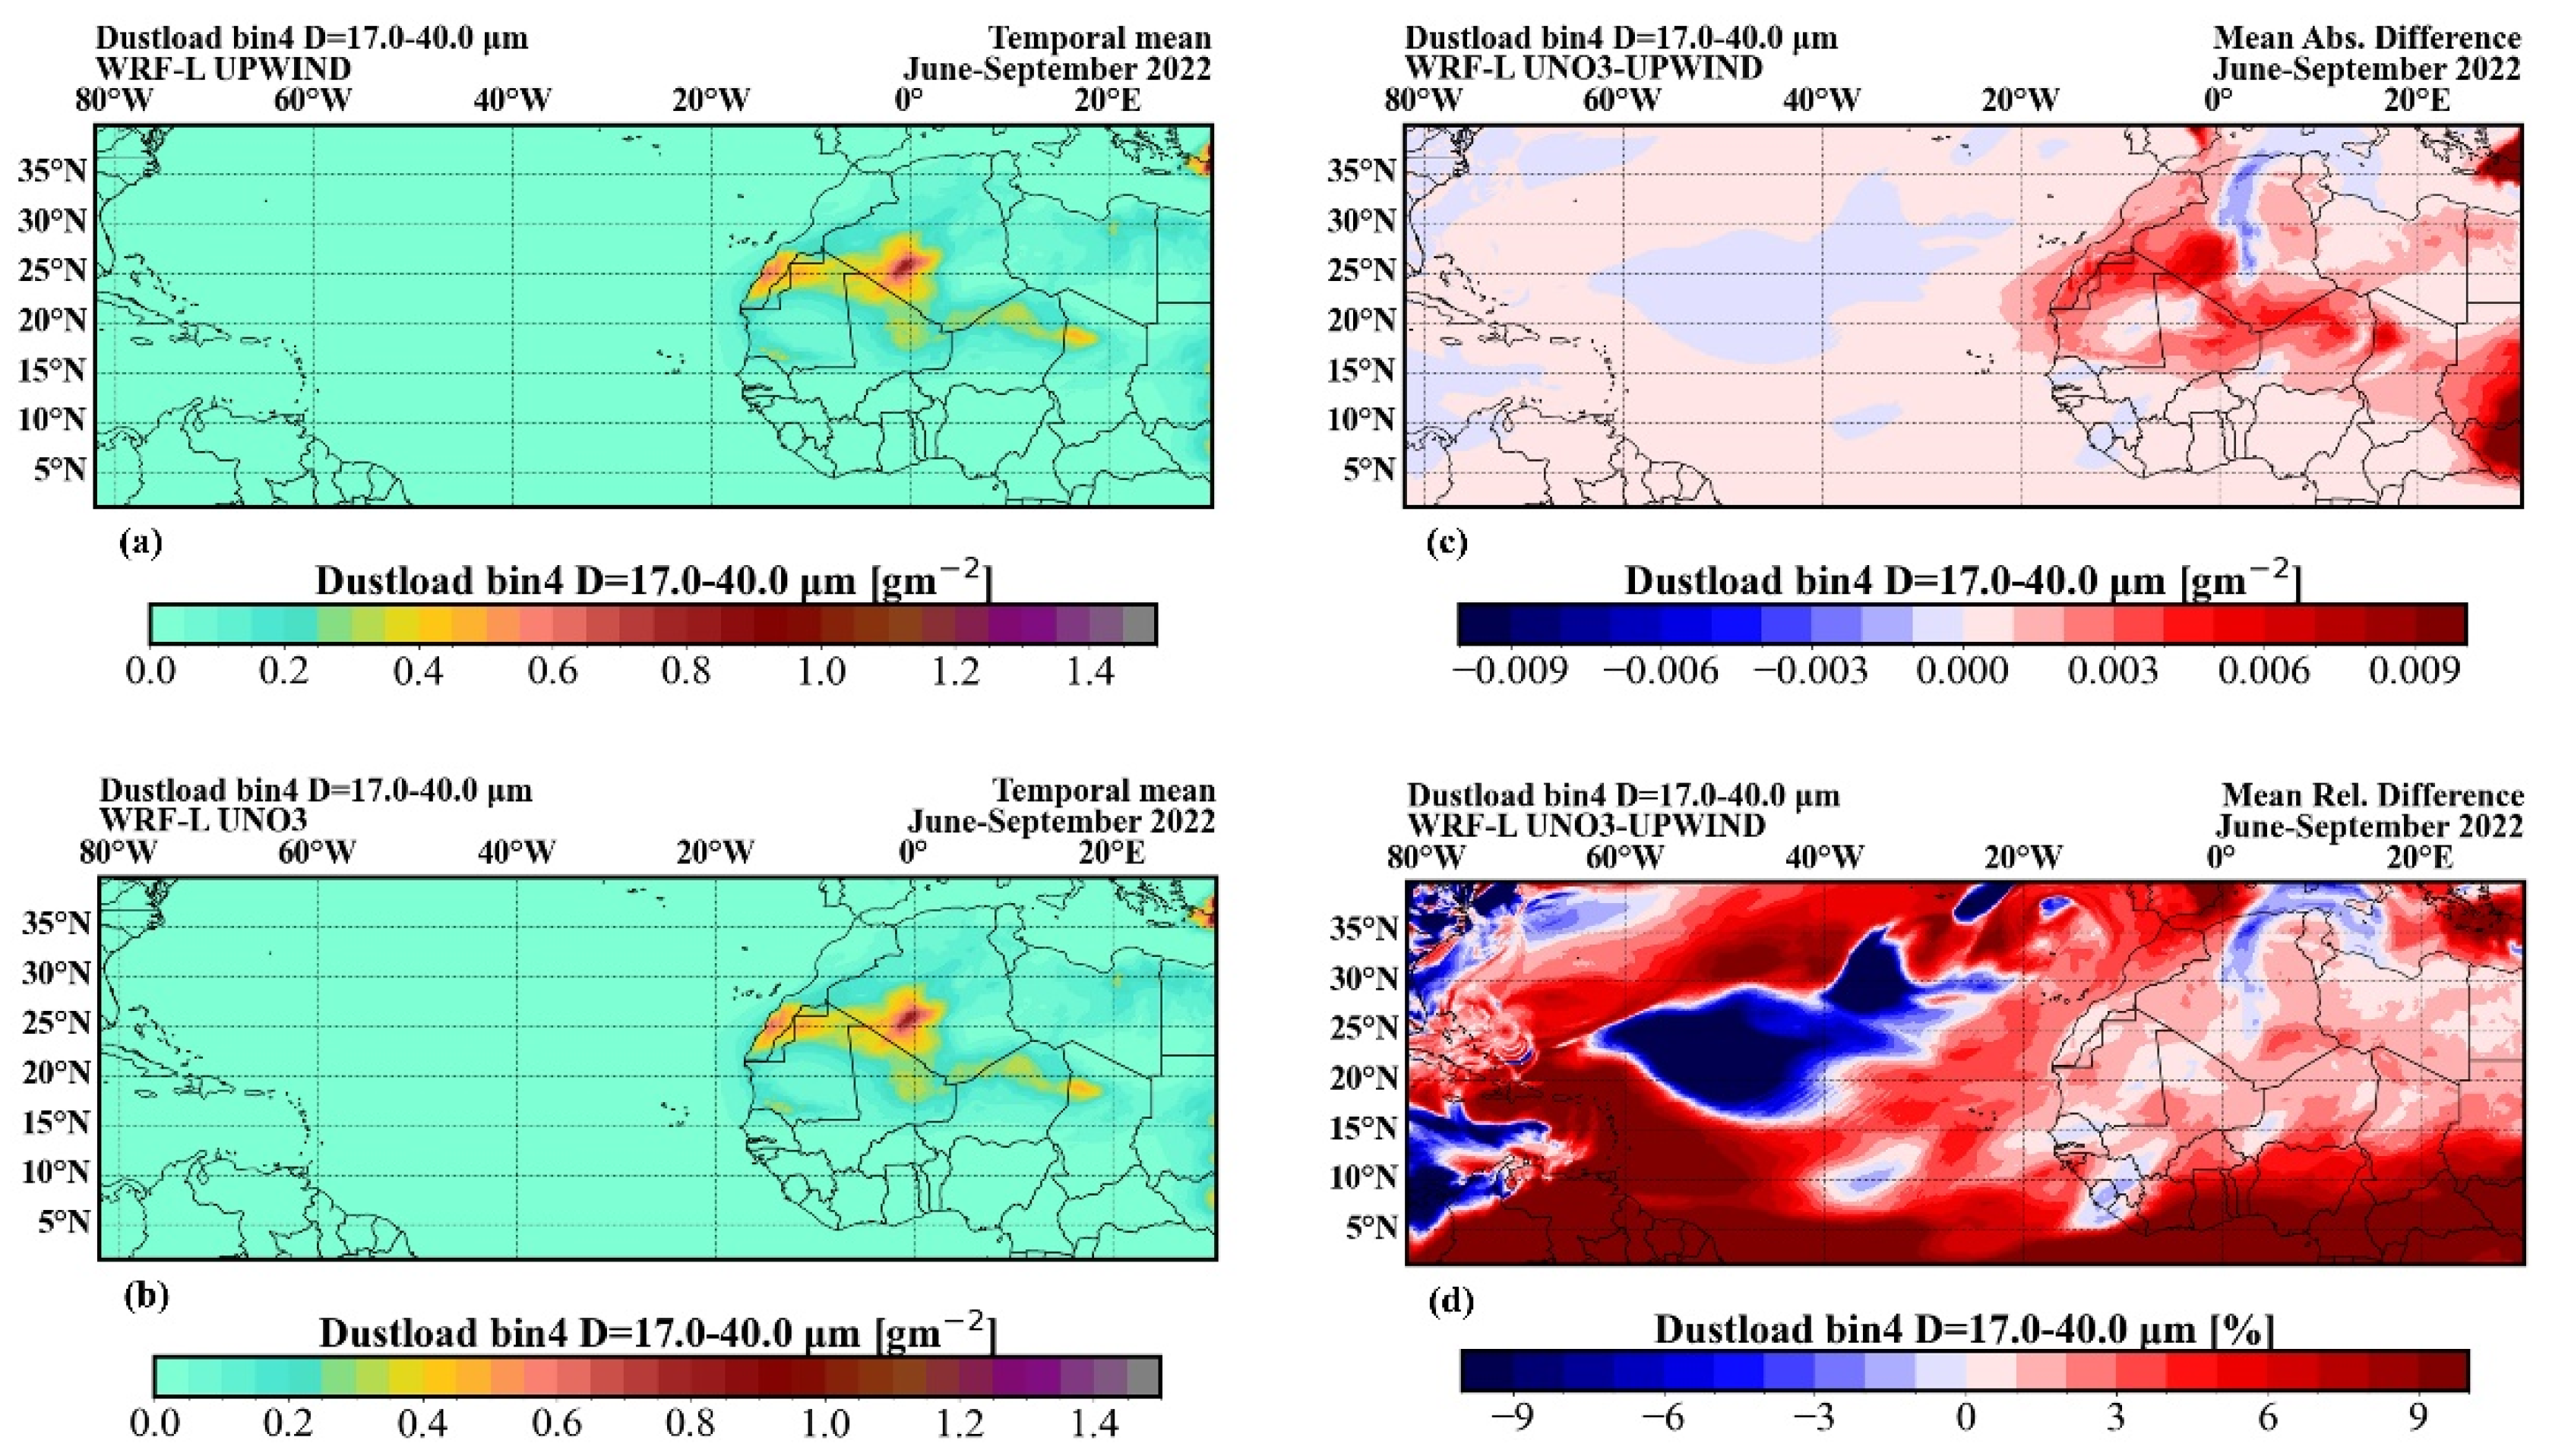
Figure A6.
Same as A2, for model bin 5.
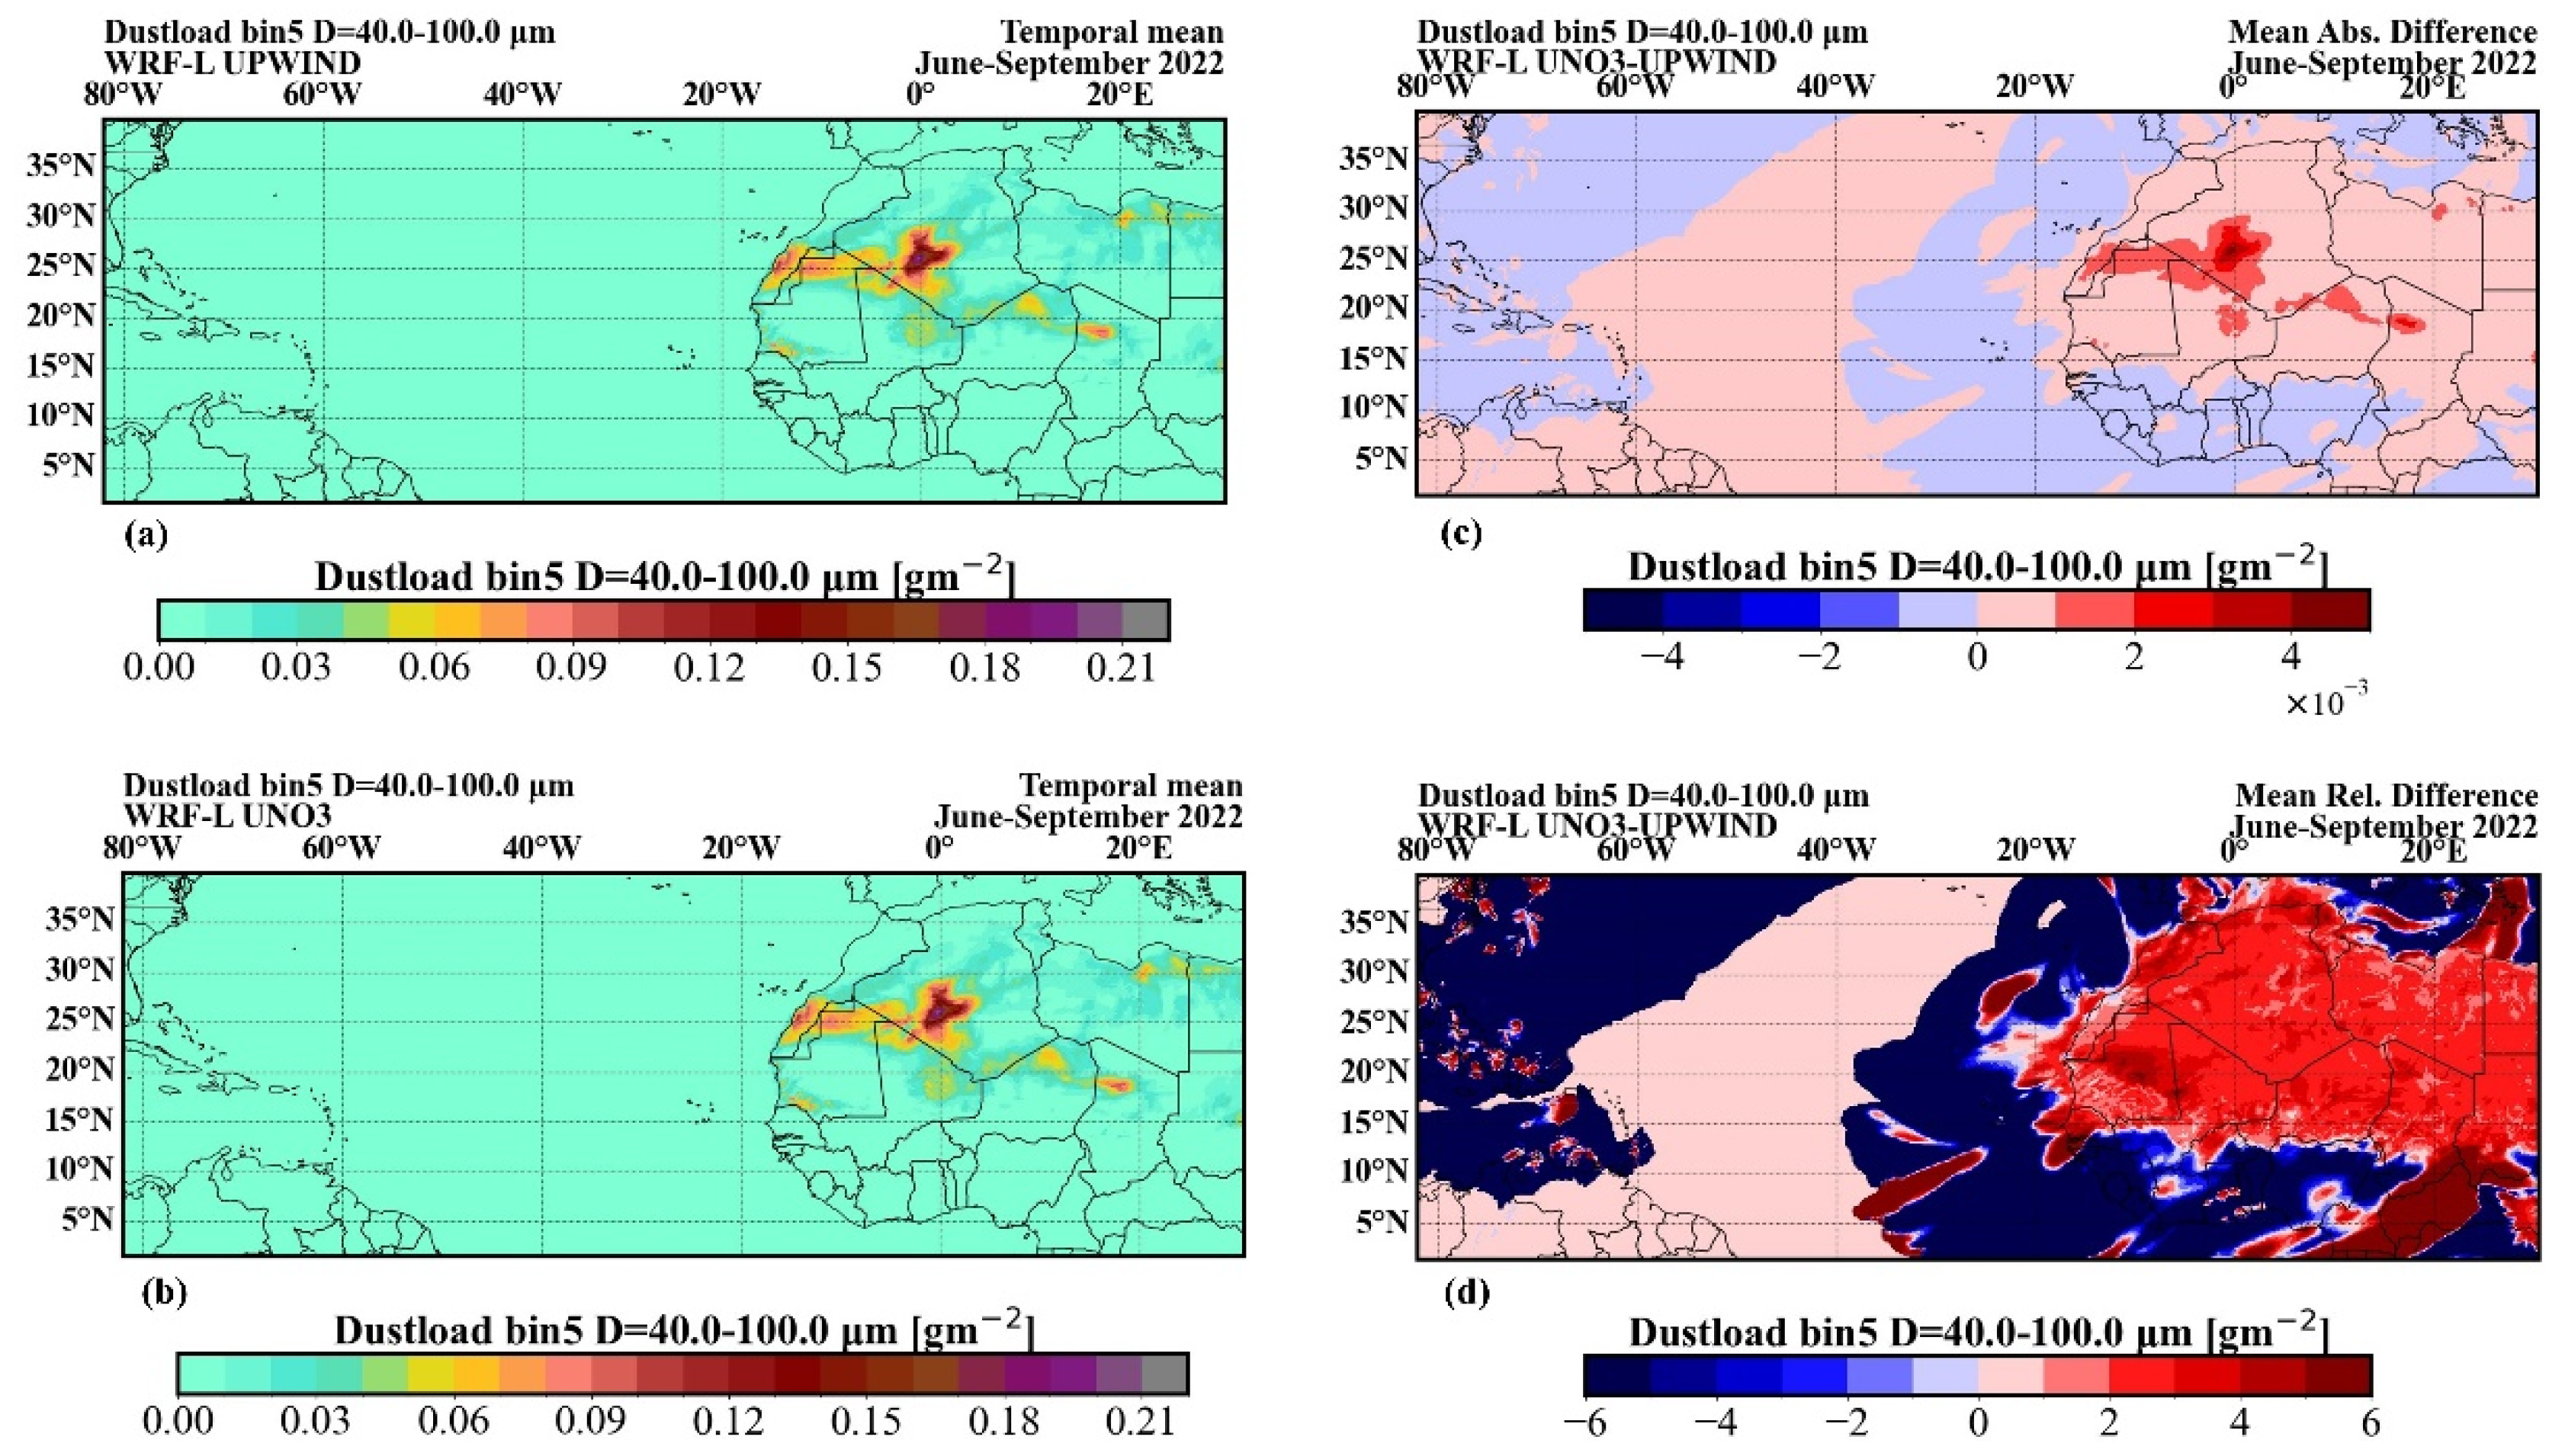

Table A1.
Temporaly and spatial average, over the domain, dustload absolute and relative difference.
Table A1.
Temporaly and spatial average, over the domain, dustload absolute and relative difference.
| Variable | UNO3-UPWIND Absolute Difference [g/m2] |
UNO3-UPWIND Relative Difference [%] |
|---|---|---|
| Total Dustload | -0.015 | -1.44 |
| Dustload bin 1 | -0.003 | -2 |
| Dustload bin 2 | -0.007 | -1.6 |
| Dustload bin 3 | 0.007 | 0.3 |
| Dustload bin 4 | 7×10⁻⁴ | 1.9 |
| Dustload bin 5 | 9.2×10⁻⁵ | 2.3 |
References
- Kok, J.F.; Adebiyi, A.A.; Albani, S.; Balkanski, Y.; Checa-Garcia, R.; Chin, M.; Colarco, P.R.; Hamilton, D.S.; Huang, Y.; Ito, A.; et al. Contribution of the World’s Main Dust Source Regions to the Global Cycle of Desert Dust. Atmos. Chem. Phys. 2021, 21, 8169–8193. [Google Scholar] [CrossRef]
- Chen, S.-H.; Liu, Y.-C.; Nathan, T.R.; Davis, C.; Torn, R.; Sowa, N.; Cheng, C.-T.; Chen, J.-P. Modeling the Effects of Dust-Radiative Forcing on the Movement of Hurricane Helene (2006): Effect of Dust-Radiative Forcing on Helene Movement. Q.J.R. Meteorol. Soc. 2015, 141, 2563–2570. [Google Scholar] [CrossRef]
- Pérez, C.; Nickovic, S.; Pejanovic, G.; Baldasano, J.M.; Özsoy, E. Interactive Dust-radiation Modeling: A Step to Improve Weather Forecasts. J. Geophys. Res. 2006, 111, 2005JD006717. [Google Scholar] [CrossRef]
- Spyrou, C.; Kallos, G.; Mitsakou, C.; Athanasiadis, P.; Kalogeri, C.; Iacono, M.J. Modeling the Radiative Effects of Desert Dust on Weather and Regional Climate. Atmos. Chem. Phys. 2013, 13, 5489–5504. [Google Scholar] [CrossRef]
- Papachristopoulou, K.; Fountoulakis, I.; Gkikas, A.; Kosmopoulos, P.G.; Nastos, P.T.; Hatzaki, M.; Kazadzis, S. 15-Year Analysis of Direct Effects of Total and Dust Aerosols in Solar Radiation/Energy over the Mediterranean Basin. Remote Sensing 2022, 14, 1535. [Google Scholar] [CrossRef]
- Guieu, C.; Ridame, C.; Pulido-Villena, E.; Bressac, M.; Desboeufs, K.; Dulac, F. Impact of Dust Deposition on Carbon Budget: A Tentative Assessment from a Mesocosm Approach. Biogeosciences 2014, 11, 5621–5635. [Google Scholar] [CrossRef]
- Okin, G.S.; Mladenov, N.; Wang, L.; Cassel, D.; Caylor, K.K.; Ringrose, S.; Macko, S.A. Spatial Patterns of Soil Nutrients in Two Southern African Savannas. J. Geophys. Res. 2008, 113, 2007JG000584. [Google Scholar] [CrossRef]
- Kok, J.F.; Storelvmo, T.; Karydis, V.A.; Adebiyi, A.A.; Mahowald, N.M.; Evan, A.T.; He, C.; Leung, D.M. Mineral Dust Aerosol Impacts on Global Climate and Climate Change. Nat Rev Earth Environ 2023, 4, 71–86. [Google Scholar] [CrossRef]
- Nabat, P.; Kanji, Z.A.; Mallet, M.; Denjean, C.; Solmon, F. Aerosol-Cloud Interactions and Impact on Regional Climate. In Atmospheric Chemistry in the Mediterranean Region; Dulac, F., Sauvage, S., Hamonou, E., Eds.; Springer International Publishing: Cham, 2022; pp. 403–425; ISBN 978-3-030-82384-9. [Google Scholar]
- Fountoulakis, I.; Tsekeri, A.; Kazadzis, S.; Amiridis, V.; Nersesian, A.; Tsichla, M.; Proestakis, E.; Gkikas, A.; Papachristopoulou, K.; Barlakas, V.; et al. A Sensitivity Study on Radiative Effects Due to the Parameterization of Dust Optical Properties in Models; Radiation/Atmospheric Modelling and Data Analysis/Troposphere/Physics (physical properties and processes), 2023.
- Jin, Q.; Wei, J.; Lau, W.K.M.; Pu, B.; Wang, C. Interactions of Asian Mineral Dust with Indian Summer Monsoon: Recent Advances and Challenges. Earth-Science Reviews 2021, 215, 103562. [Google Scholar] [CrossRef]
- Atkinson, J.D.; Murray, B.J.; Woodhouse, M.T.; Whale, T.F.; Baustian, K.J.; Carslaw, K.S.; Dobbie, S.; O’Sullivan, D.; Malkin, T.L. The Importance of Feldspar for Ice Nucleation by Mineral Dust in Mixed-Phase Clouds. Nature 2013, 498, 355–358. [Google Scholar] [CrossRef] [PubMed]
- Chatziparaschos, M.; Daskalakis, N.; Myriokefalitakis, S.; Kalivitis, N.; Nenes, A.; Gonçalves Ageitos, M.; Costa-Surós, M.; Pérez García-Pando, C.; Zanoli, M.; Vrekoussis, M.; et al. Role of K-Feldspar and Quartz in Global Ice Nucleation by Mineral Dust in Mixed-Phase Clouds. Atmos. Chem. Phys. 2023, 23, 1785–1801. [Google Scholar] [CrossRef]
- Froyd, K.D.; Yu, P.; Schill, G.P.; Brock, C.A.; Kupc, A.; Williamson, C.J.; Jensen, E.J.; Ray, E.; Rosenlof, K.H.; Bian, H.; et al. Dominant Role of Mineral Dust in Cirrus Cloud Formation Revealed by Global-Scale Measurements. Nat. Geosci. 2022, 15, 177–183. [Google Scholar] [CrossRef]
- Adebiyi, A.; Kok, J.F.; Murray, B.J.; Ryder, C.L.; Stuut, J.-B.W.; Kahn, R.A.; Knippertz, P.; Formenti, P.; Mahowald, N.M.; Pérez García-Pando, C.; et al. A Review of Coarse Mineral Dust in the Earth System. Aeolian Research 2023, 60, 100849. [Google Scholar] [CrossRef]
- Nenes, A.; Murray, B.; Bougiatioti, A. Mineral Dust and Its Microphysical Interactions with Clouds. In Mineral Dust; Knippertz, P., Stuut, J.-B.W., Eds.; Springer Netherlands: Dordrecht, 2014; pp. 287–325; ISBN 978-94-017-8977-6. [Google Scholar]
- Karydis, V.A.; Tsimpidi, A.P.; Bacer, S.; Pozzer, A.; Nenes, A.; Lelieveld, J. Global Impact of Mineral Dust on Cloud Droplet Number Concentration. Atmos. Chem. Phys. 2017, 17, 5601–5621. [Google Scholar] [CrossRef]
- Petters, M.D.; Kreidenweis, S.M. A Single Parameter Representation of Hygroscopic Growth and Cloud Condensation Nucleus Activity. Atmos. Chem. Phys. 2007, 7, 1961–1971. [Google Scholar] [CrossRef]
- Reicher, N.; Budke, C.; Eickhoff, L.; Raveh-Rubin, S.; Kaplan-Ashiri, I.; Koop, T.; Rudich, Y. Size-Dependent Ice Nucleation by Airborne Particles during Dust Events in the Eastern Mediterranean. Atmos. Chem. Phys. 2019, 19, 11143–11158. [Google Scholar] [CrossRef]
- Feingold, G.; Cotton, W.R.; Kreidenweis, S.M.; Davis, J.T. The Impact of Giant Cloud Condensation Nuclei on Drizzle Formation in Stratocumulus: Implications for Cloud Radiative Properties. J. Atmos. Sci. 1999, 56, 4100–4117. [Google Scholar] [CrossRef]
- Levin, Z.; Teller, A.; Ganor, E.; Yin, Y. On the Interactions of Mineral Dust, Sea-salt Particles, and Clouds: A Measurement and Modeling Study from the Mediterranean Israeli Dust Experiment Campaign. J. Geophys. Res. 2005, 110, 2005JD005810. [Google Scholar] [CrossRef]
- Jickells, T.D.; An, Z.S.; Andersen, K.K.; Baker, A.R.; Bergametti, G.; Brooks, N.; Cao, J.J.; Boyd, P.W.; Duce, R.A.; Hunter, K.A.; et al. Global Iron Connections Between Desert Dust, Ocean Biogeochemistry, and Climate. Science 2005, 308, 67–71. [Google Scholar] [CrossRef]
- Yu, H.; Chin, M.; Yuan, T.; Bian, H.; Remer, L.A.; Prospero, J.M.; Omar, A.; Winker, D.; Yang, Y.; Zhang, Y.; et al. The Fertilizing Role of African Dust in the Amazon Rainforest: A First Multiyear Assessment Based on Data from Cloud-Aerosol Lidar and Infrared Pathfinder Satellite Observations. Geophysical Research Letters 2015, 42, 1984–1991. [Google Scholar] [CrossRef]
- Van Der Does, M.; Knippertz, P.; Zschenderlein, P.; Giles Harrison, R.; Stuut, J.-B.W. The Mysterious Long-Range Transport of Giant Mineral Dust Particles. Sci. Adv. 2018, 4, eaau2768. [Google Scholar] [CrossRef]
- Weinzierl, B.; Petzold, A.; Esselborn, M.; Wirth, M.; Rasp, K.; Kandler, K.; Schütz, L.; Koepke, P.; Fiebig, M. Airborne Measurements of Dust Layer Properties, Particle Size Distribution and Mixing State of Saharan Dust during SAMUM 2006. Tellus B: Chemical and Physical Meteorology 2009, 61, 96. [Google Scholar] [CrossRef]
- Renard, J.-B.; Dulac, F.; Durand, P.; Bourgeois, Q.; Denjean, C.; Vignelles, D.; Couté, B.; Jeannot, M.; Verdier, N.; Mallet, M. In Situ Measurements of Desert Dust Particles above the Western Mediterranean Sea with the Balloon-Borne Light Optical Aerosol Counter/Sizer (LOAC) during the ChArMEx Campaign of Summer 2013. Atmos. Chem. Phys. 2018, 18, 3677–3699. [Google Scholar] [CrossRef]
- Ryder, C.L.; Highwood, E.J.; Walser, A.; Seibert, P.; Philipp, A.; Weinzierl, B. Coarse and Giant Particles Are Ubiquitous in Saharan Dust Export Regions and Are Radiatively Significant over the Sahara. Atmos. Chem. Phys. 2019, 19, 15353–15376. [Google Scholar] [CrossRef]
- Varga, G.; Dagsson-Waldhauserová, P.; Gresina, F.; Helgadottir, A. Saharan Dust and Giant Quartz Particle Transport towards Iceland. Sci Rep 2021, 11, 11891. [Google Scholar] [CrossRef]
- Adebiyi, A.A.; Kok, J.F. Climate Models Miss Most of the Coarse Dust in the Atmosphere. Sci. Adv. 2020, 6, eaaz9507. [Google Scholar] [CrossRef]
- Drakaki, E.; Amiridis, V.; Tsekeri, A.; Gkikas, A.; Proestakis, E.; Mallios, S.; Solomos, S.; Spyrou, C.; Marinou, E.; Ryder, C.L.; et al. Modeling Coarse and Giant Desert Dust Particles. Atmos. Chem. Phys. 2022, 22, 12727–12748. [Google Scholar] [CrossRef]
- Meng, J.; Huang, Y.; Leung, D.M.; Li, L.; Adebiyi, A.A.; Ryder, C.L.; Mahowald, N.M.; Kok, J.F. Improved Parameterization for the Size Distribution of Emitted Dust Aerosols Reduces Model Underestimation of Super Coarse Dust. Geophysical Research Letters 2022, 49, e2021GL097287. [Google Scholar] [CrossRef] [PubMed]
- Grell, G.A.; Peckham, S.E.; Schmitz, R.; McKeen, S.A.; Frost, G.; Skamarock, W.C.; Eder, B. Fully Coupled “Online” Chemistry within the WRF Model. Atmospheric Environment 2005, 39, 6957–6975. [Google Scholar] [CrossRef]
- Skamarock, W.C.; Klemp, J.B.; Dudhia, J.; Gill, D.O.; Liu, Z.; Berner, J.; Wang, W.; Powers, J.G.; Duda, M.G.; Barker, D.M.; et al. A Description of the Advanced Research WRF Model Version 4. 2021. [Google Scholar] [CrossRef]
- Rood, R.B. Numerical Advection Algorithms and Their Role in Atmospheric Transport and Chemistry Models. Reviews of Geophysics 1987, 25, 71–100. [Google Scholar] [CrossRef]
- Vuolo, M.R.; Menut, L.; Chepfer, H. Impact of Transport Schemes on Modeled Dust Concentrations. Journal of Atmospheric and Oceanic Technology 2009, 26, 1135–1143. [Google Scholar] [CrossRef]
- Ginoux, P. Effects of Nonsphericity on Mineral Dust Modeling. J. Geophys. Res. 2003, 108, 4052. [Google Scholar] [CrossRef]
- Benduhn, F.; Lawrence, M.G. An Investigation of the Role of Sedimentation for Stratospheric Solar Radiation Management. JGR Atmospheres 2013, 118, 7905–7921. [Google Scholar] [CrossRef]
- Li, J.-G. Upstream Nonoscillatory Advection Schemes. Monthly Weather Review 2008, 136, 4709–4729. [Google Scholar] [CrossRef]
- Leonard, B.P. The ULTIMATE Conservative Difference Scheme Applied to Unsteady One-Dimensional Advection. Computer Methods in Applied Mechanics and Engineering 1991, 88, 17–74. [Google Scholar] [CrossRef]
- LeGrand, S.L.; Polashenski, C.; Letcher, T.W.; Creighton, G.A.; Peckham, S.E.; Cetola, J.D. The AFWA Dust Emission Scheme for the GOCART Aerosol Model in WRF-Chem v3.8.1. Geosci. Model Dev. 2019, 12, 131–166. [Google Scholar] [CrossRef]
Figure 1.
Description of the vertical levels based on the Arakawa C-Grid of WRF-L (& WRF-Chem). The “mass grid” where the dust concentration is solved is denoted with the “x” symbol and the defined ‘gost’ levels for the setting of the boundary conditions, in grey.
Figure 1.
Description of the vertical levels based on the Arakawa C-Grid of WRF-L (& WRF-Chem). The “mass grid” where the dust concentration is solved is denoted with the “x” symbol and the defined ‘gost’ levels for the setting of the boundary conditions, in grey.
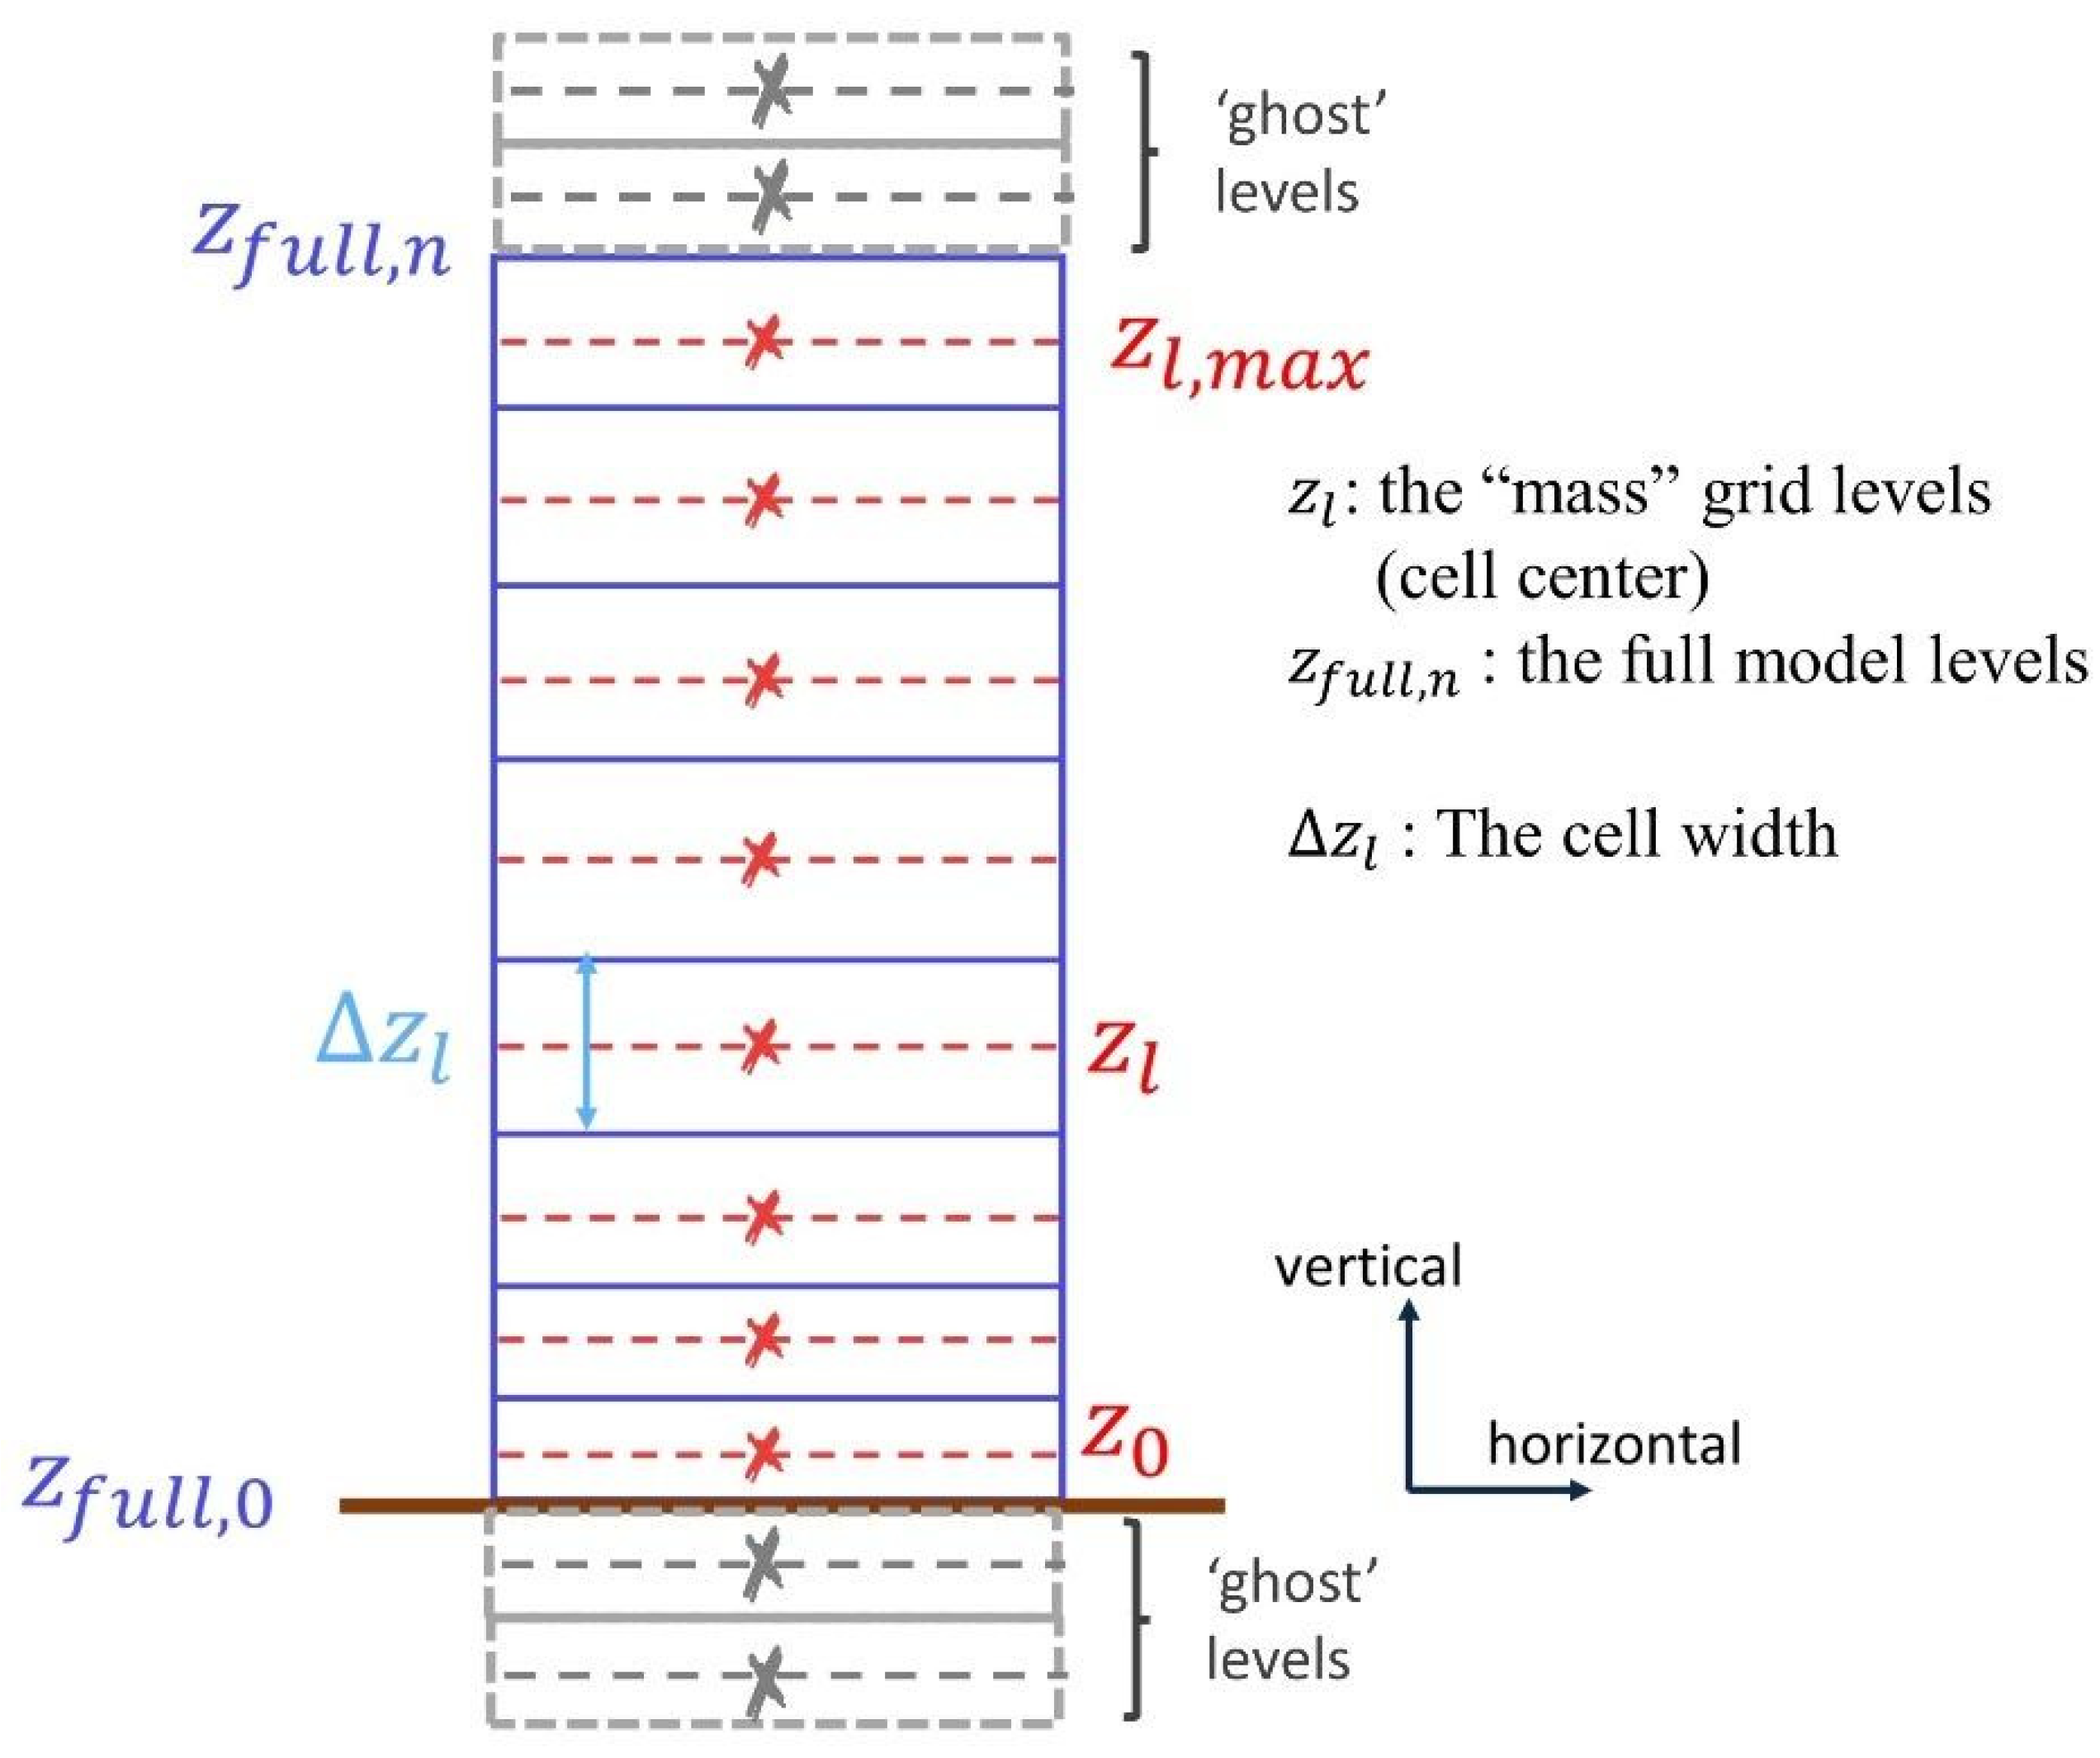
Figure 2.
SkewT-LogP diagram for the meteorological conditions used for the initialization of the 2-D WRF-L experiments. Only the zonal circulation is taken, based on the average wind speed and direction, of the area of Cabo Verde calculated from Final Analysis (FNL) Operational Global Analysis data, at 1°×1° grid, for the years 2014-2018.
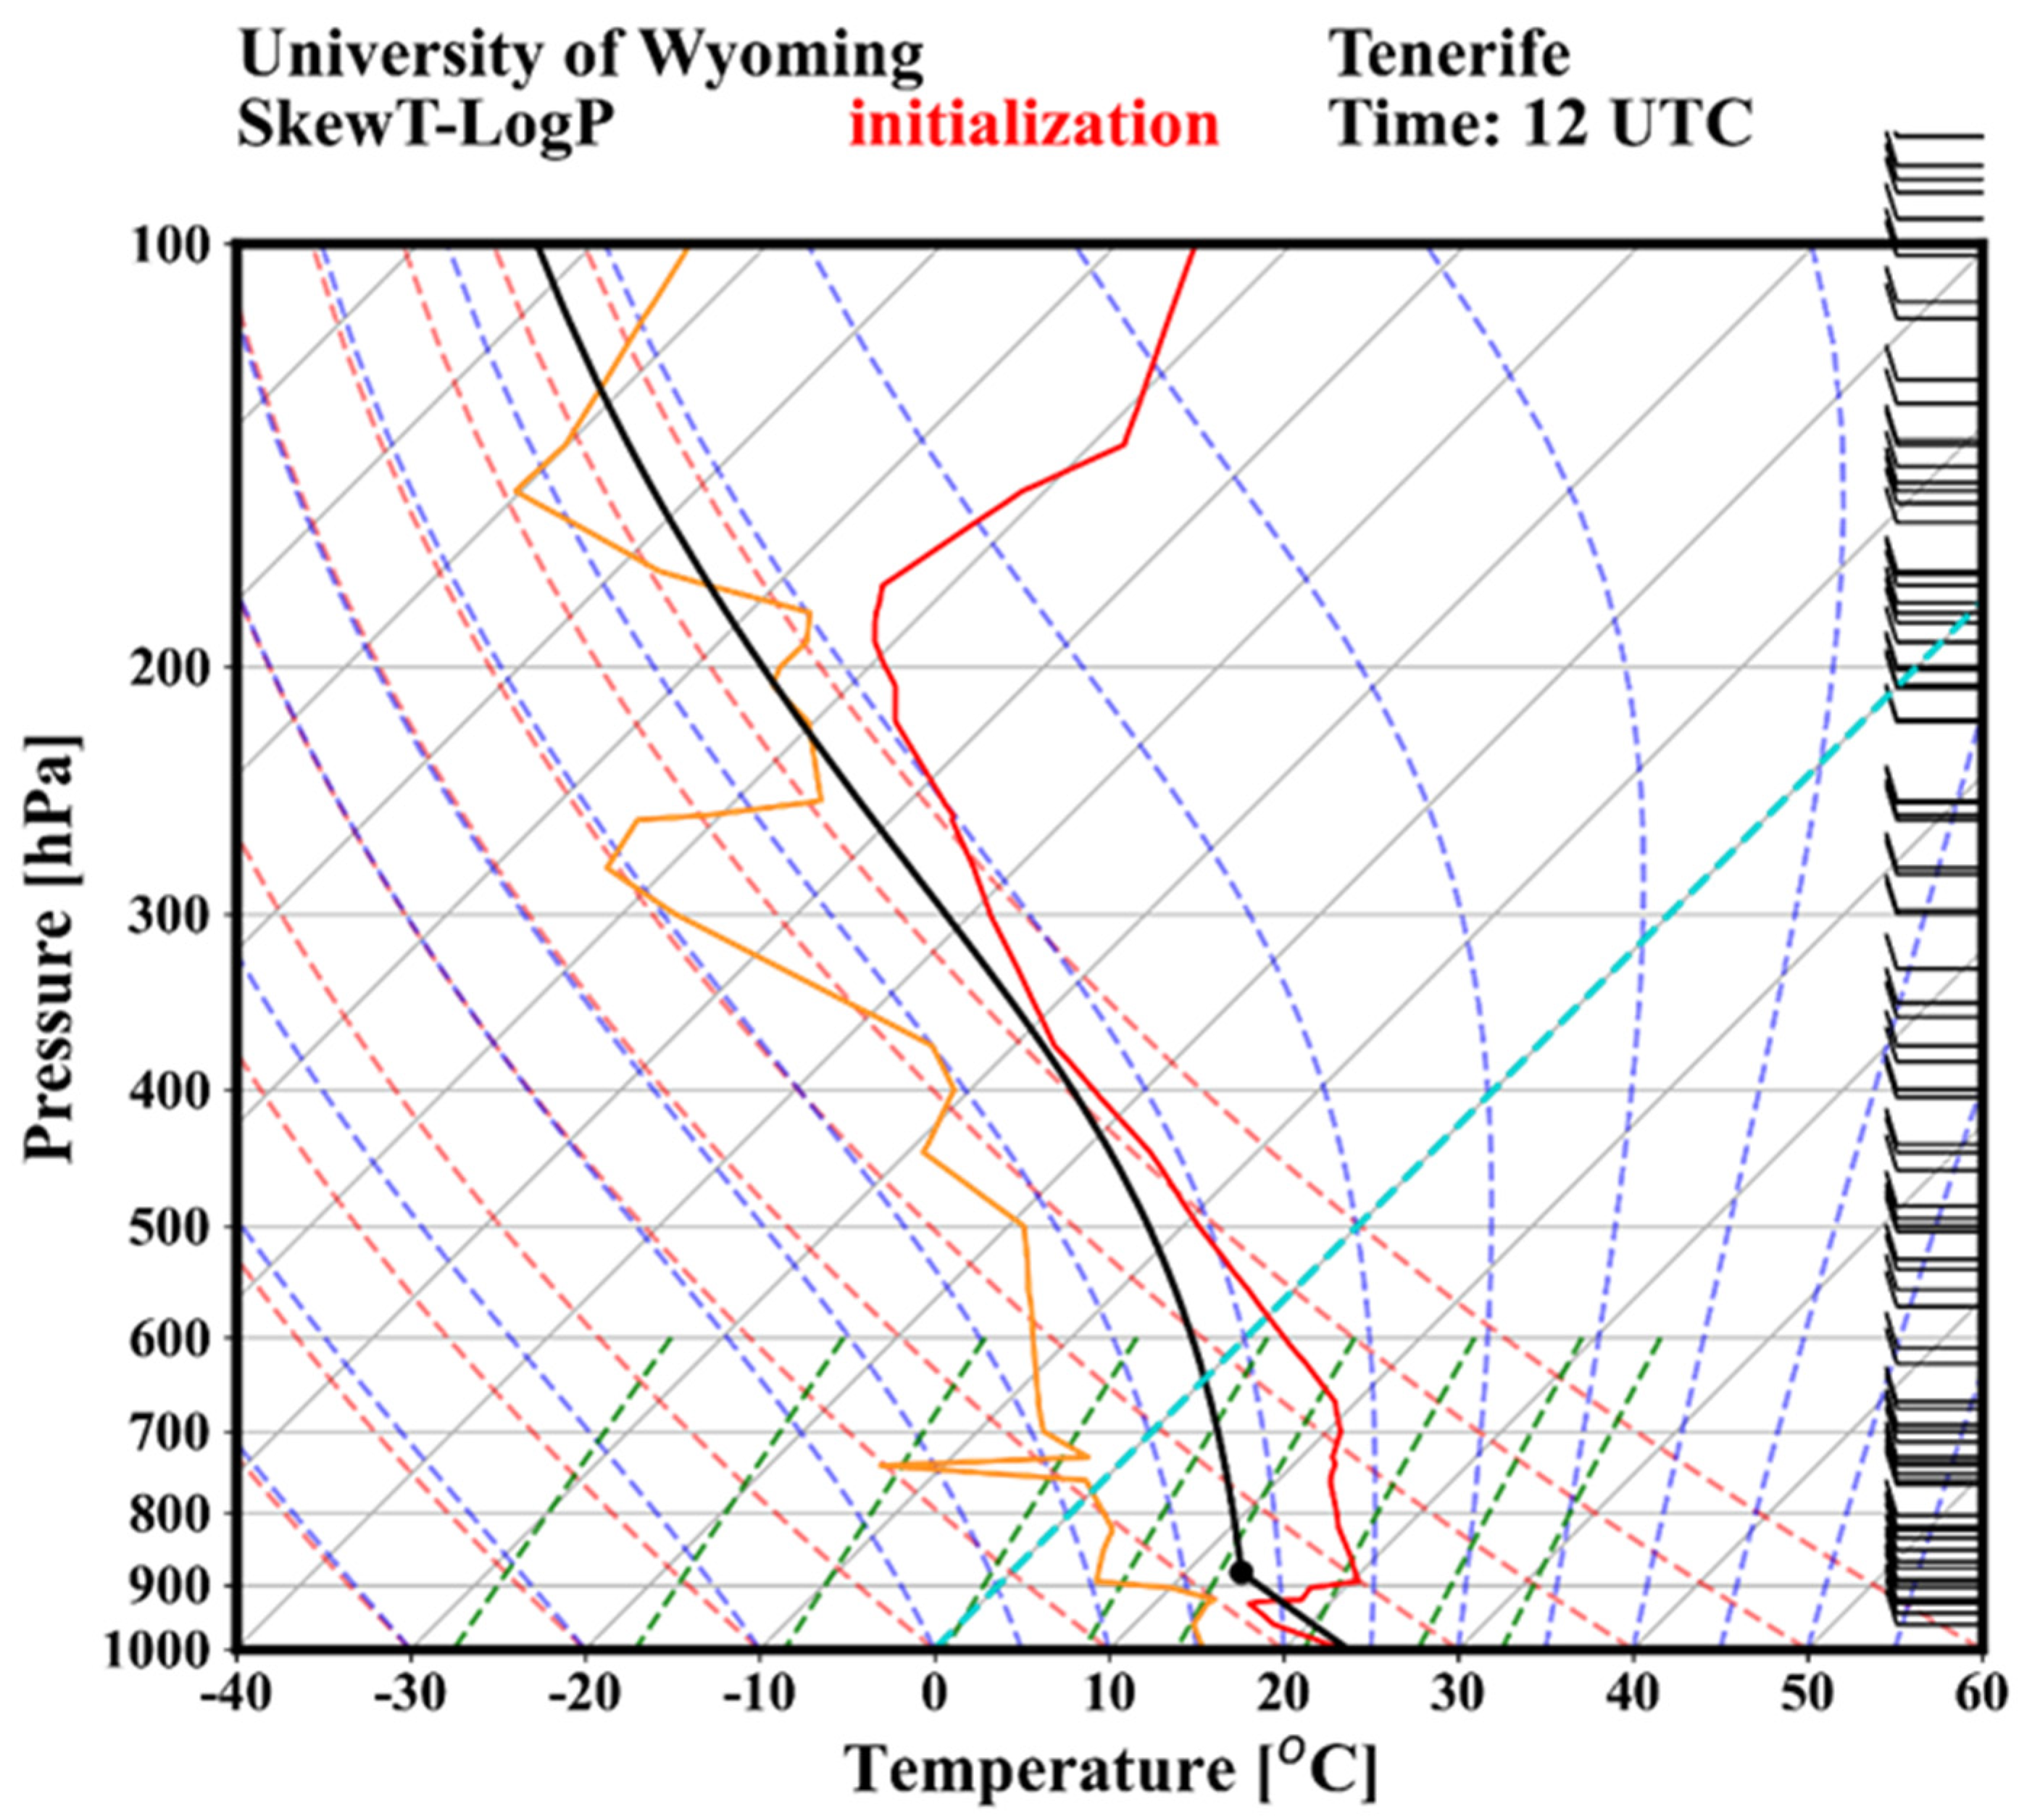
Figure 3.
In (a), (c), (e), (g) and (i) we present the comparison of the time evolution of the dust mixing ratio using the UNO3 and the UPWIND schemes, in 30, 60, 120 and 240 vertical levels model configuration, respectively. In (b), (d), (f), (h) and (j) the time evolution of the relative differences of the mixing ratio simulated between UPWIND and UNO3 is shown, for the different configurations. (a), (b) correspond to model size bin1: D = 0.2-2.0 μm, (c), (d) to bin2: D = 2.0-5.5 μm, (e), (f) to bin3: D = 5.5-17.0 μm, (g), (h) to bin4: D = 17.0-40.0 μm, and (i), (g) to bin5: D = 40.0-100.0 μm).
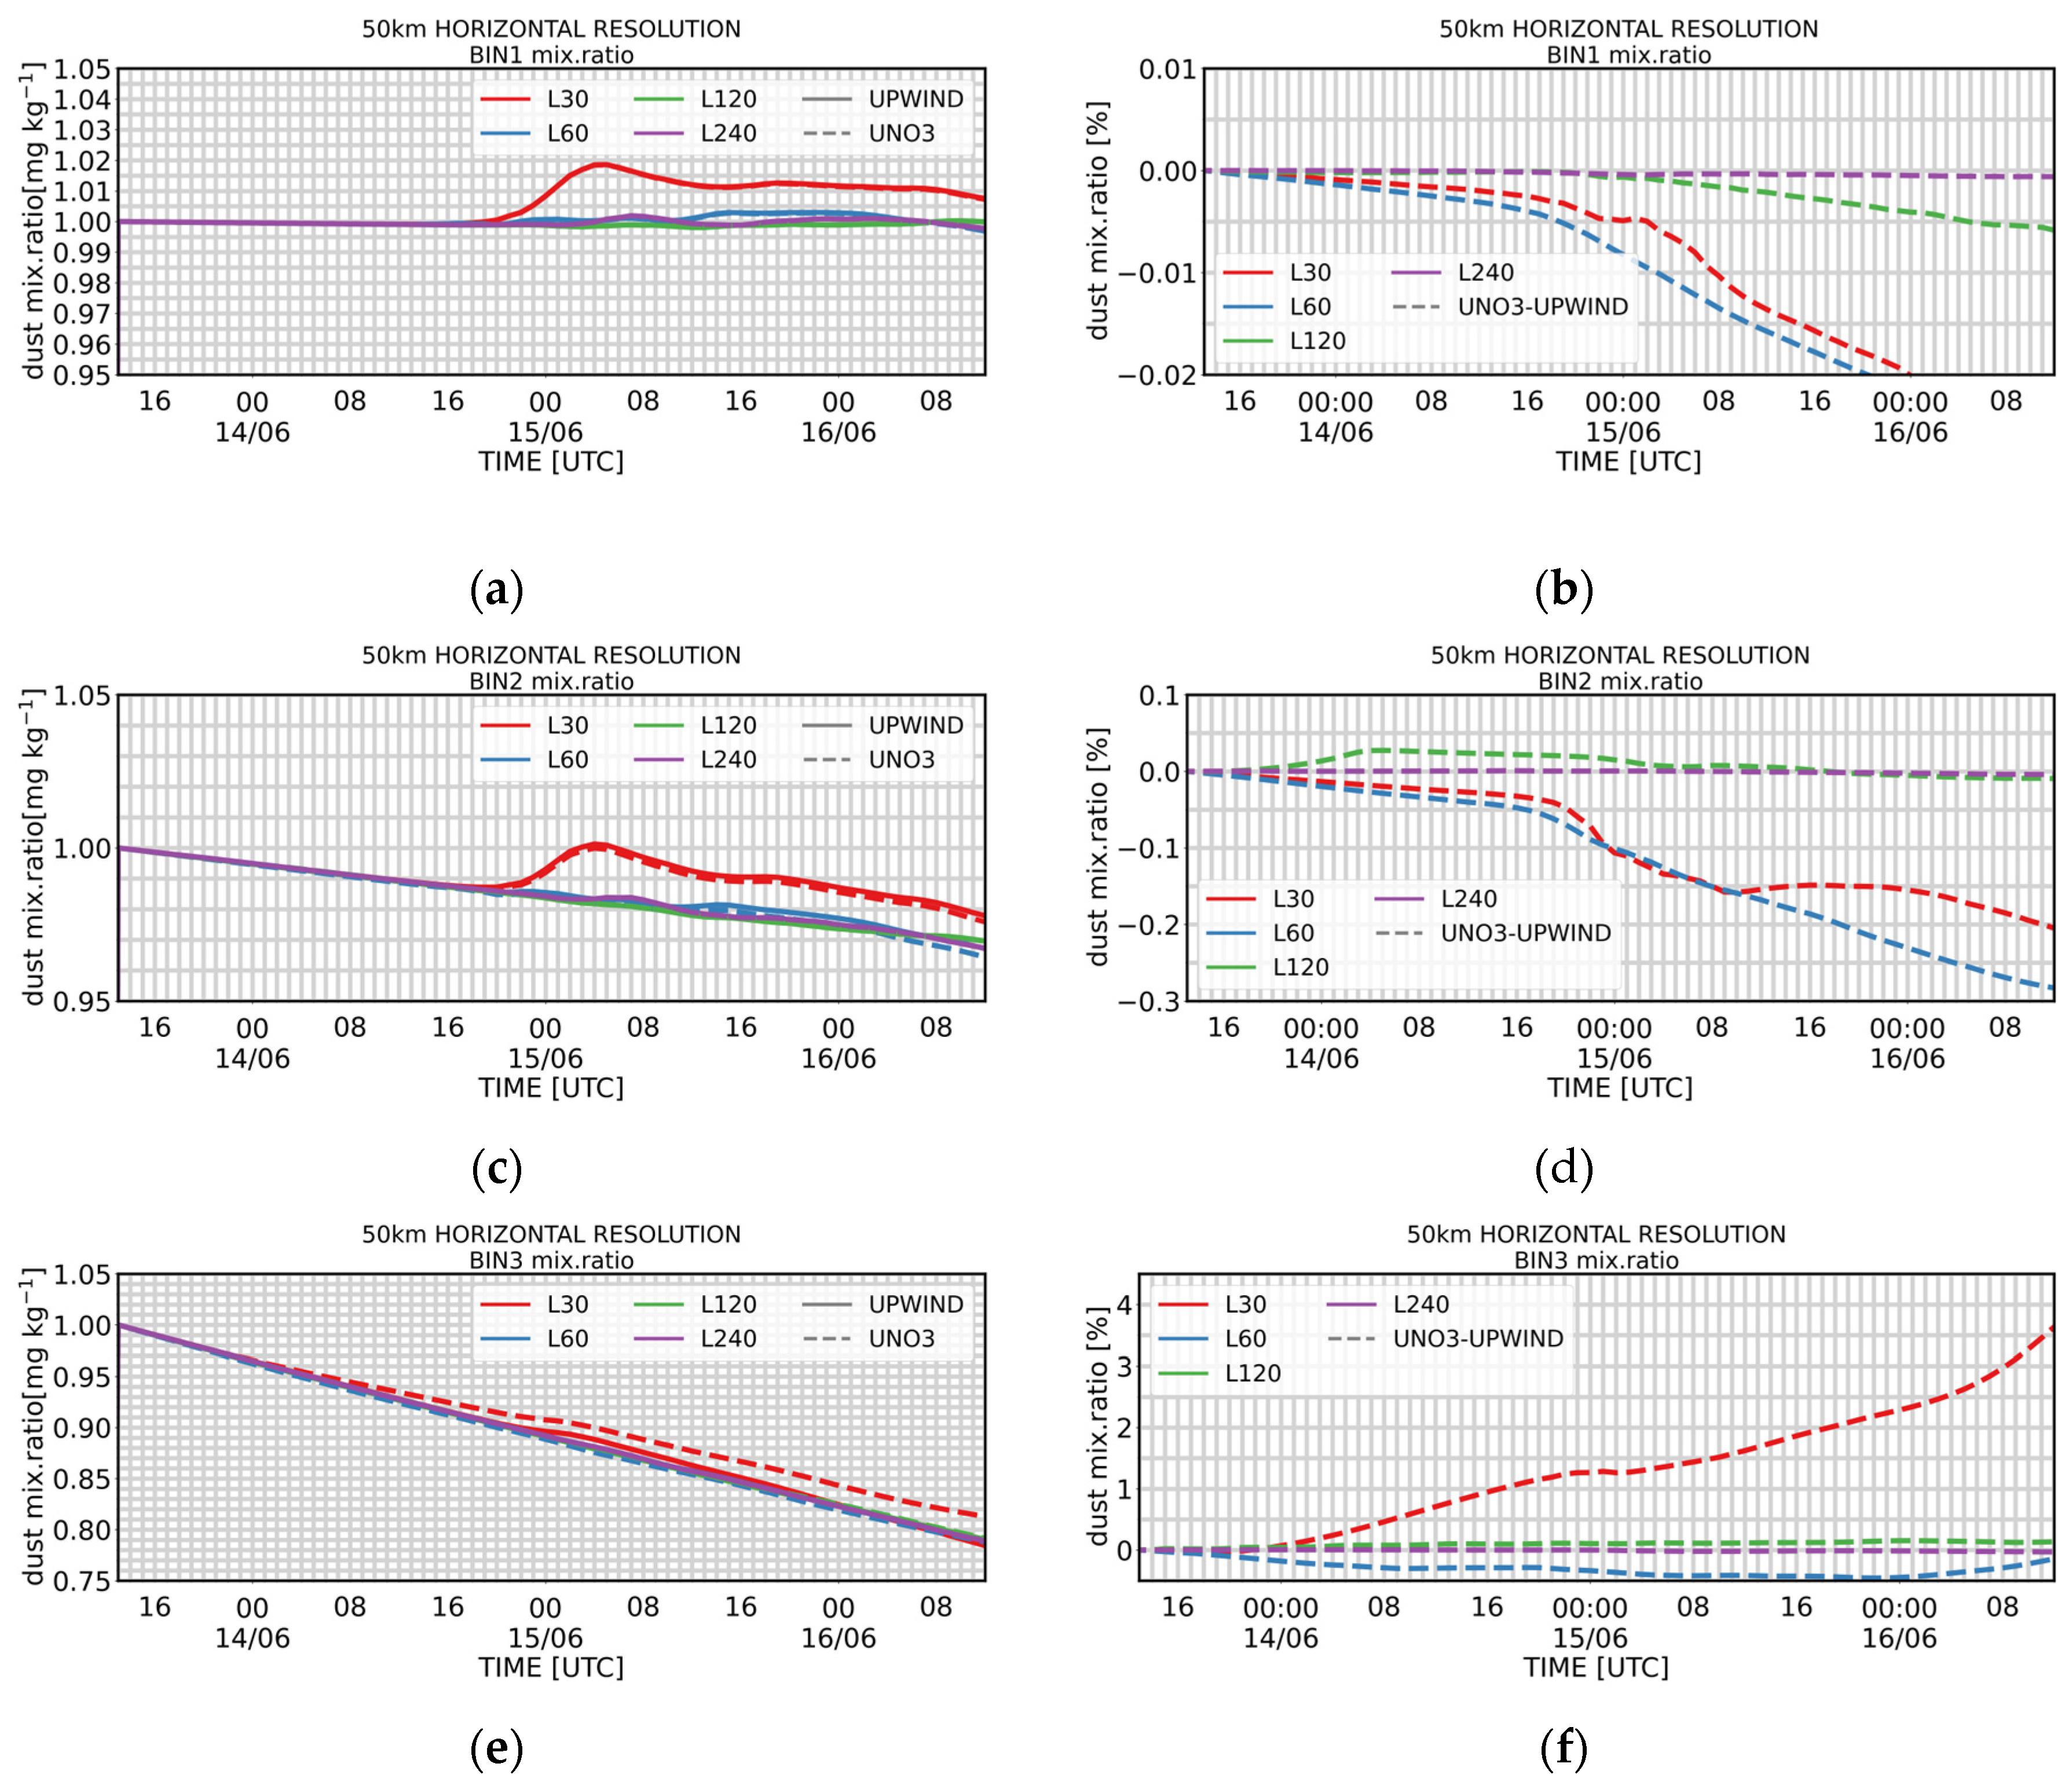
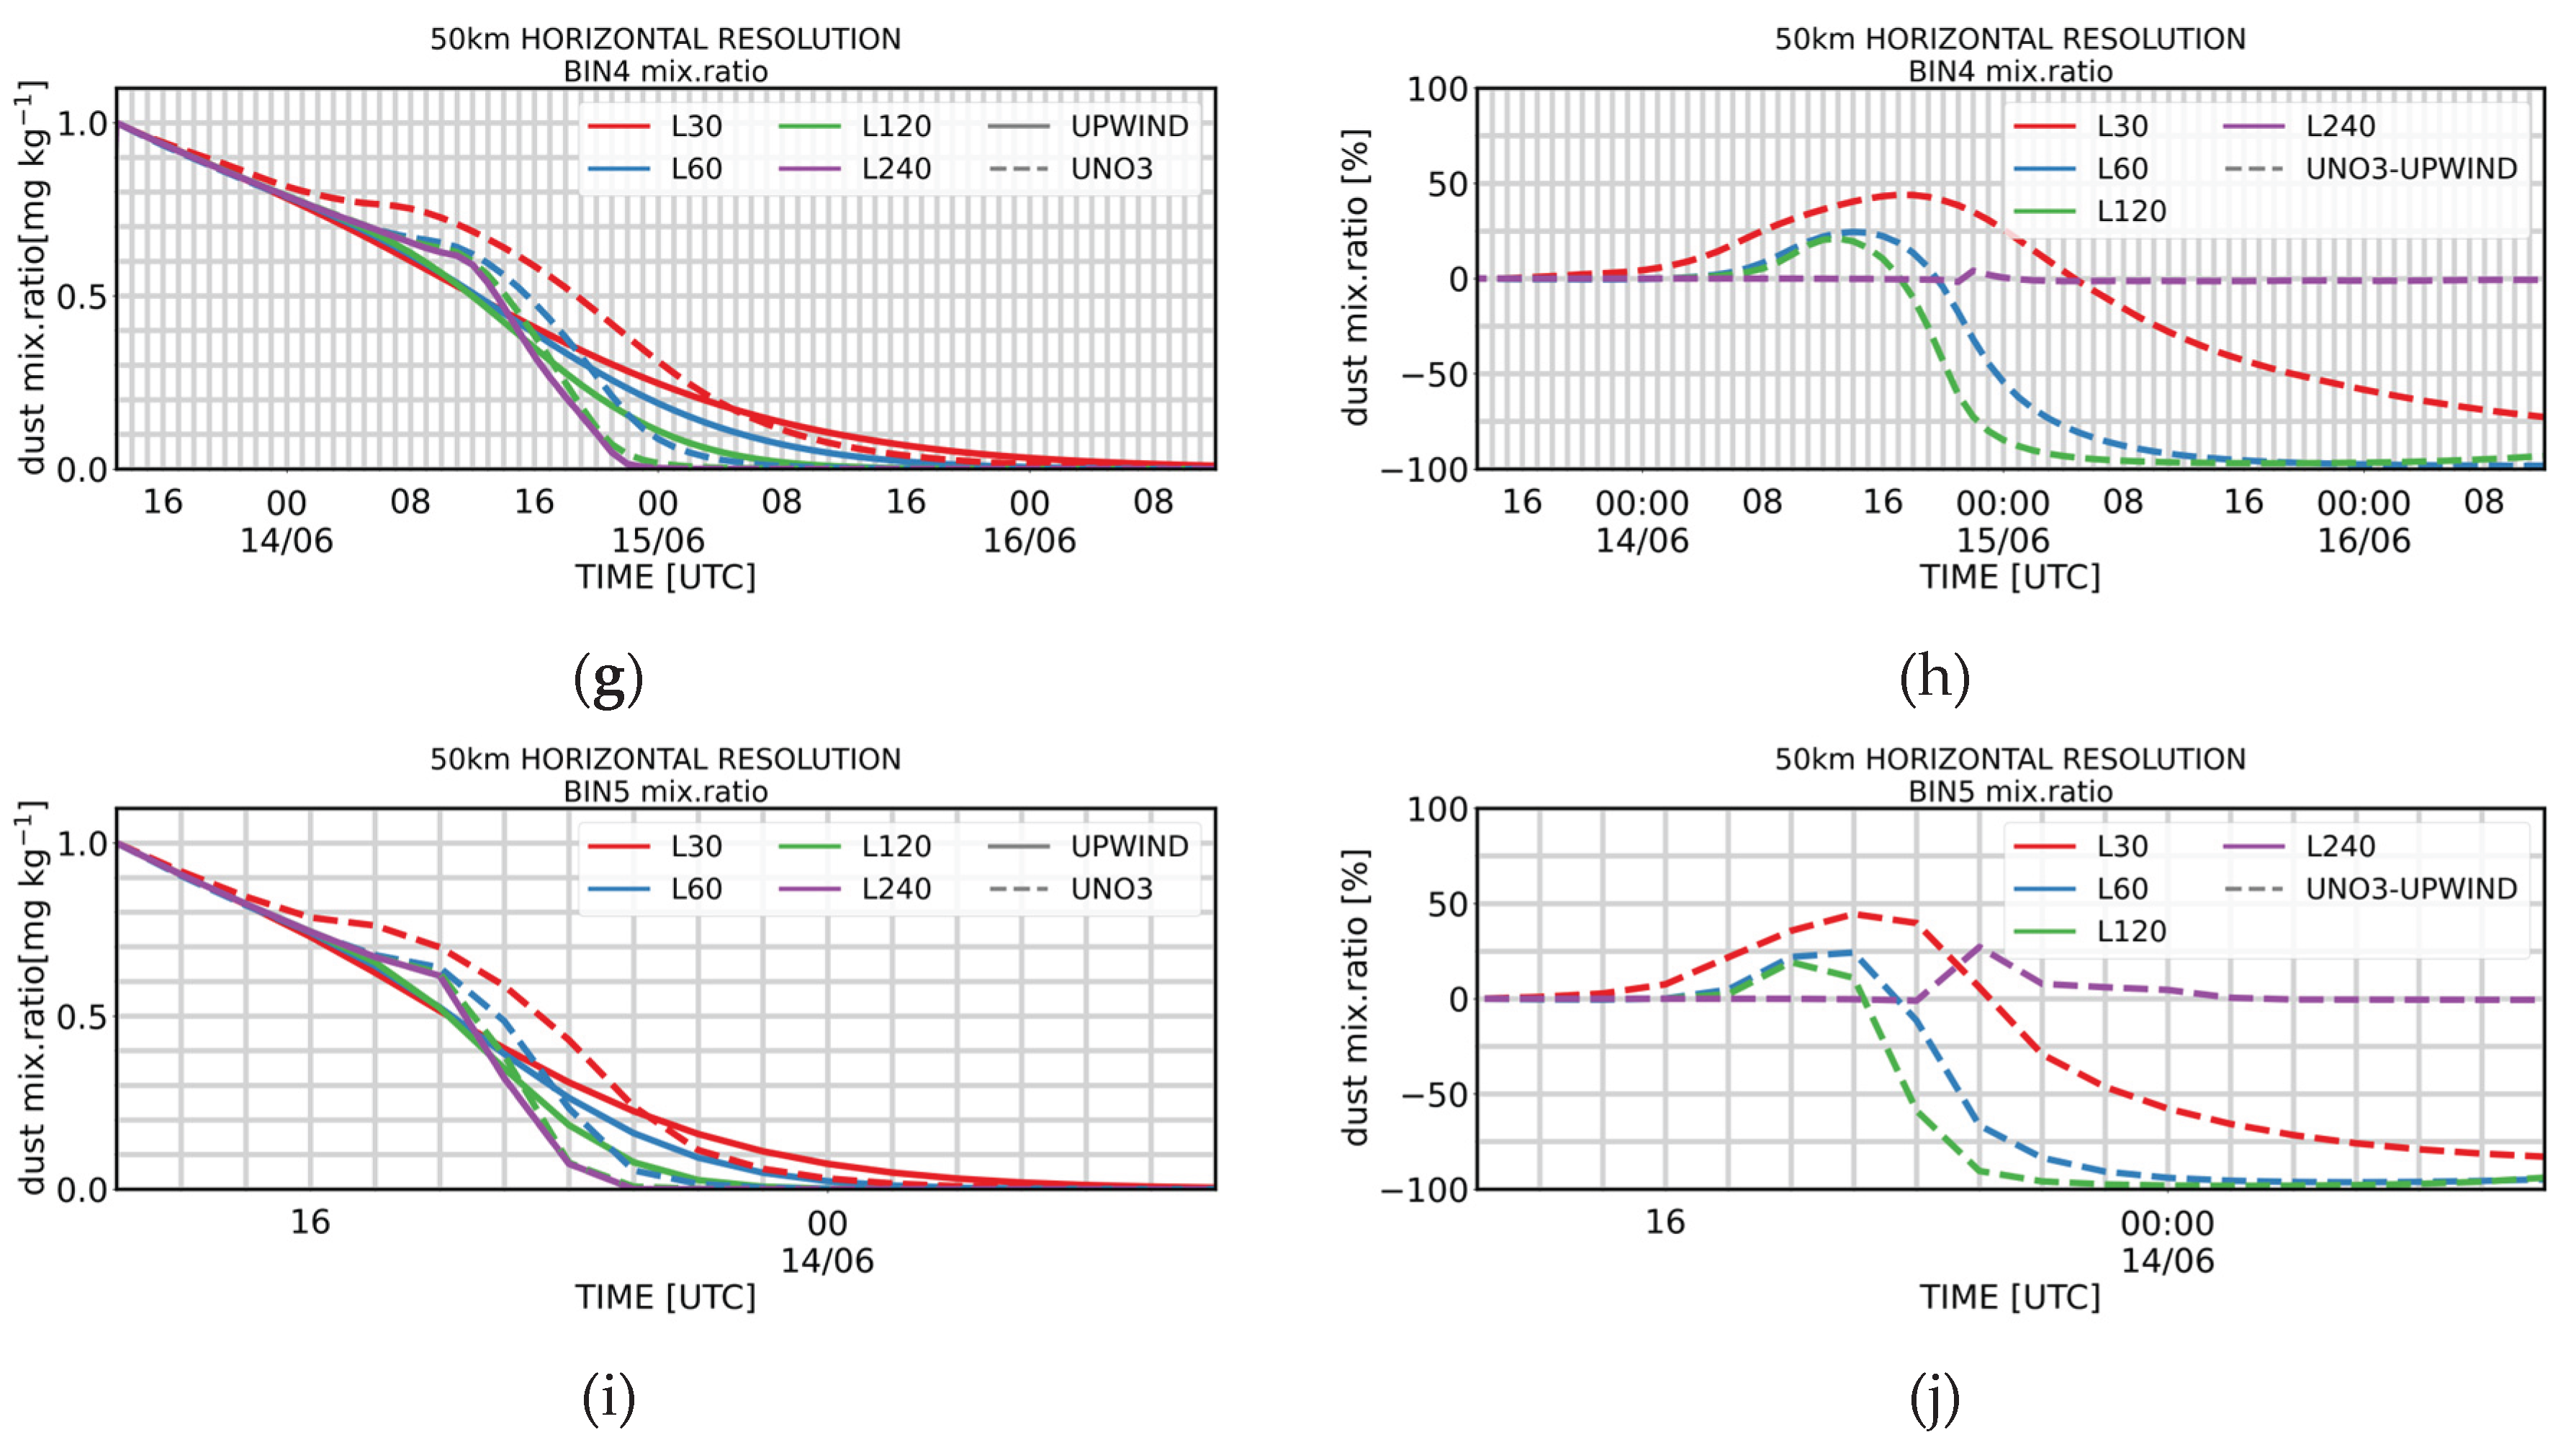
Figure 4.
The spatial distribution of the temporal mean dust load of June, July, August and September 2022 is presented for the experiments using the (a) UPWIND and (c) UNO3 schemes. In (b) and (d) the absolute and relative differences, respectively, between the simulated dust load using the UNO3 scheme and those using the UPWIND scheme are presented.
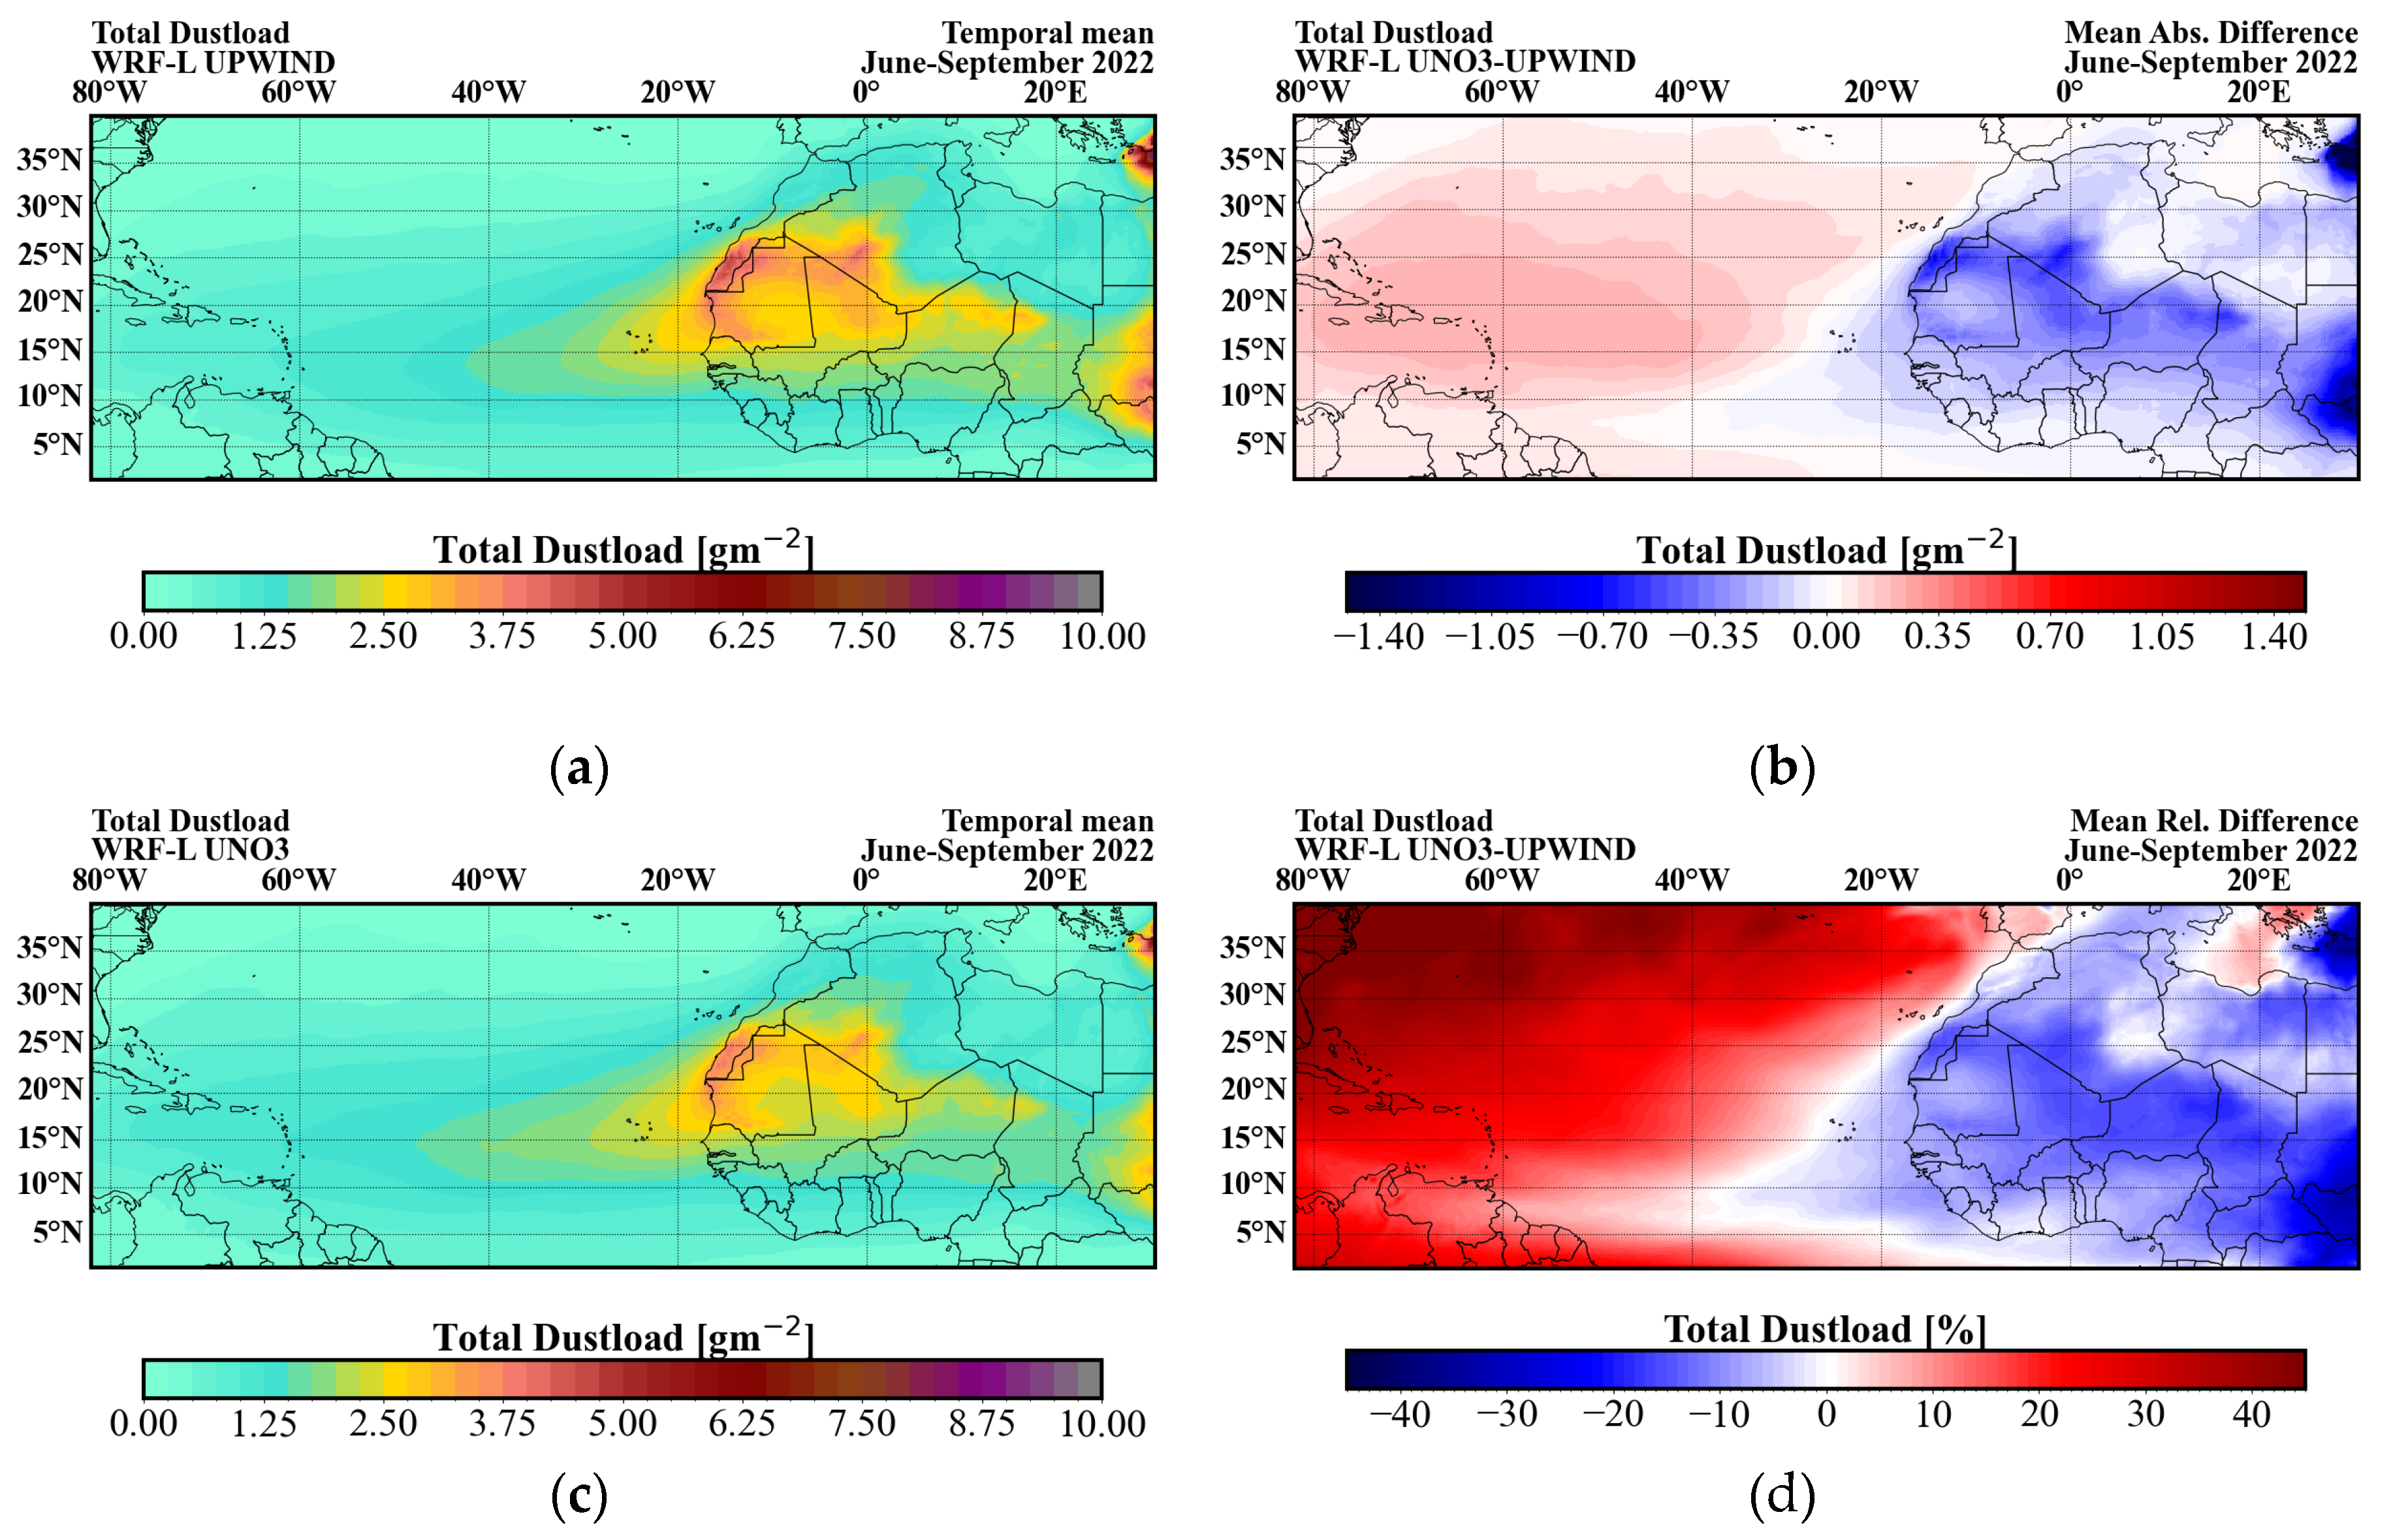
Figure 5.
The spatial distribution of the temporal mean near-surface dust concentration of June, July, August and September 2022 is presented for the experiments using the (a) UPWIND and (b) UNO3 schemes. In (c) and (d) the absolute and relative differences, respectively, between the simulated near-surface dust concentration using the UNO3 scheme and those using the UPWIND scheme are presented.
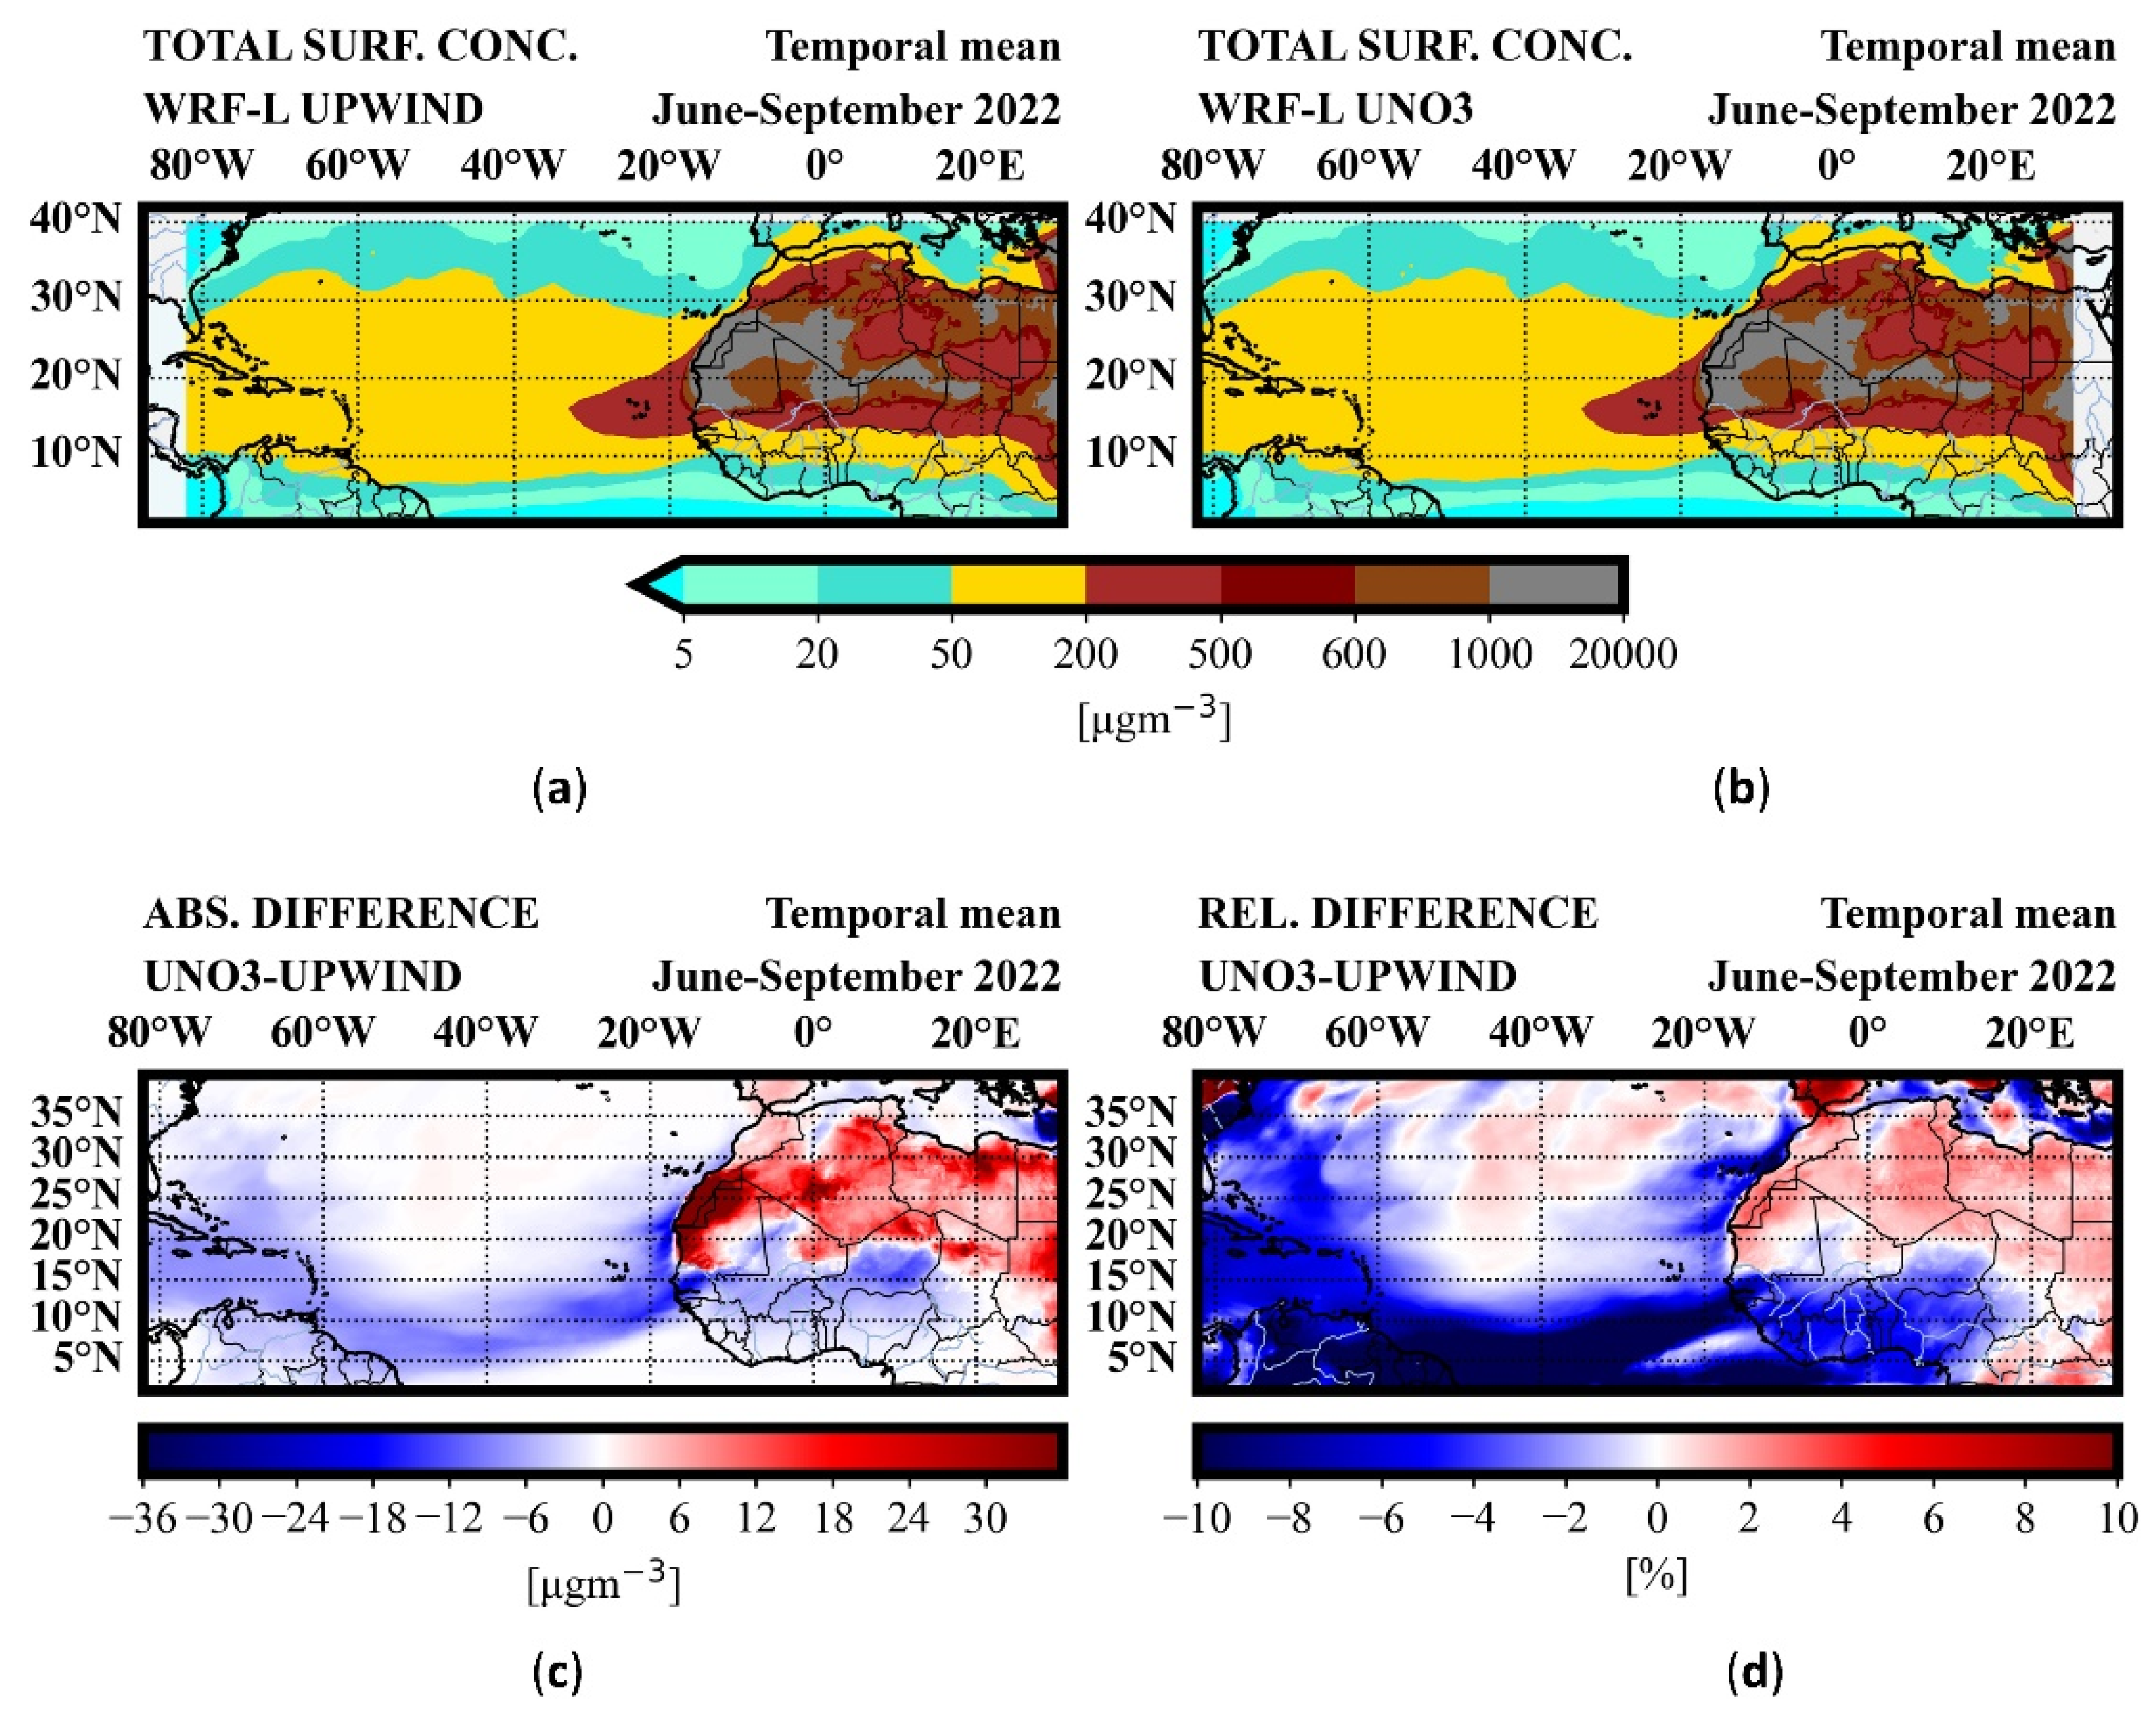
Figure 6.
The mean dustload ratio of the coarse dust particles (bin 3 and 4) and the finer dust particles (bins 1, 2and 3) (C2F) for June, July, August and September 2022 is presented for the experiments using the UPWIND (a) and UNO3 schemes (b). The absolute and relative differences, respectively, between the simulated dust load C2F ratio using the UNO3 scheme and that using the UPWIND scheme are presented (c) and (d).
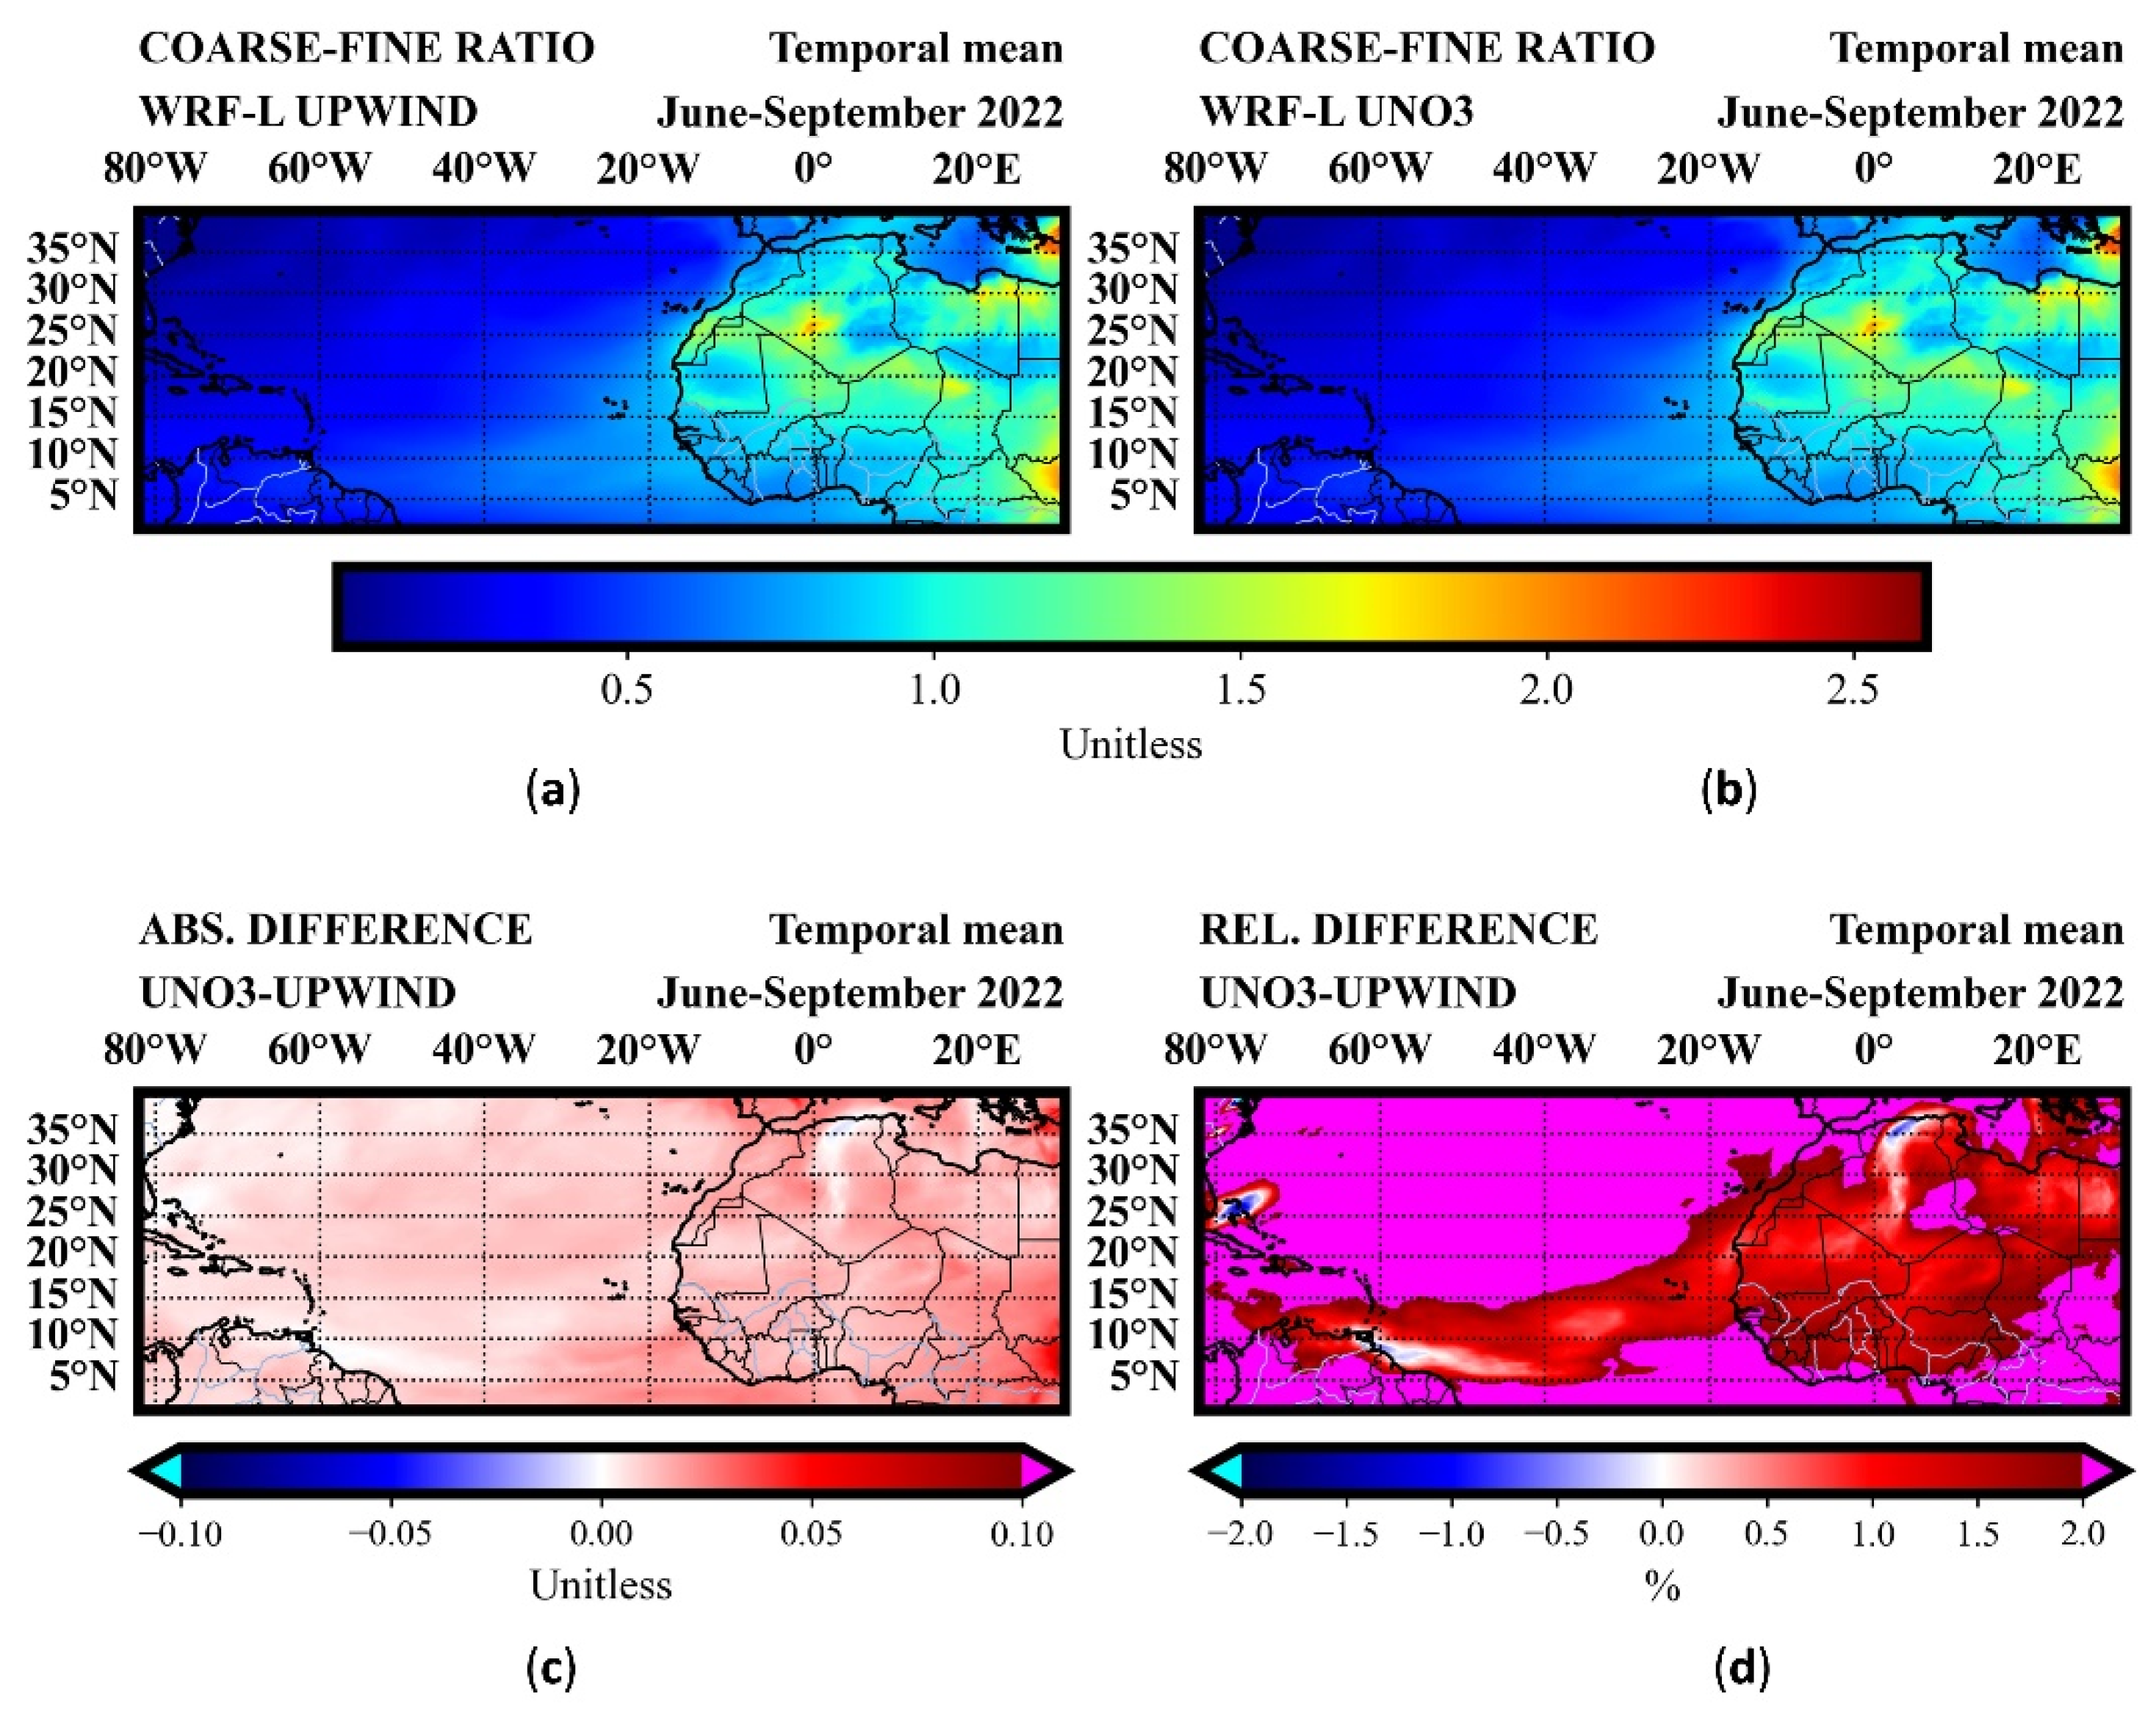
Table 1.
2-D Experimental runs that were performed in this study.
| 2-D Experiments |
Horizontal resolution Δx (km) |
Vertical resolution±z′ (km) |
Numerical scheme for gravitational settling |
| UPWIND_L30 | 50km | 1.058±0.187 | UPWIND_WRF |
| UPWIND_L60 | 50km | 0.516±0.086 | UPWIND_WRF |
| UPWIND_L120 | 50km | 0.258±0.046 | UPWIND_WRF |
| UPWIND_L240 | 50km | 0.129±0.023 | UPWIND_WRF |
| UNO3_L30 | 50km | 1.058±0.187 | UNO3 |
| UNO3_L60 | 50km | 0.516±0.086 | UNO3 |
| UNO3_L120 | 50km | 0.258±0.046 | UNO3 |
| UNO3_L240 | 50km | 0.129±0.023 | UNO3 |
Table 2.
Domain resolution and size for the WRF-L/2D tests. The vertical resolution varies with height and surface pressure thus representative median value and the mean value with its standard deviation are presented.
Table 2.
Domain resolution and size for the WRF-L/2D tests. The vertical resolution varies with height and surface pressure thus representative median value and the mean value with its standard deviation are presented.
| # of horizontal grid points in the x-direction | Lx*(km) | Δx (km) |
Δz (km) median |
±z′ (km) | Lz* (km) | # of Vertical Levels |
| 91 | 5050 | 50 | 1.005 | 1.058±0.187 | 30 | 30 |
| 91 | 5050 | 50 | 0.496 | 0.516±0.086 | 30 | 60 |
| 91 | 5050 | 50 | 0.246 | 0.258±0.046 | 30 | 120 |
| 91 | 5050 | 50 | 0.122 | 0.129±0.023 | 30 | 240 |
* Lx, Lz are the total horizontal and vertical dimensions of the domain in km.
Table 3.
Approximate level heights of the 3-D WRF-L experiments.
| Model levels | Heights (km) | Δz (km) |
| 1 | 0 | - |
| 2 | 0.05 | 0.05 |
| 3 | 0.1139 | 0.0639 |
| 4 | 0.1952 | 0.0813 |
| 5 | 0.298 | 0.1028 |
| 6 | 0.4272 | 0.1291 |
| 7 | 0.5878 | 0.1607 |
| 8 | 0.7855 | 0.1977 |
| 9 | 1.0256 | 0.24 |
| 10 | 1.3126 | 0.287 |
| 11 | 1.6496 | 0.337 |
| 12 | 2.0377 | 0.3882 |
| 13 | 2.4756 | 0.4379 |
| 14 | 2.9593 | 0.4837 |
| 15 | 3.4851 | 0.5258 |
| 16 | 4.0561 | 0.5709 |
| 17 | 4.675 | 0.6189 |
| 18 | 5.3449 | 0.6698 |
| 19 | 6.0684 | 0.7235 |
| 20 | 6.8482 | 0.7798 |
| 21 | 7.6865 | 0.8383 |
| 22 | 8.5850 | 0.8985 |
| 23 | 9.5449 | 0.9599 |
| 24 | 10.5662 | 1.0213 |
| 25 | 11.6479 | 1.0817 |
| 26 | 12.7033 | 1.0554 |
| 27 | 13.7271 | 1.0237 |
| 28 | 14.7508 | 1.0237 |
| 29 | 15.7746 | 1.0237 |
| 30 | 16.7983 | 1.0237 |
| 31 | 17.8221 | 1.0237 |
| 32 | 18.8458 | 1.0237 |
| 33 | 19.8696 | 1.0237 |
Table 4.
Configuration parameters of the 3-D WRF-L runs.
| Parameterisation | Reference | Namelist variable | Namelist option |
| Surface model | Noah (Tewari et al., 2004) | sf_surface_physics | 2 |
| Surface layer | Monin–Obukov–Janjic (or Eta Similarity Scheme) (Janić, 2001; Janjić, 1994; Monin and Obukhov, 1954) | sf_sfclay_physics | 2 |
| Radiation (SW & LW) | RRTMG (Iacono et al., 2008) | ra_sw(lw)_physics | 4 |
| Microphysics | Morrison two-moment (Morrison et al., 2005) | mp_physics | 10 |
| Cumulus | Grell-3 (Grell, 1993; Grell and Dévényi, 2002) | cu_physics | 5 |
| Boundary layer | MYNN 2.5 (Nakanishi and Niino, 2006; Olson et al., 2019) | bl_pbl_physics | 5 |
| Chemistry | GOCART simple (Chin et al., 2002; Ginoux et al., 2001) | chem_opt | 300 |
| Dust scheme | AFWA (LeGrand et al., 2019) | dust_opt | 3 |
Table 5.
3-D Experimental runs that were performed in this study.
| 3-D Experiments |
Horizontal resolution Δx (km) |
# of vertical levels |
Numerical scheme for gravitational settling |
Simulation Period |
| UPWIND_ASKOS | 15kmx15km | 33 | 1st order UPWIND (Default) | 01/06-30/09/2022 |
| UNO3_ASKOS | 15kmx15km | 33 | UNO3 | 01/06-30/09-2022 |
Disclaimer/Publisher’s Note: The statements, opinions and data contained in all publications are solely those of the individual author(s) and contributor(s) and not of MDPI and/or the editor(s). MDPI and/or the editor(s) disclaim responsibility for any injury to people or property resulting from any ideas, methods, instructions or products referred to in the content. |
© 2025 by the authors. Licensee MDPI, Basel, Switzerland. This article is an open access article distributed under the terms and conditions of the Creative Commons Attribution (CC BY) license (http://creativecommons.org/licenses/by/4.0/).
Copyright: This open access article is published under a Creative Commons CC BY 4.0 license, which permit the free download, distribution, and reuse, provided that the author and preprint are cited in any reuse.


