
Submitted:
06 August 2025
Posted:
08 August 2025
You are already at the latest version
Abstract
Chromosomal instability (CIN) arising from mitotic errors is a hallmark of cancer progression. Hepatoma Upregulated Protein (HURP), a microtubule-associated protein essential for spindle assembly, is frequently overexpressed in aggressive cancers. Here, we investigated HURP's role in breast cancer progression using a cell line model of increasing metastatic potential: immortalized MCF10A, low-metastatic T47D, and highly metastatic MDA-MB-231 cells. Elevated HURP expression was observed in cancer cells, with MDA-MB-231 showing the highest levels. Paradoxically, spindle-bound HURP was reduced in MDA-MB-231 cells despite increased total protein, suggesting cytoplasmic mislocalization. HURP silencing induced cell line-specific effects: moderate spindle defects in MCF10A and T47D cells, but severe abnormalities, apoptosis, and G2/M arrest in MDA-MB-231 cells. Mechanistically, HURP depletion perturbed spindle-bound NuMA, TPX2, and Aurora-A levels, implicating HURP in mitotic regulation and metastatic behavior. HURP silencing also impaired collective migration and converted MDA-MB-231 cells from super-diffusive to sub-diffusive motility, while having minimal effects on less aggressive cell lines. These findings establish HURP as a multifunctional regulator coordinating mitotic fidelity, migration plasticity, and tissue architecture in breast cancer, with pronounced effects in highly metastatic cells, positioning it as a promising therapeutic target for aggressive breast cancers.
Keywords:
HURP
; TPX2
; Aurora-A
; NuMA
; breast cancer
; mitosis
; spindle angle
; spindle architecture
; metastatic behavior
1. Introduction
Breast cancer (BC) remains the most frequently diagnosed cancer and the leading cause of cancer-related mortality in women, according to Global cancer statistics 2022 [1]. Despite advances in early detection and treatment, the prognosis for patients with highly metastatic breast cancer remains poor, underscoring the need to identify molecular mechanisms and therapeutic targets that drive tumor progression and dissemination [2].
A hallmark of cancer progression is Chromosomal instability (CIN), characterized by an increased rate of chromosome missegregation, often arising from mitotic errors [3]. Several mitotic aberrations such as multipolar spindles, inefficient chromosome congression and bi-orientation, as well as defective mitotic checkpoints contribute to CIN [4]. The mitotic spindle is a dynamic microtubule-based structure whose assembly and function are orchestrated by a network of microtubule-associated and regulatory proteins [5,6,7]. Among these, Hepatoma Upregulated Protein (HURP) has emerged as a critical player in spindle formation, chromosome congression, and mitotic progression [8,9,10]. We have recently shown that HURP forms a Ran-GTP-dependent complex including TPX2 and Aurora A, in mammalian cells during mitosis [11]. HURP is frequently overexpressed in aggressive cancers, including breast cancer, and its elevated levels have been associated with increased proliferation, invasion, and poor prognosis [12,13,14,15,16,17,18,19].
Proper spindle assembly and orientation also depend on the coordinated actions of several other Ran-regulated spindle assembly factors (SAFs). Targeting Protein for Xenopus kinesin-like protein 2 (TPX2) is a microtubule-associated protein that regulates spindle assembly and activates the mitotic kinase Aurora-A [20,21,22,23]. Aurora-A kinase, in turn, is required for bipolar spindle formation and accurate chromosome segregation, and its dysregulation has been linked to tumor progression and enhanced cell migration in breast cancer [24]. Nuclear Mitotic Apparatus protein (NuMA) is essential for spindle pole focusing and maintaining spindle integrity during mitosis [25,26,27,28,29]. NuMA is also essential for correct spindle positioning during mitosis [27,29]. Spindle orientation is very important for proper positioning of daughter cells after division and, thus, for tissue organization [30]. Errors during spindle assembly can lead to misoriented spindles [31]. Although misorientation alone hasn’t been reported as tumorigenic, it can promote CIN, tissue disorganization and metastasis [30]. Therefore, aberrant expression or localization of these proteins can disrupt spindle dynamics, leading to chromosomal instability, altered cell cycle progression, and increased metastatic potential.
In this study, we employ a model of breast cell lines representing a metastatic gradient: non-transformed MCF10A, low-metastatic T47D, and highly metastatic MDA-MB-231-to systematically investigate the role of HURP and its interplay with TPX2, Aurora-A and NuMA in mitotic spindle organization, cell cycle regulation, migration, and three-dimensional tumor architecture. By dissecting how perturbation of this spindle-associated protein network affects cell behavior across different stages of malignancy, we aim to elucidate new mechanisms underlying breast cancer progression and identify potential targets for therapeutic intervention.
2. Materials and Methods
2.1. Cell Culture and Synchronization Conditions
MCF10A immortalized human breast epithelial cells were cultured in DMEM/F12 medium (PAN-Biotech, Aidenbach, Germany) supplemented with 5% horse serum (Lonza, Basel, Switzerland), 20ng/ml epidermal growth factor (Sigma-Aldrich, St. Louis, MO), 0.5μg/ml hydrocortisone (Sigma-Aldrich), 100ng/ml cholera toxin (Sigma-Aldrich), and 10μg/ml insulin (Sigma-Aldrich), 100U/ml penicillin and 100μg/ml streptomycin (Lonza). T47D and MDA-MB-231 breast cancer cell lines were maintained in RPMI-1640 medium (Biosera, Nuaillé, France) supplemented with 10% fetal bovine serum (PAN-Biotech), 2mM L-glutamine (Lonza), 100U/ml penicillin, and 100μg/ml streptomycin (Lonza). All cell lines were incubated at 37°C in a humidified atmosphere containing 5% CO₂. Cell lines were authenticated by short tandem repeat profiling and tested negative for mycoplasma contamination.
For metaphase synchronization, cells were treated with 50ng/ml Nocodazole (Sigma-Aldrich) for 6 hours and, after thorough washing with PBS (1-3 times), cells were released in growth medium containing 10μg/ml MG132 (Calbiochem) for 2 hours.
2.2. siRNA Transfection and HURP Silencing
Cells were transfected with either control non-targeting siRNA (5’-UUCUCCGAACGUGUCACGUTT-3’) (Eurofins Genomics) or with 50nM of HURP-specific siRNA (5’-TGACTCGATCAGCTACTCA-3’) (Eurofins Genomics) using JetPRIME transfection reagent (Polyplus) according to the manufacturer's instructions. Briefly, cells were seeded at 60-70% confluence in antibiotic-free medium 24 hours prior to transfection. Transfection efficiency was assessed 48 hours post-transfection by western blot analysis.
2.3. Protein Extraction and Western Blot Analysis
Mitotic extracts were obtained by treating cells with nocodazole (100ng/ml) for 16 hours, followed by mechanical shake-off of rounded mitotic cells. Total protein extracts were prepared by lysing cells in RIPA buffer (50mM Tris-HCl pH 8, 150mM NaCl, 1% NP-40, 50mM sodium orthovanadate, 10mM sodium fluoride, 0.1% v/v NP-40, 1mM PMSF) supplemented with protease inhibitor cocktail (Roche, Basel, Switzerland) for 30min at 4°C, followed by centrifugation at 17,900g for 30min at 4°C.
Protein concentrations were determined using the Bradford assay (Bio-Rad, Hercules, CA, USA). Equal amounts of proteins (20μg) were separated by SDS-Polyacrylamide gradient gels (6-12%) and transferred to nitrocellulose membranes. Membranes were incubated with primary antibodies against HURP (1:1000; rabbit polyclonal antiserum DHL5) [8] and against α-tubulin (1:1000; mouse monoclonal antibody Santa-Cruz biotechnology) overnight at 4°C. Membranes were washed with PBS/0.5% v/v Tween-20 (Sigma) pH 7.4 and probed with the appropriate rabbit anti-mouse IgG H&L (HRP), (1:20000; Abcam, Cambridge, UK) and goat anti-rabbit IgG H&L (HRP), (1:20000; Abcam, Cambridge, UK) secondary antibodies for 1h at 4°C. Relative protein expression was quantified using Image Lab (Bio-Rad, Hercules, CA, USA).
2.4. Cell Cycle analysis by Flow Cytometry
Cells were fixed in 70% ice-cold ethanol for 1hr at 4°C, centrifuged at 800g for 5min at 4°C, washed twice with ice-cold PBS pH 7.4, treated with 100μg/ml RNase A (Thermo Fisher Scientific, Waltham-Massachusetts, USA) to remove RNA, and stained with 50μg/ml Propidium Iodide (Invitrogen, Waltham-Massachusetts, USA) in PBS pH 7.4 for 40min in the dark at RT. Flow cytometry was performed with an 8-color fluorescence-activated cell sorting (FACS) CantoII flow cytometer (BD Biosciences, Franklin Lakes, NJ, USA) and the BD FACSDiva™ software was used for data acquisition. A minimum of 10,000 events were collected for each condition. Data were processed using FlowJo V10 software (BD Biosciences).
2.5. Immunofluorescence Microscopy
Cells were grown on No. 1.5 glass coverslips or ibidi μ-slide 8 well plates (Ibidi GmbH, Gräfelfing, Germany), fixed in 4% paraformaldehyde/PHEM (60mM PIPES, 25mM HEPES, 10mM EGTA, 2mM MgCl2) pH 6.9 for 12min and permeabilized in PBS/0.1% v/v Triton X-100 pH 7.4 for 5min at room temperature (RT). Fixed samples were blocked in PBS/5% w/v BSA pH 7.4 for 20min at RT and incubated with primary antibodies against HURP (1:200; chicken polyclonal antibody, Abcam, Cambridge, UK, or rabbit polyclonal DHL5 [8]), NuMA (1:200; rabbit monoclonal antibody, Abcam, Cambridge, UK), Aurora-A (1:1000; mouse monoclonal antibody, BD Transduction Laboratories, NULL, USA), TPX2 (1:100; rabbit polyclonal antibody, Atlas antibodies, Stockholm, Sweden), α-tubulin (1:1000; mouse monoclonal antibody, Santa Cruz Biotechnology or, 1:200; rabbit polyclonal antibody Proteintech, Rosemont-Illinois, USA) overnight at 4°C. Cells were washed with PBS pH 7.4, incubated with the appropriate CF®488A, CF®568 or CF®640R secondary antibodies (1:1000; Biotium, Fremont, CA, USA) for 30min at 4°C. DNA was counterstained with Hoechst (10μg/ml; Life Technologies). Following immunostaining, coverslips were mounted in Mowiol 4-88 mounting medium (Applichem).
Imaging was performed on a customized Andor Revolution Spinning Disk Confocal system (Yokogawa CSU-X1; Yokogawa, Tokyo, Japan) built around an Olympus IX81 (Olympus Shinjuku, Tokyo, Japan) with 60x 1.42NA oil lens (UPlanXApo; Olympus Shinjuku, Tokyo, Japan) and a digital camera (Andor Zyla 4.2 sCMOS; Andor Technology Ltd., Belfast, Northern Ireland) (CIBIT-Bioimaging Facility, MBG-DUTH). The system was controlled by Andor IQ3.6.5 software (Andor Technology). Images were acquired as z-stacks with selected optical sections every 0.5 or 1μm, through the entire cell volume, according to experimental needs.
2.6. Image and Spindle Analysis
Image analysis was performed using ImageJ (National Institute of Health, USA) and MATLAB (The MathWorks, Inc. Natick MA, USA), for which image-processing macros were developed. All immunofluorescence images presented here are the maximum intensity projection of z-stacks, without background subtraction. The mean fluorescence intensities on the metaphase spindle of HURP, NuMA, TPX2 and Aurora-A were measured by drawing an ellipse enclosing the spindle in the channel corresponding to tubulin. Background was subtracted by using a fixed size cycle drawn out of the cell where mean fluorescence intensity values were measured. For all the proteins of interest, fluorescence intensity plots (%) presented here, are normalized against tubulin intensity.
Pole-to-pole intensity plot profiles were measured by drawing a line of a width of 60 pixels (3μm) in the tubulin channel. HURP full width at half maximum and half spindle lengths were measured in the plot profiles. Briefly, the middle of the metaphase spindle was determined by fitting a Gaussian curve on the plot profile corresponding to DNA. Half spindle lengths were determined as the left and right pole-to-middle distances, respectively. The points with the highest HURP intensity in left and right half-spindles, were used as reference to measure the widths at half maximum (FWHM) (see Figure S1B). For protein distribution analysis, the Area Under Curve (AUC) was quantified in the normalized plot profile of each spindle. To average plot profiles from multiple spindles, the plot profile of each spindle was normalized and rescaled using GraphPad Prism 8.0 (GraphPad Software, La Jolla California USA) to account for differences in spindle length.
For spindle orientation analysis, the (x, y, z) coordinates of each pole were measured in the channel corresponding to tubulin. The angle of metaphase spindle relative to the growth surface was measured using the equation [32], where, represents the distance of the poles in the z-axis and represents the distance of poles in the z-projected image. Spindle long axis length is represented as the 3-dimensional distance of poles (see Figure S1C). Only bipolar spindles were included in the analysis. To measure the architecture features of spindles, the Spindle3D [33] plug-in in ImageJ was used.
In order to quantify the spindle organization, mitotic spindles were classified in 2 categories: normal and abnormal. Spindles which were characterized by symmetry, well-organized microtubules, as well as aligned and congressed chromosomes on the metaphase plate, were defined as normal. On the other hand, abnormal spindles were subdivided into 2 extra categories: misaligned and multipolar. Spindles which were characterized by asymmetry, as well as misaligned and uncondensed chromosomes, were defined as misaligned. Lastly, spindles with poorly-organized microtubules having three or more poles and uncondensed chromosomes, were defined as multipolar.
2.7. Scratch Wound Healing Assays
Cell migration was assessed using scratch wound healing assays performed in the presence or absence of mitomycin-C (10μg/ml for 2 hours prior to imaging, Cayman Chemical, USA) to distinguish migration from proliferation. Confluent monolayers in ibidi μ-slide 8 well plates (Ibidi GmbH, Gräfelfing, Germany) were scratched using sterile pipette tips, washed with PBS pH 7.4, and monitored with a 10min time interval between frames, for a total of 108 frames (18 hours). Imaging was performed on a customized Andor Revolution Spinning Disk Confocal system (Yokogawa CSU-X1; Yokogawa, Tokyo, Japan) built around an Olympus IX81 (Olympus Shinjuku, Tokyo, Japan) with 10x 0.3NA air lens (UPlanFL N; Olympus Shinjuku, Tokyo, Japan) and a digital camera (Andor Ixon Ultra 897 EMCCD; Andor Technology Ltd., Belfast, Northern Ireland), inside a humidified, environmental chamber at 37°C with 5% CO2 (CIBIT-Bioimaging Facility, MBG-DUTH), using the phase contrast mode of the microscope.
ImageJ and the Trainable Weka Segmentation plug-in [34] were used to train and then apply a 2-class classifier in the series. Pixels in each frame of the time-series were classified either as foreground (cells) or as background (scratch gap). Classified time-series then loaded in MATLAB for post-processing. Initially, each frame was processed to close gaps and correct classification artifacts, and the area corresponding to the gap was measured. To measure the “Front Velocity” we modeled the gap as a box with an area equal to Assuming that the gap is much longer than the field of view, i.e. cells do not enter the gap area from below or above the gap, the remains constant and only the changes over time. Therefore, we have:
Moreover, assuming that the two cell-fronts have the same we get:
Finally, combining eq.1 and eq.2 we get:
where V represents the “Front Velocity”.
To determine we fitted the gap area measurements within an interval of an hour (6 frames) with a linear model (). The slope of the line is equal to: . Therefore, using eq.3 we measured the average “Front Velocity” within intervals of 1 hour.
2.8. Single-Cell Tracking and Migration Analysis
For single-cell tracking assay, cells were seeded in ibidi μ-slide 8 well plates (Ibidi GmbH, Gräfelfing, Germany). Twenty-four hours before imaging, the growth medium was replaced with fresh medium containing 1μΜ SiR-DNA (Spirochrome, Stein am Rhein, CH) and incubated overnight. Live imaging was performed on a customized Andor Revolution Spinning Disk Confocal system (Yokogawa CSU-X1; Yokogawa, Tokyo, Japan). Cells were monitored with a 10min time interval between frames, for a total of 108 frames (18 hours), using 638nm laser.
Single-cell tracking was performed using the TrackMate plugin [35,36] in ImageJ. Briefly, the LoG detector was used to identify individual cells with sigma size of 20μm, 13μm and 14μm for MCF10A, T47D and MDA-MB-231 respectively. Quality threshold was set to 8 for all cell lines. For frame-to-frame linking, a max distance of 10μm was set, with a maximum gap of 2 frames and a maximum gap distance of 20μm. For detecting cell divisions, the object splitting option was utilized, with a maximum splitting distance of 12μm, and the maximum intensity difference between splitting cells as a penalty feature. The TrackSheme tool was then used to correct and complete tracks. The whole track as well as edge features were exported for further statistical analysis. Only tracks with a duration greater than 940min were used and presented.
Square displacement was calculated using a custom-build MATLAB script utilizing the TrackMate’s “importTrackMateTracks” function and the equation: , where and represent the position coordinates at time and , respectively. The mean square displacement (MSD) was calculated by averaging across all cells. MSD over time was plotted on a log-log scale and fitted with an exponential: , where exponent α represents the slope of the line. Values of α < 1, α = 1, and α > 1 indicate sub-diffusive, diffusive, and super-diffusive motion, respectively [37,38].
2.9. MDA-MB-231 Spheroid Formation
MDA-MB-231 cells were plated on a 6-well plate (30006, SPL, Korea) and cultured in two dimensions (40,000 cells per well). When 30% confluence was reached, RNA transfection (50nM siRNA duplexes) was performed, according to manufacturer’s instructions (jetPRIME® Versatile DNA/siRNA transfection reagent, 101000015, Polyplus®, France) and cells were incubated for 6 hours (5% CO2, 95% humidity, 37°C). Cells were detached from their growing surface via trypsinization (5min at 37°C) and centrifuged at 500g for 5min. Cell density was calculated, and cell suspensions were prepared, so that in each well 1,000 cells were seeded in 50μl RNA-containing medium. Cells were seeded onto a Nunclon™ Sphera™ 96-Well, U-Shaped-Bottom Microplate (Thermo Scientific™, USA) and centrifuged for 10min at 200g. After centrifugation, 50μl of rBM (Matrigel)-containing medium were added, so that each well contains 2% matrix (Matrigel® Matrix, Corning®, USA). After centrifugation for 10min at 500g, plates were placed in the incubator (5% CO2, 95% humidity, 37°C), in order to enable spheroid formation. Spheroids were harvested 48 hours later and transferred into U-bottom 2ml Eppendorf tubes.
2.10. 2D Spheroid Imaging and Analysis
Spheroids were imaged using a conventional phase contrast microscope (Oxion Inverso, Euromex, Netherlands) equipped with 4x objective (LPlan 4x/0.13; Euromex, Netherlands) and CMOS camera (CMEX-3 Pro; Euromex, Netherlands) at day 2. To quantify the two-dimensional geometric features of spheroids, the CATS plug-in [39] in ImageJ was used to segment spheroids from background, by first training and then applying, a 2-class pixel-based classifier. Binary masks then imported into MATALB for processing and extracting the geometric properties of spheroids (as shown in Figure 7).
2.11. Spheroid Immunofluorescence
Fixation was performed in 4% paraformaldehyde/PHEM (60mM PIPES, 25mM HEPES, 10mM EGTA, 2mM MgCl2) (Applichem, Germany) pH 6.9 for 10min, permeabilization in 0.3% Triton X-100 (TR0444, Scharlau, Spain) in PBS 1x pH 7.4 for 15min, and blocking in “blocking buffer” containing 0.2% Triton X-100 and 5% BSA (P06-139310, PAN-Biotech, Germany) in PBS 1x for 1hr at RT. Incubation with primary antibodies against HURP (1:1000, rabbit polyclonal DHL5 [8]), and tubulin (1:1000 mouse monoclonal antibody, Santa Cruz Biotechnology, USA) was performed in blocking buffer at 37°C overnight. Incubation with secondary antibodies (1:1000 CF488A goat anti-mouse IgG (H+L) [Biotium], 1:1000 CF640R donkey anti-rabbit IgG (H+L) [Biotium]) and DNA dye (1:1000 SPY555-DNA [SC201, Spirochrome]) was performed in blocking buffer at 37°C overnight. Spheroids were stored at 4°C in PBS 1x until imaging. Prior imaging, spheroids were mounted in 1% low melting agarose (732893, FMC, USA) in PBS 1x and then aspirated into Fluorinated Ethylene Propylene (FEP) tubes (Fluorotherm™, USA).
2.12. Single Plane Illumination Microscopy (SPIM) Imaging and 3D Spheroid Analysis
MDA-MB-231 spheroids were imaged in three-dimensions using a Single Plane Illumination Microscope (Ultramicroscope II - Miltenyi Biotec, Germany). Samples were illuminated by both sides using only the central light sheets. The thickness of each light sheet was set to 2w =7.53μm. Fluorophore excitation was achieved by 488nm, 561nm or 640nm laser lines. Fluorescence detection was performed utilizing an 16x (0.8NA) water dipping objective (Nikon Instruments Inc, Amstelveen, Netherlands), emission filters (525/20, 620/60, 680/30), a zoom body with 2x post-magnification resulting in total magnification of 28.8x and an Andor Neo 5.5 sCMOS camera with a pixel size of 6.5μm (Andor Technology, Belfast, UK). Agarose-embedded spheroids were extruded from the FEP tube and placed in a custom 3D-printed holder which allows sample rotation. Spheroids were placed in the imaging cuvette filled with PBS 1x and imaged with a z-step of 1μm. Image acquisition was performed via the ImSpectorPro software (Version 7.1.15) (Miltenyi Biotec, Germany. Each spheroid was imaged in two rotational views (00 and 1800). Rotation was performed using a step motor (ROHS 28BYJ-48) driven by an Arduino UNO.
Fusion of the rotational views was performed in the Huygens software (Scientific Volume Imaging – Hilversum, The Netherlands). Briefly, each rotational view was first deconvolved and then fused using the light sheet fuser tool.
Intensity based threshold was set to create spheroids’ masks and extract geometrical features. Initial masks were further processed with morphological operations to fill holes and gaps. MATLAB “regionprops3” function was used to measure volume, convex volume, solidity, surface area and principal axis lengths. Sphericity was computed using the following equation:
2.13. Statistical Analysis
Statistical analysis (Mann-Whitney two-tailed test) and plotting were performed using GraphPad Prism 8.0 (GraphPad Software, La Jolla California USA).
3. Results
3.1. HURP Expression and Localization Correlate with Metastatic Potential
To investigate HURP’s association with breast cancer progression, we analyzed its expression and spindle localization in three breast cell lines of increasing metastatic potential: MCF10A, T47D and MDA-MB-231 cells. MCF10A is an immortalized non-transformed human breast epithelial cell line that resembles normal breast epithelium and serves as a control in in vitro breast cancer studies [40,41]. T47D is a low-metastatic breast cancer cell line, classified as luminal A based on the presence of estrogen and progesterone receptors and the lack of human epithelial receptor 2 (ER+, PR+, HER2-) [41,42]. MDA-MB-231 is a highly aggressive, triple-negative breast cancer cell line (ER-, PR- and HER2-), representing a model for advanced, metastatic disease [41,43]
Western blot analysis revealed significantly higher total and mitotic HURP protein levels in cancer cell lines compared to non-cancerous MCF10A, with MDA-MB-231 showing the highest expression (Figure 1A). Immunofluorescence confirmed HURP localization at the plus-ends of k-fibers (Figure 1B). Interestingly, despite higher mitotic protein levels, spindle-bound HURP intensity decreased by 20% in MDA-MB-231 compared to MCF10A, suggesting cytoplasmic mislocalization, while T47D cells showed a 40% increase in spindle-bound HURP (Figure 1C). Regarding spindle tubulin levels, T47D cells demonstrate the lowest levels, followed by MDA-MB-231 with intermediate levels, and lastly MCF10A cells with the highest levels (Figure S1A).
Spatial distribution analysis revealed that HURP occupied 63% of half-spindle length in MDA-MB-231 versus 51% and 47% in MCF10A and T47D, respectively (Figure 1D, S1B). These findings indicate that MDA-MB-231 cells exhibit the lowest spindle-bound HURP per tubulin unit and redistribute HURP along metaphase spindle axis, potentially compromising chromosomal stability.
3.2. HURP Depletion Induces Cell Line-Specific Spindle Defects
To further investigate the role of HURP as a potential drug target in breast cancer, we analyzed the effect of its silencing on spindle organization across our cell line panel. In MCF10A cells, HURP silencing (confirmed by western blot, Figure S2B) increased the percentage of abnormal spindles by 27.9%, compared to control conditions, predominantly including multipolar configurations (Figure S2A, S2C). Spindle length significantly decreased from 12.6μm (control siRNA) to 9.8μm (HURP siRNA; p < 0.0001) (Figure 2A). Spindle orientation analysis (Figure S1C) revealed that HURP silencing significantly increased spindle angle from 7.3° to 23.2° (p < 0.0001), indicating destabilized spindle architecture (Figure 2A, Sup. movies 1–2). Three-dimensional spindle architecture analysis of bipolar spindles [33] revealed that HURP silencing expanded chromatin volume, metaphase plate length, and spindle width, while decreased metaphase plate width (Figure 2B, S2D).
In low-metastatic T47D cells both immunofluorescence and Western blot analysis confirmed HURP protein silencing (Figure S3A, S3B). HURP silencing exacerbated inherent spindle defects, increasing abnormal spindles from 50% to 66% (Figure S3A, S3C). Spindle length decreased by 31.5% (from 9.2μm to 6.3µm; p < 0.0001) (Figure 3C), and spindle angle increased from 11° to 32° (p < 0.0001), (Figure 2C, Sup. movies 3-4). Spindle architecture analysis revealed reduced metaphase plate length, spindle volume and spindle width suggesting compromised structural integrity (Figure 2D, S3D).
In highly metastatic MDA-MB-231 cells HURP silencing was confirmed by immunofluorescence and Western blot (Figure S4A, S4B). Control MDA-MB-231 cells already exhibited predominantly abnormal, multipolar spindles (83.4%) (Figure S4A, S4C, control siRNA). HURP silencing induced apoptosis in 36.4% of cells (vs. 2.6% control) (Figure S4A, S4C, HURP siRNA). Surviving cells displayed decreased spindle angle (angle: from 21.7° to 8.2°; p < 0.0001) (Figure 2E) and shortened spindle length (from 10.1μm to 8.5µm; p < 0.0001) (Figure 2E, Sup. movies 5–6). Flatten spindles exhibited significantly decreased chromatin volume, metaphase plate length and spindle width, while metaphase plate width increased (Figure 2F, S4D), highlighting metastatic cells’ dependence on HURP for mitotic survival.
The increased mitotic spindle defects and apoptosis observed upon HURP silencing prompted us to examine cell cycle progression. Flow cytometry analysis revealed no significant differences in cell cycle phase distribution between control and HURP-silenced MCF10A cells (Figure S5A, S5B). In contrast, MDA-MB-231 cells showed a significant reduction in cell counts after HURP silencing, indicating increased cell death (Figure S5C). Surviving cells exhibited a reduced G1 population and increased S and G2/M phase populations, indicating G2/M arrest (G1: 62% → 11.3%; [p < 0.01], S: 15.5% → 31%; [p < 0.05], G2/M: 22.5% → 57.7% [p < 0.01]) (Figure S5C, S5D). These findings highlight the greater impact of HURP silencing on cell cycle regulation in highly aggressive breast cancer cells compared to non-transformed cells.
3.3. HURP Modulates Spindle-Associated Protein Dynamics
To further investigate HURP’s role in regulating metaphase spindle orientation and architecture, we analyzed spindle-associated proteins after HURP silencing.
Considering HURP’s participation in a complex with TPX2 [11] and the role of TPX2 as an activator of Aurora-A kinase [21], which in turn phosphorylates NuMA to organize spindle orientation [25,44], we investigated the effect of HURP silencing on these proteins. HURP silencing reduced spindle-bound TPX2 in T47D (52%; p < 0.0001) but increased it by 14.7% in MDA-MB-231 (p < 0.05) (Figure 3B). Both T47D and MDA-MB-231 preserved TPX2’s spindle pole localization pattern after HURP silencing (Figure 3A, 3C and S6A). In MCF10A cells, HURP silencing led to slightly redistribution of TPX2 near the spindle poles (p < 0.05) (Figure 3A, 3C and S6A), while spindle-bound TPX2 levels remained unaltered (Figure 3B).
We also investigated the effect of HURP silencing on spindle bound Aurora-A kinase levels and protein localization along the metaphase spindle. Plot profile analysis showed that HURP depletion led to narrow concentrated localization of Aurora-A at spindle poles in all breast cell lines (Figure 4A, 4C and S6B). Post-HURP silencing, Aurora-A levels surged 96% in T47D spindles (p < 0.001) (Figure 4B). This inverse relationship with TPX2 implies HURP stabilizes Aurora-A/TPX2 signaling in a subtype-specific manner.
HURP silencing reduced spindle-bound NuMA by 14% in MCF10A (p < 0.05) and 35% in MDA-MB-231 (p < 0.0001) but increased it by 13% in T47D (p < 0.05) (Figure 5A, 5B). After HURP silencing, T47Dcells retained narrow distribution of NuMA at the spindle poles, whereas MCF10A and MDA-MB-231 cells lost the extensive NuMA distribution at the pole region, with the protein becoming strictly localized at the poles (Figure 5A, 5C and S6C). Importantly, spindle tubulin levels remained unchanged after HURP silencing, indicating that alterations in the spindle-associated proteins were due to HURP loss rather than MT content (Figure S6D).
3.4. HURP Silencing Alters Migration Dynamics
To understand the role of HURP in breast cancer progression beyond mitosis, we performed scratch assays following HURP silencing, both in the presence and absence of Mitomycin-C to distinguish migration from proliferation effects.
In Mitomycin-C treated conditions, HURP depletion reduced gap closure in MCF10A by 67% (from 21% to 7%) (Figure 6A, 6B) and significantly decreased front velocity (from 2.3μm/h to 1.1μm/h; [p < 0.05]) (Figure 6A, 6C, Sup. movie 7-8). In MDA-MB-231 cells, HURP silencing substantially impaired collective migration, evidenced by the failure of cells to close the gap and the major reduction of the front velocity (Figure 6D–F, Sup. Movie 9-10).
In the absence of Mitomycin-C, both MCF10A and MDA-MB-231 cells exhibited higher gap closure rates and velocities, regardless of HURP status, due to cell proliferation (MCF10A: control siRNA 31%, HURP siRNA 23.8%, velocities 4.4 μm/h and 3.9 μm/h, respectively; MDA-MB-231: control siRNA 57.3%, HURP siRNA 52.5%, velocities 8 μm/h and 6.3 μm/h, respectively [p < 0.05]) (Figure S7A–F, Sup. Movies 11–14). However, the differences between control and HURP-silenced cells were less pronounced or not statistically significant in these conditions, highlighting that HURP's impact is more evident when migration is uncoupled from proliferation.
For T47D cells, HURP silencing did not significantly affect migration parameters under either condition, indicating a less prominent role for HURP in low-metastatic cell migration (Figure S8A–F, Sup. Movies 15–18).
To further dissect migration behavior, we performed single cell tracking and mean square displacement (MSD) analysis (Sup. movie 19). In MCF10A cells, HURP silencing shifted cell motility from sub-diffusive (α=0.90) to diffusive motion (α=1.09), though the overall migration mode remained characteristic of non-invasive cells (Figure 6Gi). T47D cells maintained sub-diffusive migration in both control and HURP-silenced conditions (α = 0.79 and α = 0.95, respectively) (Figure 6Gii). Strikingly, in MDA-MB-231 cells, HURP silencing converted the migration profile from super-diffusive (α = 1.42), typical of highly metastatic cells, to sub-diffusive (α = 0.97), indicating a profound loss of aggressive migratory behavior (Figure 6Giii).
Collectively, these findings demonstrate that HURP is a key regulator of migration dynamics in breast cancer cells, with its depletion having the most severe impact on the motility of highly metastatic MDA-MB-231 cells. HURP silencing impairs both collective and individual migration, particularly in aggressive cancer types, supporting its potential as a therapeutic target for limiting breast cancer metastasis.
3.5. HURP Silencing Disrupts the Formation of Compact Multicellular Spheroids
Finally, we examined HURP's impact on three-dimensional multicellular spheroid formation using MDA-MB-231 cells. Single plane illumination microscopy confirmed the absence of HURP in mitotic spindles after siRNA treatment (Figure 7A). Three-dimensional geometrical analysis revealed that HURP-depleted spheroids were significantly larger (surface area increased by 58.8%, from 1.7 × 10⁵ to 2.7 × 10⁵ µm2; p<0.05), but less compact, with reduced solidity (from 0.76 to 0.65; p<0.05) and sphericity (from 0.74 to 0.59; p<0.05) compared to controls (Figure 7B–D, Sup. Movies 20–23).
Two-dimensional morphological quantification (Figure 7E-F) corroborated these findings: HURP-silenced spheroids were significantly larger (from 1 ×105 μm2 to 1.2×105 μm2; p<0.0001), but less solid (from 0.93 to 0.89; p<0.0001) and less circular (from 0.86 to 0.78; p<0.0001) than controls (Figure 7G–I).
Figure 7.
HURP depletion disrupts three-dimensional spheroid formation in MDA-MB-231 cells (A) Maximum projection (z and y) images of spheroids formed by MDA-MB-231 cells pre-treated with control siRNA or HURP siRNA, imaged by single plane illumination microscopy (left panel). Montages of zoomed mitotic spindles from spheroids surface (right panel). HURP (cyan), α-tubulin (green), DNA (magenta, SPY555). Scale bars, 50μm (overview), 10μm (zoomed mitotic spindles). (B–D) Scatter plots quantifying 3D spheroid surface area (B), solidity (C), and sphericity (D) in control (n = 5) and HURP siRNA (n = 3) groups. *0.01 < p < 0.05, two-tailed Mann-Whitney test. Error bars denote SD. (E) Representative phase-contrast images of spheroids cultured for 48hrs in 2% Matrigel, pre-treated with control (left) or HURP siRNA (right). (F) Schematic of 2D geometric quantification. The subscripts (S) and (C) shown in the equations represent spheroid and convex respectively. (G-I) Scatter plots quantifying 2D spheroid surface area (G), solidity (H) and circularity (I) for control (n = 92) and HURP siRNA (n = 47) spheroids ****: p<0.0001, two-tailed Mann-Whitney test. Error bars denote SD.
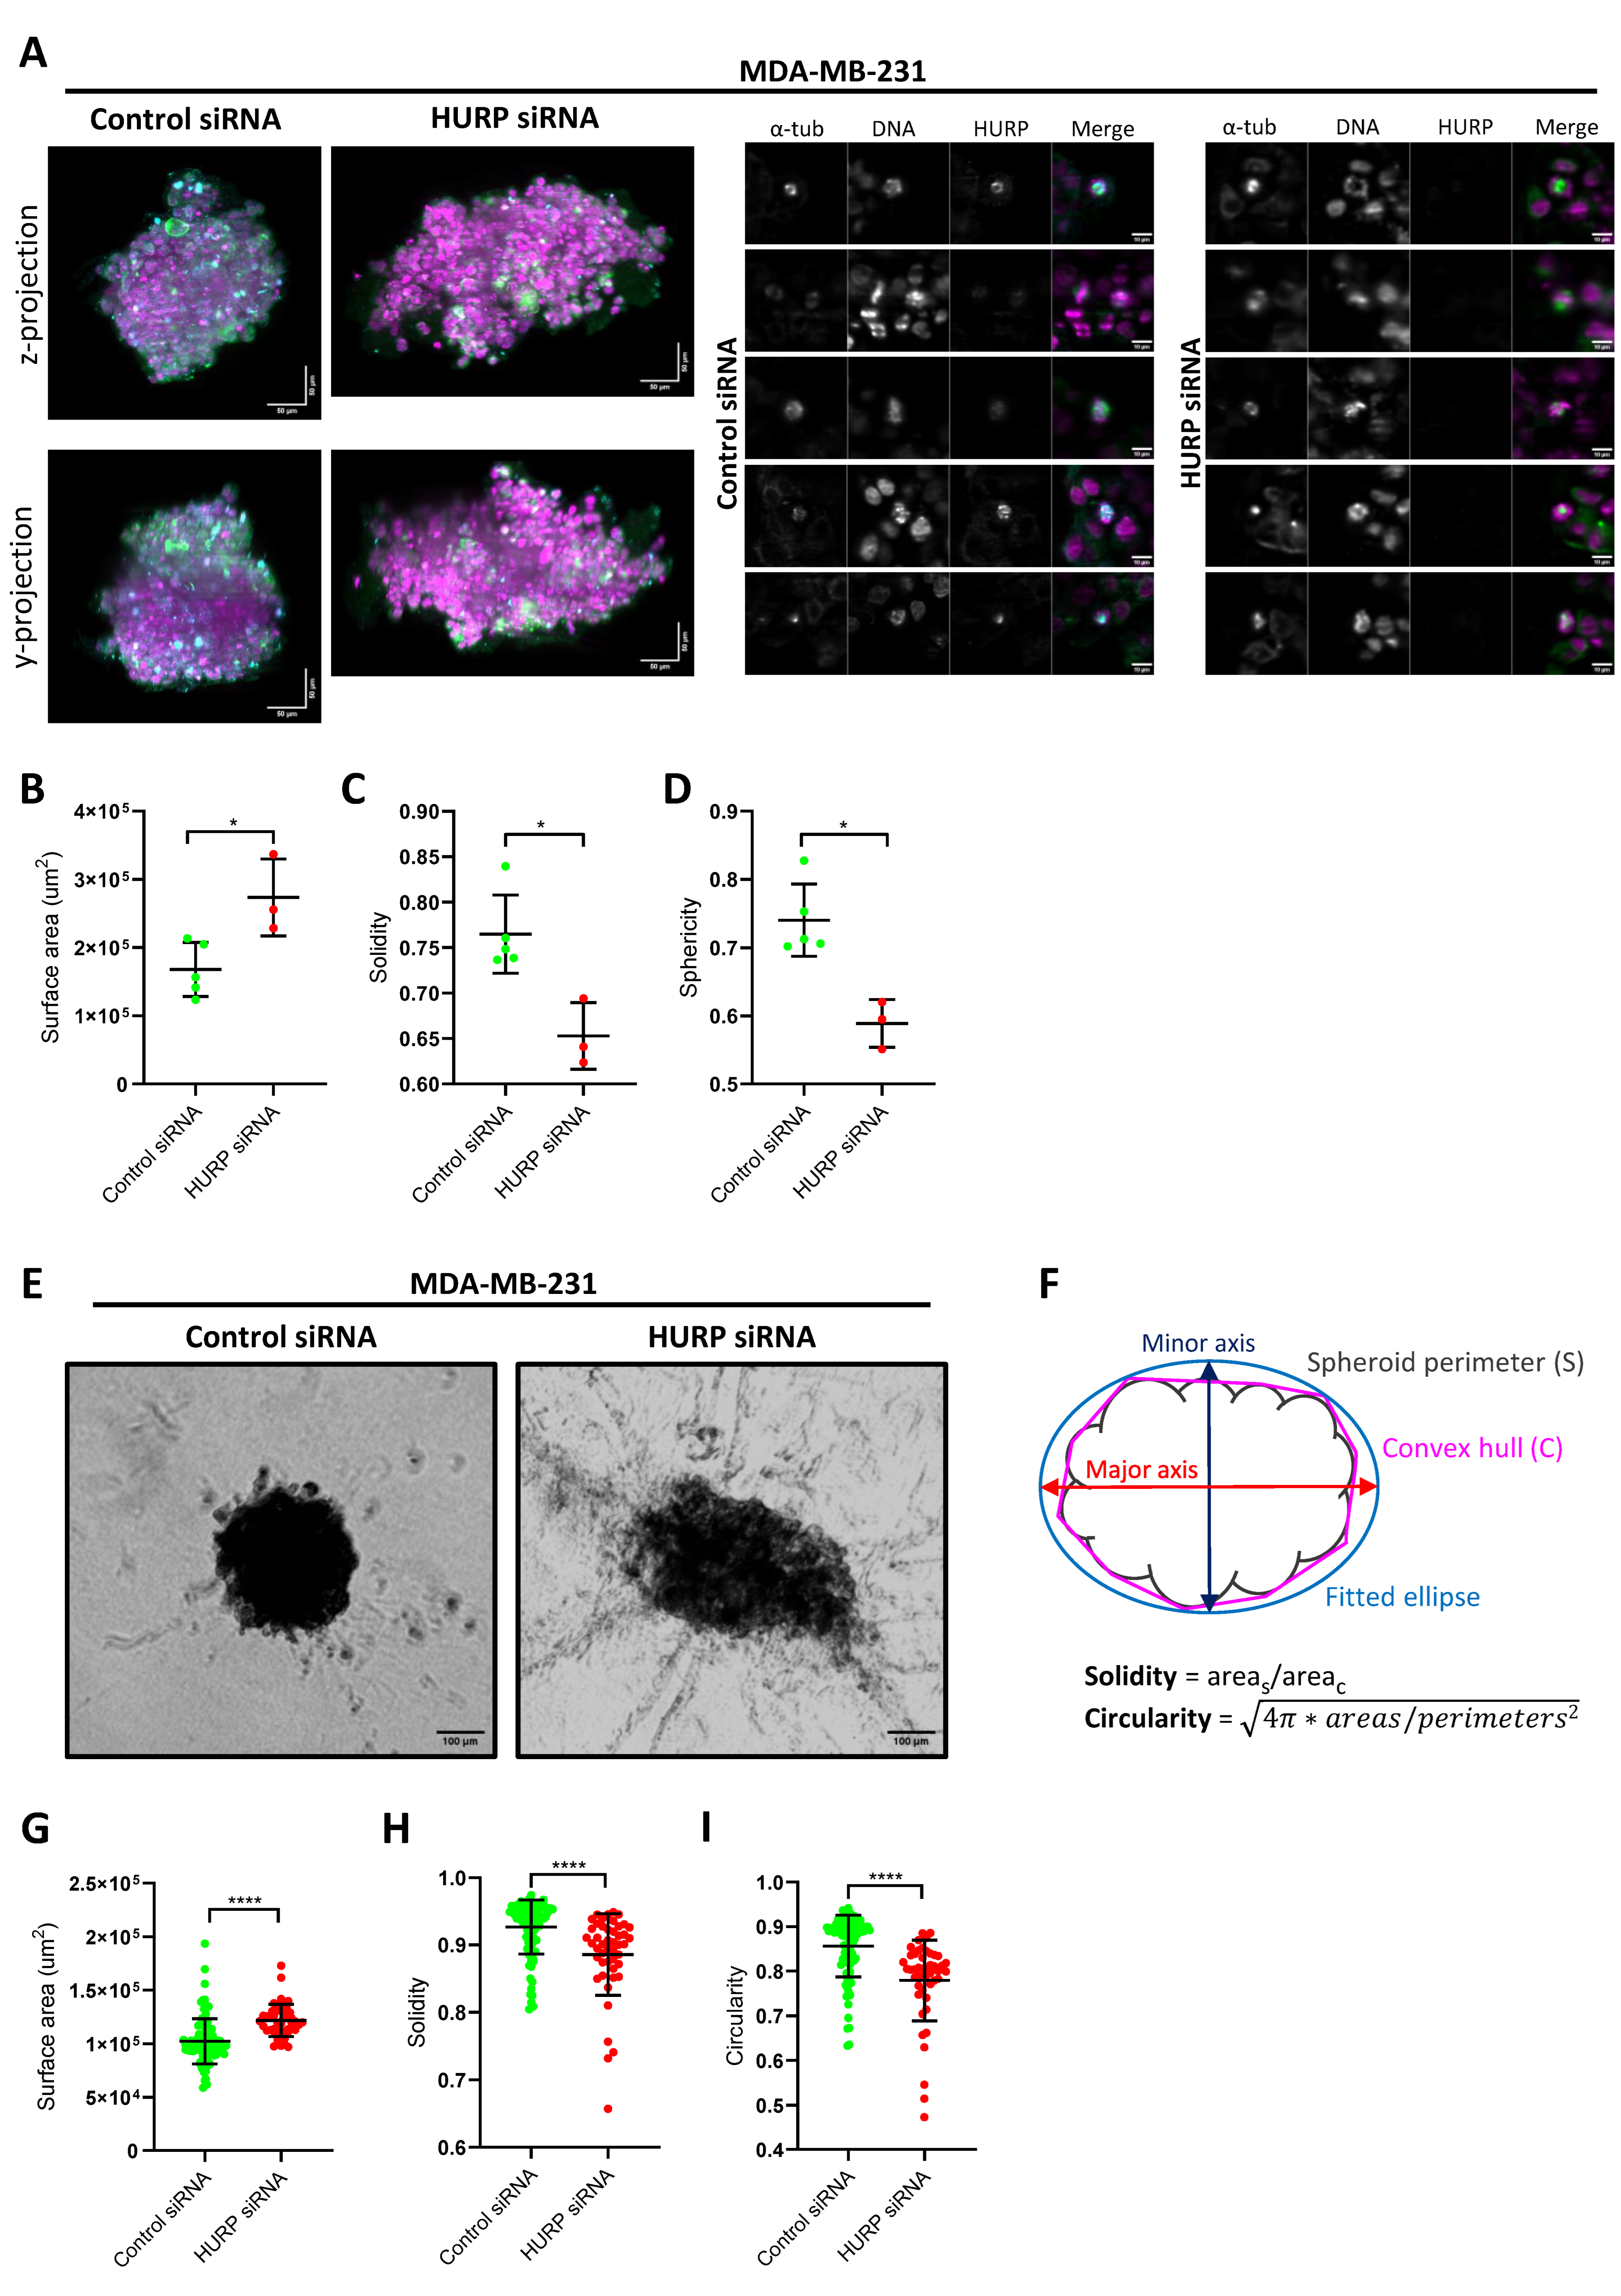
These data indicate that HURP is required for the formation of compact, regularly shaped multicellular aggregates by highly metastatic breast cancer cells. Loss of HURP leads to the formation of larger, less solid, and less spherical spheroids, suggesting a role for HURP in maintaining tumor structural integrity. Less solid spheroids with irregular surfaces might represent a phenotype with altered invasive capabilities.
The spheroid model connects HURP's known function in mitotic spindle organization to tissue-level effects, suggesting that disruption of proper spindle orientation and cell division can manifest as altered tissue architecture. This provides a mechanistic link between cellular-level defects and tumor organization that could be relevant for understanding how spindle-associated proteins contribute to cancer progression.
HURP silencing alters the localization and abundance of key spindle-associated proteins, impairs both collective and individual migration and disrupts the ability of highly metastatic cells to form compact spheroids. These effects are most pronounced in highly metastatic breast cancer cells, supporting HURP as a potential therapeutic target for aggressive breast tumors.
4. Discussion
This study provides new insights into the role of HURP and its associated spindle protein network in breast cancer progression, highlighting how aberrant regulation of mitotic machinery contributes to aggressive tumor phenotypes. Our findings demonstrate that HURP is not only overexpressed in breast cancer cells with high metastatic potential, but that its localization, spindle association, and regulation of migratory dynamics are critically altered in aggressive breast cancer cells, with profound implications for tumor architecture and invasion.
Consistent with previous reports showing elevated HURP mRNA and protein levels in breast tumors and aggressive cell lines [13], we observed a progressive increase in total and mitotic HURP expression across a metastatic gradient, with MDA-MB-231 cells displaying the highest levels. However, paradoxically, spindle-bound HURP was reduced in these highly metastatic cells, suggesting a shift toward cytoplasmic mislocalization that may compromise spindle function and chromosomal stability. This redistribution of HURP along the metaphase spindle axis in MDA-MB-231 cells likely reflects adaptations that enable these cells to tolerate, or even exploit, mitotic errors for tumor evolution.
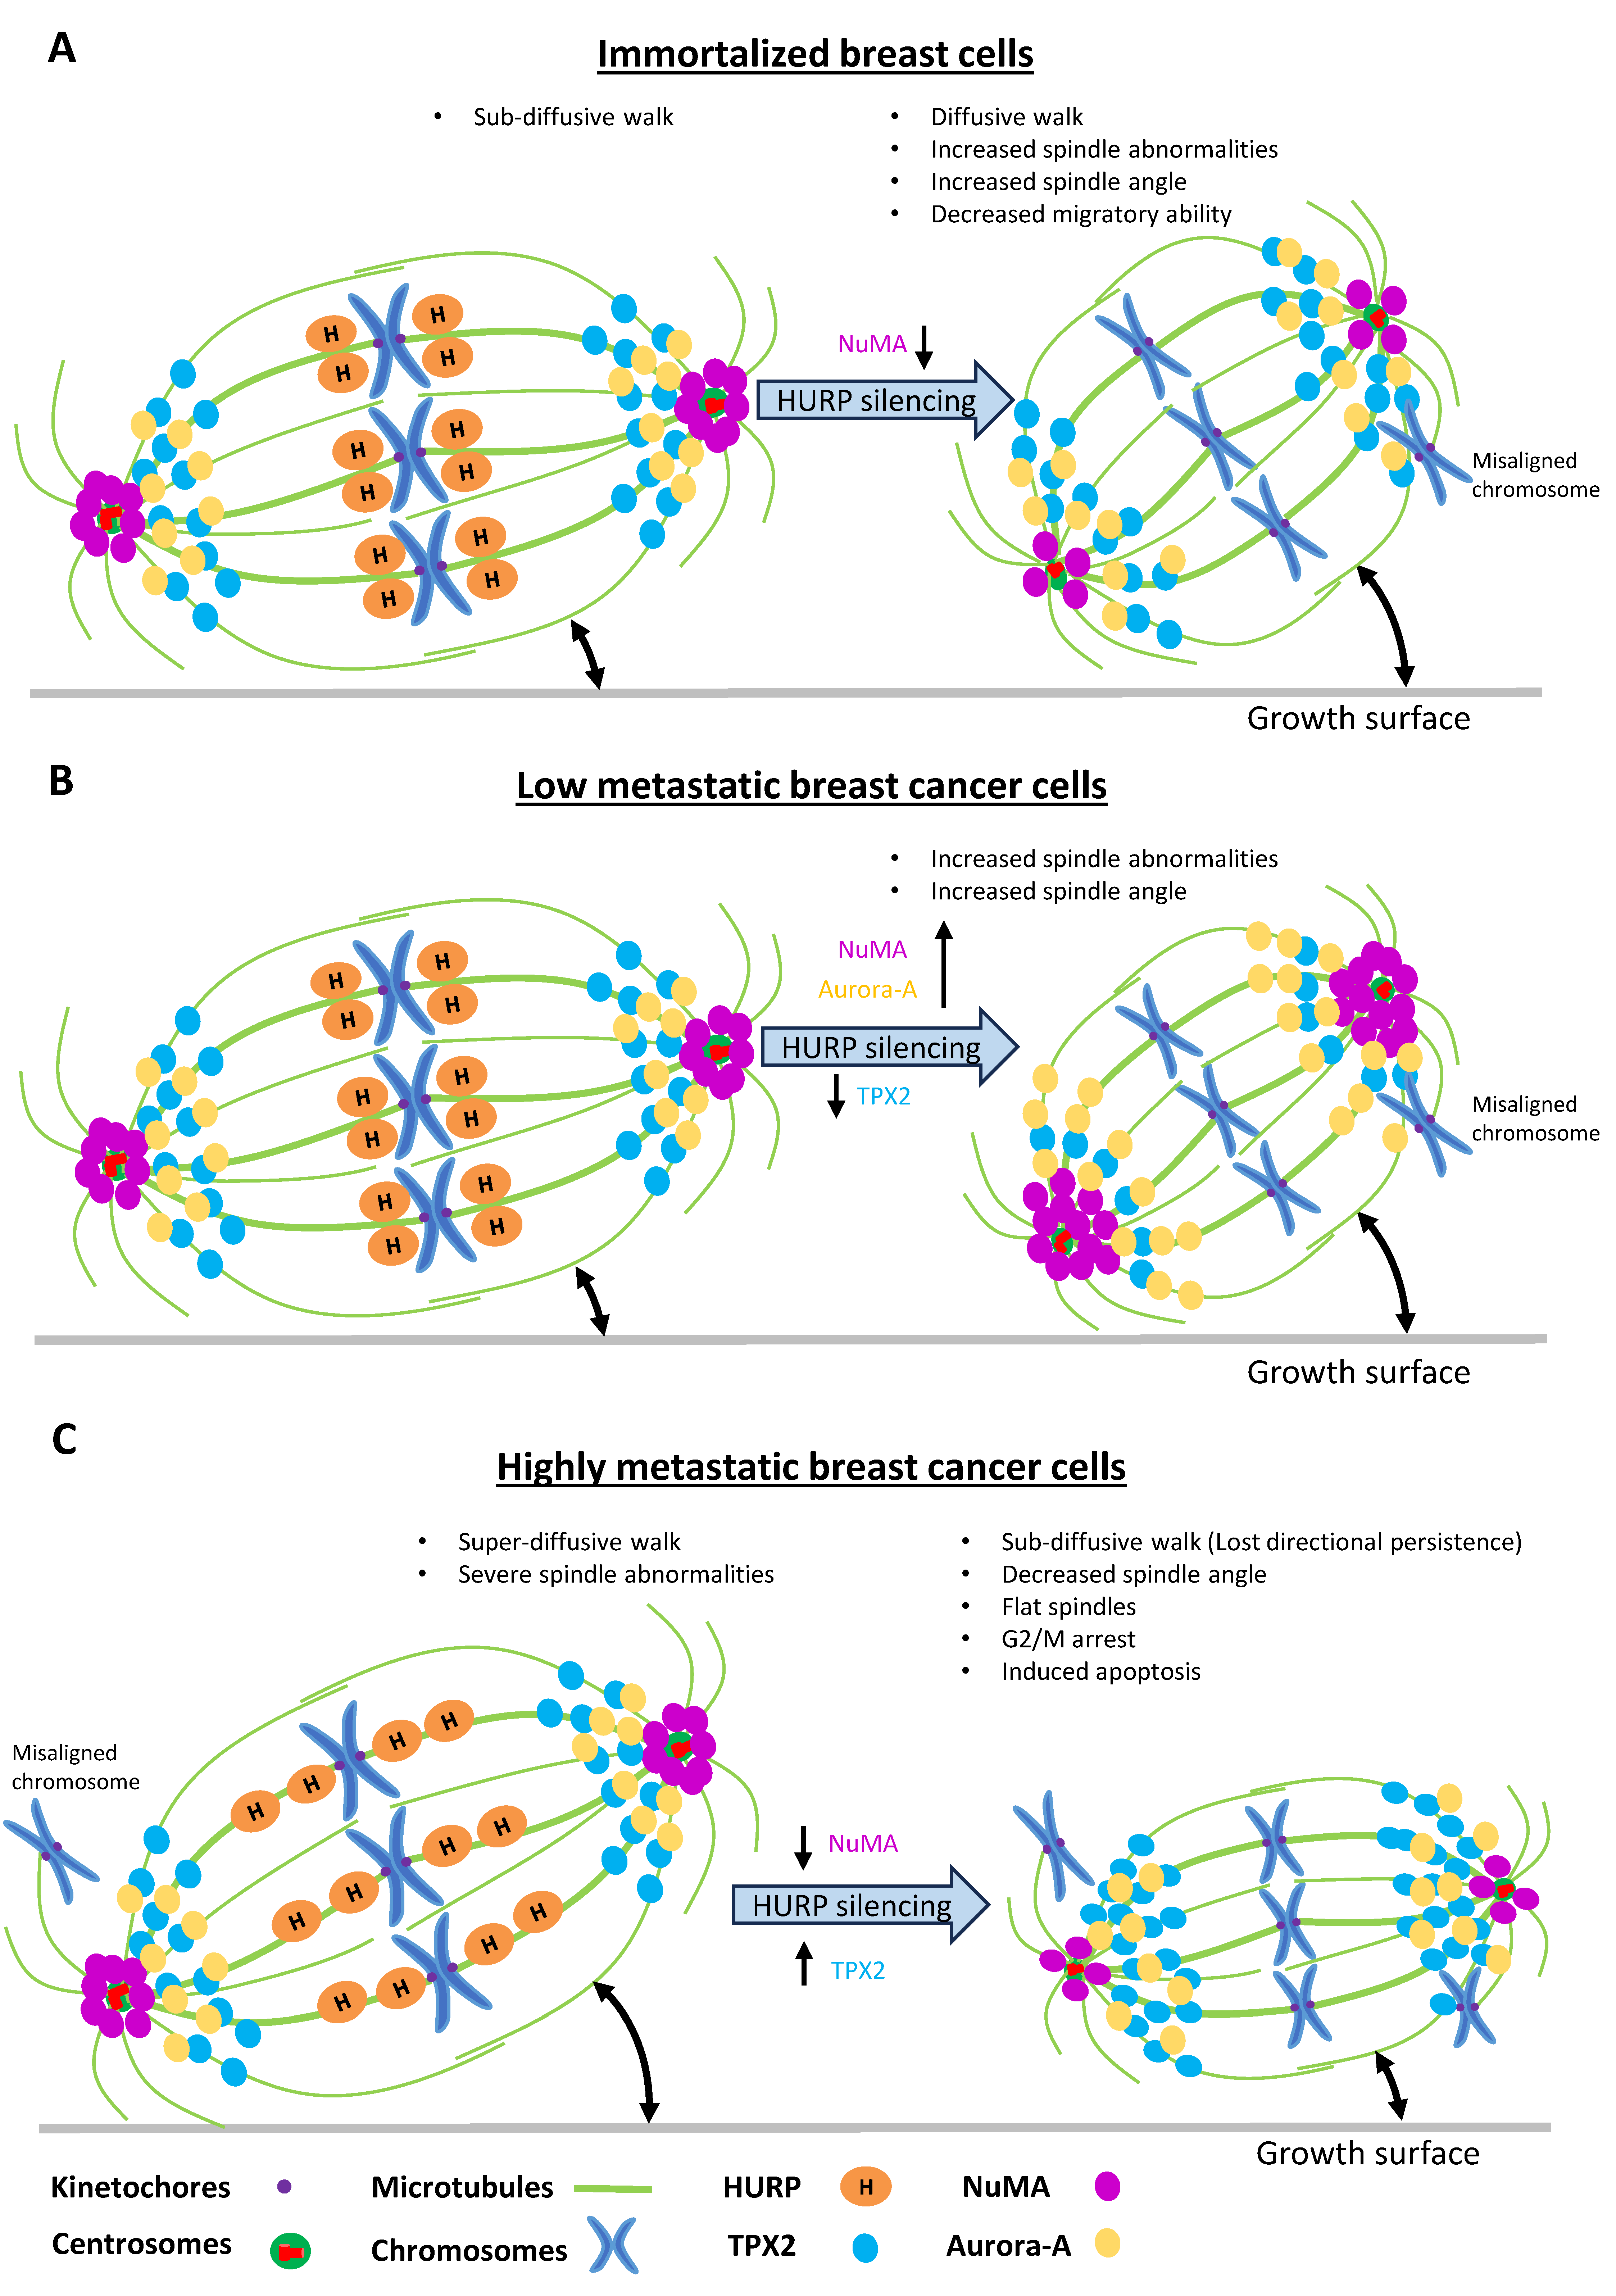
HURP silencing induced cell line-specific spindle defects, with the most severe consequences observed in highly metastatic MDA-MB-231 cells. In these cells, HURP depletion triggered widespread spindle abnormalities, apoptosis, and G2/M phase arrest, underscoring their dependence on HURP for mitotic fidelity and survival. In contrast, non-transformed MCF10A and low-metastatic T47D cells exhibited less pronounced mitotic disruption and minimal cell death, suggesting a therapeutic window for targeting HURP in aggressive cancer.
4.1. Mechanistic Integration of HURP with Essential Spindle Regulators
Mechanistically, our results reveal that HURP is central to a regulatory axis involving NuMA, TPX2, and Aurora-A-proteins essential for spindle assembly, orientation, and stability (see Figure 8). HURP silencing led to reduced spindle-bound NuMA and altered its distribution, in metastatic cells, consistent with impaired spindle pole organization. The impact on TPX2 and Aurora-A was subtype-specific: while T47D cells showed reduced TPX2 and increased Aurora-A after HURP knockdown, MDA-MB-231 cells displayed increased TPX2 and altered Aurora-A localization, suggesting that HURP stabilizes the Aurora-A/TPX2 signaling complex in a context-dependent manner. These findings align with recent evidence that the Aurora-A/TPX2 interaction forms an oncogenic unit and is a promising target for cancer therapy [20,45].
Moreover, recent structural studies demonstrating that TPX2 forms condensates on microtubules that recruit HURP for enhanced branching nucleation provide a mechanistic framework for understanding how metastatic cells exploit this pathway for rapid spindle assembly during invasion [46].
The phosphorylation-dependent regulation of HURP localization by Aurora-A, as previously demonstrated [11], likely underlies the altered protein distributions observed in our study. The disrupted HURP-TPX2-Aurora-A coordination following HURP depletion may explain the compensatory increase in TPX2 levels in aggressive cells, representing an unsuccessful attempt to maintain spindle integrity through alternative pathways.
4.2. Spindle Orientation and Tissue Architectural Control
Proper spindle orientation is essential for maintaining tissue architecture, as misoriented divisions disrupt epithelial organization and promote genomic instability [30]. In our model, HURP silencing induced spindle misorientation and chaotic spindle angles, in low metastatic T47D cells, which highly correlates with breast cancer progression. In MDA-MB-231 cells, the knockdown of HURP led to flat spindles with destabilized architecture, which correlated with compromised 3D spheroid integrity. These findings align with evidence that spindle misorientation synergizes with oncogenic changes to drive tissue disorganization-a hallmark of invasive cancers [30]. The formation of larger, less compact spheroids after HURP depletion suggests that proper spindle alignment, mediated by HURP’s effect on NuMA, Aurora-A, and TPX2, is critical for maintaining structural coherence in tumor aggregates. This disruption may facilitate metastatic dissemination by enabling cells to escape normal spatial constraints that would otherwise restrict tumor growth and invasion.
4.3. Migration Plasticity and the Mitosis-Motility Nexus
Beyond mitosis, HURP depletion markedly impaired migration, especially in MDA-MB-231 cells. Cancer cell invasion occurs through distinct migration modes: collective migration, where cell-cell contacts are maintained, and individual migration, which includes mesenchymal (protease-dependent) and amoeboid (protease-independent) subtypes [47,48]. Our results show that highly metastatic MDA-MB-231 cells exhibit HURP-dependent super-diffusive motility-a hallmark of amoeboid migration-which shifted to sub-diffusive behavior upon HURP silencing. This transition mirrors the adaptability of aggressive cancers to switch between migration modes in response to microenvironmental constraints [48,49]. The amoeboid-mesenchymal plasticity observed in MDA-MB-231 cells is critical for navigating heterogeneous extracellular matrices (ECMs) [49]. Loss of HURP disrupts this plasticity, trapping cells in less invasive states. In contrast, low-metastatic T47D cells showed minimal migration changes, consistent with their reliance on collective migration, a less invasive phenotype [47]. This supports the emerging concept that mitotic regulators, including HURP, have dual roles in both cell division and migration, and that disrupting this connection can suppress metastatic behaviors.
Our demonstration that HURP depletion converts the migration profile of MDA-MB-231 cells from super-diffusive to sub-diffusive movement reveals a previously unappreciated link between mitotic machinery and migration plasticity. Super-diffusive migration is characteristic of amoeboid movement, a highly invasive mode that enables cancer cells to navigate heterogeneous extracellular matrices without proteolytic degradation. HURP's role in stabilizing microtubules likely supports the rapid cytoskeletal remodeling required for this type of movement, and its loss traps cells in less invasive migration states.
The emerging concept of migration-mitosis crosstalk suggests that proteins like HURP serve dual functions in both cell division and motility. This connection may explain how cancer cells coordinate proliferative and invasive behaviors, and why targeting such dual-function proteins can simultaneously disrupt tumor growth and metastatic spread. The minimal migration defects observed in MC10A and T47D cells further emphasize that this connection is particularly relevant for aggressive cancer subtypes that rely on individual rather than collective migration modes.
4.4. Implications for Cancer Cell Biology and Therapeutic Strategy
From a fundamental cell biology perspective, our findings illuminate how cancer cells reprogram essential cellular machinery to support malignant behaviors. The addiction of metastatic cells to HURP-mediated functions, combined with the tolerance of normal-like cells to HURP loss, suggests that cancer cells have evolved dependencies on specific protein networks that can be therapeutically exploited.
The integration of HURP with the Aurora-A/TPX2 oncogenic unit positions this protein network as a promising target for precision medicine approaches. Given that Aurora-A inhibitors like alisertib are already in clinical development, our findings suggest that combination strategies targeting multiple components of this network could enhance therapeutic efficacy while maintaining selectivity for aggressive cancer cells.
4.5. Future Directions and Mechanistic Questions
While our study establishes HURP's multifaceted role in cancer progression, several mechanistic questions remain. The precise molecular mechanisms underlying HURP's cytoplasmic redistribution in metastatic cells warrant investigation, as does the relationship between HURP's mitotic and non-mitotic functions. Additionally, the apparent compensatory mechanisms that enable non-transformed cells to tolerate HURP loss could reveal alternative therapeutic targets or resistance mechanisms.
The integration of single-cell approaches with our current model system could provide insights into the heterogeneity of HURP-dependent responses within cancer cell populations and reveal how asymmetric mitoses contribute to the generation of migratory subclones
5. Conclusions
This study establishes HURP as a multifunctional regulator that coordinates mitotic fidelity, spindle orientation, and migration plasticity in breast cancer cells. The progressive alteration of HURP function across the metastatic gradient, combined with the selective vulnerability of aggressive cells to its loss, positions HURP and its associated protein network as promising targets for cancer therapy. Our findings contribute to the growing understanding of how cancer cells reprogram fundamental cellular processes to support malignant progression and highlight the therapeutic potential of targeting the mitosis-migration nexus in aggressive cancers.
Supplementary Materials
The following supporting information can be downloaded at the website of this paper posted on Preprints.org, Figure S1: Quantitative analysis of spindle tubulin, HURP distribution, and spindle orientation in breast cell lines; Figure S2: Impact of HURP silencing on spindle architecture in MCF10A cells; Figure S3: Impact of HURP silencing on spindle architecture in T47D cells; Figure S4: Impact of HURP silencing on spindle architecture in MDA-MB-231 cells; Figure S5: Cell cycle profiles of non-transformed MCF10A and highly metastatic MDA-MB-231 cells after HURP silencing; Figure S6: TPX2, Aurora-A and NuMA localization on metaphase spindle and tubulin quantification post HURP silencing; Figure S7: Scratch wound healing assay in MCF10A and MDA-MB-231 cells in the absence of Mitomycin-C; Figure S8: Scratch wound healing assays in T47D cells with or without Mitomycin-C treatment
Funding
The work was supported by the Hellenic Foundation for Research and Innovation (HFRI) grant #3014 to M.K. and the Luxembourg National Research Fund (FNR) grant C21/IS/15439488 to A.G.
Conflicts of Interest
All authors have reviewed and approved the manuscript, and we declare no conflicts of interest.
Abbreviations
The following abbreviations are used in this manuscript:
| HURP | Hepatoma up regulated protein |
| NuMA | Nuclear Mitotic Apparatus |
| TPX2 | Target protein for Xklp2 |
| BC | Breast cancer |
References
- Bray, F.; Laversanne, M.; Sung, H.; Ferlay, J.; Siegel, R.L.; Soerjomataram, I.; Jemal, A. Global cancer statistics 2022: GLOBOCAN estimates of incidence and mortality worldwide for 36 cancers in 185 countries. CA: A Cancer J. Clin. 2024, 74, 229–263. [Google Scholar] [CrossRef]
- Giaquinto, A.N.; Sung, H.; Miller, K.D.; Kramer, J.L.; Newman, L.A.; Minihan, A.; Jemal, A.; Siegel, R.L. Breast Cancer Statistics, 2022. CA: A Cancer J. Clin. 2022, 72, 524–541. [Google Scholar] [CrossRef]
- Hanahan, D. and R.A. Weinberg, Hallmarks of cancer: the next generation. Cell, 2011. 144(5): p. 646-74.
- Giam, M.; Rancati, G. Aneuploidy and chromosomal instability in cancer: a jackpot to chaos. Cell Div. 2015, 10, 1–12. [Google Scholar] [CrossRef]
- Inoue, S. and E.D. Salmon, Force generation by microtubule assembly/disassembly in mitosis and related movements. Mol Biol Cell, 1995. 6(12): p. 1619-40.
- Valdez, V.A.; Neahring, L.; Petry, S.; Dumont, S. Mechanisms underlying spindle assembly and robustness. Nat. Rev. Mol. Cell Biol. 2023, 24, 523–542. [Google Scholar] [CrossRef]
- Scholey, J.M., I. Brust-Mascher, and A. Mogilner, Cell division. Nature, 2003. 422(6933): p. 746-52.
- Koffa, M.D.; Casanova, C.M.; Santarella, R.; Köcher, T.; Wilm, M.; Mattaj, I.W. HURP Is Part of a Ran-Dependent Complex Involved in Spindle Formation. Curr. Biol. 2006, 16, 743–754. [Google Scholar] [CrossRef]
- Santarella, R.A.; Koffa, M.D.; Tittmann, P.; Gross, H.; Hoenger, A. HURP Wraps Microtubule Ends with an Additional Tubulin Sheet That Has a Novel Conformation of Tubulin. J. Mol. Biol. 2007, 365, 1587–1595. [Google Scholar] [CrossRef] [PubMed]
- Wong, J.; Fang, G. HURP controls spindle dynamics to promote proper interkinetochore tension and efficient kinetochore capture. J. Cell Biol. 2006, 173, 879–891. [Google Scholar] [CrossRef]
- Didaskalou, S.; Efstathiou, C.; Galtsidis, S.; Kesisova, I.; Halavatyi, A.; Elmali, T.; Tsolou, A.; Girod, A.; Koffa, M. HURP localization in metaphase is the result of a multi-step process requiring its phosphorylation at Ser627 residue. Front. Cell Dev. Biol. 2023, 11, 981425. [Google Scholar] [CrossRef]
- Tsou, A.-P.; Yang, C.-W.; Huang, C.-Y.F.; Yu, R.C.-T.; Lee, Y.-C.G.; Chang, C.-W.; Chen, B.-R.; Chung, Y.-F.; Fann, M.-J.; Chi, C.-W.; et al. Identification of a novel cell cycle regulated gene, HURP, overexpressed in human hepatocellular carcinoma. Oncogene 2003, 22, 298–307. [Google Scholar] [CrossRef] [PubMed]
- Chen, J.; Liu, Q.-J.; Wang, D.; Zhou, X.-Y.; Xiong, D.; Li, H.-J.; Li, C.-L. Hepatoma upregulated protein expression is involved in the pathogenesis of human breast carcinogenesis. Oncol. Lett. 2014, 8, 2543–2548. [Google Scholar] [CrossRef] [PubMed]
- Xu, T.; Dong, M.; Li, H.; Zhang, R.; Li, X. Elevated mRNA expression levels of DLGAP5 are associated with poor prognosis in breast cancer. Oncol. Lett. 2020, 19, 4053–4065. [Google Scholar] [CrossRef] [PubMed]
- Espinoza, I.; Sakiyama, M.J.; Ma, T.; Fair, L.; Zhou, X.; Hassan, M.; Zabaleta, J.; Gomez, C.R. Hypoxia on the Expression of Hepatoma Upregulated Protein in Prostate Cancer Cells. Front. Oncol. 2016, 6, 144. [Google Scholar] [CrossRef] [PubMed]
- Li, W. , et al., MicroRNA-409-5p inhibits cell proliferation, and induces G(2)/M phase arrest and apoptosis by targeting DLGAP5 in ovarian cancer cells. Oncol Lett, 2022. 24(2): p. 261.
- Branchi, V.; García, S.A.; Radhakrishnan, P.; Győrffy, B.; Hissa, B.; Schneider, M.; Reißfelder, C.; Schölch, S. Prognostic value of DLGAP5 in colorectal cancer. Int. J. Color. Dis. 2019, 34, 1455–1465. [Google Scholar] [CrossRef]
- Wang, Q.; Chen, Y.; Feng, H.; Zhang, B.; Wang, H. Prognostic and predictive value of HURP in non-small cell lung cancer. Oncol. Rep. 2018, 39, 1682–1692. [Google Scholar] [CrossRef]
- Eissa, S.; Matboli, M.; Mansour, A.; Mohamed, S.; Awad, N.; Kotb, Y.M. Evaluation of urinary HURP mRNA as a marker for detection of bladder cancer: relation to bilharziasis. Med Oncol. 2013, 31, 1–9. [Google Scholar] [CrossRef]
- Garrido, G.; Vernos, I. Non-centrosomal TPX2-Dependent Regulation of the Aurora A Kinase: Functional Implications for Healthy and Pathological Cell Division. Front. Oncol. 2016, 6, 88. [Google Scholar] [CrossRef]
- Bayliss, R.; Sardon, T.; Vernos, I.; Conti, E. Structural Basis of Aurora-A Activation by TPX2 at the Mitotic Spindle. Mol. Cell 2003, 12, 851–862. [Google Scholar] [CrossRef]
- Gruss, O.J.; Wittmann, M.; Yokoyama, H.; Pepperkok, R.; Kufer, T.; Silljé, H.; Karsenti, E.; Mattaj, I.W.; Vernos, I. Chromosome-induced microtubule assembly mediated by TPX2 is required for spindle formation in HeLa cells. Nat. Cell Biol. 2002, 4, 871–879. [Google Scholar] [CrossRef]
- Kufer, T.A.; Silljé, H.H.; KörNer, R.; Gruss, O.J.; Meraldi, P.; Nigg, E.A. Human TPX2 is required for targeting Aurora-A kinase to the spindle. J. Cell Biol. 2002, 158, 617–623. [Google Scholar] [CrossRef] [PubMed]
- Cowley, D.O.; Rivera-Pérez, J.A.; Schliekelman, M.; He, Y.J.; Oliver, T.G.; Lu, L.; O'QUinn, R.; Salmon, E.D.; Magnuson, T.; Van Dyke, T. Aurora-A Kinase Is Essential for Bipolar Spindle Formation and Early Development. Mol. Cell. Biol. 2009, 29, 1059–1071. [Google Scholar] [CrossRef]
- Gallini, S.; Carminati, M.; De Mattia, F.; Pirovano, L.; Martini, E.; Oldani, A.; Asteriti, I.A.; Guarguaglini, G.; Mapelli, M. NuMA Phosphorylation by Aurora-A Orchestrates Spindle Orientation. Curr. Biol. 2016, 26, 458–469. [Google Scholar] [CrossRef]
- Du, Q.; Stukenberg, P.T.; Macara, I.G. A mammalian Partner of inscuteable binds NuMA and regulates mitotic spindle organization. Nat. Cell Biol. 2001, 3, 1069–1075. [Google Scholar] [CrossRef] [PubMed]
- Kotak, S.; Busso, C.; Gönczy, P. Cortical dynein is critical for proper spindle positioning in human cells. J. Cell Biol. 2012, 199, 97–110. [Google Scholar] [CrossRef] [PubMed]
- Haren, L.; Merdes, A. Direct binding of NuMA to tubulin is mediated by a novel sequence motif in the tail domain that bundles and stabilizes microtubules. J. Cell Sci. 2002, 115, 1815–1824. [Google Scholar] [CrossRef] [PubMed]
- Kiyomitsu, T.; Cheeseman, I.M. Chromosome- and spindle-pole-derived signals generate an intrinsic code for spindle position and orientation. Nat. Cell Biol. 2012, 14, 311–317. [Google Scholar] [CrossRef]
- Pease, J.C.; Tirnauer, J.S. Mitotic spindle misorientation in cancer – out of alignment and into the fire. J. Cell Sci. 2011, 124, 1007–1016. [Google Scholar] [CrossRef]
- A Tame, M.; A Raaijmakers, J.; Afanasyev, P.; Medema, R.H. Chromosome misalignments induce spindle-positioning defects. Embo Rep. 2016, 17, 317–325. [Google Scholar] [CrossRef] [PubMed]
- Toyoshima, F.; Nishida, E. Integrin-mediated adhesion orients the spindle parallel to the substratum in an EB1- and myosin X-dependent manner. EMBO J. 2007, 26, 1487–1498. [Google Scholar] [CrossRef]
- Kletter, T. , et al., Volumetric morphometry reveals spindle width as the best predictor of mammalian spindle scaling. J Cell Biol, 2022. 221(1).
- Arganda-Carreras, I.; Kaynig, V.; Rueden, C.; Eliceiri, K.W.; Schindelin, J.; Cardona, A.; Seung, H.S. Trainable Weka Segmentation: a machine learning tool for microscopy pixel classification. Bioinformatics 2017, 33, 2424–2426. [Google Scholar] [CrossRef]
- Ershov, D.; Phan, M.-S.; Pylvänäinen, J.W.; Rigaud, S.U.; Le Blanc, L.; Charles-Orszag, A.; Conway, J.R.W.; Laine, R.F.; Roy, N.H.; Bonazzi, D.; et al. TrackMate 7: integrating state-of-the-art segmentation algorithms into tracking pipelines. Nat. Methods 2022, 19, 829–832. [Google Scholar] [CrossRef]
- Tinevez, J.-Y.; Perry, N.; Schindelin, J.; Hoopes, G.M.; Reynolds, G.D.; Laplantine, E.; Bednarek, S.Y.; Shorte, S.L.; Eliceiri, K.W. TrackMate: An open and extensible platform for single-particle tracking. Methods 2017, 115, 80–90. [Google Scholar] [CrossRef]
- Huda, S.; Weigelin, B.; Wolf, K.; Tretiakov, K.V.; Polev, K.; Wilk, G.; Iwasa, M.; Emami, F.S.; Narojczyk, J.W.; Banaszak, M.; et al. Lévy-like movement patterns of metastatic cancer cells revealed in microfabricated systems and implicated in vivo. Nat. Commun. 2018, 9, 1–11. [Google Scholar] [CrossRef]
- Takagi, H.; Sato, M.J.; Yanagida, T.; Ueda, M.; Ben-Jacob, E. Functional Analysis of Spontaneous Cell Movement under Different Physiological Conditions. PLOS ONE 2008, 3, e2648–e2648. [Google Scholar] [CrossRef] [PubMed]
- Christian Tischer, R.P. , CATS: Fiji plugin for context aware trainable segmentation for big image data. 2019.
- Qu, Y.; Han, B.; Yu, Y.; Yao, W.; Bose, S.; Karlan, B.Y.; Giuliano, A.E.; Cui, X.; Liu, X. Evaluation of MCF10A as a Reliable Model for Normal Human Mammary Epithelial Cells. PLOS ONE 2015, 10, e0131285. [Google Scholar] [CrossRef]
- Gordon, L.A.; Mulligan, K.T.; Maxwell-Jones, H.; Adams, M.; Walker, R.A.; Jones, J.L. Breast cell invasive potential relates to the myoepithelial phenotype. Int. J. Cancer 2003, 106, 8–16. [Google Scholar] [CrossRef]
- Yu, S.; Kim, T.; Yoo, K.H.; Kang, K. The T47D cell line is an ideal experimental model to elucidate the progesterone-specific effects of a luminal A subtype of breast cancer. Biochem. Biophys. Res. Commun. 2017, 486, 752–758. [Google Scholar] [CrossRef]
- Dai, X.; Cheng, H.; Bai, Z.; Li, J. Breast Cancer Cell Line Classification and Its Relevance with Breast Tumor Subtyping. J. Cancer 2017, 8, 3131–3141. [Google Scholar] [CrossRef]
- Polverino, F.; Naso, F.D.; Asteriti, I.A.; Palmerini, V.; Singh, D.; Valente, D.; Bird, A.W.; Rosa, A.; Mapelli, M.; Guarguaglini, G. The Aurora-A/TPX2 Axis Directs Spindle Orientation in Adherent Human Cells by Regulating NuMA and Microtubule Stability. Curr. Biol. 2021, 31, 658–667.e5. [Google Scholar] [CrossRef] [PubMed]
- Asteriti, I.A. , et al., The Aurora-A/TPX2 complex: a novel oncogenic holoenzyme? Biochim Biophys Acta, 2010. 1806(2): p. 230-9.
- Valdez, V.A.; Ma, M.; Gouveia, B.; Zhang, R.; Petry, S. HURP facilitates spindle assembly by stabilizing microtubules and working synergistically with TPX2. Nat. Commun. 2024, 15, 1–17. [Google Scholar] [CrossRef]
- Friedl, P.; Gilmour, D. Collective cell migration in morphogenesis, regeneration and cancer. Nat. Rev. Mol. Cell Biol. 2009, 10, 445–457. [Google Scholar] [CrossRef] [PubMed]
- Friedl, P.; Locker, J.; Sahai, E.; Segall, J.E. Classifying collective cancer cell invasion. Nat. Cell Biol. 2012, 14, 777–783. [Google Scholar] [CrossRef] [PubMed]
- Talkenberger, K.; Cavalcanti-Adam, E.A.; Voss-Böhme, A.; Deutsch, A. Amoeboid-mesenchymal migration plasticity promotes invasion only in complex heterogeneous microenvironments. Sci. Rep. 2017, 7, 1–12. [Google Scholar] [CrossRef] [PubMed]
Figure 1.
HURP expression, spindle association, and distribution in breast epithelial and cancer cell lines of increasing aggressiveness. (A)Immunoblot analysis of total (T) and mitotic (M) protein extracts from MCF10A, T47D, and MDA-MB-231 cells, probed for HURP. α-tubulin serves as a loading control. (B) Representative immunofluorescence images of metaphase-arrested MCF10A, T47D, and MDA-MB-231 cells stained for HURP (green), α-tubulin (magenta), and DNA (blue, Hoechst). Scale bar, 5μm. (C) Quantification of spindle-bound HURP intensity, normalized to α-tubulin, in metaphase cells (MCF10A, n = 28; T47D, n = 34; MDA-MB-231, n = 36). Statistical significance determined by two-tailed Mann-Whitney test: **0.001 < p < 0.01; ****p < 0.0001. Error bars denote SD. (D) Distribution of HURP along the metaphase spindle, expressed as the ratio of HURP Full Width at Half Maximum (FWHM) to Half-Spindle Length (MCF10A, n = 28; T47D, n = 34; MDA-MB-231, n = 39). ****p < 0.0001, Mann-Whitney test, two tailed. Error bars denote SD.
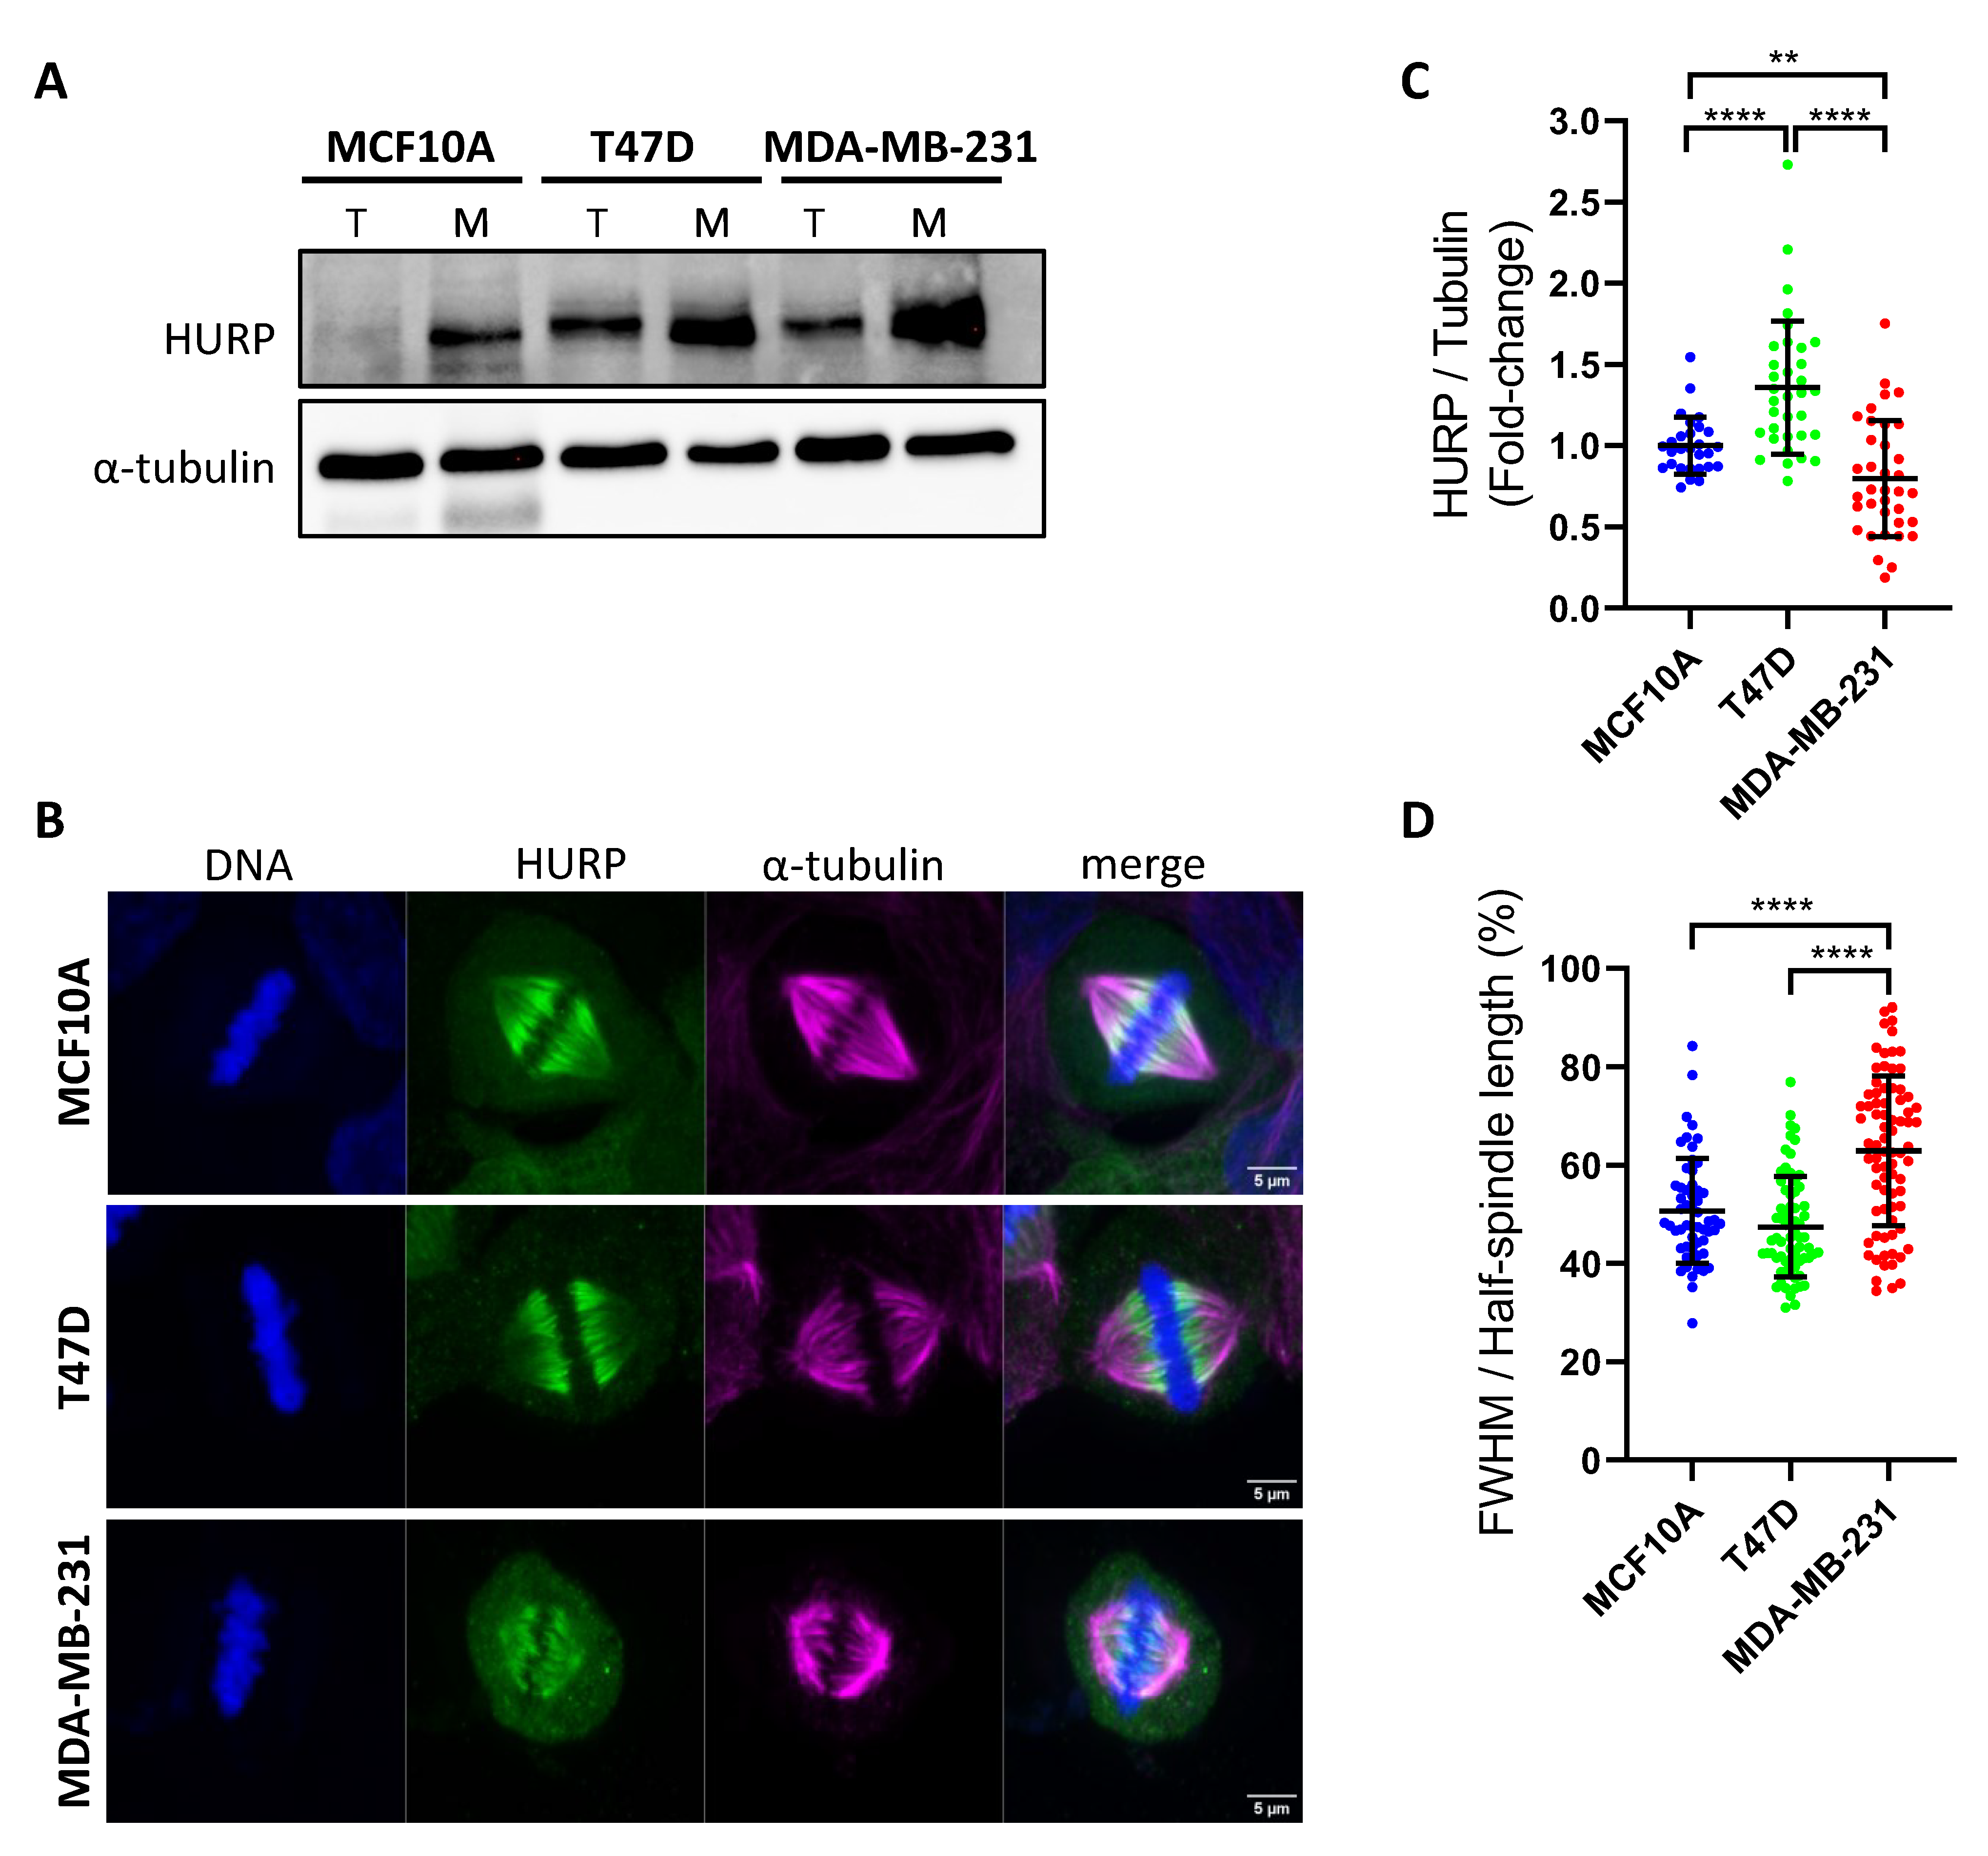
Figure 2.
HURP depletion disrupts mitotic spindle architecture across breast cell lines with differential severity correlating with metastatic potential. (A, C, E) Polar scatter plots of spindle angle versus spindle length measured in three dimensions for each cell line treated with control or HURP siRNA. Mean values ± SD are shown in green (control) and red (HURP siRNA) ((A) MCF10A: control siRNA, n = 41; HURP siRNA, n = 27; (C) T47D: control siRNA, n = 51; HURP siRNA, n = 37; (E) MDA-MB-231: control siRNA, n = 107; HURP siRNA, n = 50). ****p < 0.0001, Mann-Whitney test. (B, D, F) Schematic representation of mitotic spindle parameters quantified before and after HURP siRNA treatment, illustrating spindle length, angle, and architectural measurements analyzed across all cell lines.
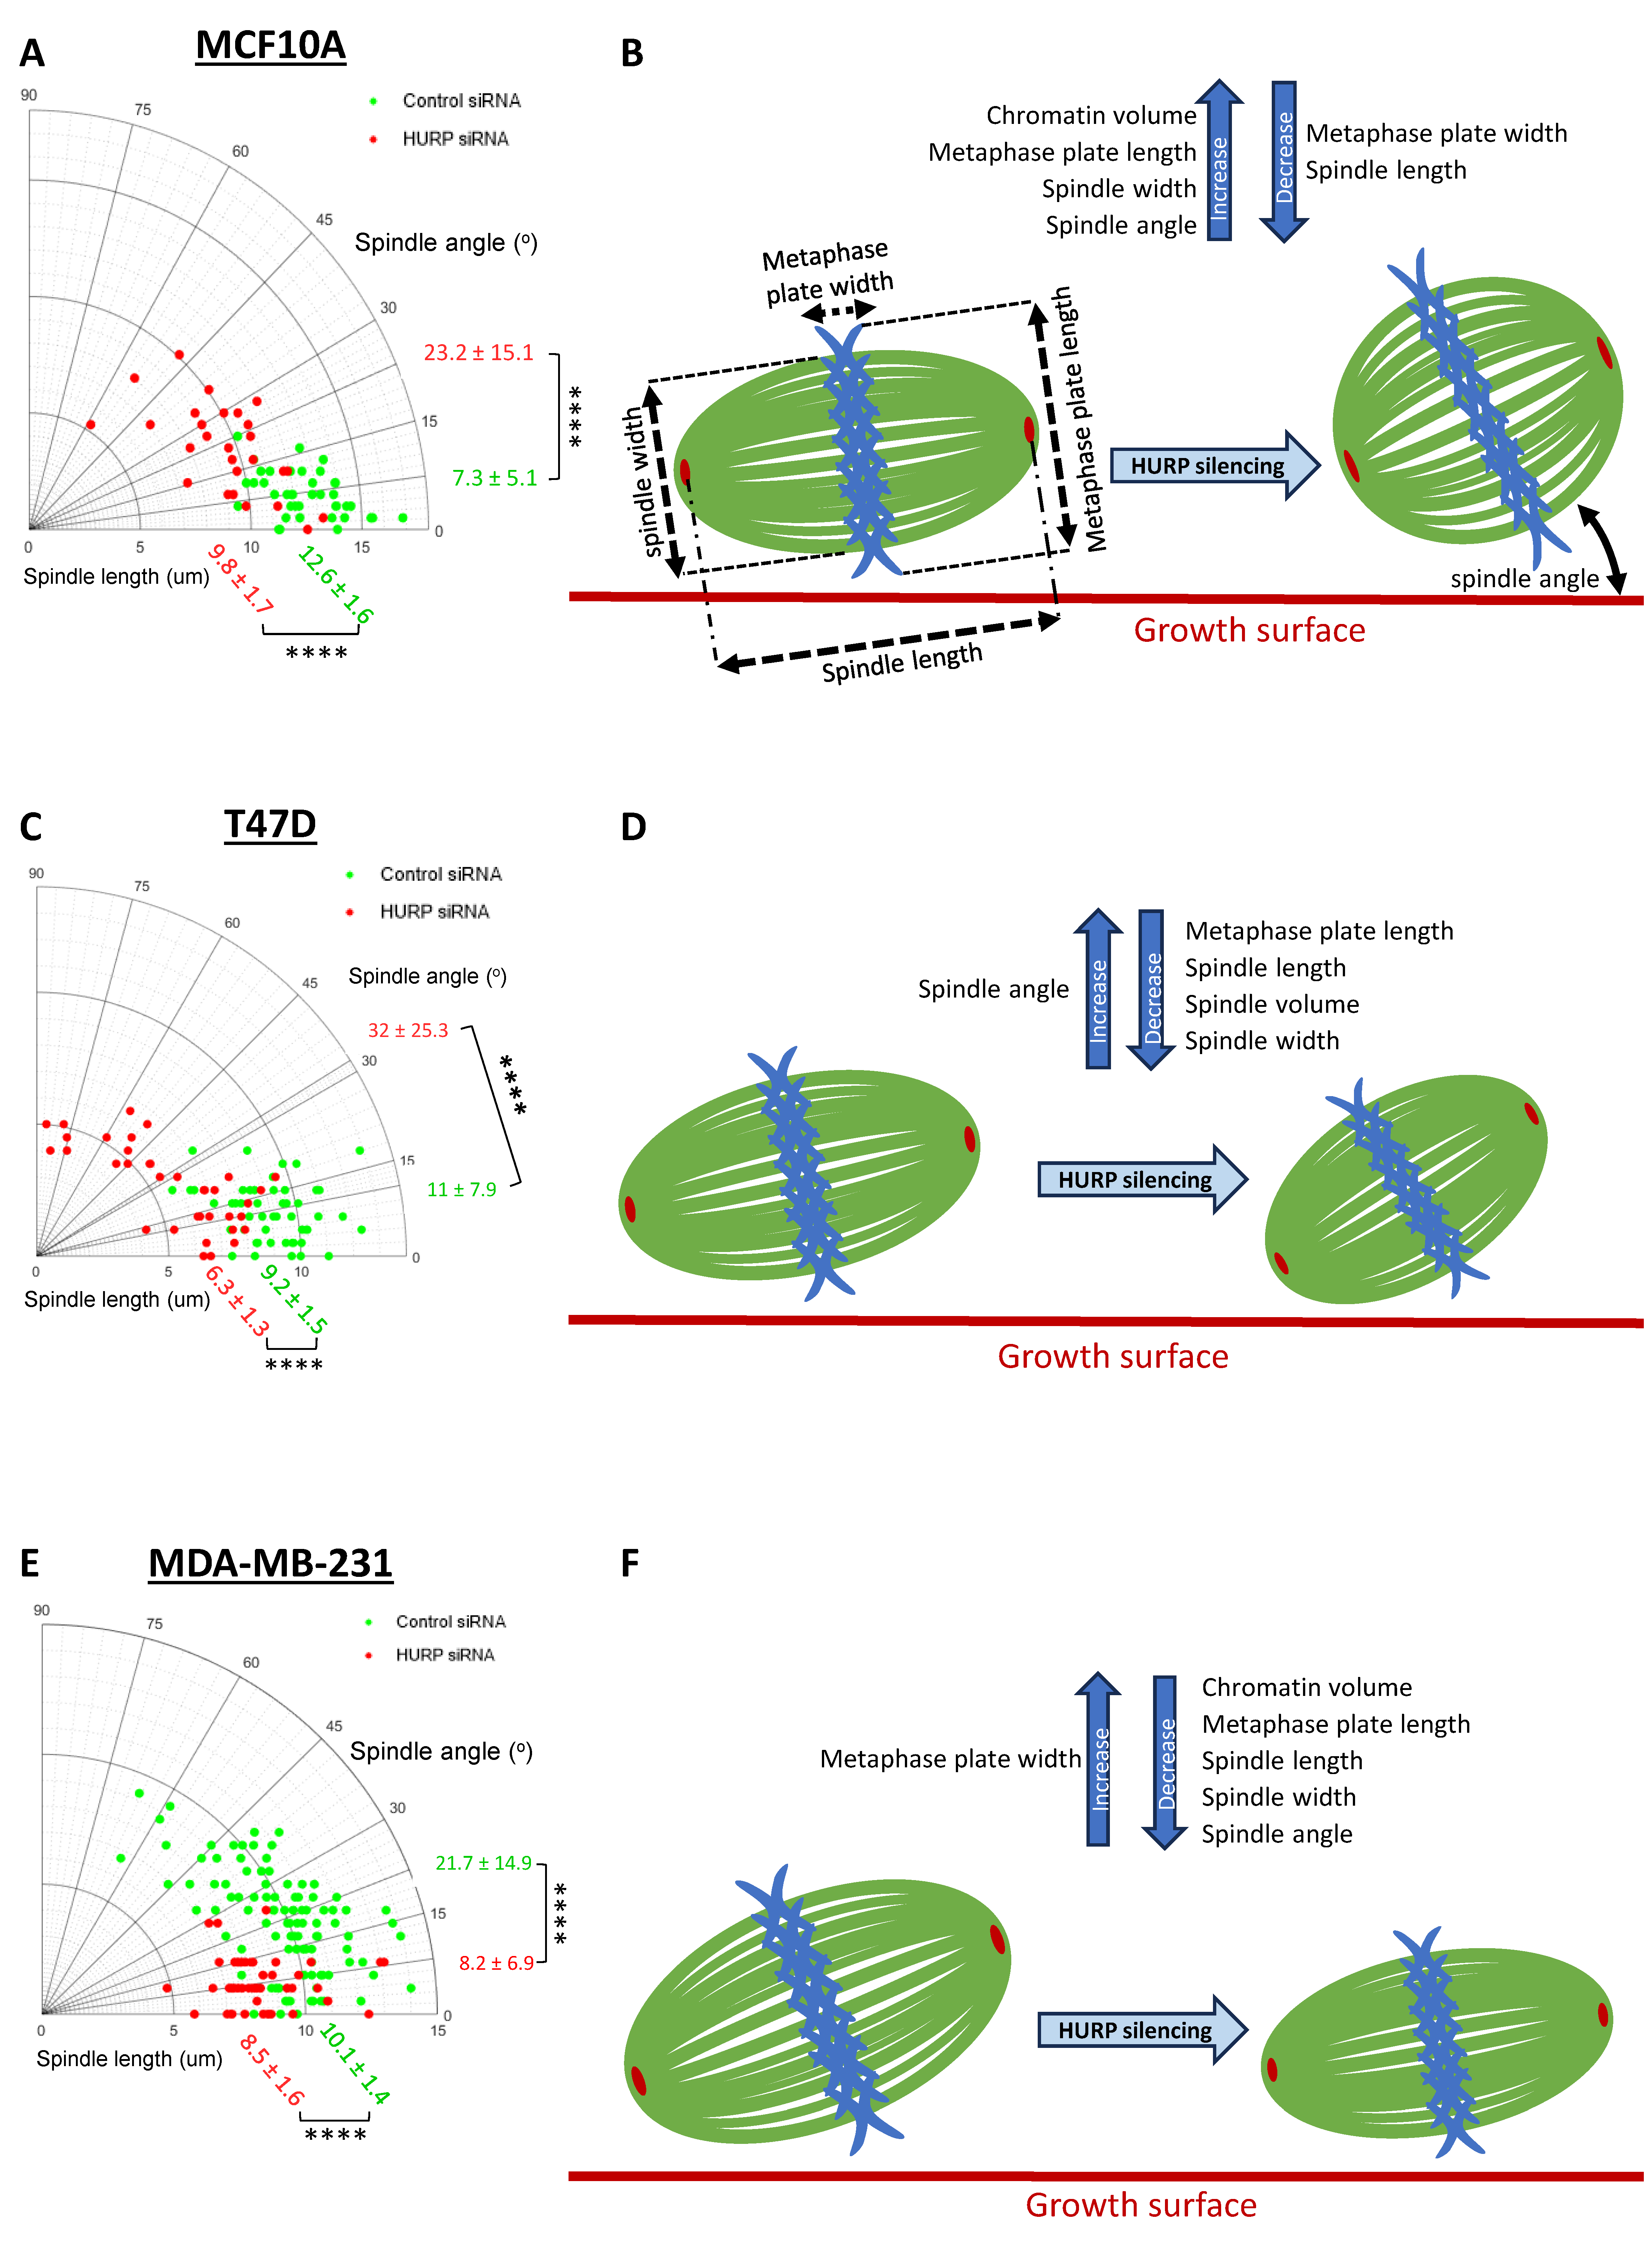
Figure 3.
TPX2 localization and intensity in metaphase spindles following HURP silencing (A) Representative immunofluorescence images of metaphase-arrested MCF10A, T47D and MDA-MB-231 cells treated with control siRNA or HURP siRNA, stained for HURP (green), TPX2 (red) α-tubulin (magenta) and DNA (blue, Hoechst) Scale bar, 5μm. (B) Quantification of spindle-bound TPX2 intensity, normalized to α-tubulin, in each cell line and condition (MCF10A: control, n = 43; HURP siRNA, n = 35; T47D: control, n = 73; HURP siRNA, n = 45; MDA-MB-231: control, n = 25; HURP siRNA, n = 41). *0.01 < p < 0.05; ****p < 0.0001, two-tailed Mann-Whitney test. Error bars denote SD. (C) Distribution of TPX2 along the metaphase spindle, expressed as the area under curve (AUC) of plot profile of each spindle (MCF10A: control, n = 43; HURP siRNA, n = 35; T47D: control, n = 76; HURP siRNA, n = 45; MDA-MB-231: control, n = 36; HURP siRNA, n = 51). *0.01 < p < 0.05; ns, not significant; Mann-Whitney test, two tailed. Error bars denote SD.
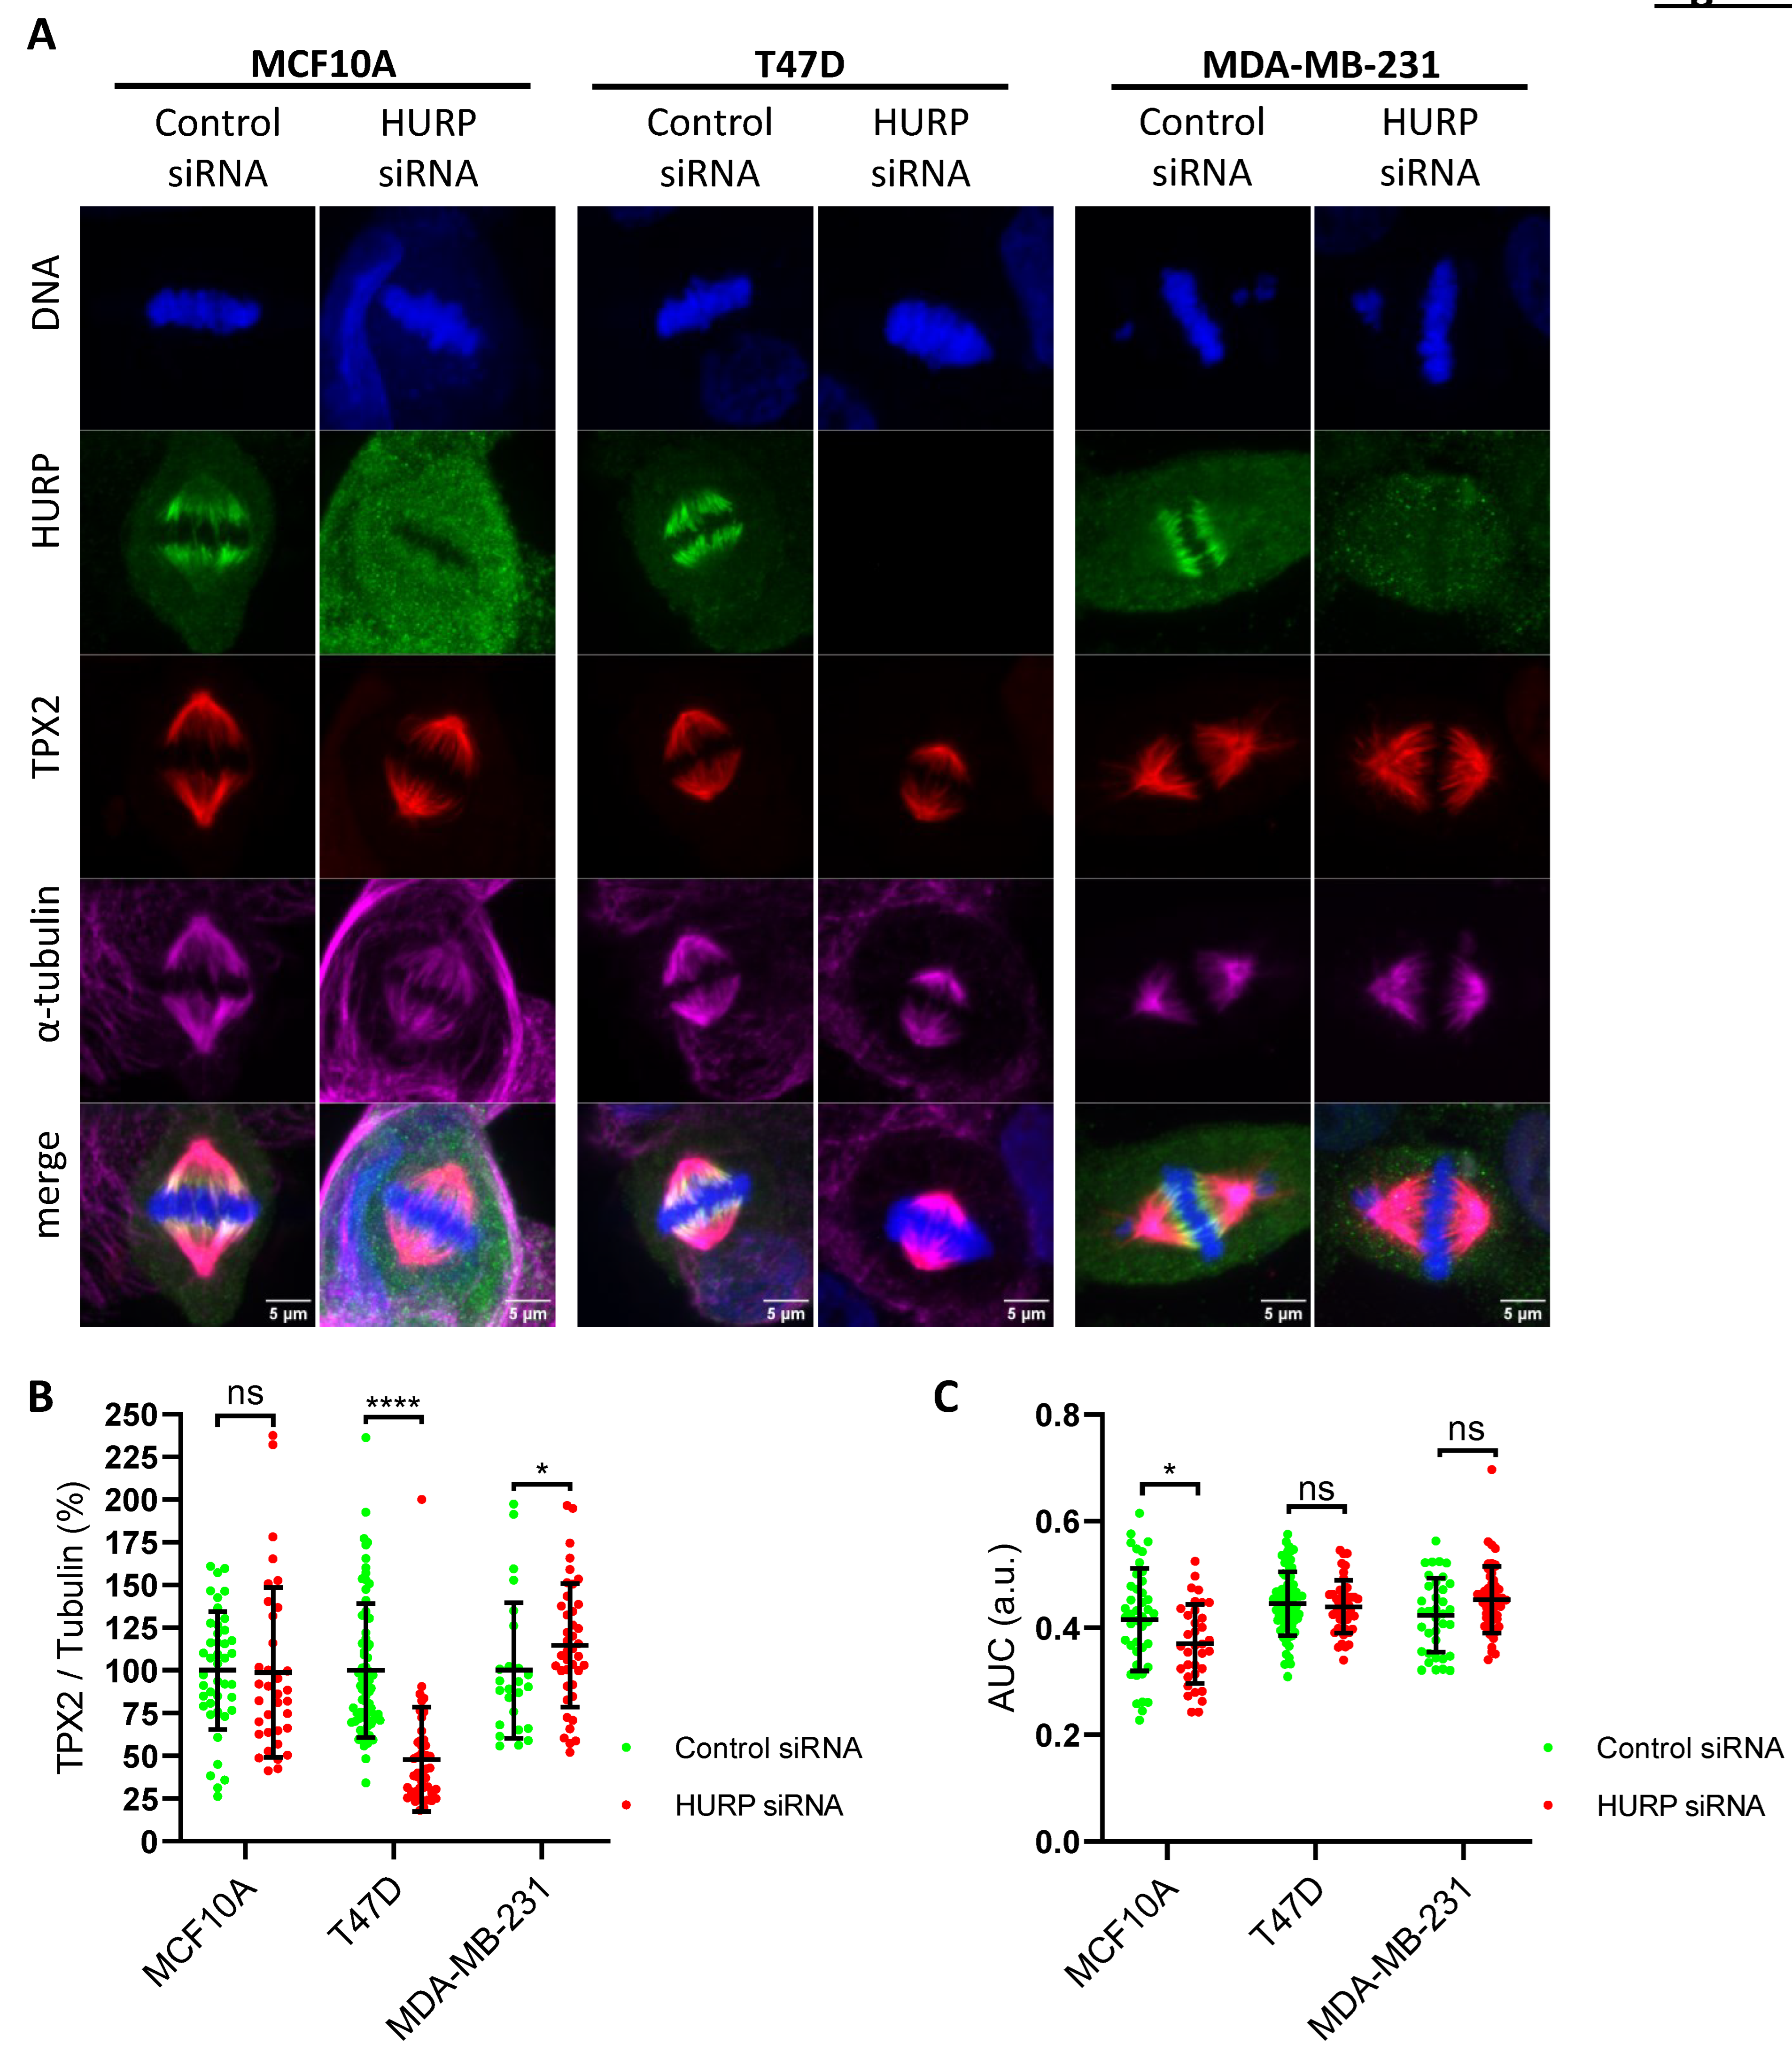
Figure 4.
Aurora-A localization and intensity in metaphase after HURP silencing (A) Representative immunofluorescence images of metaphase-arrested MCF10A, T47D and MDA-MB-231 cells treated with control siRNA or HURP siRNA, stained for HURP (green), Aurora-A (red) and α-tubulin (magenta). Scale bar, 5μm. (B) Quantification of spindle-associated Aurora-A intensity, normalized to α-tubulin, in each cell line and condition (MCF10A: control, n = 50; HURP siRNA, n = 27; T47D: control, n = 38; HURP siRNA, n = 26; MDA-MB-231: control, n = 58; HURP siRNA, n = 62). ***0.0001 < p < 0.001; ns, not significant; two-tailed Mann-Whitney test. Error bars denote SD. (C) Distribution of Aurora-A along the metaphase spindle, expressed as the area under curve (AUC) of plot profile of each spindle (MCF10A: control, n = 84; HURP siRNA, n = 49; T47D: control, n = 38; HURP siRNA, n = 33; MDA-MB-231: control, n = 34; HURP siRNA, n = 62). ***0.0001 < p < 0.001; ****p < 0.0001, Mann-Whitney test, two tailed. Error bars denote SD.
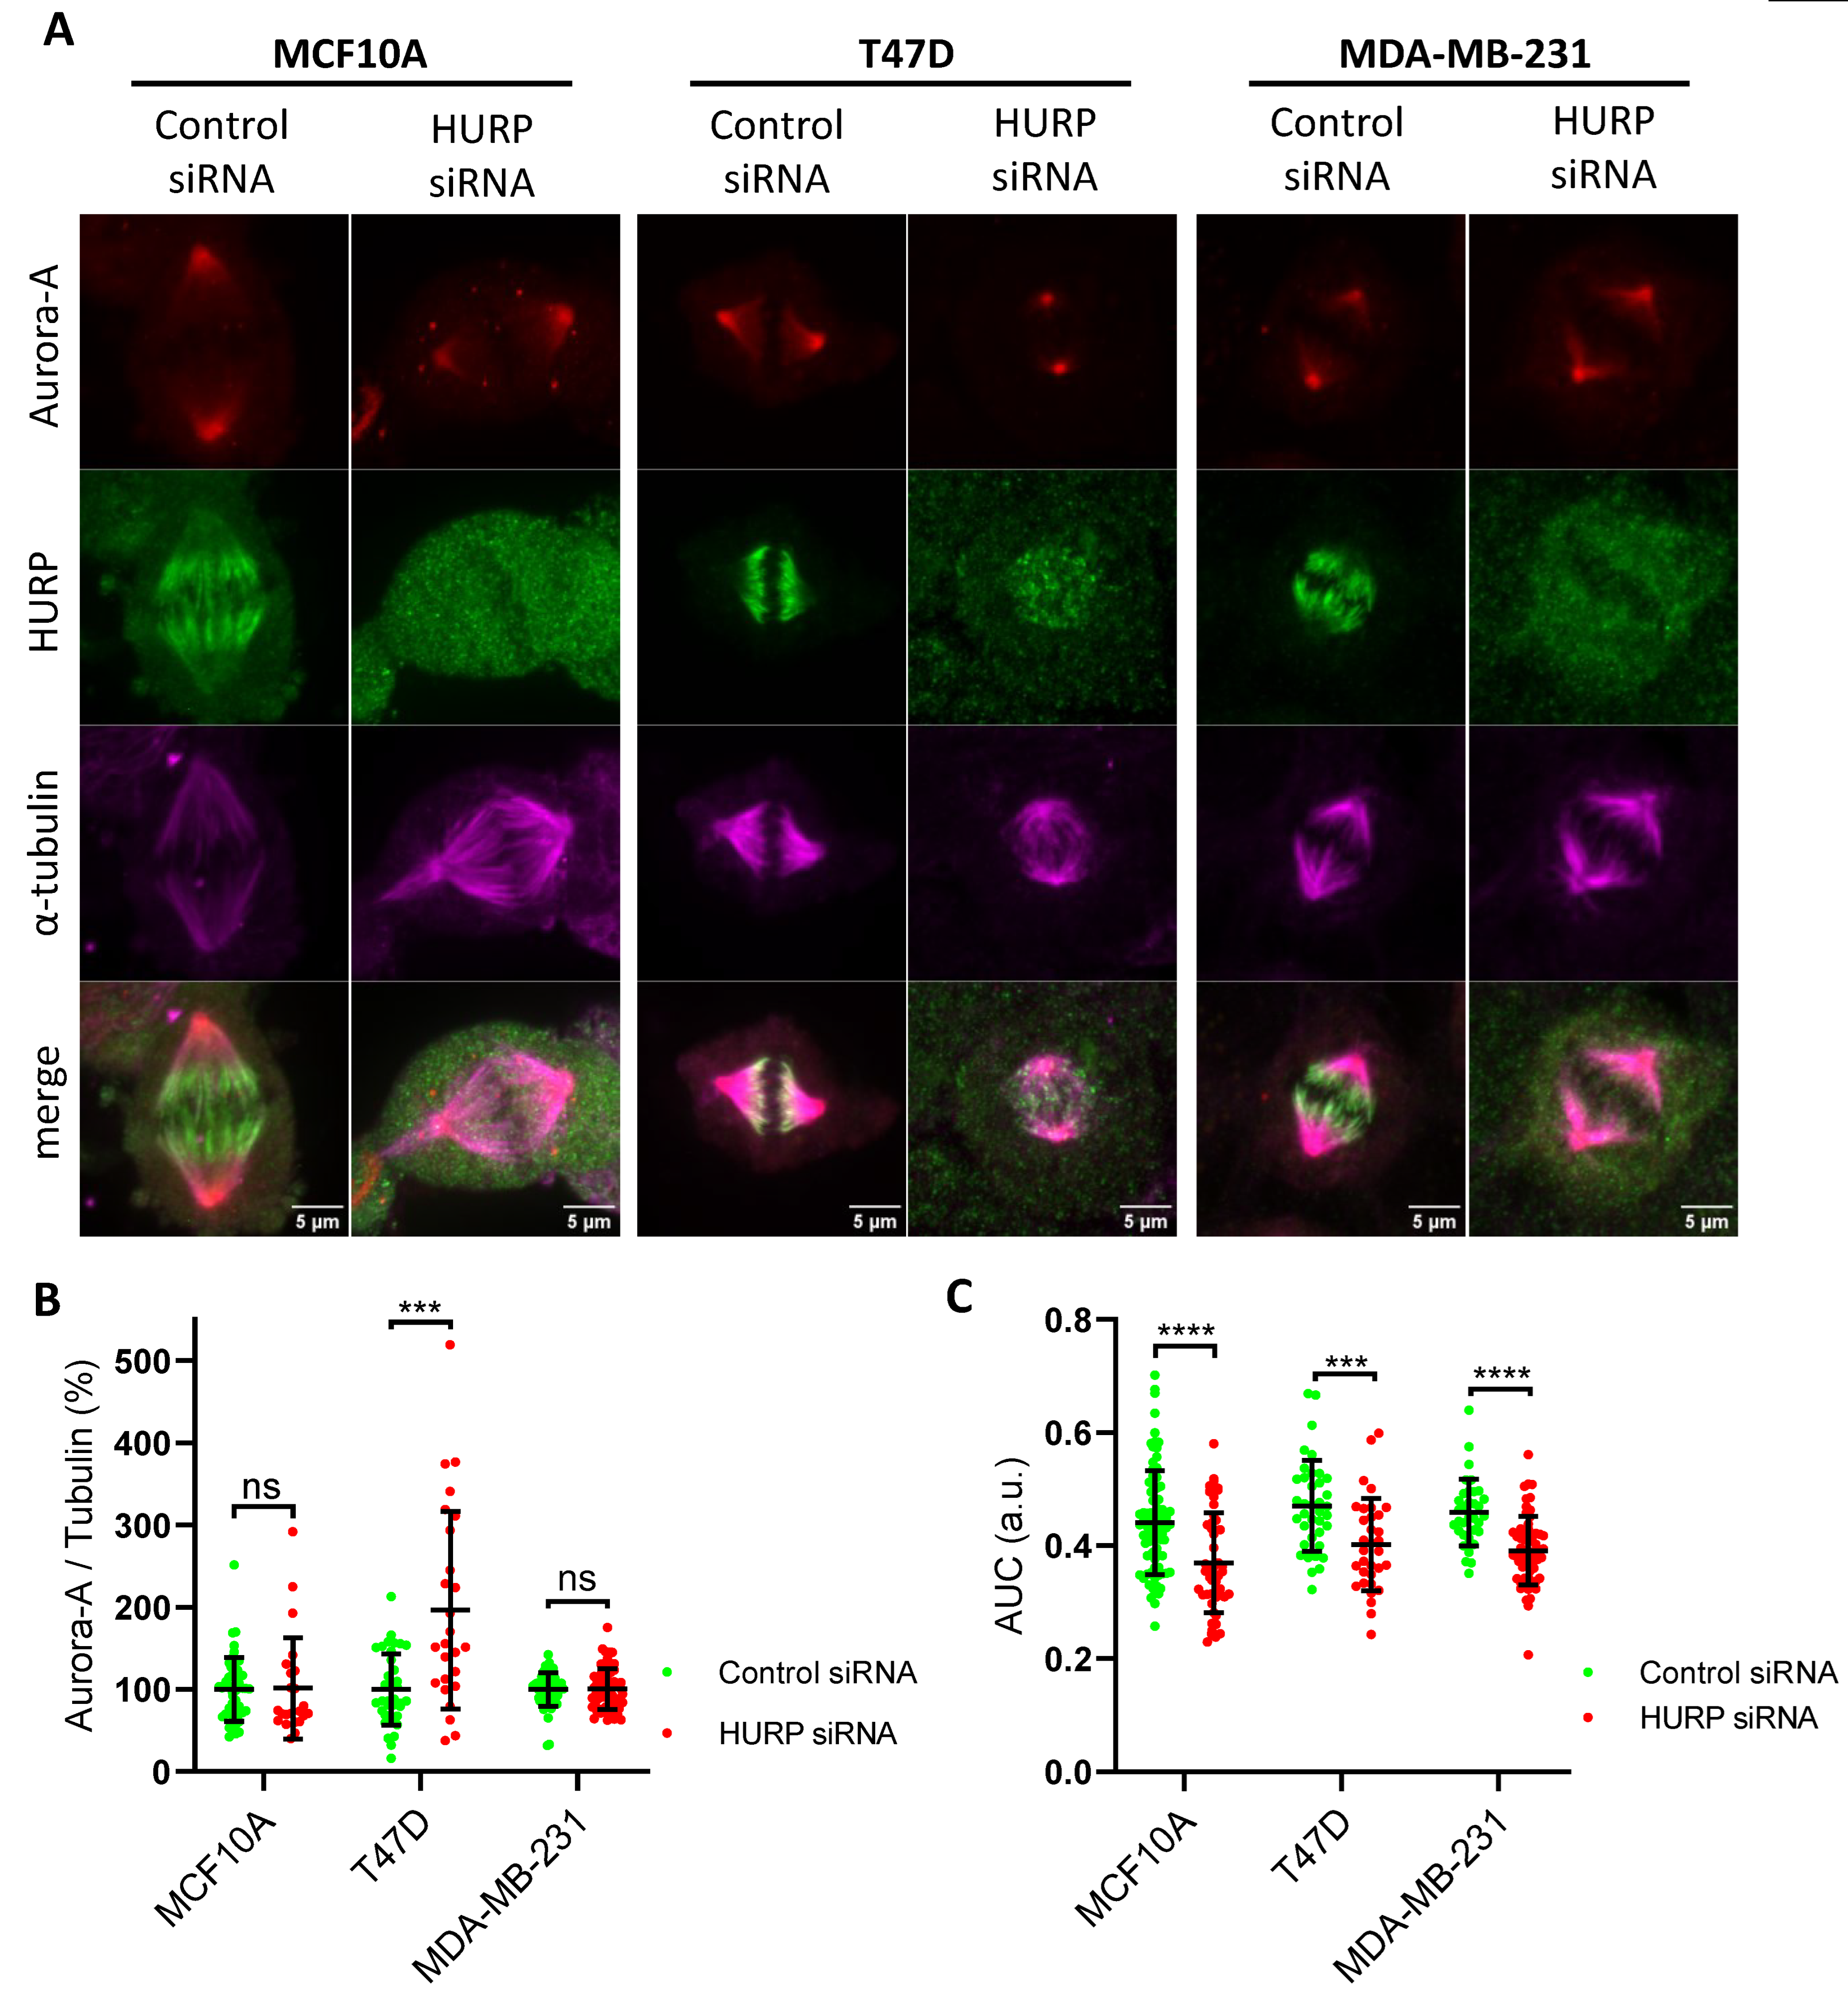
Figure 5.
Quantification of spindle-bound NuMA in metaphase following HURP depletion. (A) Representative immunofluorescence images of metaphase MCF10A, T47D, and MDA-MB-231 cells treated with control or HURP siRNA, stained for HURP (green), NuMA (red), α-tubulin (magenta), and DNA (blue, Hoechst). Scale bar, 5μm. (B) Quantification of spindle-bound NuMA intensity, normalized to α-tubulin, in each cell line and condition (MCF10A: control, n = 32; HURP siRNA, n = 28; T47D: control, n = 82; HURP siRNA, n = 51; MDA-MB-231: control, n = 41; HURP siRNA, n = 45). *0.01 < p < 0.05; ****p < 0.0001, two-tailed Mann-Whitney test. Error bars denote SD. (C) Distribution of NuMA along the metaphase spindle, expressed as the area under curve (AUC) of plot profile of each spindle (MCF10A: control, n = 68; HURP siRNA, n = 37; T47D: control, n = 98; HURP siRNA, n = 124; MDA-MB-231: control, n = 92; HURP siRNA, n = 65). ***0.0001 < p < 0.001; ****p < 0.0001; ns, not significant; Mann-Whitney test, two tailed. Error bars denote SD.
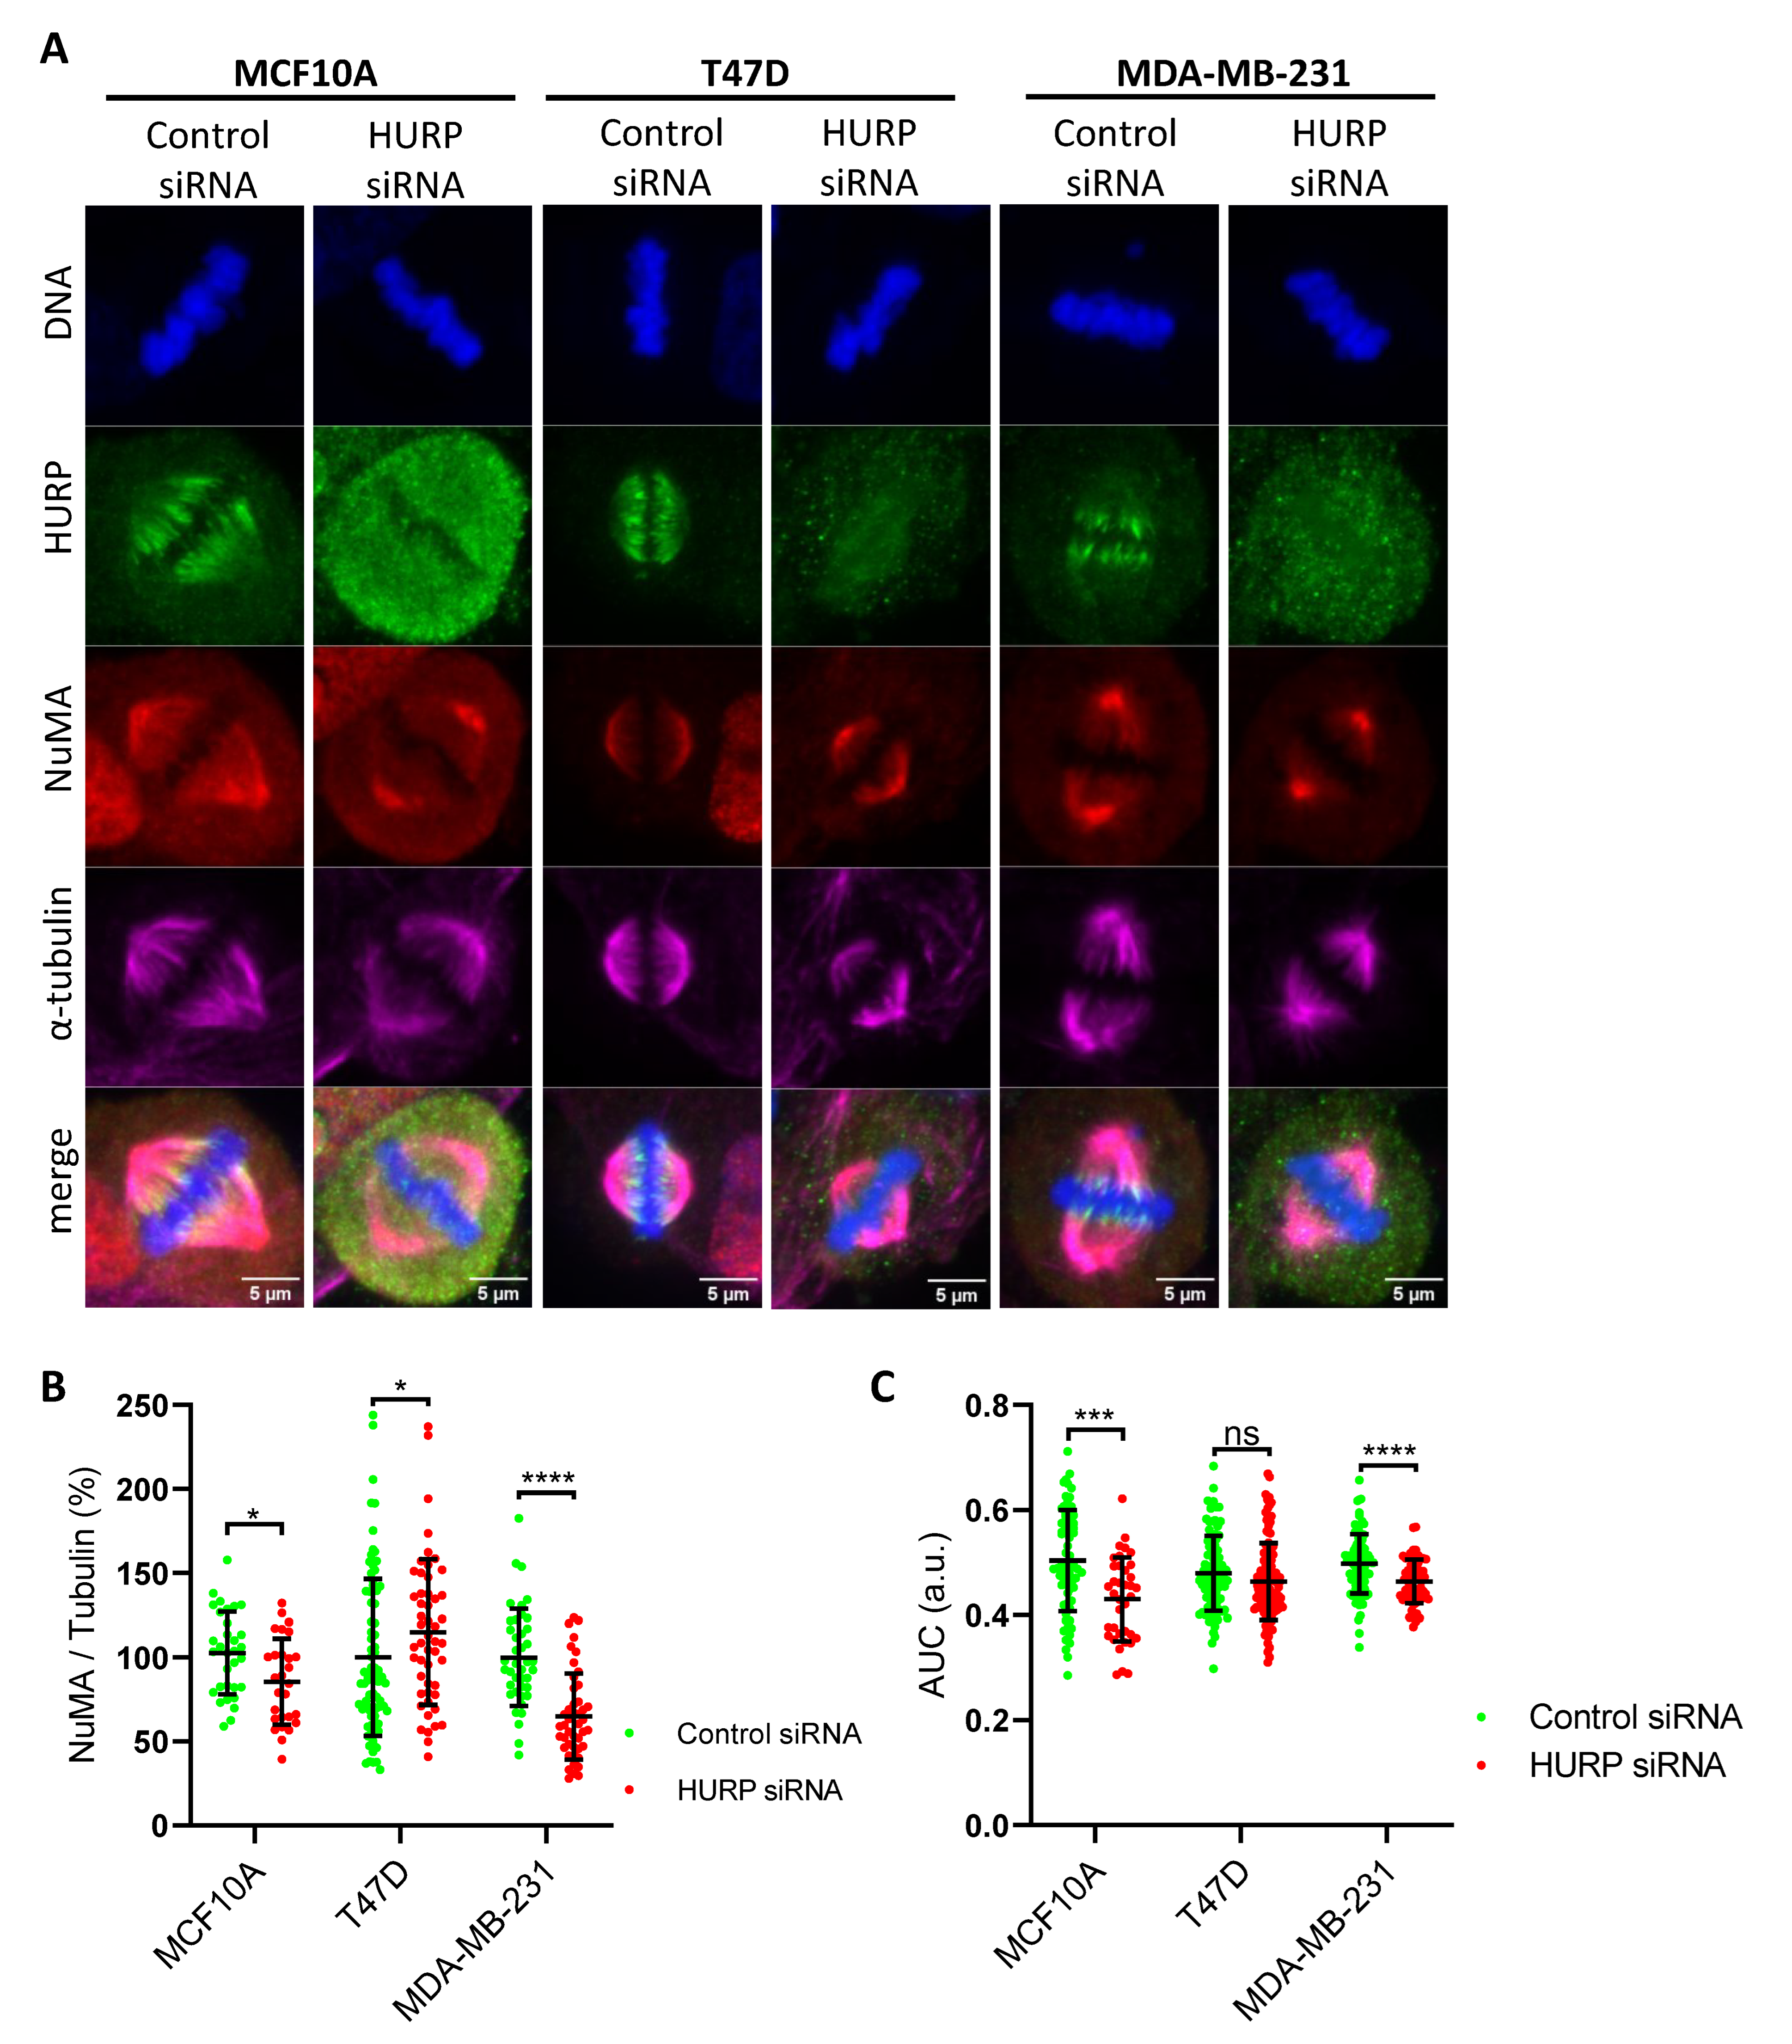
Figure 6.
HURP silencing impairs collective migration and alters single-cell motility in breast cell lines. (A, D) Representative time-lapse images of scratch assays in MCF10A (A) and MDA-MB-231 (D) cells treated with control or HURP siRNA at 0 and 18 hours. Scale bar, 100μm. (B, E) Quantification of gap closure over time for MCF10A (B) and MDA-MB-231 (E) cells (MCF10A: control, N = 3 fields; HURP siRNA, N = 2; MDA-MB-231: control, N = 1; HURP siRNA, N = 2). (C, F) Mean front velocity of MCF10A (C) and MDA-MB-231 (F) cells after control or HURP siRNA (MCF10A: control, n = 52; HURP siRNA, n = 35; MDA-MB-231: control, n = 18; HURP siRNA, n = 36). *0.01 < p < 0.05, two-tailed Mann-Whitney test. Error bars denote SD. (G) Mean square displacement (MSD) analysis of single-cell motility for each cell line and condition, with α exponent values and 95% confidence intervals indicated. i. MCF10A (control siRNA, α = 0.90, 95% CI 0.70 to 1.13; HURP siRNA, α = 1.09, 95% CI 0.99 to 1.18;) ii. T47D (control siRNA, α = 0.79, 95% CI 0.72 to 0.85; HURP siRNA, α = 0.95, 95% CI 0.87 to 1.03;) iii. MDA-MB-231 (control siRNA, α = 1.42, 95% CI 1.30 to 1.54; HURP siRNA, α = 0.97, 95% CI 0.90 to 1.02;).
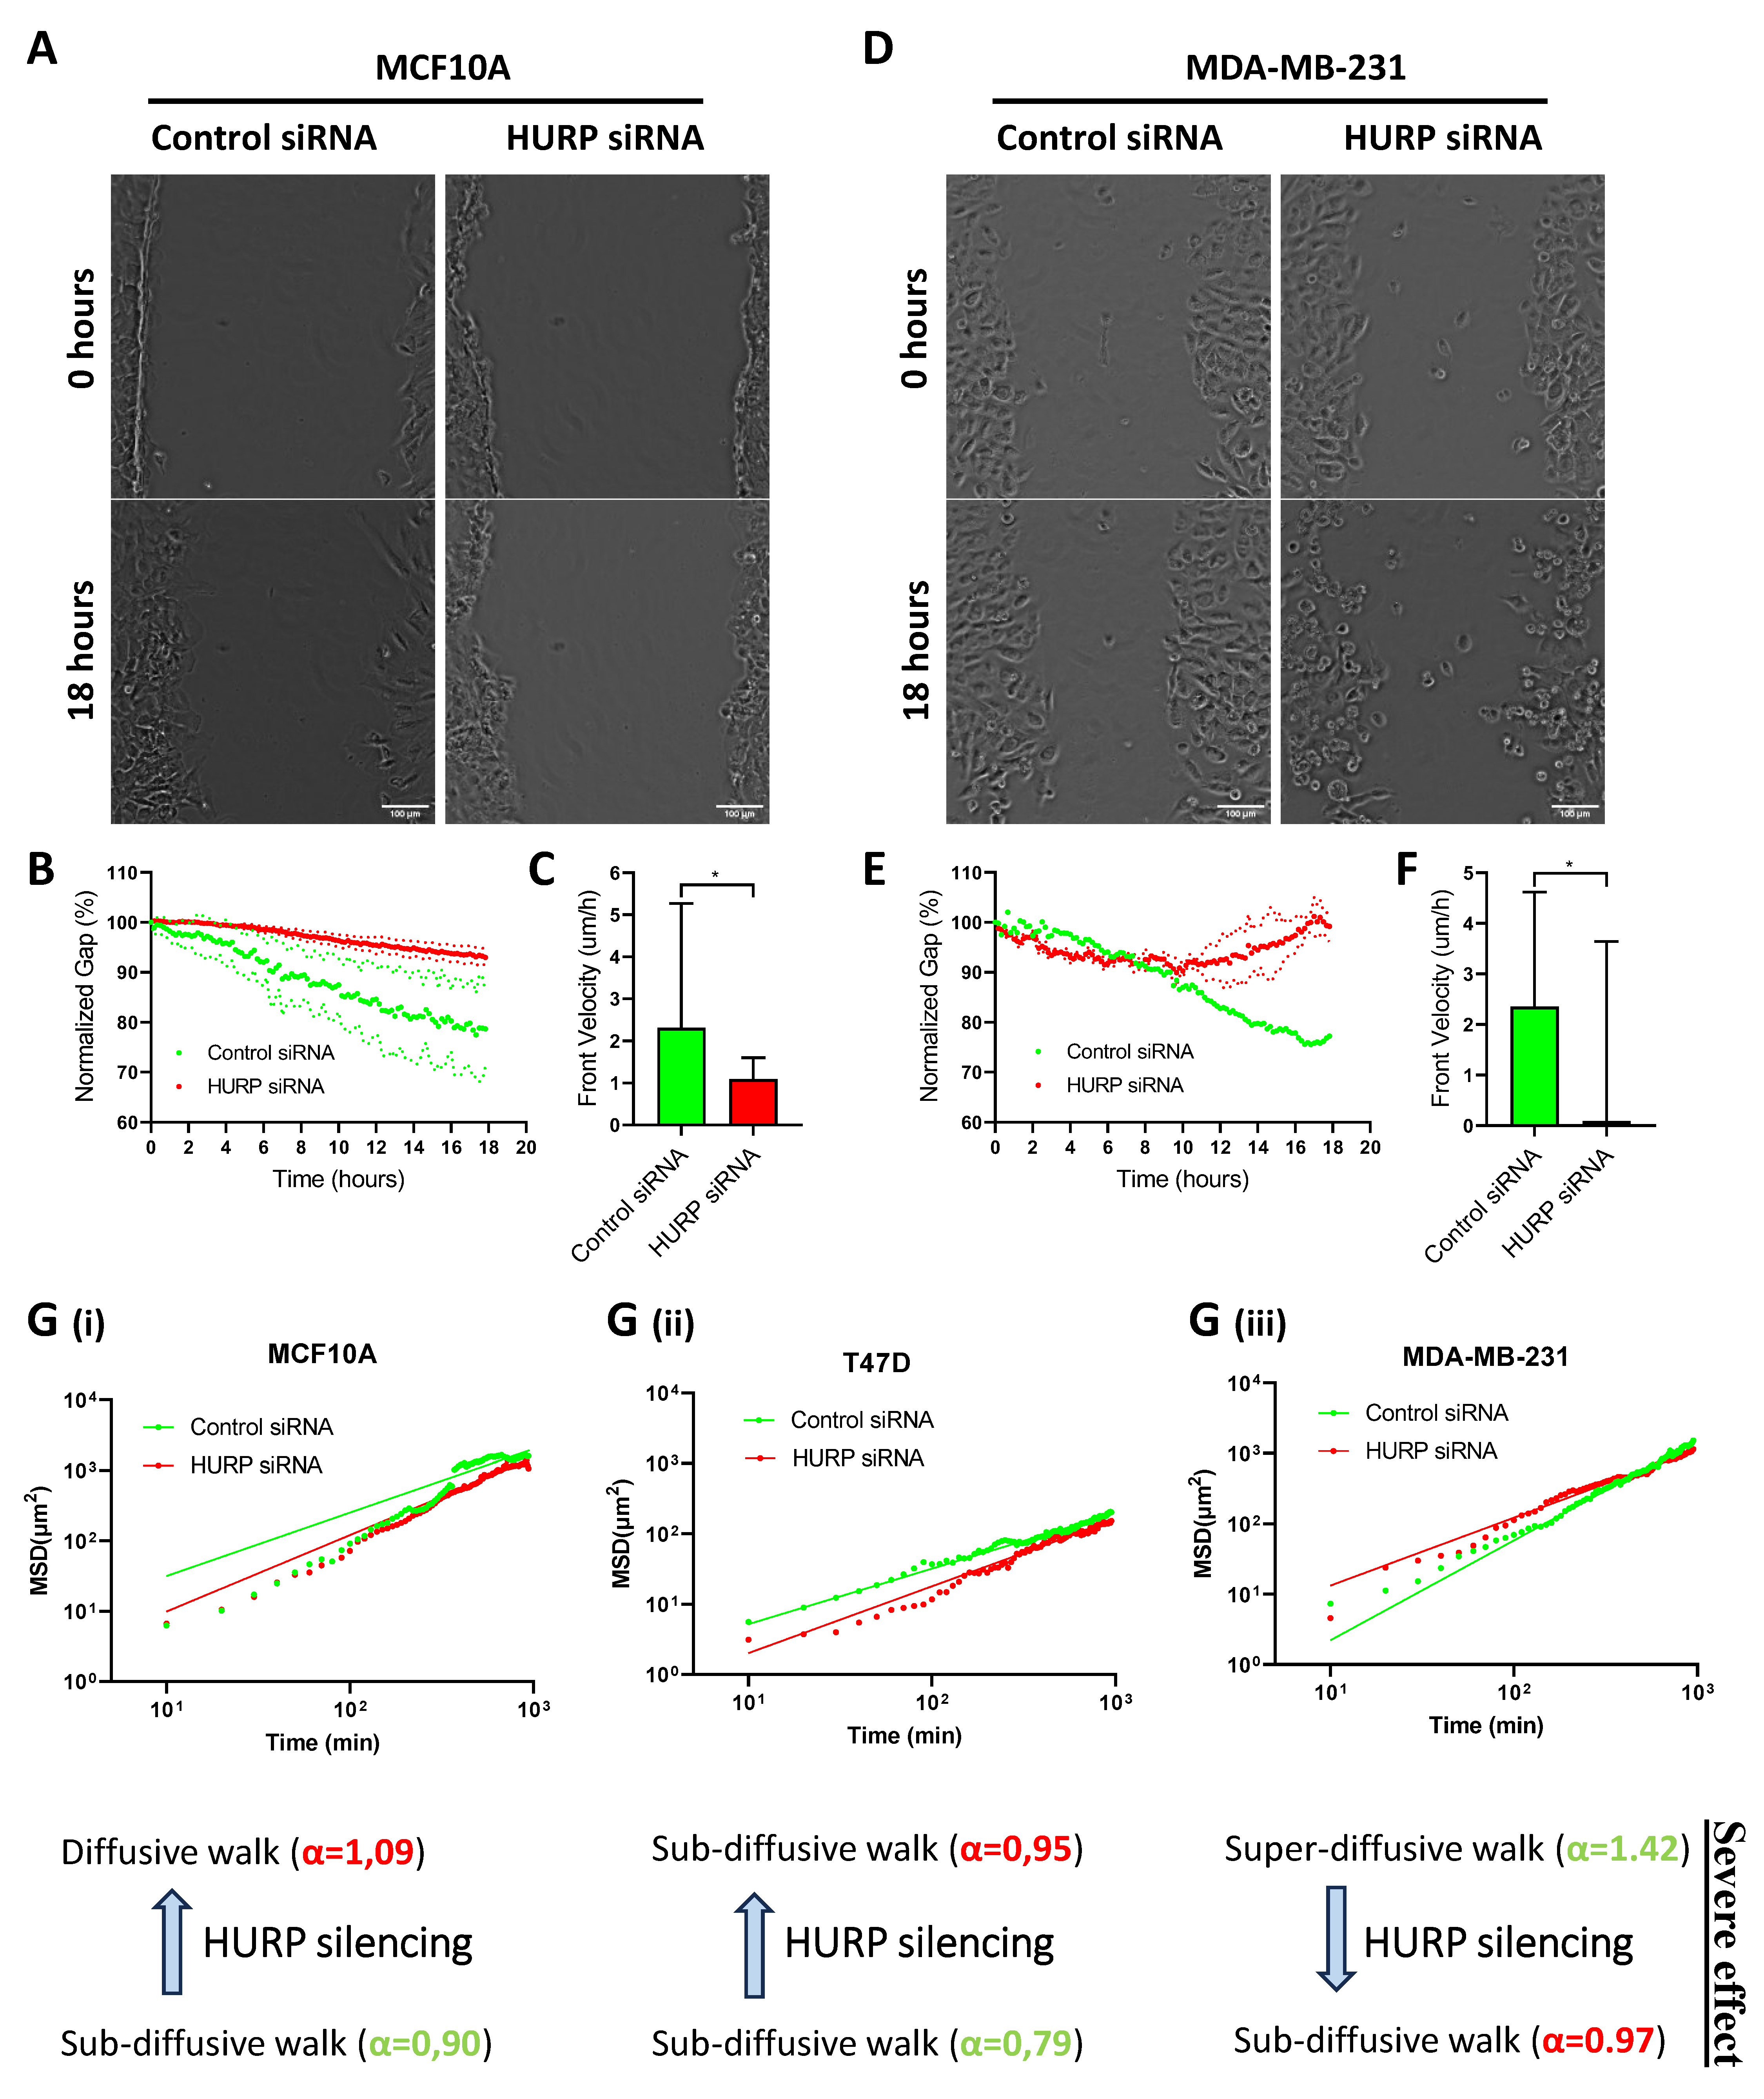
Figure 8.
Schematic model summarizing the cellular and molecular consequences of HURP silencing across a metastatic gradient. (A-C) Diagram illustrating the distinct phenotypic effects of HURP depletion in MCF10A (A), T47D (B), and MDA-MB-231 (C) cells, including alterations in spindle organization, spindle-associated protein localization, migration mode, cell cycle progression, and 3D spheroid architecture.
Disclaimer/Publisher’s Note: The statements, opinions and data contained in all publications are solely those of the individual author(s) and contributor(s) and not of MDPI and/or the editor(s). MDPI and/or the editor(s) disclaim responsibility for any injury to people or property resulting from any ideas, methods, instructions or products referred to in the content. |
© 2025 by the authors. Licensee MDPI, Basel, Switzerland. This article is an open access article distributed under the terms and conditions of the Creative Commons Attribution (CC BY) license (http://creativecommons.org/licenses/by/4.0/).
Copyright: This open access article is published under a Creative Commons CC BY 4.0 license, which permit the free download, distribution, and reuse, provided that the author and preprint are cited in any reuse.


