
Submitted:
01 August 2025
Posted:
07 August 2025
You are already at the latest version
Abstract
Cell membranes and cytoskeleton play a crucial role in regulating cellular responses by mediating mechanical forces and physical stimuli from the microenvironment through their viscoelastic properties. Investigating these properties provides valuable insights into disease mechanisms and therapeutic strategies. Gold nanorods (GNRs), especially under irradiation, exhibit lethal effects against Leishmania parasites through plasmonic photothermal conversion. However, their mechanical interaction with cells remains poorly understood. Here, Defocusing Microscopy (DM), a quantitative phase microscopy technique, was employed to analyze membrane fluctuations in macrophages (M∅s) exposed to GNRs and infected with Leishmania amazonensis. Measuring the membrane-cytoskeleton fluctuation of defocused images, we quantified viscoelastic parameters such as bending modulus (kc) and viscosity (η), enabling a detailed char-acterization of membrane behavior. Results indicate that infection increases both kc and η, while IC50 treatment reduces infection and selectively increases kc without affecting viscosity. In healthy macrophages, GNRs reduced both parameters, suggesting a fluidizing effect. These findings contribute to a deeper understanding of GNRs' therapeutic performance and cytotoxicity, contributing to improved phototherapy applications.
Keywords:
gold nanorods
; defocusing microscopy
; viscoelastic properties
; leishmaniasis
1. Introduction
In the study of biological systems, the analysis of changes in intracellular components such as the plasma membrane and attached cytoskeleton, is essential for under-standing drugs or pathogen interactions with cells. In addition to playing a crucial role in the mechanical properties of cells and the organization of tissues [1], these structures enable cells to respond to stimuli from their microenvironment, such as tension, shear stress, hydrostatic pressure, and compression, through mechanical and physical processes described by the viscoelastic properties of cell dynamics [2,3].
Investigating variations in these properties, especially in macrophages (Ms), immune cells derived from the bone marrow [1], contributes to the analysis of disease progression, cellular processes, and the development of new drugs and therapies [4,5].
Leishmaniasis is a group of diseases transmitted to humans and other mammals through the bite of infected female phlebotomine sandflies. According to the Pan American Health Organization (PAHO) and the World Health Organization (WHO), it is a serious global public health problem, classified as an emerging and neglected disease [6]. Among its clinical forms, cutaneous leishmaniasis (CL) is the most prevalent, endemic in over 98 countries, with an estimated 12 million cases and about 2.5 million new cases reported annually [6].
Current treatments remain largely limited to expensive drugs that often cause adverse effects. This situation is further aggravated by the emergence of drug-resistant parasite strains, which compromise therapeutic efficacy and patient adherence [7,8,9].
Gold nanorods (GNRs) have emerged as promising nanosystems due to their intrinsic antiparasitic activity against Leishmania species [5,7]. This activity is intensified when combined with irradiation, exploiting their unique optical properties derived from surface plasmon resonance (SPR) [10]. Upon irradiation, GNRs convert near-infrared light into localized heat through rapid photothermal effects, effectively damaging parasites and infected cells [10,11].
Although GNRs hold significant therapeutic potential, their interaction with cells must be carefully evaluated due to possible cytotoxic effects, which vary depending on concentration, surface chemistry, and cell type. Although internalization via mechanisms such as endocytosis and pinocytosis is well documented, the effects of GNRs on cellular biomechanics during and after uptake remain insufficiently understood [12,13].
In this context, phase imaging techniques such as Defocusing Microscopy (DM) provide powerful resources for real-time analysis of membrane dynamics. Traditional methods used to investigate cellular mechanics, such as atomic force microscopy (AFM) and optical tweezers, although precise, rely on direct mechanical manipulation [14]. Fluorescence-based approaches often require labeling agents that may alter cell dynamics or induce phototoxicity [15]. In contrast, DM offers a label-free and non-invasive alternative that preserves the native physiological conditions of the sample.
Most biological materials, such as cells, are considered phase objects, as they do not absorb a significant amount of light when observed under an optical microscope. In other words, when in focus, these samples do not exhibit discernible light intensity variations [16]. In DM, the observed contrast of phase objects is zero in the focal plane and becomes visible when the sample is defocused, reflecting local variations in membrane-cytoskeleton fluctuations that are associated with the mechanical properties of the cell. These fluctuations allow quantification of parameters such as the bending modulus (), which indicates the cell’s surface resistance to curvature, and viscosity (), related to the fluid’s resistance to flow [17,18].
In this study, DM was employed to explore the mechanical behavior of macrophage exposed to gold nanorods and infected with Leishmania amazonensis, a causative agent of CL, aiming to better understand cell–nanoparticle interactions relevant to therapeutic approaches. Our findings provide deeper insights into Leishmania-cell interactions by assessing changes in cell viscoelasticity and the effectiveness of GNRs against parasites, contributing to improved phototherapy applications and a more comprehensive view of the biophysical system.
2. Materials and Methods
2.1. Cell Lines and Parasite Strains
The THP-1 macrophage cell line (ATCC® TIB-202™) was derived from the peripheral blood of a patient with acute monocytic leukemia [19] and was obtained from the American Type Culture Collection (ATCC), provided by the René Rachou Research Institute.
The World Health Organization (WHO) reference strain Leishmania (Leishmania) amazonensis (IFLA/BR/1967/PH8) was used in this study. The parasites were previously transfected with the pIR1SAT-LUC(a)-DsRed2(b) (B5947) constructs [20], which contain the red fluorescent protein (RFP) gene DsRed2, encoding a protein that emits red fluorescence at a wavelength of 590 nm when excited by green light at 546 nm. The strain was typed as previously described [21], and was also provided by the René Rachou Research Institute.
2.2. Chemical Reagents and Solutions
Gold nanorods were synthesized using reagents acquired from Sigma-Aldrich Chemical Co. (USA): chloroauric acid (HAuCl4, ≥99.0%), cetyltrimethylammonium bromide (CTAB, ≥98.0%), silver nitrate (AgNO3, ≥99.0%), and sodium borohydride (NaBH4, ≥96.0%). Resveratrol (≥98%) was obtained as a pharmaceutical-grade compound imported from China by Fagron BR. Analytical grade ethanol was used without further purification. All solutions were prepared with ultrapure Milli-Q water (resistivity = 18 MΩ·cm) produced by a Millipore system.
2.3. Cell Culture and Parasite Maintenance Protocols
THP-1 macrophages were cultured in RPMI 1640 medium (Sigma, St. Louis, MO, USA) supplemented with hypoxanthine, HEPES, dextrose, sodium bicarbonate, L-glutamine, and 10% fetal bovine serum. Cultures were maintained at 37 °C, 95% humidity and 5% CO₂. Cell viability and counting were routinely assessed using the trypan blue exclusion method.
To maintain infectivity, Leishmania amazonensis parasites were continuously passaged in BALB/c mice (Mus musculus), and amastigotes were isolated from footpad lesions. These were subsequently differentiated into promastigotes, cultured in T25 cell culture flasks containing alpha-MEM medium (Sigma) supplemented with 10% fetal bovine serum, 5 µg/mL hemin, and 5 µM biopterin, at pH 7 and 25 °C. Parasite passages were performed every three days, using 1 × 10⁶ parasites per inoculum in 5 mL of complete alpha-MEM medium. For long-term storage, parasites were cryopreserved in a medium containing 20% fetal bovine serum and 10% dimethyl sulfoxide (DMSO) at –80 °C.
To maintain infectivity, Leishmania amazonensis parasites were continuously passaged in BALB/c mice (Mus musculus), and amastigotes were isolated from footpad lesions. These were subsequently differentiated into promastigotes, cultured in T25 cell culture flasks containing alpha-MEM medium (Sigma) supplemented with 10% fetal bovine serum, 5 µg/mL hemin, and 5 µM biopterin, at pH 7 and 25 °C. Parasite passages were performed every three days, using 1 × 10⁶ parasites per inoculum in 5 mL of complete alpha-MEM medium. For long-term storage, parasites were cryopreserved in a medium containing 20% fetal bovine serum and 10% dimethyl sulfoxide (DMSO) at –80 °C.
For differentiation, 4 × 10⁵ THP-1 cells (2 × 10⁵ cells/mL in 2 mL per well) were seeded into 35 mm Glass Bottom Dishes (Cellvis) featuring a 20 mm diameter coverslip at the bottom and incubated for 72 hours in RPMI 1640 medium supplemented with 50 ng/mL phorbol 12-myristate 13-acetate (PMA).
THP-1 macrophages (ATCC® TIB-202™) were infected with Leishmania promastigotes at a 10:1 parasite-to-cell ratio for 4 hours [22]. Following infection, cells were washed with RPMI medium to remove extracellular parasites. Infected macrophages were then treated with a concentration equivalent to the IC₅₀, adjusted for CTAB content, and incubated under the same culture conditions for subsequent analysis by defocusing and fluorescence microscopy.
The cytotoxicity and anti-amastigote assays were previously established by our research group using validated protocols with differentiated THP-1 cells and Leishmania infection models. CC₅₀ and IC₅₀ values were determined based on the results obtained in these assays [5].
2.4. Gold Nanorods Synthesis and Physicochemical Characterization
GNRs were synthesized according to a seedless synthesis protocol adapted from [23,24]. The growth solution was prepared by the gradual mixing of aqueous CTAB solution, aqueous HAuCl4 solution, aqueous AgNO3 solution, and alcoholic resveratrol solution at 25 °C–30 °C. The growth of GNRs was triggered by the injection of freshly prepared cold aqueous NaBH4 solution. The resulting solution was kept intact in a water bath at 70 °C for 4 hours to produce GNRs. The concentrations of CTAB, HAuCl4, AgNO3, resveratrol, and NaBH4 in the final mixture were 50, 0.5, 0.06, 5, and 0.012 mM, respectively.
Due to the fact that CTAB is toxic to biological materials in large quantities, GNRs need to undergo a calibration process, which is necessary to reduce the nanomaterial's cytotoxicity. This was performed following the injection water resuspension protocol described in [24], which aims to eliminate residual CTAB as much as possible while preserving the morphological stability of the GNRs and maintaining cell viability.
GNRs were characterized by UV-VIS spectroscopy (Thermo Scientific™ Varioskan™ LUX). Transmission Electron Microscopy (TEM) images were obtained using a Tecnai G2-20 SuperTwin electron microscope (Thermo Fisher / FEI) operated at 200 kV. Zeta potential (ζ-potential) of all samples was analyzed using a Litesizer™ 500 (Anton Paar, Austria) with an electrophoretic mobility cell.
2.5. Microscopy Equipment and Imaging Setup
The cells were analyzed using Defocusing Microscopy on an inverted microscope (Nikon Eclipse Ti-ϵ). The microscope was equipped (see Supplementary Material) with an incubation system (LCI – Live Cell Instrument – Air Gas mixer and CU-109 controller) that provided a stable environment for the cells with 37 °C, 95% humidity and 5% CO₂. These features ensured that the samples remained under controlled environmental conditions throughout the measurements.
Images were acquired using an oil immersion objective (Nikon CFI Apochromat TIRF 100× Oil) with 100× magnification and a numerical aperture (NA) of 1.49, as well as a 10× objective (Nikon CFI Achromat ADL 10×) with an NA of 0.25 for wide-field sample observation. For epi-fluorescence imaging, the same objectives were used in fluorescence microscopy, combined with a mercury lamp (Nikon Intensilight C-HGFI) and a G-2E/C filter set (bandpass emission).
Images and videos were captured using a CCD camera (Uniq UP1800 CL, 12-bit). To ensure focus stability throughout the experiments, the Nikon Perfect Focus System (PFS) was employed. All videos were recorded using the 100× objective, for which the pixel size of the Uniq camera corresponds to 0.064 µm × 0.064 µm.
2.6. Defocusing Microscopy
The theoretical framework of Defocusing Microscopy used in this study incorporates elements of Fourier optics, Fresnel diffraction, and previous analytical formulations developed for this method [25,26,27,28]. In this technique, the observed image contrast results from the propagation and diffraction of the electric field through a phase object captured at defocused planes in the optical path of the microscope.
To quantify membrane mechanics, we employed a dynamic mathematical model, which describes contrast fluctuations through the contrast temporal autocorrelation functions (CTAF) in selected regions of interest. These fluctuations were analyzed to extract the parameters. The fitting model was developed using an approximate analytical expression for the contrast of a defocused cell:
In this equation the refractive index difference between the phase object and the medium is given by , and n corresponds to the refractive index of the medium. The interface ripple profile of the phase object is described by , and defines the distance at which the phase object is defocused in the microscope, allowing for sample visualization. Figure 1 illustrates the structures and parameters described in the equation (1).
The development of Equation (1), fully detailed in the Supplementary Material, leads to the determination of the CTAF associated with viscoelastic parameters:
In this expression, the refractive index of the immersion oil used in the objective was measured as , and the refractive index difference between the cell and the medium was taken as , with . The amount of defocus was standardized at . To fit the experimental data, we subtracted a constant B, which corresponds to an experimentally observed background fluctuation, of the order of , and may arise from intracellular structures with varying contrast moving in the analysis region.
For our optical microscope setup, the upper limit of the wave number ( was determined through computational tests using red blood cells as a reference object. By analyzing the point spread function and estimating the diameter of the Airy disk, we established a practical resolution limit corresponding to . This value was adopted in our analysis as the upper bound of the accessible spatial frequency range, as it accurately reflects the true resolving power of the microscope.
DM measurements were conducted within the first 5 hours of the 24-hour incubation period with gold nanorods, aiming to characterize membrane fluctuations across the different experimental groups: healthy, infected, healthy incubated with GNRs, and infected incubated with GNRs. Cell videos were recorded to monitor membrane fluctuations, each lasting 10 minutes, with a capture rate of 2 frames per second. Recordings were performed every 15 minutes throughout the analysis period.
The videos were analyzed using the publicly available ImageJ software (http://rsb.info.nih.gov/imagej), with a custom plugin developed in [16]. For each video, at least three regions from the adhered portion of the cell membrane were selected to extract autocorrelation curves for analysis, carefully excluding internal cellular structures such as lysosomes and other organelles, as well as particles exhibiting Brownian motion or residual Leishmania parasites from the infection process.
2.7. Fluorescence Microscopy
Fluorescence microscopy analysis was performed to monitor the progression of infection and assess the impact of the gold nanorods. Measurements were conducted in triplicate at the onset of treatment, and subsequently at 5, 24, 48, and 72 hours. To ensure accuracy, samples were washed every 24 hours to remove non-internalized parasites and dead cells. Consequently, GNRs in solution were removed after 24 hours of incubation.
The corrected total cell fluorescence (CTCF) was used to quantify the fluorescence signal attributable to the parasites, effectively eliminating background interference. This quantification was performed using ImageJ software, according to the method described in [29], using the following equation:
where Integrated Density (IntDen) represents the sum of pixel intensity values within the fluorescence area, A is the area of the fluorescence region (in pixels²), and Mean Fluorescence of Background refers to the average fluorescence intensity measured in a cell-free region, used to estimate background noise.
For each sample, measurements were performed in triplicate and reported as mean ± standard deviation (see Supplementary Material). The CTCF values obtained from ImageJ, expressed in arbitrary units (a.u.). Data were collected for each time point and experimental condition, and graphical representations were generated using Python.
2.8. Data Processing and Statistical Analysis
The CTAF curves obtained from DM data were fitted using Equation (2) with MATLAB software. From this fit we obtained the parameters and , which were used to characterize membrane-cytoskeleton fluctuations across all experimental groups (see Section 2.7). The data fitting procedure involved non-linear curve fitting, and the quality of the fits was evaluated using R² values and residual analysis.
To validate and interpret the results obtained from Defocused Microscopy (MATLAB analysis), statistical analyses were performed. For each group, the mean, standard deviation, median e interquartile range (IQR) were calculated. Normality was assessed using the Shapiro-Wilk test. A p-value < 0.05 was considered statistically significant. Given the non-normal distribution of the data, the Mann-Whitney U test, a non-parametric method for comparing independent groups, was employed. These statistical analyses were conducted using Python and are presented and discussed in the following section.
3. Results
3.1. GNRs Syntheses and Physicochemical Characterizations
The synthesis of GNRs was confirmed using a combination of complementary techniques. UV–Vis absorption spectroscopy revealed a transverse plasmon resonance band at 520 nm and a longitudinal band at 636 nm, both characteristic of GNRs (Figure 2a).
Transmission electron microscopy (TEM) analysis of 161 particles confirmed the successful formation of uniform, rod-shaped structures, with an average aspect ratio (AR) of approximately 2.0, a low proportion of amorphous structures, and a narrow size distribution (Figure 2b). Further physicochemical characterization indicated that the GNRs had an average length of 43 ± 8 nm and an average diameter of 20 ± 4 nm.
The measured zeta potential (ζ-potential) was 0.0551 ± 0.0008 V, suggesting good colloidal stability under the tested conditions and reducing the risk of aggregation during subsequent cellular applications or biological assays. Both the aspect ratio and size distribution are in agreement with previously reported data, supporting the reproducibility and reliability of the synthesis protocol employed.
3.2. Fluorescence Microscopy
In our study, fluorescence microscopy was essential to monitor the progression of Leishmania amazonensis infection and to evaluate the impact on host cells over time, including under treatment conditions.
At the early stage of infection, the parasites are in their extracellular promastigote form, which is easily visualized in bright-field microscopy due to their characteristic elongated morphology (Figure 3a). These promastigotes express the red fluorescent protein (RFP) DsRed2, allowing for fluorescence detection (Figure 3b). However, once internalized by host cells and differentiated into amastigotes, the parasites became less distinguishable in bright-field images.
In this context, fluorescence microscopy was essential for detecting and tracking intracellular parasites during the initial stages of infection (Figure 4). Initially, parasites could only be identified through their fluorescence signal. As the infection progressed, fluorescence images revealed a marked increase in parasite load at 24 hours. Simultaneously, morphological changes in host cell membranes became apparent in bright-field images, suggesting biological and mechanical alterations likely associated with the infection’s progression.
This approach was also employed to assess the effect of gold nanorod treatment. As shown in Figure 5, fluorescence intensity differed between infected and treated groups. Bright-field images showed that treated cells remained viable and adherent, a finding further supported by biological assays [5]. These results suggest a potential antileishmanial effect of GNRs with low cytotoxicity toward THP-1 host cells.
This difference was quantified by mapping the fluorescence regions and calculating the CTCF (see Section 2.8) for three different samples in each case. Infected samples showed a clear progression of infection, whereas treated samples maintained relatively constant fluorescence levels up to 48 hours. Figure 6 presents the evolution of CTCF in both infected and GNR-treated samples over a 72-hour period.
Additionally, we separately evaluated the evolution of the infection areas and the fluorescence intensity, both of which contribute to the CTCF calculation. This analysis aimed to determine whether the observed reduction in CTCF in treated samples was primarily driven by a decrease in the infected area, a reduction in fluorescence intensity, or a combination of both. These separate analyses are presented in Figure 7, which illustrates the evolution of the mapped areas used for CTCF calculation, as well as the progression of the fluorescence intensity (Integrated Density). The reduction in CTCF results from the combined decrease in both the infection areas and the fluorescence intensity.
3.3. Defocused Microscopy
The DM analysis included 118 healthy macrophages, 160 healthy macrophages exposed to GNRs, 110 macrophages infected with Leishmania amazonensis, and 135 infected macrophages incubated with GNRs. These groups were systematically analyzed to characterize mechanical parameters of the cell’s membranes-cytoskeleton. The analysis involved selecting a representative region of the adhered cell, evaluate the CTAF for each pixel in the region, and average the result. In Figure 8 we present both the analyzed cell region and the corresponding autocorrelation averaged graph used for the nonlinear fit of equation 2 done in Matlab. We obtained the of viscosity and the bending modulus for at least three regions in each cell.
Based on statistical tests, we assessed the normality of the data and the significance of the observed differences. The Shapiro-Wilk test indicated that the data do not follow a normal distribution, thus requiring non-parametric methods. Therefore, the descriptive measures adopted for the parameters were the median and IQR, as presented in the table below. Given the non-parametric nature of the data, comparisons between two independent samples were performed using appropriate non-parametric tests, and the significance was evaluated through p-values. A detailed description of the complete statistical analysis is provided in the Supplementary Material.

Table 1.
Descriptive values of bending modulus () and viscosity (η) for the studied groups.
| Kc (J) | Median | IQR |
| Healthy | 1.00 | 2.54 |
| Infected | 2.46 | 3.02 |
| Healthy + GNR | 0.55 | 1.86 |
| Infected + GNR | 3.24 | 3.53 |
| η (Pa.s) | Median | IQR |
| Healthy | 1.23 | 3.48 |
| Infected | 2.55 | 4.77 |
| Healthy + GNR | 0.57 | 3.79 |
| Infected + GNR | 2.92 | 4.84 |
To visualize and compare the distribution of the bending modulus and viscosity parameters across different groups, we represented the data using boxplot graphs (Figure 9). These graphs are useful for identifying the median, quartiles, outliers, and overall data dispersion, thereby facilitating the comparison between samples.
Figure 9 shows the distribution of and across the experimental groups. For viscosity, the Healthy + GNR group exhibited the lowest median value (0.57 Pa.s), followed by Healthy (1.23 Pa.s), while higher values were observed in the Infected (2.55 Pa.s) and Infected + GNR (2.92 Pa.s) groups. The interquartile range (IQR) was notably broader in infected conditions (IQR ≈ 4.8), indicating increased variability. According to the Mann–Whitney U test, statistically significant differences were found between Healthy vs. Infected (p < 0.001), Healthy vs. Healthy + GNR (p < 0.01), and Healthy + GNR vs. Infected + GNR (p < 0.001). No significant difference was observed between Infected and Infected + GNR (p = 0.47).
In terms of bending modulus, the Infected + GNR group presented the highest median value , followed by Infected , while the Healthy and Healthy + GNR groups showed lower values . All group comparisons were statistically significant (p < 0.05), as determined by the Mann–Whitney U test, indicating that both infection and GNR treatment affected membrane-cytoskeleton .
4. Discussion
This study investigated the biomechanical responses of macrophages infected with L. amazonensis and treated with gold nanorods, with particular focus on alterations in surface curvature (bending modulus) and intracellular viscosity. By integrating Defocusing Microscopy with fluorescence analysis, we correlated changes in parasitic load with mechanical modifications and nanoparticle interactions.
Through the fluorescence analysis, the first notable observation was the small variations of CTCF levels in the treated samples, which may indicate that GNRs exert a parasitostatic effect, preventing or delaying parasite proliferation and thereby inhibiting population growth. This hypothesis is further supported by the observation that, once the treatment is withdrawn at 24 hours, parasite growth remains stagnant until becoming more pronounced after 72 hours.
However, in the biological assays [5], we observed that at higher GNR concentrations, such as the CC50, nanorods exhibit a leishmanicidal effect. In contrast, at lower concentrations, such as those employed in our experiments, there may be a dynamic balance between parasite elimination and replication. In other words, the employed treatment may be inducing parasite death at a rate comparable to their replication, resulting in stable fluorescence levels.
It is important to note that, at higher concentrations, the morphological stability of the nanorods becomes less reliable, which could compromise their therapeutic efficacy. This is attributable to the experimental protocol, in which the surfactant responsible for maintaining the morphological stability of the nanorods is washed to minimize its cytotoxic effects. As a result, the nanorods become more susceptible to aggregation, particularly at elevated concentrations. Conversely, lower concentrations favor the preservation of their structural integrity and colloidal stability, while maintaining therapeutic activity.
A relevant characteristic of the RFP fluorescent protein is its ability to generate fluorescence without requiring cofactors or luminescent substrates. This property is advantageous, as it prevents potential cell lysis induced by exogenous fluorophores and ensures that measurements remain free from external interference, preserving cell integrity and enabling accurate, non-invasive monitoring through Defocusing Microscopy.
The analysis via DM reveals distinct mechanical changes in macrophages in response to L. amazonensis infection. The combined analysis of and demonstrated that both infection and treatment significantly affect cell biomechanics. The determination of these parameters indicated that infection led to a significant rise: approximately 3-fold in membrane and 2-fold in . These changes could be related to morphological and functional transformations associated with parasite establishment, including the formation of parasitophorous vacuoles, vesicle accumulation, and cytoskeletal reorganization [30,31].
Previous studies have shown that alterations in the membrane and cytoskeletal structure of cells can signal the presence of infections, triggering the production of cytokines and pro-inflammatory mediators. This process, in turn, attracts additional immune cells to the affected area or stimulates the formation of pseudopodia for phagocytosis. For instance, a study using macrophages exposed to bacterial lipopolysaccharides demonstrated that membrane rigidity decreases, facilitating phagocytosis, suggesting an adaptive response to the presence of pathogenic agents [2].
On the other hand, another study related to atherosclerosis, a disease characterized by the accumulation of lipids, cholesterol, calcium, and other substances within the arteries, revealed that macrophages, upon exposure to oxidized low-density lipoproteins (oxLDL), become stiffer and release pro-inflammatory substances that exacerbate the inflammatory process [32]. Thus, a decrease in may suggest enhanced phagocytic activity in macrophages, while an increase may indicate infection and disease progression, as observed in our cells infected with Leishmaniasis.
The increase in , in turn, can be attributed to several hypotheses. One possibility is the reorganization of the cytoskeleton in response to infection, which may enhance resistance to intracellular flow [30]. Another explanation is the accumulation of parasitic or inflammatory structures, which interfere with fluid flow across the membrane. Additionally, the presence of Leishmania may induce changes in cellular metabolism that elevate viscosity, reflecting the cell's attempt to contain parasite spread through mechanical mechanisms [33,34].
In healthy macrophages, the median bending modulus and viscosity values reflect a baseline mechanical state consistent with the fluidity and deformability typical of resting cells. In the literature, values for range from approximately [2,35], depending on the measurement technique and cell type. Viscosity values also vary according to the study technique, with ranges from approximately [4,35].
Specifically for macrophages, the values are concentrated around [2,35], for invasive techniques such as optical tweezers. In our case, using DM, a non-invasive approach, lower values are expected, though still consistent with the expected range for living cells. The bending modulus of healthy cells obtained in our study was and the viscosity , respectively, both reported as median ± IQR. These values fall lie within the range predicted for our membrane model and are consistent with those previously reported for cellular membranes and artificial lipid bilayers using different experimental approaches [35].
Treatment with GNRs resulted in a reduction of about half in both parameters, suggesting structural modulation potentially related to the internalization of nanomaterials and the resulting cytoskeletal rearrangement. The observed reduction may indicate a more fluid cellular state, possibly due to physical interactions between the nanomaterials and the plasma membrane and alterations in the cytoskeletal architecture [36,37]. Although there was no apparent functional impairment, this modulation in non-activated cells underscores the need to consider mechanical effects even under non-pathological conditions.
Research has indicated that gold nanoparticles, at non-toxic concentrations, interact with healthy cells while maintaining their viability, inducing slight alterations in cytoskeletal organization that reduce stiffness. In opposition, at toxic concentrations, nanorods increase cell stiffness [38,39]. Our findings of decreased bending modulus are consistent with the expected effects of non-toxic nanoparticle interactions, promoting a state of reduced stiffness in healthy cells, which is essential for normal cellular function and regulatory processes.
Interestingly, GNR treatment of infected cells resulted in a further increase in the bending modulus, without significantly affecting viscosity compared to the untreated infected group. This suggests that GNRs enhance cell stiffness, possibly by reinforcing the cytoskeletal structure or directly influencing the organization [36]. The lack of change in viscosity may indicate that infection already induces a saturated mechanical state in terms of intracellular fluidity, with no additional impact from treatment.
Overall, the data indicate that GNRs modulate the viscoelastic properties of macrophages in a manner dependent on the cellular state. In healthy cells, they appear to promote mild destabilization, whereas in infected cells, they reinforce structural rigidity. These findings are relevant both for understanding the interaction between nanomaterials and host cells and for guiding the development of therapeutic strategies involving GNRs in the context of leishmaniasis. Further studies are needed to determine whether these mechanical alterations correlate with functional outcomes, such as phagocytic capacity or parasite clearance.
5. Conclusions
In this study, we employed Defocusing Microscopy and fluorescence imaging to investigate the progression of Leishmania infection in macrophages, as well as the biomechanical alterations induced by gold nanorods, with the aim of evaluating their therapeutic potential in the treatment of leishmaniasis.
The collected data provided a comprehensive characterization of the distribution of bending modulus and viscosity under distinct experimental conditions. The interaction between macrophages and Leishmania parasites resulted in a marked increase in both mechanical parameters, establishing a biomechanical signature that may serve as a valuable biomarker for monitoring infection progression and membrane remodeling.
Notably, GNR treatment modulated these mechanical properties in a context-dependent manner. In healthy cells, it induced a reduction in both bending modulus and viscosity, consistent with a state of increased membrane fluidity. Conversely, in infected cells, GNRs increased bending modulus without significantly altering viscosity, suggesting a reinforcement of cellular structure without further impact on cytoplasmic flow.
In addition to mechanical modulation, GNRs appeared to exert a leishmanicidal effect, as evidenced by the stability of fluorescence intensity and delayed parasite proliferation following treatment. These findings support the idea that GNRs interact non-toxically with macrophage membranes and cytoskeleton, and may modulate mechanical responses that contribute to the containment of infection.
Our results underscore the utility of Defocusing Microscopy, combined with the developed viscoelastic model, as a powerful and non-invasive approach for quantifying biomechanical properties in live-cell systems. This methodology can be extended to the investigation of other pathological conditions, host-pathogen interactions, and drug screening platforms.
Furthermore, the mechanical profiles described here provide a valuable framework for evaluating future therapeutic strategies, including the integration of photothermal approaches involving GNRs and laser irradiation. Altogether, these insights pave the way for the rational design of innovative biomedical strategies targeting infectious diseases.
Supplementary Materials
The following supporting information can be downloaded at the website of this paper posted on Preprints.org, Figure S1: Inverted microscope Nikon Eclipse Ti-E setup; Figure; S2: Representative images illustrating the fluorescence microscopy analysis and quantification methodology; Table S3. Results of the Mann–Whitney U test; Table S4. Results of the Shapiro–Wilk normality test; Table S5. Descriptive statistics of the experimental groups; Text S1: Detailed mathematical derivation of the contrast temporal autocorrelation functions; Figure S3: Position and wave vectors in real space and reciprocal space; Figure S4: Geometry of the electric field propagation through a cell interface and Figure S5: Geometry of the electric field propagation through the defocused microscope.
Author Contributions
Conceptualization, U.A., L.S., and A.L.; methodology, M.P. and A.L.; software, M.P.; validation, M.P., U.A., and L.S.; formal analysis, M.P.; investigation, M.P. and M.G.; resources, R.B., J.R., A.S., R.S., R.M., and J.C.; data curation, M.P.; writing—original draft preparation, M.P.; writing—review and editing, A.S., A.L., U.A., and L.S.; visualization, M.P.; supervision, U.A., L.S., and A.L.; project administration, U.A., L.S., and A.L.; funding acquisition, U.A., L.S., A.L., R.S., and R.M. All authors have read and agreed to the published version of the manuscript.
Funding
This research was funded by the governmental agencies Fundação de Amparo à Pesquisa do Estado de Minas Gerais (FAPEMIG), Conselho Nacional de Desenvolvimento Científico e Tecnológico (CNPq), and Coordenação de Aperfeiçoamento de Pessoal de Nível Superior (CAPES).
Data Availability Statement
Data are contained within the article or Supplementary Materials.
Acknowledgments
Maria L. B. Pertence acknowledges her doctoral scholarship to the Conselho Nacional de Desenvolvimento Científico e Tecnológico (CNPq).
Conflicts of Interest
The authors declare no conflicts of interest.
Abbreviations
The following abbreviations are used in this manuscript:
| AFM | Atomic Force Microscopy |
| AgNO₃ | Silver nitrate |
| AR | Aspect ratio |
| ATCC | American Type Culture Collection |
| CL | Cutaneous Leishmaniasis |
| CTAB | Cetyltrimethylammonium bromide |
| CTAF | Contrast temporal autocorrelation functions |
| CTCF | Corrected total cell fluorescence |
| DM | Defocusing Microscopy |
| DMSO | Dimethyl sulfoxide |
| GNRs | Gold nanorods |
| HAuCl₄ | Chloroauric acid |
| IntDen | Integrated Density |
| IQR | Interquartile range |
| Kc | Bending modulus |
| M∅ | Macrophages |
| NA | Numerical aperture |
| NaBH₄ | Sodium borohydride |
| oxLDL | Oxidized low-density lipoproteins |
| PAHO | Pan American Health Organization |
| PFS | Perfect Focus System |
| PMA | Phorbol 12-myristate 13-acetate |
| PPTT | Plasmonic photothermal therapy |
| RFP | Red fluorescent protein |
| SPR | Surface plasmon resonance |
| TEM | Transmission electron microscopy |
| η | Viscosity |
| WHO | World Health Organization |
References
- Alberts, B. Molecular Biology of the Cell; 6th ed.; W.W. Norton & Company: New York, 2017; ISBN 978-1-315-73536-8.
- Nussenzveig, H.M. Cell Membrane Biophysics with Optical Tweezers. European Biophysics Journal 2018, 47, 499–514. [Google Scholar] [CrossRef]
- Studying Cell Membrane Tension and Mechanosensation during Mechanical Stimulation. Nat Methods 2024, 21, 944–945. [CrossRef]
- Unal, M.; Alapan, Y.; Jia, H.; Varga, A.G.; Angelino, K.; Aslan, M.; Sayin, I.; Han, C.; Jiang, Y.; Zhang, Z.; et al. Micro and Nano-Scale Technologies for Cell Mechanics. Nanobiomedicine (Rij) 2014, 1, 5. [Google Scholar] [CrossRef]
- Lage, A.C.P.; Ladeira, L.O.; Do Camo, P.H.F.; Amorim, J.M.; Monte-Neto, R.L.; Santos, D.A.; Tunes, L.G.; Castilho, R.O.; Moreira, P.O.; Ferreira, D.C.; et al. Changes in Antiparasitical Activity of Gold Nanorods According to the Chosen Synthesis. Experimental Parasitology 2022, 242, 108367. [Google Scholar] [CrossRef]
- Rafique, A.; Sani, S.S.; Sultana, S.; Sultana, T.; Ashraf, A.; Mahmood, M.S.; Rafique, A.; Sani, S.S.; Sultana, S.; Sultana, T.; et al. Cutaneous Leishmaniasis. In Leishmania Parasites - Epidemiology, Immunopathology and Hosts; IntechOpen, 2023 ISBN 978-1-83768-311-6.
- Ahmad, A.; Wei, Y.; Ullah, S.; Shah, S.I.; Nasir, F.; Shah, A.; Iqbal, Z.; Tahir, K.; Khan, U.A.; Yuan, Q. Synthesis of Phytochemicals-Stabilized Gold Nanoparticles and Their Biological Activities against Bacteria and Leishmania. Microbial Pathogenesis 2017, 110, 304–312. [Google Scholar] [CrossRef]
- do Carmo Maquiaveli, C.; da Silva, E.R.; Hild de Jesus, B.; Oliveira Monteiro, C.E.; Rodrigues Navarro, T.; Pereira Branco, L.O.; Souza dos Santos, I.; Figueiredo Reis, N.; Portugal, A.B.; Mendes Wanderley, J.L.; et al. Design and Synthesis of New Anthranyl Phenylhydrazides: Antileishmanial Activity and Structure–Activity Relationship. Pharmaceuticals 2023, 16, 1120. [Google Scholar] [CrossRef] [PubMed]
- Peixoto, J.F.; Gonçalves-Oliveira, L.F.; Souza-Silva, F.; De Castro Côrtes, L.M.; Finkelstein, L.C.; Dias-Lopes, G.; Patricio, B.F.D.C.; Lima, C.G.D.S.; Rocha, H.V.A.; Da Silva, F.D.C.; et al. Efficacy of the Treatment Using a Microemulsion Loaded with Epoxy-α-Lapachone in Combination with Meglumine Antimoniate against Murine Infection by Leishmania (Leishmania) Amazonensis. International Journal for Parasitology: Drugs and Drug Resistance 2024, 24, 100525. [Google Scholar] [CrossRef] [PubMed]
- Domingo-Diez, J.; Souiade, L.; Manzaneda-González, V.; Sánchez-Díez, M.; Megias, D.; Guerrero-Martínez, A.; Ramírez-Castillejo, C.; Serrano-Olmedo, J.; Ramos-Gómez, M. Effectiveness of Gold Nanorods of Different Sizes in Photothermal Therapy to Eliminate Melanoma and Glioblastoma Cells. International Journal of Molecular Sciences 2023, 24, 13306. [Google Scholar] [CrossRef]
- Komsthöft, T.; Bovone, G.; Bernhard, S.; Tibbitt, M.W. Polymer Functionalization of Inorganic Nanoparticles for Biomedical Applications. Current Opinion in Chemical Engineering 2022, 37, 100849. [Google Scholar] [CrossRef]
- Alkilany, A.M.; Thompson, L.B.; Boulos, S.P.; Sisco, P.N.; Murphy, C.J. Gold Nanorods: Their Potential for Photothermal Therapeutics and Drug Delivery, Tempered by the Complexity of Their Biological Interactions. Advanced Drug Delivery Reviews 2012, 64, 190–199. [Google Scholar] [CrossRef]
- Ye, J.; Wen, Q.; Wu, Y.; Fu, Q.; Zhang, X.; Wang, J.; Gao, S.; Song, J. Plasmonic Anisotropic Gold Nanorods: Preparation and Biomedical Applications. Nano Res. 2022, 15, 6372–6398. [Google Scholar] [CrossRef]
- Wu, P.-H.; Aroush, D.R.-B.; Asnacios, A.; Chen, W.-C.; Dokukin, M.E.; Doss, B.L.; Durand-Smet, P.; Ekpenyong, A.; Guck, J.; Guz, N.V.; et al. A Comparison of Methods to Assess Cell Mechanical Properties. Nat Methods 2018, 15, 491–498. [Google Scholar] [CrossRef]
- Lichtman, J.W.; Conchello, J.-A. Fluorescence Microscopy. Nat Methods 2005, 2, 910–919. [Google Scholar] [CrossRef] [PubMed]
- Agero, U.; Monken, C.H.; Ropert, C.; Gazzinelli, R.T.; Mesquita, O.N. Cell Surface Fluctuations Studied with Defocusing Microscopy. Phys. Rev. E 2003, 67, 051904. [Google Scholar] [CrossRef]
- Himbert, S.; D’Alessandro, A.; Qadri, S.M.; Majcher, M.J.; Hoare, T.; Sheffield, W.P.; Nagao, M.; Nagle, J.F.; Rheinstädter, M.C. The Bending Rigidity of the Red Blood Cell Cytoplasmic Membrane. PLOS ONE 2022, 17, e0269619. [Google Scholar] [CrossRef] [PubMed]
- Van Canneyt, K.; Verdonck, P. Mechanics of Biofluids in Living Body. In Comprehensive Biomedical Physics : physical medicine and rehabilitation; Elsevier, 2014; Vol. 10, pp. 39–53 ISBN 978-0-444-53633-4.
- Tsuchiya, S.; Yamabe, M.; Yamaguchi, Y.; Kobayashi, Y.; Konno, T.; Tada, K. Establishment and Characterization of a Human Acute Monocytic Leukemia Cell Line (THP-1). Int J Cancer 1980, 26, 171–176. [Google Scholar] [CrossRef]
- Ng, L.G.; Hsu, A.; Mandell, M.A.; Roediger, B.; Hoeller, C.; Mrass, P.; Iparraguirre, A.; Cavanagh, L.L.; Triccas, J.A.; Beverley, S.M.; et al. Migratory Dermal Dendritic Cells Act as Rapid Sensors of Protozoan Parasites. PLoS Pathog 2008, 4, e1000222. [Google Scholar] [CrossRef]
- Rocha, M.N.; Corrêa, C.M.; Melo, M.N.; Beverley, S.M.; Martins-Filho, O.A.; Madureira, A.P.; Soares, R.P. An Alternative in Vitro Drug Screening Test Using Leishmania Amazonensis Transfected with Red Fluorescent Protein. Diagnostic Microbiology and Infectious Disease 2013, 75, 282–291. [Google Scholar] [CrossRef]
- Roy, G.; Dumas, C.; Sereno, D.; Wu, Y.; Singh, A.K.; Tremblay, M.J.; Ouellette, M.; Olivier, M.; Papadopoulou, B. Episomal and Stable Expression of the Luciferase Reporter Gene for Quantifying Leishmania Spp. Infections in Macrophages and in Animal Models. Molecular and Biochemical Parasitology 2000, 110, 195–206. [Google Scholar] [CrossRef]
- Wang, W.; Li, J.; Lan, S.; Rong, L.; Liu, Y.; Sheng, Y.; Zhang, H.; Yang, B. Seedless Synthesis of Gold Nanorods Using Resveratrol as a Reductant. Nanotechnology 2016, 27, 165601. [Google Scholar] [CrossRef]
- Lage, A.C.P.; Orlando Ladeira, L.; Mosqueira, L.; Magalhães Paniago, R.; Oliveira Castilho, R.; Amorim, J.M.; Pessoa, E.S.; Nuncira, J.; Faraco, A.A.G. Synthesis and Characterization of Gold Nanorods Using the Natural Products Resveratrol, Gallic Acid, and a Purified Fraction of Stryphnodendron Obovatum by Seedless Method. Environmental Nanotechnology, Monitoring & Management 2021, 16, 100473. [Google Scholar] [CrossRef]
- Mandel, L.; Wolf, E.; Meystre, P. Optical Coherence and Quantum Optics. American Journal of Physics 1996, 64, 1438–1439. [Google Scholar] [CrossRef]
- Joseph, W. Goodman Introduction to Fourier Optics; McGraw-Hill Inc.,US, 1968; ISBN 978-0-07-023776-6.
- Roma, P.M.S.; Siman, L.; Amaral, F.T.; Agero, U.; Mesquita, O.N. Total Three-Dimensional Imaging of Phase Objects Using Defocusing Microscopy: Application to Red Blood Cells. Applied Physics Letters 2014, 104, 251107. [Google Scholar] [CrossRef]
- Glionna, G.; Oliveira, C.K.; Siman, L.G.; Moyses, H.W.; Prado, D.M.U.; Monken, C.H.; Mesquita, O.N. Tomography of Fluctuating Biological Interfaces Using Defocusing Microscopy. Applied Physics Letters 2009, 94, 193701. [Google Scholar] [CrossRef]
- Measuring Cell Fluorescence Using ImageJ — The Open Lab Book v1.0. Available online: https://theolb.readthedocs.io/en/latest/imaging/measuring-cell-fluorescence-using-imagej.html (accessed on 20 June 2025).
- de Menezes, J.P.B.; Koushik, A.; Das, S.; Guven, C.; Siegel, A.; Laranjeira-Silva, M.F.; Losert, W.; Andrews, N.W. Leishmania Infection Inhibits Macrophage Motility by Altering F-Actin Dynamics and the Expression of Adhesion Complex Proteins. Cell Microbiol 2017, 19. [Google Scholar] [CrossRef] [PubMed]
- Young, J.; Kima, P.E. The Leishmania Parasitophorous Vacuole Membrane at the Parasite-Host Interface. Yale J Biol Med 2019, 92, 511–521. [Google Scholar]
- Couto, N.F.; Rezende, L.; Fernandes-Braga, W.; Alves, A.P.; Agero, U.; Alvarez-Leite, J.; Damasceno, N.R.T.; Castro-Gomes, T.; Andrade, L.O. OxLDL Alterations in Endothelial Cell Membrane Dynamics Leads to Changes in Vesicle Trafficking and Increases Cell Susceptibility to Injury. Biochimica et Biophysica Acta (BBA) - Biomembranes 2020, 1862, 183139. [Google Scholar] [CrossRef]
- Pradhan, S.; Ghosh, S.; Hussain, S.; Paul, J.; Mukherjee, B. Linking Membrane Fluidity with Defective Antigen Presentation in Leishmaniasis. Parasite Immunology 2021, 43, e12835. [Google Scholar] [CrossRef]
- Reyaz, E.; Tandon, R.; Beg, M.A.; Dey, R.; Puri, N.; Salotra, P.; Nakhasi, H.L.; Selvapandiyan, A. Proteome Profile of Leishmania Donovani Centrin1−/− Parasite-Infected Human Macrophage Cell Line and Its Implications in Determining Possible Mechanisms of Protective Immunity. Microbes and Infection 2024, 26, 105340. [Google Scholar] [CrossRef]
- Neto, J.C.; Agero, U.; Gazzinelli, R.T.; Mesquita, O.N. Measuring Optical and Mechanical Properties of a Living Cell with Defocusing Microscopy. Biophys J 2006, 91, 1108–1115. [Google Scholar] [CrossRef]
- Pietuch, A.; Brückner, B.R.; Schneider, D.; Tarantola, M.; Rosman, C.; Sönnichsen, C.; Janshoff, A. Mechanical Properties of MDCK II Cells Exposed to Gold Nanorods. Beilstein J Nanotechnol 2015, 6, 223–231. [Google Scholar] [CrossRef]
- Ma, X.; Hartmann, R.; Jimenez de Aberasturi, D.; Yang, F.; Soenen, S.J.H.; Manshian, B.B.; Franz, J.; Valdeperez, D.; Pelaz, B.; Feliu, N.; et al. Colloidal Gold Nanoparticles Induce Changes in Cellular and Subcellular Morphology. ACS Nano 2017, 11, 7807–7820. [Google Scholar] [CrossRef] [PubMed]
- Meesaragandla, B.; Komaragiri, Y.; Schlüter, R.; Otto, O.; Delcea, M. The Impact of Cell Culture Media on the Interaction of Biopolymer-Functionalized Gold Nanoparticles with Cells: Mechanical and Toxicological Properties. Sci Rep 2022, 12, 16643. [Google Scholar] [CrossRef] [PubMed]
- Grala, M.; Kołodziejczyk, A.M.; Białkowska, K.; Walkowiak, B.; Komorowski, P. Assessment of the Influence of Gold Nanoparticles Stabilized with PAMAM Dendrimers on HUVEC Barrier Cells. Micron 2023, 168, 103430. [Google Scholar] [CrossRef] [PubMed]
Figure 1.
(a): Geometry of the electric field propagation through the phase object, showing the interface ripple profile , the refractive indices n1 and n2, and the cover glass. L and d denote characteristic distances, and the focal plane is indicated. (b): Optical path in the defocused microscope. Caption: C: Condenser; : Objective; : Tube lens.: refractive index of the immersion medium; : Defocused amount; focal lengths; d: distance between lenses and I: image plane.
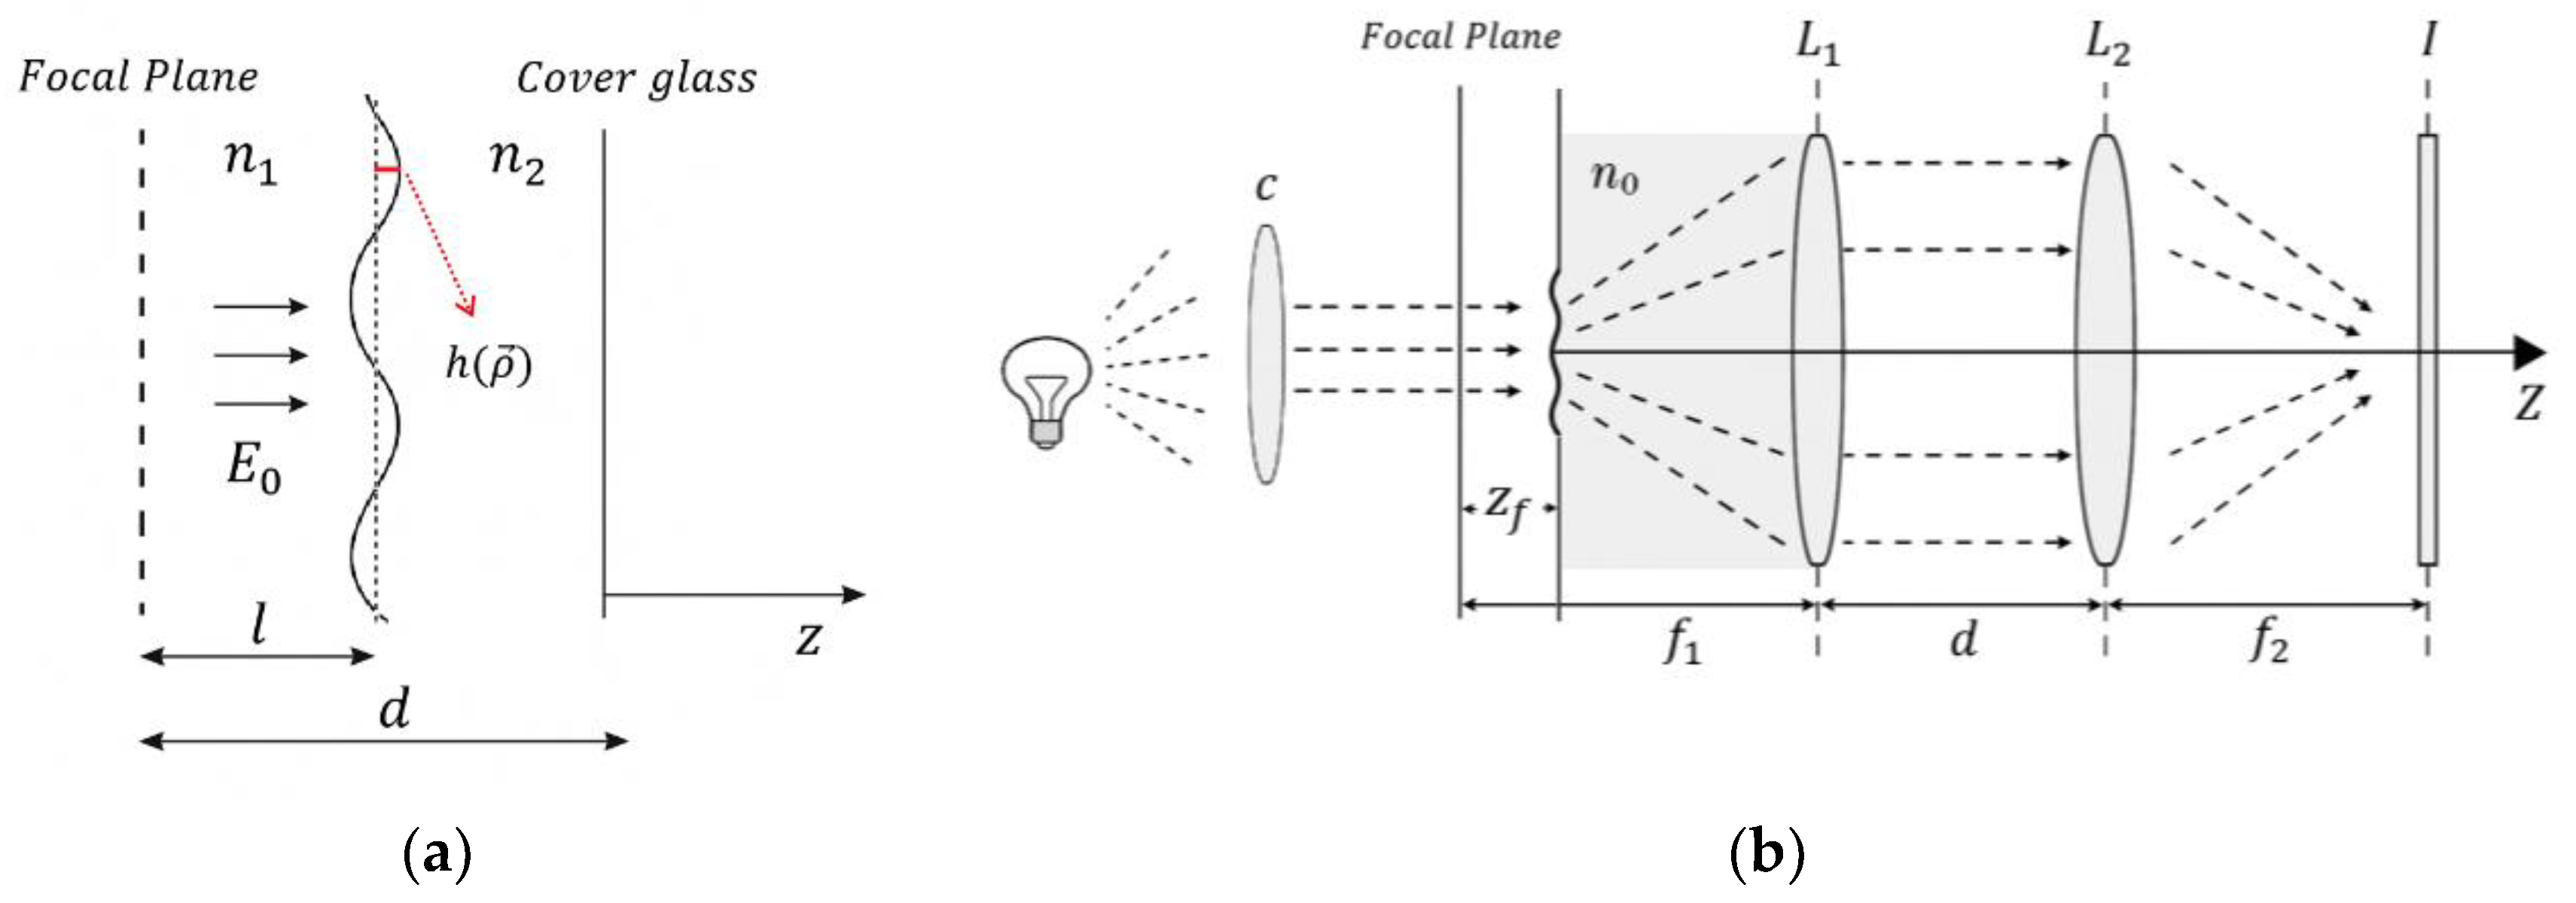
Figure 2.
Characterization of GNRs through microscopy and spectroscopy techniques. (a) UV–Vis absorption spectrum displaying the characteristic transverse and longitudinal plasmon resonance bands of the GNRs. (b) TEM image showing the morphology and size distribution of the nanorods.
Figure 2.
Characterization of GNRs through microscopy and spectroscopy techniques. (a) UV–Vis absorption spectrum displaying the characteristic transverse and longitudinal plasmon resonance bands of the GNRs. (b) TEM image showing the morphology and size distribution of the nanorods.
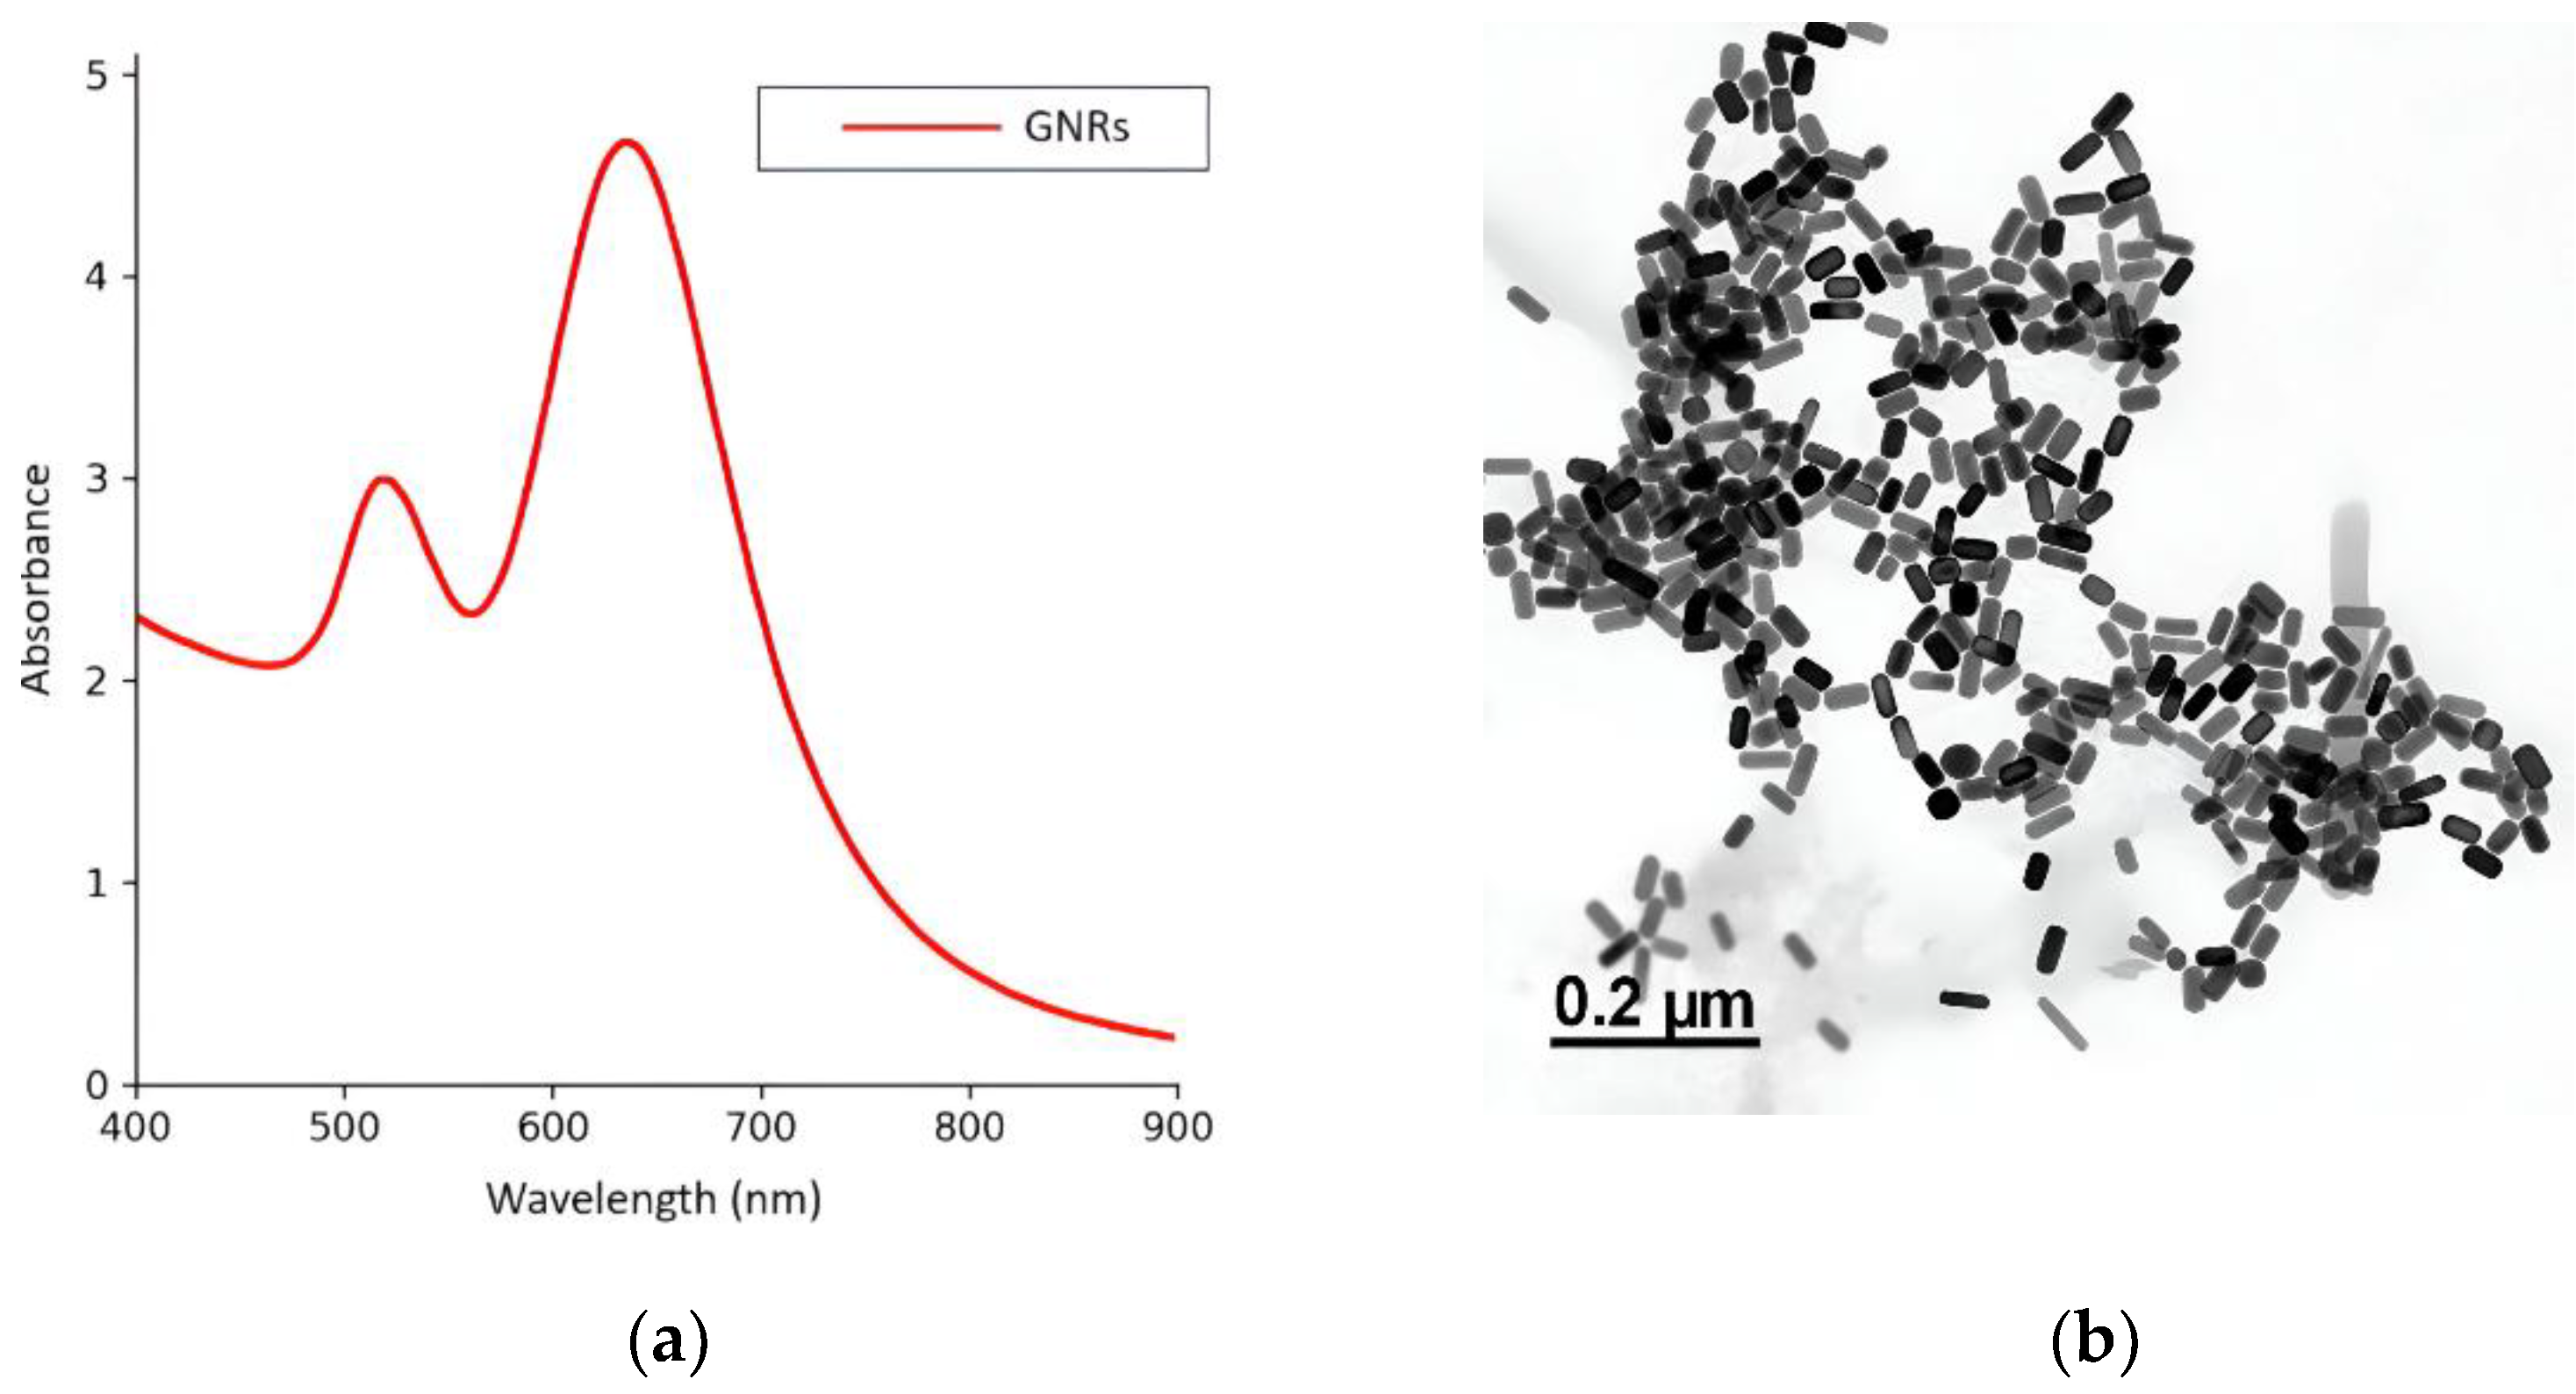
Figure 3.
Representative images of Leishmania (Leishmania) amazonensis in their promastigote form expressing the red fluorescent protein (RFP) DsRed2. (a) Bright-field image showing parasite morphology. (b) Fluorescence microscopy image of the same parasite, displaying red fluorescence emission.
Figure 3.
Representative images of Leishmania (Leishmania) amazonensis in their promastigote form expressing the red fluorescent protein (RFP) DsRed2. (a) Bright-field image showing parasite morphology. (b) Fluorescence microscopy image of the same parasite, displaying red fluorescence emission.
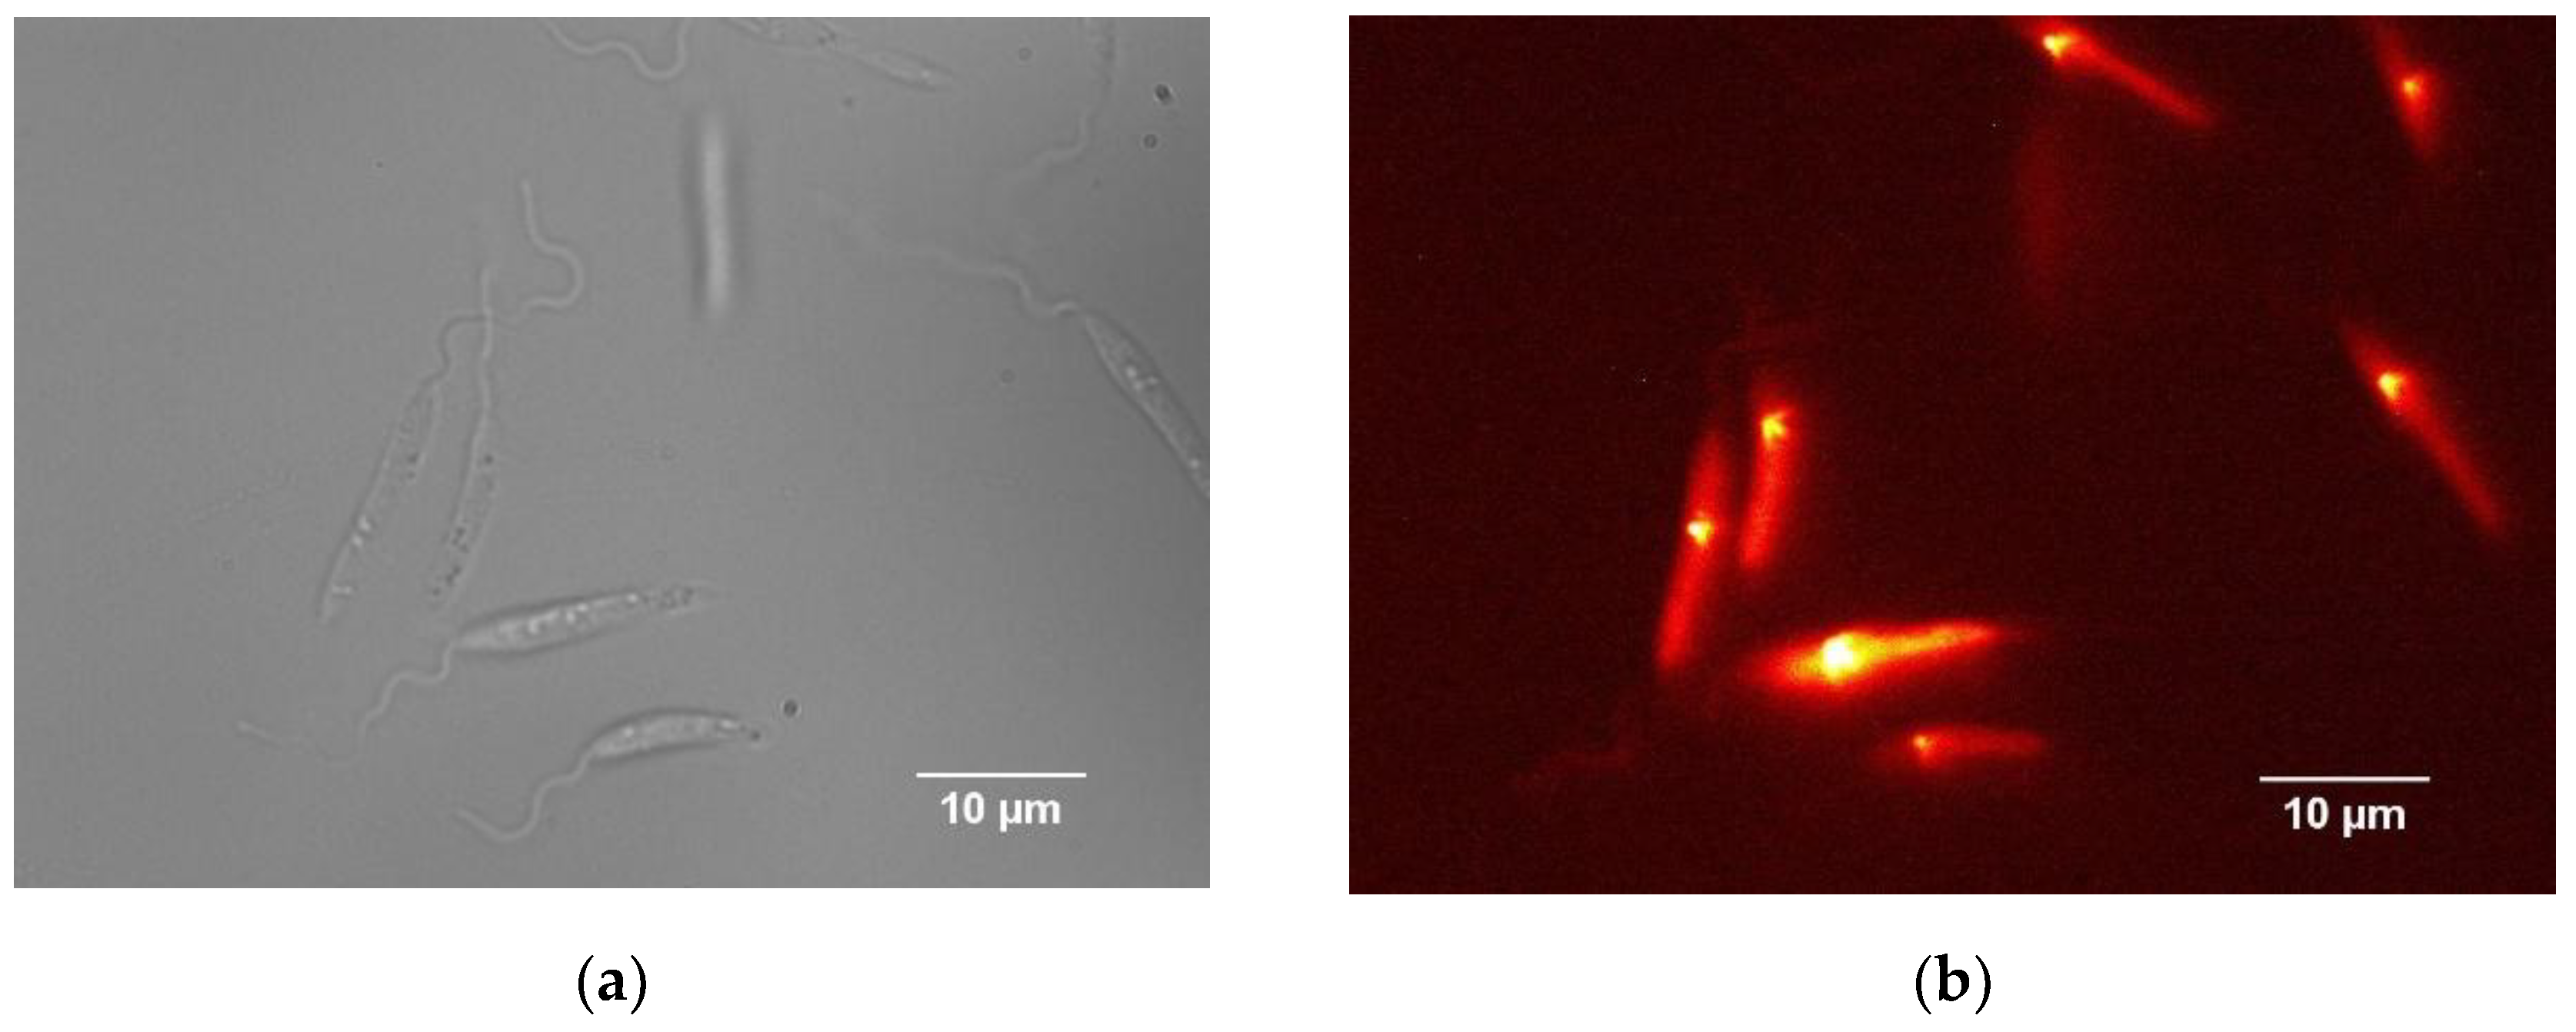
Figure 4.
Bright-field and fluorescence microscopy images showing the progression of infection. The top row presents images from the onset of infection, with bright-field on the left and fluorescence on the right. The bottom row shows images from 24 hours after infection, again with bright-field on the left and fluorescence on the right.
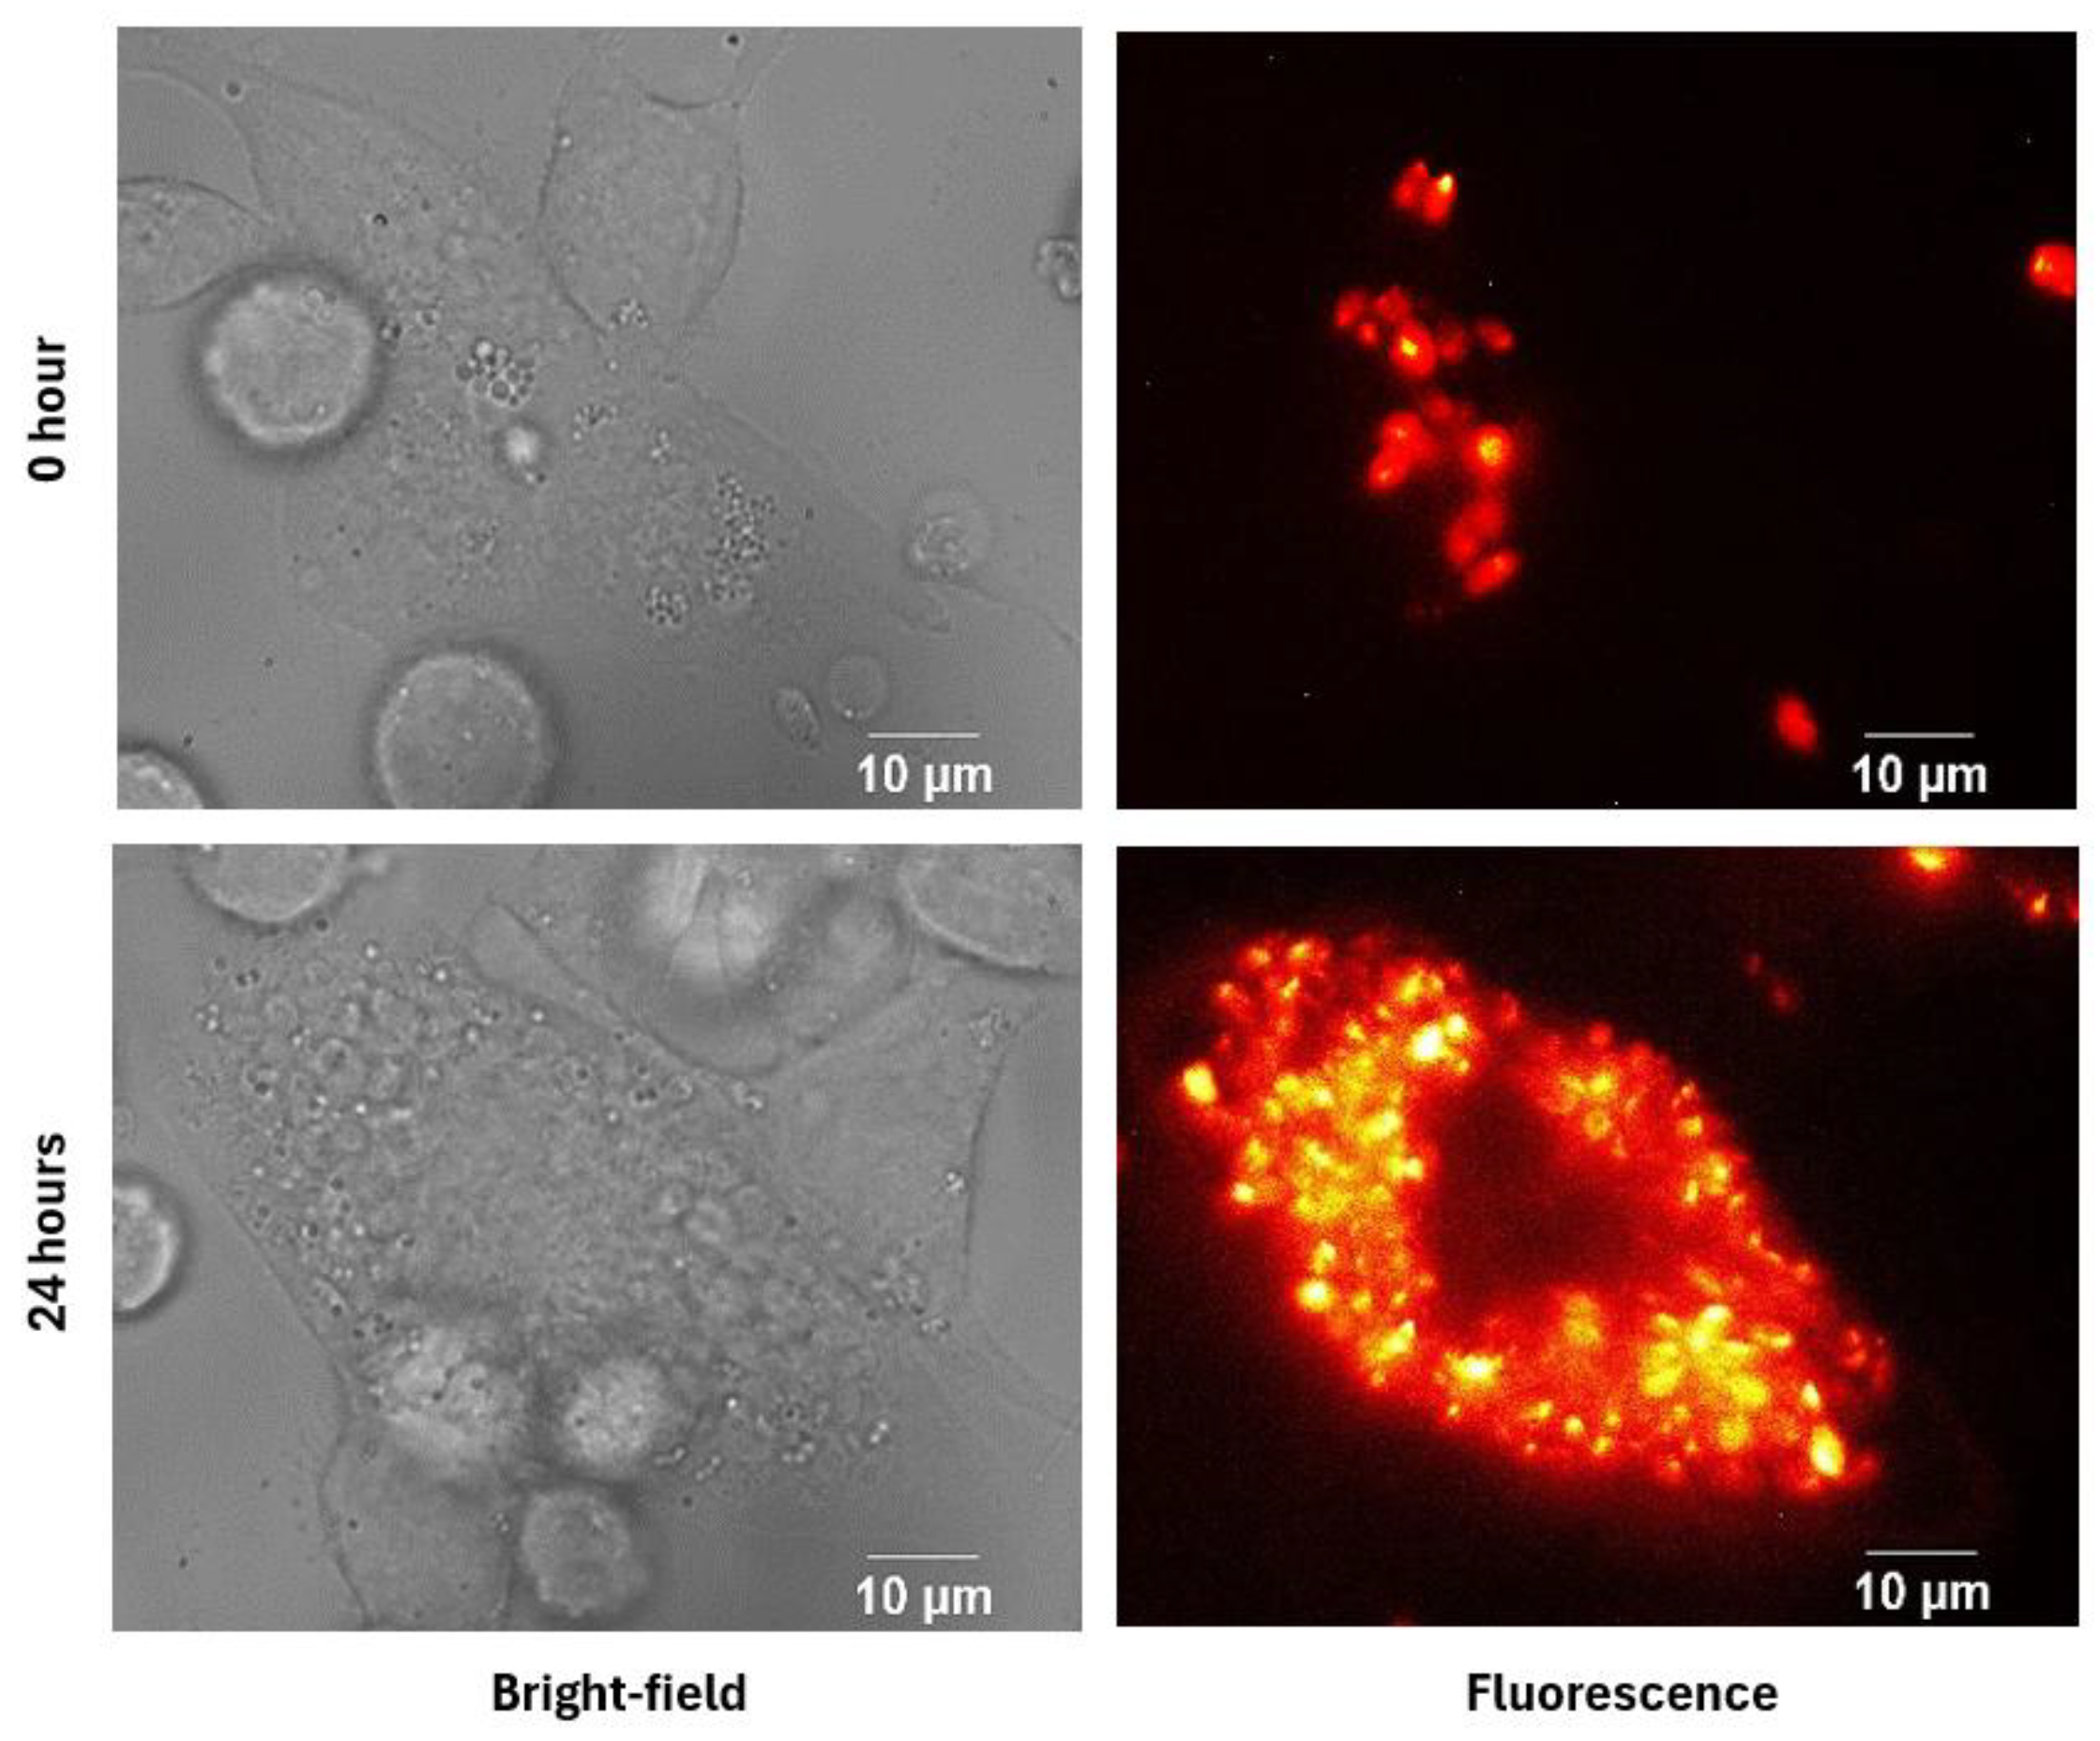
Figure 5.
Fluorescence and bright-field images of infected macrophages after 24 hours. The top row shows macrophages infected with Leishmania without treatment, with fluorescence on the left and bright-field on the right. The bottom row shows infected macrophages treated with the IC50, also with fluorescence on the left and bright-field on the right.
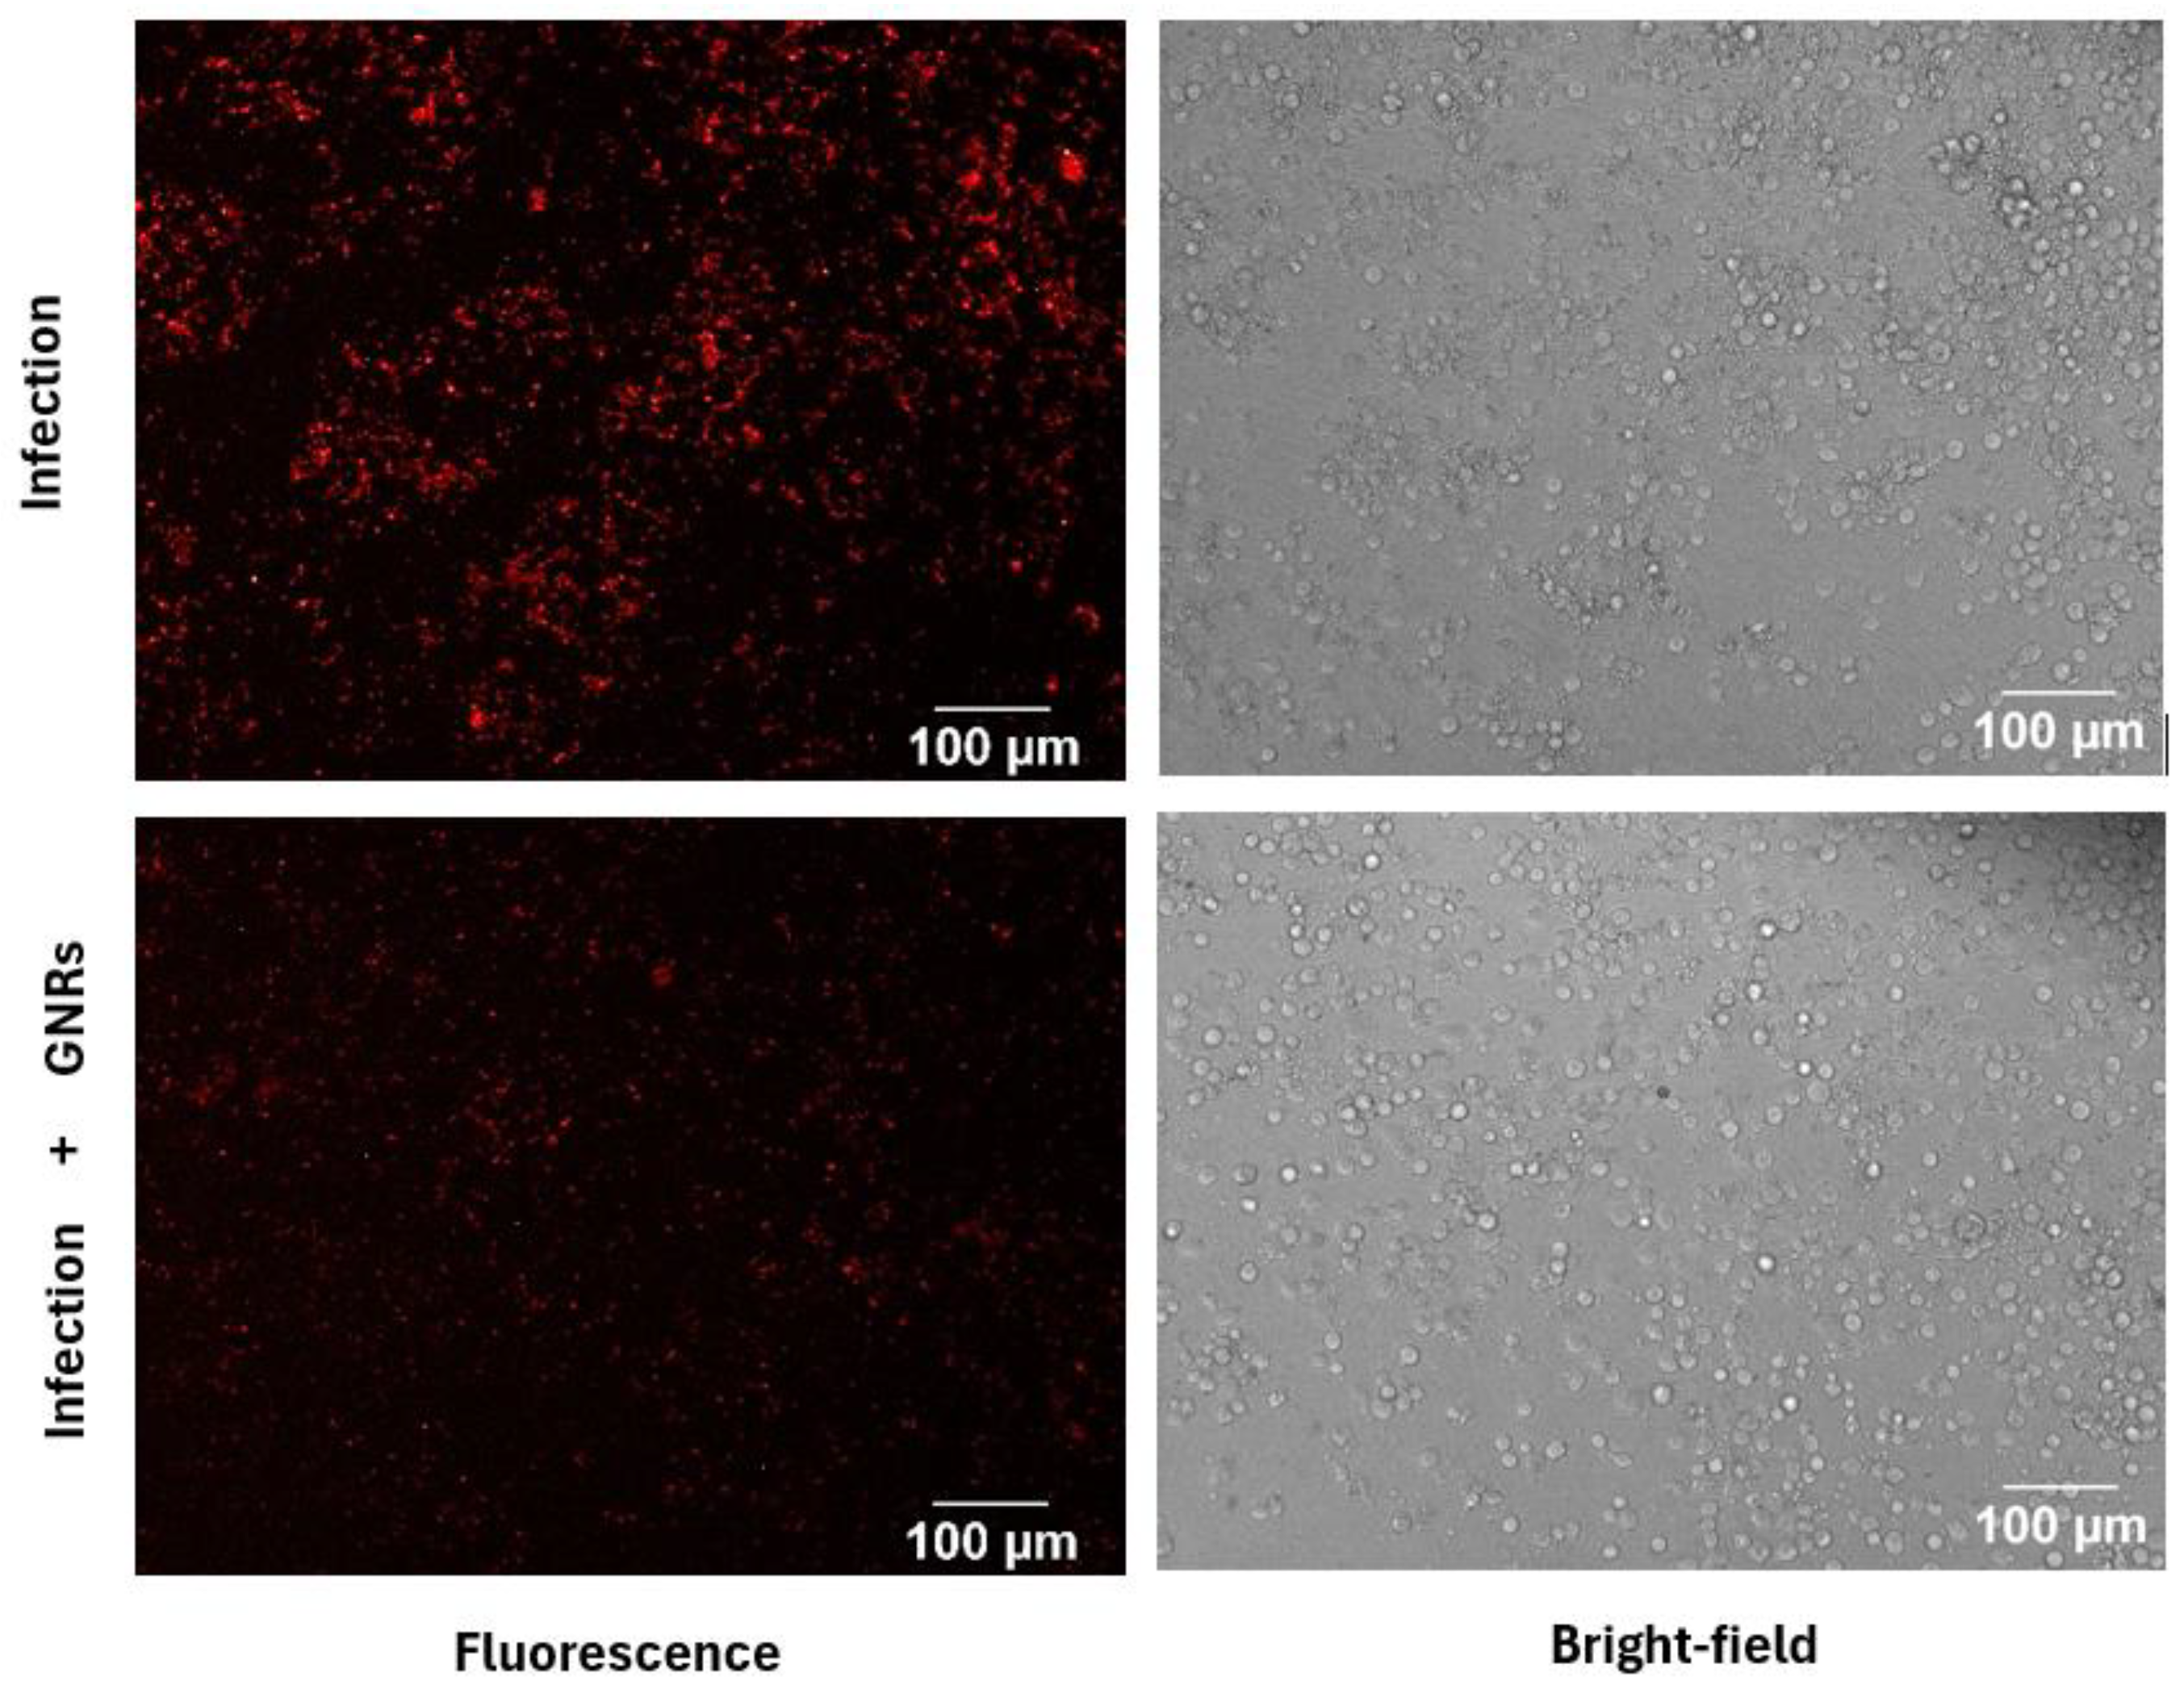
Figure 6.
Evolution of CTCF in infected samples and samples treated with GNRs over 72 hours.
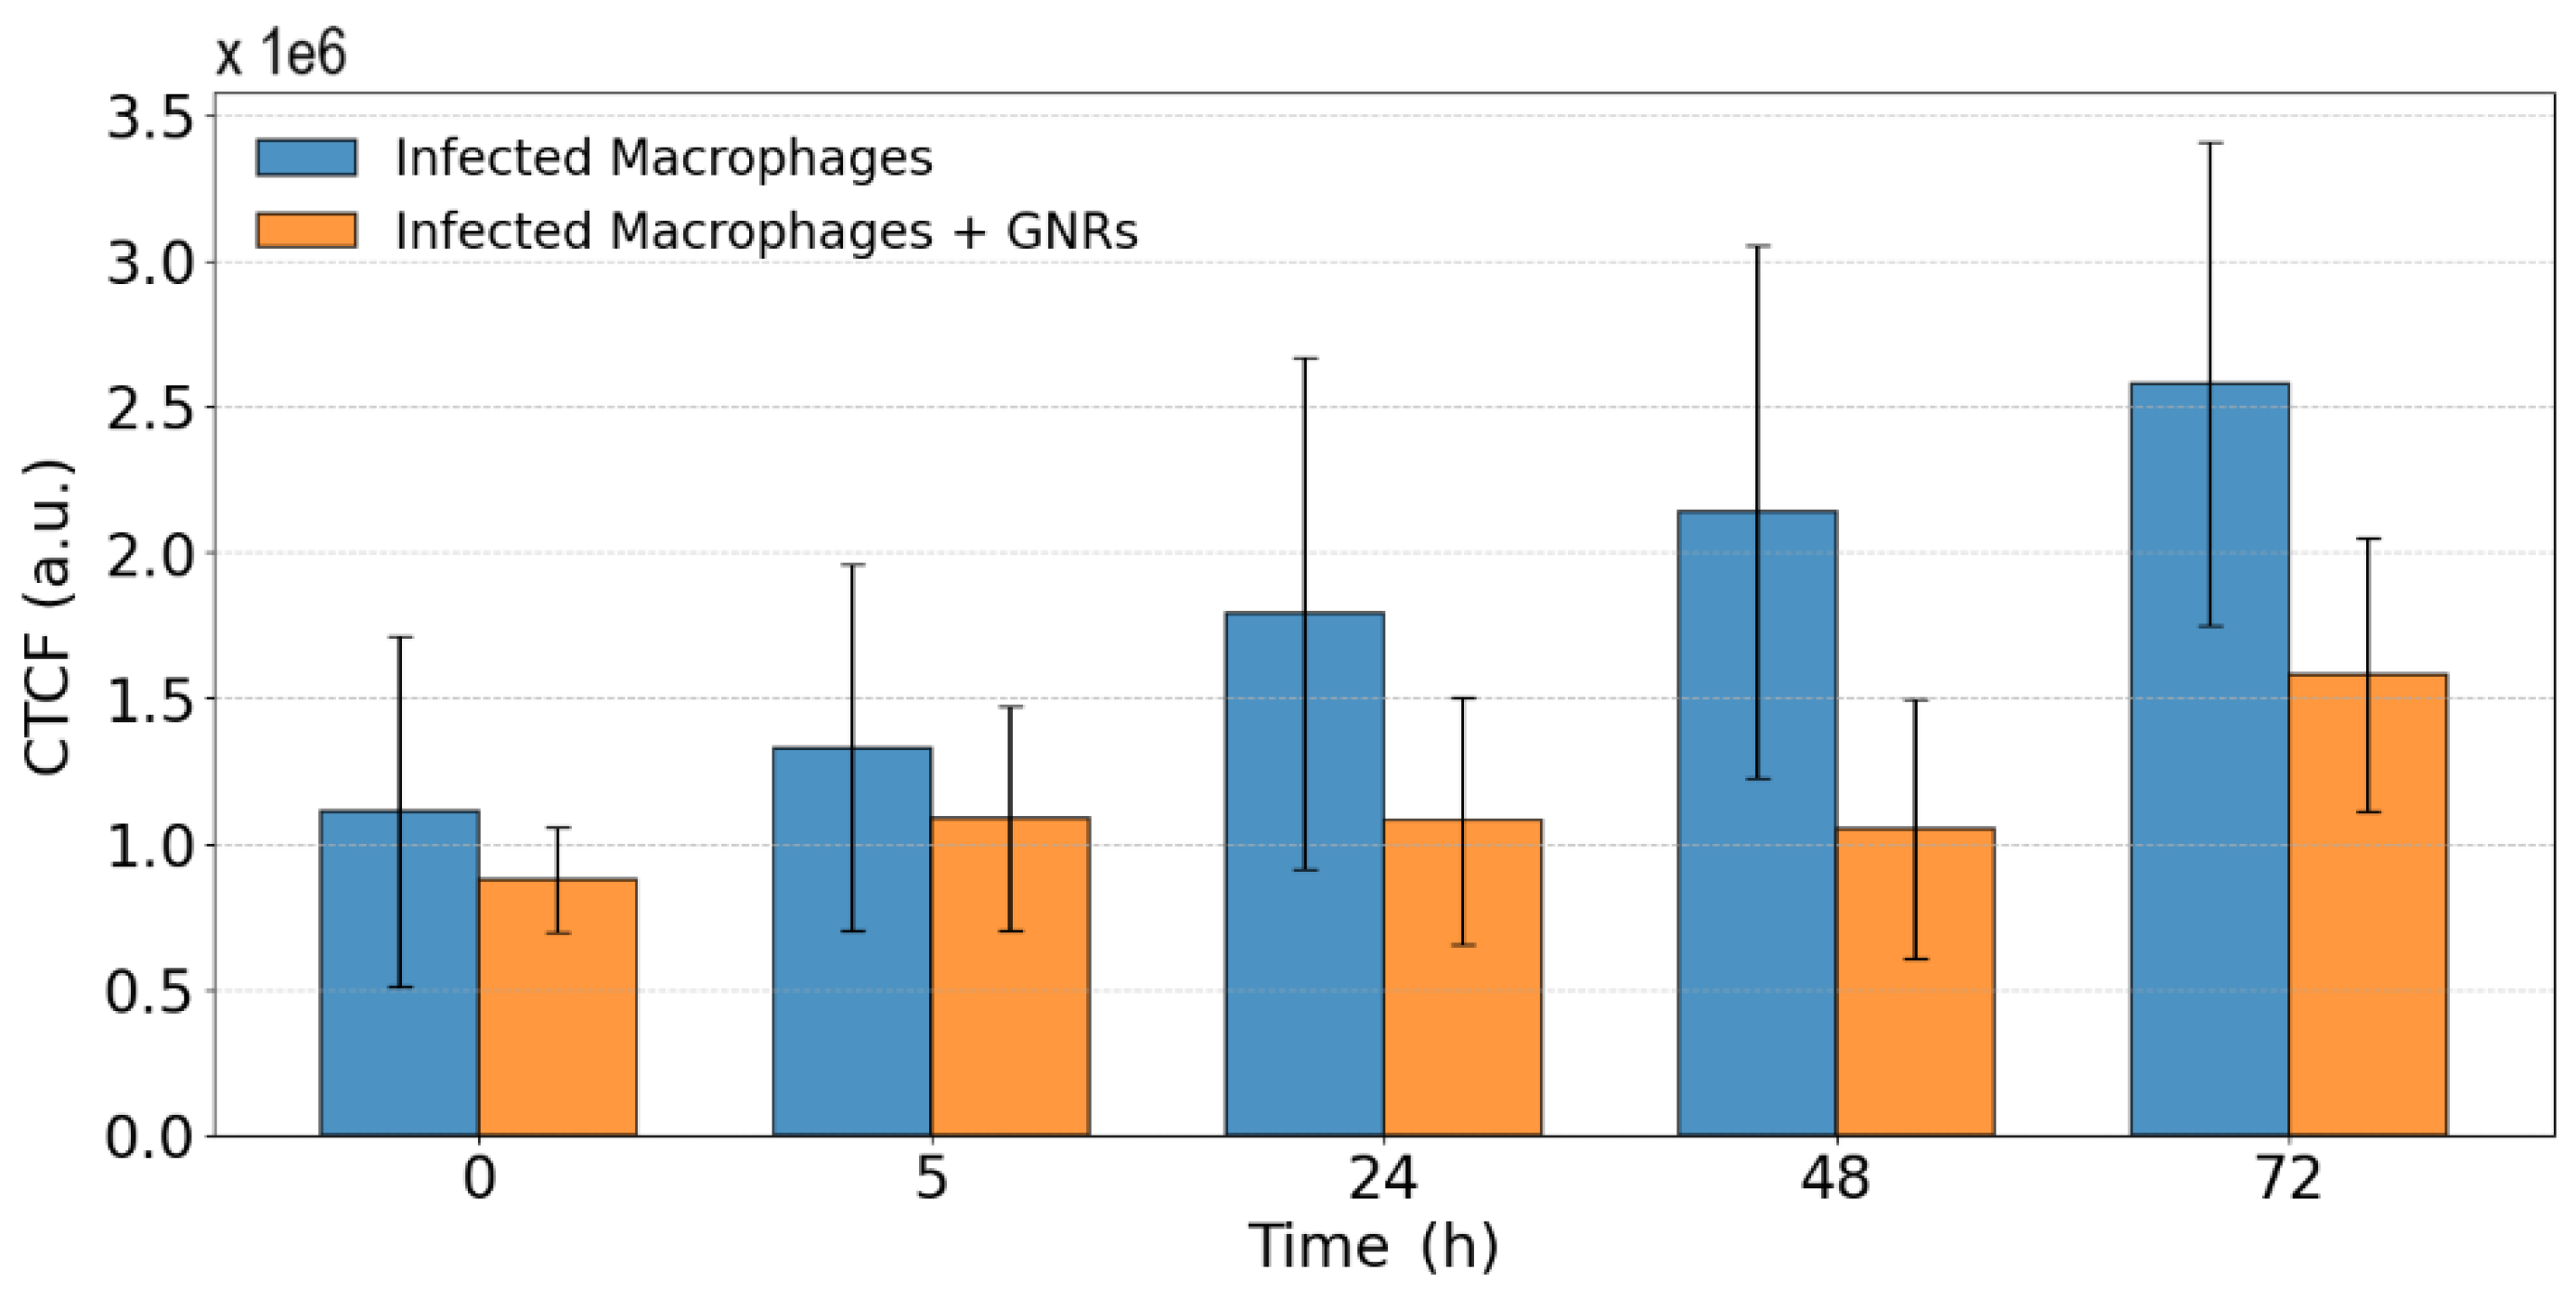
Figure 7.
Evolution of mapped areas for the CTCF calculation and the evolution of Integrated Density (Int Den).
Figure 7.
Evolution of mapped areas for the CTCF calculation and the evolution of Integrated Density (Int Den).
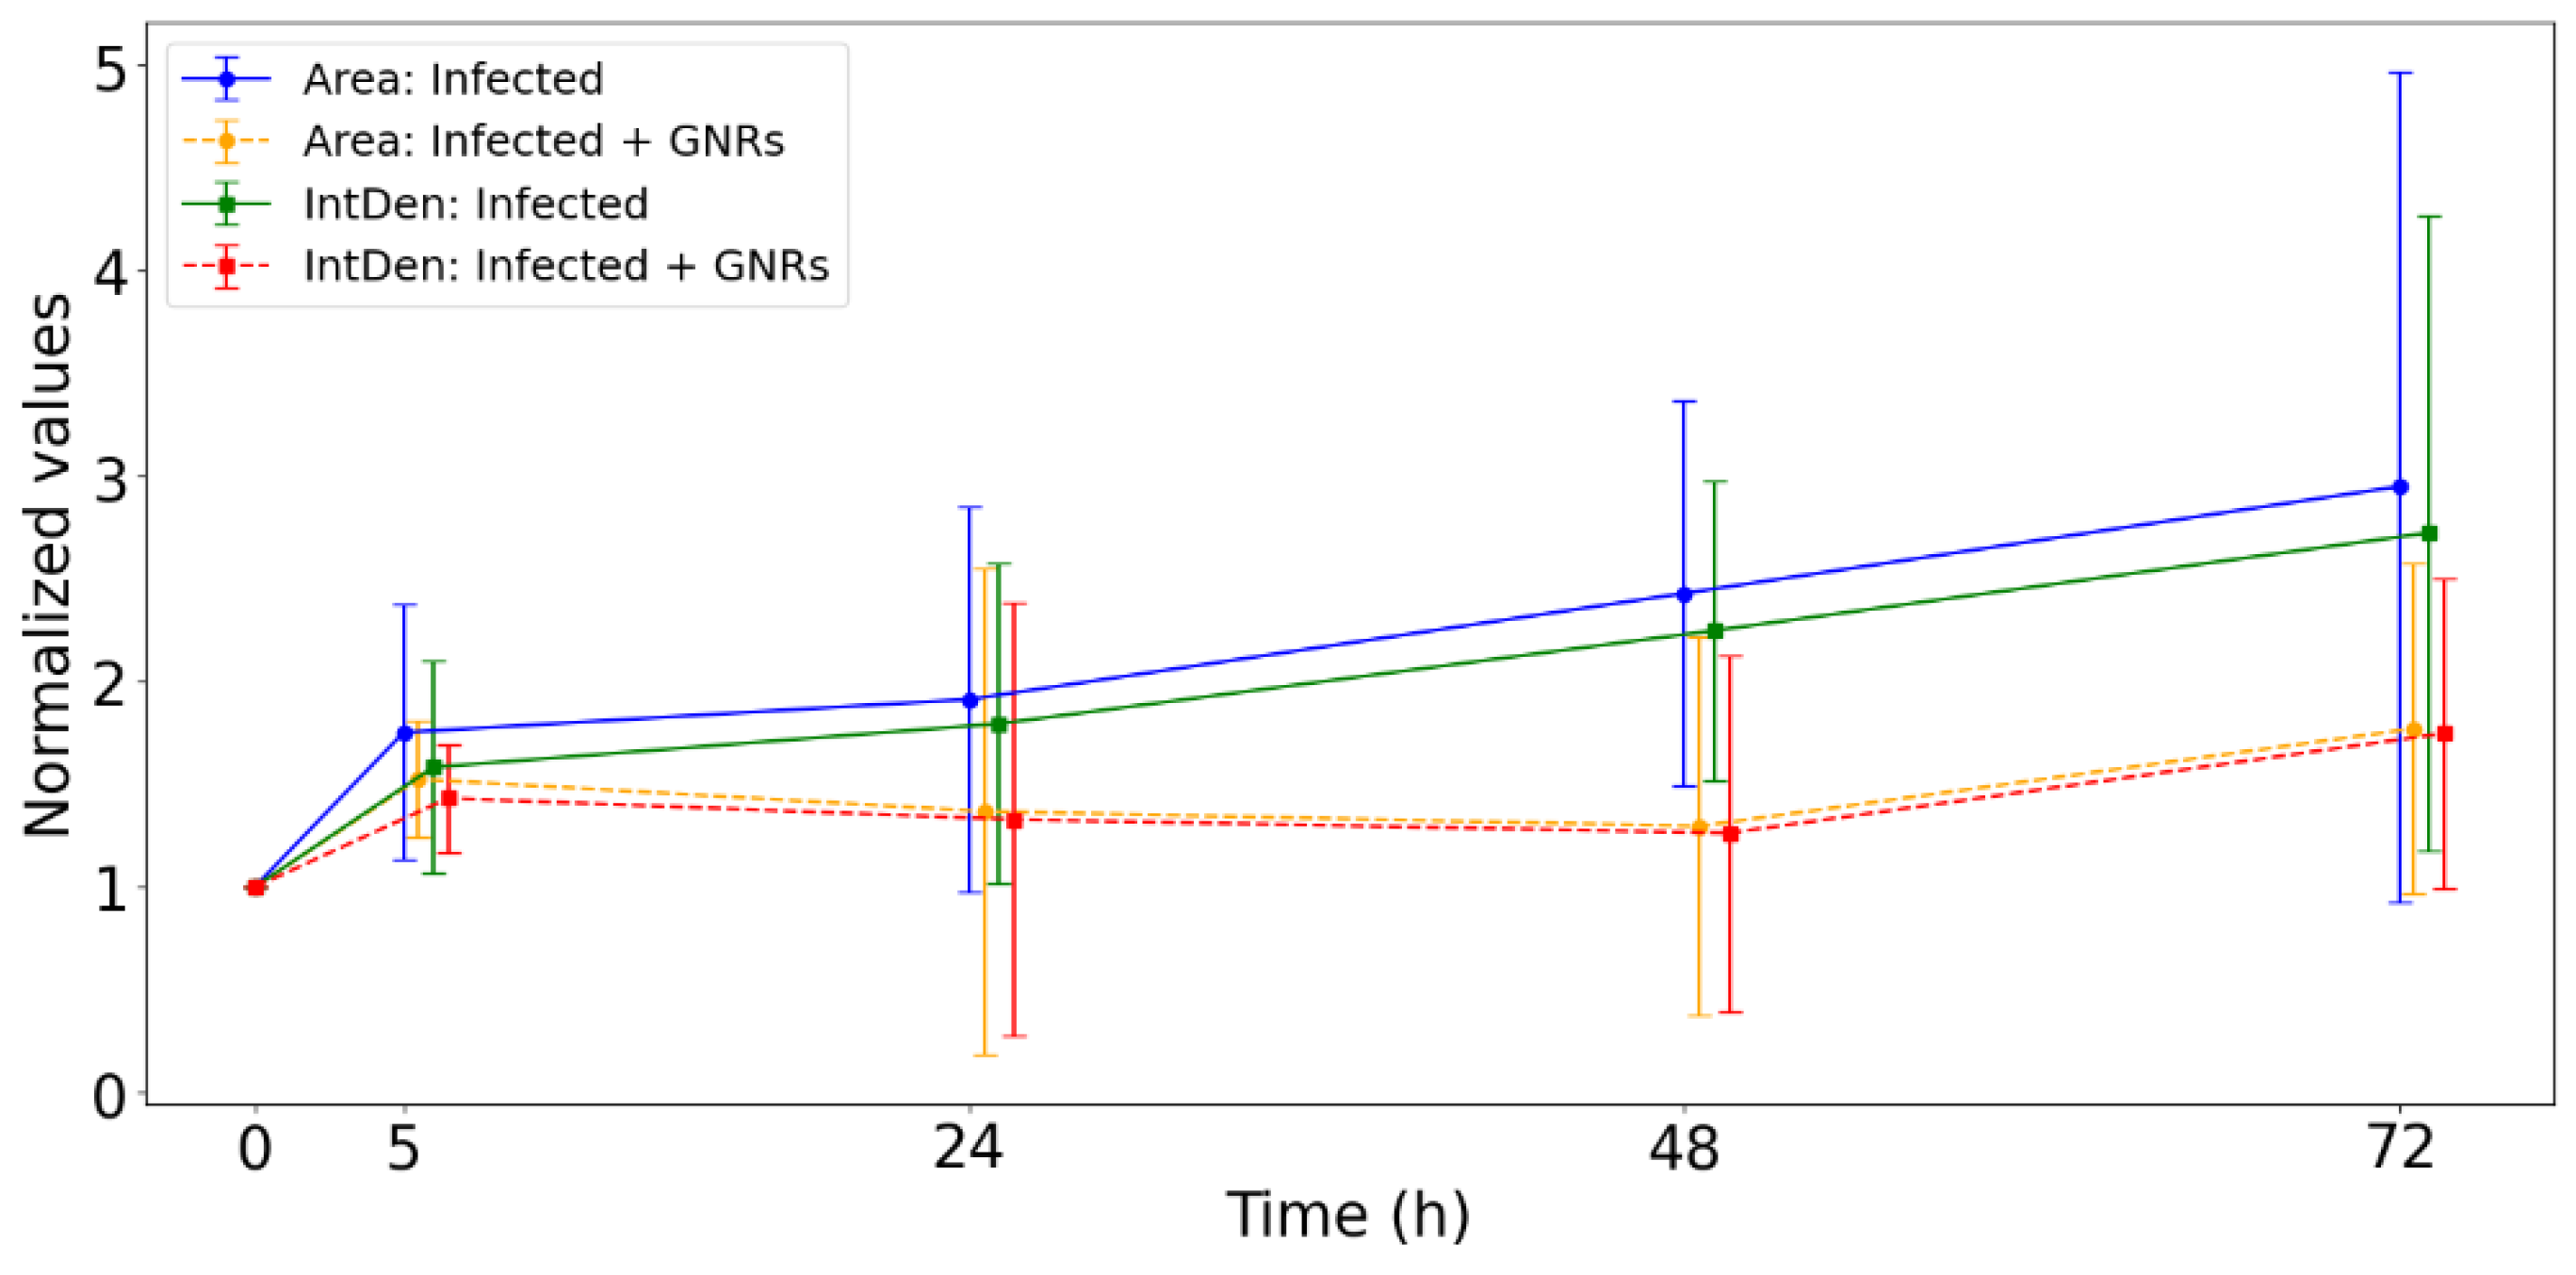
Figure 8.
Representative examples of the data analysis. (a) Example of a selected analysis area within the cells. (b) Corresponding graph showing the CTAF curve obtained from the analysis. For this specific region we obtained and .
Figure 8.
Representative examples of the data analysis. (a) Example of a selected analysis area within the cells. (b) Corresponding graph showing the CTAF curve obtained from the analysis. For this specific region we obtained and .

Figure 9.
Boxplot representation of the bending modulus (kc) and viscosity (η) parameters for the studied groups. (a) Boxplot for the bending modulus (kc); (b) Boxplot for viscosity (η). The boxes indicate the interquartile range (IQR), with the horizontal line inside each box representing the median. The whiskers extend to the minimum and maximum values within 1.5 times the IQR, while outliers are shown as individual points. Graph Legend:  P value: *** p<0.001; ** p<0.01; * p<0.05;
  Mean;
Mean;  Median; ○ outliers;
  Healthy group;
  Healthy + GNR group;
  Infected group and
  Infected + GNR.
P value: *** p<0.001; ** p<0.01; * p<0.05; Mean; Median; ○ outliers; Healthy group; Healthy + GNR group; Infected group and Infected + GNR.
Figure 9.
Boxplot representation of the bending modulus (kc) and viscosity (η) parameters for the studied groups. (a) Boxplot for the bending modulus (kc); (b) Boxplot for viscosity (η). The boxes indicate the interquartile range (IQR), with the horizontal line inside each box representing the median. The whiskers extend to the minimum and maximum values within 1.5 times the IQR, while outliers are shown as individual points. Graph Legend: P value: *** p<0.001; ** p<0.01; * p<0.05; Mean; Median; ○ outliers; Healthy group; Healthy + GNR group; Infected group and Infected + GNR.
P value: *** p<0.001; ** p<0.01; * p<0.05; Mean; Median; ○ outliers; Healthy group; Healthy + GNR group; Infected group and Infected + GNR.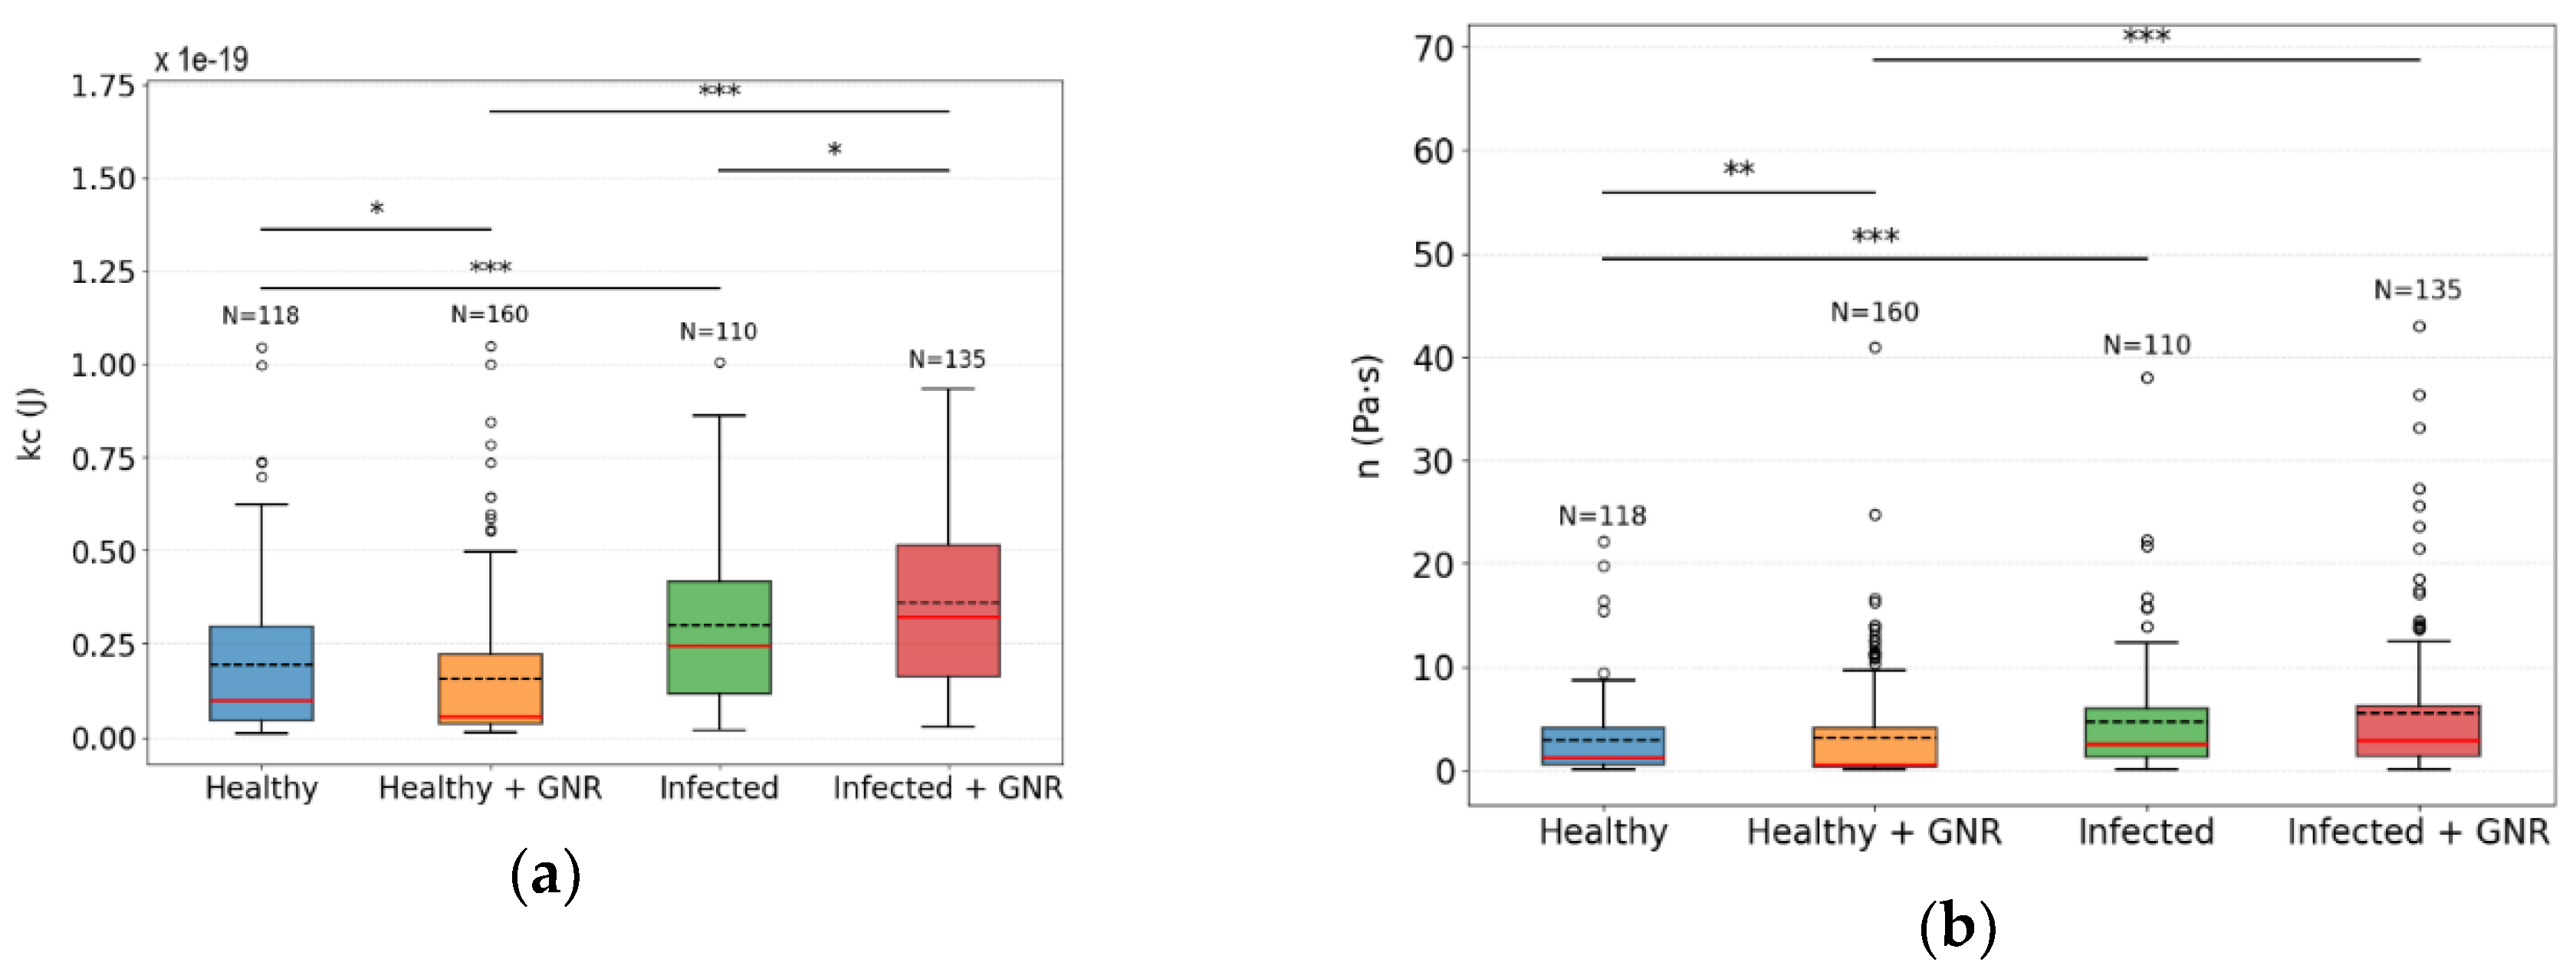
Disclaimer/Publisher’s Note: The statements, opinions and data contained in all publications are solely those of the individual author(s) and contributor(s) and not of MDPI and/or the editor(s). MDPI and/or the editor(s) disclaim responsibility for any injury to people or property resulting from any ideas, methods, instructions or products referred to in the content. |
© 2025 by the authors. Licensee MDPI, Basel, Switzerland. This article is an open access article distributed under the terms and conditions of the Creative Commons Attribution (CC BY) license (http://creativecommons.org/licenses/by/4.0/).
Copyright: This open access article is published under a Creative Commons CC BY 4.0 license, which permit the free download, distribution, and reuse, provided that the author and preprint are cited in any reuse.


