
Submitted:
06 August 2025
Posted:
07 August 2025
You are already at the latest version
Abstract
Although it seems obvious in today's era of digitization to have an electronic surface water database, as proven in earlier studies, there are still many shortcomings, errors, and a lack of updating spatial information about the hydrographic network despite its dynamic nature. The answer to the need for an up-to-date spatial water database com-bines GIS and remote sensing tools. Using the example of the Polish administration, this article synthesizes the structure of the surface water database. It develops a scheme for using geoinformation tools to automatically obtain information about the hydrographic network's course. The study also analyzed the optimization of remote sensing input im-ages of medium and low aerial ceiling.
Keywords:
hydrography
; water database
; UAV
; aerial imagery
1. Introduction
Geographic Information Systems (GIS) are widely used in water management, and modern hydrological analysis would not be as advanced were it not for the development of GIS. Although analytical algorithms are based mainly on vector data, large-scale data production is possible based on raster photogrammetric materials. Acquisition of data whose reliability and precision allow its final use for analytical purposes is possible thanks to today's developed remote sensing tools. This coupling of GIS and remote sensing tools was used, among others, by S.M. Taher [1] studying the degree of irrigation of agricultural areas, or B. Rahmani [2] designed a catchment management model for flood and drought management. Another widespread application of GIS and remote sensing tools in water management is the remote study of water quality, as demonstrated by the authors in their study on the use of multispectral indicators for remote detection of changes in the amount of chlorophyll or salinity in flowing waters [3,4].
As repeatedly emphasized in previous studies, despite the extensive resources of algorithms enabling precise representation of the hydrographic network in geographic space, existing surface water databases exhibit numerous discrepancies with the actual state. The main reasons for this state of affairs are a separate vectorization technique, lack of updating and unification on a supra-regional scale [5,6]. At this point, it is important to distinguish between the concepts of surface water database and the inventory. An inventory is a register - a catalog quantifying phenomena [7,8]. A spatial database, on the other hand, combines information about the location of the objects in question with descriptive attributes [9]. Search or filtering algorithms allow cataloging the data collected in the database so that the concept can access the database. Thus, in the hydrographic network, an inventory is a catalog of data of hydrographic objects (e.g., natural watercourses, lakes, artificial reservoirs). A water registry assigning the issue of maintenance of water data to a selected entity should therefore exist legally. A spatial database can be the tool in which such an inventory is created, or it can be a separate entity that spatially or attribute-wise organizes the information collected in the inventory [10]. While the creation of a database is a technical activity, the issue of inventory, especially merged with other regions, remains a substantive difficulty for every administrative level in Poland and around the world [11].
The input material is a key factor in obtaining the final product, such as a database. In the case of remote sensing data acquired within the context of a hydrographic network, the choice of data acquisition altitude is particularly important. Satellite images have low spatial resolution but allow for imaging a large area at a single moment (provided there is no cloud cover). Aerial photos (especially low-altitude ones acquired using an unmanned surface vehicle) allow for the acquisition of high-resolution images, but for large areas, this is a time-consuming process and requires working with BIG DATA. In the case of aerial remote sensing, it is impossible to acquire data for the same hydrological state (images are taken on consecutive days when the water level – the area occupied by water – may change) [12,13,14]. The issue of terrain relief also remains an important consideration - a photogrammetric raid should be planned for a uniform surface, eliminating the problem of terrain leveling (imaging scale change issues) and exposure (shading). When processing images acquired from a raid crossing different geographic landscapes, there may be disturbances in the measurement and generation of vector information (artifacts) [15].
Although the most common way of transferring hydrographic data to geo-information space has been the digitization of analog hydrographic maps or manual vectorization based on orthophotos [16,17], there are a number of tools that allow automatic generation of information about the course of the hydrographic network.
Among the methods of remote detection of water, the following can be distinguished:
- -
- use of multispectral indicators,
- -
- supervised classification,
- -
- detection of objects based on deep learning algorithms,
- -
- detection of subsidence based on the Digital Terrain Model (point cloud classification),
- -
- use of the ArcHydro toolkit to generate a hydrographic network based on the Digital Terrain Model (DTM),
- -
- contour map generated based on DTM (for water bodies).
The application of a particular method depends, on the one hand, on the availability of data, the technical possibilities in terms of the amount of data processed (hardware performance), as well as the target needs (the precision of processing and the type of output data - for example, linear data or polygons).
With images collected in several spectral ranges, especially in the near infrared, it is possible to perform a pixel algebra that allows for the isolation of pixels whose brightness is characteristic only for water [18]. This relationship forms the basis for indices such as the Near Differenced Water Index (NDWI), the Water Index (WI), and the Automated Water Extraction Index (AWEI) [19,20,21].
On the other hand, supervised classification is one of the pioneering machine learning methods of classifying pixels based on distance and brightness similarity. Thus, with the help of supervised classification, it is easy to automatically distinguish pixels representative of waters from pixels corresponding to the riverbank's zones [22]. Advanced and contemporary machine learning algorithms have made it possible to detect objects based on models generated from training fields indicating the brightness of pixels corresponding to a given land cover type. However, the use of deep learning for water detection is not limited to vast areas due to, among other things, the large size of the data required to generate and apply the model [23].
Taking advantage of the relationship that water always accumulates in depressions, its remote detection is effective using Digital Terrain Models. Due to the overlying land cover, extracting from the point cloud those points that correspond exclusively to the ground is necessary. If such classification is not already done at the raid stage, it can also be done using algorithms available in GIS software (e.g., Ground classification tool) [24,25]. For remote detection of water extent in a GIS environment, it may be helpful to create a contour drawing in which a given level delineates the extent of damming of a given reservoir [26].
Another useful tool for generating comprehensive hydrographic network information based on DEMs is ESRI's ArcHydro Tools. Using the toolkit, hydrographic information is generated in vector format based on analysis of runoff direction, flow accumulation, and catchment area [27].
Although the range of methods for remote sensing of waters is wide, each has limitations, while the key element of any hydrographic inventory is a reliable attribute description. For this reason, the final result of this work will be a proposal for a unified spatial structure of the hydrographic database, together with an optimized method of its acquisition (based on remote sensing and GIS) in order to create a consistent water inventory at the supra-regional level.
2. Materials and Methods
2.1. Study Area
The research was carried out on the example of Poland, with particular attention paid to the Imielinka River basin. The Imielinka River is a third-order stream within the Vistula River basin. The Imielinka River's sources are in a forested area in the center of Imielin, and the stream's length is approximately 8.1 km. At its mouth, the riverbed width is about 2.5 meters, and the catchment area covers 77.7 km². The river channel is largely regulated and equipped with numerous culverts; some sections are conducted in piped segments [28].
Imielinka flows as a right tributary into the Przemsza River near the Dziećkowice reservoir, in the Chełm Śląski area. This region is situated on a highland, within the Chełm mezoregion (341.11), which is part of the Silesian Upland macroregion, in the subprovince of the Silesian-Kraków Upland, and within the Polish Uplands [30]. The area lies within a transitional temperate climate zone, characterized by mixed forests. Administratively, the Imielinka River catchment is located within the municipalities of Lędziny and Chełm Śląski, in southern Poland, in the eastern part of the Silesian Voivodeship (Figure 1).
2.2. Attribute Structure
To identify key attribute data for the hydrographic network database, a nationwide survey was conducted among water management specialists – employees of the entity responsible for water management in Poland, the State Water Management Authority (PWD) Polish Waters. Responses were collected in 2024 from 93 participants residing throughout Poland, primarily in the Silesian Voivodeship. Therefore, opinions regarding the structure of the surface water database are not significantly influenced by local hydrographic or historical conditions.
In response to the question "Which information is most important for describing a specific watercourse and should be mandatory in the developing database?" (Scale: 0 – unnecessary; 6 – very necessary), the following options were presented:
- Official name of the watercourse (accurate and recognized),
- Alternative names (used colloquially or in other registers),
- Stream order,
- River basin (name of the receiving waterbody),
- Nature/characteristics (surface water + type and number of relevant documents, uncertain, river or other),
- Responsible entity for maintenance,
- Date of the last update,
- Comments (current issues or problems related to the waterbody).
2.3. Materials
A key aspect of the research involved generating information about the hydrographic network based on imagery processed from photogrammetric flights.
Aerial imagery and the elevation point cloud data were collected during a photogrammetric flight conducted on June 15, 2024, between 4:35 and 7:45 AM by the SP-OPK Diamond DA62 aircraft. Weather conditions on the flight day included an air temperature of +2°C and a pressure of 101.4 hPa. The ground sampling distance (GSD) was less than 0.1 meters, with a cross-track coverage of q=30% and an along-track coverage of p=80%. The flight direction was east-west. Photogrammetric images were captured in four spectral bands: red, green, blue, and near-infrared (NIR). A CityMapper-2 camera equipped with a D69.146/4.8 146 mm lens and a LiDAR (Light Detection and Ranging) scanner was used. The point cloud density was 7 points per square meter. The pixel size (GSD) was 1.5 meters.
Low-altitude images (flight altitude of 108 meters) were obtained using an Unmanned Aerial Vehicle (UAV) DJI Mavic 3 Multispectral, equipped with an RTK module. The flight took place on June 28, 2025. Images were captured in the following spectral ranges: visible (Red, Green, Blue), Red Edge, and Near Infrared (NIR). The pixel size was 5 centimeters.
The acquired images were aligned and processed into orthophotomaps using Agisoft Metashape software in both cases. The point clouds in LAS format were grouped into datasets and processed into a digital elevation model (DEM) and a digital terrain model (DTM) using ArcGIS Pro 3.2.
2.4. GIS Analysis
The process initially involved using orthophotomaps derived from images captured in the Green and NIR bands to generate information about the extent of the hydrographic network automatically. The Near Difference Water Index (NDWI) was calculated using a raster calculator. The NDWI is used to identify the presence of flowing water by analyzing the specific reflectance of the water surface relative to its surroundings. The index was computed through pixel algebra by dividing the green (GREEN) and near-infrared (NIR) bands according to the formula:
(GREEN – NIR) / (GREEN + NIR) [19]
NDWI values range from -1 to 1, with values greater than 0 indicating water-covered areas [31]. The resulting NDWI raster was reclassified in the next step using the equal interval method and then converted into a vector layer.
Point clouds were converted into LAS datasets for further analysis and subsequently transformed into a Digital Elevation Model (DEM). By adjusting the symbology, the lowest points representing the riverbed were identified.
All the abovementioned analyses were performed using ArcGIS Pro 3.2 software.
2.5. Field and Statistical Research
To verify the accuracy of remote detection of the river's course relative to its actual path in the field, measurements were conducted on August 29, 2024, using a GPS receiver Carlson BRx7. A total of 53 points were measured in the PUWG 1992 coordinate system at accessible locations within different parts of the riverbed (see Figure 1).
Subsequently, the distance between the automatically generated line representing the river's course and each measured point within the riverbed was measured using Near Distance. Then, the Pearson correlation coefficient was used to assess the correlation between the distances obtained for the line generated based on aerial images taken at medium and low altitudes.
The Pearson correlation coefficient is defined as the ratio of the covariance between two variables to the product of their standard deviations, and it is calculated using the following formula:
ρ = cov(X, Y) / (σx * σy) [32]
In this context, cov represents the covariance, while σx and σy denote the standard deviations of variables X and Y, respectively. The coefficient's values are confined within the closed interval [–1, 1]. A higher coefficient value indicates a stronger correlation.
3. Results
3.1. Database Structure
Firstly, survey research was conducted among water management specialists in Poland (employees of Polish Waters), in which respondents rated the most important attributes that should be recorded in the water register on a scale from 0 to 6. All respondents (i.e., 93 individuals) indicated the necessity of specifying the official name of the watercourse. Additionally, attributes such as the name of the water body's unit, information about the owner, and the character of the water were considered important. Conversely, the flow direction of the watercourse and the comments field were regarded as less significant. The greatest discrepancies in responses concerned the need to include alternative (other existing) names of the watercourse and the date of data updates (Figure 2). In response to the question about additional necessary attributes, there were frequent suggestions emphasizing the need to determine the mileage of the watercourse, which is only possible once the vector layer depicting the course of the river is accurately defined.
Based on the survey results, the authors in Figure 3 propose a scheme for a surface water database that can act as an inventory. It should be noted that the length field should include the length according to the field information in kilometers (in the format of 0.00), as it will be different from the length of the polyline representing the watercourse (due to the transformations associated with the relief when converting the length using the algorithm).
3.2. The Current Course of the Hydrographic Network – Workflow
Once the attribute structure has been created, the next step is to properly drawing in the objects. Based on previous research (under publication), the following scheme for processing photogrammetric images into vector data about the hydrographic network was adopted (Figure 4):
- Creation of an orthophotomosaic from images acquired in the Green spectrum and the NIR spectrum.
- Processing of orthophotomosaics based on the NDWI index.
- Reclassification of NDWI orthophotomosaics (equal intervals at 0.1 intervals).
- Raster to polygon transformation (classes representing NDWI values > 0).
- Simplifying the polygon representing the river reach and converting it into a line.
- Verification with DEM at 0.5 m interval of the lowest points of the terrain (riverbed) - from the mouth downstream.
Verification of the course of a watercourse based on DTM/DEM is ineffective in an area densely covered with vegetation (numerous artifacts - elevations or inability to extract points representing the ground). In general, however, using the appropriate symbolization, it is easy to extract the lowest points in relation to the environment, i.e. those representing the course of the riverbed. NDWI, on the other hand, does an excellent job of penetrating through vegetation and detecting water between plants.
Using both methods complementarily, it is possible to indicate the actual course of the hydrographic network with high accuracy. A DEM or DTM gives a general terrain picture, while NDWI helps isolate water even among dense vegetation.
3.3. Comparison of Accuracy with Field Measurements
To investigate whether the information obtained from aerial imagery captured at medium altitude (aerial photogrammetric flight) is consistent with the data derived from low-altitude remote sensing (collected using UAV), the polylines generated based on these data were compared against ground survey measurements.
The measurements were performed using a precise GPS receiver at locations where it was possible to mark a point in the center of the watercourse. It should be noted that there was no possibility to delineate the full course of the river in the field for safety reasons, such as steeply terraced banks, dense vegetation, or unfavorable terrain. Table 1 presents the distances from the measured points, obtained using the GPS receiver, to the line determined from aerial imagery and UAV images.
The width of the riverbed at the mouth is 2 m, while the maximum distance of automatically drawn polylines (based on NDWI and DTM/DEM) is more than 6 m for aerial photos, and more than 4 m for drone photos. For the distance of GPS points from the polylines drawn automatically from low-altitude photos, the other basic statistics (mean or median) are also lower (Table 2).
The line drawn from the aerial photo is located more than 2 m from the point measured in the field in the center of the trough in 18.5% (10 points out of 54). In the case of the line drawn from photos taken with a UAV, 14 points out of 54, i.e. 26%, are located more than 2 m from the point measured in the field.
The line drawn from aerial photography is located more than 1 m from the point measured in the field in the center of the trough in 52% (28 points out of 54). As for the line drawn from photos taken with a UAV, 25 points out of 54 i.e. 46% are located more than 1 m from the point measured in the field.
Therefore, a general trend indicates that the river's course was delineated with greater accuracy based on photogrammetric data collected through low-altitude remote sensing.
Additionally, a Pearson correlation test was conducted to examine whether there is a correlation between the distances of the lines drawn from aerial images and low-altitude images relative to points marked with GPS in the Imielinka watercourse. The correlation coefficient was 0.836, which is statistically significant (Figure 5). To confirm the high agreement, a non-parametric Sign test was also performed, yielding a p-value of 0.892. Since p-value > 0.05, the null hypothesis H0: The two samples follow the same distribution can be accepted. Statistical analyses thus demonstrated a high similarity between the course of the watercourse delineated based on aerial imagery at medium and low altitudes.
4. Discussion
The foundation of any spatial database is attribute data. These data determine the ability to generate queries for definition or selection and produce a spatial image according to specified criteria [29]. The desired scope of such data often results from the empirical experience of operators who input and process the data [33]. Therefore, the universal range of attribute data for water records presented in this work is based on survey data among water management employees. However, it should be noted that the survey was conducted exclusively in Poland, and the level of technological advancement and needs, including geographic information systems and remote sensing systems, vary across different regions of Europe and the world [34]. For this reason, survey results, although conducted in various geographic regions, may exhibit subjectivity, undermining the universality of the proposed database.
The surveys often indicated that there was a lack of information on the length of the watercourse. Creating a layer with the kilometer markers requires a few simple steps (dividing the line representing the watercourse into equal segments and determining points at the beginning and end of each segment) [6]. However, determining the river's length properly depends on accurate spatial databases, publicly available as official, unified, and geometrically correct data sources (which helps avoid discrepancies in data sets, etc.) [35,36,37].
Every method of verifying or delineating a linear object's course has limitations. Although it might seem that marking the watercourse in the field would allow for the most precise indication of its course, it should be noted that it was impossible to obtain the coordinates of a point located within the watercourse in many cases. The reasons included a lack of access to the watercourse (e.g., steep banks with an inclination >80°) or obstructions such as trees overhanging the watercourse that disturb positioning.
Dense vegetation both within the watercourse and along the banks is the most common cause of noise in remote sensing imagery [38,39]. Other noise sources include variability in lighting conditions during data acquisition (e.g., local cloud cover) and incorrect interpretation of the reflected wave spectrum [40]. Consequently, there are issues with pixel classification based on similarity in radiometric resolution [41]. The information obtained about the course of the Imielinka River based on the NDWI index calculated from aerial images was significantly less precise (in many places, the watercourse was not visible or asphalt/concrete surfaces had similar values to water) compared to the results obtained using this index on drone-acquired images.
The inverse relationship, on the other hand, was noted in the case of digital models. In the case of aerial imagery, it was a DTM based on a point cloud, from which it was possible to select only those points that represent the ground (tool: generate ground). In the case of imaging obtained from a drone, only a DEM with a lower spatial resolution was created. In areas where the riverbed was covered, the DEM was completely unhelpful in determining the course of the watercourse. Despite this, M. Łącka [24], based on the DEM created from photos acquired with the UAV, analyzed the shoreline zone.
Nevertheless, high-density point elevation data from airborne laser scanning is commonly used to detect aquatic objects. This is due to the high sampling density, including between vegetation and other objects covering the watercourse. Increasingly, models based on neural networks are being used to classify a given terrain layer automatically [42]. Thus, in the case of laser scanning, it is not the data acquisition ceiling that matters, but the density of points per square meter. For this reason, in the presented research, the manual symbolization of a DEM produced based on a point cloud made it possible to indicate the river's course in its entirety. Another way is to generate contour drawings or modified terrain profiles [26].
Considering the basic statistical quantities, the line based on low-altitude imageries was closer to the points measured in the field than the line determined based on aerial imageries. On average, however, this magnitude did not exceed 1.4 m (so it should be assumed that both lines ran correctly within the riverbed, the width of which at the mouth was 2 m). However, the selection of the data acquisition ceiling is an individual parameter depending on the purpose of the study. The higher the ceiling, the lower the accuracy, but the greater the range of imaging done under uniform atmospheric conditions [43]. Statistical studies, however, have shown a high convergence between lines drawn based on aerial photographs of both medium and low ceilings.
5. Conclusions
Previous studies by the authors revealed significant discrepancies and issues (such as time consumption and lack of automation) in achieving a comprehensive inventory of surface waters. A key element is a reliable database of surface waters that accurately depicts the hydrographic network in space and describes its attribute-wise.
Based on existing knowledge and conducted analyses, the presented research proposed an optimal attribute structure and workflow for the automated acquisition and processing of photogrammetric imagery into vector information of the hydrographic network. It was found that although images acquired using UAVs offer higher precision (compared to points measured within the watercourse using a precise GPS receiver), aerial images can also provide this information with comparable accuracy.
The best input materials to accurately map the hydrographic network in space are a DTM (generated from a dense LAS point cloud with a symbolization interval of approximately 0.5 meters) and multispectral images processed using the NDWI index. In this way, the automatically delineated line representing the watercourse falls within the riverbed boundaries. Even field measurements of the watercourse course using a GPS receiver are not feasible for capturing the entire course. Therefore, it is impossible to find a perfect and universal method; the key lies in optimally selecting input materials and methods, considering cost and time efficiency.
The choice of data acquisition altitude depends on the scope of the project and the desired accuracy. A significant ongoing challenge is the raster or scanning data size and the required storage capacity. Further research is necessary to optimize this process and explore the use of machine learning tools or neural networks to reduce the memory needed for processing.
Author Contributions
Conceptualization, N.J, M.M. and M.J.; methodology, D.A.; validation, D.A. and M.J.; formal analysis, N.J.; investigation, N.J. and M.M.; data curation, M.M. and N.J., writing—original draft preparation, N.J.; supervision, M.J. and D.A.; project administration, M.M. and M.J.
Funding
This research received no external funding
Conflicts of Interest
The authors declare no conflicts of interest
References
- Taher, S.M. GIS and Remote Sensing Application in Water Management in Agriculture Field. ScienceOpen Preprints 2020. [Google Scholar] [CrossRef]
- Rahmani, B. GIS and remote sensing in water resource engineering. Kardan J Eng Technol 2021, 3, 42–61. [Google Scholar] [CrossRef]
- Absalon, D.; Matysik, M.H.; Woźnica, A.; Janczewska, N.A. Detection of changes in the hydrobiological parameters of the Oder River during the ecological disaster in July 2022 based on multi-parameter probe tests and remote sensing methods. Ecological Indicators 2023, 148, 1–12. [Google Scholar] [CrossRef]
- Matysik, M.; Absalon, D.; Janczewska, N.; Woźnica, A. Detection of changes in water salinity based on patrol monitoring and remote sensing methods. Desalination and Water Treatment 2025, 321, 100930, ISSN 1944-3986. [Google Scholar] [CrossRef]
- Janczewska, N.; Absalon, D.; Matysik, M. Assessment of discrepancies between spatial databases of surface waters in the context of water management in Poland. In: Więzik, B. (Eds.) 2022. Współczesne problemy gospodarowania zasobami wodnymi. Monografie Komitetu Gospodarki Wodnej Polskiej Akademii Nauk. Zeszyt 45, pp. 85–96.
- Janczewska, N.; Matysik, M.; Absalon, D. Verification of the consistency of surface water spatial databases and their importance for water management in Poland. J Hydrol Reg Stud 2023, 49, 101486. [Google Scholar] [CrossRef]
- Wojciechowski, R.A. Model administracji rejestrów publicznych. Wybrane zagadnienia. Zeszyty Naukowe Uniwersytetu Przyrodniczo-Humanistycznego w Siedlcach. Seria: Administracja i Zarządzanie 2013, 257–273.
- Oleński, J. Rejestry administracyjne i systemy katastralne w infrastrukturze informacyjnej państwa — 7–9 września 2005. Uniwersytet Warszawski, Wisła. https://wodgik.katowice.pl/www/pobierz/wydarzenia/2005/Olenski.pdf (accessed on April 15 2025).
- Samson, G.L.; Lu, J.; Xu, Q. Spatial Databases: An Overview. In Ontologies and Big Data Considerations for Effective Intelligence; IGI Global: Hershey, PA, 2017; pp. 111–149. [Google Scholar] [CrossRef]
- Mihaylenko, V.; Honcharenko, T.; Chupryna, K.; Liazschenko, T. Integrated Processing of Spatial Information based on Multidimensional Data Models for General Planning Tasks. Int. J. Comput. 2021, 20, 55–62. [Google Scholar] [CrossRef]
- Janczewska, N.; Matysik, M.; Absalon, D.; Jarzyński, M.; Pieron, Ł. Use of spatial water database as an essential element of water management – a methodological overview. Environ Socio-Econ Stud 2025, 13(1), 53–62. [Google Scholar] [CrossRef]
- Kubišta, J.; Surový, P. Spatial resolution of unmanned aerial vehicles acquired imagery as a result of different processing conditions. Central Eur. For. J. 2021, 67, 148–154. [Google Scholar] [CrossRef]
- Messina, G.; Peña, J.M.; Vizzari, M.; Modica, G. A Comparison of UAV and Satellites Multispectral Imagery in Monitoring Onion Crop. Remote Sens. 2020, 12, 3424. [Google Scholar] [CrossRef]
- Alvarez-Vanhard, E.; Corpetti, T.; Houet, T. UAV & satellite synergies for optical remote sensing applications: A literature review. Sci. Remote Sens. 2021, 3, 100019. [Google Scholar] [CrossRef]
- Pervolarakis, Z.; Zidianakis, E.; Katzourakis, A.; Evdaimon, T.; Partarakis, N.; Zabulis, X.; Stephanidis, C. Three-Dimensional Digitization of Archaeological Sites—The Use Case of the Palace of Knossos. Heritage 2023, 6, 904–927. [Google Scholar] [CrossRef]
- Drwal, J.; Jankowski, A.T.; Kaniecki, A.; Michalczyk, Z.; Berus, T.; Jasiński, R.; Kokociński, P.; Ostrowski, W.; Pawlak, W.; Gutry-Korycka, M.; Pawlak, W.; Krazue-Tomczyk, I.; Sikorska, K. Wytyczne techniczne GIS - 3 Mapa Hydrograficzna Polski Skala 1:50 000 w formie analogowej i numerycznej. Główny Urząd Geodezji i Kartografii, Warszawa, 2005.
- Doskocz, A. Zakres możliwych błędów w bazach danych map wielkoskalowych. Acta Sci. Polonorum, Geodesia et Descriptio Terrarum 2015, 14(1-2), 19–34. [Google Scholar]
- Rad, A.M.; Kreitler, J.; Sadegh, M. Augmented Normalized Difference Water Index for improved surface water monitoring. Environ. Model. Softw. 2021, 140, 105030. [Google Scholar] [CrossRef]
- McFeeters, S.K. The use of the Normalized Difference Water Index (NDWI) in the delineation of open water features. Int J Remote Sens. 1996, 17(7), 1425–1432. [Google Scholar] [CrossRef]
- Danaher, T.; Collett, L. Development, Optimisation and Multi-Temporal Application of a Simple Landsat Based Water Index. In Proceedings of the 13th Australasian Remote Sensing and Photogrammetry Conference, Canberra, Australia, 20–24 November 2006. [Google Scholar]
- Feyisa, L.G.; Meilby, H.; Fensholt, R.; Proud, S.R. Automated Water Extraction Index: A new technique for surface water mapping using Landsat imagery. Remote Sens. Environ. 2014, 140, 23–35. [Google Scholar] [CrossRef]
- Sun, S.; Xue, Q.; Xing, X.; Zhao, H.; Zhang, F. Remote Sensing Image Interpretation for Coastal Zones: A Review. Remote Sens. 2024, 16, 4701. [Google Scholar] [CrossRef]
- Nasir, A.N.; Kansal, A.; Alshaltone, O.; Barneih, F.; Shanableh, A.; Al-Shabi, M.; Shammaa, A. Deep learning detection of types of water-bodies using optical variables and ensembling. Intell. Syst. Appl. 2023, 18, 200222. [Google Scholar] [CrossRef]
- Łącka, M. Analysis of algorithms for automatic classification of photogrammetric point clouds to build a digital terrain model in a shoreline area. Sci. J. Marit. Univ. Szczecin 2021, 68, 108–118. [Google Scholar]
- ESRI. Classify LAS Ground. Available online: https://pro.arcgis.com/en/pro-app/latest/tool-reference/3d-analyst/classify-las-ground.htm (accessed on April 15 2025).
- Stateczny, A.; Halicki, A.; Specht, M.; Specht, C.; Lewicka, O. Review of Shoreline Extraction Methods from Aerial Laser Scanning. Sensors 2023, 23, 5331. [Google Scholar] [CrossRef]
- Baye, M. Watershed delineation by Arc Hydro tools. Int. J. Sci. Res. 2020, 9, 956–961. [Google Scholar] [CrossRef]
- Hydroportal. Available online: https://wody.isok.gov.pl/imap_kzgw/ (accessed on June 17 2025).
- Bernardo, B.M.V.; Mamede, H.S.; Barroso, J.M.P.; Santos, V.M.P.D. Data governance & quality management—Innovation and breakthroughs across different fields. J. Innov. Knowl. 2024, 9, 100598. [Google Scholar] [CrossRef]
- Solon, J.; Borzyszkowski, J.; Bidłasik, et al. Physico-geographical mesoregions of Poland: Verification and adjustment of boundaries on the basis of contemporary spatial data. Geogr Pol. 2018, 91(2), 143–170. [CrossRef]
- McFeeters, S. Using the Normalized Difference Water Index (NDWI) within a Geographic Information System to detect swimming pools for mosquito abatement: A practical approach. Remote Sens. 2013, 5(7), 3544–3561. [Google Scholar] [CrossRef]
- Cohen, J. Statistical Power Analysis for the Behavioral Sciences, 2nd ed.Routledge: London, UK, 1988. [Google Scholar] [CrossRef]
- Żywiołek, J.; Nedeliaková, E. Identification of Attributes of Information as an Element of Management Security of Information in the Company. In Proceedings of the Quality Production Improvement – CQPI, Sciendo, 2019, 1(1), 170–177. [CrossRef]
- Dritsas, E.; Trigka, M. Remote Sensing and Geospatial Analysis in the Big Data Era: A Survey. Remote Sens. 2025, 17, 550. [Google Scholar] [CrossRef]
- Cadieux, N.; Kalacska, M.; Coomes, O.T.; Tanaka, M.; Takasaki, Y. A Python Algorithm for Shortest-Path River Network Distance Calculations Considering River Flow Direction. Data 2020, 5, 8. [Google Scholar] [CrossRef]
- Xiangyong, M.; Yindi, Z. 2021. IOP Conf. Ser.: Earth Environ. Sci. 820, 012021.
- Janczewska, N.; Matysik, M.; Absalon, D.; Bieda, A. Surface Flowing Waters Covered Areas From the Cadastre Database as a Source for the National Spatial Water Database—Case Study. Transactions in GIS 2025, 29, e70055. [Google Scholar] [CrossRef]
- Mehmood, M.; Shahzad, A.; Zafar, B.; Shabbir, A.; Ali, N. Remote Sensing Image Classification: A Comprehensive Review and Applications. Mathematical Problems in Engineering 2022, 2022, 5880959. [Google Scholar] [CrossRef]
- Zhou, T.; Fu, H.; Sun, C.; Wang, S. Shadow Detection and Compensation from Remote Sensing Images under Complex Urban Conditions. Remote Sens. 2021, 13, 699. [Google Scholar] [CrossRef]
- Gawlikowski, J.; Ebel, P.; Schmitt, M.; Zhu, X.X. Explaining the Effects of Clouds on Remote Sensing Scene Classification. IEEE J. Sel. Top. Appl. Earth Obs. Remote Sens. 2022, 15, 9976–9986. [Google Scholar] [CrossRef]
- Dai, J.; Ding, L.; Zhang, T.; Wang, J. RCFC: Radiometric resolution compression of remote sensing images considering feature reconstruction and color consistency. Digital Signal Process. 2025, 164, 105255. [Google Scholar] [CrossRef]
- Jussila, A.; Koski, C.; Kettunen, P. Vectorization of watercourse detection from neural network. Abstr. Int. Cartogr. Assoc. 2024, 7, 65. [Google Scholar] [CrossRef]
- Cha, Y.-J.; Ali, R.; Lewis, J.; BüyüközTürk, O. Deep learning-based structural health monitoring. Autom. Constr. 2024, 161, 105328. [Google Scholar] [CrossRef]
Figure 1.
Study area.
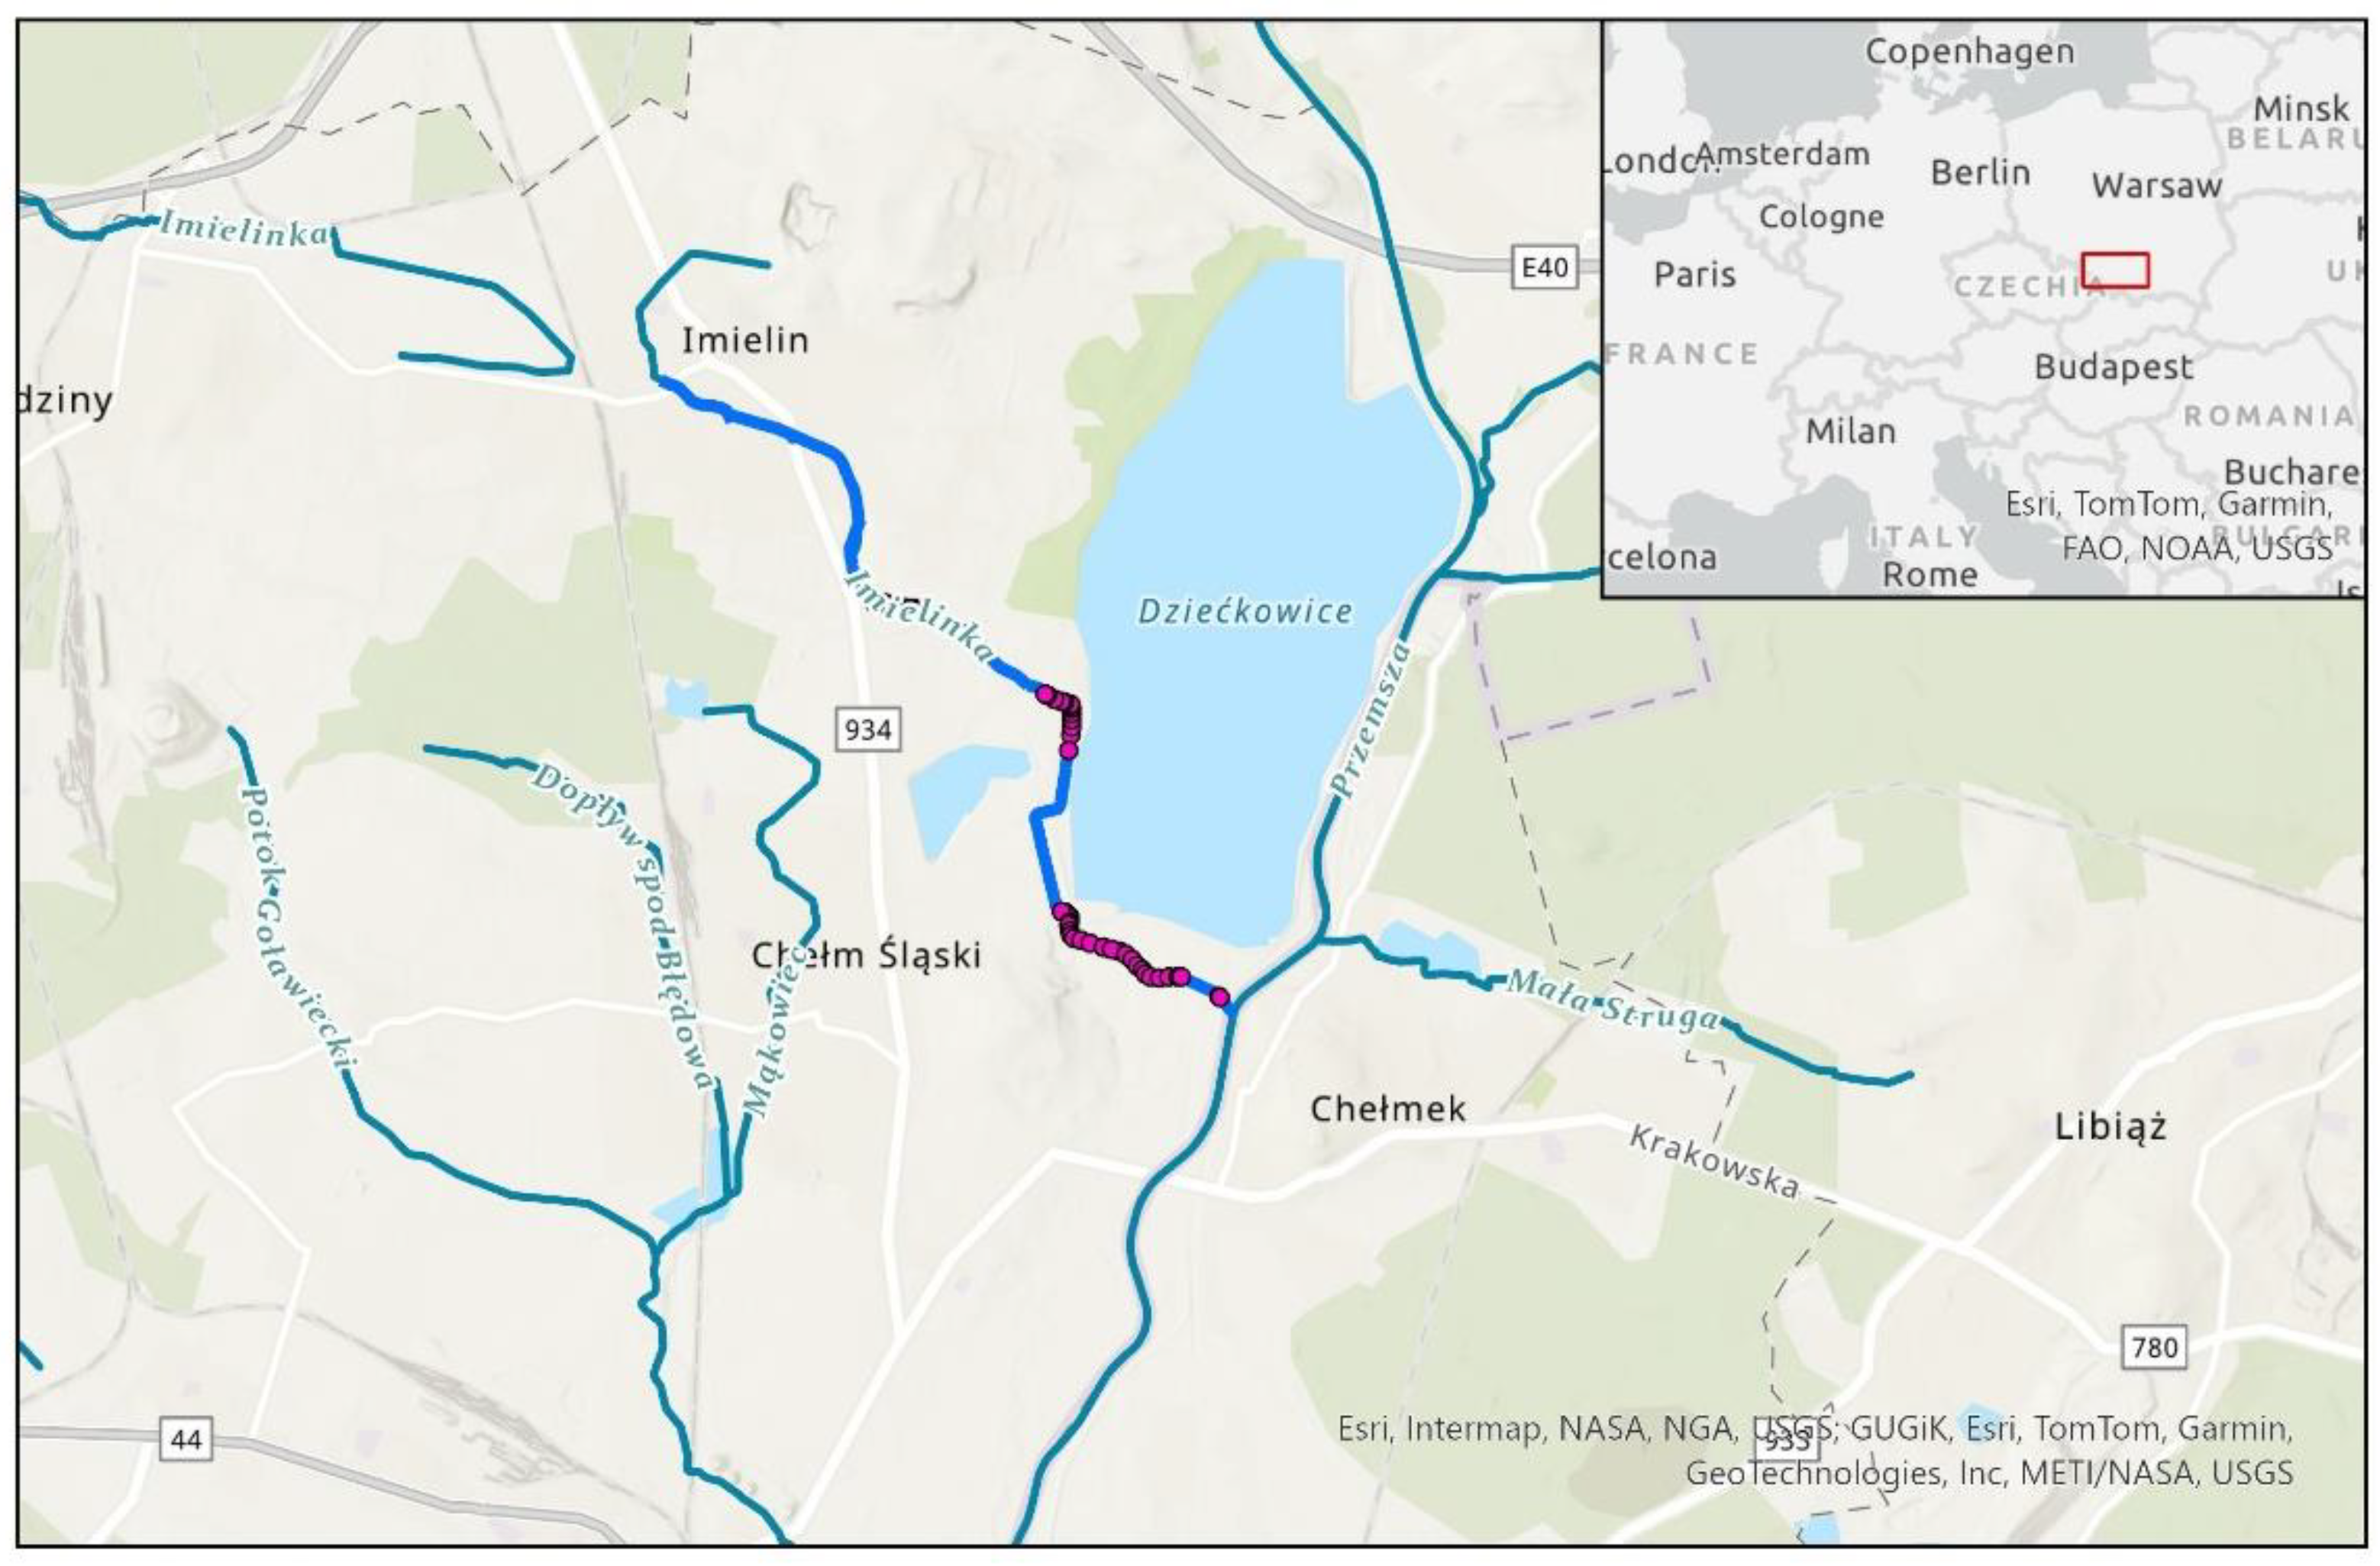
Figure 2.
Results of the survey regarding important attributes of the surface water database. Own study.
Figure 2.
Results of the survey regarding important attributes of the surface water database. Own study.
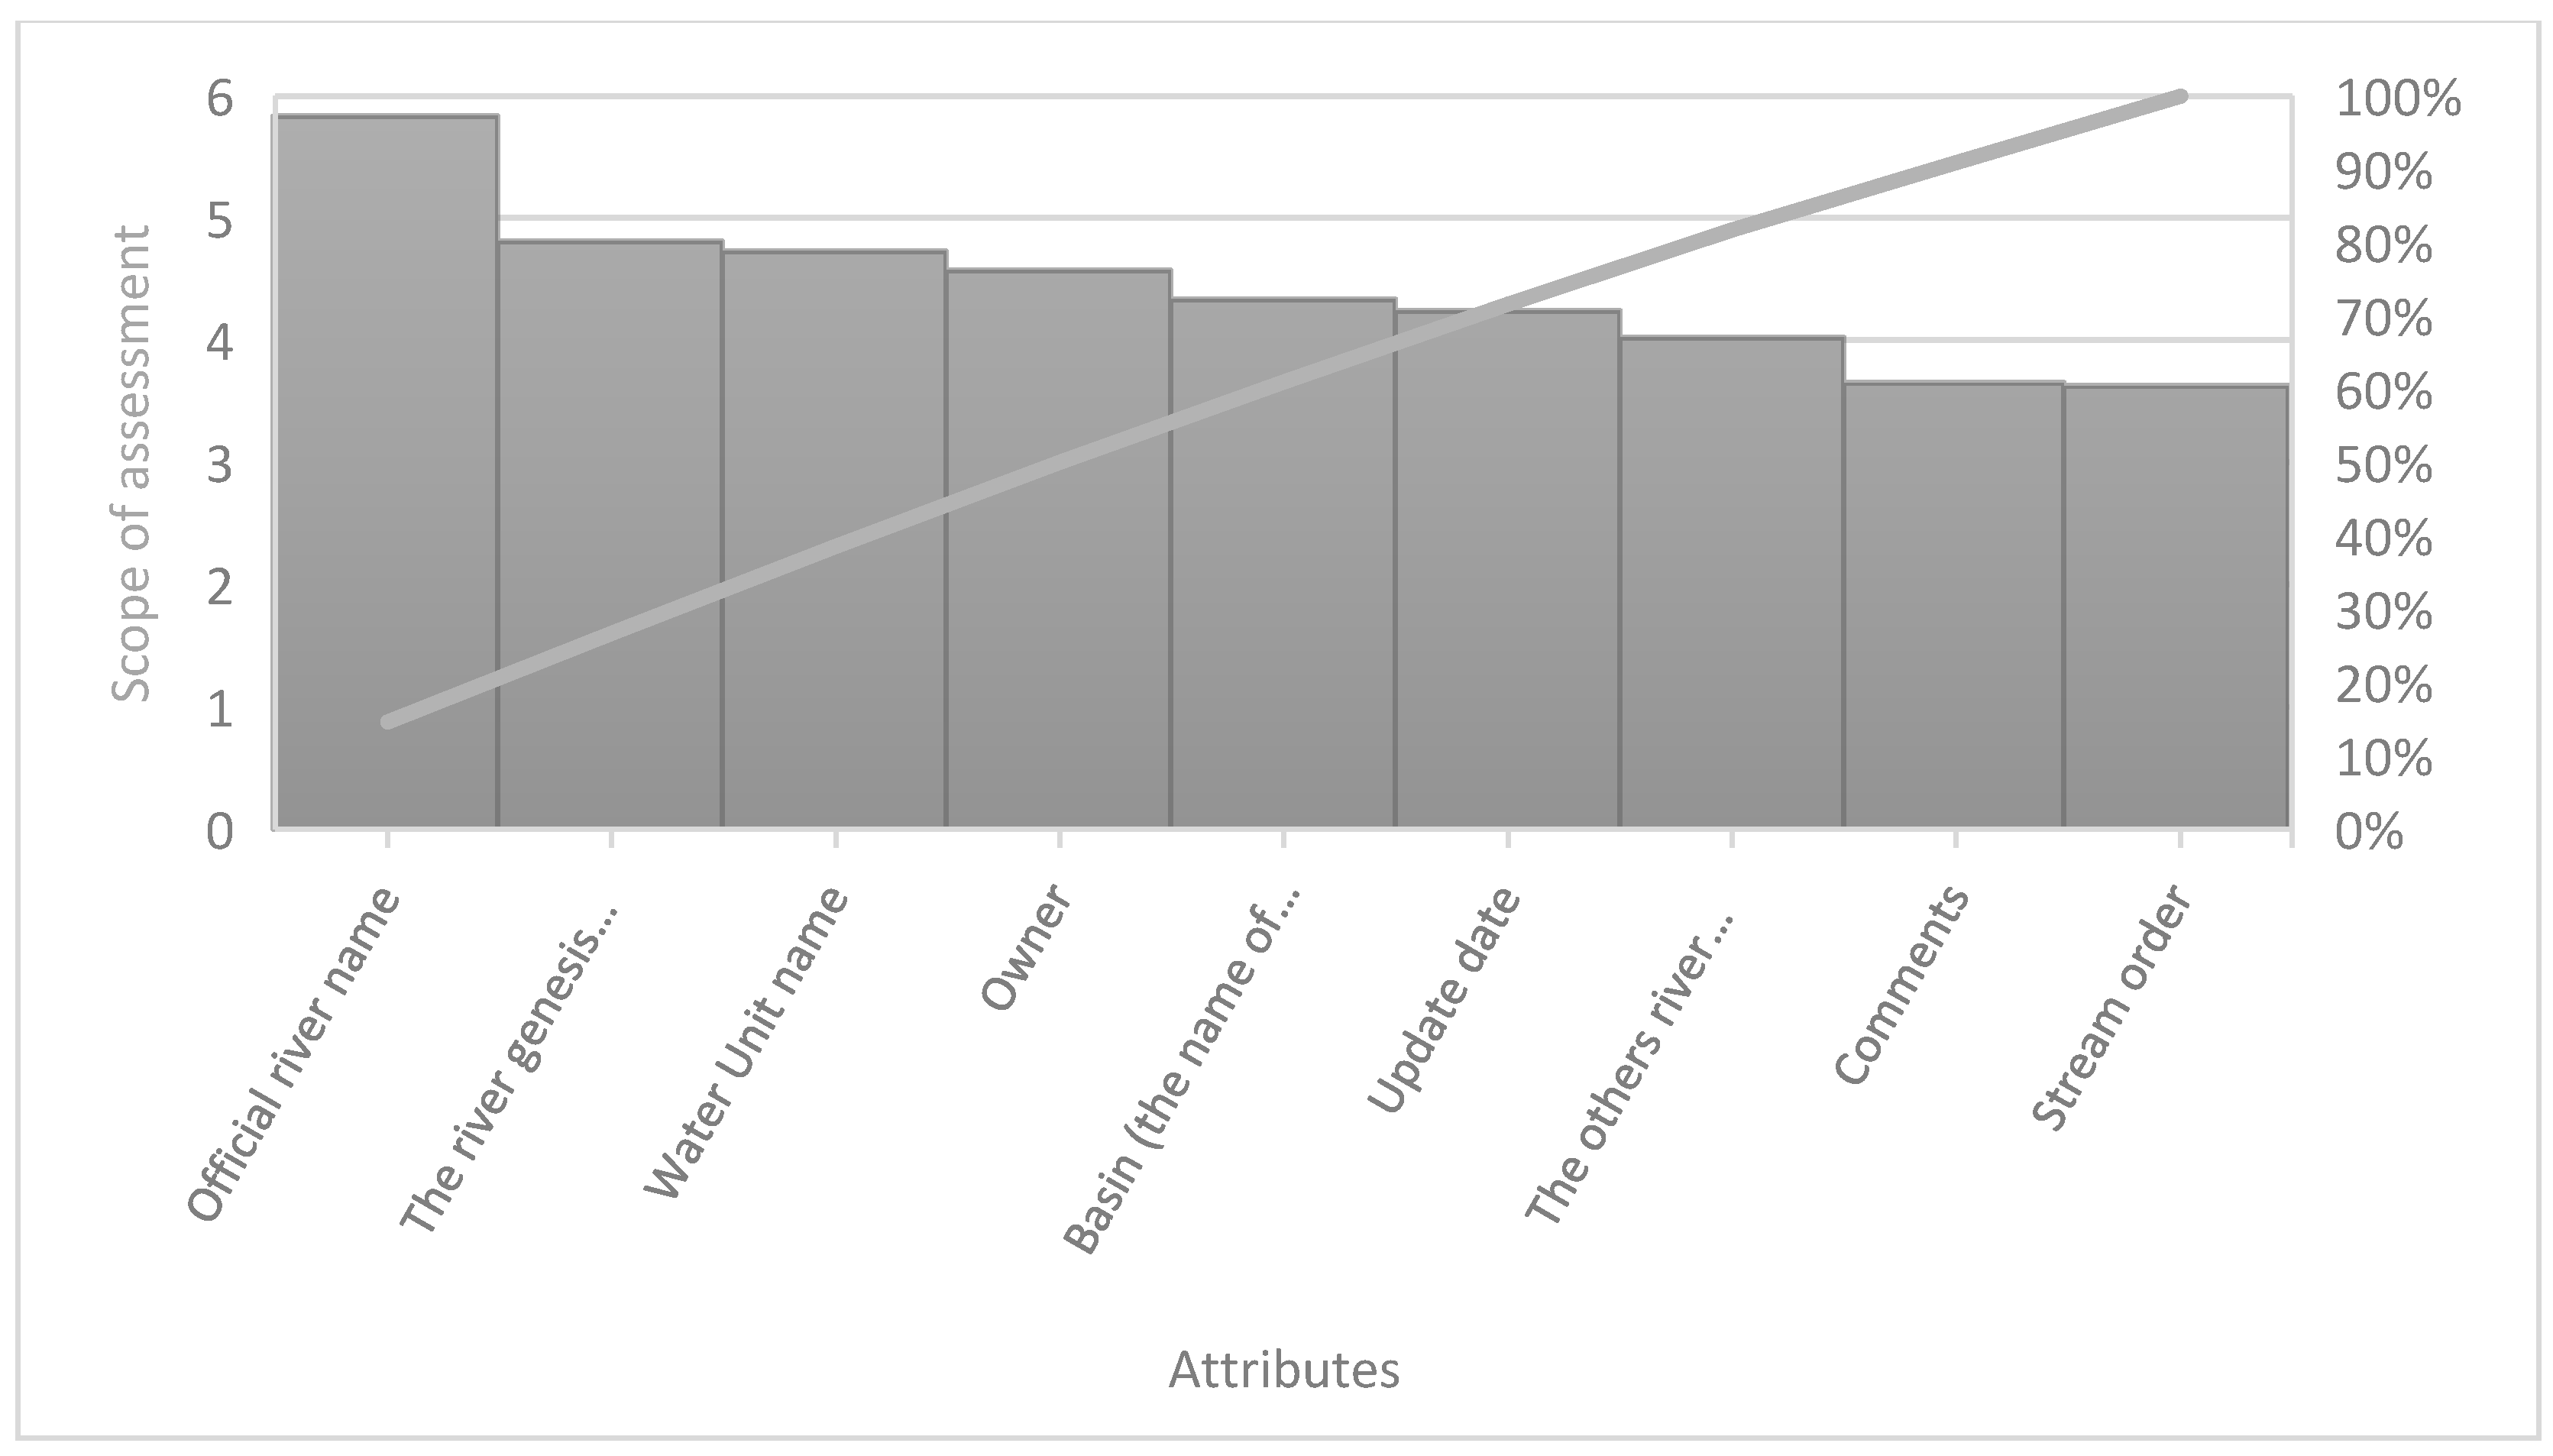
Figure 3.
Proposed attribute scheme of the watercourse layer.
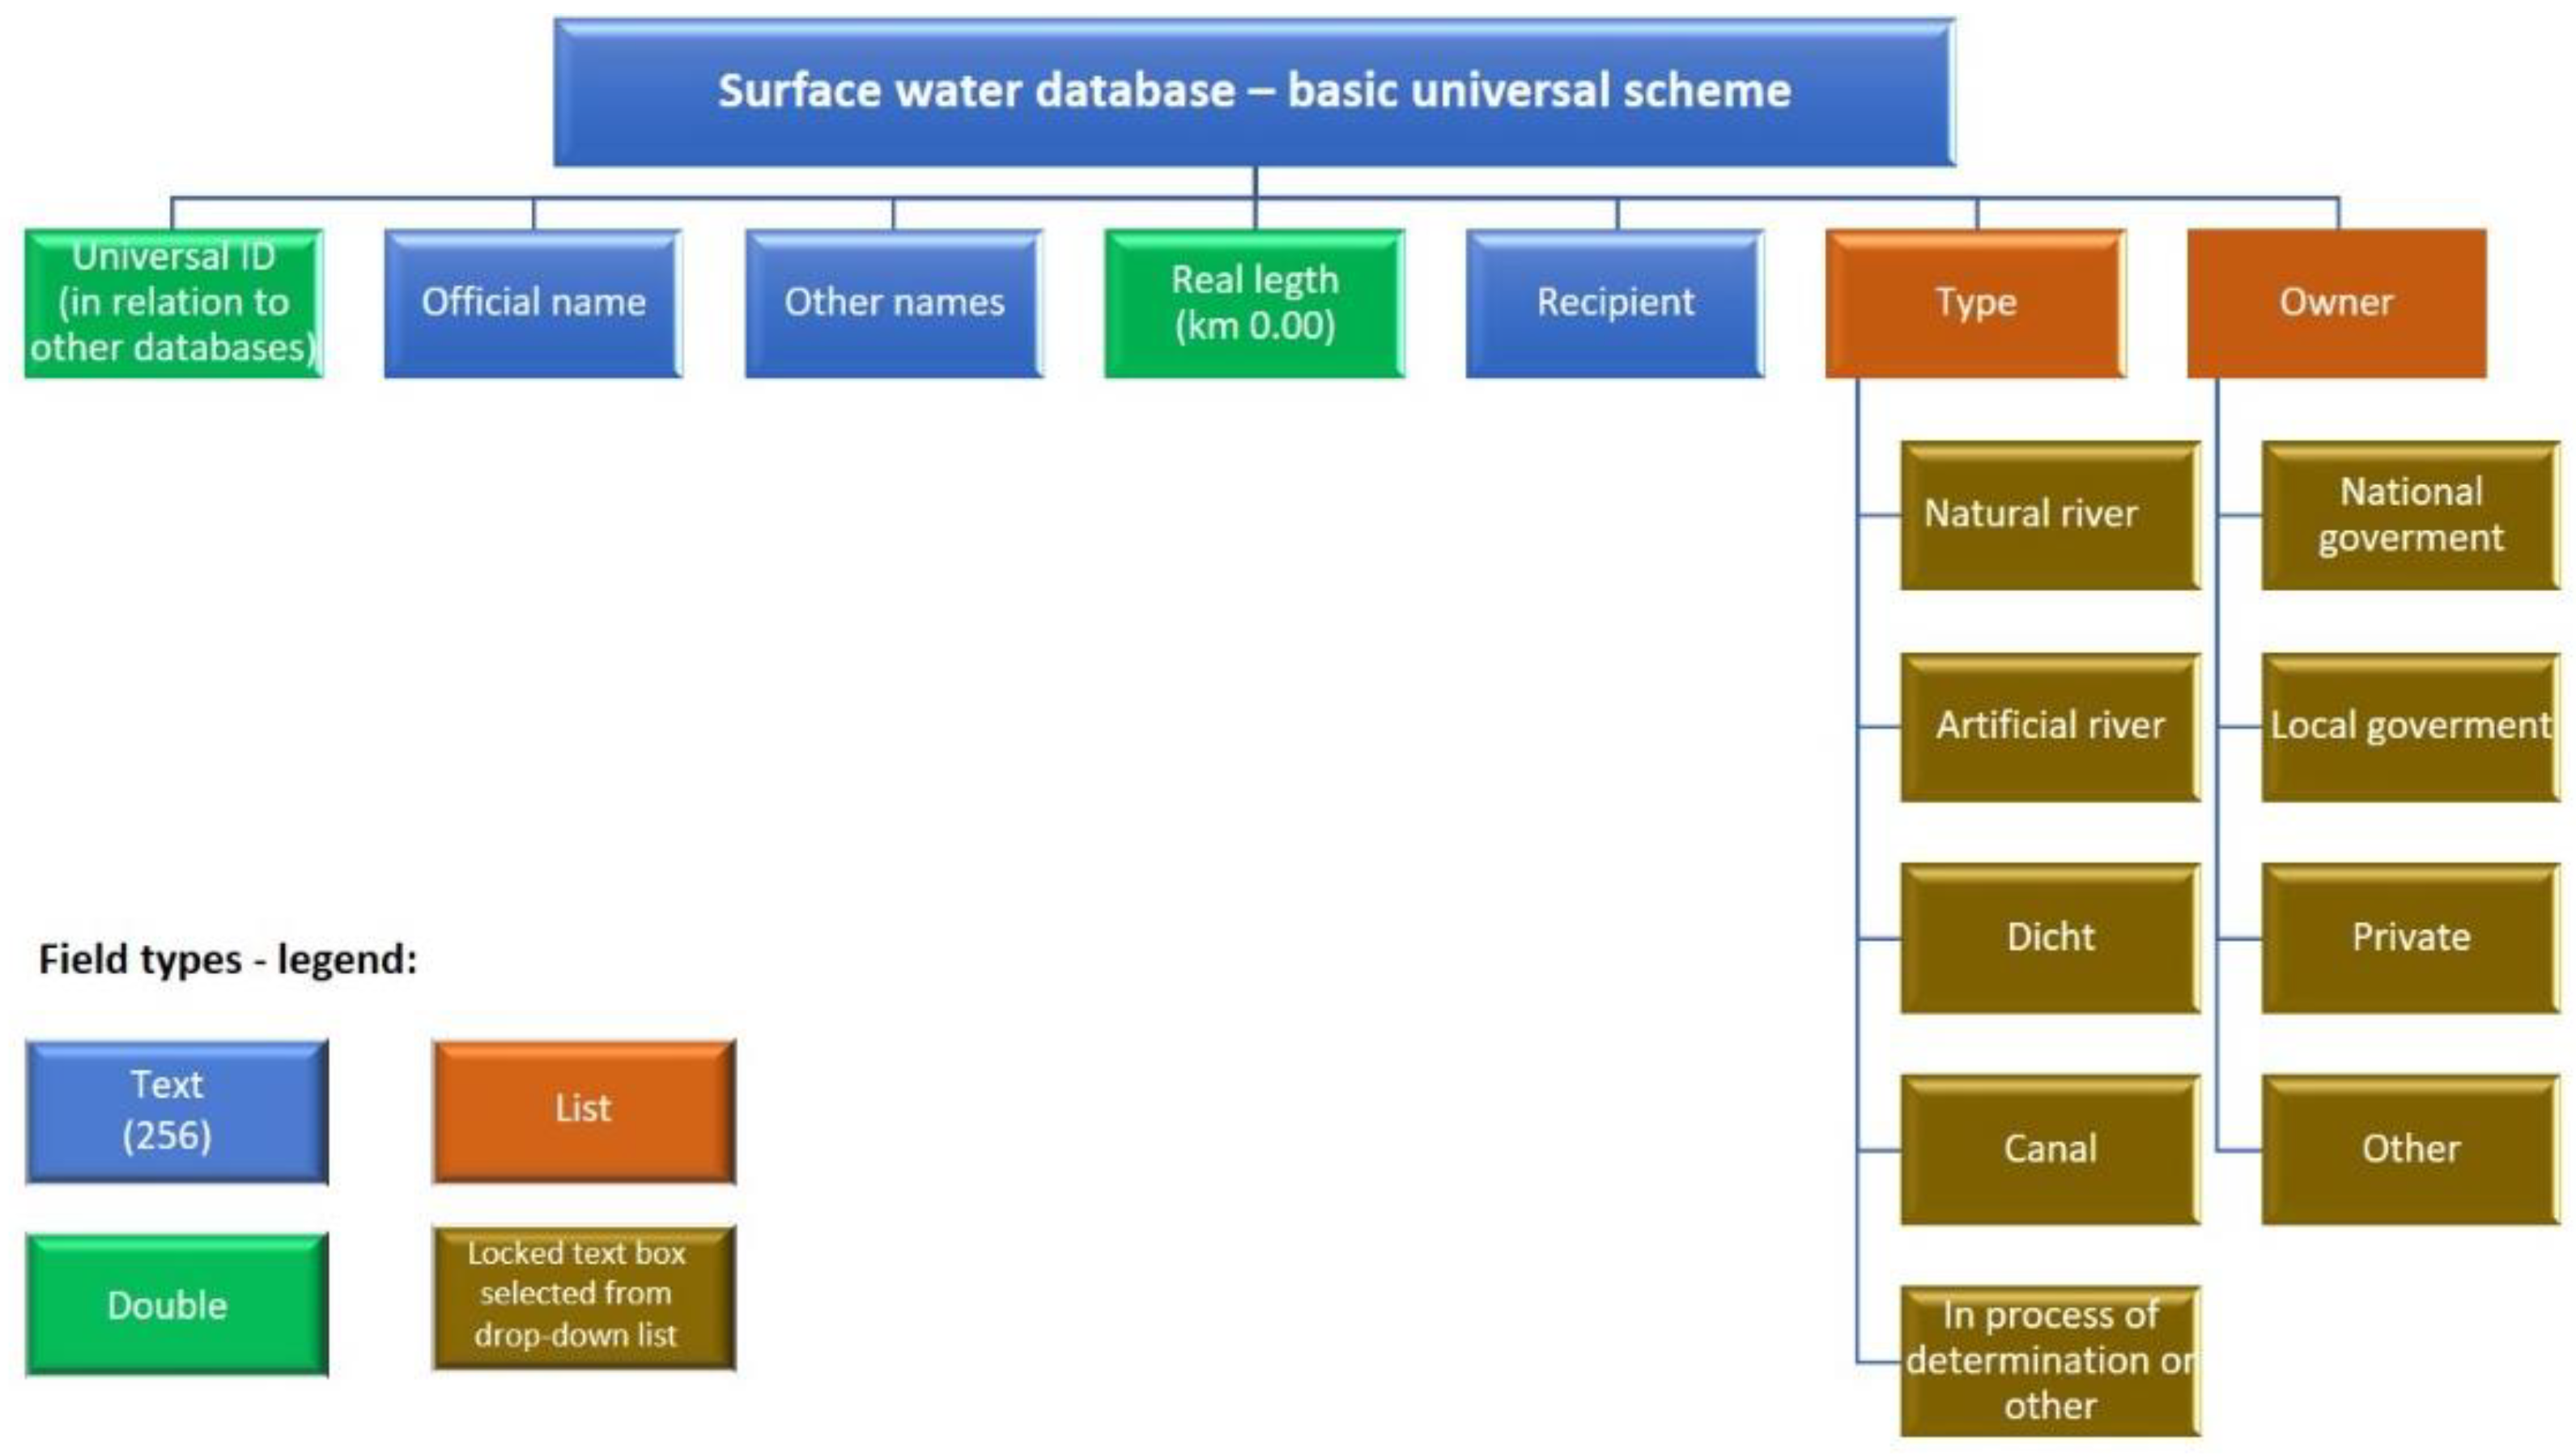
Figure 4.
I - workflow of processing NDWI imagery to produce hydrographic network information automatically. I.A - the effect of using the raster to polygon tool - the extent of the river in the form of a vector polygon. I.B - the effect of using the Polygon to centerline tool - producing a line depicting the course of a watercourse based on the generated polygon representing the river reach. II - changing the symbolization of the DEM so that only areas representing the elevation of 348 m above sea level are visible. III - symbolization of the DEM so that only areas representing the elevation of 348.5 m above sea level are visible.
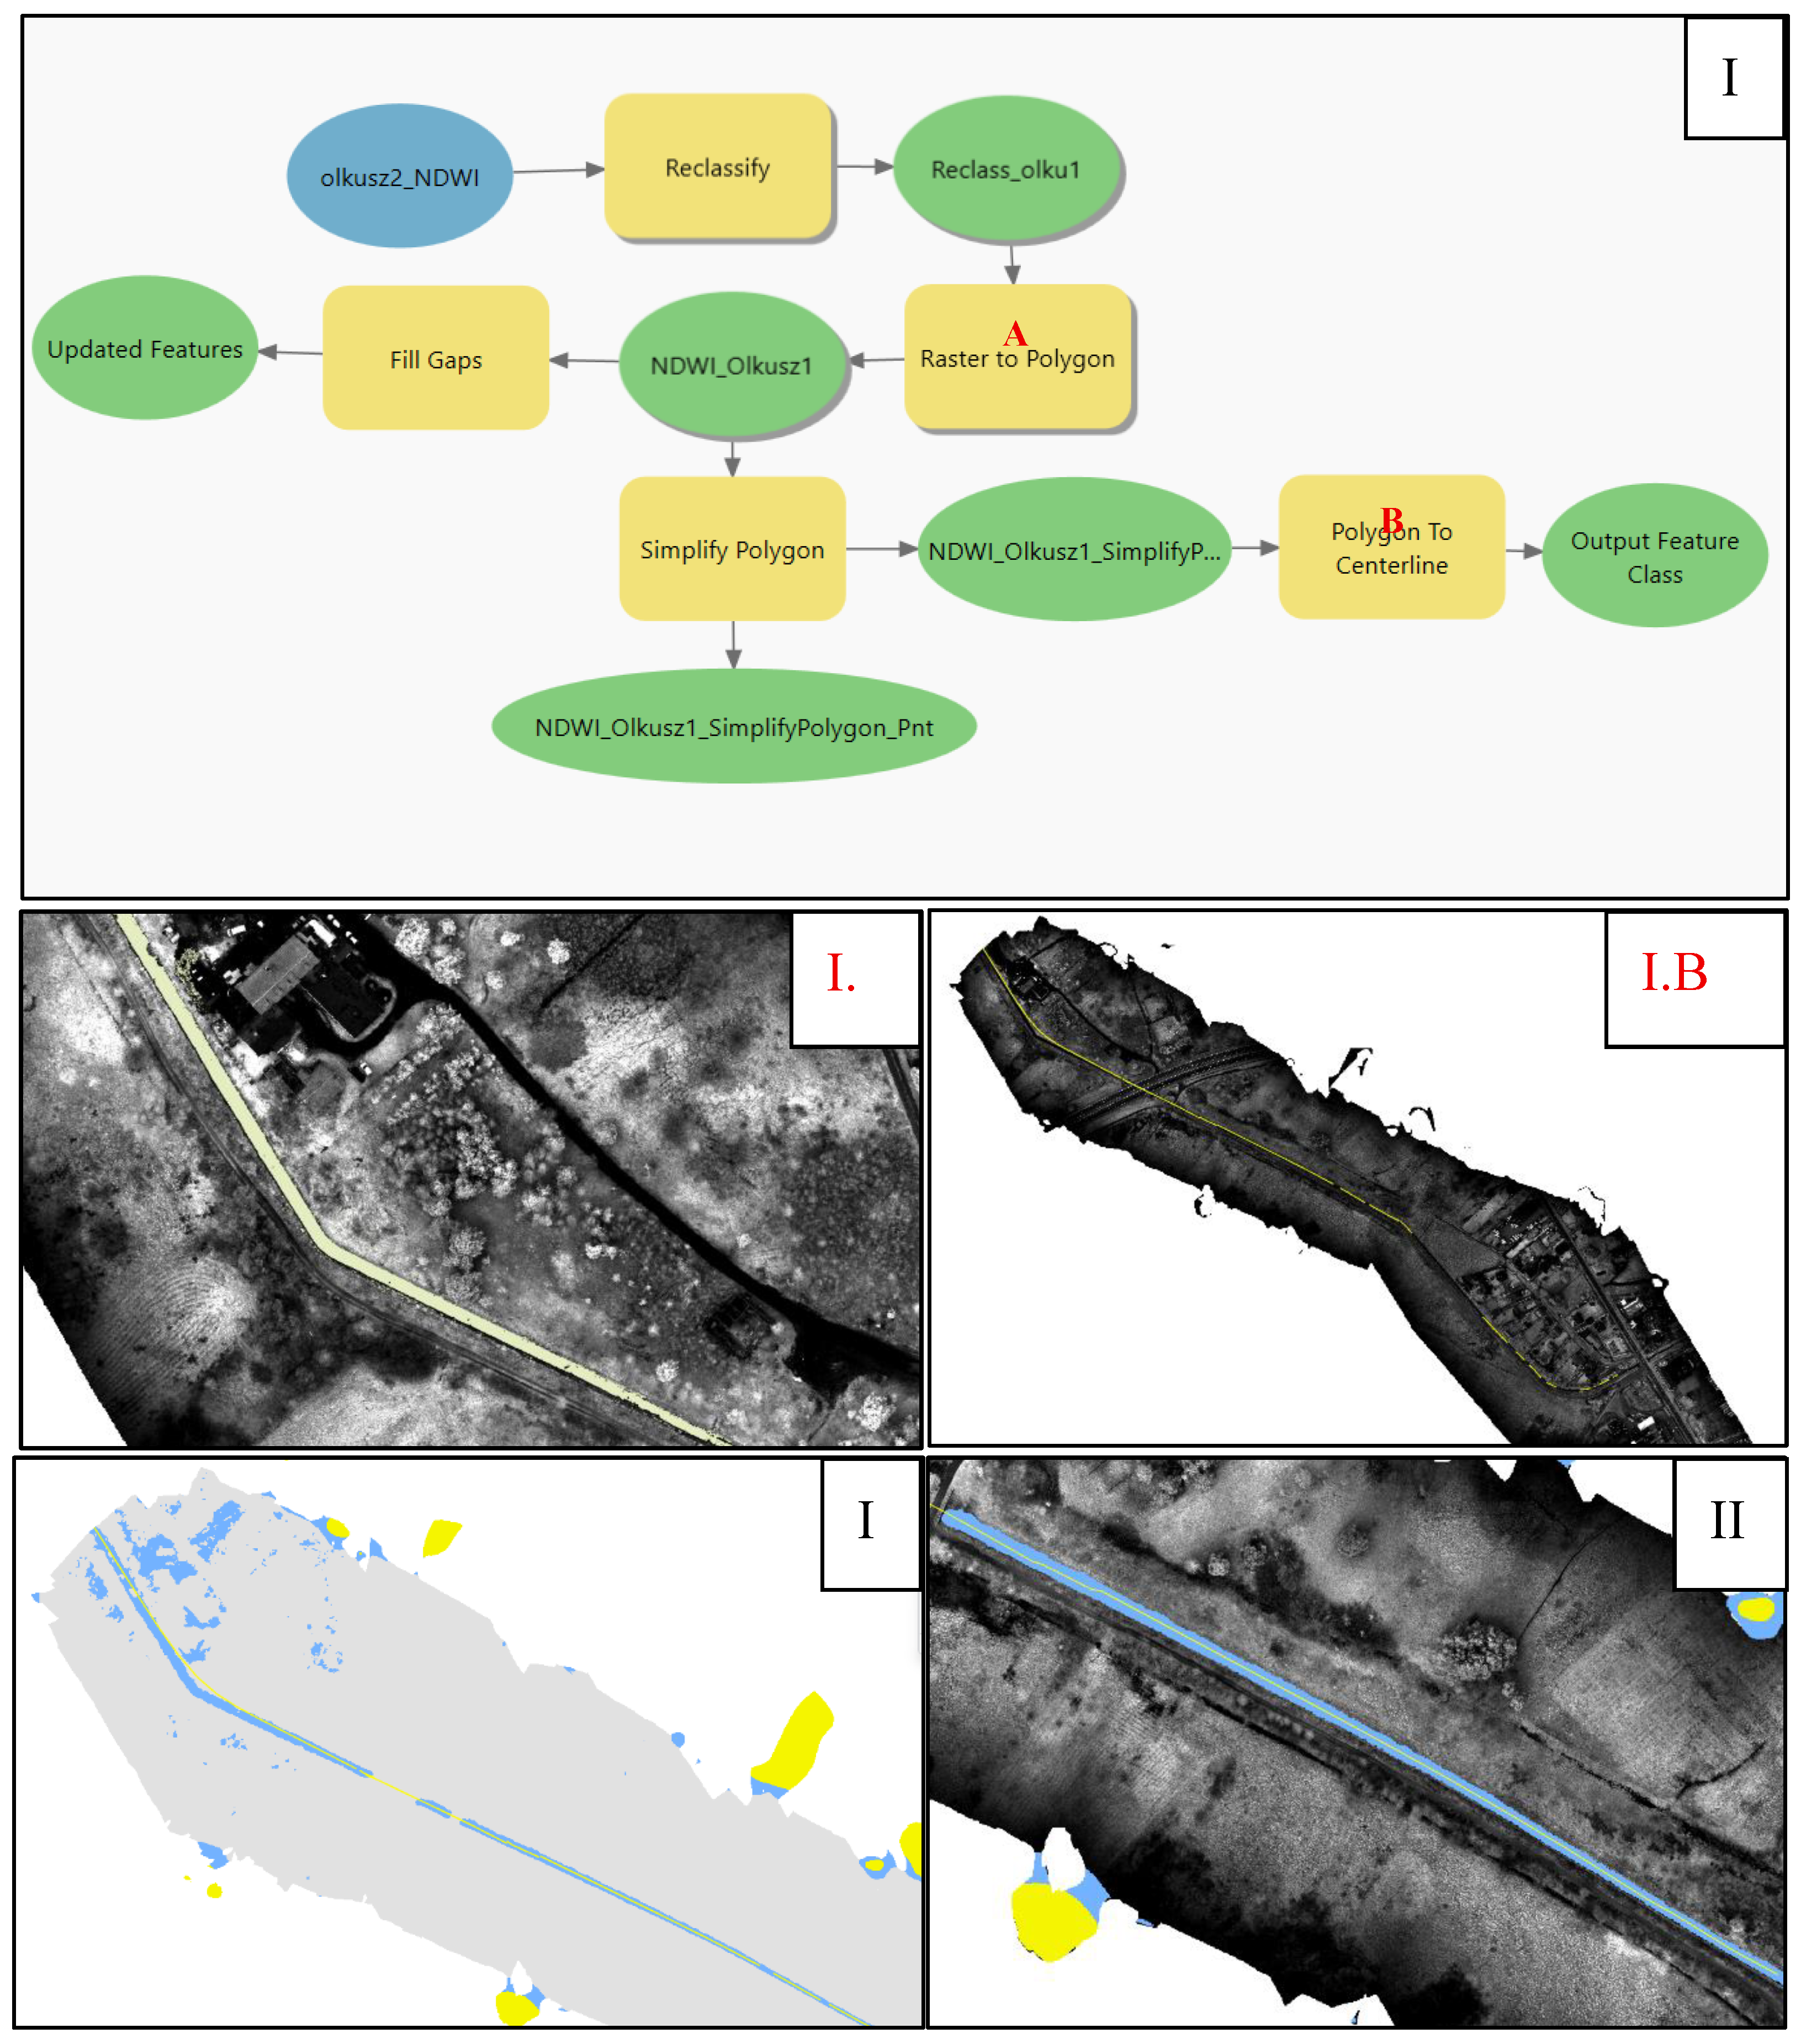
Figure 5.
The result of Pearson's correlation between the distances of the lines drawn based on medium- and low-altitude aerial photos from points in the Imielinka watercourse bed.
Figure 5.
The result of Pearson's correlation between the distances of the lines drawn based on medium- and low-altitude aerial photos from points in the Imielinka watercourse bed.


Table 1.
The distances from the measured points, obtained using the GPS receiver, to the line determined from aerial imagery and UAV images.
Table 1.
The distances from the measured points, obtained using the GPS receiver, to the line determined from aerial imagery and UAV images.
| Lp. | X | Y | Distance of the GPS point from the line determined from the aerial imagery | Distance of the GPS point from the line determined from the UAV imagery |
|---|---|---|---|---|
| 1 | 5553662.3240 | 6587091.9930 | 0.20123473581 | 0.61120941410 |
| 2 | 5553662.3270 | 6587091.9710 | 0.22340259726 | 0.58918978673 |
| 3 | 5553686.1510 | 6587094.2920 | 1.35950727815 | 2.07412499404 |
| 4 | 5553713.1050 | 6587067.2010 | 2.92393379020 | 3.24197553216 |
| 5 | 5553721.9260 | 6587044.2420 | 2.84521831154 | 3.97735801300 |
| 6 | 5553653.0730 | 6587091.7100 | 0.24468030310 | 0.39026633416 |
| 7 | 5554854.3470 | 6587100.8930 | 0.35596994974 | 0.19725880052 |
| 8 | 5554755.5080 | 6587085.6840 | 0.37687069952 | 0.43301925788 |
| 9 | 5554912.2290 | 6587108.4610 | 0.08891688128 | 0.04516403421 |
| 10 | 5554955.8490 | 6587106.4790 | 1.48677535474 | 2.47426261953 |
| 11 | 5555727.5200 | 6585817.5230 | 2.77874144754 | 1.71913735639 |
| 12 | 5555711.9850 | 6585831.1430 | 6.36562417398 | 4.84815567378 |
| 13 | 5555711.2750 | 6585890.7730 | 0.69380229373 | 1.47682472104 |
| 14 | 5555697.5570 | 6585935.5130 | 4.94803593652 | 3.18517533876 |
| 15 | 5555678.6000 | 6585977.7690 | 0.39531537535 | 0.30010402643 |
| 16 | 5555680.9010 | 6585986.4630 | 0.18469115902 | 1.16614456089 |
| 17 | 5555687.3960 | 6585998.6640 | 3.91787638830 | 3.38646075770 |
| 18 | 5555755.0850 | 6585797.8010 | 4.77991842586 | 3.80750225173 |
| 19 | 5553631.0354 | 6587091.0778 | 0.16705608049 | 0.47832405239 |
| 20 | 5553597.6801 | 6587094.1407 | 0.82979868294 | 0.83749625632 |
| 21 | 5553565.6094 | 6587099.7812 | 0.84969382634 | 0.60206937165 |
| 22 | 5553549.1327 | 6587120.8339 | 1.08993086869 | 0.11473010311 |
| 23 | 5553533.5209 | 6587164.4437 | 1.21307440569 | 1.69010130833 |
| 24 | 5553515.0806 | 6587228.2676 | 2.00632118934 | 1.48428215329 |
| 25 | 5553490.7273 | 6587313.5387 | 1.69091614127 | 1.05099721187 |
| 26 | 5553460.9580 | 6587419.8051 | 1.18033018455 | 0.27592336952 |
| 27 | 5553477.3579 | 6587362.1554 | 1.08074277965 | 0.41587973953 |
| 28 | 5553444.4476 | 6587458.6399 | 1.08050917238 | 0.58891686599 |
| 29 | 5553409.7457 | 6587495.5614 | 1.27261485667 | 0.12798261565 |
| 30 | 5553373.3508 | 6587530.0708 | 1.01081128972 | 0.05102895381 |
| 31 | 5553342.2554 | 6587560.4140 | 0.41149089872 | 1.12897692129 |
| 32 | 5553316.0771 | 6587581.5558 | 3.14377384887 | 1.82133974934 |
| 33 | 5553300.4576 | 6587616.8566 | 2.65135737292 | 1.76841489041 |
| 34 | 5553295.8684 | 6587670.9995 | 1.53467329132 | 2.01262285992 |
| 35 | 5553297.0140 | 6587733.1934 | 0.64178147057 | 0.21846785248 |
| 36 | 5553296.2717 | 6587794.4748 | 0.75140323050 | 0.72777181835 |
| 37 | 5553296.8354 | 6587813.2238 | 0.30973076970 | 0.35170007331 |
| 38 | 5553176.3561 | 6588051.7690 | 0.18380912995 | 0.55485449285 |
| 39 | 5553170.9389 | 6588058.2142 | 1.22971799893 | 1.90816198374 |
| 40 | 5554994.3451 | 6587106.4858 | 0.61276807592 | 0.54403990244 |
| 41 | 5555028.7390 | 6587105.3119 | 0.58972287695 | 0.68233765549 |
| 42 | 5555045.3585 | 6587103.6421 | 0.65729132994 | 0.64137737006 |
| 43 | 5555053.2452 | 6587098.2304 | 1.56409946928 | 0.06006766963 |
| 44 | 5555067.4833 | 6587062.8263 | 0.42401330593 | 0.06154681054 |
| 45 | 5555075.8673 | 6587040.5248 | 0.58260147118 | 0.06338715582 |
| 46 | 5555089.5262 | 6586997.8929 | 1.35501815801 | 2.09386247506 |
| 47 | 5555115.4572 | 6586952.9630 | 2.99398821416 | 2.27722926894 |
| 48 | 5555121.9778 | 6586938.5733 | 0.72520992772 | 0.67550889887 |
| 49 | 5555680.6777 | 6586026.3729 | 1.76458335455 | 2.03021234630 |
| 50 | 5555673.2435 | 6586060.9894 | 1.82312584075 | 2.16272172264 |
| 51 | 5555668.7313 | 6586084.4511 | 0.34458405986 | 2.13136738382 |
| 52 | 5555669.6648 | 6586107.1519 | 0.07921604258 | 0.23351891460 |
| 53 | 5555671.3579 | 6586129.5683 | 0.33592788335 | 0.35176127483 |
| 54 | 5555673.0572 | 6586152.4489 | 1.18634532812 | 1.26309929097 |
Table 2.
Basic statistical quantities about the distances from the measured points, obtained using the GPS receiver, to the line determined from aerial imagery and UAV images.
Table 2.
Basic statistical quantities about the distances from the measured points, obtained using the GPS receiver, to the line determined from aerial imagery and UAV images.
| Distance of the GPS point from the line determined from the aerial imagery | Distance of the GPS point from the line determined from the UAV imagery | |
|---|---|---|
| MAX | 6.36562417398 | 4.84815567378 |
| MIN | 0.07921604258 | 0.04516403421 |
| AVERAGE | 1.40603674223 | 1.27317336645 |
| MEDIAN | 1.08062597602 | 0.78263403733 |
Disclaimer/Publisher’s Note: The statements, opinions and data contained in all publications are solely those of the individual author(s) and contributor(s) and not of MDPI and/or the editor(s). MDPI and/or the editor(s) disclaim responsibility for any injury to people or property resulting from any ideas, methods, instructions or products referred to in the content. |
© 2025 by the authors. Licensee MDPI, Basel, Switzerland. This article is an open access article distributed under the terms and conditions of the Creative Commons Attribution (CC BY) license (http://creativecommons.org/licenses/by/4.0/).
Copyright: This open access article is published under a Creative Commons CC BY 4.0 license, which permit the free download, distribution, and reuse, provided that the author and preprint are cited in any reuse.


