
Submitted:
06 August 2025
Posted:
07 August 2025
You are already at the latest version
Abstract
Cement manufacturing is the second largest anthropogenic source of Hg emissions into the environment, therefore, establishment of analytical methodologies that can be utilized to determine Hg concentration from cement raw materials and cement is of great importance. Therefore, total Hg and Hg thermospecies in cement raw materials and cements were determined by thermal desorption techniques with Zeeman Hg analyzer. No chemical pre-treatment of samples is required from this technique prior analysis. Optimum single stage temperature program was applied to determine total Hg at optimum heating rate approximately 5C s−1 while Hg thermospecies were determined over four stages at optimum heating rate of approximately 0.2C s−1 per stage from ambient to 720C. Total mercury concentrations in cement raw materials ranged between 2.19 ng g−1 and 395 ng g−1. And in cement lied between 1.32 ng g−1 and 31.0 ng g−1. The highest Hg contents were found in dust return (580 ng g−1 and 679 ng g−1). Hg thermospecies determination showed that cements raw materials and cements contain one Hg thermospecies that are released at 20C−180C while dust return contained one to four Hg thermospecies that could be released at 20C−180C, 180C−360C, 360C−540C and/or 540C−720C, thus indicating that new Hg compounds are formed during cement production.
Keywords:
mercury
; thermospecies
; cement
; raw materials
1. Introduction
Mercury (Hg) is a hazardous element of major public health concern due to its high toxicity, high volatility and long residence time in the environment [1−3]. It occurs naturally on the earth crust and is emitted to the atmosphere through various anthropogenic sources associated with the combustion of fossil fuels such as coal combustion at electrical power stations, metal smelters, waste incineration and from cement production plants [4−6].
Cement production is the second largest source of anthropogenic Hg emissions into the environment worldwide, with Europe accounting for 11% of global anthropogenic Hg emissions [7]. Hg enters the cement manufacturing process as trace element through raw materials (limestone, slag, and coal) that are utilized during cement production. Hg concentration in natural raw materials varies from deposit to deposit, depending on the origin and source [8−11]. A typical cement manufacturing process involves three fundamental stages, viz., preparation of feedstocks, production of clinker, and production of cement.
Feedstock preparation includes quarrying, crushing and milling of raw materials. After milling and homogenization in a silo, the raw materials are transferred into the preheaters (kiln feed) before entering the kiln operating at maximum temperatures of 1450°C, where it is burned to form cement clinker. Clinker is produced inside the kiln and its nodules are then milled and mixed with other materials to produce cement. Hg desorption and emissions occur in the cement kiln due to its heating temperature of approximately 1450°C [12−16]. Due to Hg being very toxic and harmful to human life upon inhalation and ingestion, studies involving the quantification of Hg in cement making industries are essential as limited information on the actual concentration from cement raw materials is available [17].
There are four official standard methods of solid sample analysis, viz., bomb combustion [18], acid extraction [19,20], wet oxidation [19] and thermal decomposition [21,22]. The main limitation of the first three methods is that sample preparation is long, taking up to 8 hours, depending on solid type, e.g., coal requires longer digestion time to transfer Hg into solution. The US EPA method 7473 [22] is based on thermal decomposition with amalgamation of Hg vapours on golden wire and quantitative determination of Hg by AAS but the reliability of the method is affected by the presence of SO2 and Cl− ions (common constituents of most coals), thus, affecting the precision and accuracy of the results of analysis. Therefore, the applications of these recommended methods often result in contradicting results. That is why additional studies of the determination of Hg in solid matrices is necessary to eliminate the shortcomings of the recommended methods described above.
Pyrolysis technology coupled with atomic absorption spectrometry or atomic fluorescence spectrometry was used by researchers in the determination of Hg content in solid samples. Mercury removal from powdered samples by mild pyrolysis before combustion was originally proposed by Merriam et al., (1990) [23], and further studies were conducted by other researchers who assessed the effects of temperature, residence time and volatile matter content on Hg removal [24−29]. Further development in the analytical methodology is necessary for the identification and quantification of mercury species as a function of volatility temperature in cement and cement raw materials to enhance selection of cement raw materials and coal (fuel) needed for combustion during cement production. The main objective of this study is to determine total mercury concentration and mercury thermospecies in cement raw materials and cement after thermal decomposition with Hg analyzer.
2. Materials and Methods
2.1. Instrumentation
A Model RA-915+ Zeeman Mercury analyzer (Lumex, St.Petersburg, Russia) with a PYRO-915 attachment was used for Hg measurements. The PYRO-915 attachment enables the determination of Hg in samples having complex-matrices such as soils, sediments, oil products and foodstuffs by utilising the pyrolysis technique incorporated within the instrument [30−32].
The operation of the Hg analyser is based on the release of Hg from solid samples during their thermal decomposition. The concentration of Hg is measured by atomic absorption spectrometer at 253.7 nm Hg0 resonance line and any background absorption is corrected using a Zeeman Effect correction system [30].
2.2. Calibration Standards
The direct mercury analyzer was calibrated using the fish protein certified reference material for trace metals DORM 3 (Industrial Analytical, South Africa), with certified Hg concentration of 0.382 ± 0.06 mg kg−1 covering the lower concentration range and dogfish liver certified reference material for trace metals DOLT-4 (Industrial Analytical, South Africa) with certified Hg value 2.58 ± 0.22 mg kg−1 covering the higher concentration range. Zeeman Hg analyzer was calibrated using SARM 20 certified reference material of coal (Sasolburg) with certified Hg value of 250 ± 30 ng g−1.
2.3. Reagents and Solutions
South African standard reference materials of coal, SARM 20 (Council for Mineral Technology, MINTEK, South Africa) with certified Hg concentration of 250 ± 30 ng g−1 was used for quality control and validation of results. Dogfish liver certified reference material for trace metals, DOLT-4 (Industrial Analytical, South Africa) with certified Hg value 2.58 ± 0.22 mg kg−1 together with fish protein certified reference material for trace metals, DORM 3 (Industrial Analytical, South Africa), with certified Hg concentration of 0.382 ± 0.06 mg kg−1 were used for the calibration of DMA-80 covering high and low concentrations, respectively. NCSZC 78001 (Coal fly ash, China, 39 ± 0.9 ng g−1) was also used to check the validity of the analytical method.
2.4. Sampling of Raw Materials and Cement
Cement raw materials (Limestone, fly ash, slag, and gypsum) were sampled from different Pretoria Portland Cement (PPC) plants, viz., PPC Jupiter, PPC Hercules and PPC De Hoek on different stockpiles over a period of three months (January 2019 to March 2019). Final product cement was sampled from storage silos available at each plant. Proper personal protective equipment like dust musk, work suit, safety shoes, goggles and helmet or hard hat were always worn during sampling to prevent injury.
Two types of cement sampled were CEM I 52.5N and CEM II 42.5N. The difference between these two cements is that CEM II 42.5N is extended with fly ash and slag or slag, depending on the plant preference, while in CEM I 52.5N, extenders are not added. Extenders are added to reduce clinker used during cement production as cost saving intervention. Gypsum is added to both cements on the finish mill as minor additional constituent (MAC) and acts as a set regulator. CEM II 42.5N produced at PPC De Hoek is extended with slag only, while CEM II 42.5N produced at PPC Hercules is manufactured in the same way as in PPC Jupiter with slag and fly ash as extenders, and synthetic ALI gypsum is used instead of natural gypsum while PPC Jupiter uses OMV synthetic gypsum (phosphate waste product) that is supplied by Oranje Mynbou en Vervoer (OMV) ready mix concrete plant.
2.5. Sample Preparation
Samples were first dried at 105°C to remove moisture that might be present. Jaw crusher (Model: Retsch GmbH, Type: BB200 Mangan) was used to crush limestone and raw coal to particle size of approximately 4.75 mm. Limestone, gypsum and raw coal are further pulverised using LM2 Lab pulverising mill to smaller particle size of approximately 2.00 mm, then all samples were ground to pass 212 µm using a Siebtechnik TEMA mill.
2.6. Analysis of Samples
A sample weighing approximately 20 to 300 mg was transferred into a sample boat and recorded using RAPID software of the instrument. Integration of the analytical cell was switched on and sample boat with sample was inserted into PYRO 915+ attachment which consists of two chambers. The first chamber is for evaporation of liquid and pyrolysis of solid samples. Hg vapour produced in the atomizer was passed through the analytical cell that is heated to 800°C, where Hg levels were processed, and a signal was produced and integrated to give the final Hg content in ng g−1. Background absorption signal was eliminated using a high frequency Zeeman correction system [33]. Every sample was analysed in triplicate and the results were reported as mean ± standard deviation of mercury concentration.
The concentration of Hg in the sample was determined from a calibration curve plotted as integrated analytical signal (arbitrary units) versus absolute mass of Hg (ng) [34]. Integration was considered complete when the analytical signal goes back to baseline. The absorption of 254 nm resonance radiation by mercury atoms was measured using Zeeman correction for background absorption. The certified reference material SARM 20 was used to check the accuracy of the instrument and blank samples were run after every ten samples and after samples with high values of Hg.
2.7. Determination of Hg Thermospecies by Zeeman Hg Analyzer
Samples ranging from 20 to 300 mg were weighed into a sample boat and inserted into the furnace of the Zeeman Hg analyzer. Each sample was gradually heated from ambient temperature to 720°C at an optimized heating rate over five temperature stages to obtain thermoscanning peaks that shows the detection of Hg thermospecies in cement raw material samples and dust return based on Hg species volatility temperatures.
3. Results
3.1. Optimization of the Heating Rate in the Evaporation Chamber
The heating rate of the evaporation chamber was optimized to obtain well separated analytical integrated absorbance peaks of Hg. The total Hg determination is achieved by heating the raw material and cement samples from ambient temperature to 720°C at a slower heating rate (Table 1).
The optimum heating rate ranged between 3.60 and 7.20 °C s−1 and takes approximately 150 seconds. To quantify Hg thermospecies, samples were heated from ambient temperature to 720°C over four different stages, viz., 20−180°C; 180−360°C; 360−540°C and 540−720°C, at the optimum heating rate of 0.144°C s−1 stage−1 and this took approximately 1000 seconds (Table 1). Stage 6 involves the cooling of the evaporation chamber to ambient temperature in preparation for analysis of the next sample.
3.2. Calibration of Zeeman Hg Analyzer
The calibration curve of Hg determination was generated as the absolute mass of Hg (ng) versus atomic absorption peak area (peak area, arbitrary units). The absolute mass of Hg (mHg) was determined from the relationship between the certified value of Hg concentration (CHg) and the mass of the CRMs (mCRM) subsamples taken for analysis:
A plot of Hg standards signals against absorbance was drawn to check whether the instrument is well optimized [Figure 1). The calibration curve with correlation coefficient of approximately 1 was obtained, thus confirming a well optimized instrument. Therefore, it can be concluded that sample matrices did not have any effect on the release of Hg and can be used for the creation of a single universal calibration curve for the determination of mercury. Such data is stored in the PC memory and used for automatic calculation of Hg concentration during analysis.
3.3. Validation of Analytical Results
Certified reference materials (CRMs) were analysed regularly to ensure validity and reliability of the results. The accuracy of the applied method is confirmed when there is good agreement between the found and certified values. To check the validity of the applied analytical method, CRMs were analysed. The choice of CRMs was based on including CRM with lower Hg content (NCSZC 78001) and CRM with higher Hg content (SARM 20) so that a wide range of Hg values were represented. The CRMs containing Hg content in the range to those found in cement and cement raw products were analysed, viz., NCSZC 78001 (Coal fly ash, China, 39 ± 0.9 ng g−1) and SARM 20 (MINTEK, South Africa, 250 ± 30 ng g−1), to check the validity of the method. The results of the analysis of reference materials indicated that the applied analytical method is reliable as there was good agreement between certified and found values at 95% level of confidence using two-tailed t test (Table 2).
3.4. Results of the Determination of Total Hg in Cement Raw Materials
The results for determination of total Hg (ng g−1) in cement raw materials and coals that are utilized for combustion are summarized in Table 3. The analyzed mined limestone utilized at PPC for cement production contained the lowest concentration of Hg (2.40 ± 0.28 ng g−1 − 3.02 ± 0.32 ng g−1 , with mean concentration of 2.54 ± 0.43 ng g−1), followed by natural gypsum (2.30 ± 0.33 ng g −1−5.75 ± 0.47 ng g−1 , with mean concentration of 3.63 ± 1.86 ng g−1 ) and coal (28.7 ± 2.63 ng g−1−142 ± 19 ng g−1 , with mean concentration of 86 ± 57 ng g−1 ). In contrast, the concentration of Hg in fly ash (89 ± 25 − 160 ± 2.55 ng g−1, with mean concentration of 124 ± 50 ng g−1), ALI synthetic gypsum (262 ± 7.38 ng g−1) and OMV synthetic gypsum (395 ± 4.83 ng g−1) were higher as compared with naturally mined raw materials (limestone, gypsum, and coal).
3.5. Results of Total Hg Determination in Different Grades of Cements
The results for determination of total Hg (ng g−1) in cements are shown in Table 4. CEM I 52.5N is the cement that has high early strength while CEM II 42.5N is the cement that has low early strength. The results of Hg determination in cements showed that CEM I 52.5N contains less Hg concentration than CEM II 42.5N. The level of Hg is higher in CEM II 42.5N due to the utilization of both synthetic gypsum and fly ash during cement milling as these materials are not added during CEM I 52.5N production.
Fly ash and slag are added in PPC Jupiter as extenders and OMV gypsum is added as minor additional constituent (MAC), hence a high Hg concentration of 31 ± 4.14 ng g−1 is observed in CEM II 42.5N than cements produced in PPC De Hoek and PPC Hercules. Fly ash and slag are added in PPC Hercules as extenders and ALI gypsum is added as MAC, hence, a lower concentration of Hg (8.13 ± 2.50 ng g−1) is observed than in PPC Jupiter. Lower Hg concentration is also observed in PPC De Hoek CEM II 42.5N cements because slag is added as extender and natural gypsum is added as MAC.
3.6. Results of Total Hg Determination in By-product of Cement Production
The results for the determination of total Hg (ng g−1) in dust return are shown in Figure 2. Dust return is a by-product of combustion that is released from the raw meal material at the pre-heaters that operates at temperature of up to 1000⁰C and is captured at the dust collectors. Therefore, the components of the dust collectors also include the air blown from the clinker cooler through the pre-heaters.
3.7. Results of the Determination of Hg Thermospecies
Mercury thermospecies were determined on the raw materials utilized during cement production. Hg thermospecies are chemical forms of Hg that are released from materials at variable volatility temperatures. Summary of these results are shown in Table 5.1 and Table 5.2.
Results of the assessment of the presence of Hg thermospecies in materials utilized during cement production showed that synthetic gypsums, viz., OMV gypsum (200 ± 252 ng g−1) and ALI gypsum (228 ± 30 ng g−1), fly ash (108 ± 48 ng g−1) and coal (106 ± 22 ng g−1) contain one Hg thermospecies at 20−180°C range as mercury was not detected above this temperature range (Table 5.1). This means that all Hg compounds in these materials are emitted and captured in dust return during cement production as the cement mill kilns operate at maximum of 1450°C.
Results of analysis show that dust return may contain one to four Hg species as indicated by number of Hg compounds detected over the full temperature range, viz., 20–180°C, 180–360°C, 360–540°C and 540–720°C (Table 5.2). Sample DH15 collected from PPC De Hoek plant contained four Hg thermospecies, viz., 71.4 ± 0.8 ng g−1 (20–180°C), 12.9 ± 0.10 ng g−1 (180–360°C), 20.9 ± 0.5 ng g−1 (360–540°C) and 0.5 ± 0.02 ng g−1 (540–720°C). These concentrations are associated with different chemical forms of Hg in the sample of dust return. It can therefore be concluded from this results that only dust return samples contain more than one Hg thermospecies, thus indicating that new Hg compounds of higher volatility temperatures are formed during cement production.

Table 5.
1. Results of the determination of total Hg and Hg thermospecies in materials utilized during cement production.
Table 5.
1. Results of the determination of total Hg and Hg thermospecies in materials utilized during cement production.
| Material | Total Hg, ng g−1 | Hg thermospecies concentration, ng g−1 | |||
| 20°C−180°C | 180°C−360°C | 360°C − 540°C | 540°C − 720°C | ||
| OMV Gypsum | 208 ± 257 | 200 ± 252 | - | - | - |
| ALI Gypsum | 262 ± 5.37 | 228 ± 30 | - | - | - |
| Fly Ash | 126 ± 48 | 108 ± 48 | - | - | - |
| Coal | 121 ± 26 | 106 ± 22 | - | - | - |
Table 5.
2. Results of the determination of total Hg and Hg thermospecies in dust return.
|
Cement Plant |
Sample ID |
Total Hg, ng g−1 |
Hg thermospecies, ng g−1 | |||
| 20°C−180°C | 180°C−360°C | 360°C−540°C | 540°C−720°C | |||
|
PPC De Hoek |
DH14 | 235 ± 6.7 | 194 ± 4.0 | − | − | − |
| DH15 | 179 ± 1.8 | 71.4 ± 0.8 | 12.9 ± 0.10 | 20.9 ± 0.5 | 0.5 ± 0.02 | |
| DH16 | 1663 ± 19.8 | 1223 ± 12 | 390 ± 2.0 | − | − | |
4. Discussion
The results of the determination of Hg in CRMs show that the calibration curve of Hg has a regression equation of y=324x + 402 and correlation coefficient r2 = 0.9918, indicating that the calibration curve obtained was linear as r2 was approximately 1 and is used for quantification of Hg in cement and its raw materials. Based on this correlation coefficient it is certain that this thermal decomposition analytical approach to determine Hg content on solid samples is more favourable than chemical decomposition methods that involves analyte loss or contamination that are introduced through chemical pre-treatment, as it is more rapid and offers high efficiency.
ALI synthetic gypsum, also known as phospogypsum, is a by-product formed during the production of phosphoric acid from natural phosphate rock by the wet process [35−37]. Phospogypsum is mainly composed of gypsum but also contains a high level of impurities such as phosphates, fluorides, and sulphates, naturally occurring radionuclides, heavy metals, and other trace elements and therefore, Hg in ALI gypsum may have originated from natural phosphate rock. Similarly, the presence of high Hg in OMV gypsum could be attributed to it being a phosphate waste-product as phosphate ores are known to contain trace amount of metals including mercury. Hg in fly ash comes from coal as it is a by-product of coal combustion [38−40].
Slag was found to contain low Hg content ranging between 1.58 ± 0.19 ng g−1 and 3.23 ± 0.36 ng g−1 with the lowest average of Hg concentration detected at PPC Hercules. The possible reason for low concentration in slag is because slag is the waste matter separated from metals during the smelting or refining of ore at blast furnace operating at temperatures of as high as 1650⁰C which volatilize all Hg compounds, thus mercury is emitted and therefore does not form part of the final product [41,42]. Results of analysis of slag samples of different origin by Moreda-Piñeiro et al., (2001) also showed lower concentration of Hg in slag (0.09 ± 0.003 − 0.13 ± 0.001 ng g−1), which is much lower than that established in this study [43].
Dust return shows a higher mercury content as compared with all other materials that are utilized during cement production (Figure 2). High concentration of Hg in dust return is the results of the capture of emitted Hg from pre-heaters and kilns operated at up to 1000°C and 1450°C, respectively, by dust collectors. This product is of great concern if it must be disposed into the environment and because of that, it is reintroduced during cement manufacturing process to minimize the amount of Hg that is released into the environment. Results of this study and others indicate that Hg compounds are released at 720°C or lower temperatures, thus, it can be concluded with higher degree of certainty at 95% confidence level that all Hg compounds are released and captured by dust collectors during cement production [34].
The identity of the Hg compounds raw materials and cement is related to the temperature of decomposition as they were identified by studying volatility of pure Hg compounds in others studies, viz., Hg2O (100°C), HgCl2 (304°C), Hg2Cl2 (383°C), HgSO4 (450−500°C), Hg2SO4 (335−500°C), HgO (500°C), HgS (544°C), HgF2 (645°C) and Hg2F2 (570°C) [44−46]. It can therefore be concluded that mercury compounds are dominated by mercury compounds bound to oxygen. Mercury compounds that are formed in dust generated during cement production are chlorides, fluorides, sulphates and sulphides.
The average total Hg concentration of fly ash detected at samples collected from PPC cement (149 ± 1.40 ng g−1) is much lower than the average Hg concentration reported by Du et al. (2018) of 550 ± 28.7 ng g−1 from different coal fired power plants in China [47]. Mercury concentrations in limestone reported in literature ranged between 4.70 ± 1.40 ng g−1 and 34.6 ± 19.5 ng g−1 [17, 48−50]. These Hg concentrations are higher than those found in PPC plants (2.49 ± 0.50 ng g−1), thus indicating that limestone inputs utilized during cement production has low Hg content. The Hg concentration of 4.7 ± 1.40 ng g−1, and 141 ± 6.70 ng g−1 found by Cui et al., (2021) in limestone and coal, respectively, are higher when compared to the average Hg concentration of 2.49 ± 0.5 ng g−1 and 121 ± 1.20 ng g−1 found at PPC cement plants [50].
Hg concentration in gypsum was found to be 228 ± 30 ng g−1 from PPC cement, which is lower than that obtained by Kogut et al., (2021) of 265 ± 1.2 ng g−1 [17]. Coal, fuel that is utilized for heating during cement production, was found to be 121 ± 1.20 ng g−1 in PPC plants and this value falls within the range of 31.0 ± 5.60 ng g−1 to 158 ± 9.0 ng g−1 reported in literature [17, 48, 50, 51].
The content of Hg in dust return or dust filter bags found in PPC plants (1663 ± 19.8 ng g−1) compares well to those established in other studies of 1690 ng g−1 ± 3.80−2448 ± 604 ng g−1 [17, 49]. In general, PPC plants raw materials has lower Hg content than what is utilized in other cements plants.
Hg thermospecies obtained from PPC cement coal was detected at single temperature range when compared to those obtained from the literature. Coal from PPC shows single Hg species at low temperatures compared to coal samples obtained by Mathebula et al. (2020) and Mashyanov et al. (2017) [34, 51]. Reports Hg thermospecies content in dust return, cement or raw materials were not found in literatures.
5. Conclusions
Mined raw materials utilized in PPC plants showed low concentration of Hg (1.58 ± 0.19− 5.75 ± 0.47 ng g−1) except for coal (28.7 ± 2.63−142 ± 19 ng g−1) when compared to synthetic gypsum (395 ± 4.83 ng g−1). Hg concentration in CEM II 42.5N cement is higher when compared to CEM I 52.5N since synthetic gypsum and fly ash are added during cement milling. Dust return has the highest concentration of Hg as it contains Hg released from the combustion of materials in pre-heaters and kilns. Results of this study indicate that most Hg compounds are released at a temperature of 720°C or lower. Therefore, it can be concluded that all Hg is released and captured by dust collectors during cement production. It was also found that dust return contains Hg thermospecies with volatility temperatures ranging from 20°C to 720°C, thus indicating that Hg compounds of high volatility temperatures are also formed during cement production.
Acknowledgments
The authors acknowledge Pretoria Portland Cement Co Ltd (PPC) for supplying us with the samples.
References
- ATSDR. Agency for Toxic Substances and Disease Registry. 2017. Substance priority list [online]. Available from: https://www.atsdr.cdc.gov/spl/index.html [Accessed: 02 May 2018].
- Wu, Y.S.; Osman, A.I.; Hosny, M.; Elgarahy, A.M.; Eltaweil, A.S.; Rooney, D.W.; Chen, Z.; Rahim, N.S.; Sekar, M.; Gopinath, S.C.B.; Mat Rani, N.N.I.; Batumalaie, K.; Yap, P.S. The toxicity of mercury and its chemical compounds: molecular mechanisms and environmental and human health implications: a comprehensive review. ACS Omega 2024, 9, 5100–5126. [Google Scholar] [CrossRef]
- Jomova, K.; Alomar, S.; Nepovimova, E.; Kuca, K.; Valko, M. Heavy metals: toxicity and human health effects. Arch. Toxicol. 2025, 99, 153–209. [Google Scholar] [CrossRef]
- Pacyna, E.G.; Pacyna, J.M.; Sundseth, K.; Munthe, J.; Kindbom, K.; Wilson, S.; Steenhuisen, F.; Maxson, P. Global emission of mercury to the atmosphere from anthropogenic sources in 2005 and projections to 2020. Atmos. Environ. 2010, 44, 2487–2499. [Google Scholar] [CrossRef]
- Pirrone, N.; Cinnirella, S.; Feng, X.; Finkelman, R.B.; Friedli, H.R.; Leaner, J. Global mercury emissions to the atmosphere from anthropogenic and natural sources. Atmos. Chem. Phys. 2010, 10, 5951–5964. [Google Scholar] [CrossRef]
- Teng, H.; Altaf, A.R. Elemental mercury (Hg0) emission, hazards, and control: A brief review. J Hazard Mater Adv 2022, 5, 100049. [Google Scholar] [CrossRef]
- Nair, S.V.; Kotmic, J.; Gačnic, J.; Živkovic, I.; Koenig, A.M.; Mlakar, T.L.; Hovart, M. Dispersion of airborne mercury species emitted from the cement plant. Environ. Pollut. 2022, 312, 120057. [Google Scholar] [CrossRef] [PubMed]
- Ozerova, N.A. Mercury in geological systems. In: Baeyens, W.; Ebinghaus, R.; Vasiliev, O. Global and regional mercury cycles: sources, fluxes and mass balances. NATO ASI Ser. 1996, 21, 463–474. [Google Scholar]
- Yudovich, Ya.E.; Ketris, M.P. Mercury in coal: a review Part 1. Geochemistry. Int. J. Coal Geol. 2005, 62, 107–134. [Google Scholar] [CrossRef]
- Yudovich, Ya.E.; Ketris, M.P. Mercury in coal: a review Part 2. Coal use and environmental problems. Int. J. Coal Geol. 2005, 62, 135–165. [Google Scholar] [CrossRef]
- Jia, W.; Chen, C.; Liu, S.; Cao, Y. New insight into the characteristics and mechanism of Hg0 removal by NaClO2 in limestone slurry. Energ Fuel 2021, 35, 11403–11414. [Google Scholar] [CrossRef]
- Mlakar, T.L.; Horvat, M.; Vuk, T.; Stergarsek, A.; Kotnik, J.; Tratnik, J.; Fajon, V. Mercury species, mass flows and processes in a cement plant. Fuel 2010, 89, 1936–1945. [Google Scholar] [CrossRef]
- Sikkema, J.K.; Alleman, J.E.; Ong, S.K.; Wheelock, T.D. Mercury regulation, fate, transport, transformation and abatement within cement manufacturing facilities: review. Sci. Total Environ. 2011, 409, 4167–4178. [Google Scholar] [CrossRef]
- Zheng, Y.; Jensen, A.D.; Windelin, C.; Jensen, F. Dynamic measurement of mercury adsorption and oxidation on activated carbon in simulated cement kiln flue gas. Fuel 2012, 93, 649–657. [Google Scholar] [CrossRef]
- Ghosh, S.K.; Parlikar, U.V.; Karstensen, K.H. Cement manufacturing-technology, practice and development. In Sustainable management of waste through co-processing, Ghosh, S.K.; Parlikar, U.V., Karstensen, K.H., Eds.; Springer: Singapore, 2022. [Google Scholar]
- Pang, D.; Mao, Y.; Jin, Y.; Song, Z. , Wang, X.; LI, J.; Wang, W. Review on the use of sludge in cement kilns: Mechanism, technical, and environmental evaluation. Process Saf Environ. Prot. 2023, 172, 1072–1086. [Google Scholar] [CrossRef]
- Kogut, K.; Górecki, J.G.; Burmistrz, P. Opportunities for reducing mercury emissions in the cement industry. J. Clean. Prod. 2021, 293, 126053. [Google Scholar] [CrossRef]
- ASTM Method D3684; Standard test method for total mercury in coal by the oxygen bomb combustion/atomic absorption method. ASTM, 2006.
- ASTM Method D6414; Standard test methods for total mercury in coal and coal combustion residues by acid extraction or wet oxidation/cold vapour atomic absorption. ASTM, 2006.
- US EPA method 7471; Mercury in solid or semisolid waste (manual cold-vapour technique). US EPA, 2007.
- ASTM method D6722; Standard test method for total mercury in coal and coal combustion residues by direct combustion analysis. ASTM, 2001.
- US EPA method 7473: Mercury in solids and solutions by thermal decomposition, amalgamation and atomic absorption spectrophotometry. US EPA, 2007.
- Merriam, N.W.; Cha, C.Y.; Kang, T.W.; Vaillancourt, M.B. Development of an advanced continuous mild gasification process for the production of coproducts. Task 4, Mild gasification tests. United States. 1990. Available from: https://www.osti.gov/biblio/6133465 [Accessed: 20 November 2022].
- Merdes, A.C.; Keener, T.C.; Khang, S.J.; Jenkins, R.G. Investigation into the fate of mercury in bituminous coal during mild pyrolysis. Fuel 1998, 77, 1783–1792. [Google Scholar] [CrossRef]
- Wang, M.; Keener, T.C.; Khang, S.J. 2000. The effect of coal volatility on mercury removal from bituminous coal during mild pyrolysis. Fuel Process Technol. 2000, 67, 147–161. [Google Scholar] [CrossRef]
- Guffey, F.D.; Bland, A.E. 2004. Thermal pretreatment of low-ranked coal for control of mercury emissions. Fuel Process Technol. 2004, 85, 521–531. [Google Scholar] [CrossRef]
- Xu, Z.; Lu, G.; Chan, O.Y. Fundamental study on mercury release characteristics during thermal upgrading of an Alberta sub-bituminous coal. Energ Fuel 2004, 18, 1855–1861. [Google Scholar] [CrossRef]
- Strezov, V.; Morrison, A.; Nelson, P.F. Pyrolytic mercury removal from coal and its adverse effect on coal swelling. Energ Fuel 2007, 21, 496–500. [Google Scholar] [CrossRef]
- Liu, H.; Chang, L.; Liu, W.; Xiong, Z.; Zhao, Y.; Zhang, J. Advances in mercury removal from coal-fired flue gas by mineral adsorbents. J. Chem. Eng. 2020, 379, 122263. [Google Scholar] [CrossRef]
- Sholupov, S.; Pogarev, S.; Ryzhov, V.; Mashyanov, N.; Stroganov, A. Zeeman atomic absorption spectrometer RA-915+ for direct determination of mercury in air and complex matrix samples. Fuel Process Technol. 2004, 85, 473–485. [Google Scholar] [CrossRef]
- Huang, R.J.; Zhuang, Z.X.; Wang, Y.R.; Huang, Z.Y.; Wang, X.R.; Lee, F.S.C. An analytical study of bioaccumulation and the binding forms of mercury in rat body using thermolysis coupled with atomic absorption spectrometry. Anal. Chim. Acta. 2005, 538, 313–321. [Google Scholar] [CrossRef]
- Panichev, N.A.; Panicheva, S.E. Determination of total mercury in fish and sea products by direct thermal decomposition atomic absorption spectrometry. Food chem. 2015, 166, 432–441. [Google Scholar] [CrossRef]
- Sholupov, S.; Ganeev, A. Zeeman atomic absorption spectrometry using high frequency modulated light polarization. Spectrochim. Acta. Part B 1995, 50, 1227–1236. [Google Scholar] [CrossRef]
- Mathebula, M.W.; Panichev, N.; Mandiwana, K. Determination of mercury thermospecies in South African coals in the enhancement of mercury removal by pre-combustion technologies. Sci. Rep. 2020, 10, 19282. [Google Scholar] [CrossRef]
- Carter, O.C.; Scheiner, B.J. Investigation of metal and non-metal migration through phosphogypsum. In AIME Proceedings on the Symposium on Emerging Process Technologies for a Cleaner Environment, Phoenix, USA, February 24–27.
- Carbonell-Barrachina, A.; Delaune, R.D.; Jugsujinda, A. Phosphogypsum chemistry under highly anoxic conditions. J. Waste Manag. 2002, 22, 657–665. [Google Scholar] [CrossRef] [PubMed]
- Tayibi, H.; Choura, M.; Lopez, F.A.; Alguacil, F.J.; Lopez-Delgado, A. Environmental impact and management of phosphogypsum. J. Environ. Manage. 2009, 90, 2377–2386. [Google Scholar] [CrossRef] [PubMed]
- Wei, Z.; Wu, G.; Su, R.; Li, C.; Liang, P. Mobility and contamination assessment of mercury in coal fly ash, atmospheric deposition, and soil collected from Tianjin, china. Environ. Toxicol. Chem. 2011, 30, 1997–2003. [Google Scholar] [CrossRef]
- Rompalski, P.; Smolinski, A.; Krzton, H.; Gazdowicz, J.; Howaniec, N.; Rog, L. Determination of mercury content in hard coal and fly ash using X-ray diffraction and scanning electron microscopy coupled with chemical analysis. Arab. J. Chem. 2019, 12, 3927–3942. [Google Scholar] [CrossRef]
- Wu, J.; Wu, X.; Wang, J.; Wang, T.; Zhang, Y.; Pan, W.P. Speciation analysis of Hg, As, Pb, Cd, and Cr in fly ash at different ESP’s hoppers. Fuel 2020, 280, 118688. [Google Scholar] [CrossRef]
- Kumar, P. , Gogineni, A.; Ammarullah, M.I. Sustainable bioengineering approach to industrial waste management: LD slag as a cementitious material. Discov. Sustain. 2025, 6, 242. [Google Scholar] [CrossRef]
- Aziz, I.H.; Abdullah, M.M.A.B.; Heah, C.Y.; Liew, Y.M. Behaviour changes of ground granulated blast furnace slag geopolymers at high temperature. Adv. Cem. Res. 2020, 32, 465–475. [Google Scholar] [CrossRef]
- Moreda-Piñeiro, J.; Beceiro-González, E.; Alonso-Rodríguez, E.; González-Soto, E.; López-Mahía, P.; Muniategui-Lorenzo, S.; Prada-Rodríguez, D. Use of low temperature ashing and microwave acid extraction procedures for As and Hg determination in coal, coal fly ash, and slag samples by cold vapor/hydride generation AAS. At. Spectrosc. 2001, 22, 422–428. [Google Scholar]
- Tariq, S.A.; Hill, J.O. Thermal analysis of mercury(I) sulfate and mercury (II) sulphate. J Therm Anal Calorim 1981, 21, 277–281. [Google Scholar] [CrossRef]
- Lide, D.R. CRC Handbook of Chemistry and Physics, 90th Edition. CRC Press 2020, 725–726. [Google Scholar]
- Sedlar, M.; Pavlin, M.; Popovic, A.; Hovart, M. Temperature stability of mercury compounds in solid substrates. Open Chem. 2015, 13, 404–419. [Google Scholar] [CrossRef]
- Du, W.; Zhang, C.; Kong, X.M.; Zhuo, Y.Q.; Zhu, Z.W. Mercury release from fly ashes and hydrated fly ash cement pastes. Atmos. Environ. 2018, 178, 11−18. [Google Scholar] [CrossRef]
- Li, X.; Li, Z.; Wu, T.; Chen, J.; Fu, C.; Zhang, L.; Feng, X.; Fu, X.; Tang, L.; Wang, Z.; Wang, Z. Atmospheric mercury emissions from two pre-calciner cement plants in Southwest China. Atmos. Environ. 2019, 199, 177–188. [Google Scholar] [CrossRef]
- Berisha, S.; Živković, I.; Kotnik, J.; Mlakar, T.L.; Hovart, M. Quantification of total mercury in samples from cement production processing with thermal decomposition coupled with AAS. Accred. Qual. Assur. 2020, 25, 233–242. [Google Scholar] [CrossRef]
- Cui, J.; He, J.; Xiao, Y.; Li, J.; Di, Y. 2021. Characterization of input materials to provide an estimate of mercury emissions related to China’s cement industry. Atmos. Environ. 2021, 246, 118133. [Google Scholar] [CrossRef]
- Mashyanov, N.; Pogarev, S.E.; Panova, E.G.; Panichev, N.; Ryzhov, V. Determination of mercury thermospecies in coal. Fuel 2017, 203, 973–980. [Google Scholar] [CrossRef]
Figure 1.
The calibration curve of Hg by Zeeman Hg analyzer for Hg determination in cement and cement raw materials.
Figure 1.
The calibration curve of Hg by Zeeman Hg analyzer for Hg determination in cement and cement raw materials.
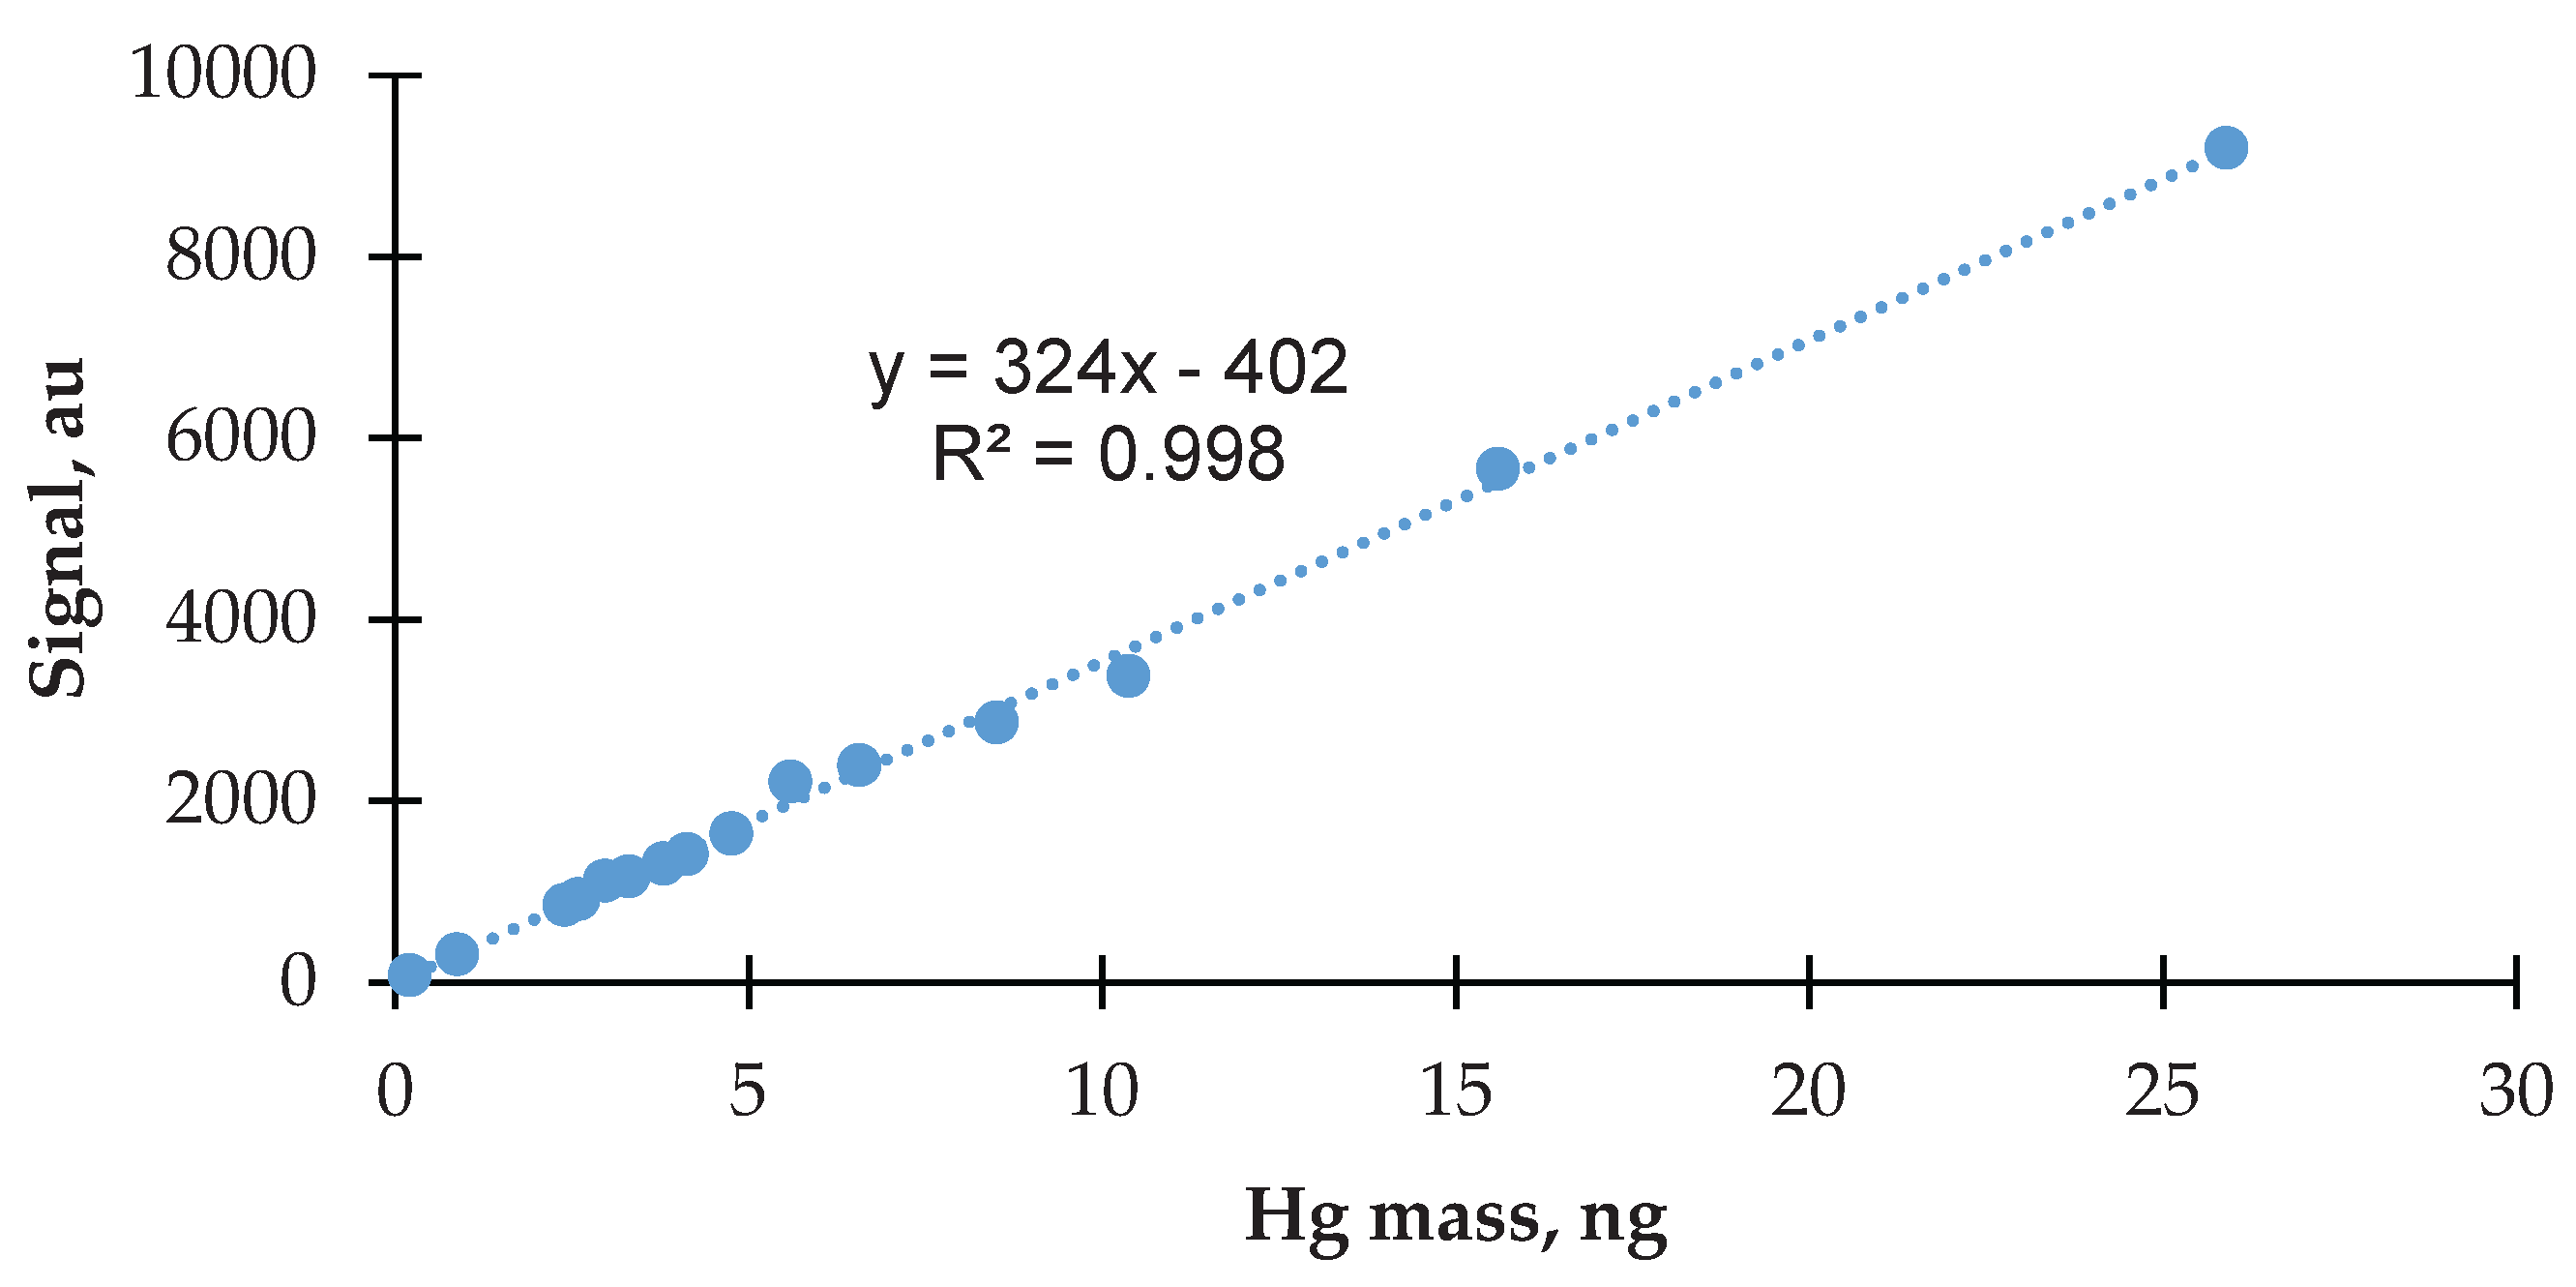
Figure 2.
Graph showing total mercury concentration on cement raw materials and dust return by-products.
Figure 2.
Graph showing total mercury concentration on cement raw materials and dust return by-products.
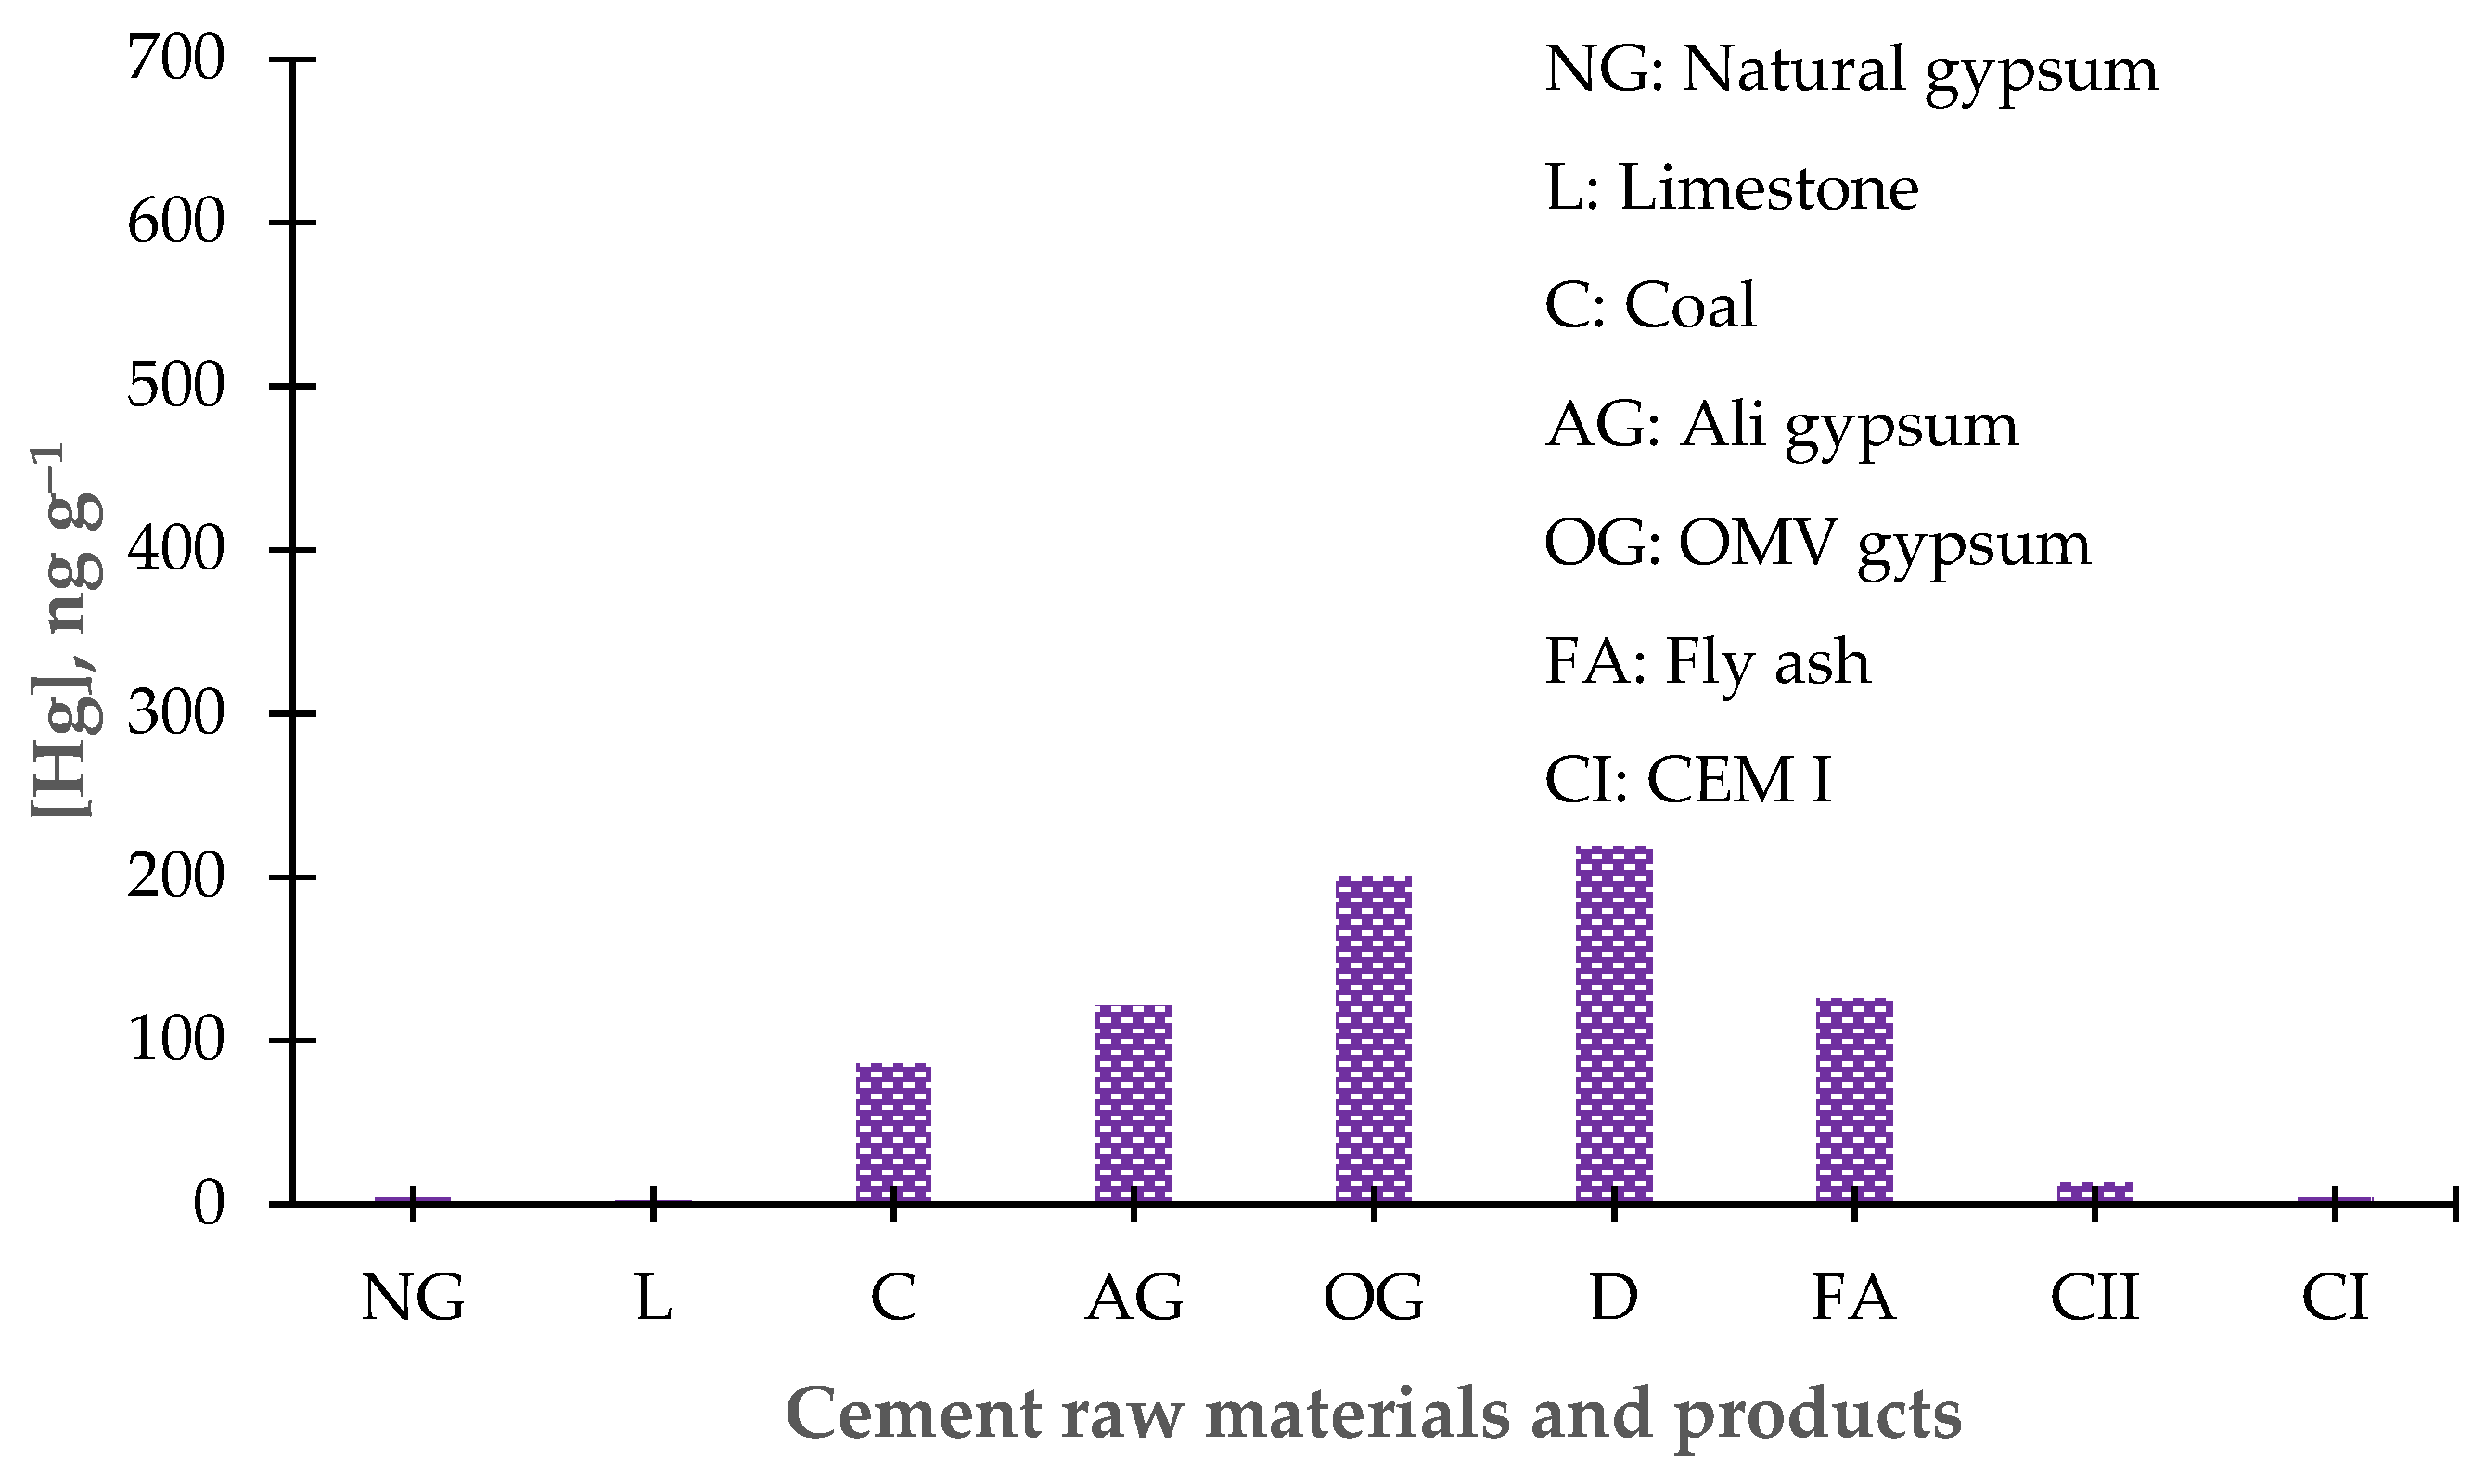
Table 1.
Temperature program applied in the determination of Hg in samples.
| Analyte | Heating Stage Temperature range |
| Total Hg determination | Single stage: Ambient T−720ºC |
| Stage 1: Ambient T−340ºC | |
| Stage 2: 344−378ºC | |
| Hg thermospecies | Stage 3: 387−485ºC |
| Stage 4: 510−617ºC | |
| Stage 5: 641−720ºC | |
| Stage 6: 720ºC −Ambient T (Cooling) |
Table 2.
Results of Hg determination in standard and certified reference material (ng g−1).
| SARM 20 | NCSZC 78001 | |||
| Instrument | Certified value | Found value | Certified value | Found value |
| RA-915+ | 250 ± 30 | 247 ± 4.0 | 39 ± 0.9 | 38 ± 1.0 |
| DMA-80 | 250 ± 30 | 251 ± 5.0 | 39 ± 0.9 | 38 ± 0.8 |
Table 3.
Results of the Determination of Total Hg Concentration (ng g−1) in Cement Raw Materials.
| Raw Materials | PPC Jupiter, ng g−1 | PPC De Hoek, ng g−1 | PPC Hercules, ng g−1 |
| Limestone | 2.40 ± 0.28 | 3.02 ± 0.32 | 2.19 ± 0.32 |
| Fly Ash | 160 ± 2.55 | N | 89 ± 25 |
| Slag | 2.56 ± 0.41 | 3.23 ± 0.36 | 1.58 ± 0.19 |
| Natural Gypsum | 5.75 ± 0.47 | 2.84 ± 1.19 | 2.30 ± 0.33 |
| OMV Gypsum | 395 ± 4.83 | N | N |
| ALI Gypsum | N | N | 262 ± 7.38 |
| Raw Coal | 28.7 ± 2.63 | 87 ± 2.24 | 142 ± 19 |
N: Not added during cement production.
Table 4.
Total Hg concentration in different grades of cement.
| Cement Plant | Total Hg (ng g−1) |
| PPC Jupiter | 6.56 ± 0.72 a |
| 31.0 ± 4.14 b | |
| PPC De Hoek | 1.20 ± 0.020 a |
| 2.93 ± 0.28 b | |
| PPC Hercules | 1.32 ± 0.83 a |
| 8.13 ± 2.50 b |
a CEM I 52.5N, b CEM II 42.5N.
Disclaimer/Publisher’s Note: The statements, opinions and data contained in all publications are solely those of the individual author(s) and contributor(s) and not of MDPI and/or the editor(s). MDPI and/or the editor(s) disclaim responsibility for any injury to people or property resulting from any ideas, methods, instructions or products referred to in the content. |
© 2025 by the authors. Licensee MDPI, Basel, Switzerland. This article is an open access article distributed under the terms and conditions of the Creative Commons Attribution (CC BY) license (http://creativecommons.org/licenses/by/4.0/).
Copyright: This open access article is published under a Creative Commons CC BY 4.0 license, which permit the free download, distribution, and reuse, provided that the author and preprint are cited in any reuse.


