
Submitted:
07 August 2025
Posted:
07 August 2025
You are already at the latest version
Abstract
Reservoir and adjacent soil are ecologically interconnected yet distinct microhabitats in wetland ecosystems, but direct comparisons of their bacterial community composition and assembly remain limited. In this study, we integrated high-throughput 16S rRNA gene sequencing with statistical, null model, and network analyses to compare the diversity patterns, assembly mechanisms, and interactions of abundant and rare bacterial taxa in both habitats. Soil communities exhibited greater taxonomic diversity but lower overall abundance, while reservoir communities displayed pronounced vertical stratification and soil communities were more spatially homogeneous. Key environmental drivers differed: salinity and nutrient levels structured reservoir communities, whereas nutrient availability and cation exchange capacity dominated in soil. Stochastic processes mainly governed the assembly of abundant taxa in both environments, whereas deterministic selection was more prominent in structuring rare taxa, especially in soil. Co-occurrence network analysis revealed higher connectivity and modularity in soils, with moderate taxa acting as critical connectors between modules, while rare taxa played a pivotal role in sustaining the network stability in reservoir. These findings underscore that distinct assembly mechanisms and ecological roles of abundant and rare bacterial taxa in different wetland microhabitats, providing novel insights to inform effective strategies for wetland conservation and scientific ecosystem management.
Keywords:
bacterial community
; rare taxa
; abundant taxa
; diversity
; community assembly
; co-occurrence networks
; reservoir
; soil
1. Introduction
Coastal wetlands are dynamic and complex ecosystems shaped by freshwater inflow, evaporation, precipitation, and tidal intrusion. Within these systems, reservoirs—engineered water bodies designed to alleviate freshwater shortages [1]—often form distinct habitats, especially when they are hydrologically connected and ecologically interactive with the surrounding natural wetlands. While reservoirs primarily serve as artificial hydraulic infrastructures, they also function as important aquatic habitats, contributing to the overall biodiversity and ecosystem functioning of wetland complexes.
Water bodies and soils represent two archetypal yet interconnected microhabitats within wetland systems. Wetland soils are influenced by multiple environmental factors, with reservoirs playing a critical role in regulating adjacent soil conditions. Numerous studies have highlighted the hydrological connectivity between reservoirs and surrounding groundwater in coastal regions [2,3]. Reservoirs affect groundwater levels through lateral seepage and vertical water exchange [4], leading to fluctuations that directly impact the adjacent soil’s moisture and solute dynamics (such as salt and nutrients) via capillary rise and plant-mediated processes. When groundwater tables are shallow, capillary effects can extend into the upper soil layers, especially the top 60 cm. Concurrently, rainfall, surface runoff, and plant root activities transport materials from the upper soil to the reservoir. These bidirectional hydrological pathways tightly couple the reservoir and adjacent soils, jointly shaping their environmental conditions and microbial community structures.
Bacterial communities are key constituents of these microhabitats, facilitating carbon cycling and driving vital ecological and geochemical processes across terrestrial and aquatic environments [5,6]. Both abundant and rare bacterial taxa play critical roles in ecosystem functioning, yet they respond differently to environmental variation [7,8,9,10,11]. Rare taxa, in particular, serve as a “seed bank,” enhancing community resilience due to their diversity and adaptability to environmental fluctuations [12,13]. Recent research highlights the ecological importance of the rare biosphere, as rare species frequently demonstrate high metabolic activity and genetic diversity, playing essential roles in ecosystem stability and function [14,15]. Clarifying the ecological strategies of abundant and rare taxa for adapting to different habitat is critical for developing effective conservation approaches and sustaining wetland ecosystem services.
Community assembly is a fundamental concept for understanding the processes shaping microbial diversity, requiring discrimination between stochastic (random) and deterministic (environmentally driven) mechanism [16,17]. While assembly processes have been extensively studied across isolated habitats, including reservoirs [10,11], rivers [18,19], wetland waters [20], and wetland soils [21,22], direct comparisons between the reservoir water and adjacent soil in coastal wetlands are lacking. Most comparative research has focused on river [23,24] and estuarine systems [25]. Dispersal limitation is generally more prominent in soil communities than in aquatic habitats, particularly in inland river and estuarine environments [24,25]. Moreover, network analysis has become a powerful tool for revealing interaction patterns among microbial taxa, offering new insights into the co-occurrence and connectivity within microbial communities [18,26]. It is now evident that the uniqueness of environmental conditions exerts a large influence on the interaction of bacterial taxa across different habitats [25,27,28].
Despite advances, several knowledge gaps on abundant and rare bacterial taxa between habitats of reservoir and soil remain. We hypothesize that (1) habitat type (reservoir vs. soil) will significantly structure the bacterial communities, with a stronger effect observed among rare taxa than abundant taxa; (2) community assembly processes for abundant and rare taxa will differ between these habitats, with stochastic processes prevailing for abundant taxa and deterministic selection being more pronounced for rare taxa, especially in soils; and (3) co-occurrence networks in soil will exhibit higher complexity and modularity than those in reservoirs, with abundant taxa occupying more central positions and rare taxa showing greater modular specificity. Therefore, the objectives of this study are to: (1) elucidate the differences and connectivity in community structure (alpha and beta diversity, species exchange) of abundant and rare bacterial taxa between reservoir and soil habitats; (2) assess the assembly mechanisms governing both taxa in each habitat; and (3) compare the co-occurrence network structures, clarifying the distinct ecological roles of abundant and rare taxa. Better understanding the assembly and interaction patterns of wetland bacterial communities is crucial for advancing the biodiversity-stability relationship and informing conservation and management strategies for coastal wetland ecosystems.
2. Materials and Methods
2.1. Sample Collection and Physicochemical Analysis
The Beidagang Reservoir (117°11′ E–117°37′ E, 38°36′ N–38°57′ N) is located in Tianjin’s coastal Binhai New Area, adjacent to the Bohai Bay, one of the major natural wetland reserves in northern China. The reservoir covers an area of 164 km², with a storage capacity of 0.50 billion m³ and an average water depth ranging from 2 to 3 m. The surrounding land use types primarily include wetland, forest, cropland, and industrial land [29].
Field sampling was conducted in December 2021, encompassing both the Beidagang Reservoir and its adjacent riparian soils, as illustrated in Figure 1. Nine sampling sites were selected at locations near the reservoir’s sluice gates. At each site, water samples were collected from three depths: surface (0.5 m below surface), middle (midway between surface and sediment), and bottom (0.5 m above the sediment), resulting in a total of 27 water samples. For each depth, three 2-liter parallel samples were collected and then combined to create a homogenized composite sample, which was transported to the laboratory without delay. Each composite water sample was subsequently divided into two portions: one for water chemistry analysis and the other for bacterial community analysis. Approximately 500 mL of each sample was sequentially filtered through a 200 μm mesh to remove larger particles and then through a 0.22 μm pore-size membrane filter (GTTP, Millipore, Billerica, MA, USA) to capture microbial biomass. Filters were immediately stored at −80 °C until DNA extraction.
In this study, "soils" refer specifically to samples collected from the reservoir’s riparian zone, which is periodically exposed and subject to terrestrial soil development, thereby distinguishing it from submerged sediments. Five sites were selected around the reservoir for soil sampling. A total of 12 soil samples were obtained from three depth intervals: surface (0–20 cm), middle (20–40 cm), and lower (40–60 cm). However, one sample could not be obtained from the 20–40 cm layer and two from the 40–60 cm layer due to field constraints. At each site and depth, five soil cores were randomly collected and composite samples were formed for analysis. All soil samples were placed in sterile plastic bags and immediately transported to the laboratory at 4 °C. Upon arrival, a portion of each sample was stored at −80 °C for microbial community analysis, while the remainder was air-dried and pretreated for soil physicochemical measurements.
For reservoir water, environmental variables including pH, oxidation-reduction potential (Eh), dissolved organic carbon (DOC), ammonia nitrogen (NH4+–N), total nitrogen (TN), total phosphorus (TP), and total dissolved solids (TDS) were measured following previously described protocols [3]. For soil samples, pH was measured in the soil-water slurry (1: 5, soil: water, w: w) with a pH meter. Total Soil Salt (TSS) Content were measured gravimetrically. For soils, pH was measured in a 1:5 (w:w) soil-water suspension using a pH meter. Total soil salt (TSS) content was determined gravimetrically. Soil total organic carbon (TOC) was quantified using dichromate oxidation. Soil TN was measured by the Kjeldahl digestion method [30]. Soil TP was extracted using HF–HClO4 [31] and determined by the molybdenum-blue method. NH₄⁺-N in soil was extracted with KCl solution and determined by spectrophotometric method [32]. Soil cation exchange capacity (CEC) was measured using the cobalt hexammine trichloride (Cohex) extraction-spectrophotometry method [33].
2.2. DNA Extraction, PCR Amplification, and Sequencing Analysis
Genomic DNA extractions from the water and soil samples were conducted using a DNeasy PowerSoil kit (Qiagen, Hilden, Germany) following the manufacturer’s instructions, respectively. Subsequently, the purity and quantity of DNA were verified by a NanoDrop 2000 spectrophotometer (Thermo Fisher Scientific, Waltham, MA, USA) and agarose gel electrophoresis, respectively. The diluted DNA was used as the template for polymerase chain reaction (PCR) amplification of bacterial 16S rRNA genes with the barcoded primers and Takara Ex Taq (Takara). The high-fidelity Takara Ex Taq enzyme, produced by Takara, facilitates efficient and accurate amplification. The V3-V4 hypervariable region of the bacterial 16S rRNA gene was amplified by PCR with primers 343F (5′-TACGGRAGGCAGCAG-3′) and 798R (5′-AGGGTATCTAATCCT-3′) [34,35]. PCR amplification and library preparation were carried out according to the manufacturer’s instructions and standard protocols. Purified amplicons were sequenced using the Illumina MiSeq platform at OE Biotech Co., Ltd. (Shanghai, China).
Paired-end reads were then preprocessed using cutadapt software to detect and cut off the adapter. After trimming, paired-end reads were filtered low-quality sequences, denoised, merged, and chimera reads were detected and cut off using DADA2 with the default parameters of QIIME2 platform [36], to generate amplicon sequence variant (ASV) tables. Taxonomic classification of ASVs was conducted using the SILVA database (v.138) [37]. Following quality control, a total of 2,407,075 high-quality sequences from water and soil samples were retained, with individual samples ranging from 55,690 to 68,582 sequences. A total of 5175 ASVs were obtained for reservoir water and 8934 ASVs for soil, which were used in subsequent analyses.
Although sequencing depth varied among samples, rarefaction analysis demonstrated that the sequencing depth of all samples was sufficient to saturate the diversity (Figure S1). Therefore, to maximize data retention and accurately reflect microbial diversity, the original sequence counts for each sample were used for all subsequent ASV-based analyses.
Following previous definitions [11,38,39], ASVs were classified separately for the reservoir and soil habitats as follows: (I) ASVs with average relative abundances of 0.1% or greater across all samples were identified as “abundant” taxa; (II) ASVs with average relative abundances of 0.01% or less were "rare" taxa; and (III) the remaining ASVs were assigned as “moderate” taxa. Subsequent analysis focused primarily on abundant and rare taxa because of their distinct ecological roles and contrasting responses to environmental factors.
2.3. Statistical Analyses
Microbial communities were classified into four groups based on habitat (reservoir or soil) and abundance (abundant or rare taxa). To visualize community differences within and among these groups, principal coordinates analysis (PCoA) based on Bray–Curtis dissimilarity was performed using the “vegan” package. Permutational multivariate analysis of variance (PERMANOVA), implemented with the “adonis” function, was used to assess the effects of habitat and taxa abundance on community structure. Differences in community composition of abundant and rare taxa across water column layers in the reservoir and soil depths in the adjacent riparian zone were further examined using Bray–Curtis distances and visualized by non-metric multidimensional scaling (NMDS) via the “vegan” package. Analysis of similarity (ANOSIM) was used to evaluate the significance of compositional dissimilarities among water and soil layers.
Alpha diversity indices, including observed richness and Shannon–Wiener index for abundant and rare taxa, were calculated with the “vegan” package. Faith’s phylogenetic diversity (Faith’s PD) was determined through the “pd” function in the “picante” package [40]. Beta diversity was assessed using Bray–Curtis dissimilarity and computed via the “metaMDS” function in “vegan.” To further characterize the mechanisms underlying community differences between abundant and rare taxa in the two habitats, beta diversity values were partitioned into turnover (species replacement) and nestedness (richness difference) components, using the “beta.div.comp” function in the “adespatial” package [41].
Reservoir samples were divided into two vertical layers: upper (surface), and deep (including both middle and bottom layers). This resulted in four groups based on habitat and taxa abundance, and six groups based on three habitat strata (upper reservoir, deep reservoir, and soil) and taxa abundance. Linear Discriminant Analysis Effect Size (LEfSe) was applied to identify bacterial biomarkers across the four main groups using the “microeco” package [3,42], with selection criteria of LDA score (log₁₀) > 4.5 and p < 0.05. The “VennDiagram” and “UpSetR” packages were used to visualize shared and unique taxa among four groups and six groups, respectively.
Correlations between community structure (in both abundant and rare taxa) and environmental variables in the reservoir and adjacent soil were analyzed using Mantel tests with the “mantel_test” function in the “linkET” package. Canonical correspondence analysis (CCA) was conducted, as detrended correspondence analysis indicated gradients exceeding four. Permutation tests using the “envfit” function from “vegan” evaluated the statistical significance of key environmental variables shaping community composition.
Ecological processes governing community assembly were inferred using a community-level null model framework for both abundant and rare taxa in reservoir and soil, following established protocols [17,43,44]. The β-nearest taxon index (βNTI) and Bray-Curtis-based Raup-Crick (RCbray) metrics were calculated using the “iCAMP” package. A βNTI > 2 indicates that heterogeneous selection (a deterministic process) drives community assembly, whereas a βNTI < −2 suggests dominance of homogeneous selection. Values of |βNTI| < 2 imply that stochastic processes are primarily responsible for observed phylogenetic diversity patterns. Stochasticity can be further classified with RCbray: (1) |βNTI| < 2 and RCbray < −0.95 indicate homogenizing dispersal; (2) |βNTI| < 2 and RCbray > 0.95 indicate dispersal limitation; and (3) |βNTI| < 2 and |RCbray| < 0.95 indicate “undominated” processes, such as weak selection, weak dispersal, diversification, or genetic drift [17]. Habitat niche breadths of abundant and rare taxa were estimated using the “spaa” package [45]. Relationships between βNTI and Bray-Curtis dissimilarity in abundant and rare taxa for the reservoir and adjacent soil were assessed by linear regression analysis.
Co-occurrence network analysis was performed by calculating Spearman’s rank correlations between ASVs occurring in at least three samples within each habitat, using the “Hmisc” package. The false discovery rate (FDR) adjustment was applied to control for multiple comparisons [46]. Only robust and significant correlations (|r| > 0.8, p < 0.05) were retained for network construction. Network topological features, including node/edge counts, betweenness centrality, closeness centrality, eigenvector centrality, proportions of positive/negative correlations, average degree, average path length, diameter, density, clustering coefficient, degree centralization, betweenness centralization, and modularity, were calculated with the “igraph” package. Networks were visualized in Gephi (v0.10). For comparison, 1,000 Erdős–Rényi random networks with matching node and edge counts were generated using “igraph” package.
Within-module connectivity (Zi) and among-module connectivity (Pi) for each node were calculated with the “microeco” package to assign topological roles. Nodes were classified as network hubs (Zi ≥ 2.5, Pi ≥ 0.62), module hubs (Zi ≥ 2.5, Pi < 0.62), connectors (Zi < 2.5, Pi ≥ 0.62), or peripherals (Zi < 2.5, Pi < 0.62), following established criteria [47,48,49]. Keystone taxa were defined as network hubs, module hubs, and connectors [50,51]. To enable cross-habitat network comparisons, node topological properties (degree, betweenness centrality, closeness centrality, and eigenvector centrality) were normalized to percentile ranks (0 to 1) within each network. All statistical analyses were conducted in R version 4.4.2 (http://www.r-project.org, accessed 1 December 2024).
3. Results
3.1. Community Structure and Diversity of Abundant and Rare Taxa in Reservoir and Adjacent Soil
Within the reservoir bacterial community, a total of 124 ASVs (2.40%) were classified as abundant taxa, accounting for 75.81% of the overall sequence abundance. In contrast, rare taxa made up the majority (4,454 ASVs; 86.07% of total ASVs), but contributed only 6.81% to the total sequence abundance (Table S1). In the adjacent soil, 162 ASVs (1.81%) were defined as abundant taxa, comprising 39.93% of the overall sequence abundance, while rare taxa (7,313 ASVs; 86.07%) overwhelmingly dominated numerically and contributed 18.86% of the total bacterial abundance.
PCoA analysis results based on Bray–Curtis dissimilarity revealed clear structural differences among the four groups defined by habitat (reservoir vs. soil) and bacterial abundance (abundant vs. rare taxa) (Figure 2A). PERMANOVA results indicated that both habitat and taxa abundance type significantly influenced community structure (p < 0.001 for both), and there was also a significant interaction between habitat and taxa (p < 0.001; Table S2). However, pairwise PERMANOVA comparisons showed no significant differences between "Reservoir Abundant" and "Reservoir Rare," nor between "Soil Abundant" and "Soil Rare" (Table S3). These findings were further corroborated by separate PCoA analyses within reservoir and soil, where no significant differences were observed between abundant and rare taxa (p > 0.1; Figure 2B).
NMDS analysis showed significant compositional differences in both abundant and rare bacterial communities among the three water layers (upper, middle, and bottom) of the reservoir (ANOSIM, p < 0.01), whereas no significant differences were observed among the soil layers (0–20 cm, 20–40 cm, 40–60 cm) for either abundant or rare taxa (ANOSIM, p > 0.5; Figure 2C, D). Within the reservoir, further pairwise comparisons revealed significant differences between the upper and middle layers, and between the upper and bottom layers (ANOSIM and PERMANOVA, p < 0.05), but not between the middle and bottom layers for either abundant or rare taxa (p > 0.1; Table S4). Due to the significant stratification observed in the reservoir, with notable differences between the upper layer and the other layers, the middle and bottom layers were combined for subsequent diversity analyses as a "deep layer," which was compared with the upper layer.
Alpha diversity indices (observed richness, Shannon–Wiener index, and Faith’s PD), beta diversity (Bray–Curtis dissimilarity), and the partitioning of beta diversity into turnover and nestedness components were used to assess bacterial diversity patterns between habitats and among abundant and rare taxa. Results indicated that rare taxa consistently exhibited significantly higher alpha diversity, beta diversity, and turnover components than abundant taxa across all habitats (Figure 3A–D). For rare taxa, soil communities displayed the highest alpha diversity values compared to the deep and upper reservoir layers. The Faith’s PD of abundant taxa was comparatively similar to that of the reservoir upper layer, rather than the deep layer. On average, turnover contributed the most to beta diversity for both abundant and rare taxa (upper reservoir: 81.63% and 76.84%; deep reservoir: 65.78% and 67.52%; soil: 78.08% and 64.78%), while nestedness accounted for a smaller fraction. Furthermore, Bray–Curtis dissimilarity, turnover, and nestedness of both abundant and rare taxa were significantly greater in soil than in either the upper or deep reservoir layers (Figure 3D–F).
3.2. Community Composition of Abundant and Rare Taxa in the Reservoir and Adjacent Soil
At the phylum level (Figure 4A), Proteobacteria and Bacteroidota were predominant across all six groups. Proteobacteria were especially dominant in the abundant taxa of both reservoir layers (69.24% in the upper layer, 76.13% in the deep layer) and progressively decreased in the rare taxa from the reservoir (49.29% in the upper layer, 47.51% in the deep layer) as well as in both abundant (42.24%) and rare taxa (34.25%) from the soil. Bacteroidota showed the highest relative abundance in the rare taxa of the upper (31.82%) and deep reservoir layers (27.00%), but were less represented in the abundant reservoir taxa (12.16% in the upper, 10.37% in the deep layer). Actinobacteriota were notably more enriched in the abundant reservoir taxa (18.52% in the upper, 12.73% in the deep layer) than in the rare taxa from the reservoir, while their abundance was similar between the abundant (11.00%) and rare (8.88%) soil taxa. Gemmatimonadota were distinctive, occurring mainly in the soil’s abundant (19.55%) and rare taxa (11.02%), and were nearly absent in the reservoir (<2%). The rare taxa in soil also showed higher relative abundances of Desulfobacterota and Myxococcota compared to those in the reservoir.
Biomarker taxa distinguishing the four groups were identified by LEfSe analysis. A taxonomic cladogram highlighted the characteristic lineages differentiating abundant and rare taxa in the reservoir and soil (Figure S2). Based on an LDA score threshold (log₁₀ > 4.5, p < 0.05), a total of 14 biomarker taxa (9 in abundant and 5 in rare taxa) were identified for the reservoir, while 12 biomarkers were found for the soil (11 in abundant, 1 in rare taxa) (Figure 4B). In each case, biomarker taxa in a group showed the highest relative abundance in their respective comparison.
Venn diagrams revealed that only 384 ASVs (3% of the total) were shared between the reservoir and soil habitats, underscoring a substantial divergence in bacterial community composition. The number of shared ASVs between reservoir_abundant and soil_abundant groups (1 ASV) was much lower than that between reservoir_rare and soil_rare groups (201 ASVs). Furthermore, the abundant taxa in the reservoir shared 31 ASVs with the rare taxa of soil, while the rare taxa of the reservoir shared 8 ASVs with the abundant taxa of soil (Figure 4C), with detailed taxonomic information of these shared ASVs listed in Table S5. Additionally, the upset diagrams revealed that the overlap of rare taxa ASVs between the deep reservoir and soil was greater than the overlap observed between the upper reservoir and soil (Figure 4D).
3.3. Influencing Factors and Assembly Mechanisms of Abundant and Rare Bacterial Taxa
The basic environmental characteristics of the reservoir water and adjacent soil are presented in Table S6. In the reservoir, the concentration of DOC in the middle and bottom layers was significantly higher than in the upper layer (p < 0.05), whereas other environmental variables exhibited no significant vertical variation (p > 0.05; Figure S3A). Similarly, in the adjacent soil, pH in the 0–20 cm layer was significantly lower than in the 20–40 cm layer (p < 0.05), while other environmental variables did not differ significantly across soil layers (p > 0.05; Figure S3B).
To elucidate the environmental influences on bacterial communities, Mantel tests and canonical correspondence analysis (CCA) were performed to assess the responses of abundant and rare taxa to environmental variables in both the reservoir and soil. In the reservoir, Mantel tests revealed that abundant bacterial taxa were significantly correlated with Eh, TN, DOC, and TDS (p < 0.05), while rare taxa showed significant correlations with pH, Eh, NH₄⁺–N, TN, TP, DOC, and TDS (p < 0.05; Figure 5A). In the adjacent soil, abundant taxa were significantly associated with Eh, TN, DOC, and TDS (p < 0.05), whereas rare taxa showed significant correlations with pH, Eh, TOC, TN, TP, and CEC (p < 0.05); notably, TOC, TN, TP, and CEC strongly influenced the structure of the rare taxa community (Figure 5B). CCA results indicated that environmental variables accounted for a greater proportion of variance in the community structure of abundant taxa compared to rare taxa, in both reservoir and soil habitats. In the reservoir, pH, Eh, TN, DOC, and TDS were identified as the primary environmental drivers shaping both abundant and rare taxa, as supported by permutation tests (p < 0.05; Figure 5C, D). In the soil, pH, TN, TP, TOC, and CEC mainly shaped the community structure of abundant taxa, while TN, TP, TOC, and CEC were the principal drivers for rare taxa (p < 0.05; Figure 5E, F).
To further clarify the relative influence of deterministic and stochastic assembly processes, we applied a null model framework integrating community phylogenetic relationships and abundance data. The contributions of distinct deterministic and stochastic processes for abundant and rare taxa in both the reservoir and soil were quantified using pairwise comparisons of βNTI and RCbray (Figure S4). In the reservoir, stochastic assembly of abundant taxa was predominately attributed to dispersal limitation (17.38%) and undominated processes (69.80%). For rare taxa, both deterministic processes (heterogeneous selection: 10.54%, homogeneous selection: 35.33%) and stochastic processes (dispersal limitation: 44.73%, undominated: 9.12%) contributed to community assembly (Figure 6A). In the soil, stochastic assembly of abundant taxa was mainly driven by dispersal limitation (83.33%), whereas rare taxa were shaped to a greater extent by deterministic processes (heterogeneous selection: 39.39%, homogeneous selection: 31.82%) than by dispersal limitation (28.79%; Figure 6B).
Abundant taxa showed significantly broader niche breadth than rare taxa across both reservoir and soil habitats (Wilcoxon test, p < 0.0001), and the niche breadth of both groups was higher in the reservoir than in the soil (Figure 6C). Linear regression analysis indicated that, for rare taxa in both the reservoir and soil, βNTI was significantly positively correlated with Bray–Curtis dissimilarity (p < 0.001), whereas this relationship was not observed for abundant taxa (Figure 6D, E).
3.4. Co-Occurrence Networks of Bacterial Community in the Reservoir and Soil
To elucidate interspecies interactions and the ecological roles of abundant and rare taxa, co-occurrence networks were constructed for bacterial communities in both the reservoir and adjacent soil. The topological properties of these two networks provided insights into the complexity and structure of microbial interactions (see Table S7 for details). Compared to 1,000 Erdős–Rényi random networks with the same number of nodes and edges, both empirical co-occurrence networks exhibited higher average clustering coefficients, longer average path lengths, and greater modularity. These features indicate pronounced non-random, small-world characteristics in both the reservoir and soil networks.
In the reservoir network, rare taxa comprised 66.92% of the 2,143 nodes, whereas abundant taxa accounted for only 5.79% (Figure 7A). In the soil network, rare and abundant taxa represented 47.05% and 6.29% of the total 2,561 nodes, respectively (Figure 7B). The soil network exhibited a substantially greater number of edges (64,757) than the reservoir network (20,218), as well as a higher average degree (50.57 vs. 18.88) and clustering coefficient (0.86 vs. 0.70). These findings indicate much tighter interspecific interactions and higher species connectivity within the soil bacterial community compared to that of the reservoir. Additionally, network modularity was greater in the soil (0.74) than in the reservoir (0.69), suggesting stronger compartmentalization in the soil bacterial community.
Potential keystone taxa were identified based on within-module connectivity (Zi) and among-module connectivity (Pi) metrics. In the reservoir network, nine module hubs and eleven connectors were recognized as keystone species (Figure 7C). Of these, three belonged to abundant taxa (ASV163, ASV187, ASV219), three to moderate taxa (ASV909, ASV1729, ASV1825), and the remaining fifteen were rare taxa. These keystones spanned seven phyla and eight classes, with Proteobacteria, especially the Gammaproteobacteria and Alphaproteobacteria, being dominant. In the soil network, twenty-six keystone taxa were detected, comprising one module hub and twenty-five connectors. These included one abundant taxon (ASV436), six rare taxa, and the remainder classified as moderate taxa. Soil keystone taxa covered ten phyla and thirteen classes, with Proteobacteria and Bacteroidota dominating—particularly Gammaproteobacteria, Alphaproteobacteria, Bacteroidia, and Rhodothermia (Table S8).
Node-level topological parameters for abundant, moderate, and rare taxa in both the reservoir and soil networks—including edge/node ratio, degree, betweenness centrality, closeness centrality, eigenvector centrality, and clustering coefficient—are summarized in Table S9 and illustrated in Figure S5. Due to the overall low and dispersed values of closeness and eigenvector centrality, all node parameters were normalized to percentile ranks within each habitat to facilitate cross-network comparison. After normalization, rare taxa in the reservoir network exhibited significantly higher degree, betweenness centrality, and eigenvector centrality compared to abundant taxa. In the soil network, rare taxa had higher degree values, while abundant taxa displayed higher normalized betweenness and closeness centrality than rare taxa (Figure 8).
4. Discussion
4.1. Community Structure of Abundant and Rare Taxa in the Reservoir and Adjacent Soil
In this study, reservoir water and adjacent riparian soil represent two physically connected yet ecologically distinct microhabitats within the coastal wetland ecosystem. Previous studies have often compared water bodies with reservoir sediments [10], which, being permanently submerged beneath overlying water, contrast with riparian soils that undergo alternating submersion and exposure during hydrological cycles [25]. The riparian soils sampled here are periodically exposed and shaped by terrestrial soil-forming processes, making them highly sensitive to fluctuations in water level. These dynamic conditions in riparian soils lead to frequent changes in redox status, nutrient inputs, and energy availability, which in turn influence the structure and function of their microbial communities [22].
Comparison of bacterial community composition revealed clear distinctions between habitats. Soil bacterial communities harbored a greater number of ASVs (8,934) than reservoir water (5,175), yet the overall bacterial abundance—especially that of abundant taxa—was markedly higher in reservoir water, with abundant taxa comprising more than the entire bacterial abundance of the soil community (Table S1). This highlights substantial ecological and functional differentiation between reservoir water and soil. When compared to soil, reservoir water with its greater hydrological connectivity, facilitates broader spatial dispersal of both abundant and rare taxa, resulting in the largest ecological niche breadths (Figure 6) and greater adaptation to spatial heterogeneity. Notably, the turnover component of community dissimilarity for both rare taxa (upper: 76.84%, deep: 67.52%) and abundant taxa (upper: 81.63%) in the reservoir exceeded that in soil (rare: 64.78%; abundant: 78.08%). This suggests that higher bacterial abundance and ecological turnover in the reservoir leads to greater spatial heterogeneity in community composition.
PCoA with PERMANOVA tests further confirmed that habitat was a key determinant of bacterial community structure, with a significant interaction between habitat and taxa abundance (Table S2). Alpha diversity (Shannon-Wiener index, Faith’s PD) and beta diversity (Bray–Curtis dissimilarity) for both abundant and rare taxa were consistently higher in soil compared to reservoir water. This elevated diversity in soil microbial communities is likely due not only to the presence of resident microbes, but also to the continual exchange of microbes between soil microhabitats and their surrounding environments [24,52]. These findings are consistent with previous studies reporting that soil harbors greater microbial diversity than aquatic environments [23,24,25], thereby supporting our first hypothesis that soil and aquatic habitats maintain distinct and highly diverse bacterial assemblages.
Spatial stratification within the reservoir revealed that both abundant and rare communities differed markedly between the surface and deeper layers (Figure 2C). Faith’s PD of abundant taxa was significantly higher in the deep layer than in the upper, and the deep layer’s diversity was more similar to that of soil than to the surface. This may result from stronger ecological connections (e.g., via surface runoff, root activity) between the reservoir upper water and adjacent soil. For rare taxa, alpha diversity indices were significantly higher in the deep layer, driven primarily by the much greater number of rare ASVs in the deep layer compared to the surface (3,896 vs. 843; Figure 4D). Additionally, the relative abundance of Proteobacteria and Actinobacteriota decreased with depth, while Bacteroidota increased, across both abundant and rare communities (Figure 4A). These patterns reinforce the strong spatial heterogeneity observed in the reservoir.
Given the unique characteristics of soil as a microhabitat, its bacterial community is frequently shaped by the rhizosphere effect [25]. In the present study, the relative abundance of Gemmatimonadota among abundant taxa and Desulfobacterota and Myxococcota among rare taxa was significantly higher in soil than in the reservoir. Both Gemmatimonadota and Myxococcota have previously been reported as prominent members in coastal freshwater Phragmites wetlands [53]. Gemmatimonadota is also recognized as a dominant component of soil bacterial communities, with higher abundance in soil than in freshwater environments, and is often associated with plants and the rhizosphere [54,55]. Consistent with these findings, Gemmatimonadota was identified as the top biomarker for abundant taxa in our study. Desulfobacterota, on the other hand, are primarily associated with anaerobic sulfate reduction in soil and play a crucial role in the sulfur cycle of lagoon and estuary wetlands [53,56].
Our findings also highlight cross-habitat microbial connectivity. Specifically, 201 rare ASVs were shared between the reservoir and soil, 31 ASVs were shared between abundant taxa in the reservoir and rare taxa in the soil, and eight ASVs were shared between rare taxa in the reservoir and abundant taxa in the soil (Table S5). These results indicate dynamic gene flow and ecological connectivity between the two habitat systems. Species exchange of abundant and rare taxa between habitat across habitats carries several important ecological implications: (1) different bacterial taxa display unique responses to environmental heterogeneity, thereby enhancing functional diversity and ecological resilience; (2) rare taxa present in the reservoir can become abundant in the soil, supporting the concept of the rare biosphere acting as a microbial seed bank that enables rare lineages to become dominant under favorable conditions (Lennon and Jones, 2011); (3) both deterministic processes (e.g., environmental selection) and stochastic processes (e.g., dispersal) jointly contribute to the maintenance and reshuffling of species across habitats; and (4) such microbial exchanges facilitate functional redundancy and resilience within communities, thereby strengthening the coupling of biogeochemical processes between wetland soils and aquatic ecosystems.
4.2. Environmental Influencing Factors and Assembly Mechanisms of Abundant and Rare Taxa in Reservoir Water and Adjacent Soil
In this study area, the strong hydrological connectivity between reservoir water and groundwater, combined with common meteorological recharge, has led to seawater intrusion into the reservoir, resulting in marked salinization of the reservoir water [3,57]. The Wetland soil also displays severe salinization [58]. Salinity is represented by total dissolved solids (TDS) in the reservoir and total soluble salts (TSS) in the soil. Our analyses revealed that, in the reservoir, both abundant and rare taxa were significantly influenced by nutrient variables (DOC, TN), TDS, Eh, and pH. In contrast, in the soil, only nutrient variables (TOC, TN, TP) and cation exchange capacity (CEC) significantly affected abundant and rare taxa. Previous research on reservoirs and lakes has demonstrated that salinity is a key factor shaping microbial community composition [44,59,60], which supports our findings. Similarly, many studies have shown that salinity acts as an environmental filter for bacterial communities in coastal wetlands and saline-gradient soils [61,62,63,64]. However, in our study, neither abundant nor rare taxa in soil were significantly correlated with TSS, likely because soil salinity was relatively homogeneous across samples (Figure S3B) and thus could not explain variation in the soil bacterial community.
With regard to community assembly mechanisms, our results showed that stochastic processes primarily governed the assembly of abundant taxa in both reservoir and soil. In the reservoir, rare taxa were shaped by a combination of deterministic and stochastic processes, whereas in the soil, homogeneous selection (74.07%) overwhelmingly dominated the assembly of rare taxa, compared to undominated stochastic processes (22.22%) (Figure 8C). The dominance of stochastic processes in shaping abundant taxa is consistent with observations in other source water reservoirs [10], the wetland system [20], estuary areas of the lake [19], and plain river networks [18], and coastal wetland soils [21]. However, the assembly mechanisms for rare taxa tend to vary more across aquatic environments, whereas in soils, environmental selection (deterministic processes) is typically more important [21,23,65].
Examining the association between βNTI and Bray–Curtis dissimilarity offers additional perspective on the ecological processes structuring microbial communities. When a strong positive relationship exists, it implies that factors like environmental filtering are concurrently influencing both phylogenetic and taxonomic composition, pointing to the dominance of deterministic processes. Conversely, only a weak or insignificant association would indicate that random, stochastic forces are the primary drivers, allowing community composition to shift independently of phylogenetic relationships [16,43]. In our study, rare taxa in both the reservoir and soil exhibited a significant positive correlation between βNTI and Bray–Curtis dissimilarity, suggesting that strong environmental selection was predominant, in line with our assembly mechanism results. Furthermore, the coefficient of determination (R²) from linear regression was higher for rare taxa in the soil compared to the reservoir (0.49 vs. 0.24, Figure 6D,E), indicating stronger deterministic control in the soil (74.07%) than in the reservoir (45.87%). These findings confirm our second hypothesis that stochastic processes govern abundant taxa assembly, whereas deterministic processes dominate in rare taxa, particularly in soil habitats.
CCA analysis revealed that environmental variables explained a greater proportion of compositional variation in abundant taxa than in rare taxa, in both habitats. At first glance, this appears to contradict the results from the null model analysis regarding assembly mechanisms. However, it is important to note that CCA reflects the overall variance in community composition that can be attributed to environmental factors. Because abundant taxa are dominant and contribute the most to total community variation, the explanatory power of environmental variables is proportionately higher. In contrast, rare taxa, due to their low abundance, contribute little to overall community variation; thus, their variation is less well captured by CCA, despite their higher sensitivity to environmental change. In terms of assembly mechanisms, abundant taxa, with their broad distribution and wide ecological niches, are less affected by environmental filtering and are more likely to be governed by stochastic processes. Rare taxa, often being ’environmental specialists,’ are highly sensitive to environmental gradients, and their community assembly is primarily regulated by deterministic processes such as environmental selection. Thus, the results of these two analyses are not contradictory but instead reflect different ecological perspectives. This ecological differentiation illustrates a strategic divergence in environmental response between abundant and rare bacterial lineages.
4.3. Ecological Role of Abundant and Rare Taxa in the Network of Reservoir and Adjacent Soil
Despite employing identical network construction methods, the co-occurrence network structures of bacterial communities differed markedly between the reservoir and soil, highlighting that environmental heterogeneity is a principal driver of these differences. Similar findings have been reported in other habitat comparisons, where the unique environmental features of each system strongly shape microbial interactions [25,27,28]. Such inter-taxa interactions substantially contribute to community resilience, acting as a buffer against environmental disturbances [66].
Notably, the soil bacterial network was characterized by higher edge density, average degree, clustering coefficient, and shorter average path length compared to the reservoir, indicating a more densely connected and interactive community. This denser networking, by promoting active decomposition of soil organic carbon, may enhance carbon utilization efficiency [26]. Moreover, the higher modularity observed in the soil network signifies greater ecological compartmentalization and the formation of discrete functional modules, which are commonly linked to environmental filtering and resource partitioning [67,68], These highly structured modules further corroborate our findings that rare taxa in soil are subject to pronounced environmental selection (Figure 6A, B). This enhanced modularity likely contributes to the resilience of bacterial communities against environmental fluctuations.
Within ecological networks, keystone species maintain the overall structure and function of microbial communities through their extensive connections with other taxa [69,70]. In the present study, nineteen keystone species were identified in the reservoir network, functioning mainly as module hubs and connectors, whereas a larger number (26) were found in the soil, predominantly serving as connectors linking different modules [71]. The predominance of connectors as keystone taxa in soil, reminiscent of patterns found in rhizosphere environments [72], supports the third hypothesis that soil network exhibits greater stability and connectivity than that of the reservoir.
In the reservoir, rare taxa contributed the majority of keystone species (15 out of 19), and exhibited markedly higher values for all major network topological parameters compared to abundant taxa (Table S9). These results underscore the central role of rare taxa in stabilizing bacterial communities within aquatic environments, corroborating previous studies in reservoir systems [10,11]. In contrast, within the soil network, abundant taxa exhibited the highest betweenness and closeness centrality (Figure 8), indicating a primary role in intermodular connectivity and core network influence.
Notably, although moderate taxa comprised only 16.33% of ASVs in soil, their total abundance (41.21%) surpassed that of the abundant taxa (39.93%). In the soil network, moderate taxa accounted for 46.66% of all nodes—second only to rare taxa at 47.05%—and contributed approximately 73% of the keystone species. While the edge/node ratio, degree, and clustering coefficient of moderate taxa were slightly less than those of rare taxa, their normalized betweenness centrality, closeness centrality, and eigenvector centrality were notably higher, highlighting their critical role in network cohesion. Furthermore, moderate taxa exhibited more frequent links connecting abundant and rare taxa, emphasizing their pivotal bridging function within the soil microbial network (Figure 7B). These findings point to a previously underappreciated role of moderate taxa in maintaining high connectivity and stability in soil networks. This complexity is further underscored by highly intricate associations and ecological role of three taxa in soil, compared with the network patterns in the reservoir. It is worth noting that some research have classified soil bacterial communities directly into “core” and “non-core” taxa to analyze their functional roles [6]. Exploring more refined and ecologically meaningful approaches for defining taxon abundance groups remains an important theme for future research, especially when comparing patterns across diverse habitats.
This study utilized only 16S rRNA gene amplicon sequencing, limiting our ability to resolve the metabolic and functional diversity of the different community groups. In addition, sampling was restricted to the winter season, precluding comparison of seasonal network dynamics. Future investigations employing multi-seasonal and multi-omics approaches will be essential to further elucidate how abundant, moderate, and rare taxa collectively regulate ecosystem function and metabolic processes in both reservoir and soil bacterial communities.
5. Conclusions
Our study reveals fundamental differences in bacterial community structure between reservoir water and adjacent wetland soil. While reservoirs exhibited higher total bacterial abundance, they harbored lower taxonomic richness and diversity compared to soils. The principal environmental drivers shaping community composition varied between habitats: salinity and nutrient availability were most influential in the reservoir, whereas nutrient variables and cation exchange capacity played dominant roles in soil. Community assembly mechanisms also diverged, with stochastic processes primarily governing abundant taxa in both environments, while deterministic environmental selection exerted a stronger influence on rare taxa, especially in soil. Network analyses further demonstrated that soil bacterial communities possessed greater connectivity and modularity, indicating more robust interspecies interactions and ecological compartmentalization. Our study advances the understanding of how microbial communities assemble and function in connected aquatic–terrestrial interfaces. The pronounced contrasts in ecological drivers, assembly mechanisms, and network architectures between reservoir and soil highlight the importance of considering both microbial abundance categories and habitat types in future wetland research.
Supplementary Materials
The following supporting information can be downloaded at the website of this paper posted on Preprints.org. Figure S1: Rarefaction curve of bacterial community Shannon index reaches saturation stage with increasing sequencing depth. Figure S2: Taxonomic cladogram from Linear discriminant analysis Effect Size (LEfSe) analysis identifying significant biomarker taxa in bacterial communities across four groups: reservoir-abundant, reservoir-rare, soil-abundant, and soil-rare. Figure S3: The vertical variation of environmental factors in the reservoir (A) and soil (B). The statistical differences were evaluated among layers utilizing the Kruskal–Wallis test and between layers, utilizing the Wilcoxon rank sum test (ns, not significant, p > 0.05, * p < 0.05, ** p < 0.01, *** p < 0.001, **** p < 0.0001). Eh: oxidation-reduction potential TDS: total dissolved solids; TN: total nitrogen; TP: total phosphorus; DOC: dissolved organic carbon; Eh, oxidation-reduction potential, TSS: total soluble salts, TOC: total organic carbon, CEC: cation exchange capacity. Figure S4: β-nearest taxon index (βNTI) and Bray-Curtis-based Raup-Crick (RCbray) analyses of abundant and rare taxa between reservoir water and soil. Comparisons between abundant and rare taxa, between reservoir and soil with Wilcoxon test (ns: not significant, p > 0.05, * p < 0.05, ** p < 0.01, *** p < 0.001, **** p < 0.0001). Figure S5: Comparison of non-normalized topological parameters (degree, betweenness centrality, closeness centrality, and eigenvector centrality) among abundant, moderate, and rare taxa in reservoir (A) and soil (B). Statistical differences were assessed using the Kruskal-Wallis’s test and Wilcoxon rank sum test (ns: not significant, p > 0.05, * p < 0.05, ** p < 0.01, *** p < 0.001, **** p < 0.0001). Table S1: Identification and information of abundant, moderate, and rare bacterial taxa in different water layers. Description of bacterioplankton ASV datasets based on exact sequence variants. Table S2: Results of PERMANOVA test for effects of habitat (reservoir vs. soil) and taxa abundance types (abundant vs. rare) on bacterial community structure based on Bray-Curtis dissimilarity. Table S3: Pairwise PERMANOVA comparisons of bacterial community structure among groups defined by habitat (reservoir, soil) and taxa abundance type (abundant, rare), based on the bray-Curtis dissimilarity. The p-values were adjusted for multiple comparisons using the Benjamini-Hochberg method. Table S4: Dissimilarity test of abundant and rare taxa in the reservoir water by ANOISM (analysis of similarity), and PERMANOVA (permutational multivariate analysis of variance) based on Bray-Curtis dissimilarity matrix between different water layers. *p < 0.05; **p < 0.01, *** p < 0.001. Table S5: Taxonomic information of shared ASVs between reservoir_abundant and soil_abundant, reservoir_abundant and soil_rare, reservoir_rare and soil_abundant. Table S6: Environmental factors of three water layers (upper, middle, and bottom) in 27 samples, of three layers (0-20 cm, 20-40 cm, and 40-60 cm) of adjacent soil in 11samples, presented as mean ± standard deviation. Table S7: Comparison of topological properties for the empirical co-occurrence networks of bacterioplankton communities in the reservoir water and soil and their associated random networks. Table S8: Taxonomic information of keystone taxa from the networks in the reservoir water and soil. Table S9: Node level topology characteristics of abundant, moderate, and rare taxa in the bacterial networks of reservoir and soil.
Author Contributions
Conceptualization, software, writing original draft, C.Z.; funding acquisition, writing review and editing, H.L.; investigation, project administration, M.L.; data curation, writing review and editing, S.S.; methodology, formal analysis, H.X.; visualization, validation, X.Z. software, Q.Z. All authors have read and agreed to the published version of the manuscript.
Funding
This research was funded by the National Natural Science Foundation of China, grant numbers 42072288 and 42102299.
Data Availability Statement
The obtained sequences were deposited in the National Center for Biotechnology Information (NCBI) under the Bio Projects ID: PRJNA1168442 and PRJNA1302095.
Conflicts of Interest
The authors declare no conflicts of interest.
Abbreviations
The following abbreviations are used in this manuscript:
| Eh | Oxidation-reduction potential |
| TDS | Total dissolved solids |
| DOC | Dissolved organic carbon |
| TN | Total nitrogen |
| TP | Total phosphorus |
| NH4+––N | Ammonia nitrogen |
| TSS | Total soil salt |
| TOC | Total organic carbon |
| CEC | Cation exchange capacity |
| PCR | Polymerase chain reaction |
| ASV | Amplicon sequence variant |
| PCoA | Principal coordinates analysis |
| PERMANOVA | Permutational multivariate analysis of variance |
| NMDS | Non-metric multidimensional scaling |
| ANOSIM | Analysis of similarity |
| Faith’s PD | Faith’s phylogenetic diversity |
| LEfSe | Linear Discriminant Analysis Effect Size |
| CCA | Canonical correspondence analysis |
| βNTI | β-nearest taxon index |
| RCbray | Bray-Curtis-based Raup-Crick |
References
- Jin, G.Q.; Mo, Y.M.; Li, M.D.; Tang, H.W.; Qi, Y.Z.; Li, L.; Barry, D.A. Desalinization and salinization: a review of major challenges for coastal reservoirs. J. Coastal Res. 2019, 35, 664–672. [Google Scholar] [CrossRef]
- Mo, Y.M.; Jin, G.Q.; Zhang, C.M.; Xu, J.; Tang, H.W.; Shen, C.J.; Scheuermann, A.; Li, L. Combined effect of inland groundwater input and tides on flow and salinization in the coastal reservoir and adjacent aquifer. J. Hydrol. 2021, 600, 126575. [Google Scholar] [CrossRef]
- Zhang, C.; Li, H.; Li, M.; Zhang, Q.; Su, S.; Zhang, X.; Xiao, H. Salinity Gradients Override Hydraulic Connectivity in Shaping Bacterial Community Assembly and Network Stability at a Coastal Aquifer–Reservoir Interface. Microorganisms 2025, 13, 1611. [Google Scholar] [CrossRef] [PubMed]
- Mao, D.; Wang, Y.; Guo, Q.; Li, D.; Liu, S.; Meng, J.; Hu, L. Heterogeneous reservoir seepage characterized by geophysical, hydrochemical, and hydrologic methods. Geophysics 2024, 89, B401–B413. [Google Scholar] [CrossRef]
- Newton, R.J.; Jones, S.E.; Eiler, A.; McMahon, K.D.; Bertilsson, S. A Guide to the Natural History of Freshwater Lake Bacteria. Microbiol. Mol. Biol. Rev 2011, 75, 14–49. [Google Scholar] [CrossRef] [PubMed]
- Ye, Z.; Wang, J.; Li, J.; Liu, G.; Dong, Q.g.; Zou, Y.; Chau, H.W.; Zhang, C. Different roles of core and noncore bacterial taxa in maintaining soil multinutrient cycling and microbial network stability in arid fertigation agroecosystems. J. Appl. Ecol 2022, 59, 2154–2165. [Google Scholar] [CrossRef]
- Zhu, M.; Qi, X.; Yuan, Y.; Zhou, H.; Rong, X.; Dang, Z.; Yin, H. Deciphering the distinct successional patterns and potential roles of abundant and rare microbial taxa of urban riverine plastisphere. J Hazard Mater 2023, 450, 131080. [Google Scholar] [CrossRef]
- Nyirabuhoro, P.; Liu, M.; Xiao, P.; Liu, L.; Yu, Z.; Wang, L.; Yang, J. Seasonal variability of conditionally rare taxa in the water column bacterioplankton community of subtropical reservoirs in China. Microb. Ecol. 2020, 80, 14–26. [Google Scholar] [CrossRef]
- Nyirabuhoro, P.; Gao, X.; Ndayishimiye, J.C.; Xiao, P.; Mo, Y.; Ganjidoust, H.; Yang, J. Responses of abundant and rare bacterioplankton to temporal change in a subtropical urban reservoir. FEMS Microbiol. Ecol. 2021, 97, fiab036. [Google Scholar] [CrossRef]
- Dang, C.; Wang, J.; He, Y.; Yang, S.; Chen, Y.; Liu, T.; Fu, J.; Chen, Q.; Ni, J. Rare biosphere regulates the planktonic and sedimentary bacteria by disparate ecological processes in a large source water reservoir. Water Res. 2022, 216, 118296. [Google Scholar] [CrossRef]
- Xue, Y.Y.; Chen, H.H.; Yang, J.R.; Liu, M.; Huang, B.Q.; Yang, J. Distinct patterns and processes of abundant and rare eukaryotic plankton communities following a reservoir cyanobacterial bloom. ISME J. 2018, 12, 2263–2277. [Google Scholar] [CrossRef]
- Zhang, Z.; Lu, Y.; Wei, G.; Jiao, S. Rare species-driven diversity–ecosystem multifunctionality relationships are promoted by stochastic community assembly. MBio. 2022, 13, e00449-00422. [Google Scholar] [CrossRef]
- Lennon, J.T.; Jones, S.E. Microbial seed banks: the ecological and evolutionary implications of dormancy. Nat. Rev. Microbiol. 2011, 9, 119–130. [Google Scholar] [CrossRef]
- Debroas, D.; Hugoni, M.; Domaizon, I. Evidence for an active rare biosphere within freshwater protists community. Mol. Ecol. 2015, 24, 1236–1247. [Google Scholar] [CrossRef] [PubMed]
- Ma, L.; Niu, W.; Li, G.; Du, Y.; Sun, J.; Zhang, Q.; Siddique, K.H.M. Crucial role of rare taxa in preserving bacterial community stability. Land Degrad. Dev. 2023, 35, 1397–1410. [Google Scholar] [CrossRef]
- Dini-Andreote, F.; Stegen, J.C.; Van Elsas, J.D.; Salles, J.F. Disentangling mechanisms that mediate the balance between stochastic and deterministic processes in microbial succession. Proc. Natl. Acad. Sci. 2015, 112, E1326–E1332. [Google Scholar] [CrossRef] [PubMed]
- Zhou, J.Z.; Ning, D.L. Stochastic community assembly: Does it matter in microbial ecology? Microbiol. Mol. Biol. Rev 2017, 81, e00002-00017. [Google Scholar] [CrossRef]
- Zhao, J.; Hein, T.; Yuan, Q.; Shu, W.; Huang, X.; Zhang, X.; Wang, L. Co-occurrence patterns and assembly processes of abundant and rare bacterioplankton in plain river network areas of eastern China. Ecol. Indic. 2023, 150, 110204. [Google Scholar] [CrossRef]
- Jiang, R.; Wang, D.; Jia, S.; Li, Q.; Liu, S.; Zhang, X.X. Dynamics of bacterioplankton communities in the estuary areas of the Taihu Lake: Distinct ecological mechanisms of abundant and rare communities. Environ. Res. 2024, 242, 117782. [Google Scholar] [CrossRef]
- Yang, Y.; Cheng, K.; Li, K.; Jin, Y.; He, X. Deciphering the diversity patterns and community assembly of rare and abundant bacterial communities in a wetland system. Sci. Total Environ. 2022, 838, 156334. [Google Scholar] [CrossRef]
- Gao, G.F.; Peng, D.; Tripathi, B.M.; Zhang, Y.H.; Chu, H.Y. Distinct community assembly processes of abundant and rare soil bacteria in coastal wetlands along an inundation gradient. mSystems 2020, 5, e01150-01120. [Google Scholar] [CrossRef]
- Liu, C.; Li, X.; Mansoldo, F.R.P.; An, J.; Kou, Y.; Zhang, X.; Wang, J.; Zeng, J.; Vermelho, A.B.; Yao, M. Microbial habitat specificity largely affects microbial co-occurrence patterns and functional profiles in wetland soils. Geoderma 2022, 418, 115866. [Google Scholar] [CrossRef]
- Yang, Y.; Chen, C.; Grossart, H.P.; Liu, Y. Community assembly characteristics of abundant and rare bacterial taxa in water, sediment and riparian soil of Wujiang river, China. Ecotoxicol. Environ. Saf. 2025, 297, 118262. [Google Scholar] [CrossRef]
- Zhang, S.; Li, K.; Hu, J.; Wang, F.; Chen, D.; Zhang, Z.; Li, T.; Li, L.; Tao, J.; Liu, D.; et al. Distinct assembly mechanisms of microbial sub-communities with different rarity along the Nu River. J Soils Sediments 2022, 22, 1530–1545. [Google Scholar] [CrossRef]
- Ma, K.; Ren, Z.; Ma, J.; Chen, N.; Liu, J. Differential patterns and assembly processes of bacterial communities from distinct microhabitats in a subtropical estuary. Front. Mar. Sci. 2022, 9, 1039387. [Google Scholar] [CrossRef]
- Morriën, E.; Hannula, S.E.; Snoek, L.B.; Helmsing, N.R.; Zweers, H.; De Hollander, M.; Soto, R.L.; Bouffaud, M.-L.; Buée, M.; Dimmers, W. Soil networks become more connected and take up more carbon as nature restoration progresses. Nat. Commun. 2017, 8, 14349. [Google Scholar] [CrossRef] [PubMed]
- He, Q.; Wang, S.; Hou, W.; Feng, K.; Li, F.; Hai, W.; Zhang, Y.; Sun, Y.; Deng, Y. Temperature and microbial interactions drive the deterministic assembly processes in sediments of hot springs. Sci. Total Environ. 2021, 772, 145465. [Google Scholar] [CrossRef] [PubMed]
- Liang, H.; Huang, J.; Xia, Y.; Yang, Y.; Yu, Y.; Zhou, K.; Lin, L.; Li, X.; Li, B. Spatial distribution and assembly processes of bacterial communities in riverine and coastal ecosystems of a rapidly urbanizing megacity in China. Sci Total Environ 2024, 934, 173298. [Google Scholar] [CrossRef] [PubMed]
- Han, Z.; Xiao, M.; Yue, F.; Yi, Y.; Mostofa, K. Seasonal Variations of Dissolved Organic Matter by Fluorescent Analysis in a Typical River Catchment in Northern China. Water 2021, 13, 494. [Google Scholar] [CrossRef]
- Page, A.L.; Miller, R.H.; Keeney, D.R. Methods of soil Analysis, Part 2, Chemical and Microbiological Properties; Americal Society of Agronomy, Inc.: Madison, Wisconsin, USA, 1982. [Google Scholar]
- Jackson, M.L. Soil Chemical Analysis; Pretice-Hall, Inc.: Englewood Cliffs, NJ, 1958. [Google Scholar]
- Soil Determination of Ammonium, Nitrite, and Nitrate Nitrogen Potassium Chloride Solution Extraction-Spectrophotometric Methods. 2012, HJ 634—2012.
- Soil Determination of Cation Exchange Capacity (CEC) Hexaamminecobalt Trichloride Solution Extraction-Spectrophotometric Method. 2017, HJ 889-2017.
- Nossa, C.W.; Oberdorf, W.E.; Yang, L.; Aas, J.A.; Paster, B.J.; DeSantis, T.Z.; Brodie, E.L.; Malamud, D.; Poles, M.A.; Pei, Z. Design of 16S rRNA gene primers for 454 pyrosequencing of the human foregut microbiome. World J. Gastroenterol. 2010, 16, 4135–4144. [Google Scholar] [CrossRef]
- Liu, Z.; DeSantis, T.Z.; Andersen, G.L.; Knight, R. Accurate taxonomy assignments from 16S rRNA sequences produced by highly parallel pyrosequencers. Nucleic Acids Research 2008, 36, e120. [Google Scholar] [CrossRef]
- Callahan, B.J.; McMurdie, P.J.; Rosen, M.J.; Han, A.W.; Johnson, A.J.A.; Holmes, S.P. DADA2: High-resolution sample inference from Illumina amplicon data. Nature Methods 2016, 13, 581–583. [Google Scholar] [CrossRef] [PubMed]
- Quast, C.; Pruesse, E.; Yilmaz, P.; Gerken, J.; Schweer, T.; Yarza, P.; Peplies, J.; Glöckner, F.O. The SILVA ribosomal RNA gene database project: improved data processing and web-based tools. Nucleic Acids Research 2013, 41, 590–596. [Google Scholar] [CrossRef] [PubMed]
- Li, C.; Jin, L.; Zhang, C.; Li, S.; Zhou, T.; Hua, Z.; Wang, L.; Ji, S.; Wang, Y.; Gan, Y.; et al. Destabilized microbial networks with distinct performances of abundant and rare biospheres in maintaining networks under increasing salinity stress. iMeta 2023, 2, e79. [Google Scholar] [CrossRef] [PubMed]
- Chen, C.; Li, P.; Yin, M.; Wang, J.; Sun, Y.; Ju, W.; Liu, L.; Li, Z.H. Deciphering characterization of seasonal variations in microbial communities of marine ranching: Diversity, co-occurrence network patterns, and assembly processes. Mar. Pollut. Bull. 2023, 197, 115739. [Google Scholar] [CrossRef] [PubMed]
- Kembel, S.W.; Cowan, P.D.; Helmus, M.R.; Cornwell, W.K.; Morlon, H.; Ackerly, D.D.; Blomberg, S.P.; Webb, C.O. Picante: R tools for integrating phylogenies and ecology. Bioinformatics 2010, 26, 1463–1464. [Google Scholar] [CrossRef]
- Shen, C.; Gunina, A.; Luo, Y.; Wang, J.; He, J.-Z.; Kuzyakov, Y.; Hemp, A.; Classen, A.T.; Ge, Y. Contrasting patterns and drivers of soil bacterial and fungal diversity across a mountain gradient. Environ. Microbiol. 2020, 22, 3287–3301. [Google Scholar] [CrossRef]
- Segata, N.; Izard, J.; Waldron, L.; Gevers, D.; Miropolsky, L.; Garrett, W.S.; Huttenhower, C. Metagenomic biomarker discovery and explanation. Genome Biol. 2011, 12, R60. [Google Scholar] [CrossRef]
- Stegen, J.C.; Lin, X.; Fredrickson, J.K.; Chen, X.; Kennedy, D.W.; Murray, C.J.; Rockhold, M.L.; Konopka, A. Quantifying community assembly processes and identifying features that impose them. ISME J. 2013, 7, 2069–2079. [Google Scholar] [CrossRef]
- Wang, L.; Lian, C.; Wan, W.; Qiu, Z.; Luo, X.; Huang, Q.; Deng, Y.; Zhang, T.; Yu, K. Salinity-triggered homogeneous selection constrains the microbial function and stability in lakes. Appl. Microbiol Biotechnol. 2023, 107, 6591–6605. [Google Scholar] [CrossRef]
- Levins, R. Evolution in changing environments: Some theoretical explorations; Princeton University Press: Princeton, 1968. [Google Scholar]
- Benjamini, Y.; Hochberg, Y. Controlling the false discovery rate: A practical and powerful approach to multiple testing. J. R. Stat. Soc. Ser. B Methodol. 1995, 57, 289–300. [Google Scholar] [CrossRef]
- Olesen, J.M.; Bascompte, J.; Dupont, Y.L.; Jordano, P. The modularity of pollination networks. Proc. Natl. Acad. Sci. 2007, 104, 19891–19896. [Google Scholar] [CrossRef]
- Guimerà, R.; Amaral, L.A.N. Functional cartography of complex metabolic networks. Nature 2005, 433, 895–900. [Google Scholar] [CrossRef] [PubMed]
- Strogatz, S.H. Exploring complex networks. Nature 2001, 410, 268–276. [Google Scholar] [CrossRef] [PubMed]
- Röttjers, L.; Faust, K. Can we predict keystones? Nat. Rev. Microbiol. 2019, 17, 193. [Google Scholar] [CrossRef]
- Shi, S.; Nuccio, E.E.; Shi, Z.J.; He, Z.; Zhou, J.; Firestone, M.K. The interconnected rhizosphere: high network complexity dominates rhizosphere assemblages. Ecol. Lett. 2016, 19, 926–936. [Google Scholar] [CrossRef]
- Zhang, L.; Delgado-Baquerizo, M.; Shi, Y.; Liu, X.; Yang, Y.; Chu, H. Co-existing water and sediment bacteria are driven by contrasting environmental factors across glacier-fed aquatic systems. Water Res 2021, 198, 117139. [Google Scholar] [CrossRef]
- Huang, X.; He, Z.; Wang, Y.; Wang, F.; Zheng, Z.; Zuo, Y.; Cao, Y.; Yao, X.; She, Z.; Ge, Y.; et al. Assessment of soil microbial communities and diversity in typical coastal wetlands along a succession gradient: Implications for reconstructing the long-term evolution of coastal wetlands. Environ. Technol. Innov. 2025, 39, 104263. [Google Scholar] [CrossRef]
- Mujakić, I.; Cabello-Yeves, P.J.; Villena-Alemany, C.; Piwosz, K.; Rodriguez-Valera, F.; Picazo, A.; Camacho, A.; Koblížek, M. Multi-environment ecogenomics analysis of the cosmopolitan phylum Gemmatimonadota. Microbiol. Spectr. 2023, 11. [Google Scholar] [CrossRef]
- Mujakić, I.; Piwosz, K.; Koblížek, M. Phylum Gemmatimonadota and Its Role in the Environment. Microorganisms 2022, 10, 151. [Google Scholar] [CrossRef]
- La, W.; Han, X.; Liu, C.Q.; Ding, H.; Liu, M.; Sun, F.; Li, S.; Lang, Y. Sulfate concentrations affect sulfate reduction pathways and methane consumption in coastal wetlands. Water Res 2022, 217, 118441. [Google Scholar] [CrossRef] [PubMed]
- Wang, X.; Yue, F.; Li, S.; Li, X.; Lang, Y.; Hu, J.; Ding, H.; Liu, C. Spatial variations in water chemical components in a coastal zone of northern China: Insights from environmental isotopes. J. Hydrol. 2022, 612, 128054. [Google Scholar] [CrossRef]
- Zhang, J.; Hao, Q.; Li, Q.; Zhao, X.; Fu, X.; Wang, W.; He, D.; Li, Y.; Zhang, Z.; Zhang, X.; et al. Source identification of sedimentary organic carbon in coastal wetlands of the western Bohai Sea. Sci Total Environ 2024, 913, 169282. [Google Scholar] [CrossRef]
- Mo, Y.Y.; Peng, F.; Gao, X.; Xiao, P.; Logares, R.; Jeppesen, E.; Ren, K.; Xue, Y.; Yang, J. Low shifts in salinity determined assembly processes and network stability of microeukaryotic plankton communities in a subtropical urban reservoir. Microbiome 2021, 9, 128. [Google Scholar] [CrossRef]
- Zhong, Z.P.; Liu, Y.; Miao, L.L.; Wang, F.; Chu, L.M.; Wang, J.L.; Liu, Z.P. Prokaryotic community structure driven by salinity and ionic concentrations in Plateau Lakes of the Tibetan Plateau. Appl. Environ. Microbiol. 2016, 82, 1846–1858. [Google Scholar] [CrossRef]
- Li, Y.; Kang, E.; Song, B.; Wang, J.; Zhang, X.; Wang, J.; Li, M.; Yan, L.; Yan, Z.; Zhang, K.; et al. Soil salinity and nutrients availability drive patterns in bacterial community and diversity along succession gradient in the Yellow River Delta. Estuar. Coast. Shelf Sci. 2021, 262, 107621. [Google Scholar] [CrossRef]
- Rath, K.M.; Fierer, N.; Murphy, D.V.; Rousk, J. Linking bacterial community composition to soil salinity along environmental gradients. ISME J. 2019, 13, 836–846. [Google Scholar] [CrossRef]
- Xu, J.; Chen, L.; Zhou, T.; Zhang, C.; Zhang, J.; Zhao, B. Salinity-driven differentiation of bacterial and fungal communities in coastal wetlands: Contrasting assembly processes and spatial dynamics. Environ Res 2025, 279, 121895. [Google Scholar] [CrossRef]
- Zhang, G.; Bai, J.; Tebbe, C.C.; Zhao, Q.; Jia, J.; Wang, W.; Wang, X.; Yu, L. Salinity controls soil microbial community structure and function in coastal estuarine wetlands. Environ. Microbiol. 2021, 23, 1020–1037. [Google Scholar] [CrossRef] [PubMed]
- Wang, Y.; Wang, J.; Zou, X.; Qu, M.; Li, J. Groundwater depth regulates assembly processes of abundant and rare bacterial communities across arid inland river basin. J Environ Manage 2022, 319, 115767. [Google Scholar] [CrossRef]
- Konopka, A.; Lindemann, S.; Fredrickson, J. Dynamics in microbial communities: unraveling mechanisms to identify principles. ISME J. 2015, 9, 1488–1495. [Google Scholar] [CrossRef]
- Faust, K.; Raes, J. Microbial interactions: from networks to models. Nat. Rev. Microbiol. 2012, 10, 538–550. [Google Scholar] [CrossRef] [PubMed]
- Newman, M.E.J. Modularity and community structure in networks. Proc. Natl. Acad. Sci. 2006, 103, 8577–8582. [Google Scholar] [CrossRef] [PubMed]
- Hu, X.; Gu, H.; Wang, Y.; Liu, J.; Yu, Z.; Li, Y.; Jin, J.; Liu, X.; Dai, Q.; Wang, G. Succession of soil bacterial communities and network patterns in response to conventional and biodegradable microplastics: A microcosmic study in Mollisol. J. Hazard. Mater. 2022, 436, 129218. [Google Scholar] [CrossRef]
- Lu, L.; Tang, Q.; Li, H.; Li, Z. Damming river shapes distinct patterns and processes of planktonic bacterial and microeukaryotic communities. Environ. Microbiol. 2022, 24, 1760–1774. [Google Scholar] [CrossRef] [PubMed]
- Poudel, R.; Jumpponen, A.; Schlatter, D.C.; Paulitz, T.; Gardener, B.M.; Kinkel, L.L.; Garrett, K. Microbiome networks: a systems framework for identifying candidate microbial assemblages for disease management. Phytopathology 2016, 106, 1083–1096. [Google Scholar] [CrossRef]
- Fan, K.; Weisenhorn, P.; Gilbert, J.A.; Shi, Y.; Bai, Y.; Chu, H. Soil pH correlates with the co-occurrence and assemblage process of diazotrophic communities in rhizosphere and bulk soils of wheat fields. Soil Biol. Biochem. 2018, 121, 185–192. [Google Scholar] [CrossRef]
Figure 1.
Map of sampling locations in the reservoir and adjacent soil. Red circles denote reservoir sites; blue triangles denote soil sites.
Figure 1.
Map of sampling locations in the reservoir and adjacent soil. Red circles denote reservoir sites; blue triangles denote soil sites.
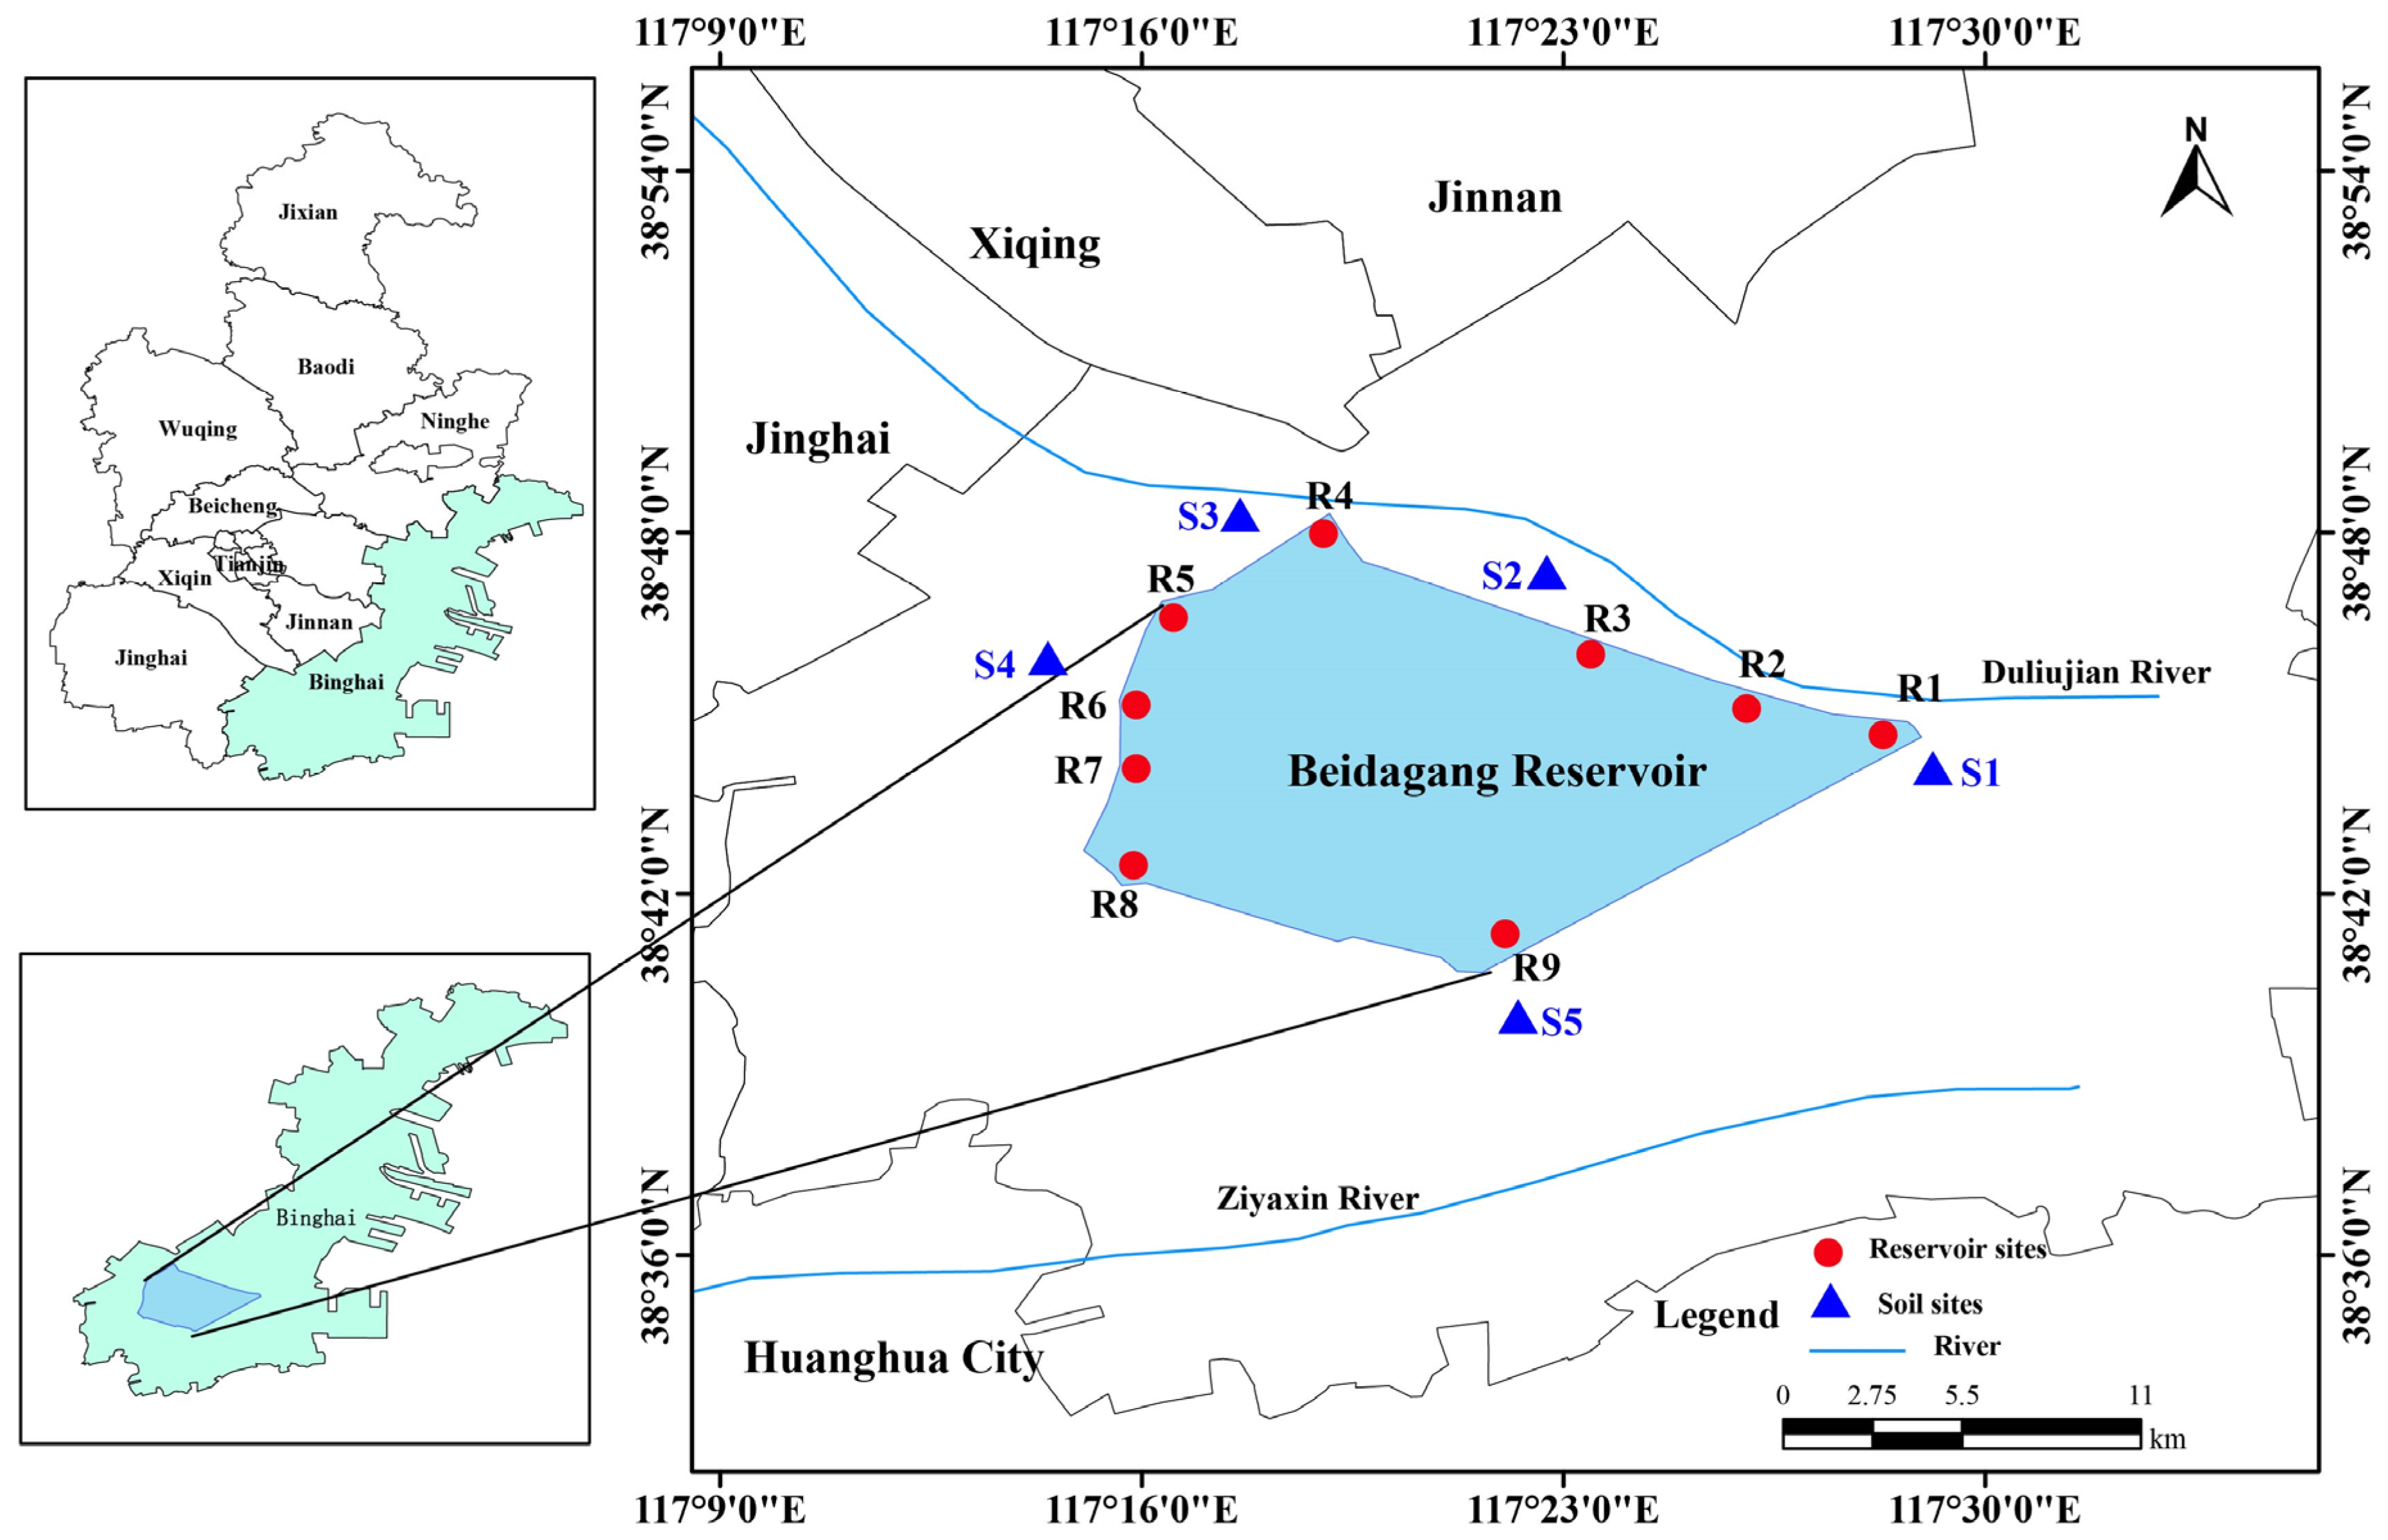
Figure 2.
(A, B) Principal coordinates analysis (PCoA) based on Bray–Curtis dissimilarity for four groups defined by habitat (reservoir and soil) and bacterial taxa abundance (abundant and rare) (A), and for abundant and rare taxa within each habitat (B). PERMANOVA results (Adonis) indicated no significant difference. (C, D) Non-metric multidimensional scaling (NMDS) analysis based on Bray-Curtis distances for abundant and rare bacterial taxa in the reservoir across water layers (C) and in the adjacent soil across different layers (D). Community dissimilarity among layers was assessed using analysis of similarity (ANOSIM). Significance levels: *p < 0.05; **p < 0.01.
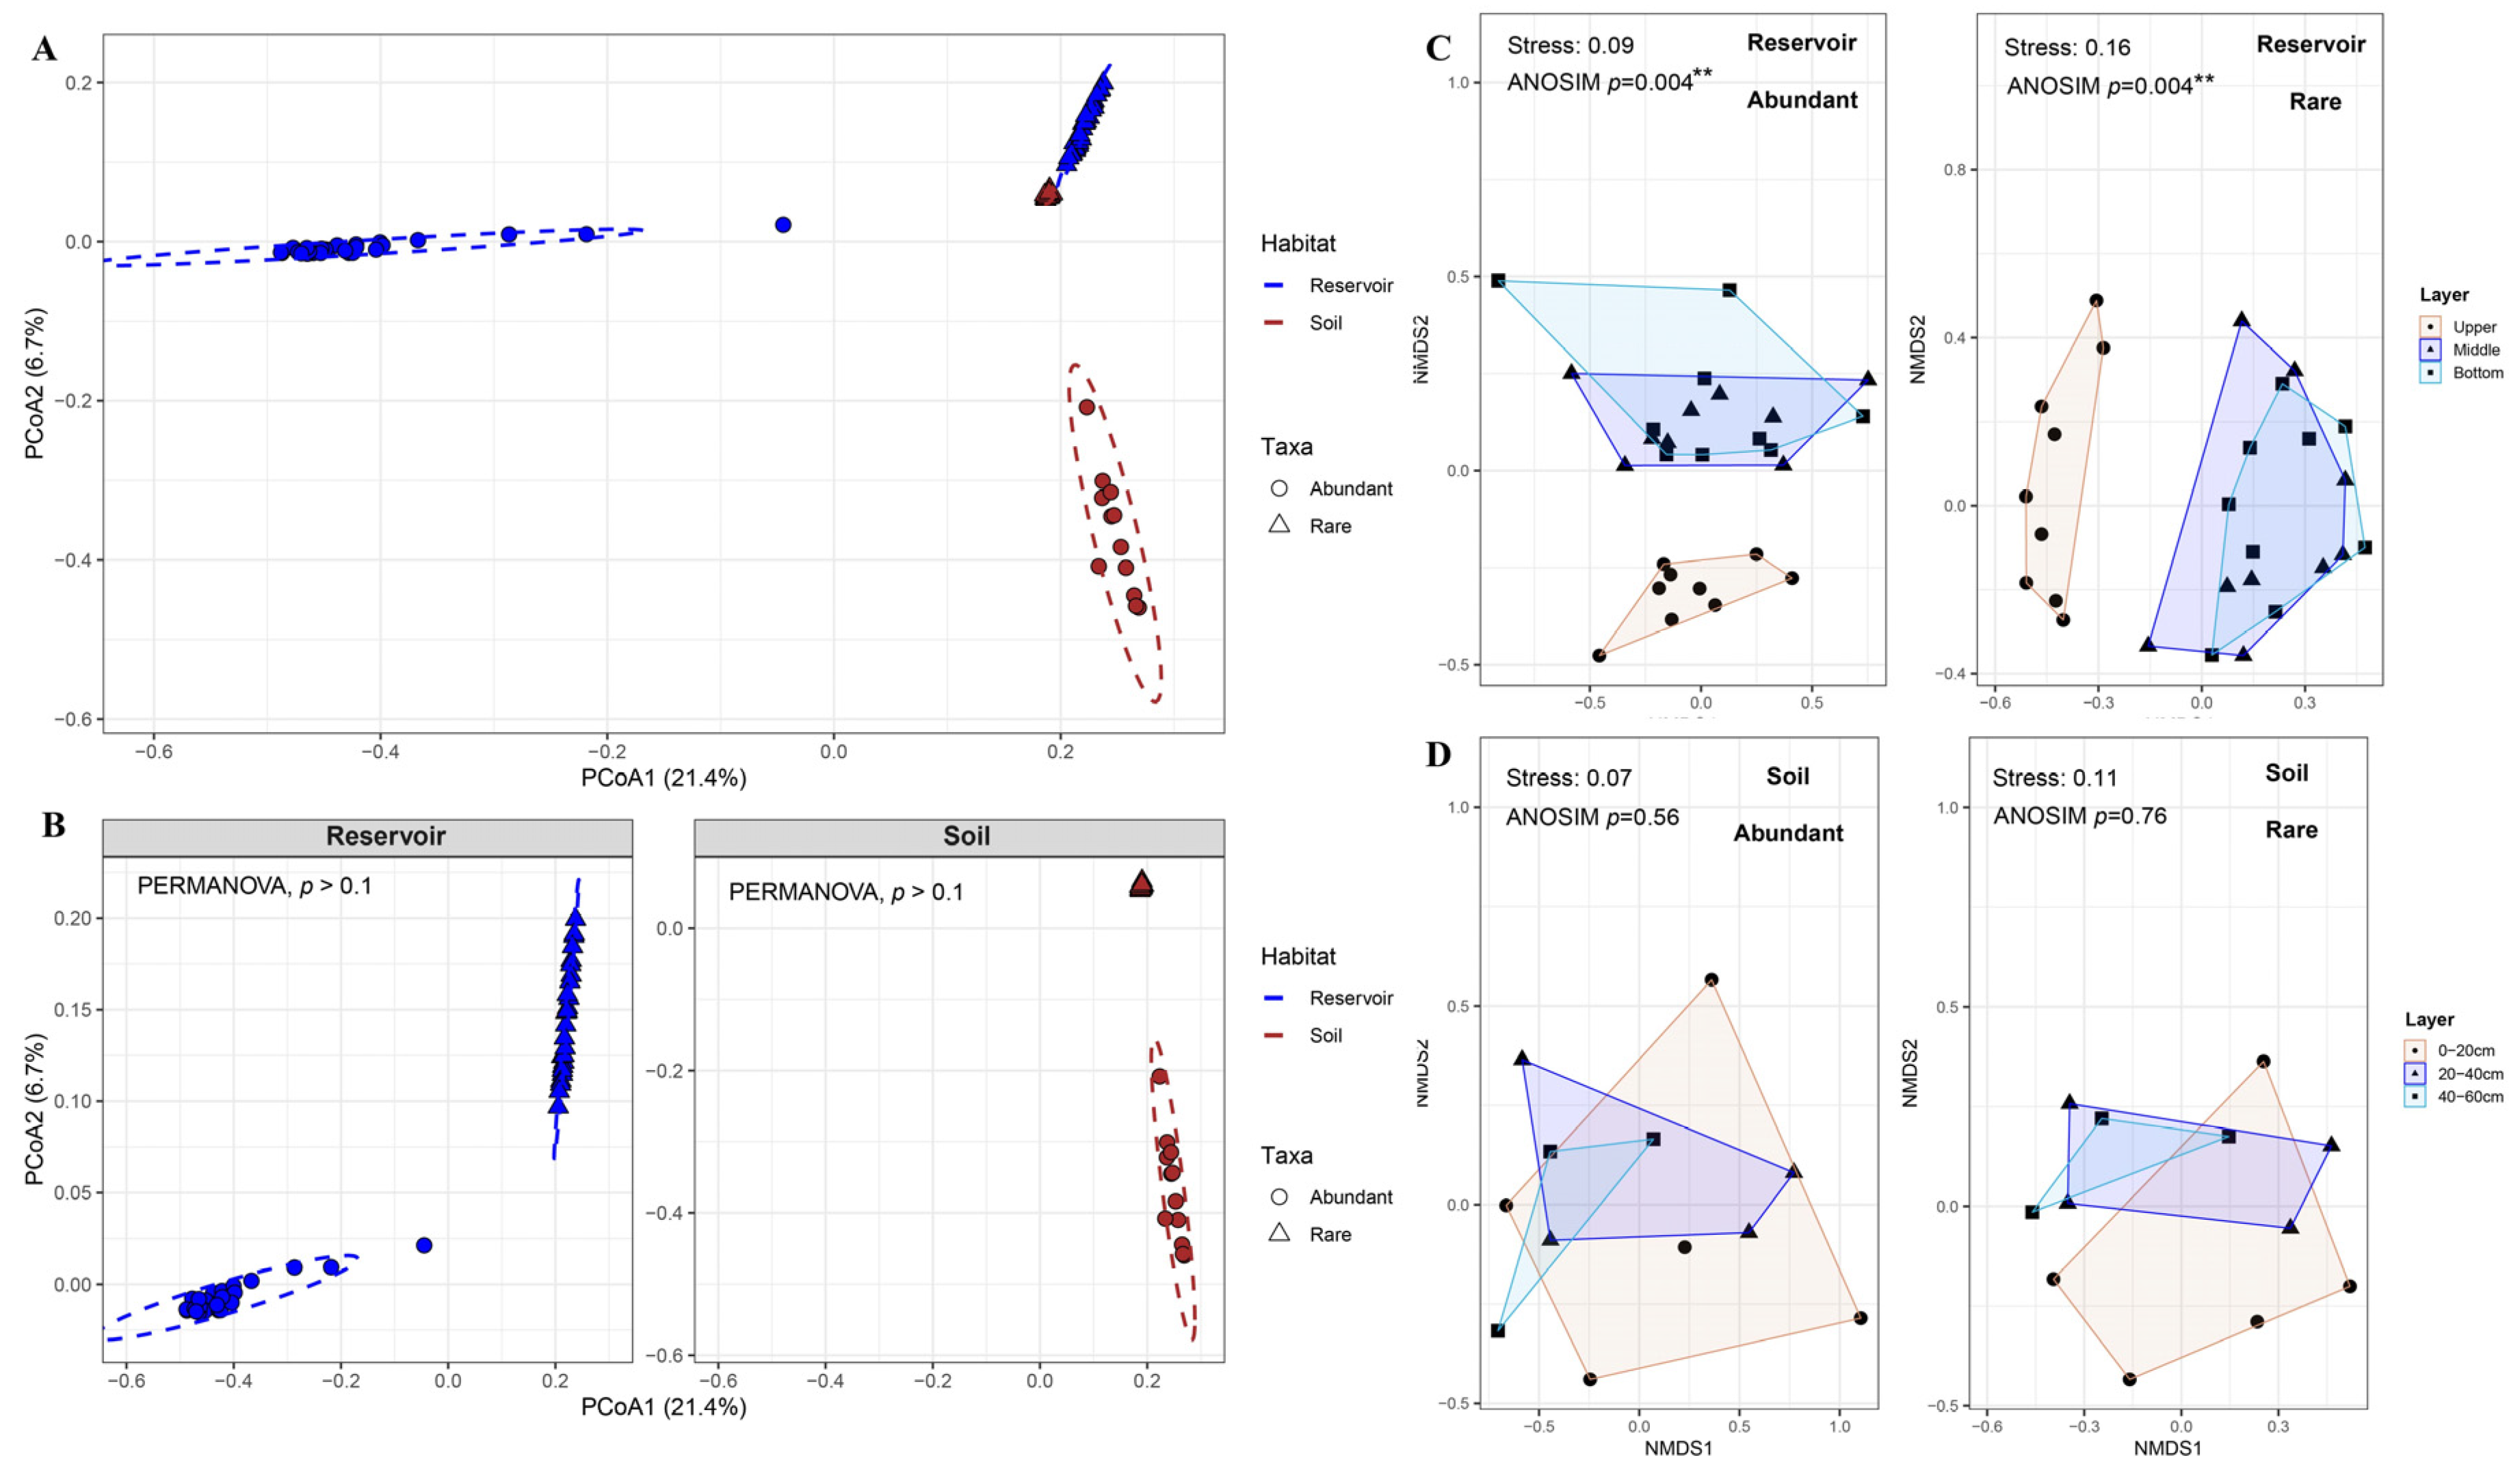
Figure 3.
Differences in bacterial diversity of abundant and rare taxa in the upper layer and deep layer of reservoir, and adjacent soils. (A-C) Alpha diversity indices: observed richness, Shannon–Wiener index and Faith’s PD. (D-F) Beta diversity metrics: Bray–Curtis dissimilarity, turnover component, and nestedness fraction. Statistical significance was assessed using the Wilcoxon rank sum test for pairwise comparisons between abundant and rare taxa, and the Kruskal-Wallis test for comparison among the upper and deep reservoir layers and soil. Significance levels between taxa are indicated as ns (not significant), * p < 0.05, ** p < 0.01, and *** p < 0.001. Significance levels among habitats are indicated by letters (a, b, c), with different letters denoting significance at p < 0.05.
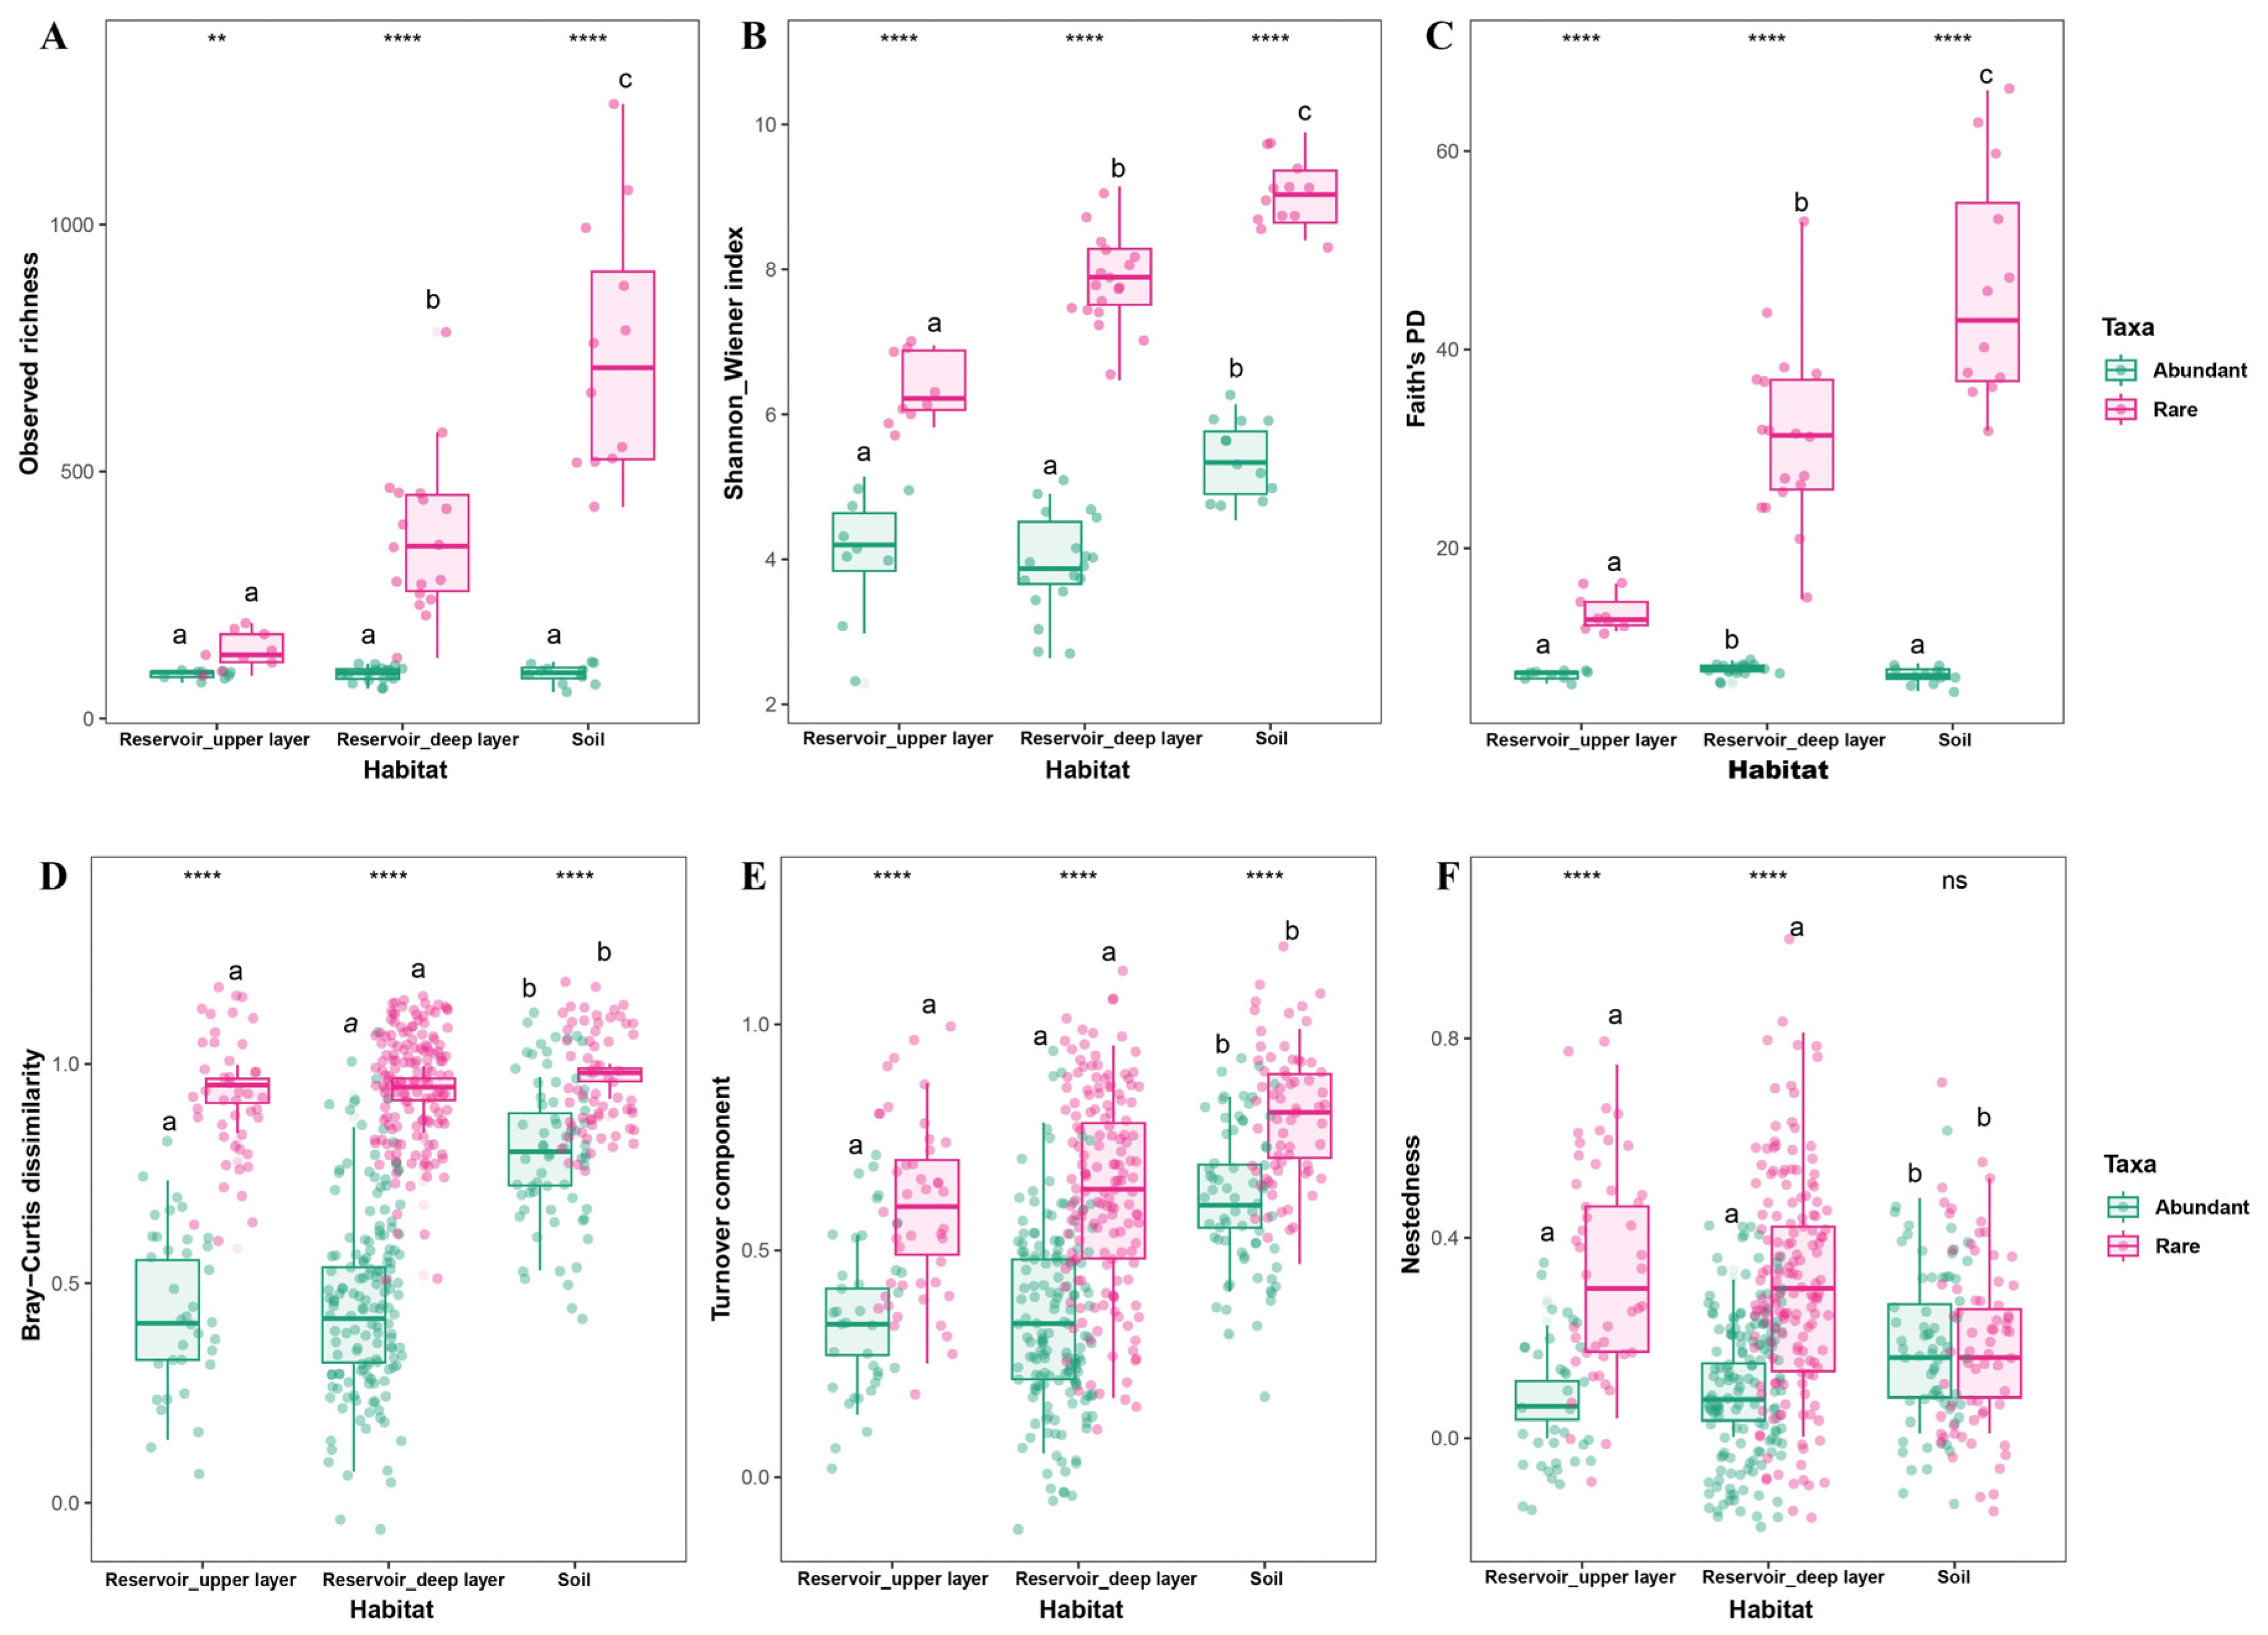
Figure 4.
(A) Phylum-level composition of the top 10 abundant and rare bacterial taxa in the upper reservoir, deep reservoir, and adjacent soil. (B) Twenty-six biomarkers of four groups were identified with linear discriminant analysis (LDA) scores greater than 4.5, with their mean relative abundances (bars) ± standard error of the mean (error bars) (p < 0.05). (C–D) Venn and upset diagrams showing shared and unique ASVs: (B) between reservoir and adjacent soil; (C) among four groups defined by habitat (reservoir and soil) and taxa (abundant and rare); (D) among six groups defined by habitat (upper reservoir, deep reservoir and soil) and taxa.
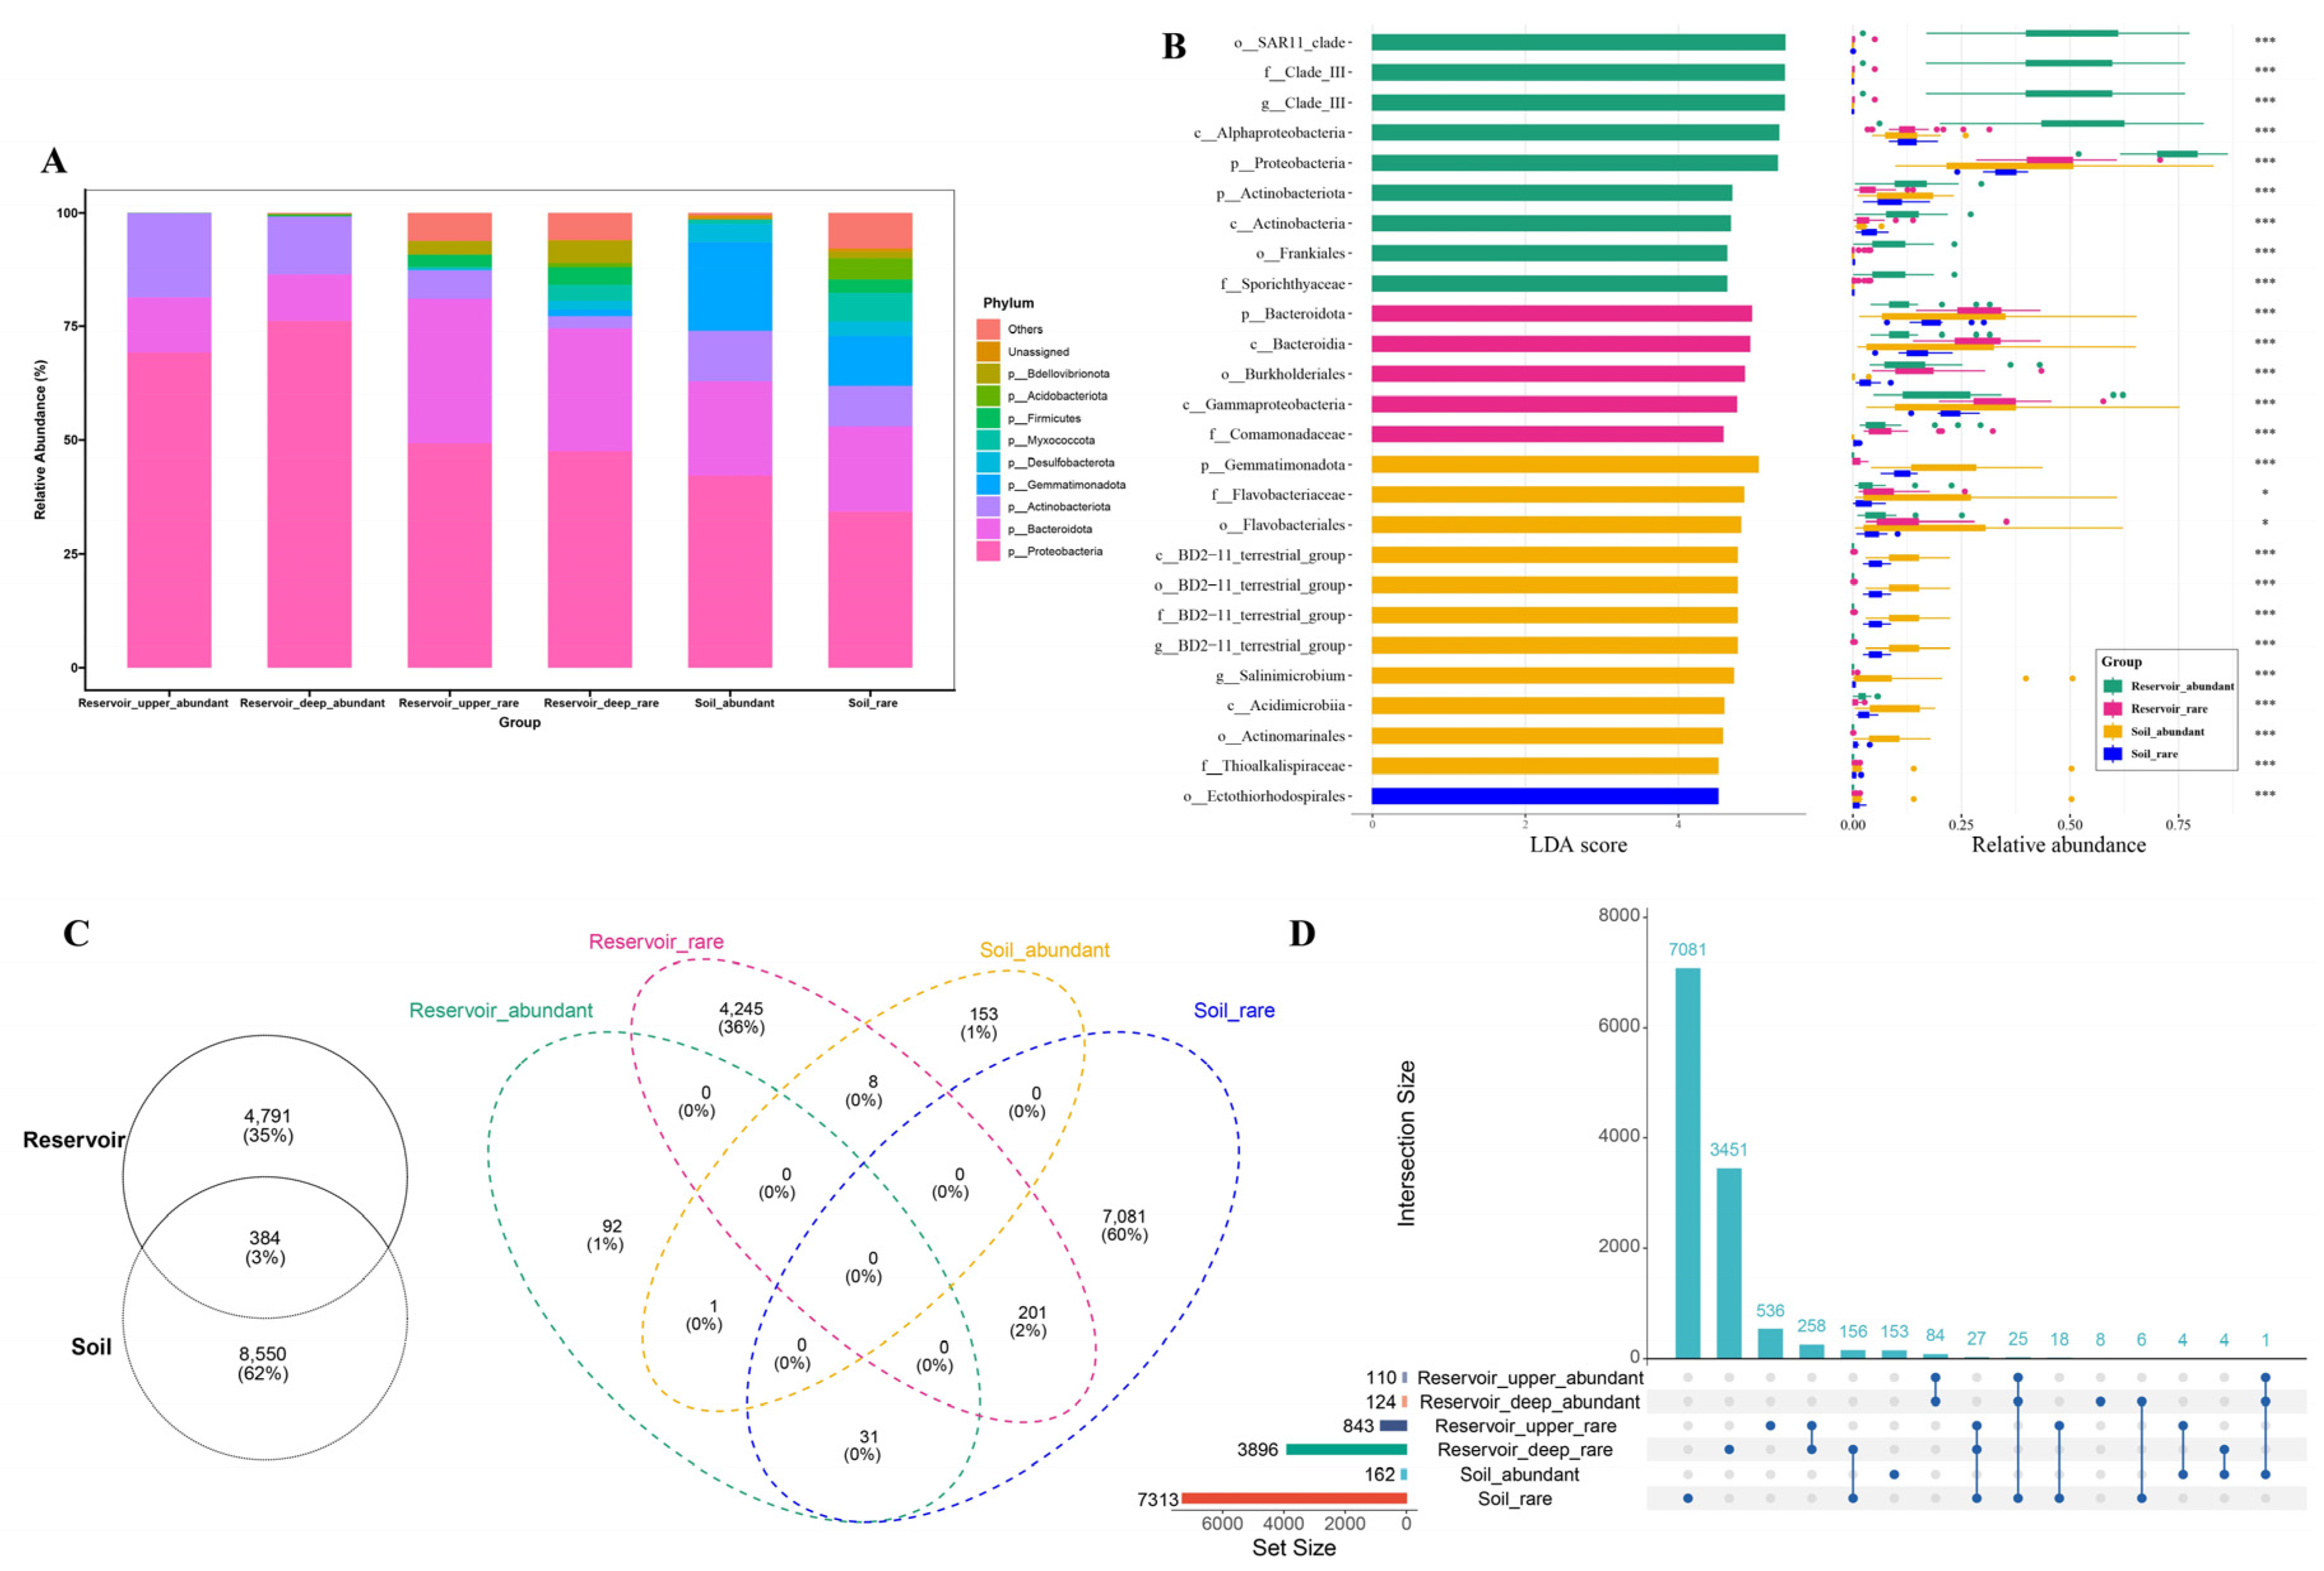
Figure 5.
Relationships between different taxa bacterial community structure and environmental variables in the reservoir water and adjacent soil. (A, B) Mantel test examines relationships between bacterial taxa and environmental variables. Pairwise comparisons of environmental factors are shown at the top right, with color gradients representing Spearman’s correlation coefficients. Line width indicates the Mantel r statistic, and line color denotes significance based on 999 permutations. (C-F) Canonical correspondence analysis (CCA) shows the environmental variables influencing abundant and rare bacterial communities in the reservoir (C, D), and adjacent soil (E, F). Statistical significances were determined by permutation tests. Significance levels: * p < 0.05, ** p < 0.01, and *** p < 0.001.
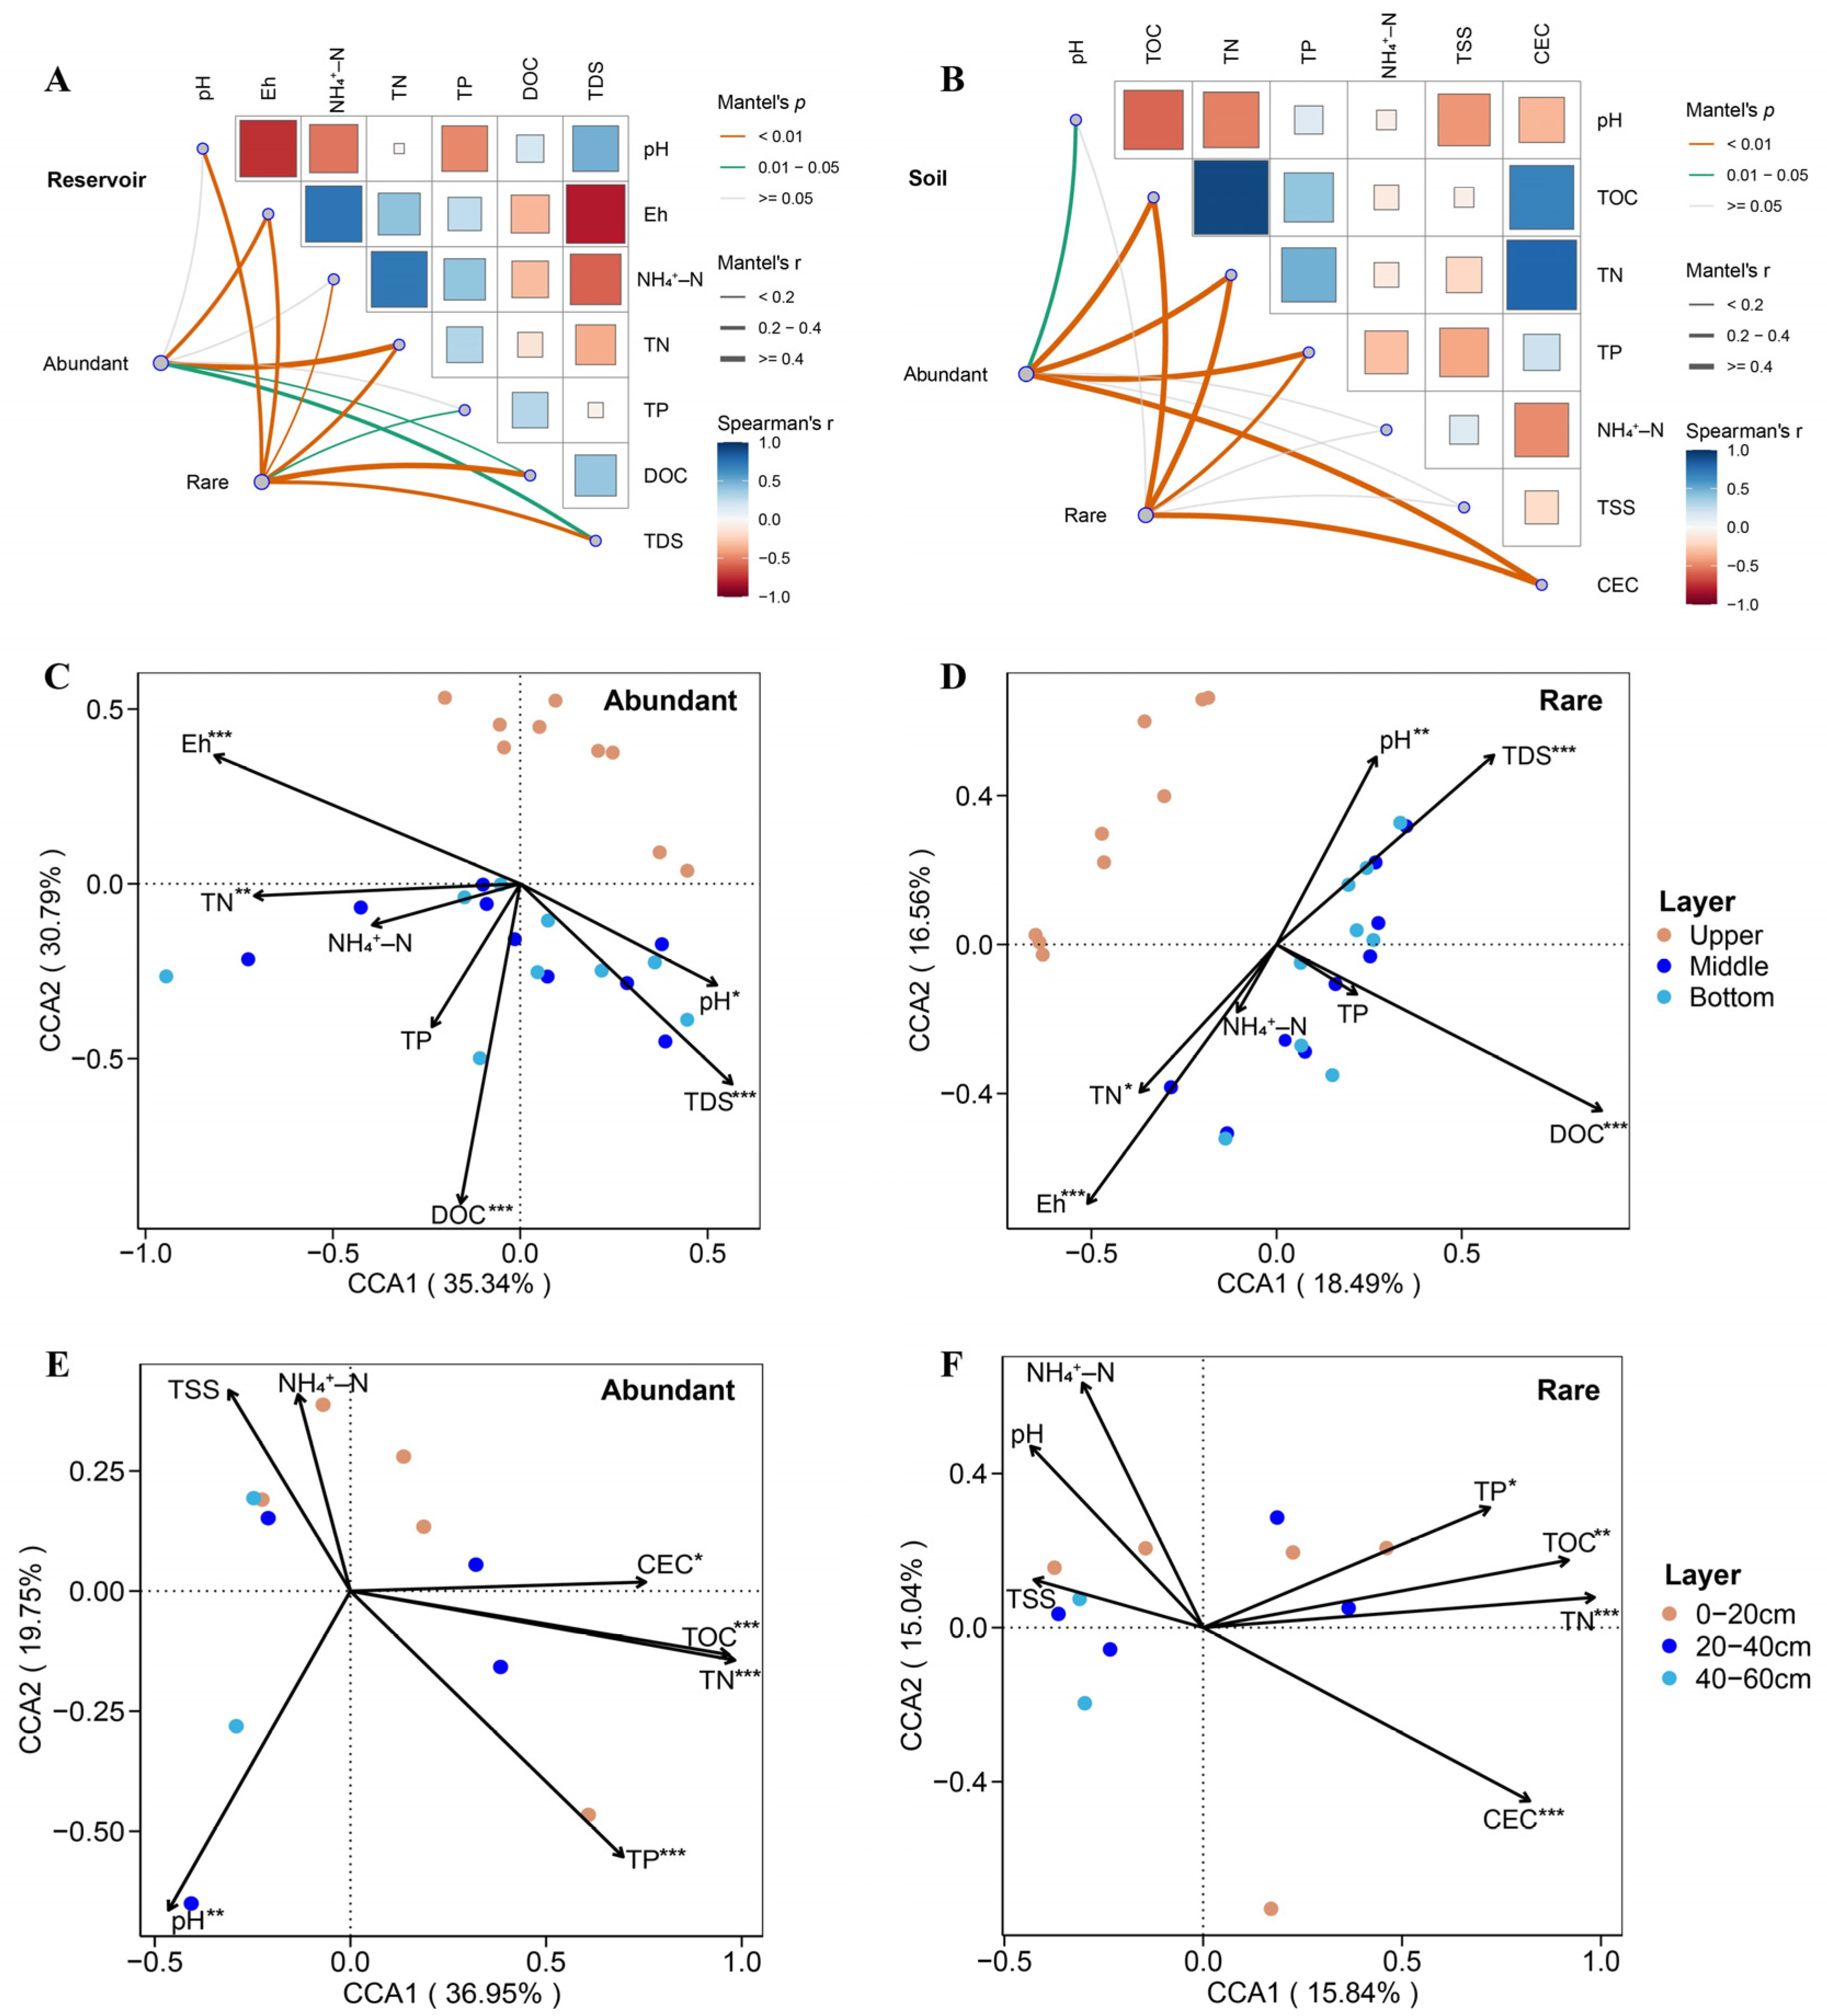
Figure 6.
(A, B) Ecological assembly processes of abundant and rare taxa were assessed using a quantitative ecological framework based on RCBray and βNTI null models in the reservoir (A) and the adjacent soil (B). (C) Habitat niche breadth (Levins) of abundant and rare taxa in the reservoir and adjacent soil. Statistical comparisons between abundant and rare taxa, between reservoir and soil were conducted using the Wilcoxon test (ns: not significant, p > 0.05, **p < 0.01, ***p < 0.001, ****p < 0.0001). (D, E) Relationship between βNTI and Bray-Curtis dissimilarity in abundant and rare taxa for the reservoir (D) and adjacent soil (E). Solid lines represent least-squares linear fits, R2 indicates the coefficient of determination for the linear regression, and p denotes the significant level.
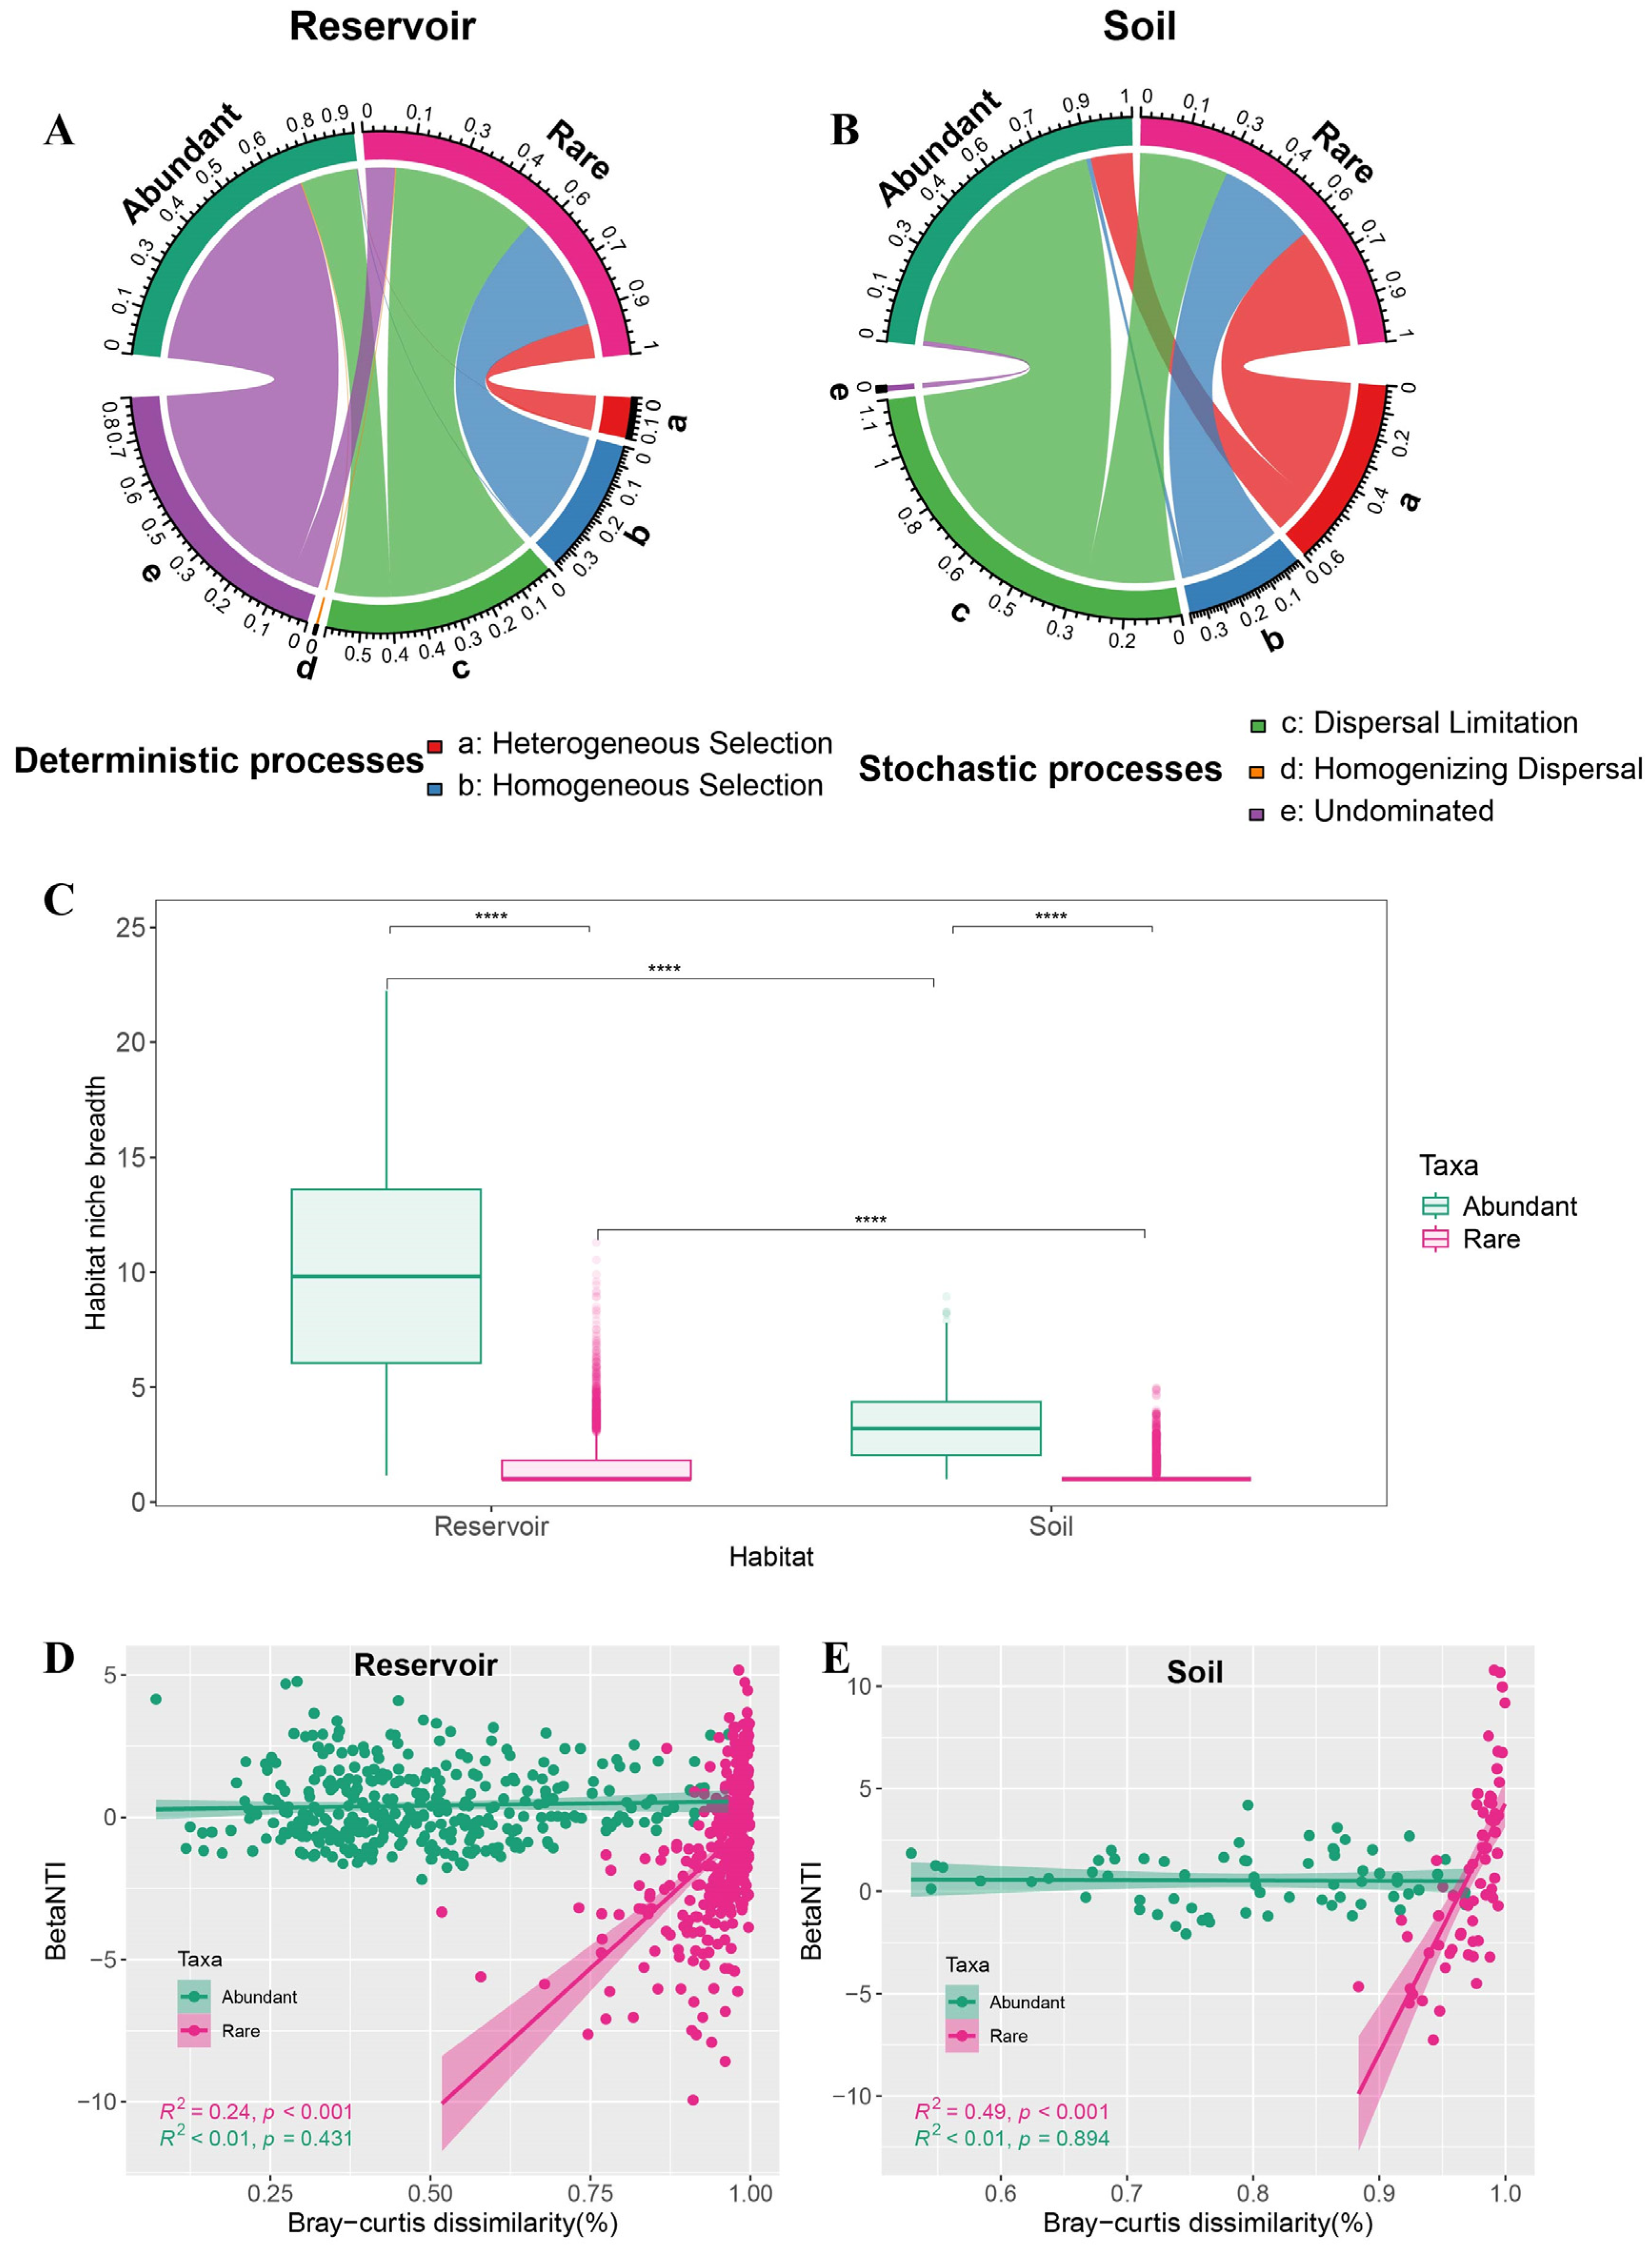
Figure 7.
(A, B) Co-occurrence networks of bacterial communities in the reservoir (A) and adjacent soil (B), with links represent strong (Spearman’s |r| > 0.8) and significant (FDR-corrected p-value <0.05) correlations. The numbers outside brackets represent the numbers of positive edges, and the numbers within parentheses indicate the numbers of negative edges. (C, D) Distributions of ASVs according to within-module connectivity (Zi) and among-module connectivity (Pi) in the reservoir (C) and adjacent soil (D), illustrating the assignment of network topological roles. ASVs are classified as module hubs (Pi < 0.62 and Zi ≥ 2.5), network hubs (Pi ≥ 0.62 and Zi ≥ 2.5), connectors (Pi ≥ 0.62 and Zi < 2.5), and peripheral nodes (Pi < 0.62 and Zi < 2.5).
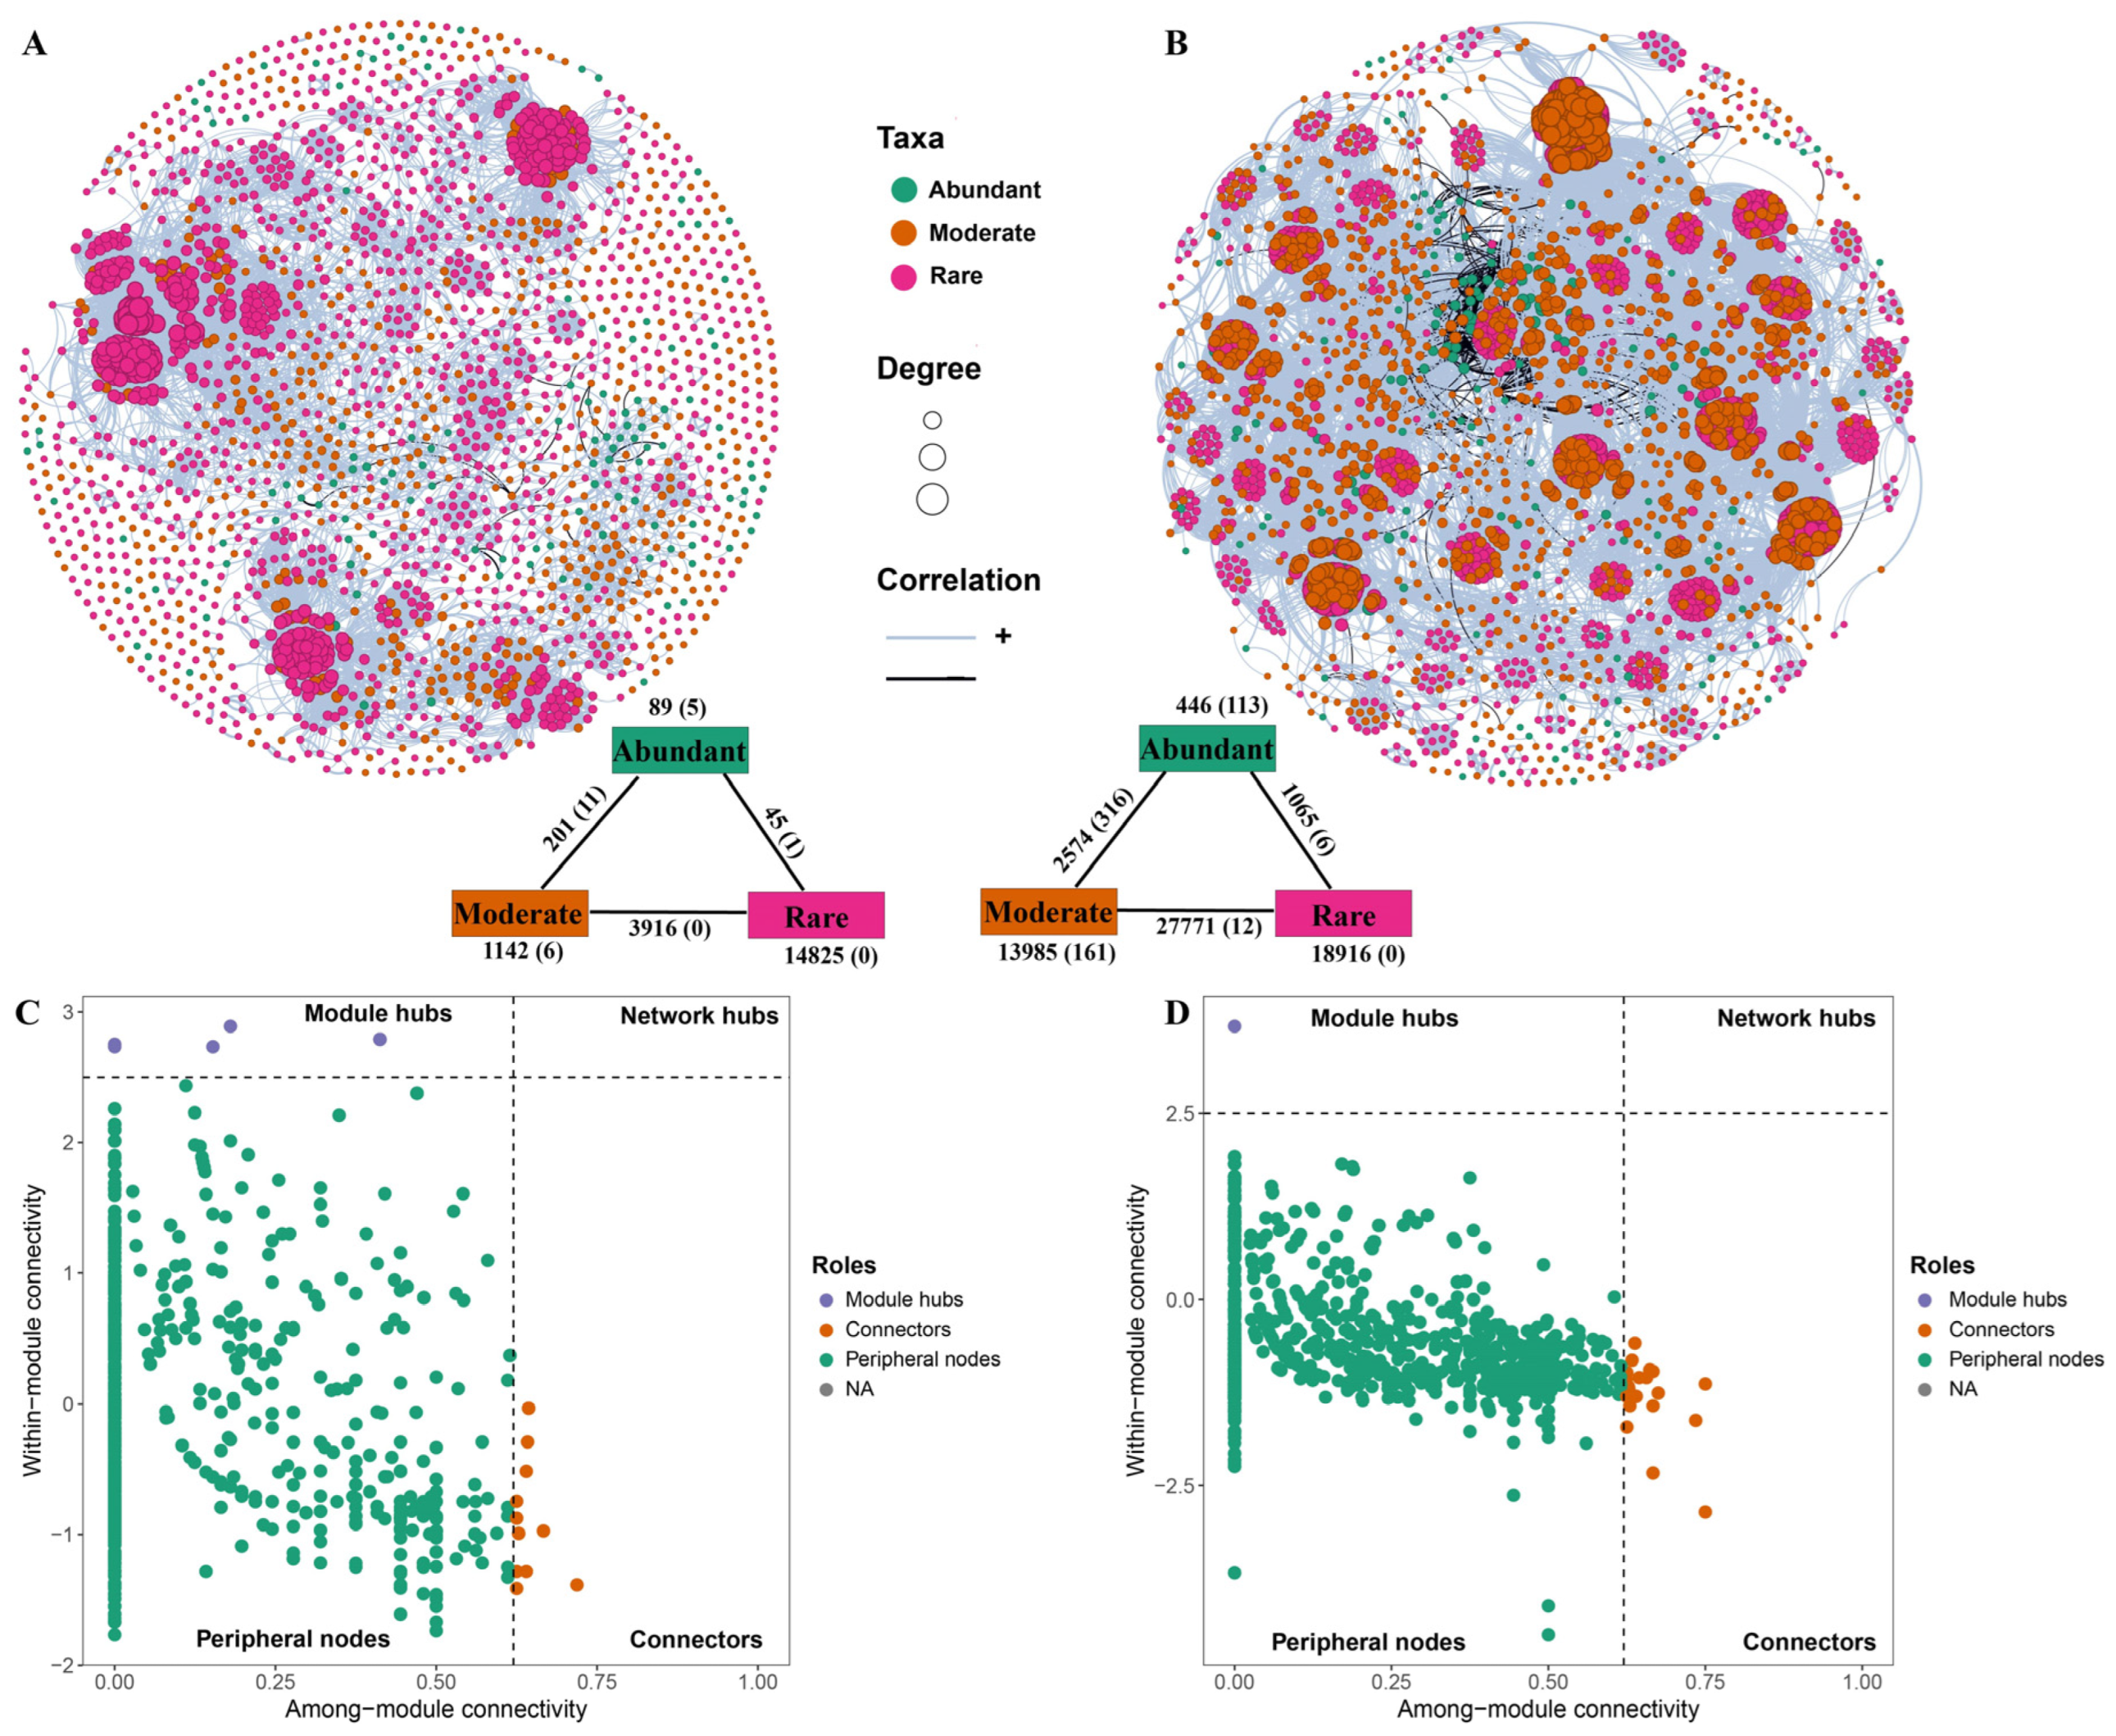
Figure 8.
Comparison of normalized topological parameters (degree, betweenness centrality, closeness centrality, and eigenvector centrality) among abundant, moderate, and rare taxa in reservoir (A) and soil (B). Topological parameters were normalized within each network to their percentile rank values. Statistical differences were assessed using the Wilcoxon rank sum test (ns: not significant, p > 0.05, *p < 0.05, **p < 0.01, ***p < 0.001).
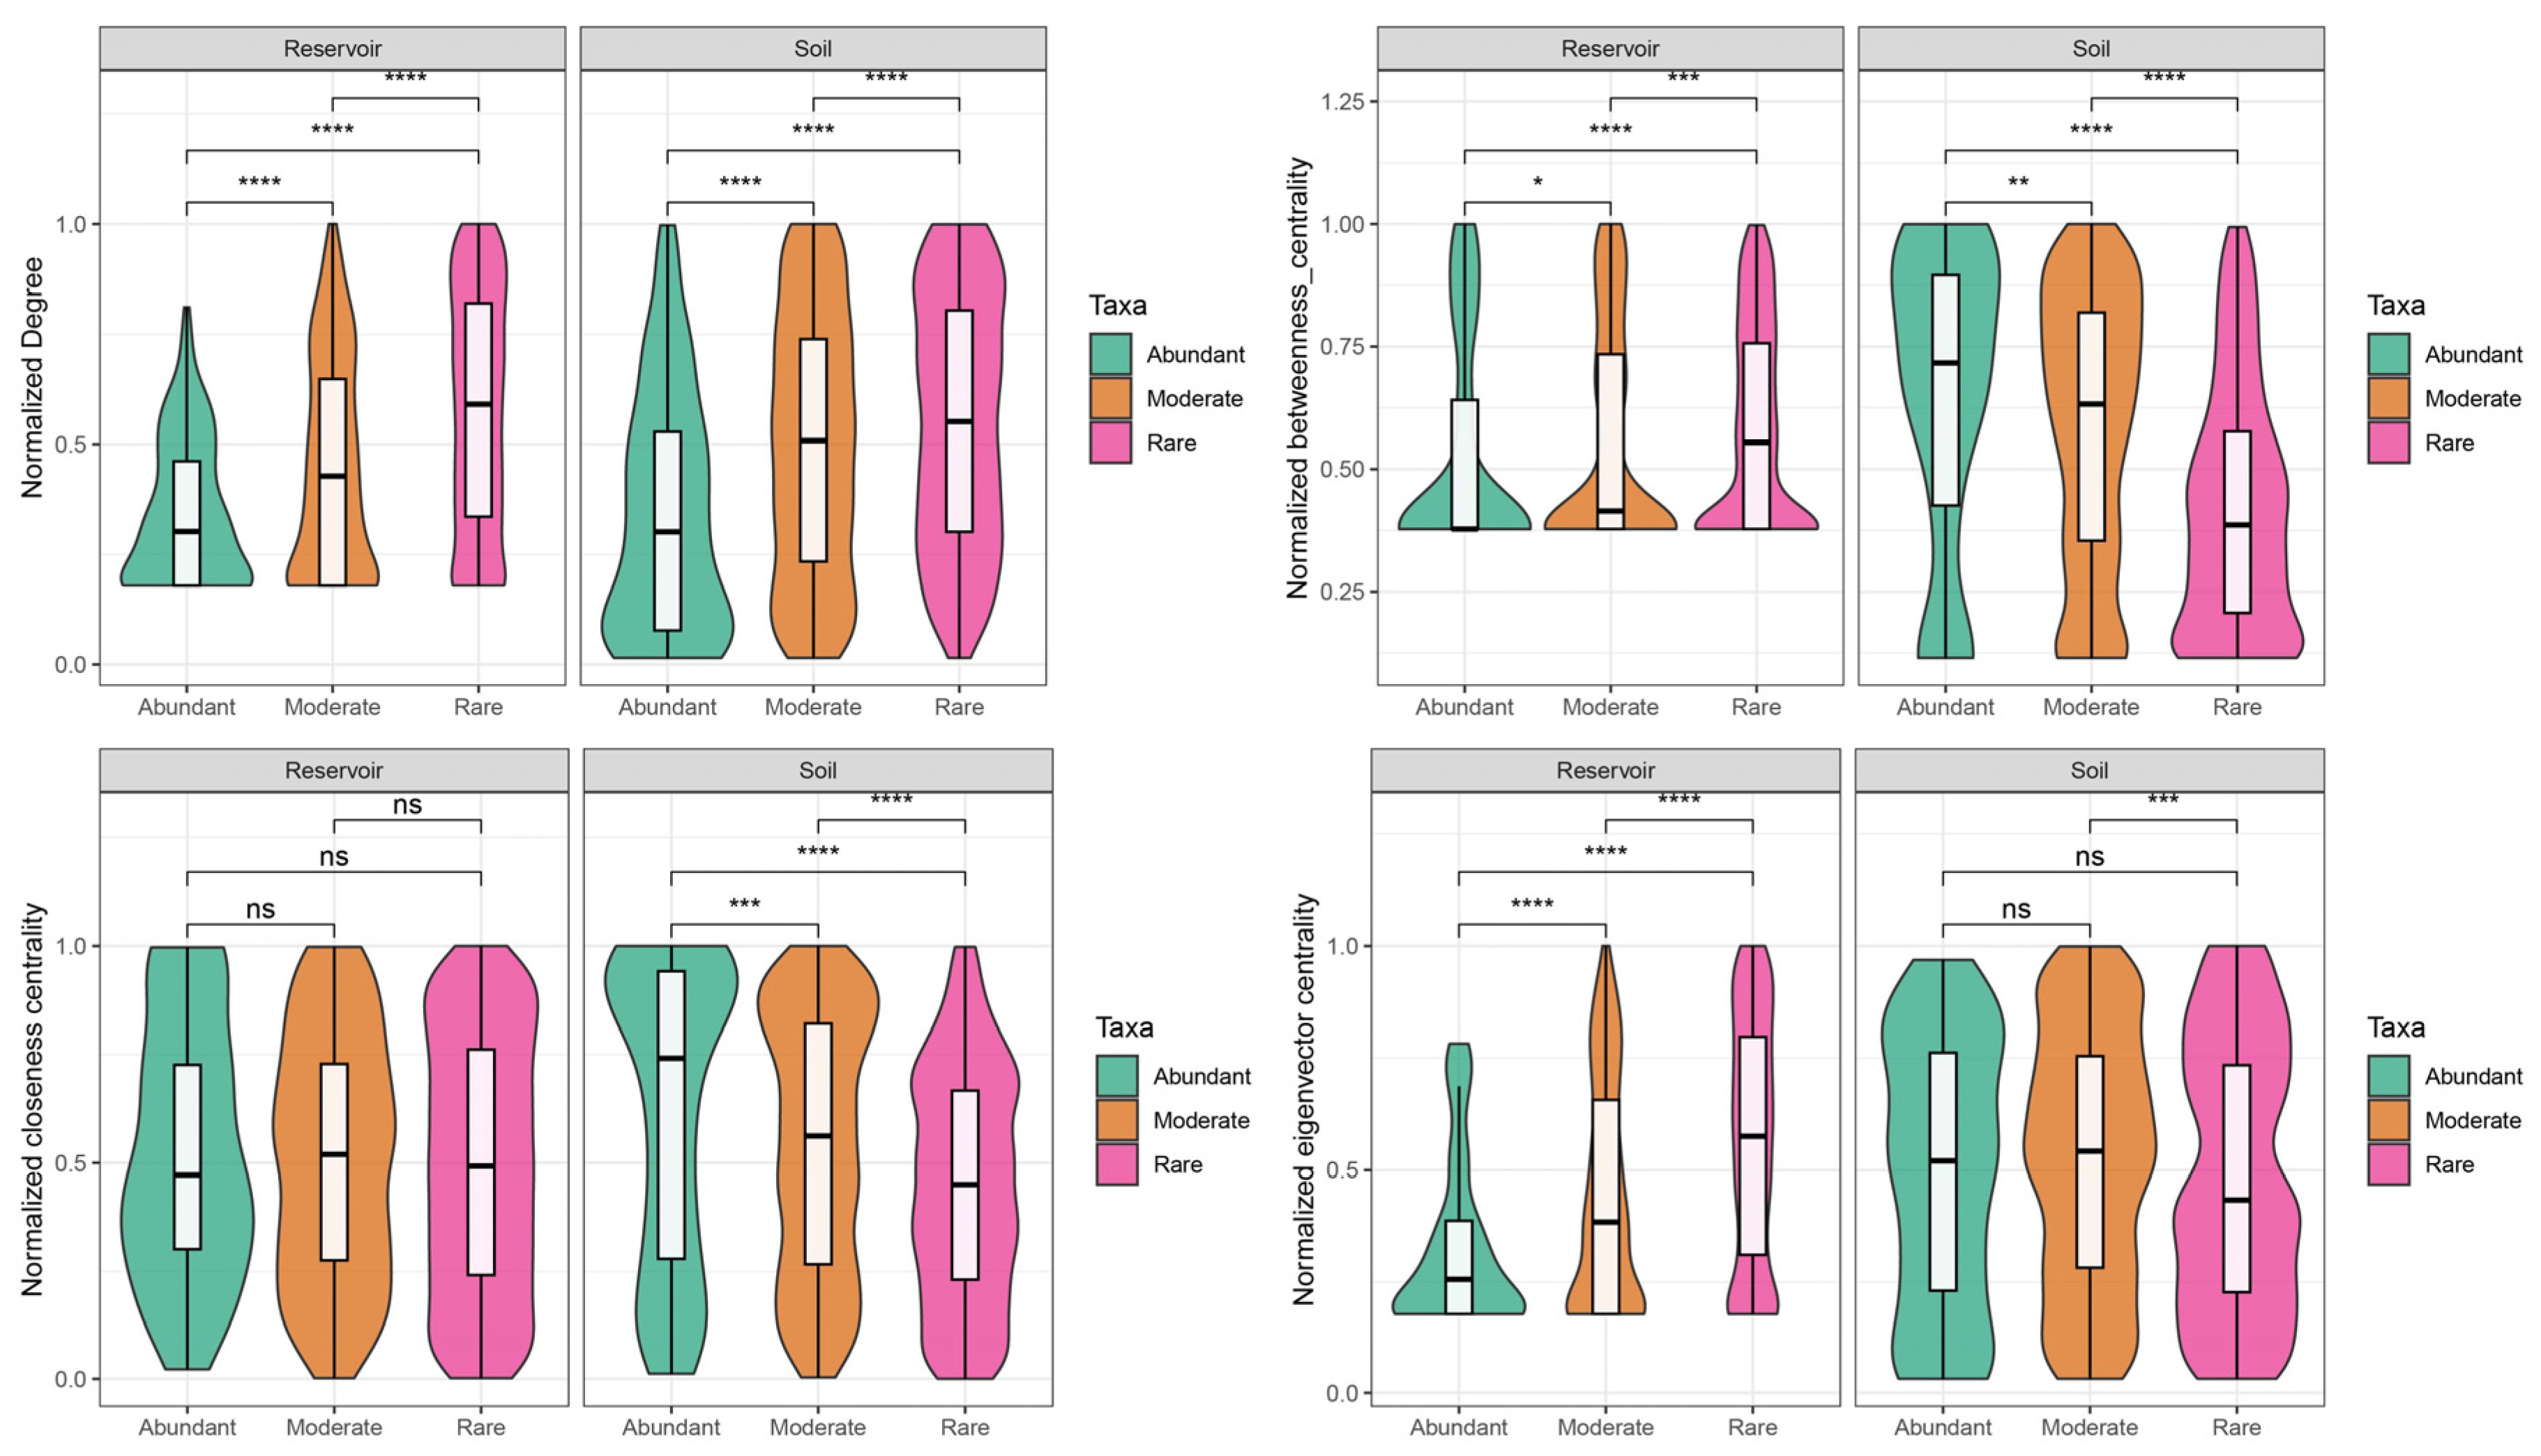
Disclaimer/Publisher’s Note: The statements, opinions and data contained in all publications are solely those of the individual author(s) and contributor(s) and not of MDPI and/or the editor(s). MDPI and/or the editor(s) disclaim responsibility for any injury to people or property resulting from any ideas, methods, instructions or products referred to in the content. |
© 2025 by the authors. Licensee MDPI, Basel, Switzerland. This article is an open access article distributed under the terms and conditions of the Creative Commons Attribution (CC BY) license (http://creativecommons.org/licenses/by/4.0/).
Copyright: This open access article is published under a Creative Commons CC BY 4.0 license, which permit the free download, distribution, and reuse, provided that the author and preprint are cited in any reuse.


