1. Introduction
Thermal shocks and the physicochemical impact of the liquid metal on the refractory insulation, together with the continuous nature of metallurgical technologies and the intensification of production, increase the risk of damage and disruption of the structural integrity of the units during the technological process.
The destruction of the structural integrity of this equipment results in the forced interruption of production and significant costs associated with emergency response. It requires measures to be taken to reduce the risk of such situations.
An opportunity to address these issues in the metallurgical industry is the implementation of decision-making systems and predictive maintenance into the production process, based on continuous or periodic monitoring and diagnostics of the refractory insulation condition in high-temperature furnaces and auxiliary equipment [
1,
2,
3].
The complexity of technological operations, the conditions under which they occur, the size of industrial equipment, and the volume of data generated by periodic measurements in combination with those of the operating parameters of the process, make subjective assessment extremely difficult and require the development of specific approaches and rules for monitoring, evaluation, and interpretation of inspection data. All this is combined in the work of modern systems for diagnostics and making informed decisions based on processing the results of various monitoring approaches [
4,
5].
The implementation of such systems extends the life cycle, leading to the safe operation and increased environmental, operational, and economic efficiency of technological facilities within the context of Industry 4.0.
Various approaches are used to assess the condition of the refractory insulation in the units, starting with visual assessments by experts and ending with modern infrared thermography systems [
6,
7] and laser scanning systems for the interior of the metallurgical unit [
8].
When applying this method to obtain primary information, it is necessary to consider several factors that affect the technological, structural, and thermal characteristics of the studied objects, as well as the location of the units that allow for measurements to be conducted.
In modern non-ferrous metallurgical production, converter units are a crucial component in the technological process, and their stable operation is essential for the overall operation of the entire technological line. This draws attention to them and refractory insulation, the condition of which must be monitored and controlled.
The refractories in these units operate under severe conditions. During the technological process, high temperatures are achieved, the insulation is subjected to cyclic temperature changes, and the movement of the liquid metal, as a result of the blowing, further contributes to the erosion of the thermal insulation, along with the chemical one.
During operation, the most problematic area of converters is the tuyere row, where the refractory insulation wears out at the highest rate. The majority of the conducted research and publications [
9,
10,
11,
12,
13,
14,
15,
16] aim to optimize refractory insulation, study the hydrodynamics of the converter bath, investigate the influence of purging parameters, and maintain the tuyere section.
The developed concepts of predictive maintenance systems [
17,
18,
19,
20,
21,
22,
23,
24,
25] are primarily based on managing the parameters of purging liquid metal and maintaining the tuyere zone and its adjacent section.
In parallel with the wear of the date zone, the rest of the refractory insulation is also subjected to the physicochemical effects of the interaction with the liquid metal.
Studies [
23] have shown that 65% of the total wear of the refractory insulation on the wall is due to thermal cracks forming in the vertical direction, and 35% is due to chemical erosion.
As a result of the chemical interaction between the liquid metal and the refractory wall, an infiltrated reaction layer with different thermomechanical properties from those of the refractory material is created on the contact surface of the refractory [
24,
25,
26]. These weakened refractory microstructures are exposed to additional thermal and mechanical loads, which lead to both continuous degradation (hot erosion and corrosion) and to the formation of cracks (thermochemical cleavage) and further destruction.
Such destruction during the operation manifests as damage in individual zones of the wall, allowing the liquid metal to penetrate deeply into the wall, which is a prerequisite for a production accident.
These defects in the process of operation develop in parallel with the wear of the tuyere zone and the general wear of the wall, which necessitates periodic monitoring and maintenance decisions that take into account local damage outside the tuyere area of the unit at various stages of its life cycle.
During operation, thermal imaging measurements of the converter surface are taken, based on which assumptions are made about the erosion of the insulation and the presence of local damage, without any additional diagnostic procedures or condition assessments.
The peculiarities of realisation technological processes in different production conditions and the specificity of the equipment do not allow the direct transfer and application of the results of already operating monitoring, evaluation, and maintenance systems. This requires that, for each case, research be conducted and a technological regulation and a specific approach to conducting thermographic monitoring and assessing the current condition of the units be developed to make informed decisions on operation and maintenance, aiming to extend the life cycle and safely utilize the maximum resource.
The investigation aims to establish the conditions for organizing and conducting thermographic diagnostic procedures as part of a technological regulation for thermovision diagnostics and decision-making in predictive maintenance of converter units in non-ferrous metallurgy.
In this study, a 3D mathematical model developed for this purpose is utilized, and the optimal time for conducting a thermovision diagnosis is determined from both constructive and thermal engineering perspectives.
Based on simulation modeling results, a regression equation has been derived to determine the total wear of the converter wall as a function of the surface temperature in the defect-free area of the wall.
2. Methods
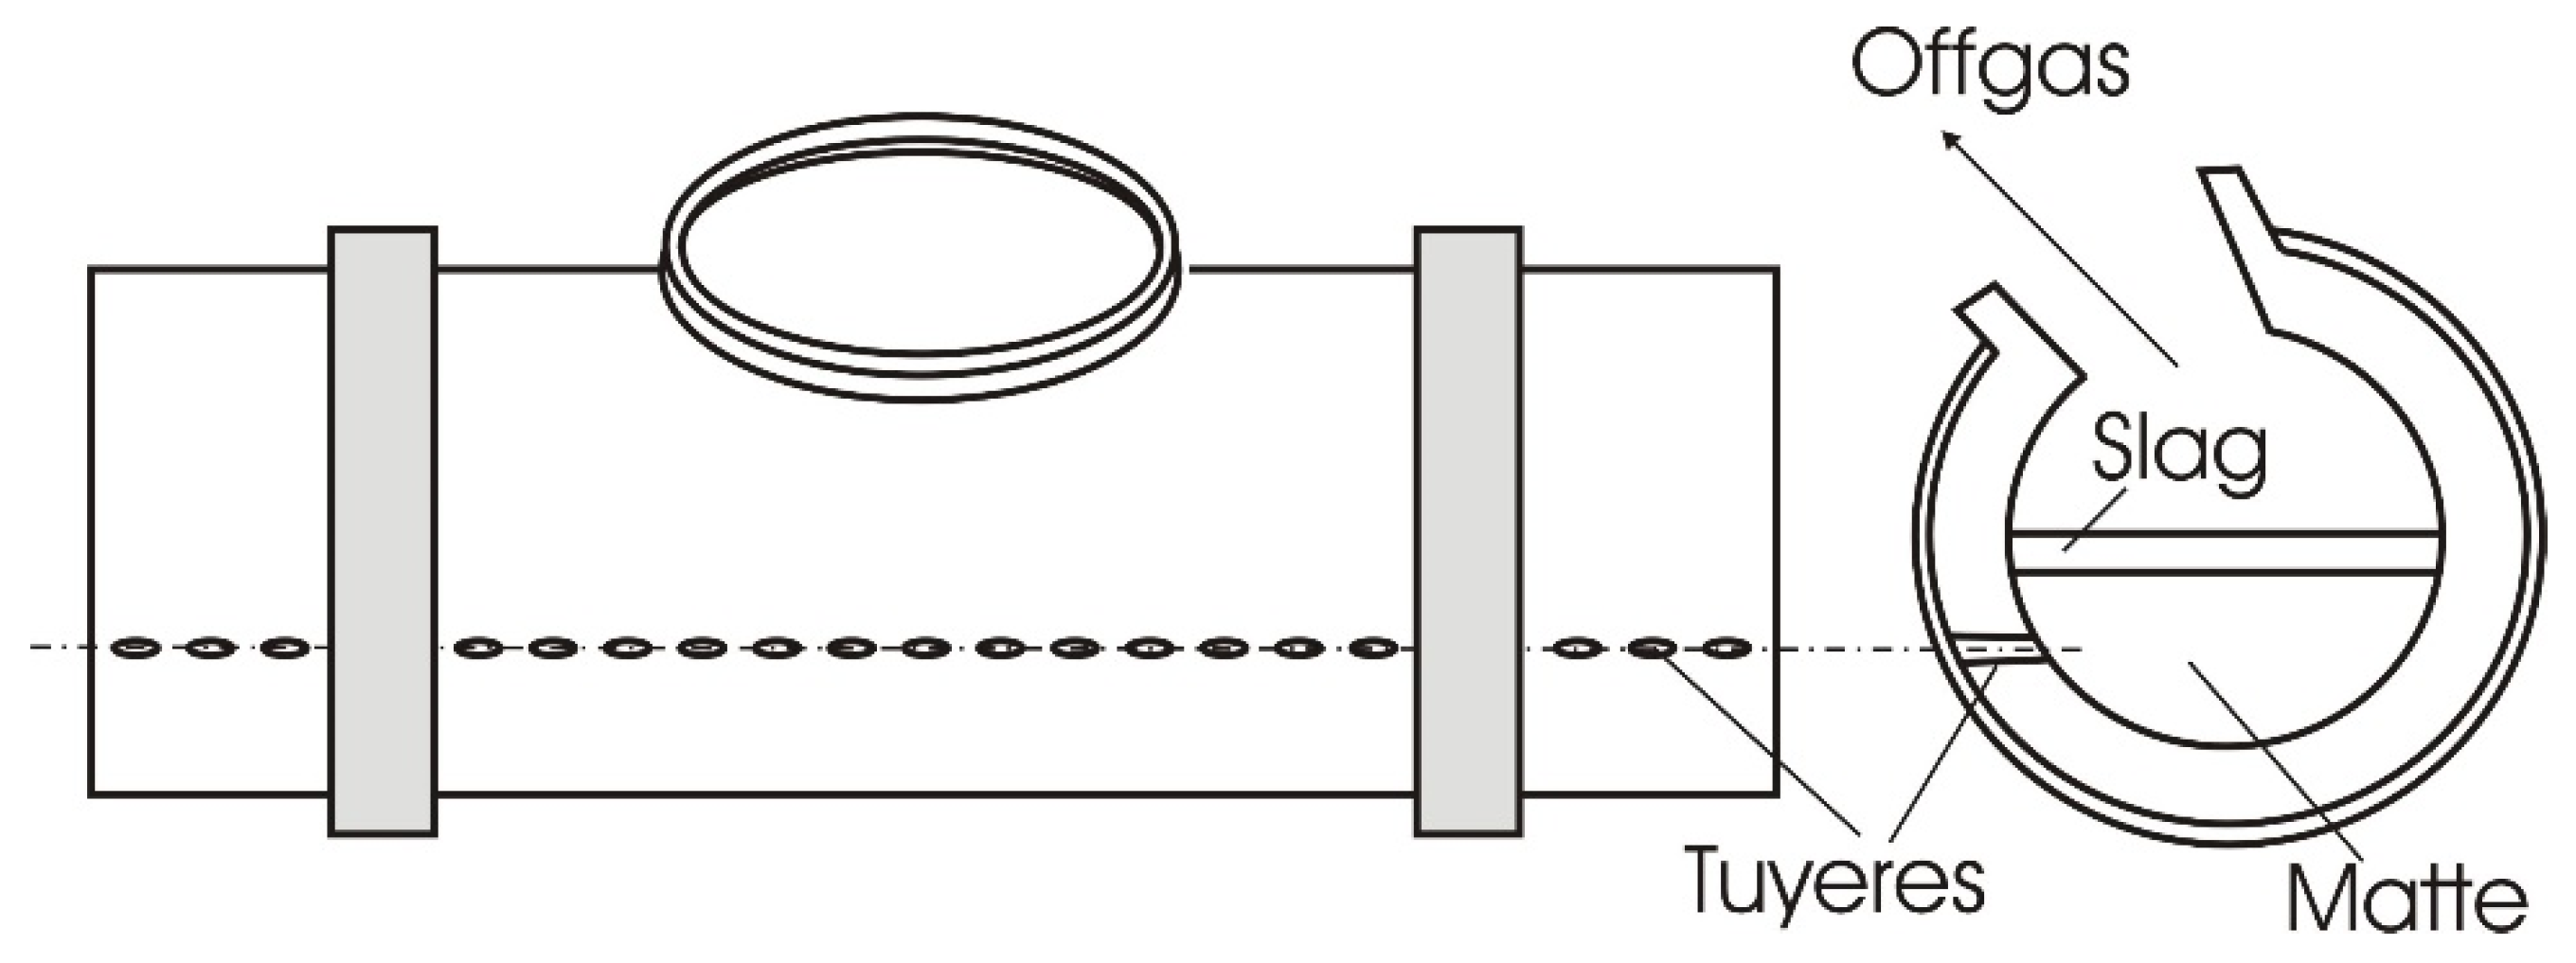
The object of the presented research is Pierce-Smith cooper converter for processing copper matte in non-ferrous metallurgy, shown in
Figure 1. It is a technological facility with periodic operation, consisting of a horizontal cylindrical reactor, a support device, a mechanism for rotating, a device for supplying air through tuyeres, and a device for removing converter gases. The oxidation air, enriched with pure oxygen, is provided to the copper matte melt through a series of tuyeres. The liquid matte is fed into the converter from the furnace with specialized metallurgical ladles and is poured into the charging hole.
When performing the individual operations of the converter unit, it is positioned in a fixed location in the workshop. During loading and draining of the liquid metal, it rotates around its horizontal axis. During the purging process, an oxidizing agent and the necessary additives for processing are supplied, while the structure is in an upright state, and the level of the liquid metal does not exceed half the height of the working space.
In previous studies by the research team [
26], the operating and technological parameters of a Pierce-Smith converter were established through an industrial experiment. Based on a statistical analysis of data from real work, the limits of variation, the duration of individual operations, and the temperature of the metal during the technological process have been determined [
26].
The technological process for converting includes two periods of metal processing. The first period of converting comprises: Loading the first portion of copper matte, blowing, and casting the first portion of slag. This is followed by loading an additional amount of liquid metal, blowing, and casting the second portion of slag. The second period of converting consists of blowing and casting the processed metal. This is followed by the preparation of the converter for the next operation, which includes cleaning the blowing tuyeres and aperture the unit. The new technological cycle begins with loading a portion of copper matte, and the technological operations are performed again.
The service life of a converter lasts between two and three months, during which time 260 to 330 technological cycles are realized, forming one campaign. From the point of view of maintaining the converters, after a certain degree of wear of the refractory insulation in the blowing zone, it must be replaced. For the sustainable operation of the converter, three intermediate repairs of the tuyere zone are provided, after which the refractory insulation of the entire unit is subject to repair.
In this study, attention is focused on the condition of the refractory insulation in the area of the unit that contacts the liquid metal during the technological process, which may prove problematic during the last stage of converter operation, after the third interim repair. To establish the possibilities for conducting infrared diagnostic procedures, it is necessary to determine the optimal period for conducting thermovision measurements from a structural and thermal engineering perspective. Based on the study's results, further research is needed to determine a dependence for predicting the wear of the refractory converter wall.
The location of the converter units in the workshop and the organization of the technological process do not allow the application of online systems for diagnostics and monitoring of their entire surface. Therefore, the diagnostic procedures are based on periodic measurements of temperature fields using infrared (thermal imaging) cameras, employing a passive thermographic approach. The cyclical operation of the converter units and the associated non-stationary temperature field in the refractory wall require the implementation of a combined approach, taking into account the features of active two-sided diagnostics.
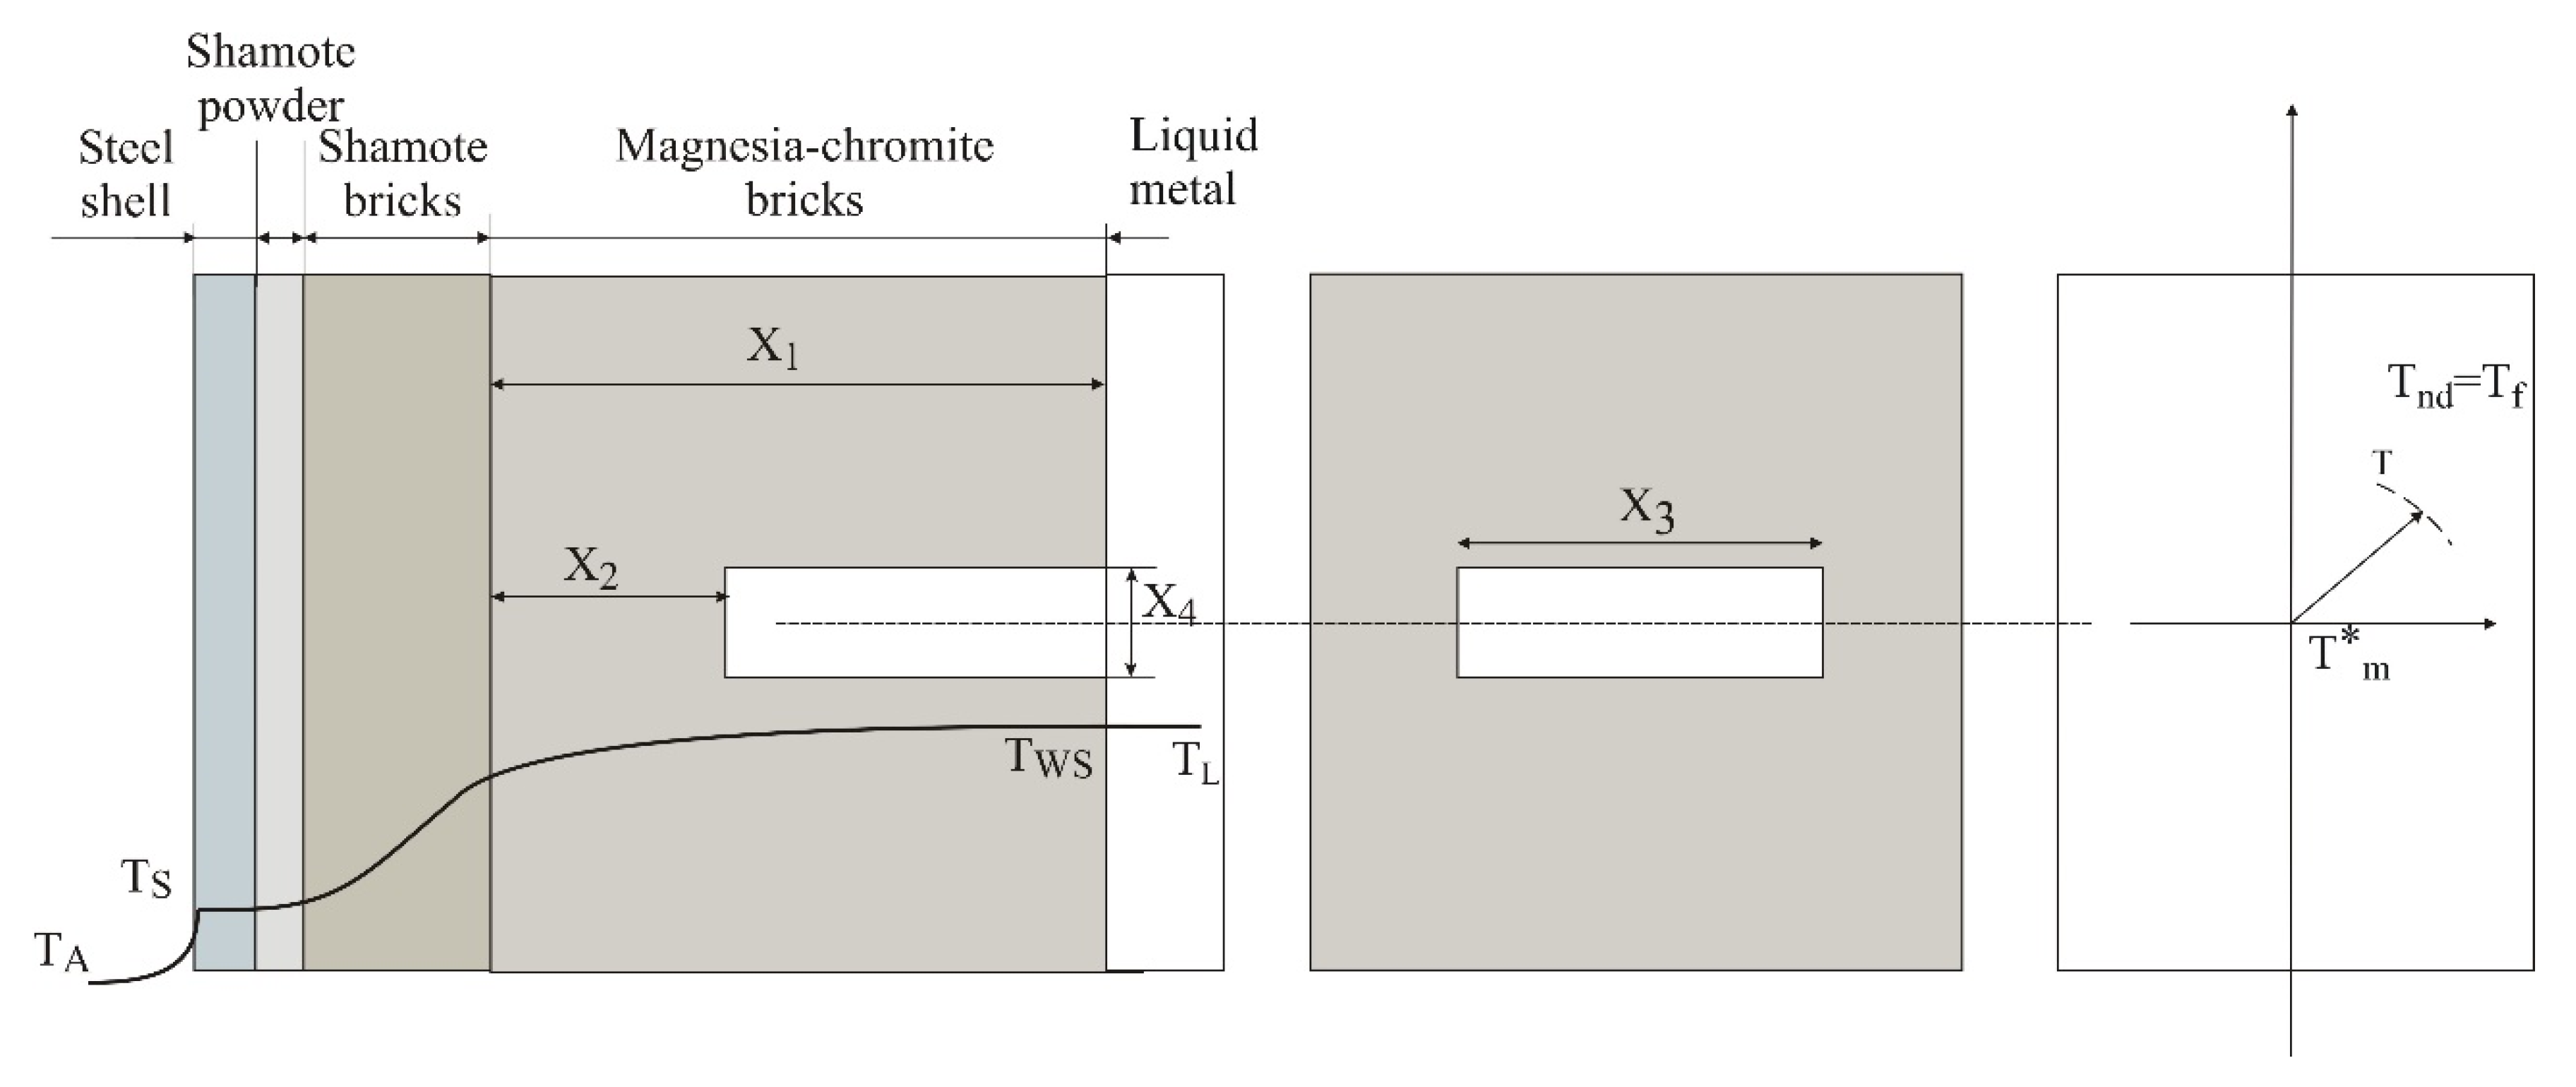
Basic parameters for conducting such monitoring to diagnose local damage include the temperature distribution in the hot spot of the outer surface in the defect area, its maximum value (Tm), and the surface temperature in the defect-free region (Tf), also known as the background temperature. The difference between the values of maximum temperature in the hot spot area and the background temperature represents the differential temperature signal, also known as the temperature contrast.
Taking into account the features of two-sided active thermography in the diagnosis of local damage requires tracking the temperature contrast value over time and determining the moment τ
m at which it reaches its maximum value [
6]. This is the final moment by which the thermographic monitoring should be implemented. In practice, the so-called “early monitoring” is also applied at a time τ<τ
m. The advantage of early measurement is the low value of heat diffusion in the transverse direction. It is applicable for dynamic analyses, as it is characterized by an increase in surface temperature over time. When conducting thermographic measurements in the time range of maximum temperature contrast, the signal-to-noise ratio is expected to be at its maximum, i.e., the contrast between the measured temperatures in the defect area and the defect-free area is expected to be greatest.
To conduct diagnostic procedures based on the values of the temperature contrast and other parameters, detailed information is required about the temperature field change on the surface during the technological process in the presence of local defects, which necessitates the application of simulation models.
For the study, analysis, and diagnostics of surface temperature fields resulting from damage, a 3D mathematical model of the transient heat transfer in the wall of a converter unit in non-ferrous metallurgy has been developed and numerically implemented. To adjust the operation of the mathematical model, the design parameters and the results of an industrial experiment [
26] were used, considering the operating and technological parameters of the production process. With the help of the model, various combinations of the wear levels of the refractory layer on the wall and the parameters of a local defect were simulated for different stages of the converter's service life.
The non-stationary temperature distribution along the wall thickness is described using the Fourier equation in cylindrical coordinates z, r, and ϕ:
where λ is thermal conductivity coefficient, W/mK; T - wall temperature,
ОС ; r- radius, m; c - specific heat capacity, kJ/kgK; ρ - density, kg/m
3; z, r and ϕ - coordinates; τ- time, s.
With steady-state thermal conductivity, the temperature remains constant over time, and the above expression takes the form:
When solving the equation, it is assumed that the liquid metal is perfectly homogeneous and stationary during the technological process, the temperatures of the metal and slag are the same, and the total wear of the wall is uniform along its length. Based on the assumptions and considerations outlined above, the boundary conditions can be presented as follows.
For the inner surface of the wall in the area of close contact with the metal:
where T
L is temperature of the liquid metal,
ОС; T
WS - temperature of the inner (hot) surface of the wall,
ОС; r
1 - radius of the inner surface of the wall m, α- heat transfer coefficient from metal to the wall[
27], W/m
2 K.
For the inner surface of the wall in the absence of metal or the area above the level of the metal:
where q
inc is the resultant heat flux to the inner surface of the wall in the absence of metal or in the area above the metal level, W/m
2 ;
For the outer surface:
where r
2 is radius of the outer surface of the wall, m; T
A – ambient temperature,
OC; T
S – temperature of the outer surface of the converter unit,
ОС; α
Σ – total heat transfer coefficient, W/m
2K; α
c – convective component of the heat transfer coefficient[
27], W/m
2K; α
r =q
r /(T
W -T
A ) - radiant component of the heat transfer coefficient, W/m
2K; q
r – radiation heat flux from the outer surface to the environment, W/m
2.
To account for the temperature distribution at different stages of the converter operating cycle, it is necessary to perform calculations varying in degree of wear, i.e., at various sizes of the residual wall thickness and local damage.
To determine the initial condition; the heat conduction equation (1) is solved under steady-state conditions in the form represented by equation (2) when setting a first-order boundary condition:
where
TWSh is the temperature of the inner wall surface at the end of the heating process after repair and before the start of operation of the unit.
The obtained results for the temperature distribution from the computational procedure under steady-state conditions are assigned as the initial condition for solving the transient heat conduction equation.
For the numerical implementation of the mathematical model, the finite element method and the Ansys 16 software product were used.
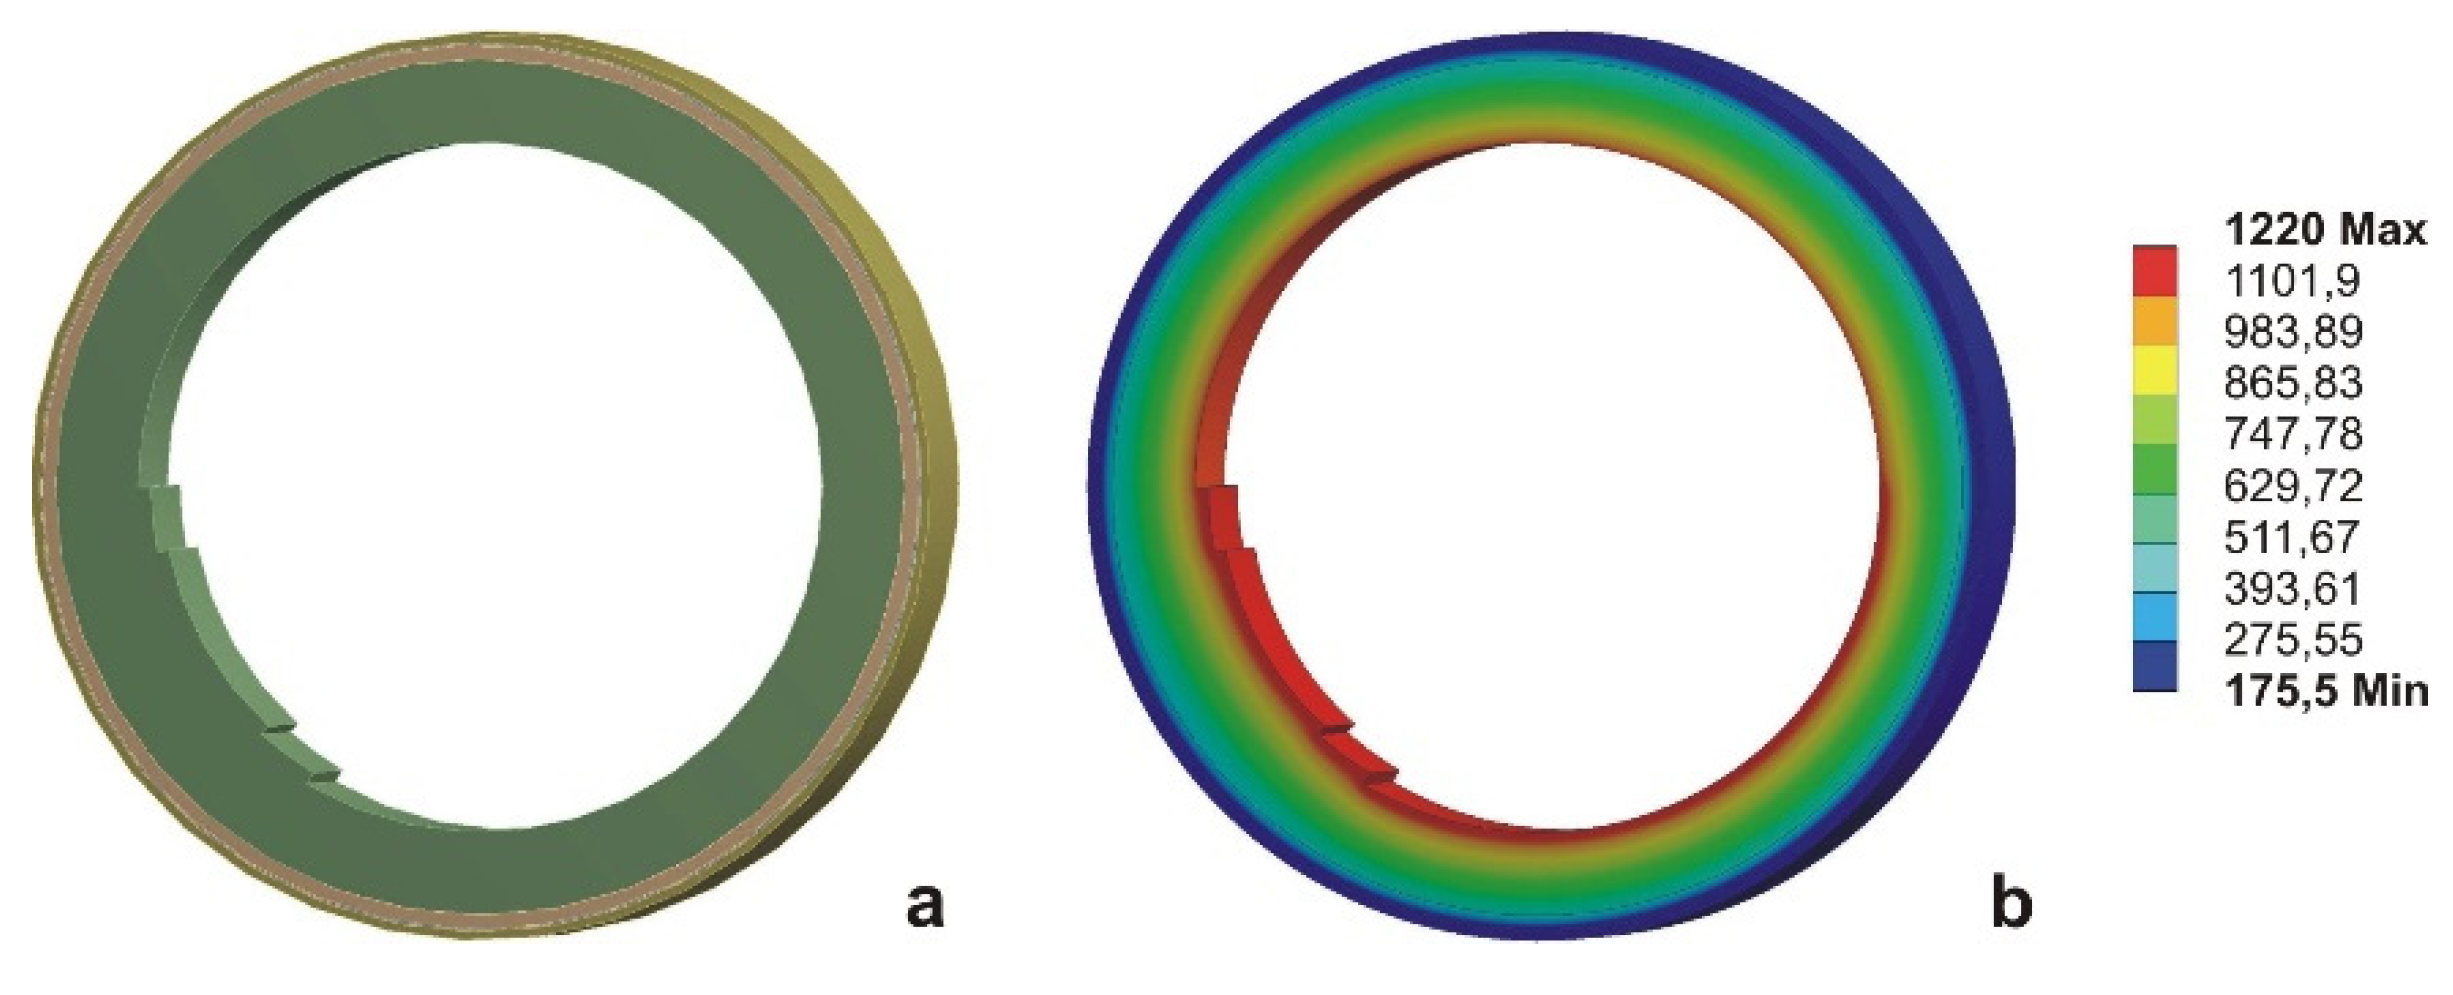
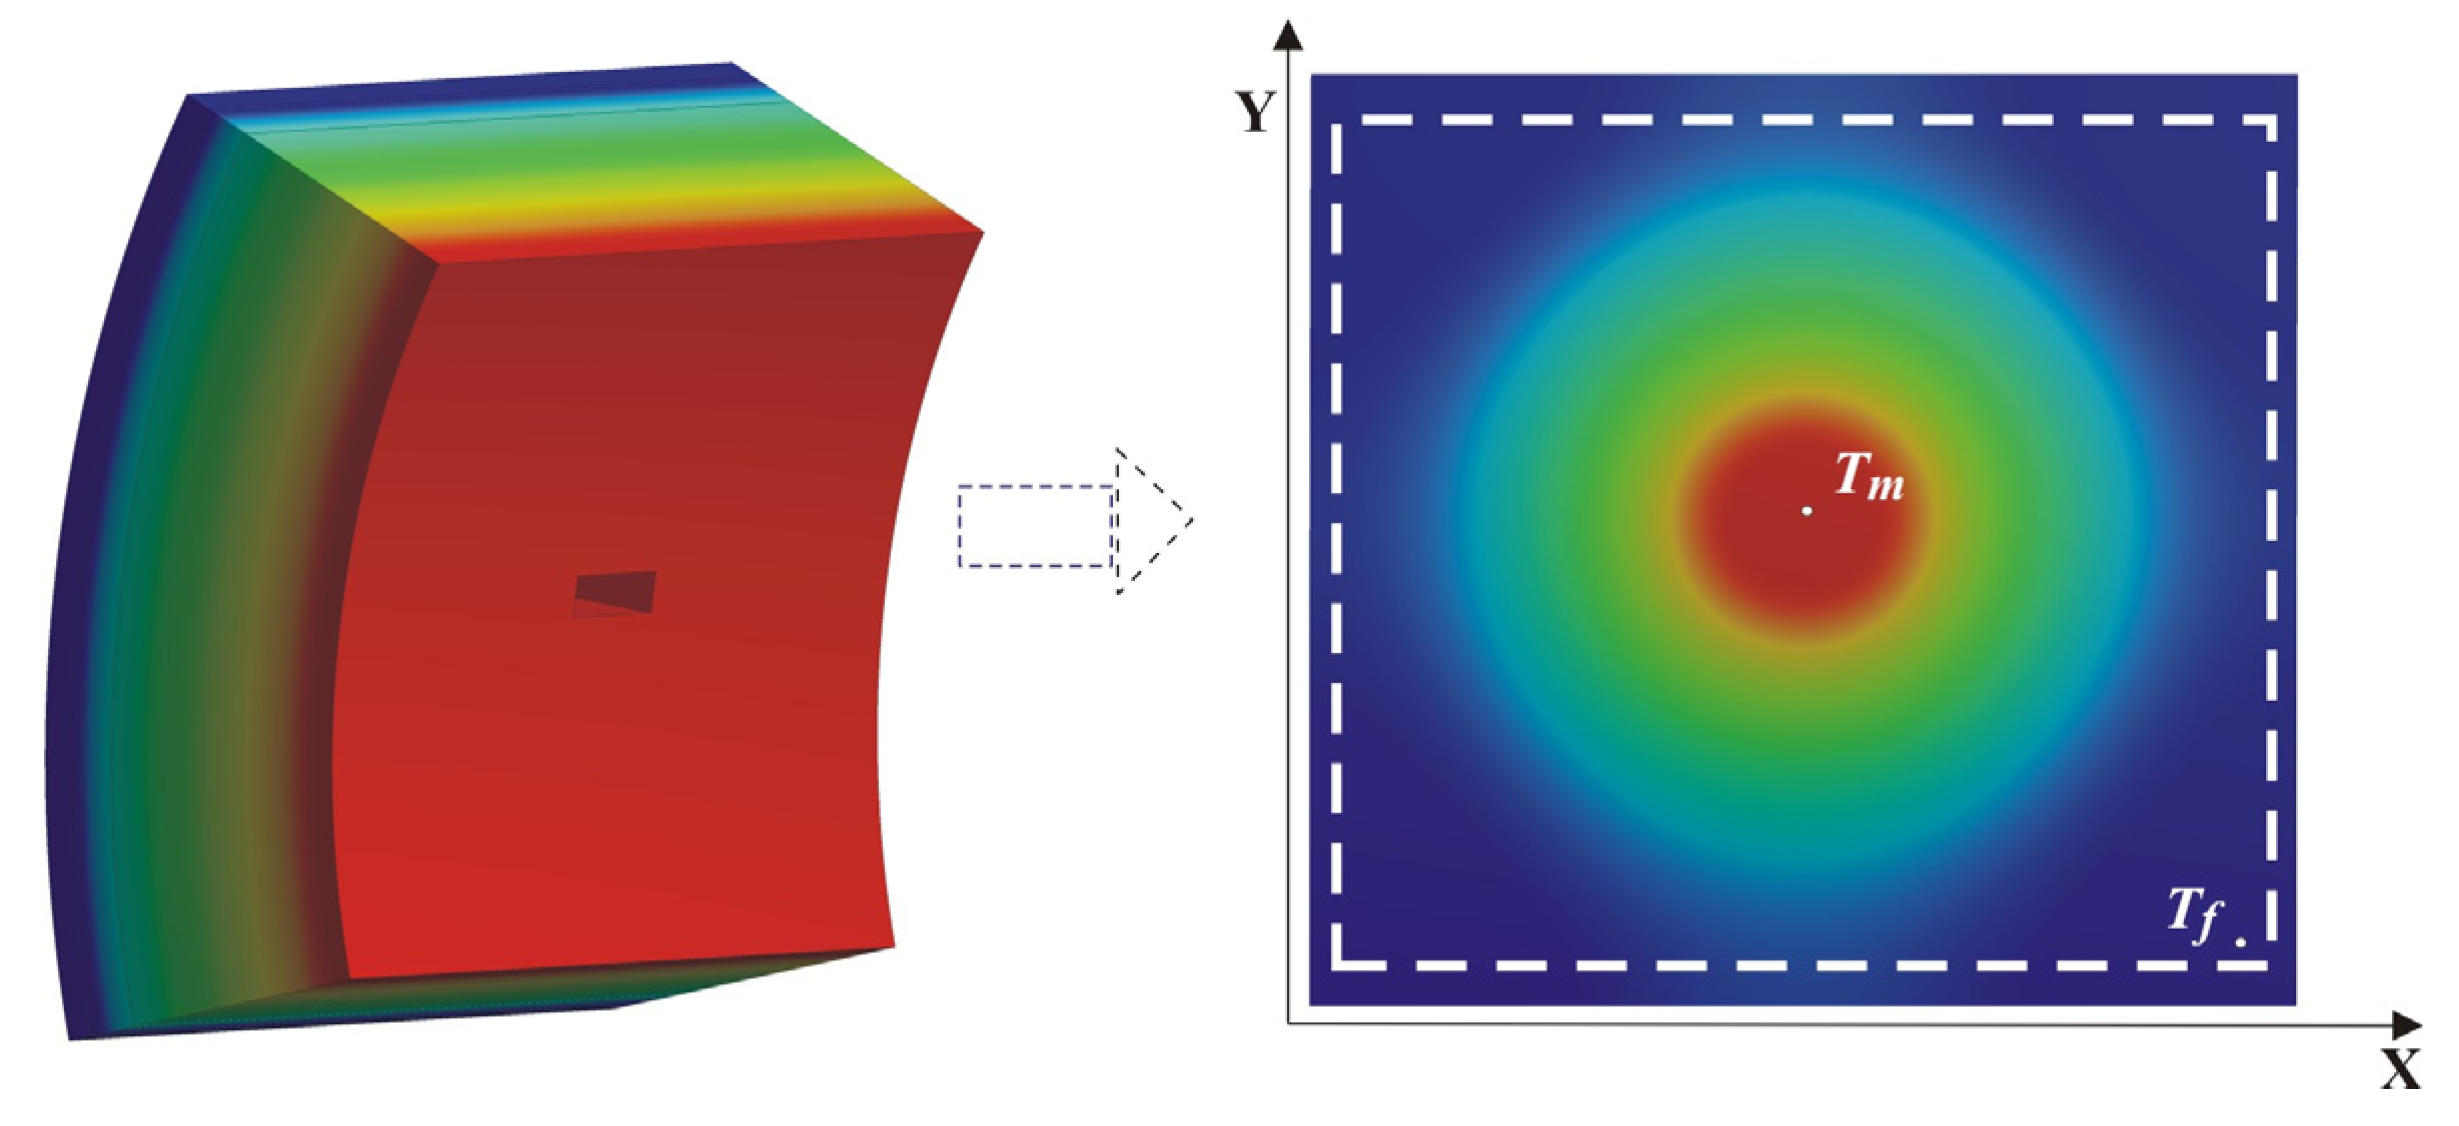
To account for the individual stages of operation and downtime, several technological cycles were sequentially simulated, with the converter being full of liquid metal during operation and empty during downtime between two technological cycles. A ring-shaped computational object was built to conduct the study, representing a portion of the unit's cross-section, perpendicular to the horizontal axis. The computational object, along with a visualization of the temperature distribution in the wall, is presented in
Figure 2.
It is assumed that the metal is filled and poured from the unit instantly. During operation of the converter, its lower half is full of liquid metal. When idle between two technological cycles, the unit is empty, in which case the walls are cooled by heat transfer through convection and radiation from the outer surface.
Determining the surface temperature distribution for different stages of the converter's operational period requires that the calculation procedures be carried out at different thicknesses, reflecting the degree of wear - initial thickness, residual thickness in the middle of the campaign and residual thickness at the end of the campaign, upon of which the converter must be taken out of service.
When conducting the study for each calculation variant to determine the temperature distribution, the Fourier equation is solved under steady-state conditions, and the results obtained are assigned as the initial condition for studying the transient heat transfer. When realizing the calculations, the unsteady heat transfer is solved under several successive cyclic repetitions of the boundary conditions characteristic of the converter operating cycle. The determination of the actual temperature distribution in the volume at a specific wall thickness and the corresponding conditions is carried out for a fixed moment τ of the technological cycle after fulfilling the conditions:
where n is the number of iterations performed.
The test calculations conducted show that, at constant values of the wear parameters, after simulating a certain number of consecutive cycles of the technological process, the repeatability of the values obtained for the change in the temperature field is observed. Therefore, it is accepted that the study's results should be accounted for after fulfilling the conditions cited above in equations (7) and (8).
To more effectively utilize available computational resources, reduce calculation time, and minimize the volume of generated result files, a series of preliminary calculations, analyses, and summaries was conducted. This aimed to reduce the computational object and determine the necessary boundary conditions for conducting the simulation study.
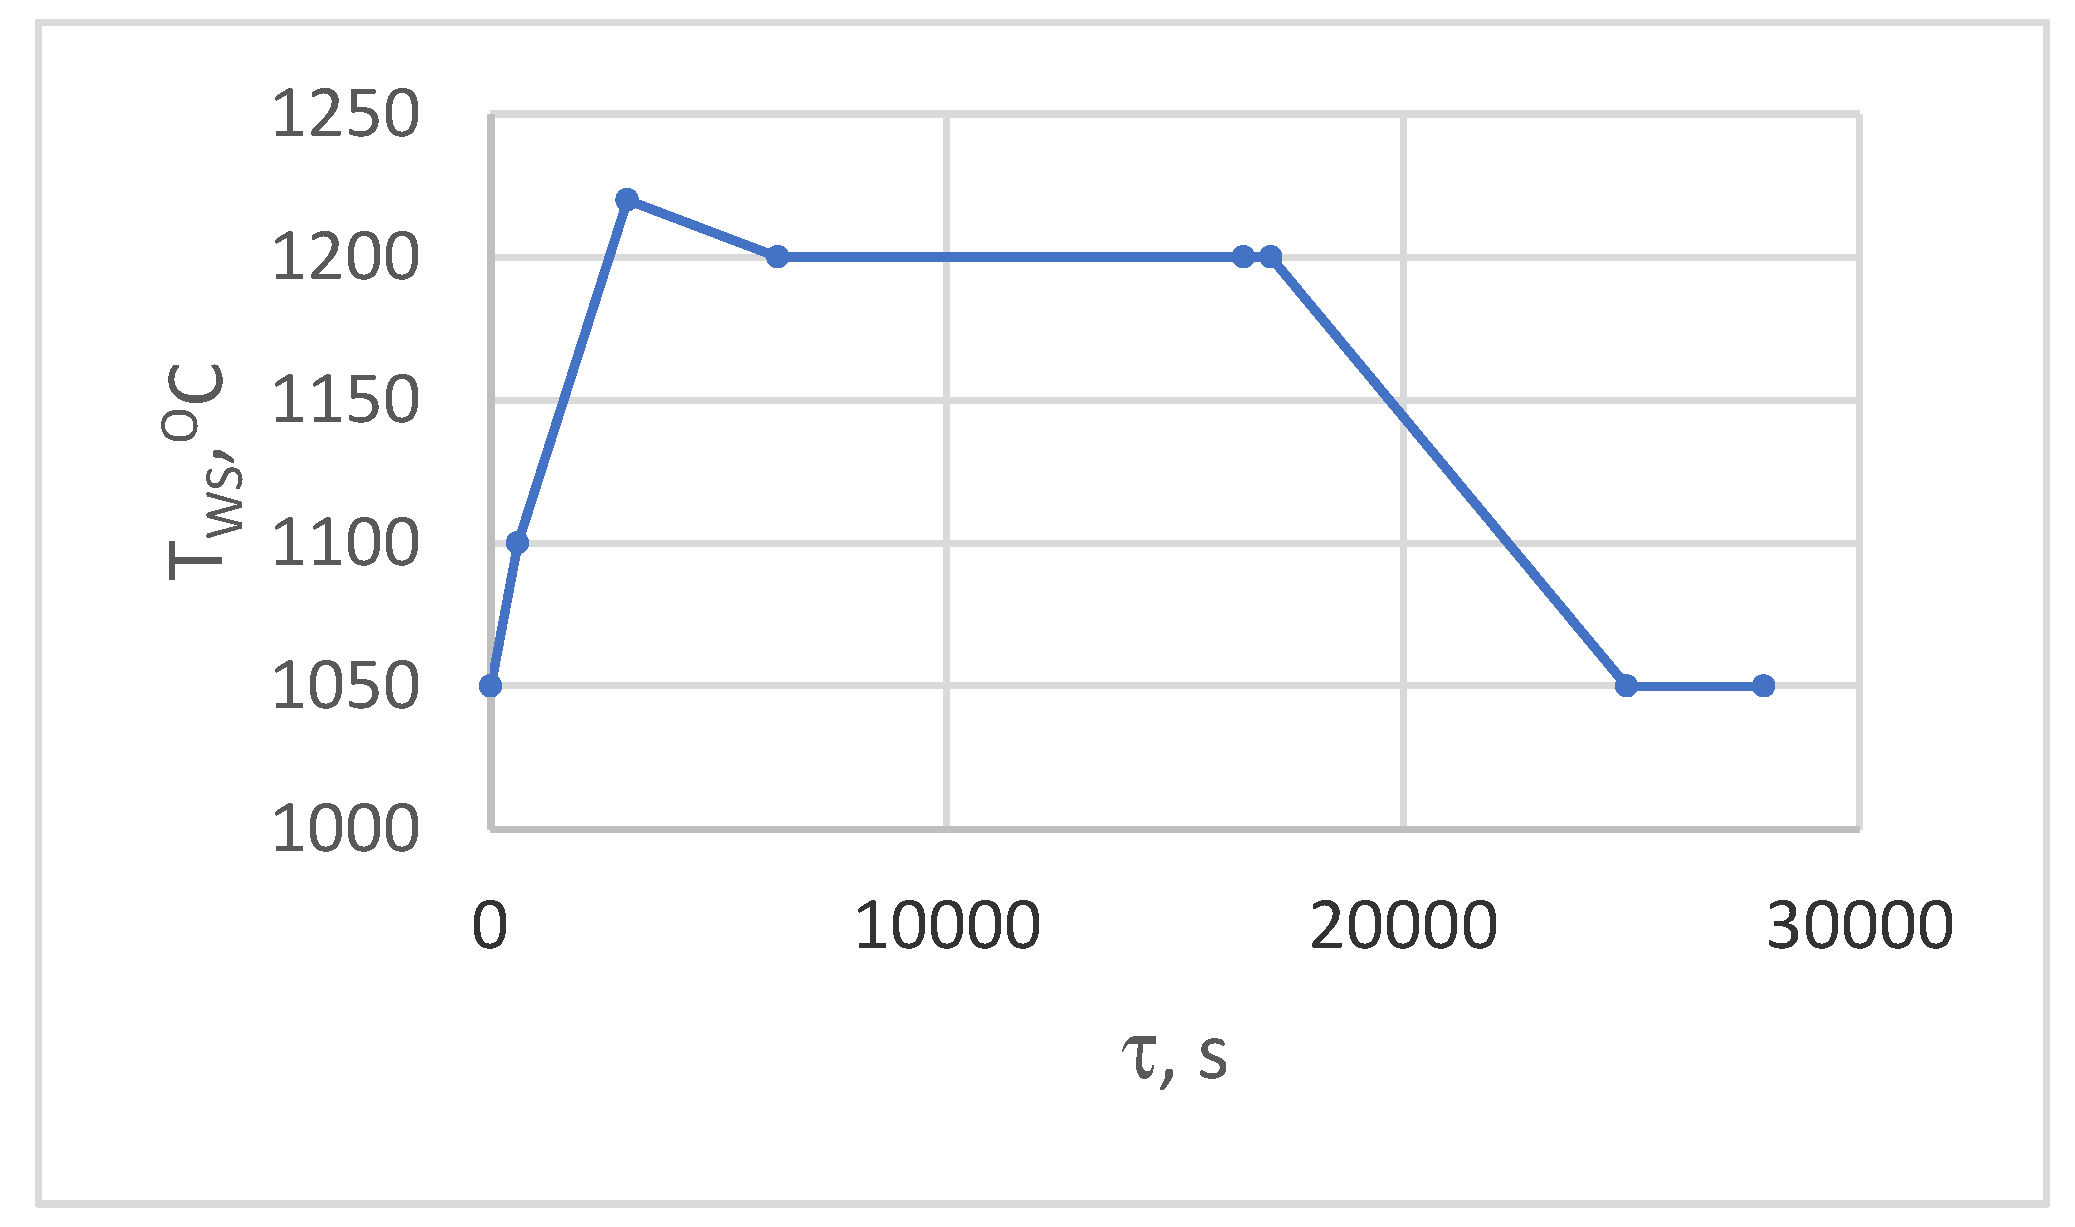
The computational procedures performed took into account the actual temperature regime of the metal, presented in
Figure 2, and the operating parameters of the process. The obtained results for the temperature distribution in the wall volume, especially on the hot surface, were subjected to generalization and analysis. This allowed the establishment of a boundary condition, represented by equation (9), at the contact areas of the liquid metal with the refractory insulation of the wall.
The change in the values of the boundary condition T
WS (τ) of the hot surface for one technological cycle is presented in
Figure 3.
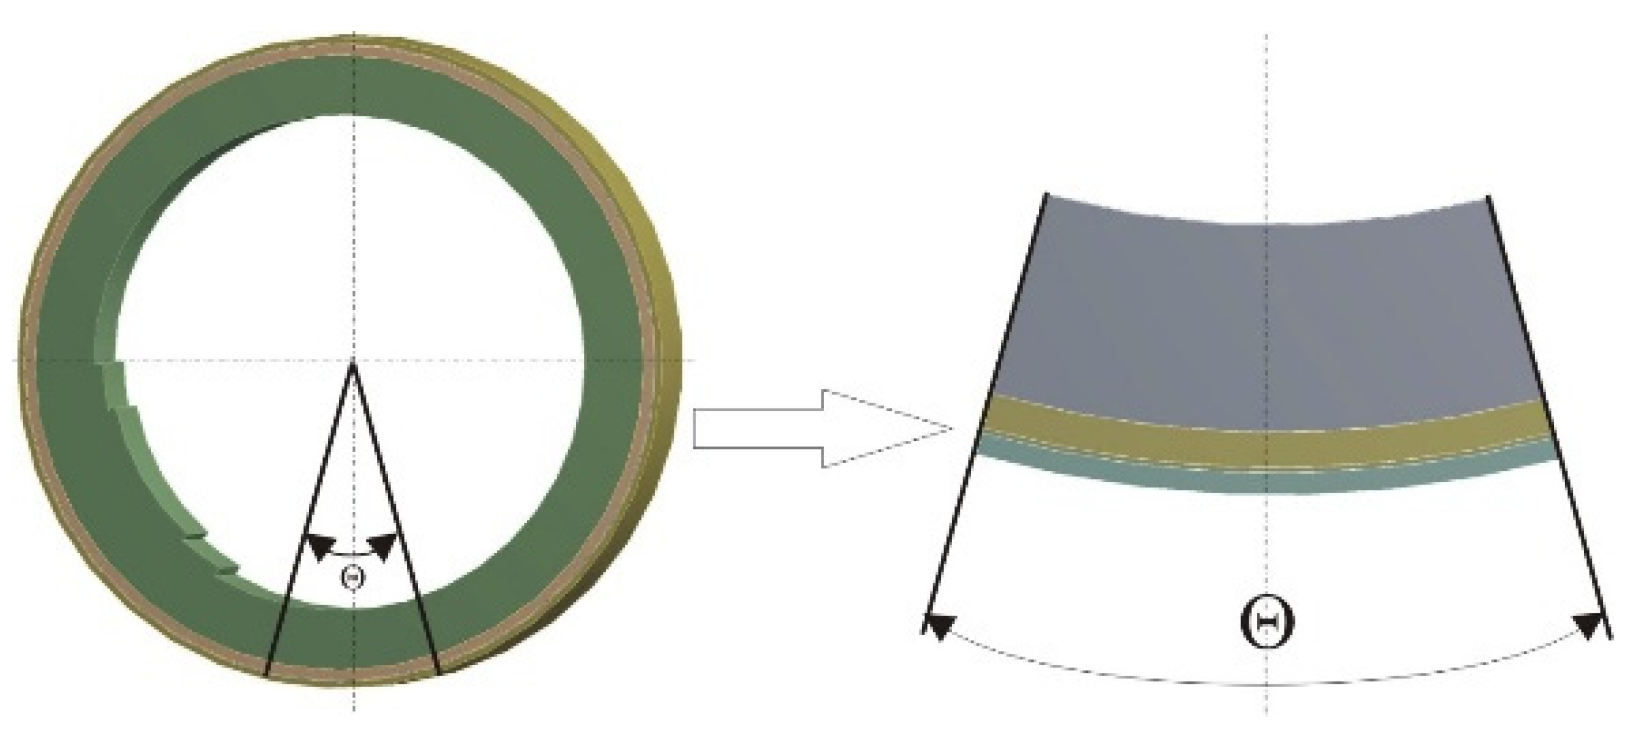
Applying this boundary condition and taking into account the symmetry along the horizontal axis of the converter and the need to study the area in contact with the liquid metal, to obtain results for the temperature on the outer surface of the wall, it is accepted the computational object to be reduced and represented by a sector of the wall with a central angle θ, presented in
Figure 4.
The described mathematical model, with the formulated initial and boundary conditions, will be used to study the surface temperature field of the converter unit wall, depending on the parameters of local damage and total wear of the working refractory layer.
3. Results and Discussion
To study the heat transfer processes in the converter wall, a local damage with the shape of a regular prism was simulated in the developed 3D mathematical model, resembling a defect resulting from a destroyed brick from the refractory (magnesia-chromite) layer of the aggregate.
The wall of the converter consists of a steel structure with a thickness of 0.04 m, a compensation layer of chamotte powder with a thickness of 0.01 m, a thermal insulation layer of chamotte refractory bricks with a thickness of 0.064 m, and an inner layer of magnesia-chromite refractory material with a thickness of 0.375 m.
A schematic representation of the defect configuration and the adopted designations is visualized in
Figure 5. The following designations of the geometric characteristics have been adopted to represent the damage parameters:
the residual thickness of the refractory layer of the wall X1 in the defect-free area;
the residual thickness of the refractory layer of the wall X2 in the area of the damage;
length of the fault X3;
width (height) of the damage X4.
For the study, it was assumed that the width (height) of the defect on the inner surface of the wall was constant and of size X4 = 0.06 m, and the remaining three parameters were varied at three levels: minimum (-1), average (0), and maximum (+1). A complete factorial experiment was planned and implemented, requiring 27 experiments.
When planning the experiment, the values of the residual thickness of the refractory (magnesia-chromite) layer in the defect-free area, the residual thickness of the insulation in front of the defect, and the length of the defect are changed according to the values presented in
Table 1.
The plan for experimenting, including the levels and values of the parameters, is presented in
Table 2.
To conduct the simulation calculations, the described mathematical model was numerically implemented, with the computational procedures being carried out for a section of the wall presented in
Figure 4.
A visualization of the obtained results for the surface temperature field is presented in
Figure 6. The figure shows that as a result of the heat exchange processes, the presence of local damage in the converter wall is projected onto the surface temperature field as a hot spot.
From the simulation study results, the temperature distribution along the outer surface of the wall during the converter operating cycle was accounted for. To investigate the temperature contrast, the change in maximum temperature (T
m) in the defect area and the temperature (T
f) in the defect-free area, as presented in
Figure 6, is examined.
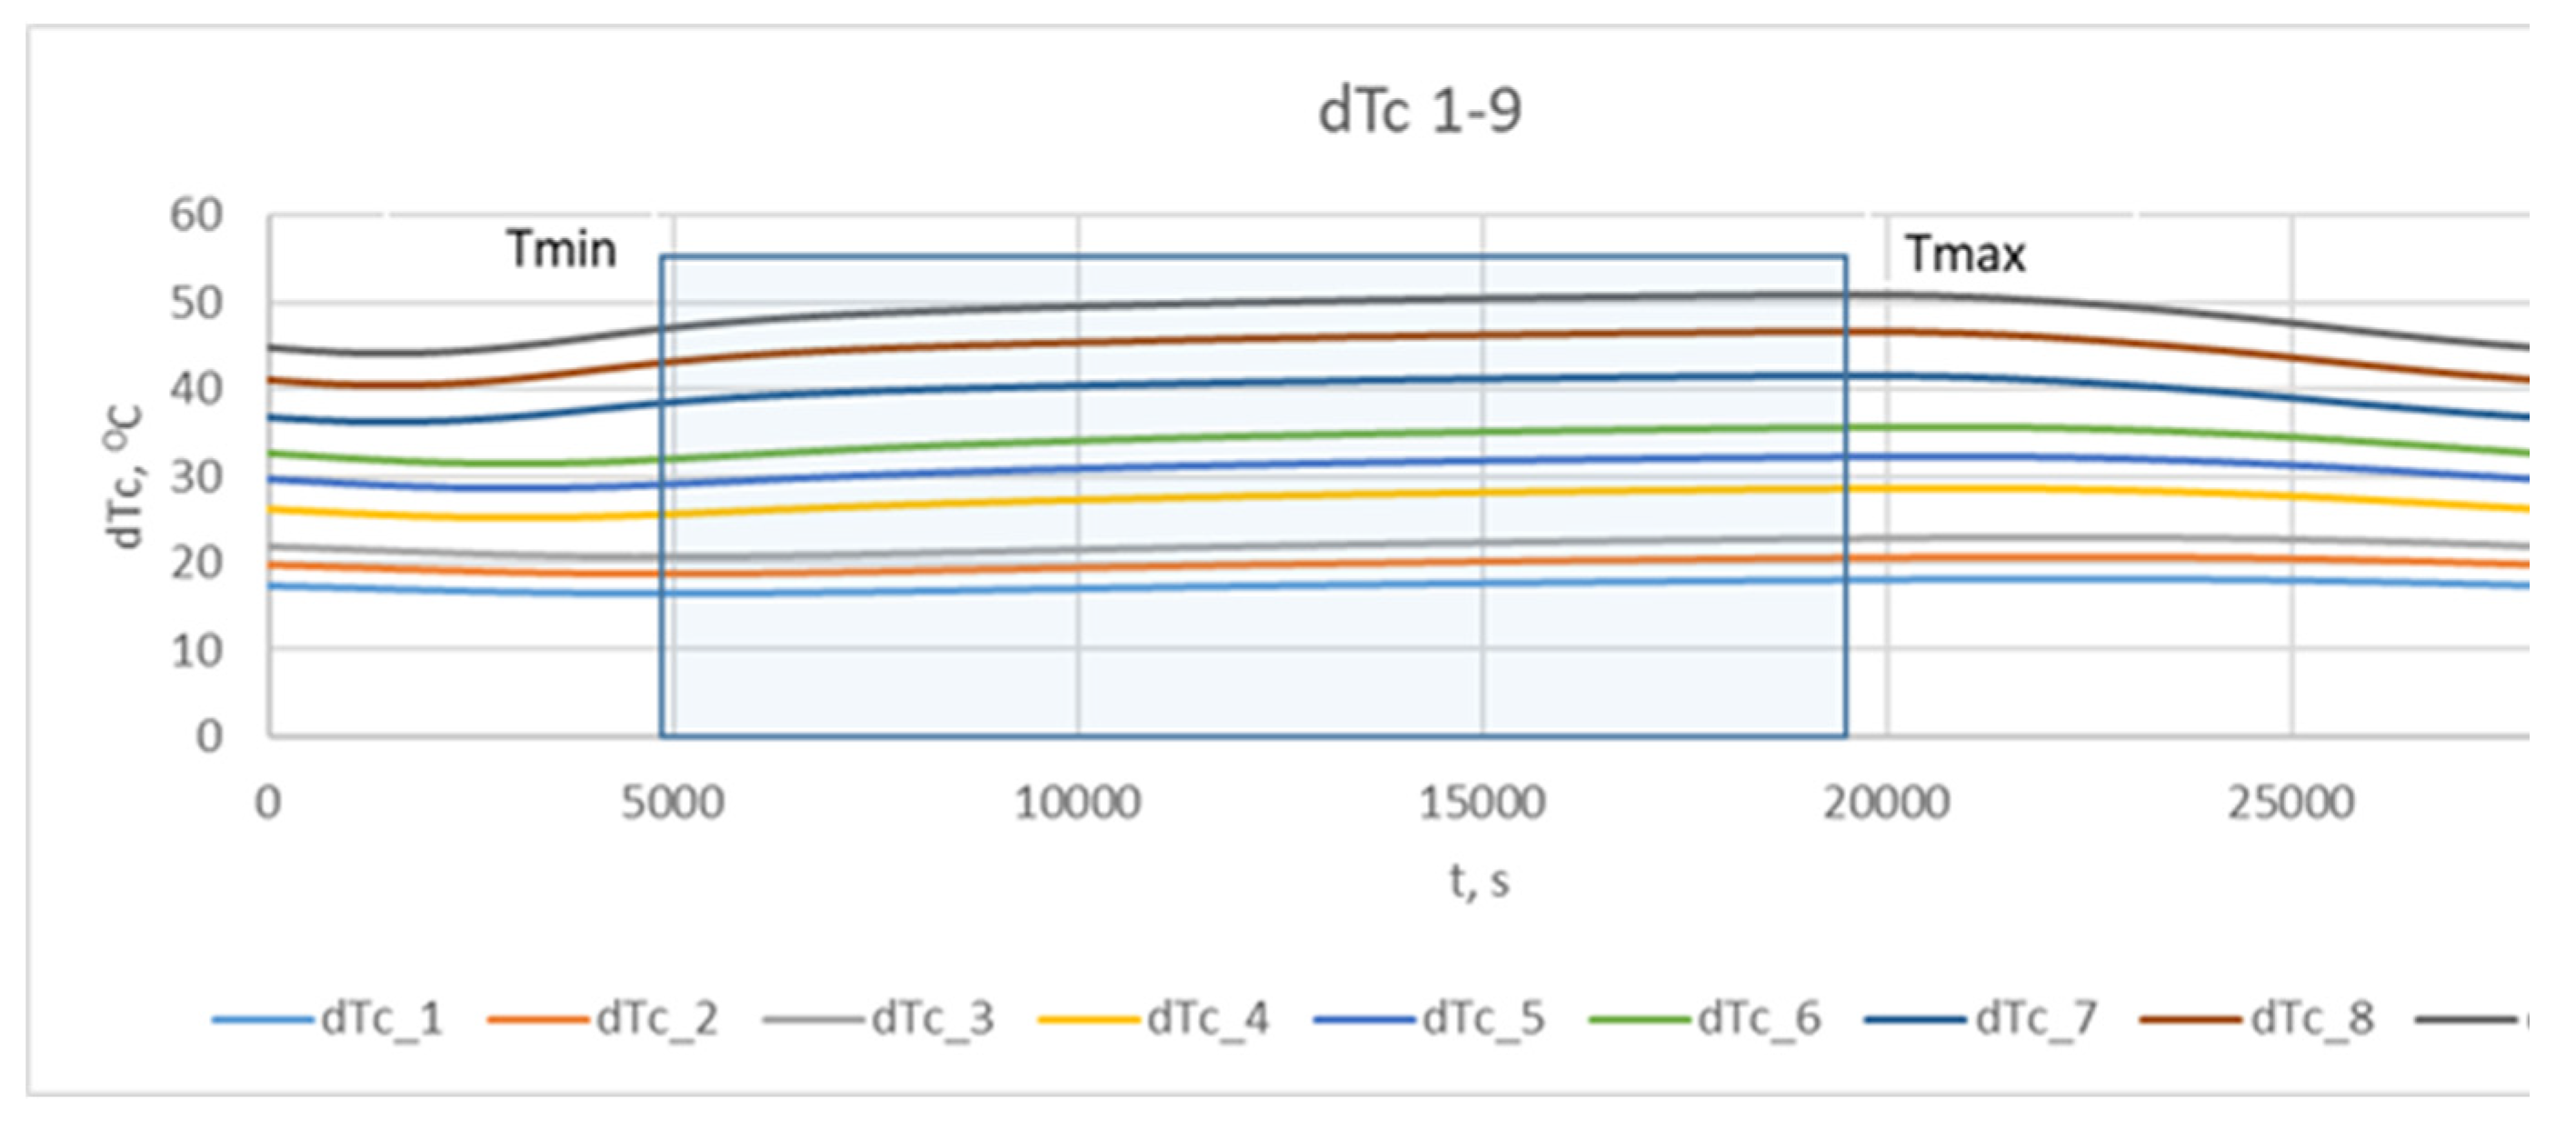
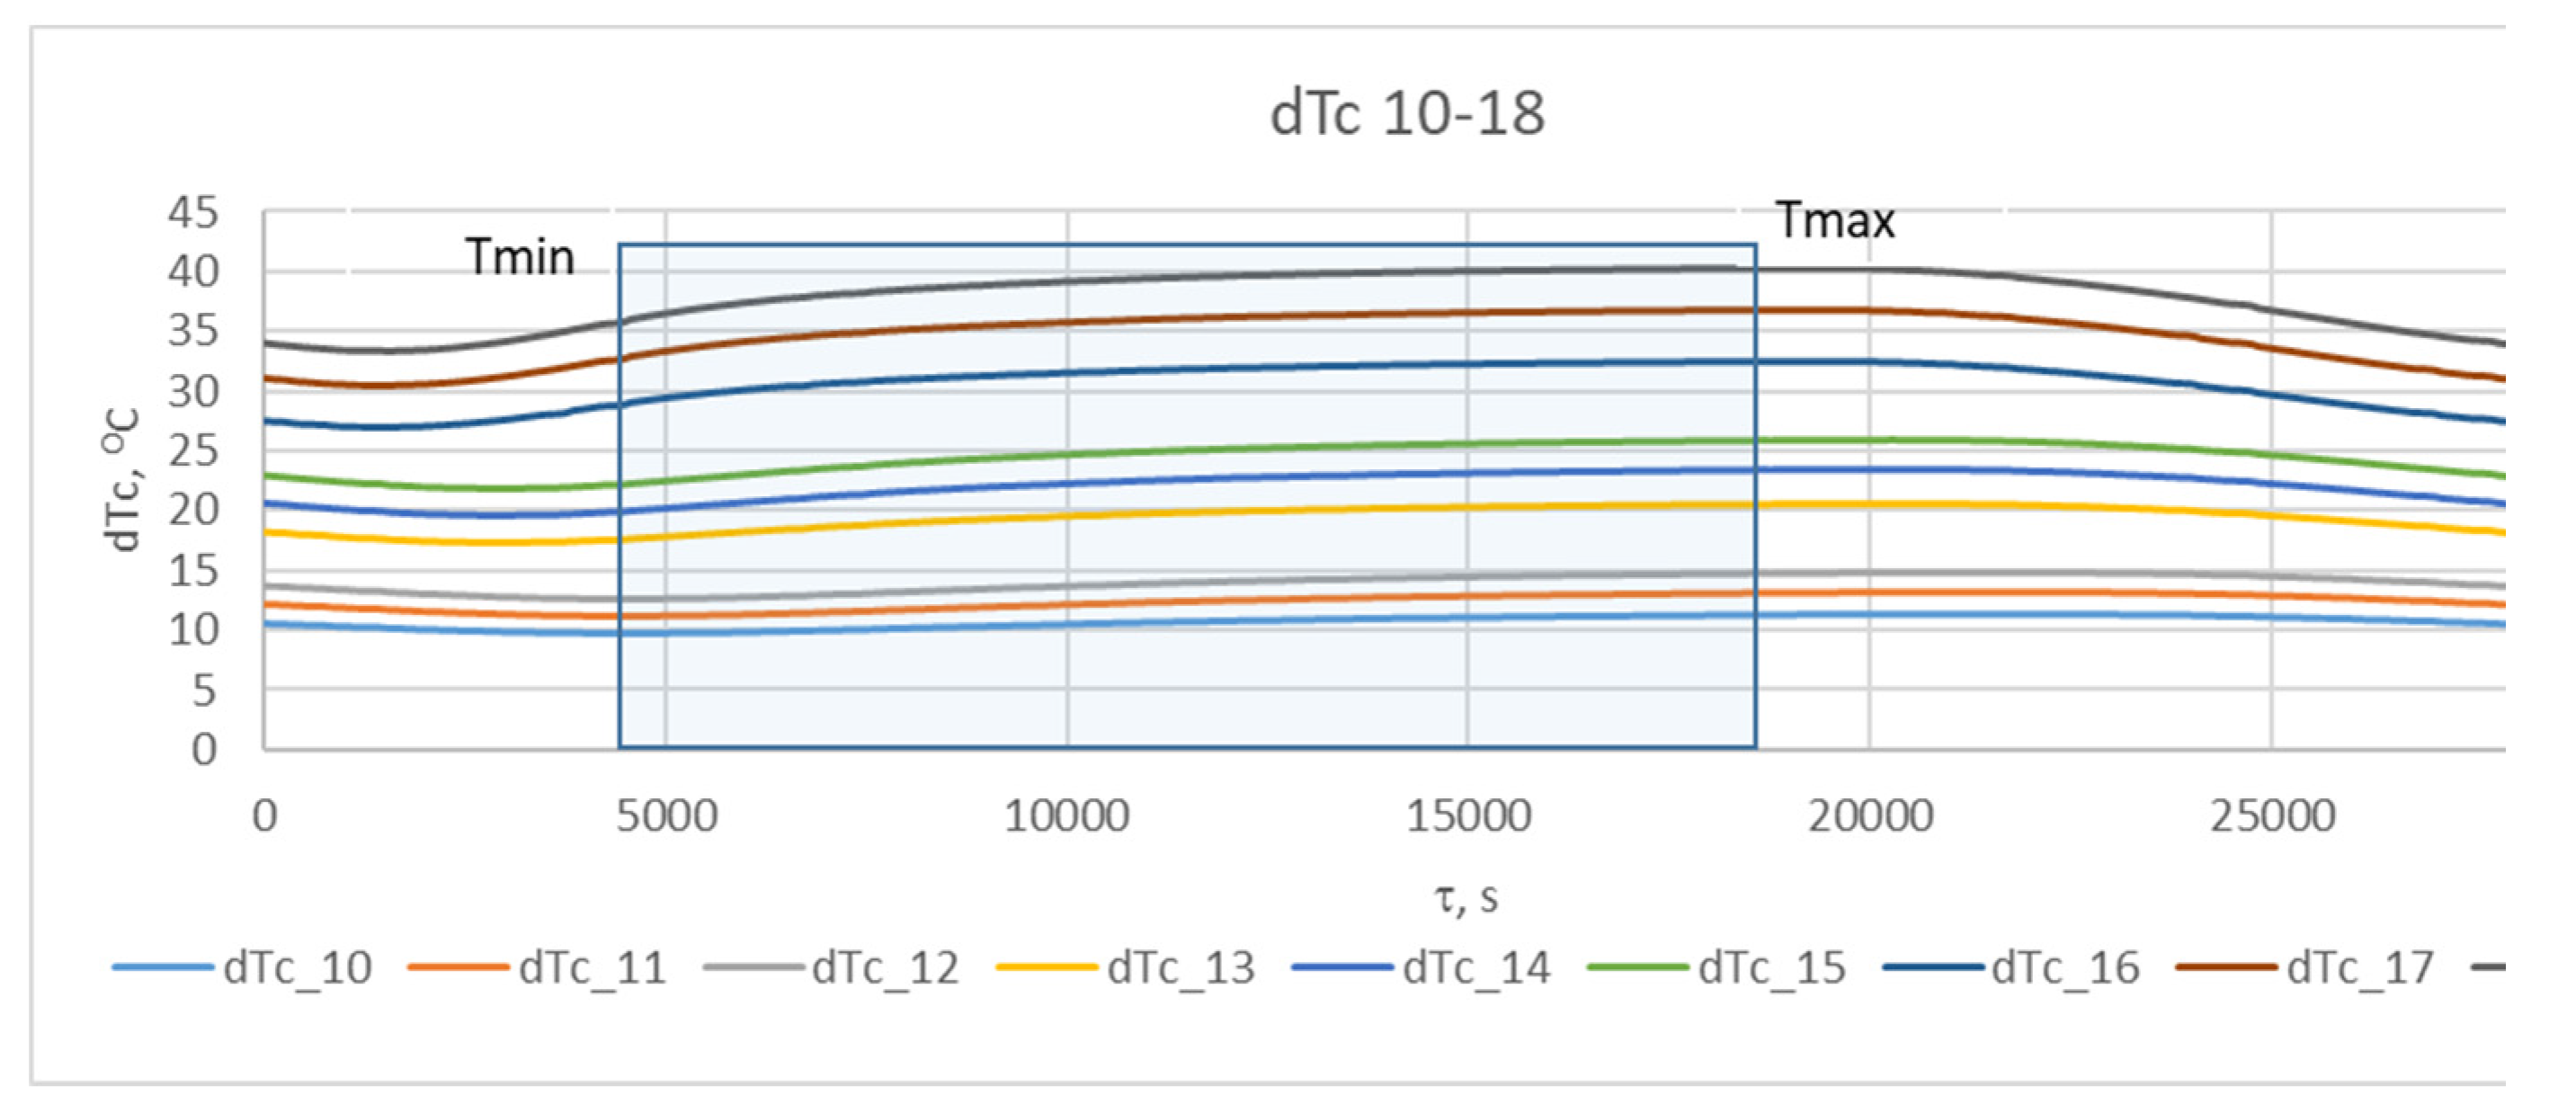
The difference between the values of these temperatures over time represents the change in temperature contrast throughout the converter operating cycle, dTτC = T τm - Tτf.
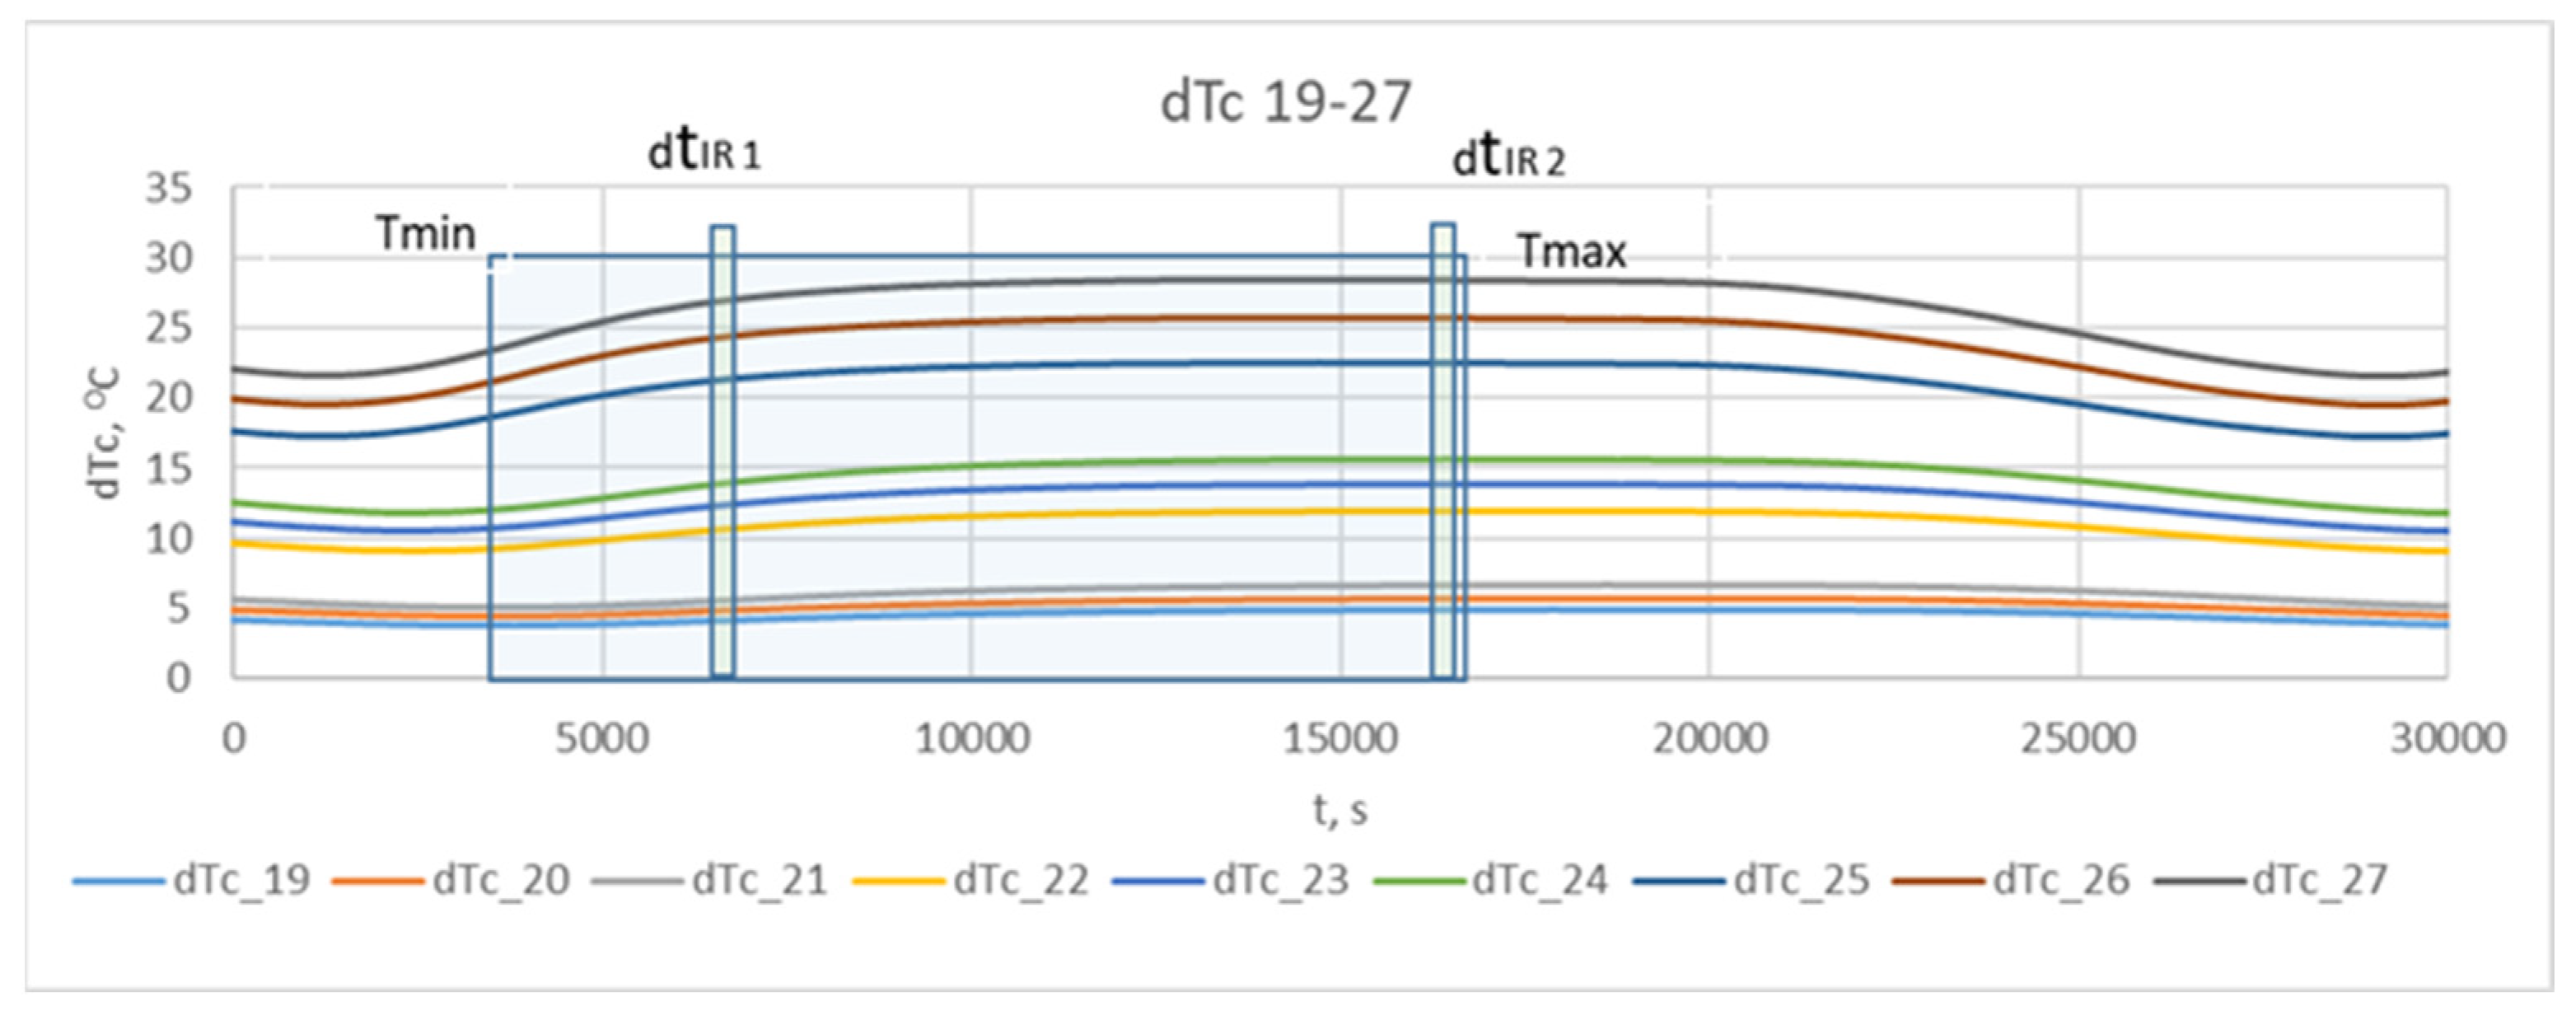
The results obtained for the change in temperature contrast dTτ
C (denoted as dT
C ) throughout one operating cycle at different stages of the operational period (campaign) are presented in
Figure 7Figure 8 and
Figure 9.
Figure 7 presents the results of the studies for the first nine combinations of the experimental design (
Table 2), relating to the initial wall thickness X
1 = 0.375 m, i.e., at the beginning of the refractory insulation life cycle, in the absence of wear.
Figure 8 presents the results of the studies for the second nine combinations of the experimental design, relating to refractory insulation thickness X
1 = 0.285 m, i.e., in the middle of the campaign (life cycle).
Figure 9 presents the results of the studies for the third nine combinations of the experimental design, relating to the wall thickness X
1 = 0.195 m, i.e., at the end of the refractory insulation campaign.
From
Figure 7,
Figure 8 and
Figure 9, it can be seen that during the technological cycle, the temperature contrast passes through minimum and maximum values.
Figure 7 shows that for combination No. 1 from
Table 2 of the experimental plan, the minimum value of the temperature contrast is observed at 5000 s from the beginning of the technological cycle, while the maximum is for combination No. 9, at 19700 s. A summary of the times at which the minimum and maximum values of the temperature contrast are observed for the three levels of residual thickness of the refractory wall in the defect-free area is presented in
Table 3.
The table shows that the compromise zone between the maximal and minimal values for all combinations can be formulated as the range between the highest value of the minimum levels and the lowest value of the maximum levels. They are accounted for by the minimal value of the change in temperature contrast for combination No. 1 and the maximal value for combination No. 27, as presented in the experimental plan in
Table 2. It can be summarized that the zone in which the time for conducting the thermographic control should be selected is within the range of 5000 - 17200 s from the beginning of the technological cycle. Considering the design and technological features of the process implementation, three time intervals are suitable for conducting measurements across the entire surface. These are the times for pouring the slag after the first and second stages of blowing, as well as the time for pouring the black copper at the end of the process. In these stages, the converter is turned around its horizontal axis, allowing for thermographic measurements of the lower part of the cylindrical body's surface. The time for pouring the slag after the second blowing, at the end of the first period, indicated in
Figure 9 as dT
IR1 (with an interval of 5700÷6300s), is suitable for conducting measurements for early diagnostics. The time of pouring the black copper at the end of the process, dT
IR2 (with an interval of 16500÷17100s), is suitable for diagnostics at maximum temperature contrast. The results obtained for the non-stationary temperature field on the external surface of the converter for the different combinations of the planned experiment enable the background temperature values to be accounted for at the beginning of the two time intervals, which are suitable for thermographic monitoring.
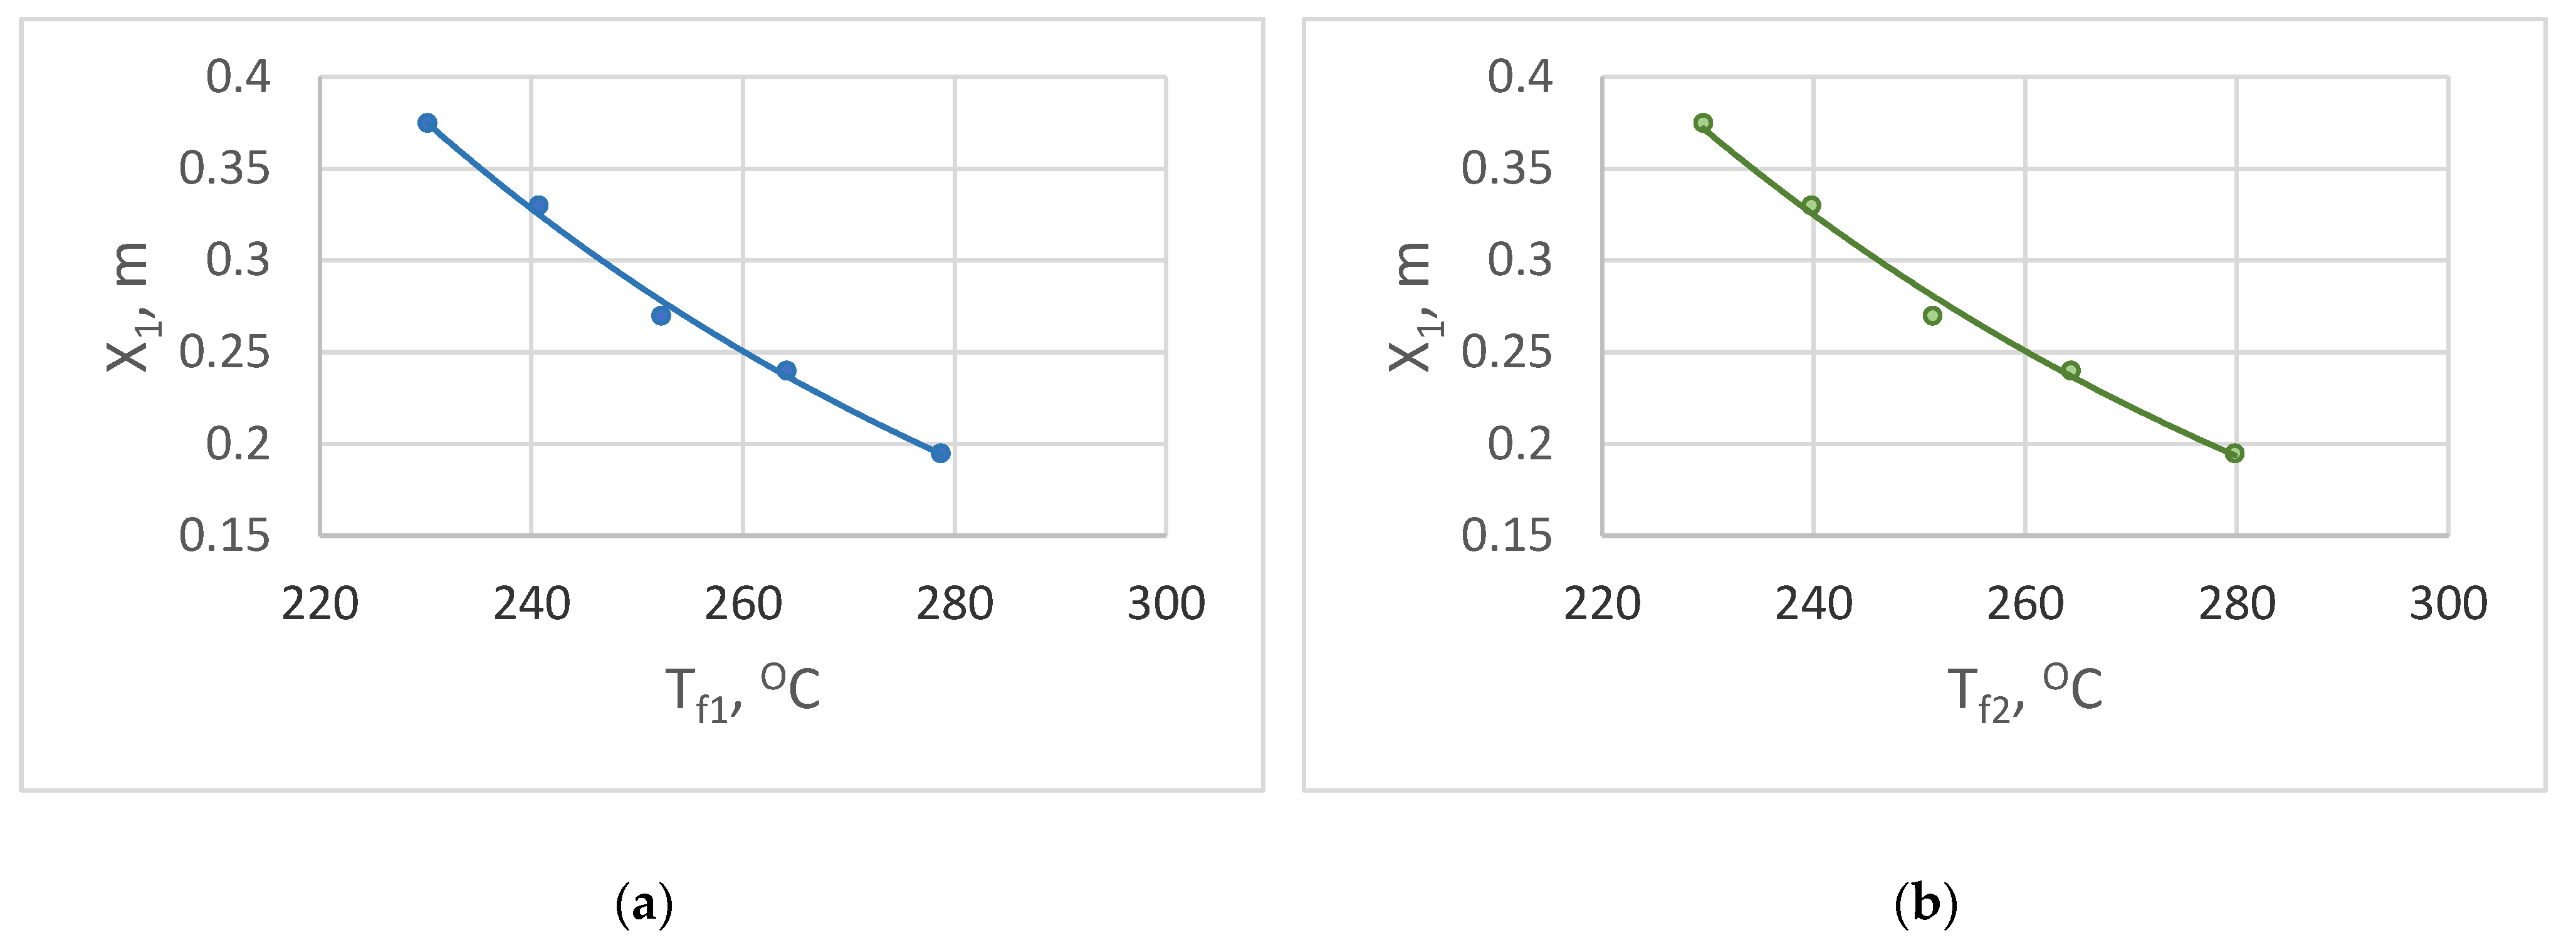
For this purpose, additional studies have been conducted to determine the background temperature change at five different levels of wall wear in the defect-free area. Graphical relationships have been established between the values of the background temperature (Tf) and the corresponding thicknesses of the refractory insulation (X1) for each of the above-described two periods of thermographic observation.
The results are illustrated by the graphical dependencies presented in
Figure 10a and
Figure 10b, where T
f1 (
Figure 10a) refers to the background temperatures during the slag tapping period, and T
f2 (
Figure 10b) refers to the period at the end of the technological process.
The results for the background temperature and the corresponding refractory insulation thickness for the two measurement periods were subjected to a correlation analysis, the results of which are presented in
Table 4.
From the obtained values in the correlation matrix, it can be seen that between the background temperature and the wall thickness in the defect-free area for both cases of study, the correlation coefficient has values (R > 0.98). This allows the background temperature to be considered as a diagnostic parameter, based on which a relationship can be established to assess the total wear of the wall in the defect-free area.
As a result of statistical processing of the results, regression dependences have been derived, allowing prediction of the wall thickness in the defect-free area by the background temperature of the outer surface, represented by equations (11) and (12) for the corresponding cases described above, presented in
Figure 10a and
Figure 10b:
The multiple correlation coefficients for both regression dependencies are R² = 0.995 for the early period of inspection and R² = 0.993 for the period of maximum temperature contrast.
For the relevant time ranges, further research will seek to identify diagnostic features and dependencies for assessing the parameters of the local defect and developing a technological regulation for diagnosing the condition of the refractory insulation as part of predictive maintenance procedures.
4. Conclusion
To determine the optimal period for conducting thermographic monitoring of the wall of a converter unit, the change in the surface temperature field in the presence of local damage to the internal surface was investigated. The behaviour of the temperature contrast during the technological process of the converter and at different stages of the operating cycle was analysed. It was found that from a technological, constructive, and thermal engineering point of view, the time at the end of the first period when pouring the slag after the second blowdown can be used for early diagnostics, and the time of pouring the liquid metal after the second period can be used for diagnostics at a maximum differential temperature signal.
Based on correlation analysis, it was established that background temperature can be used as a diagnostic parameter. Statistical processing of the results for the values of the surface temperature distribution, regression dependences were established, allowing the determination of the residual wall thickness as a function of the temperature in the defect-free area.
The established periods will be utilized in future research to develop diagnostic procedures for assessing the parameters of the damage and the actual condition of refractory insulation when implementing predictive maintenance procedures for converter units in non-ferrous metallurgy.
Author Contributions
Conceptualization, Em. M. and D. Ch.; methodology, Em. M. and M. A.; investigation, Em. M., D. Ch., M.A., and M. I.; resources, Em. M., D. Dh., M. A., and M. I.; writing — original draft preparation, Em. M., D. Ch., M. A., and M. I., writing — review and editing, Em. M. and D. Ch.; supervision, Em. M. All authors have read and agreed to the published version of the manuscript.
Funding
This study is funded by the European Union- NextGenerationEU, through the National Recovery and Resilience Plan of the Republic of Bulgaria, project N BG-RRP-2.004-0002, " BiOrgaMCT ".
Institutional Review Board Statement
No applicable.
Informed Consent Statement
No applicable.
Data Availability Statement
The original contributions presented in this study are included in the article. Further inquiries can be directed to the corresponding author.
Conflicts of Interest
The authors declare no conflicts of interest.
References
- Severson K.; Chaiwatanodom, P.; Braatz, R. Perspectives on Process Monitoring of Industrial Systems. IFAC-Papers Online, 2014, 48(21). 931-939. [CrossRef]
- Chang L.; Russell, E.; Braatz, R. Fault Detection and Diagnosis in Industrial Systems, Springer-Verlag, London ,England, 2001, 279. [CrossRef]
- Iserman R. Fault-Diagnosis Systems, Springer-Verlag Berlin, Heidelberg, Germany, 2006, 475. [CrossRef]
- Yemelyanov V , Yemelyanova, N.; Morozova, O.; Nedelkin, A. Specialized computer system to diagnose critical lined equipment, International Conference Information Technologies in Business and Industry, IOP Publishing, IOP Conf. Series: Journal of Physics: Conf. Series 2018, 1015, 1-5. [CrossRef]
- Yemelyanov, V.; Tochilkina, T.; Nedelkin, A.; Shved, E. Automation of monitoring and diagnosing the technical condition of torpedo ladle cars, MATEC Web of Conferences, 2018, 16-19 May, Novosibirsk; Russian Federation, 239. [CrossRef]
- Vavilov V.; Burleigh, D. Infrared Thermography and Thermal Nondestructive Testing, Springer, Cham, Switzerland, 2020, 598.http:10.1007/978-3-030-48002-8.
- Vavilov, V. Pulsed thermal NDT of materials: back to basics. Nondestructive Testing and Evaluation, 2007, 22 (2-3), 177–197.
- Tucci G.; Conti A.; Fiorini L. Refractory Brick Lining Measurement and Monitoring in a Rotary Kiln with Terrestrial Laser Scanning, Book: R3 in Geomatics: Research, Results and Review, Parente, C.; Troisi, S; Vettore, A., Eds.; Springer Cham, Switzerland, 2020, 1, 296-310. [CrossRef]
- Ng, K.; Kapusta, J.; Harris, R.; Harris, R., Wraich, A.; Parra, R. Modelling Peirce-Smith Converter Operating Costs. JOM 2005, 7, 52-57. [CrossRef]
- Kapusta, J. The International Peirce-Smith Converting Centennial Symposium: A look ahead. JOM, 60(10), October 2008. [CrossRef]
- Valencia, A.; Paredes, R.; Rosales, M.;Godoy, E.; Ortega, J. Fluid Dynamics of Submerged Gas Injection into a Liquid in a Model of Copper Converter. Int. Communication in Heat and Mass Transfer, 2004, 31(1), 21-30. [CrossRef]
- Rigby, J. Controlling the processing parameters affecting the refractory requirements for Peirce-Smith converters and anode refining vessels. TMS Annual Meeting, January 2005.
- Petkov, V.; Jones, P.; Boydens, E.; Blanpain, B.; Wollants, P. Chemical corrosion mechanisms of magnesia-chromite and chrome-free refractory bricks by copper metal and anode slag. J. Eur. Ceram. Soc., 2007, 27, 2433-2444. [CrossRef]
- Liow J.; Tsirikis, P.; Gray, N. Study of refractory wear in the tuyere region of a Peirce-Smith nickel converter. Can. Metal. Quart. 1998, 2(37), 99-117. [CrossRef]
- Malfliet A.; Lotfian, S.; Scheunis, L.; Petkov, V.; Pandelaers, L.; Jones, P.; Blanpain, B. Degradation mechanisms and use of refractory linings in copper production processes: A critical review. Journal of the European Ceramic Society, 2014, 34(3), 849-876. [CrossRef]
- Chibwe, D.K.; Akdogan, G.; Taskinen, P.; Eksteen, J.J. Modeling of fluid flow phenomena in Peirce-Smith copper converters and analysis of combined blowing concept. J.S. Afr. Inst. Min. Metal., 2015,115(5), 363-374.
- Hadjiski, M.; Boshnakov, K.; Ginchev, T. Cost Oriented Redesign of Condition-Based Maintenance of Copper Converting Process, 15th Workshop on International Stability, Technology, and Culture. The International Federation of Automatic Control, Prishtina, Kosovo, June 6-8, 2013.
- Song,Y.; Peng, X.; Dong, W.; Hu, Z. Data Driven Optimal Decision Making Modeling for Copper-mate Converting Process by Means of Data Mining, Proc. Fifth International Conference on Digital Image Processing, (SPIE 8878), 19 July 2013. [CrossRef]
- Horebbeek, A.V.; Pintelon, L. Optimal Prognostic Maintenance Planning for Multi-component Systems, In: Proceedings ESREL 2011, Troyes, France, 2011, 910 – 917.
- Van,P.D.; Levart, E.; Voisin, A.; Iung, B.Remaining Useful Life (RUL) based Maintenance Decision Making for Deterioration Systems, 2-nd IFAC Workshop on Advanced Maintenance Engineering, Service and Technology, Seville, Spain, 2012.
- Tomova F., Application of the Monte Carlo method for forecasting the duration of Peirce-Smith converter campaigns. Journal of Chemical Technology and Metallurgy, 2022, 57(4), 857-871.
- Goni Ch.; Barbes, M.; Bazan, V.; Brandaleze, E.; Parra, R.; Gonzalez, L. The Mechanism of Thermal Spalling in the wear of the Peirce-Smith Copper Converter. Journal of the Ceramic Society in Japan, 2006, 114 (8), 672–675. [CrossRef]
- Gregurek D.; Reinharter, K.; Schmid, J.; Wenz, C.; Spanring, A. Typical Refractory Wear Phenomena in Copper Vessels and Novel Monitoring Technologies. China's Refractories, 2021, 30(2), 16-21. [CrossRef]
- Petkov V.; Jones, P.; Blanpain, B. Optimization of an Anode Furnace Refractory Lining Using Distinct Magnesia-Chromite Refractory Types. World of Metallurgy – ERZMETALL 2007; 60(4), 255 – 264.
- Pérez I.; Moreno-Ventas, I.; Ríos, G. Post-mortem study of magnesia-chromite refractory used in Peirce-Smith Converter for copper-making process, supported by thermochemical calculations. Ceramics International, 2018, 44(12), 13476-13486. [CrossRef]
- Choshnova D.; Ivanova M.; Asenova M.; Mihailov Em.; Petrova I. Investigation of the Operating Parameters of a High-Temperature Unit for the Production of Blister Copper. International Journal NDT DAYS , 2024, Volume VII(3) 117-125 (in Bulgarian).
- Stansbie, C. H. Dissertation: Natural Gas Burner for Copper Smelter Converter, Doctoral Thesis, University of Southern Queensland, Southern Queensland, October 2024.
|
Disclaimer/Publisher’s Note: The statements, opinions and data contained in all publications are solely those of the individual author(s) and contributor(s) and not of MDPI and/or the editor(s). MDPI and/or the editor(s) disclaim responsibility for any injury to people or property resulting from any ideas, methods, instructions or products referred to in the content. |
© 2025 by the authors. Licensee MDPI, Basel, Switzerland. This article is an open access article distributed under the terms and conditions of the Creative Commons Attribution (CC BY) license (http://creativecommons.org/licenses/by/4.0/).