
Submitted:
06 August 2025
Posted:
11 August 2025
You are already at the latest version
Abstract
The preservation of archaeological bone is of great importance for both archaeological and conservation science studies. Traditional methods of preservation assessment, such as Attenuated Total Reflectance Fourier Transform Infrared Spectroscopy (ATR-FTIR), are minimally invasive and destructive. Neutron and X-ray tomography offer a totally non-invasive novel analysis method for the state of preservation of archaeological bones. Seven archaeological animal bones were selected for analysis based animal maturity, species, visual factors, and ATR-FTIR analysis results [1]. Archaeological bone is a hierarchical composite material constructed from both organic and mineral components, therefore neutron tomography and synchrotron X-ray tomography have been combined in this novel approach to assess the state of preservation of animal archaeological bone. The neutron data demonstrated that the organic distribution along the diaphysis of archaeological bones varied significantly both within bones and between different animal bones. There is minimal consistency between the samples, emphasising the inhomogeneity in archaeological bone collections. X-ray revealed unseen physical details, including cracks and substantial damage. The collection of this information via non-invasive methods is highly valuable for cultural heritage, providing a deeper understanding of the observed inhomogeneity in ATR-FTIR analysis data and revealing obscured physical details.
Keywords:
animal archaeological bone
; neutron tomography
; synchrotron X-ray tomography
; conservation science
; FTIR
; XRF
1. Introduction
Archaeological bones are an important historical resource; they contain information about the people and animals that have preceded us in history. This information exists within museums as bulk animal remains, carefully stored human remains, and worked bone objects. They have long taphonomic histories, undergoing several stages of deterioration during their post-mortem lifetime, such as butchery and cooking practices, funerary practices, diagenesis during burial, and deterioration and post excavation conditions of display and storage in the museum environment. All of which contribute to an inhomogeneous state of preservation.
Bone is a hierarchical composite material composed of 60-70 % mineral, specifically a form of carbonated hydroxyapatite known as bioapatite, and 20-30 % organic material, predominantly type I collagen (80-90 %), with, the remainder consisting of water [1]. Cortical tissue features a dense structure of osteons, which are composed of concentric lamellae layers of mineralised collagen [2]. During burial, bones undergo several degradation mechanisms in a process called diagenesis [3]. These include the dissolution and precipitation of bioapatite, the hydrolysis of collagen, and microbial attack. The extent of each process is dependent on variable conditions within the burial environment [4].
A variety of analytical techniques has been used to investigate the state of preservation of archaeological bone. This includes, but is not limited to, Fourier Transform Infrared Spectroscopy (FTIR), which has been predominantly employed to evaluate preservation of the mineral components in bones. These studies [5,6] are interested in the relationship between the burial environment and the condition of the bone. Several analytical methods, including FTIR and elemental analysis, have been used to pre-screen bones for more complex and expensive analysis, e.g., ancient DNA (aDNA) analysis and carbon isotope analysis [7,8]. Histology, analysed via thin sectioning and forms of microscopy, looks at the microstructure of bones and evidence of microbial attack [9,10]. By the very nature of the process this results in the partial destruction of the bone. These techniques look at the preservation of archaeological bones regarding the diagenesis mechanisms, and how they have affected aspects such as DNA preservation [7]. However, each method requires sampling either in the form of drilling or complete sample destruction. Both neutron and synchrotron X-ray tomography techniques have been used as non-invasive analysis of fossilised mineralised tissue, primarily to conduct virtual micro-excavation of fragile fossilised material [11,12,13].
Neutron and X-ray tomography offer a unique, complementary, non-invasive method to assess the state of preservation of archaeological bones. Neutrons interact primarily with the nucleus and have a non-linear relationship with the atomic mass, generally showing greater attenuation with lighter elements [14]. Therefore, increased neutron attenuation indicates the presence of hydrogenous organic content within bones, such as the presence of collagen. X-rays interact with an atom’s electrons and the attenuation has a linear relationship with the atomic numbers of the elements. Consequently, elements with higher atomic numbers, such as those found in the mineral components of bones, exhibit X-ray attenuation.
This study aims to evaluate two specific aspects of the state of preservation of archaeological bone; firstly, the imaging of bone’s compositional inhomogeneity to better understand the variation seen in the FTIR analysis. Secondly, the combined non-destructive neutron and X-ray tomography results reveal physical damage and vulnerabilities not evident during visual assessment. These observations were complemented by portable X-ray Fluorescence (pXRF) performing surface heavy elemental analysis. Seven archaeological bones, primarily long cattle bones, were selected for analysis. They were excavated from four archaeological sites of varying periods; the Medieval site of Battle Abbey (BAT), the Tudor Camber Castle (CAM), and the Roman Corbridge Roman Town (CRB), and Housesteads Roman Fort (HST) [15,16,17,18].
2. Materials and Methods
2.1. Sample Selection
All the bones studied are long bones which consist of the same gross anatomy (Figure 1). The long shaft, referred to as the diaphysis, is composed of dense cortical tissue and is the focus of our study. Each bone was broken for access to the medullary cavity and the bone marrow within during their original use. Therefore, each bone also consists of only one epiphysis, the head of the bone constructed of a thin cortical layer housing trabecular tissue, a more open structure once containing additional soft tissue. In some cases, the trabecular tissue has been lost. The other epiphysis was removed prior to deposition leaving the historical break.
Seven archaeological bones were selected to represent various aspects of the collection. They included material from four archaeological sites [15,16,17,18], deposited at different times and with different excavation histories (Table 1). Most of the samples featured within the study were cattle bones, except for CRB3 which could not be confidently identified due to extensive deterioration and the loss of identifying features. Cattle was a primary species found at each site, suggesting it was a primary species throughout the English Heritage (EH) archaeological bulk finds. Almost all the samples are sourced from adults; however, BAT5 is a juvenile and HST1 is a sub-adult. These proportions of adult, juvenile, and sub-adult are representative of the EH collection. Younger individuals are often under-represented in collections due to their greater vulnerability to diagenesis mechanisms.
Visual appearance of the bones was another factors used for their selection (Figure 2). It was anticipated that these samples would exhibit interesting physical details not visible by visual inspection. Bone BAT5 (Figure 2a) has a pale exterior surface, with little to no sediment present. The surface is also fragile and powdery when handled. This indicates that the bone may have been washed post-excavation. Bone HST1 (Figure 2c) also has a pale exterior surface, however sediment is evident at the epiphysis and inside the medullary cavity. The surface is stable when handled. The bones excavated from Corbridge Roman Town have more surface discolouration, varying from patches of brown (CRB3 and CRB12) to complete discolouration (CRB2 and CRB9). Bones CRB2 and CRB9 have shiny surfaces, showing little signs of weathering. However, CRB3 is extremely weathered and has signs of burning near the epiphysis. Finally, CRB12 has a lightly weathered surface and is slightly powdery when handled. The organic content of the bones were also considered. This was based on FTIR measurements as described in section 2.3 and the results are presented in section 3.2 of this paper.
2.2. Neutron and X-ray tomography
Neutron tomography data were collected at the Imaging and Materials Science & Engineering (IMAT), ISIS and Neutron Muon Source, UK [19,20] using an optical camera box equipped with a gated Andor CCD module with 2048 × 2048 pixels, each pixel of 59×59 μm. Each neutron tomography consisted of 1020 projections over 360° rotation, with 6 flat field (open beam) and 6 dark field (no beam) images and 30 s exposure time per image. Tomographic reconstruction was performed using Octopus software [21], while subsequent analysis and modelling were completed with Avizo 9.0.1 [22] and Fiji/ImageJ [23] (Figure 3).
The X-ray tomography data were acquired at Joint Engineering, Environmental, and Processing (JEEP), I12, Diamond Light Source, UK [24]. 3600 projections were captured using the PCO.edge with optical module 1, pixel size of 18.5 µm. Due to the sample dimensions each bone was imaged in up to 16 sections, which were then reconstructed individually using SAVU software developed at Diamond [25].
2.3. Attenuated Total Reflectance Fourier Transform Infrared Spectroscopy (ATR-FTIR)
Attenuated Total Reflectance Fourier Transform Infrared Spectroscopy (ATR-FTIR) has been used to assess the state of preservation of the organic conponent of the archaeological bones. Each bone was sampled at three locations along the cortical bone of the diaphysis. Modern cattle sourced from a local butcher were included to contextualise the archaeological bone. The surface 2 mm of the archaeological bones sample area was removed using a scalpel, and sample material was extracted with a motorised drill. Spectra were collected using the ThermoScientific Nicolet iS5 with the iD5 ATR attachment [26], using 32 scans and a range of 4000-550 cm-1. Data was processed on the GRAMS AI 8.0 software [27]. Each measurement was repeated five times.
2.4. Portable X-ray Florescence (pXRF)
Portable X-ray florescence (pXRF) has been used to detect the presence of heavy elements on the discoloured surface of the archaeological bone samples. The analysis was performed on two or three sites along the diaphysis wall of the selected bones, designated as X1, X2, and X3. Areas of different tones were chosen for examination. Each measurement was acquired using the Bruker Tracer 5, at 40 kV and 14 µA for 120 seconds. The equipment was calibrated for heavy elements (Nutrisoil_20), and a heavy element filter (Cu 75 µm, Ti 25 µm, Al 200 µm) to identify elemental contamination such as iron on the surface of the bone. The archaeological bones were not cut or altered prior to pXRF analysis and were measured at different distances from the detector due to variable geometry. The elemental peaks were categorised as either major (M), minor (m) or trace (t), and were assessed using the software Peakaboo 5.5 [28].
3. Results
3.1. Neutron and X-Ray Tomography
The neutron and X-ray results are presented together as they provide complementary information and collectively provide extensive information regarding the state of preservation of each bone. Historical sample BAT5 (shown in Figure 2a), like most of the other selected samples has low organic content as indicated by the low AmI/P values of 0.061-0.070 (section 3.2, Figure 11). There is also some inhomogeneity across the length of the diaphysis as shown by the AmI/P ratio, with a slight increase in relative organic content towards the epiphysis head (BAT5A) (Figure 11). The neutron tomography data have indicated that this bone has an inconsistent distribution of high organic content in the centre of the diaphysis, highlighting accelerated deterioration on the surface of the bone (Figure 4A) and higher organic content towards the historical break (BAT5C). The complexity of this internal organic inhomogeneity was not evident in ATR-FTIR results.
The X-ray tomography results revealed that the exterior surface is extremely damaged and has a lacey fractured appearance (Figure 5B). This loss of cortical bone will have also contributed to the low neutron attenuation on the surface of the bone. This feature is unique to sample BAT5 and may be evidence of plexiform bone, a form of immature mineralised tissue seen in rapidly growing quadruped animals such as cattle. It is brick like in appearance and less mineralised than mature cortical bone [29]. It is therefore less stable and more vulnerable to taphonomic diagenetic alterations, such as mineral dissolution and collagen hydrolysis during diagenesis [4]. Due to the pale and clean (little to no sediment) appearance of BAT5 the surface damage may be caused by extensive post-excavation water washing. Recent research by Valtierra, N., et al., has indicated that exposure to washing post-excavation causes dissolution of the mineral component and damage to the surface [30]. This may have also been exaggerated by the presence of plexiform bone. During handling the damaged surface caused powdering, highlighting the physical instability of the surface. This structure and pale colour correlate with the pXRF analysis which indicates an inhomogeneous minor to trace amount of heavy elements on the surface (Table 2). Sediment is trapped in the nutrient foramen, a channel which cuts through the cortical tissue of the diaphysis, connecting the medullary cavity to the rest of the body. The sediment is visible in the X-ray tomography data (Figure 5b), but it is less distinguishable in the neutron data (Figure 4A). An overlay of the neutron and X-ray tomography images (Figure 4C) in neutron (red) and X-ray (teal) highlights the contrast between the techniques. Particularly the high organic content (red) beneath the damaged and fragmented surface (teal), and the near invisibility of the sediment in the neutron tomography.
CAM3, an adult cattle bone excavated from Camber Castle, was imaged using neutron tomography. The bone is pale in colour but has a stable surface when handled. There are also several signs of physical damage, such as cracks (Figure 5a). Neutron tomography data shows that organic distribution within the bone is highly localised and variable. The cross-section indicates that the medullary cavity and cracking through the diaphysis wall have facilitated a rapid loss of organic material, leading to areas of poor organic preservation along the interior surface (Figure 5a). Therefore, the pattern of inhomogeneity in organic content identified in the FTIR analysis is not a true indication of the pattern of degradation. The organic variation is very localised, as seen in the neutron data. The exterior has high attenuation indicating more organic content. Similarly to BAT5, CAM3, is pale in colour and the pXRF analysis indicated it has peaks in Fe and Pb present in minor concentrations.
Object HST1, a sub-adult cattle bone from Housesteads Roman Fort, located along Hadrian’s Wall, was imaged using neutron tomography only. The bone has extensive damage running down the diaphysis (Figure 2c). During diagenesis, a stable surface containing more organic content has formed, which likely includes organic contaminants (Figure 5b). An inconsistent band of high organic content exists in the centre of the diaphysis wall. This feature is less uniform and does not extend through the entire bone. It may be associated with the stability provided by high organic content on the outer surface. The ATR-FTIR analysis results have indicated only small variations in organic content and the complexity of its distribution is not seen in the spot analysis. The neutron tomography also revealed the full extent of the physical damage the bone has experienced. Under visual inspection (Figure 2c) there is a long crack from a historical break and evidence of fragmentation. The imaging has shown extensive fragmentation beneath the surface, with damaged pieces held together by sediment. The pXRF analysis revealed that this sediment contains Fe in minor and major concentrations.
Sample CRB2 is an adult cattle bone with a brown discoloured surface excavated from Corbridge Roman Site (Figure 2b). The neutron tomography has revealed that this surface has a higher organic content than the cortical tissue beneath and is evident as a form of patina. There is also more organic content towards this historical break, suggesting the organic contamination is linked to the exposure to the burial environment (Figure 6a). This conflicts with the results of the FTIR analysis (Figure 11), which indicated that the diaphysis had the most organic content. The AmI/P results of each drilled location are linked to the depth of the patina and the drilling depth, as the patina depth varies across the surface and is over 2 mm in places. The high resolution X-ray tomography also showed this unique patina layer (Figure 6b). This indicates that it contains heavier elements than the rest of the cortical tissue beneath. The presence of Fe in major concentration results confirmed this finding (Table 2). The extensive brown discolours may be attributed to this iron content. The depth of the surface patina is linked to the concentration of contamination by heavy elements, as shown in the pXRF results, which indicate a higher concentration of both Mn and Cu where the patina is thicker. Overlaid images (Figure 6c) have illustrated the varying distribution of organic and heavy elemental composition throughout the bone diaphysis. High organic content is found on the outer surface (Figure 6a), while heavy elements are present around the interior surface of the medullary cavity (Figure 6b). This indicates different diagenesis environments around the bone. The X-ray tomography data also contains evidence of physical vulnerability in the form of cracking and microcracking along the interface between the cortical tissue and the patina. Sample CRB2 is the only one to demonstrate this high-density patina on the outer surface and this feature was not visible under visual assessment.
Bone CRB9 is also an adult cattle bone excavated from Corbridge Roman Town. It has a dark brown surface, and destructive drilling revealed that it is also discoloured beneath the surface. The pXRF results showed that iron (Fe) was present in both major concentrations at both analysed locations, regardless of the extent of discolouration. Bone CRB9 has the highest organic content of the sample material, as indicated by the higher AmI/P ratios of 0.162-0.219 (Figure 11). However, the results show inhomogeneity across the diaphysis. Similarly, to CRB2, the neutron tomography revealed that the bone has higher organic content on the exterior surface of the bone (Figure 7a). The gradient observed is attributed to organic contamination that infiltrates the bone matrix during diagenesis, leading to relatively high organic content on the surface (Figure 7b). X-ray tomography indicates that the bone exhibits a uniform mineral content and elemental composition, as demonstrated by the consistent attenuation observed across the cross-sections. However, the X-ray images disclosed additional sediment-filled cracks that are not visible to the naked eye, in part due to the colour similarity of the sediment and the bone surface. Only 4 cracks can be seen by visual assessment, 6 are visible by neutron tomography, and 9 are visible only by the X-ray tomography measurements due to the higher resolution of X-ray tomography images (Figure 7c). This includes both surface cracks filled with sediment and small microcracks within the cortical tissue. The visual assessment and analysis results indicate the bone is in good condition, and therefore more robust to mechanical changes; however, the cracks suggest physical vulnerability that could be seen by visual examination. There are also small pores (average area 7.4 µm2) throughout the cortical tissue of CRB9 relating to the histological structure of the bone.
X-ray tomography images show strong visual similarities between samples CRB2 and CRB9, both exhibiting high attenuation due to the presence of heavy elements. This was confirmed by pXRF analysis (Table 2). The porosity in the cortical tissue of CRB9 is also evident in the patina of CRB2. This similarity implies both samples were, at least partially, exposed to a particular burial environment which yielded this unique state of preservation. However, there is not contextual information available for this site.
Sample CRB3 is an unidentified adult bone excavated from Corbridge Roman Site, with signs of burning and a highly weathered surface. The neutron tomography has revealed an interesting organic distribution. Running along the centre of the cortical tissue of the diaphysis is a core of very low organic content surrounding an internal crack that is located in the centre of the diaphysis. The diaphysis also contains varied attenuation around the diaphysis cross-section, indicating very uneven organic preservation (Figure 8a). This organic inhomogeneity was identified by ATR-FTIR analysis and the neutron tomography results have explained these results. These features are also seen in the X-ray tomography data confirming the presence of a central crack through parts of the diaphysis wall as well as micro-cracks emanating from the central crack. There is no clear exterior surface layer of high neutron attenuation as seen on some bones, but rather an uneven surface with patches of very low attenuation and therefore low organics. This correlates with the highly altered surface seen in visual assessment. Sample CRB3 also has extensive internal structural damage as seen clearly in the high-resolution X-ray tomography slices (Figure 8b). Firstly, there is the damage along the entire length of the diaphysis. This damage is visually evident by a rough and weathered surface. However, identifying the full extent and depth of this damage through visual inspection alone is not possible. This damage may be linked to the burning process of the bone. The second feature is the evidence of concave fragmentation which is not detectable through by visual assessment; however, a dark scar can be observed above the damage. Tomography has revealed extensive fracturing and fragmentation of cortical tissue below the surface. The surface of CRB3 is discoloured and patchy. These observations are consistent with the pXRF results, which indicated the inconsistent presence of elements including Fe and Mn.
Finally, CRB12 is in exceptionally poor condition, with very low organic content throughout as indicated in the FTIR analysis (Figure 11). Upon visual inspection the bone has patches of surface discolouration which does not penetrate below the surface (Figure 2g). The pXRF results indicated the presence of heavy elements, Fe in major concentration and Mn, Cu, and Zn in minor concentrations (Table 2). The neutron data indicated an increased presence of organic content on the exterior surface (Figure 9a), which has resulted in a stable exterior surface. The rest of the cortical tissue also has localised variation and is not impacted by the cracks along the outside. The X-ray tomography highlights that the higher organic content is accompanied by higher X-ray attenuation, suggesting a localised homogenous preservation (Figure 9b). The lower X-ray attenuation of the centre of the diaphysis indicates that the bone is less dense and may be a linked to the exceptionally low organic content. Several cracks running down the diaphysis of the bone are evident on visual inspection. The X-ray tomography shows that these are shallow, not crossing the diaphysis wall, with a depth of 0.28 cm ± 0.09 cm.
3.2. Attenuated Total Reflectance Fourier Transform Infrared Spectroscopy (ATR-FTIR)
ATR-FTIR analysis was completed as part of a larger body of work to be published elsewhere, and some of the results which contributed to the selection of samples for the advanced imaging are presented here [31]. The amide I (c. 1640 cm-1) to phosphate (c. 1010 cm-1) (Figure 10) peak ratio (AmI/P) provided information regarding the state of preservation of the organic content for sample selection (Figure 2) [32,33]. The estimation of organic content, including collagen, was important for neutron tomography selection as both the quantity and distribution of organic content were of interest. Organic content, in particular type I collagen plays an important role in the mechanical properties of bone [34], and was therefore selected as the primary measure of state of preservation for sample selection. Modern cattle bone has an AmI/P of 0.227 ± 0.011. Kontopoulos, I., et al., assessed the suitability of the AmI/P spectral ratio for prescreening samples for aDNA analysis. Their results indicated that an AmI/P ratio of 0.02 was consistent with a 5 weight percentage (wt%) of collagen and was sufficient for aDNA analysis [7].
Each bone was sampled in three locations along the cortical bone of the diaphysis. Location A was taken near the epiphysis, B central along the diaphysis, and C near the historical break (Figure 11). Bone CRB9 has high levels of remaining organic content, with sample location CRB9A (near the epiphysis head) demonstrating similar AmI/P values to modern cattle bone (0.227 ± 0.011). This high level of organic content is unusual among the sample material. In contrast sample CRB12 has very low remaining organic content, and consistently has the least amount of remaining organic content when compared to modern cattle bone (0.029-0.037 ± 0.005) and close to the lower limit of 0.02 presented by Kontpolulos, I., et al. [7]. The ATR-FTIR results have indicated localised variation in the organic content along the diaphysis of samples CRB3 and CRB9. The distribution of this organic content can be affected by factors such as taphonomic history and burial orientation. However these details are not available for the sites featured within this study. The remaining samples are of homogenous low organic content (BAT5, CAM3, and HST1) and were selected for additional characteristics as described.
3.3. Portable X-ray Florescence (pXRF)
Each selected bone was measured at 2-3 locations along the diaphysis to identify the presence of heavy elements on the surface of the diaphysis. The results indicated a connection between the colour of the bone and the presence of heavy elements. Bones with paler surfaces, BAT5, CAM2 and HST1 had primarily minor and trace (m and t) concentrations of heavy elements, such as iron (Fe), manganese (Mn) and copper (Cu) (Table 2). Whereas the more discoloured samples of Corbridge (CRB2, CRB9, CRB3, and CRB12) show high concentration (M) of Fe, Mn and zinc (Zn). This correlates with the brown discolouration visible on the samples (Figure 2).
Some pale samples show discolouration patches, such as CRB3 in Figure 2. These patches contain more heavy elements (CRB2X2, CRB3X2, CRB12X2, HST13), indicating a link between surface discolouration and heavy elements.
4. Discussion
Identifying the state of preservation of archaeological bones is valuable for both archaeological research and conservation purposes within the heritage environment. The preservation of bone’s organic material, particularly type I collagen, is key to the object’s continued survival. It provides part of the bones mechanical properties, providing flexibility to support the minerals stiffness [34,35]. The conservation of this material is essential for the preservation of ancient DNA [4]. Traditional methods, such as ATR-FTIR, allow for the quantification of organic content in terms of the ratio of peaks observed in FTIR (AmI/P). However, they are limited by their invasive nature and are minimally destructive in nature. Neutron tomography has facilitated the non-invasive visualisation of the distribution of organic material in the bones. A valuable finding of this study has been the visualisation of the inhomogeneity of the distribution of the archaeological bones’ organic content. Inhomogeneity in the state of bone preservation has been recorded elsewhere [36], and was a key result of the ATR-FTIR analysis within this study (Figure 11). It is mostly associated with variation in the burial parameters, such as burial orientation and proximity to other deposited material. Neutron tomography has confirmed that both the cross-sectional distribution and the longitudinal distribution along the diaphysis can vary in organic content. The most common distribution is the higher organic content being located along the outer surface of the diaphysis, as seen in CRB2, CRB9, CRB12 and HST1. Localised organic content can be affected by several aspects of diagenesis, including accelerated loss of original collagen in exposed cortical bone and the addition of organic contaminants absorbed from the surrounding soil. The presence of this layer also correlates with surface stability. However, it is not possible to distinguish between different types of organic material with neutron tomography.
This inhomogeneity of bone has implications for both further analysis and conservation concerns. When regarding localised invasive and destructive pre-screening analysis (such as ATR-FTIR) to predict Zooarchaeology by Mass Spectrometry (ZooMS) performance [37], collagen extraction [38] and ancient DNA extraction [7]) it is possible that the results may be misleading if the sampled location is in particularly good or poor state of preservation. The relationship of organic content to a bone’s mechanical properties may result in variable behaviour in different environments and cause additional strain to the object.
Visual assessment is a key tool in conservation due to its non-invasive nature and accessibility. However, by its nature it is limited to surface details. X-ray tomography has revealed a range of physical details that are either obscured by sediment or hidden beneath the surface. It also shows very fine details, that cannot be seen by visual inspection. The surface damage of BAT5 can be felt during handling, and is evident as surface powdering. This may be linked to water washing, which has been indicated to reduce surface hardness [30]. These surfaces have low organic content and low density, highlighting that both the mineral and organic phase have been altered and lost. In the case of BAT5 fractured layers of the surface were also observed. This may be linked to the presence of plexiform tissue in immature animal bones. The cracking of archaeological bones can occur at any stage of their life cycle, during life, post-mortem and diagenesis. Therefore, we see different attributes associated with the cracking. The tomography analysis has highlighted that they are not always visible. One key example of that is sample CRB9, a bone with high-degree of organic content.
The ATR-FTIR results indicate some details regarding the inhomogeneity of the organic distribution in archaeological bones. Most of the samples, BAT5, CAM3, CRB2, CRB12 and HST1, have fairly homogenous organic content with small variations, while samples CRB3 and CRB9 have a wide range of organic content (expressed in terms of AmI/P values) across their diaphysis demonstrating localised variation (Figure 10). With this method it is not possible to see how accurately the results reflect the distribution of organic content throughout the whole bone. The neutron tomography has illustrated the diverse distributions of organic material in detail. Samples BAT5, HST1 and CRB12 all have consistent organic distribution throughout their diaphysis. The key shared characteristic of BAT5 and HT1 is an uneven distribution of higher organic content throughout the centre of the diaphysis, while CRB12 has higher organic content on the exterior surface. The uneven presence of this has caused the small variations in the AmI/P ratio seen in the ATR-FTIR. Therefore, for these samples we can conclude that the ATR-FTIR analysis does provide sufficient information.
For the archaeological samples CAM3, CRB2, CRB3, and CRB9 the ATR-FTIR results do not reflect the organic distribution seen in the neutron tomography. Sample CAM3 has extensive localised variation with distinct organic concentrations adjacent to each other. This indicates that the ATR-FTIR results will have been greatly impacted by localised variation. Bone CRB2 has, comparatively to the rest of the cortical bone, a high organic patina. The presence of this is also not evident in the ATR-FTIR results as the samples were drilled though the cortical bone from the outer surface. Bone CRB3 is a highly damaged and altered object which was burned before burial. This history has greatly affected the distribution of the remaining organics of the bone, which is reflected in the neutron tomography and the ATR-FTIR results. The organic distribution in CRB3 is highly varied, both along and around the diaphysis. Organic preservation has been affected by physical damage and anatomical features and this was indicated in the ATR-FTIR results.
Overall the neutron tomography has revealed that the spot sampling and measurements associated with techniques such as ATR-FTIR do not always provide an accurate impression of the preservation of the bone. Archaeological bones have a varied and inhomogeneous preservation, the nuance of this cannot be accurately understood via more conventional analytical techniques. There are challenges when directly comparing the AmI/P FTIR results and the neutron tomography images. The spot analysis nature of the FTIR analysis means a small number of samples have been greatly affected by localised inhomogeneity. Due to the complex and unique nature of each bone they contain both native organic content, such as type I collagen, and organic contaminants gained during burial. It is not possible to distinguish between the type of organic content using neutron tomography. Therefore, direct comparison of neutron attenuation values between different imaging experiments is not possible.
The pXRF results indicate a correlation between discolouration and the presence of heavy elements on the surface of the bone diaphysis. Surface discolouration of the archaeological bone surface is caused by mineral contamination. The dark brown discolouration seen on several sample, such as covering the diaphysis of CRB9 and the localised discolouration of CRB12 can be attributed to the presence of iron. Without archaeological records it is not possible to confidently attribute the cause of this iron, however it may be linked to nearby iron objects. Higher heavy elemental content correlated with the high X-ray attenuation exterior surfaces. However, the homogenous X-ray tomography also indicates that the Fe present in major concentration as shown in the pXRF results (Table 2) runs through the entire cortical bone.
The samples imaged were excavated from four differently located sites, ranging from the Roman to the Tudor period. As well as the individual inhomogeneity previously discussed there is inhomogeneity between and within the sites. Each of the bones excavated from Corbridge shows a distinct pattern of preservation both in terms of component distribution and physical details. This includes both the distribution of organic content and mineral density. Each bone also shows unique patterns of physical damage, ranging from cracking in CRB9 to the bulbous texture of CRB3. As these bones still contain sediment they were not washed post-excavation and therefore this inhomogeneity of preservation can be linked to their burial environment. Unfortunately, there is no context information for this site. This variation in organic content and mineral density is also seen across the rest of samples.
5. Conclusions
In conclusion, neutron and X-ray tomography techniques can be used to reveal extensive hidden information regarding the preservation of archaeological bone objects. This is the visualisation of organic distribution within cortical bone and obscured physical damage. The two types of radiation interact with different elements, and when used as complementary methods give a comprehensive preservation assessment.
Visualising the distribution of the organic content within the cortical bone has highlighted the extent of preservation variation within archaeological collections. The neutron tomography data have also highlighted the limitations of the more traditional invasive and spot measurement techniques such as ATR-FTIR. Analysing only one location along a bone, even if consistently selected between samples, does not always give an accurate impression of the bone. This could lead to incorrect identification of the proportions of the organic component present in bone. Neutron imaging can be used as a non-invasive pre-screening method for advanced analysis methods such as aDNA and ZooMS. Identifying the most suitable sampling location will limit invasive sampling damage and help ensure positive results. This can be particularly valuable with rare or small objects where invasive sampling will greatly impact its future research potential and analytical value.
The X-ray imaging has also indicated that there is significantly more physical damage within the cortical bone of archaeological bones than appears on the surface. This indicates that many of the bones are more physically vulnerable than they appear. High X-ray attenuation within the imaging also correlates with the presence of heavy elements that enter the cortical bone during burial. These were also identified via pXRF analysis, and contributed to the surface. Extensive details on postmortem changes, such as microbial activity, the impact of burning, and physical changes induced by mineral exposure during burial, are hidden in the cortical tissue of archaeological bone. X-ray tomography offers a non-destructive method to analyse and interpret these features; enhancing understanding without impacting archaeological bones.
Author Contributions
Conceptualisation, Chloe Pearce, Marianne Odlyha and Genoveva Burca. Methodology, Oxana Magdysyuk and Genoveva Burca. Resources, David Thickett and Genoveva Burca. Visualisation, Leonard Fabian and Chloe Pearce. Supervision, Marianne Odlyha, Genoveva Burca and David Thickett. Writing, Chloe Pearce, Marianne Odlyha, Genoveva Burca. All authors have read and agreed to the published version of the manuscript.
Funding
This research was funded by the Arts and Humanities Research Council (AHRC) (170908). Access to the Harwell Campus (UK) facilities was funded by the Science and Technology Facilities Council (STFC) and Diamond Light Source. The neutron imaging beamline grant (RB1920744) was provided by STFC ISIS Facility DOI: https://doi.org/10.5286/ISIS.E.RB1920744
Data Availability Statement
The datasets presented in this article are not readily available due to storage requirements and ongoing study. Requests to access the datasets should be directed to Chloe Pearce.
Conflicts of Interest
The authors declare no conflicts of interest.
References
- Chadefaux, C. , et al., Curve-fitting micro-ATR-FTIR studies of the amide I and II bands of type I collagen in archaeological bone materials. E-Preservation Science 2009, 6, 129–137. [Google Scholar]
- Lopes, D. , et al., Bone physiology as inspiration for tissue regenerative therapies. Biomaterials 2018, 185, 240–275. [Google Scholar] [CrossRef] [PubMed]
- Nielsen-Marsh, C.M. , et al., Bone diagenesis in the European Holocene II: taphonomic and environmental considerations. Journal of Archaeological Science 2007, 34, 1523–1531. [Google Scholar] [CrossRef]
- Kendall, C. , et al., Diagenesis of archaeological bone and tooth. Palaeogeography, Palaeoclimatology, Palaeoecology 2018, 491, 21–37. [Google Scholar] [CrossRef]
- Kontopoulos, I. , et al., Bone diagenesis in a Mycenaean secondary burial (Kastrouli, Greece). Archaeological and Anthropological Sciences 2019, 11, 5213–5230. [Google Scholar] [CrossRef]
- Alvarez-Lloret, P. , et al., Quantative analysis of bone mineral using FTIR. MACLA 2006, 6, 45–47. [Google Scholar]
- Kontopoulos, I. , et al., Screening archaeological bone for palaeogenetic and palaeoproteomic studies. PLOS ONE 2020, 15, e0235146. [Google Scholar] [CrossRef]
- Brock, F., T. Higham, and C.B. Ramsey, Pre-screening techniques for identification of samples suitable for radiocarbon dating of poorly preserved bones. Journal of Archaeological Science 2010, 37, 855–865. [Google Scholar] [CrossRef]
- Child, A.M. , Microbial Taphonomy of Archaeological Bone. Studies in Conservation 1995, 40, 19–30. [Google Scholar] [CrossRef]
- Smith, C.I. , et al. , Bone diagenesis in the European Holocene I: patterns and mechanisms. 2007, 34, 1485–1493. [Google Scholar]
- Cherns, L. , et al., Correlative tomography of an exceptionally preserved Jurassic ammonite implies hyponome-propelled swimming. Geology 2022, 50, 397–401. [Google Scholar] [CrossRef]
- Fernandez, V. , et al., Evidence of Egg Diversity in Squamate Evolution from Cretaceous Anguimorph Embryos. PLOS ONE 2015, 10, e0128610. [Google Scholar] [CrossRef] [PubMed]
- Laaß, M. , et al., New insights into the respiration and metabolic physiology of Lystrosaurus. Acta Zoologica 2011, 92, 363–371. [Google Scholar] [CrossRef]
- Burca, G. , Combined Neutron Imaging and Diffraction: Instrumentation and Experimentation, in Faculty of Mathematics, Computing and Technology (MCT). 2013, The Open University: Ann Arbor.
- Bishop, M.C. and J.N. Dore, Corbridge: Excavations of the Roman fort and town, 1947–1980. Archaeological Report. 1988, London: Historic Buildings & Monuments Commission for England.
- Hare, J.N. , Battle Abbey: The Eastern Range and the Excavations of 197-80. Vol. Archaeological Report no.2. 1985, London: English Heritage.
- Connell, B. and S. Davis, The Animal Bones, in Henry VIII’s Coastal Artillery Fort at Camber Castle, Rye, East Sussex, M. Biddle, et al., Editors. 2001, Oxford Archaeological Unit for English Heritage: Oxford. p. 301-341.
- Rushmore, A. , Housesteads Roman Fort - The Grandest Station: The Material Assemblages. Archaeological Reports. Vol. 2. 2009, Swindon: English Heritage.
- Burca, G. , et al., Exploring the potential of neutron imaging for life sciences on IMAT. Journal of Micropscopy 2018, 272, 242–247. [Google Scholar] [CrossRef] [PubMed]
- Burca, G. , et al. Modelling of an imaging beamline at the ISIS pulsed neutron source. Journal of Instrumentation 2013, 8, P10001. [Google Scholar] [CrossRef]
- Dierick, M., B. Masschaele, and L. Van Hoorebeke, Octopus, a fast and user-friendly tomographic reconstruction package developed in LabView®. Measurement Science and Technology 2004, 15(1366).
- Avizo 9.0.1 FEI (2015) User’s guide Avizo ® 9. Thermofisher. Waltham, Massachusetts.
- Schindelin, J. , et al., Fiji: an open-source platform for biological-image analysis. Nature Methods 2012, 9, 676–682. [Google Scholar] [CrossRef]
- Drakopoulos, M. , et al., I12, the Joint Engineering, Environment and Processing (JEEP) beamline at Diamond Light Source. Journal of Synchrotron Radiation 2015, 22, 828–838. [Google Scholar] [CrossRef]
- Wasaeson, N. and M. Basham, Savu: A Python-based, MPI Framework for Simultaneous Processing of Multiple, N-dimensional Large Tomography Datasets. arXiv arXiv:1610.08015, 2016.
- Nicolet iS5 User Guide (2018). Thermofisher. Waltham, Massachusetts.
- GRAMS AI 8.0. Thermofisher. Waltham, Mssachusetts.
- Van Loon, L.L. , et al., Peakaboo: Advanced software for the interpretation of X-ray fluorescence spectra from synchrotrons and other intense X-ray sources. Software Impacts 2019, 2, 100010. [Google Scholar] [CrossRef]
- Hillier, M. , L and L. Bell, Differentiating Human Bone from Animal Bone: A Review of Histological Methods. Journal of Forensic Sciences 2007, 52, 249–263. [Google Scholar] [CrossRef]
- Valtierra, N. , et al., Cleaning archaeological bones: Influence of water, ethanol, and acetone on microhardness. International Journal of Osteoarchaeology 2023, 33, 967–972. [Google Scholar] [CrossRef]
- Pearce, C. , Preservation Assessment of Archaeological Animal Bones using Combined Analytical and Advanced Imaging Techniques. PhD. Birkbeck, University of London. 2024.
- Paschalis, E. P. , et al. FTIR Microspectroscopic Analysis of Normal Human Cortical and Trabecular Bone. Calcified Tissue International 1997, 61, 480–486. [Google Scholar] [CrossRef]
- Trueman, C. N. G. , et al. Mineralogical and compositional changes in bones exposed on soil surfaces in Amboseli National Park, Kenya: diagenetic mechanisms and the role of sediment pore fluids. Journal of Archaeological Science 2004, 31, 721–739. [Google Scholar] [CrossRef]
- Currey, J. , Incompatible mechanical properties in compact bone. Journal of Theoretical Biology 2004, 231, 569–580. [Google Scholar] [CrossRef]
- Viguet-Carrin, S., P. Garnero, and P.D. Delmas, The Role of Collagen in Bone Strength. Osteoporos Int 2006, 17, 319–336. [Google Scholar] [CrossRef]
- Boaks, A., D. Siwek, and F. Mortazavi, The temporal degradation of bone collagen: A histochemical approach. Forensic Science International 2014, 240, 104–110. [Google Scholar] [CrossRef] [PubMed]
- Bouchard, G.P. , et al., Portable FTIR for on-site screening of archaeological bone intended for ZooMS collagen fingerprint analysis. Journal of Archaeological Science: Reports 2019, 26, 101862. [Google Scholar]
- Lebon, M. , et al., Rapid Quantification of Bone Collagen Content by ATR-FTIR Spectroscopy. Radiocarbon 2016, 58, 131–145. [Google Scholar] [CrossRef]
Figure 1.
Labelled photograph of juvenile cattle bone (BAT5), showing the gross anatomy of the archaeological bone. In this example the epiphysis is still intact, including the fragile trabecular tissue.
Figure 1.
Labelled photograph of juvenile cattle bone (BAT5), showing the gross anatomy of the archaeological bone. In this example the epiphysis is still intact, including the fragile trabecular tissue.
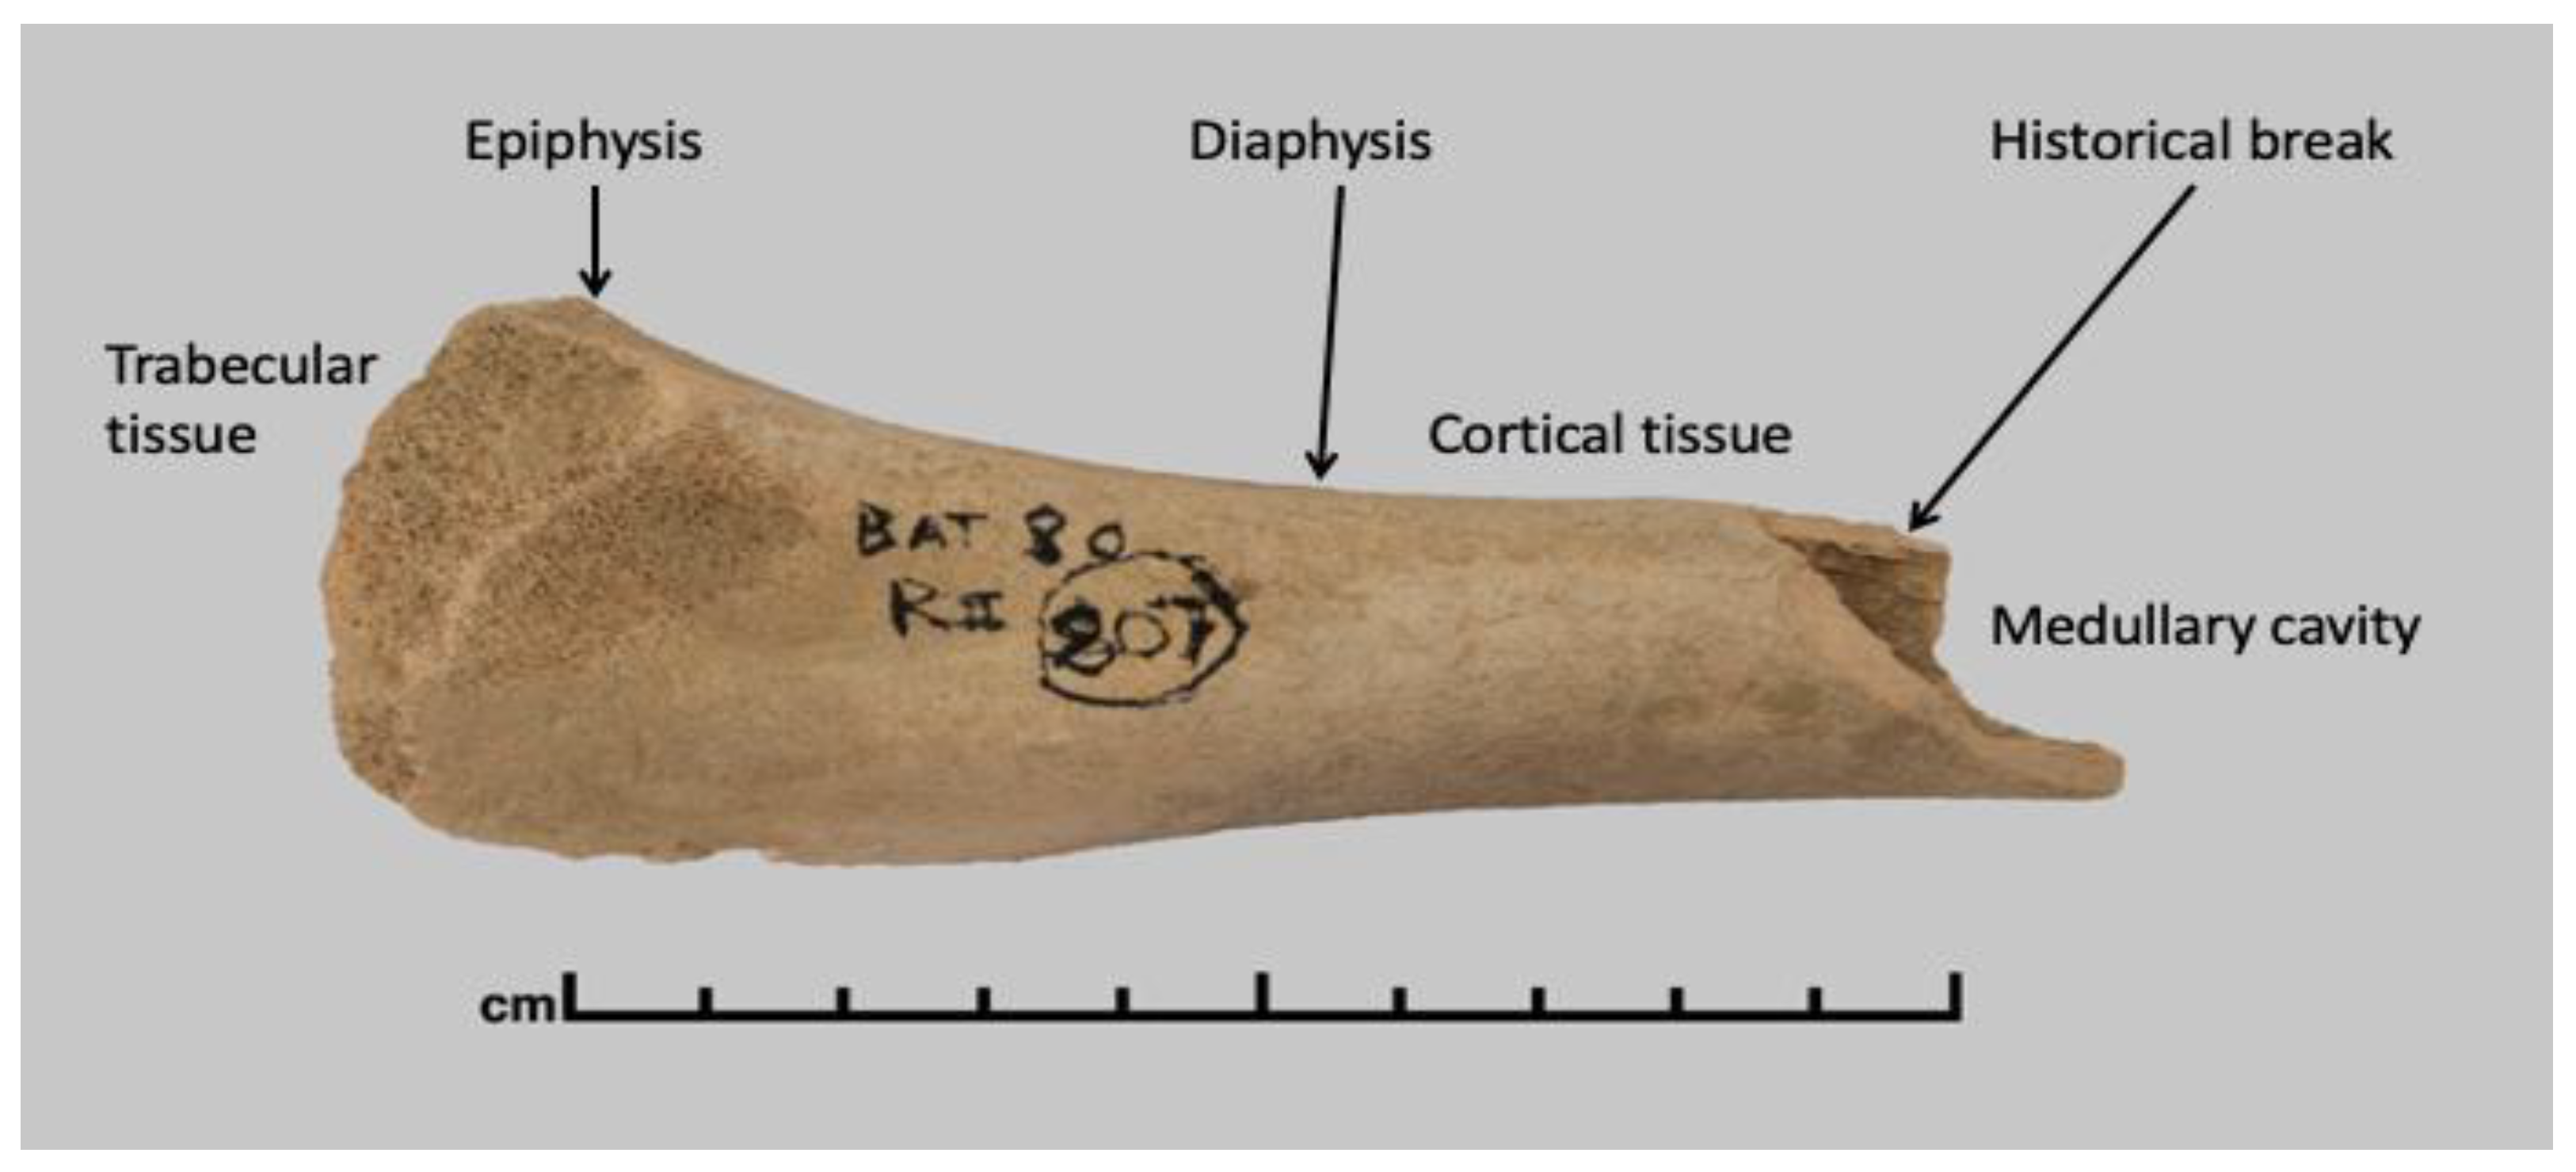
Figure 2.
Photographs of featured archaeological bones, a) BAT5, b) CAM3, c) HST1, red arrow indicates surface damage, d) CRB2, e) CRB3, red arrow indicating signs of burning, black arrow highlighting the presence of dark scar on surface, f) CRB9 and g) CRB12.
Figure 2.
Photographs of featured archaeological bones, a) BAT5, b) CAM3, c) HST1, red arrow indicates surface damage, d) CRB2, e) CRB3, red arrow indicating signs of burning, black arrow highlighting the presence of dark scar on surface, f) CRB9 and g) CRB12.
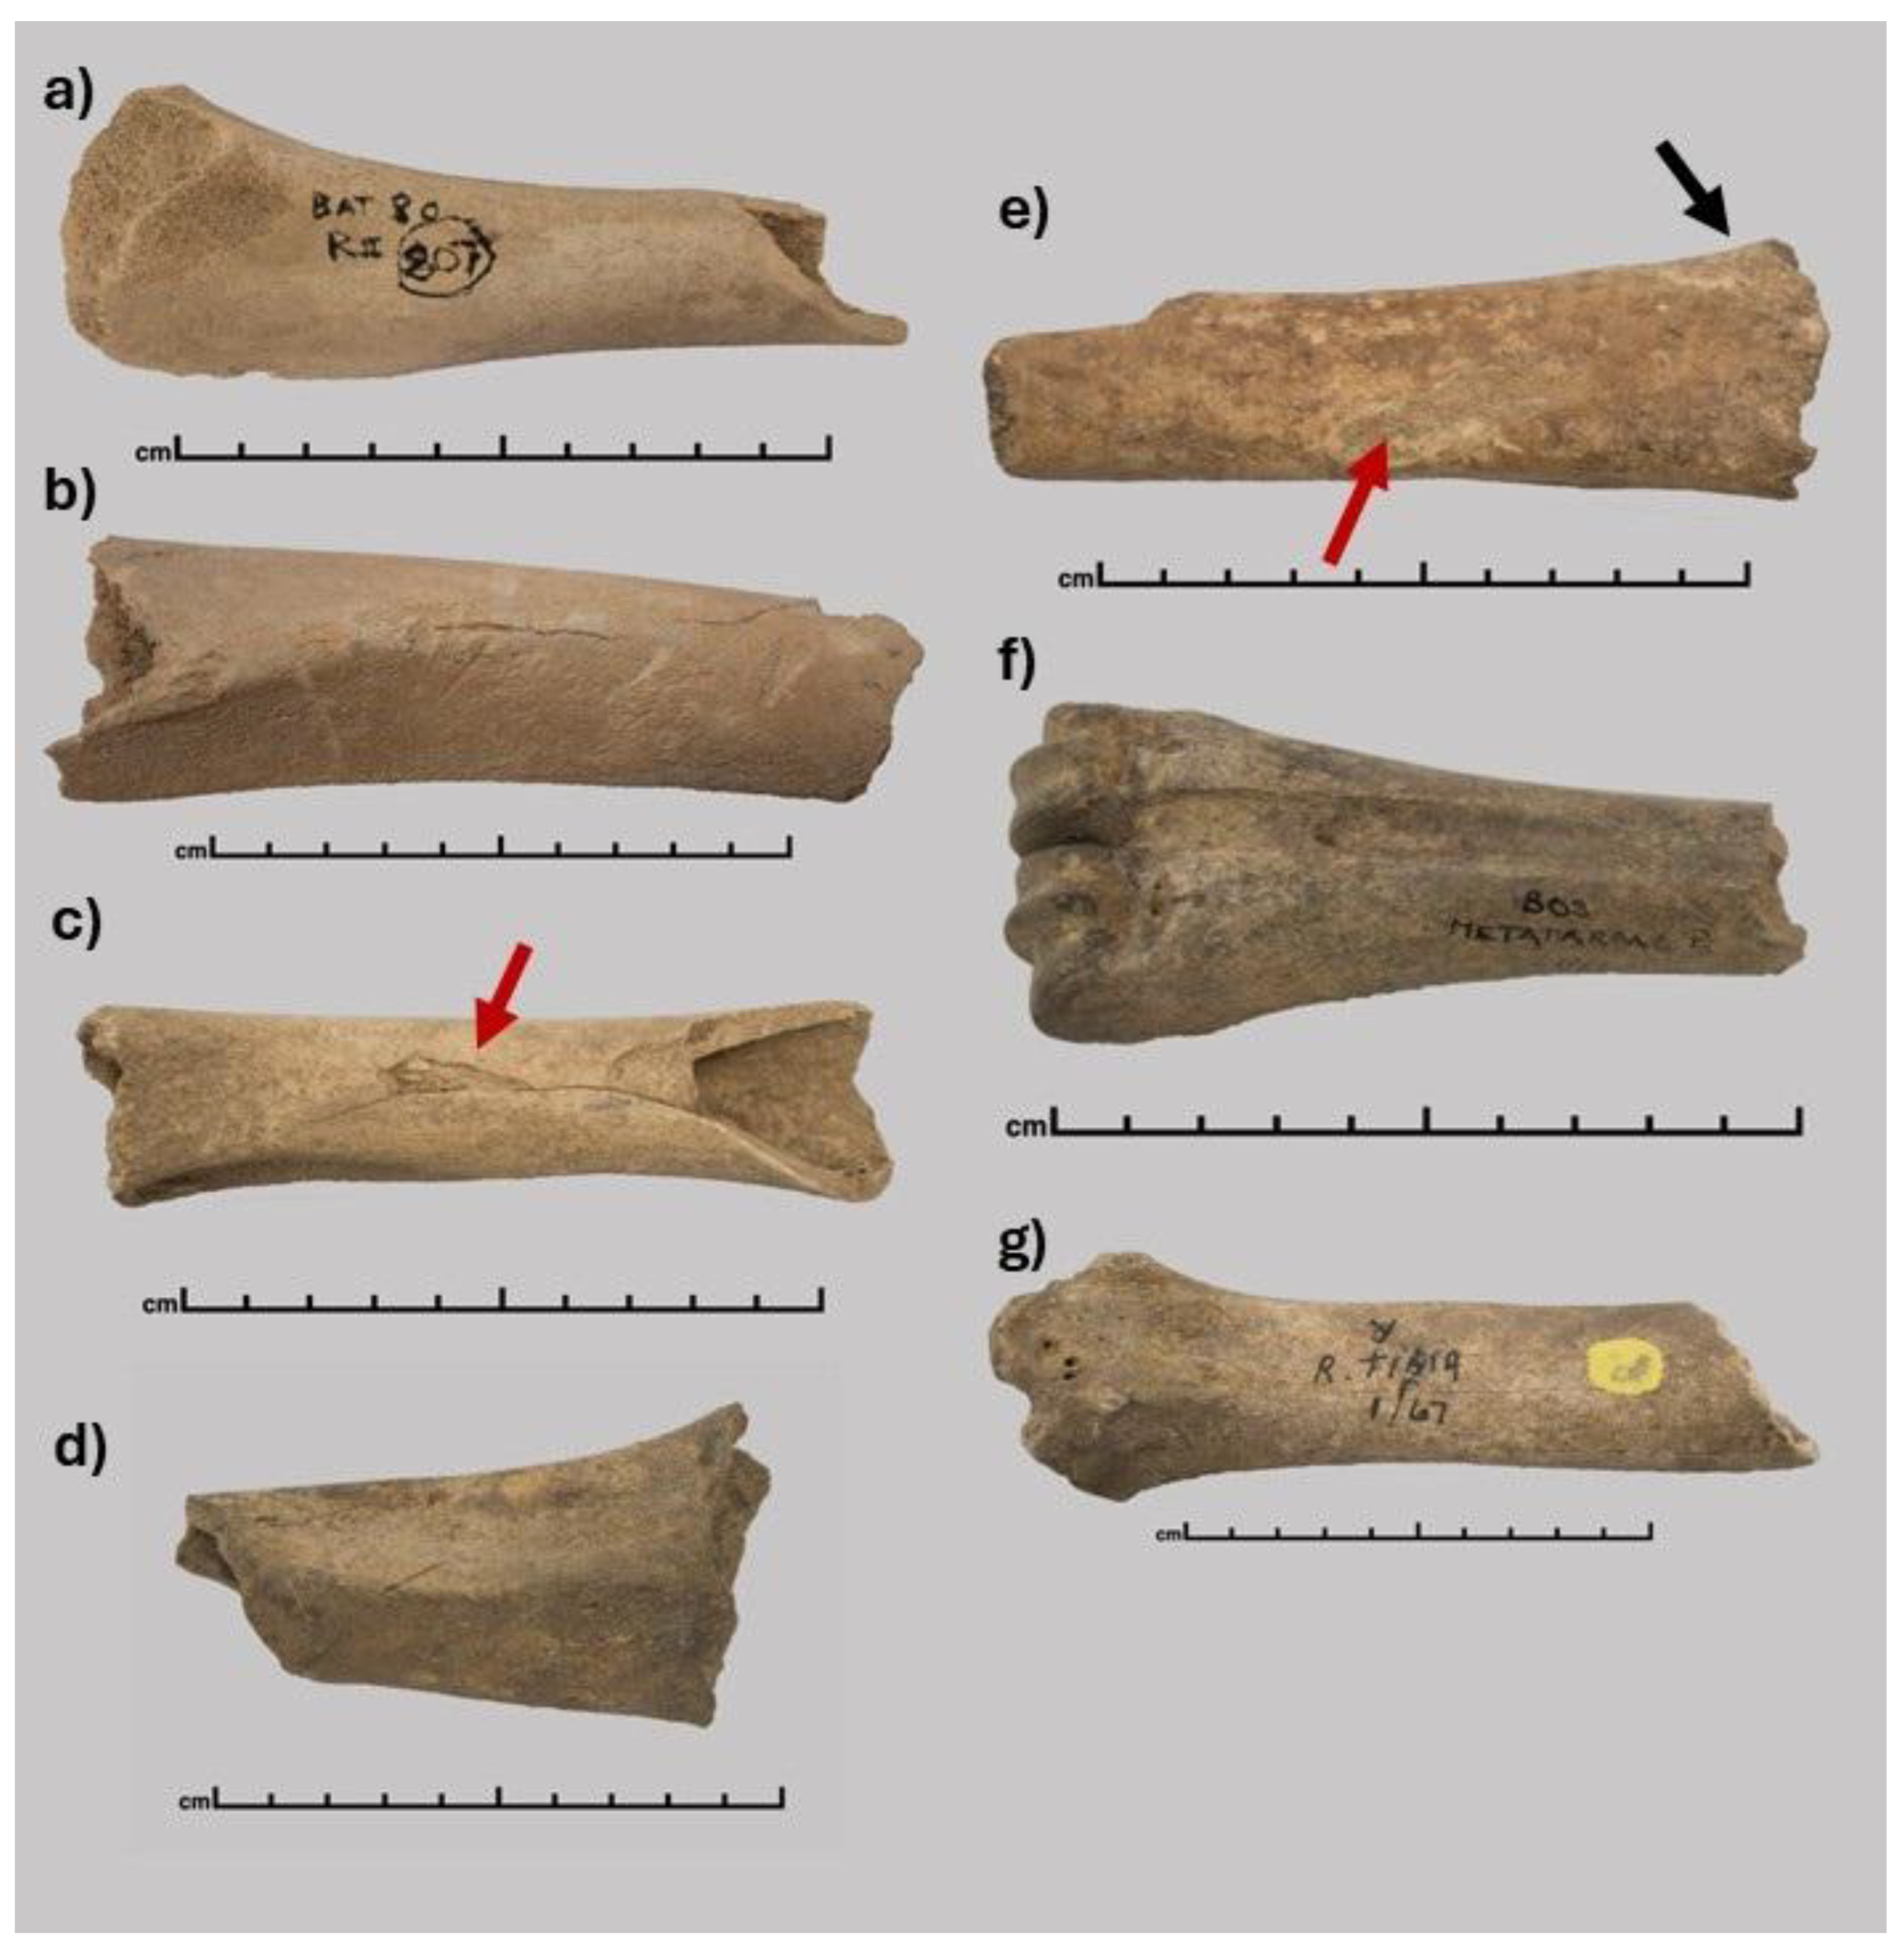
Figure 3.
Generalised workflow for both neutron and X-ray tomography, with the neutron tomography of a sample as an example. a) Each bone was wrapped in aluminium foil. b) The neutron radiographies were collected as the bone rotated. c) Octopus software was used to create slices, followed by generating 3D volumes with Avizo (d).
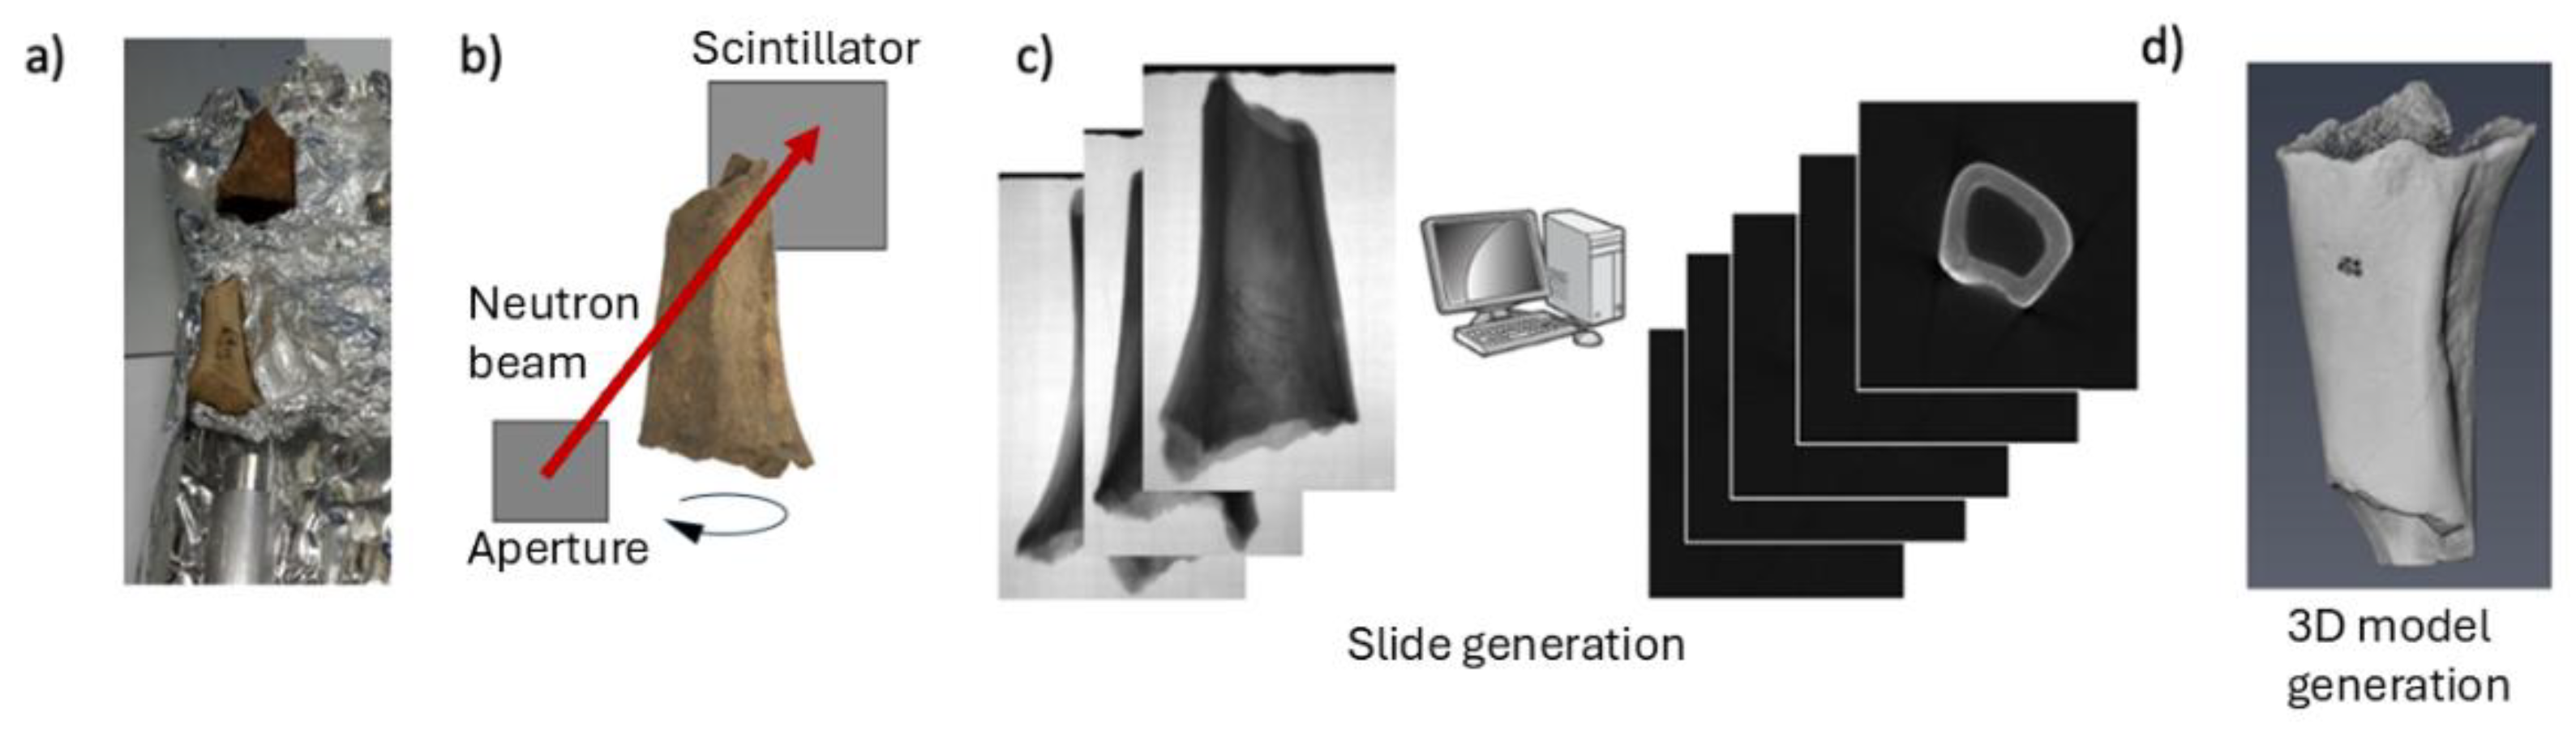
Figure 4.
Neutron and X-ray slices of sample BAT5. a) Neutron tomography slice of sample BAT5, showing higher attenuation along the centre of the diaphysis wall. The near-invisible sediment of the nutrient foramen is also evident and highlighted by the red square. b) X-ray tomography slice of BAT5 with dashed red box highlighting the damaged surface seen across much of the diaphysis, and clear sediment in the nutrient foramen. c) Overlaid coloured images of neutron (red) and X-ray (teal). The exposed red highlights the high organic content of the outer surface while surface fragmentation remains visible. Areas in the centre of the diaphysis, appearing white, have high attenuation for both neutron and X-ray tomography and are therefore high organic and dense material.
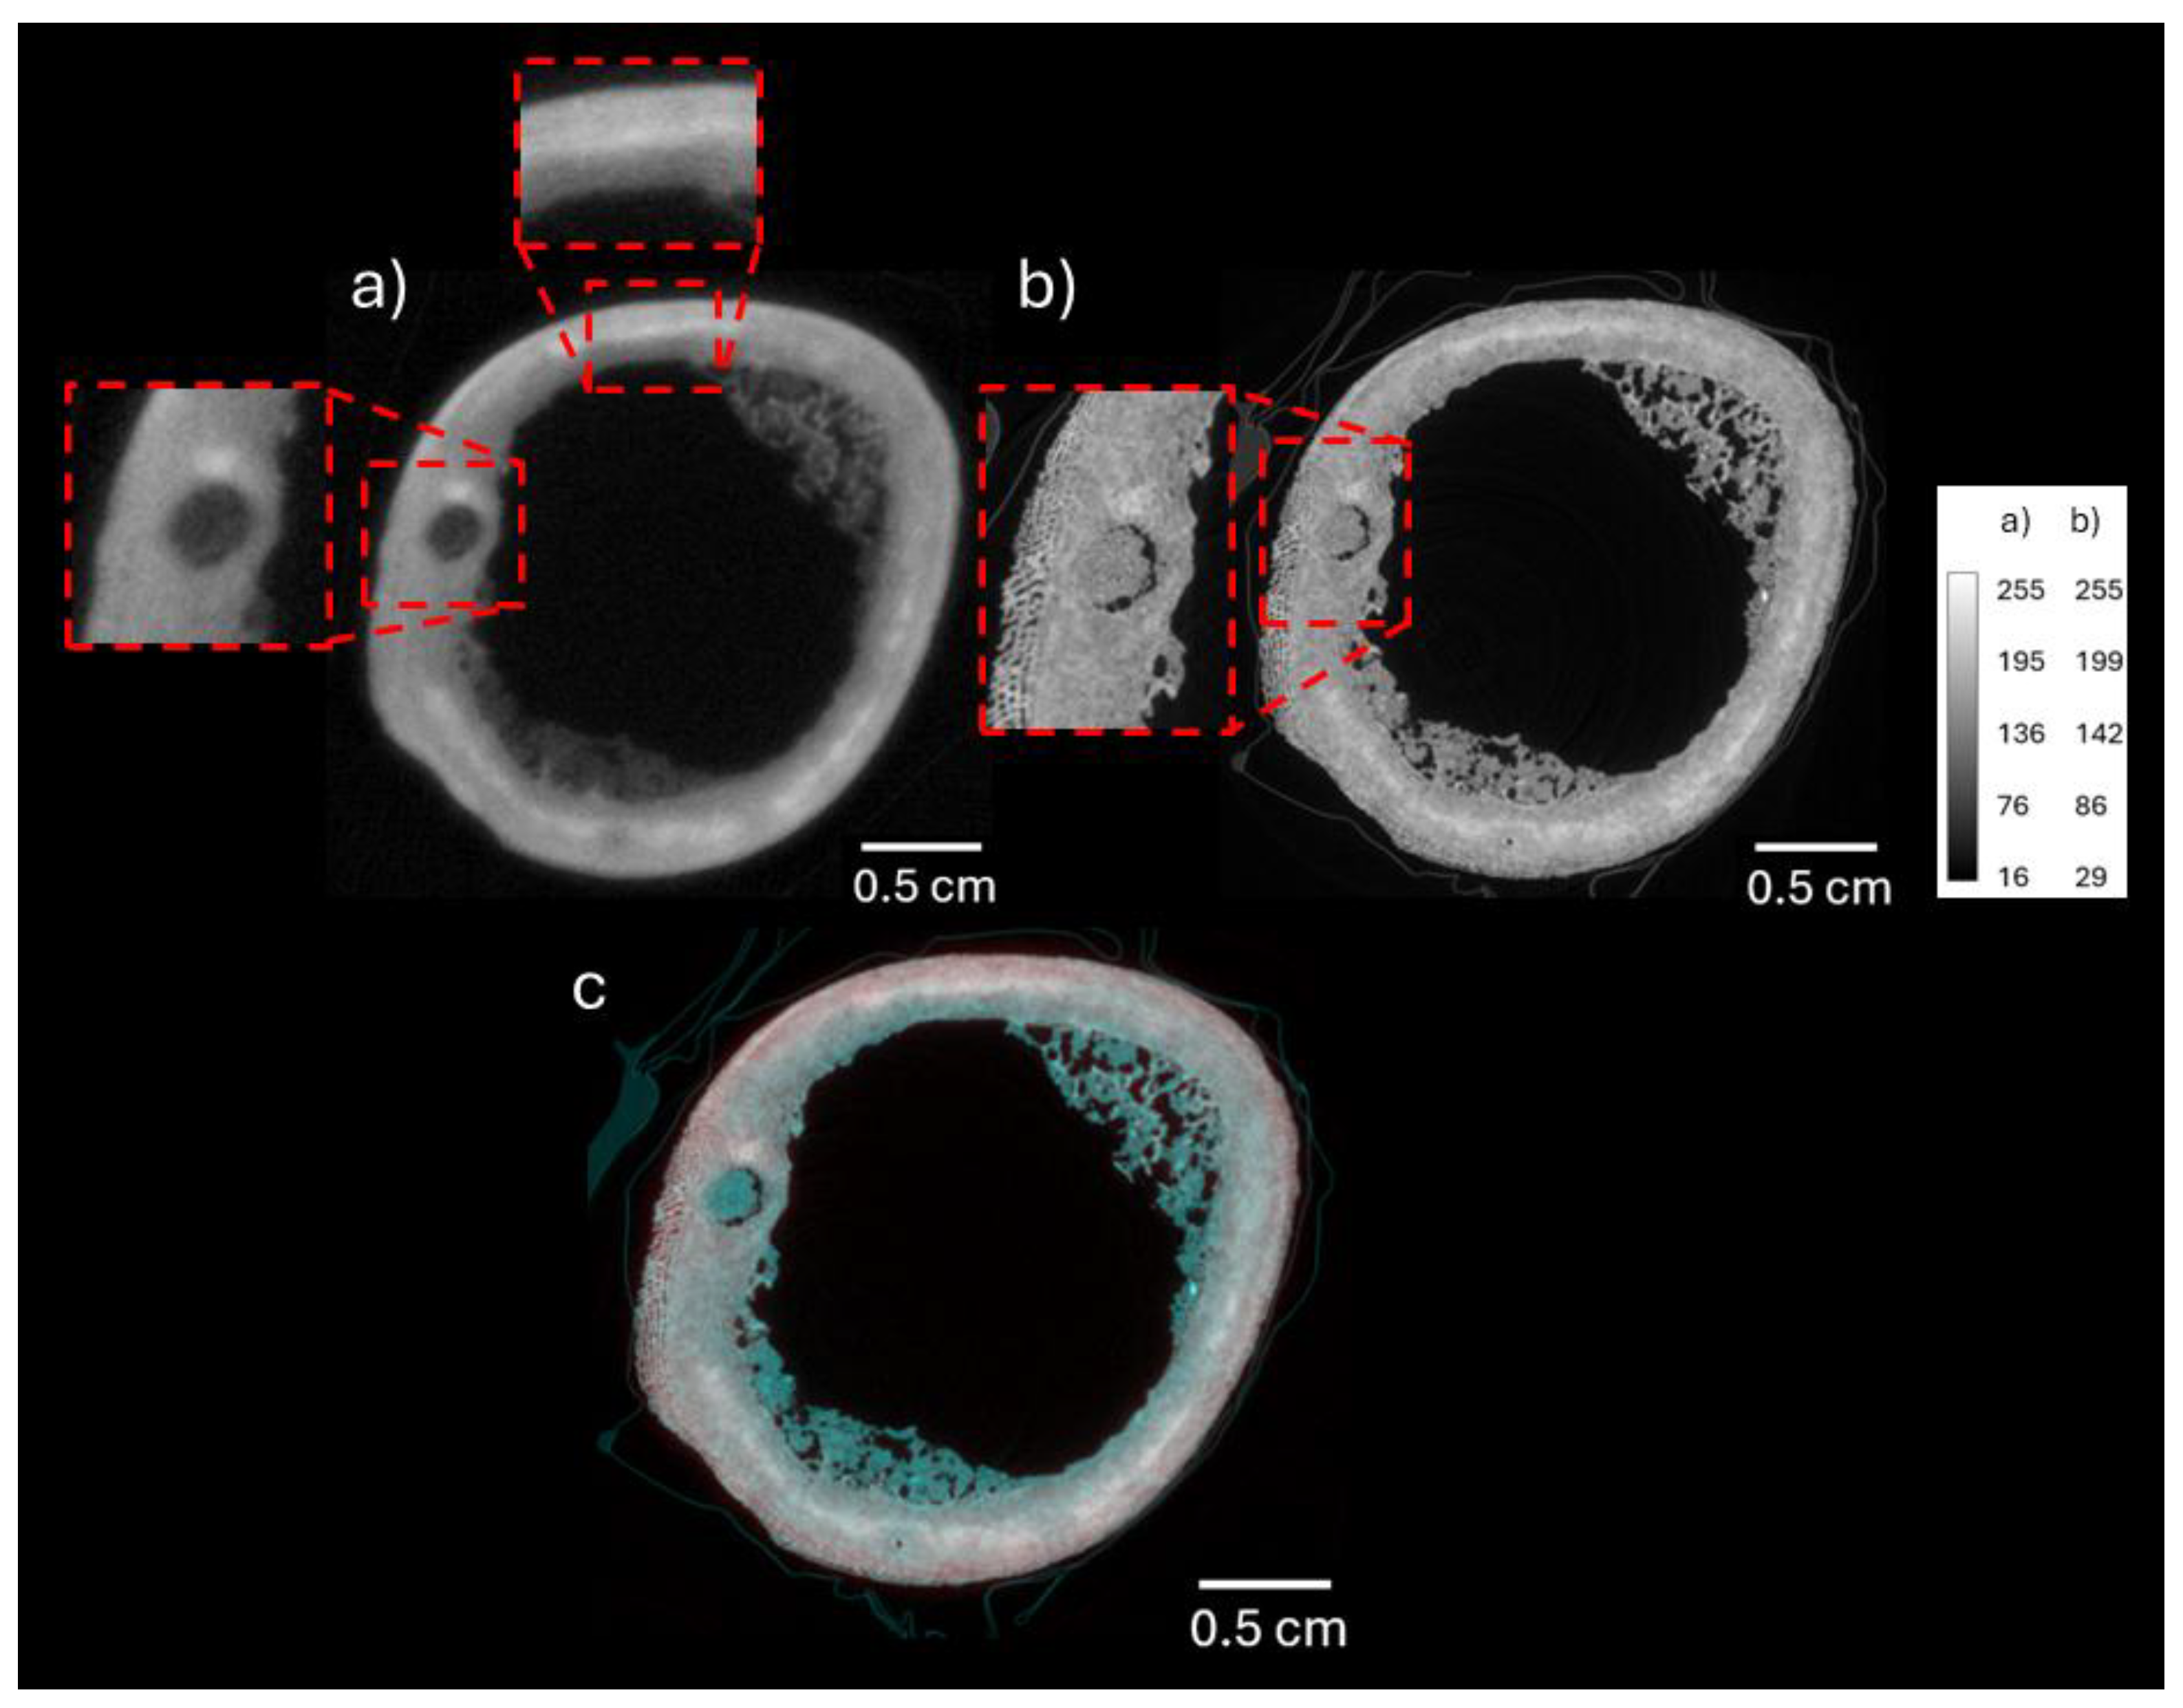
Figure 5.
Neutron tomography slices of samples CAM3 and HST1. a) Neutron tomography slice of CAM3, the outer surface has high attenuation as does areas of the cortical tissue. However, the interior surface and the area of cortical tissue surrounding the crack show lower attenuation indicating less organics are present, as shown by the dashed red box. b) A neutron tomography slice of sample HST1 showing higher attenuation on the exterior surface. It also shows both high attenuation and low attenuation bands through the centre of the diaphysis, indicating that it has both good and poor organic preservation. The dashed red box highlights the fragmentation caused by physical damage.
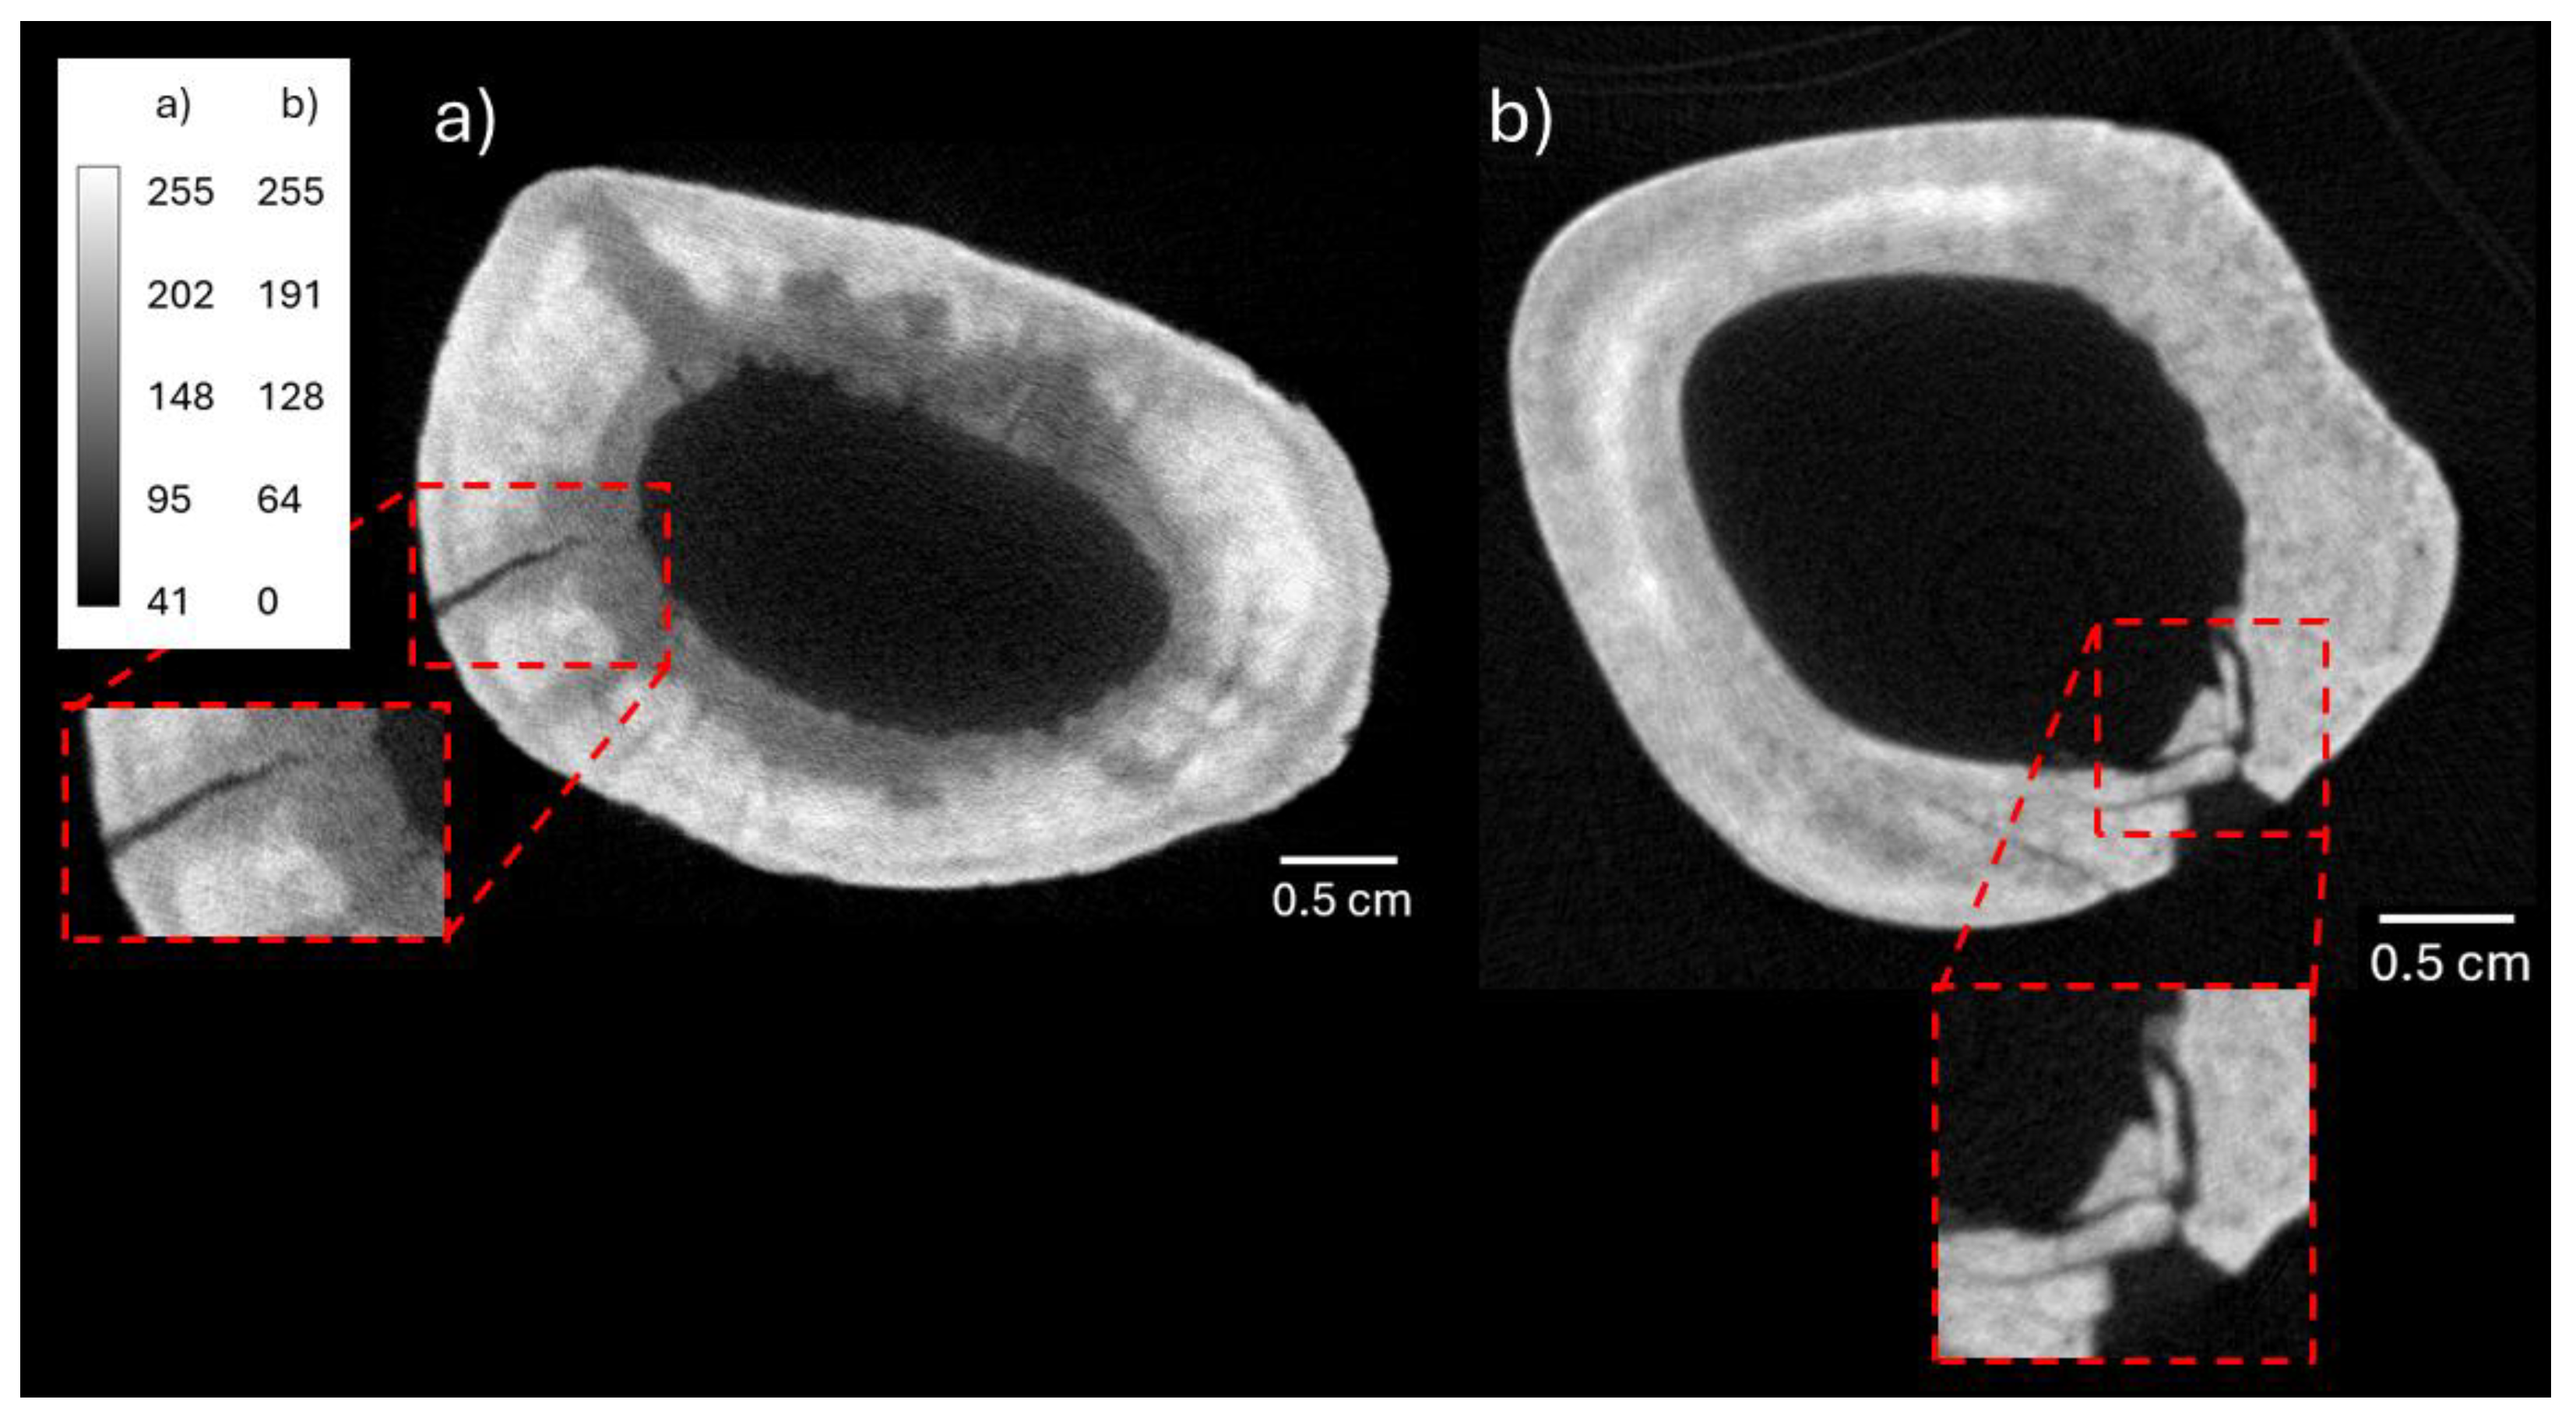
Figure 6.
Neutron and X-ray cross-sections of sample CRB2. a) Neutron tomography cross-slice of sample CRB2 showing the highly attenuating exterior surface. This layer is very thick in places and shows a large contrast to the cortical tissue beneath which has lower organic content. b) CRB2 X-ray tomography cross-section. The patina on the exterior of the bone is of higher attenuation and shows signs of physical vulnerability as microcracking across and between the patina, as highlighted by the dashed red box. c) Overlaid images of neutron (red) and X-ray (teal) tomography of sample CRB2. The red is only visible on the exterior surface of the sample, relating to the localised organic content, while the increase in concentration of heavy elements shown by the teal colour surrounding the interior surface. The overlaid images also highlight the additional physical details of the X-ray tomography, particularly the presence of several surface microcracks.
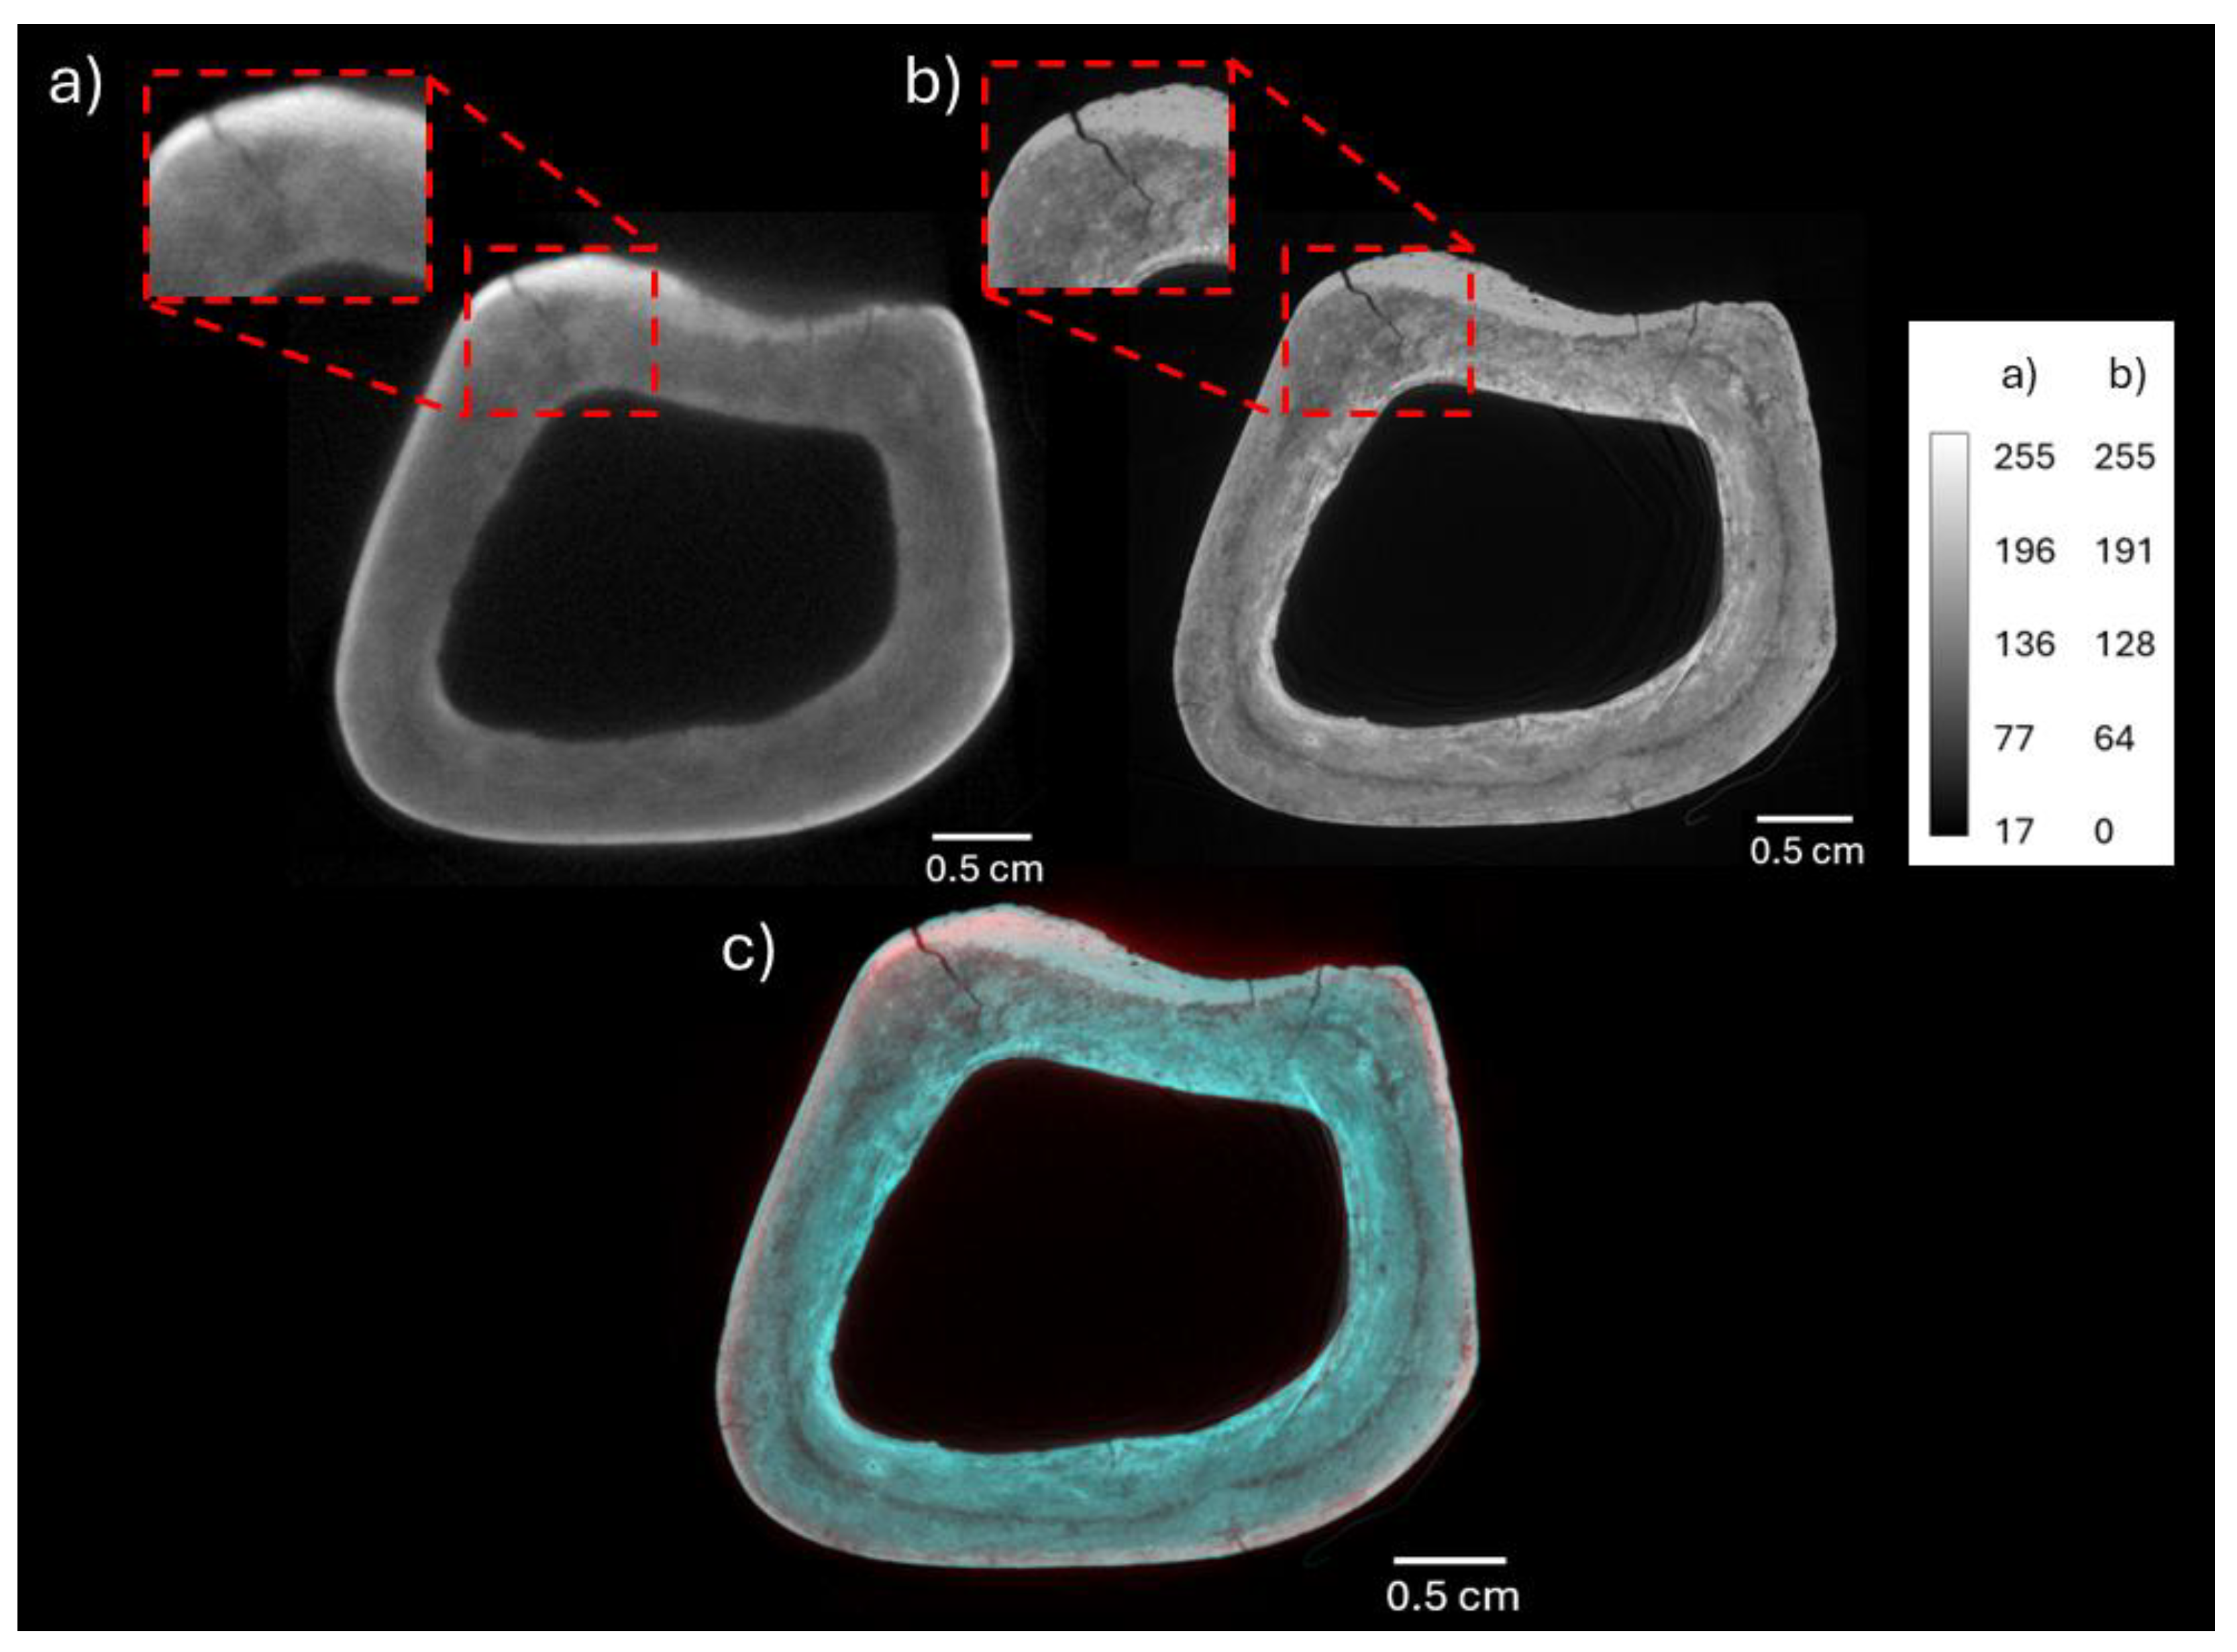
Figure 7.
Neutron and X-ray tomography cross-sections of sample CRB9. Greyscale calibration bar applied to both images (a) and (b). a) Neutron tomography cross-section of bone CRB9 has a higher attenuation and therefore more organic material present on the exterior surface of the diaphysis wall. b) X-ray tomography cross-section of sample CRB9, the cortical tissue is homogenous in attenuation and density. The dashed red box highlights small pores (averaged area 7.4 µm2) that can also be seen throughout the cortical tissue. c) Mapping of cracking across the CRB9 diaphysis near the historical break. Each crack has been allocated a colour so it can be identified via each method. Only 4 cracks are visible under visual inspection, there are 6 visible in the neutron tomography, and 9 in the X-ray tomography data. The higher resolution of the X-ray data has revealed the smaller cracks.
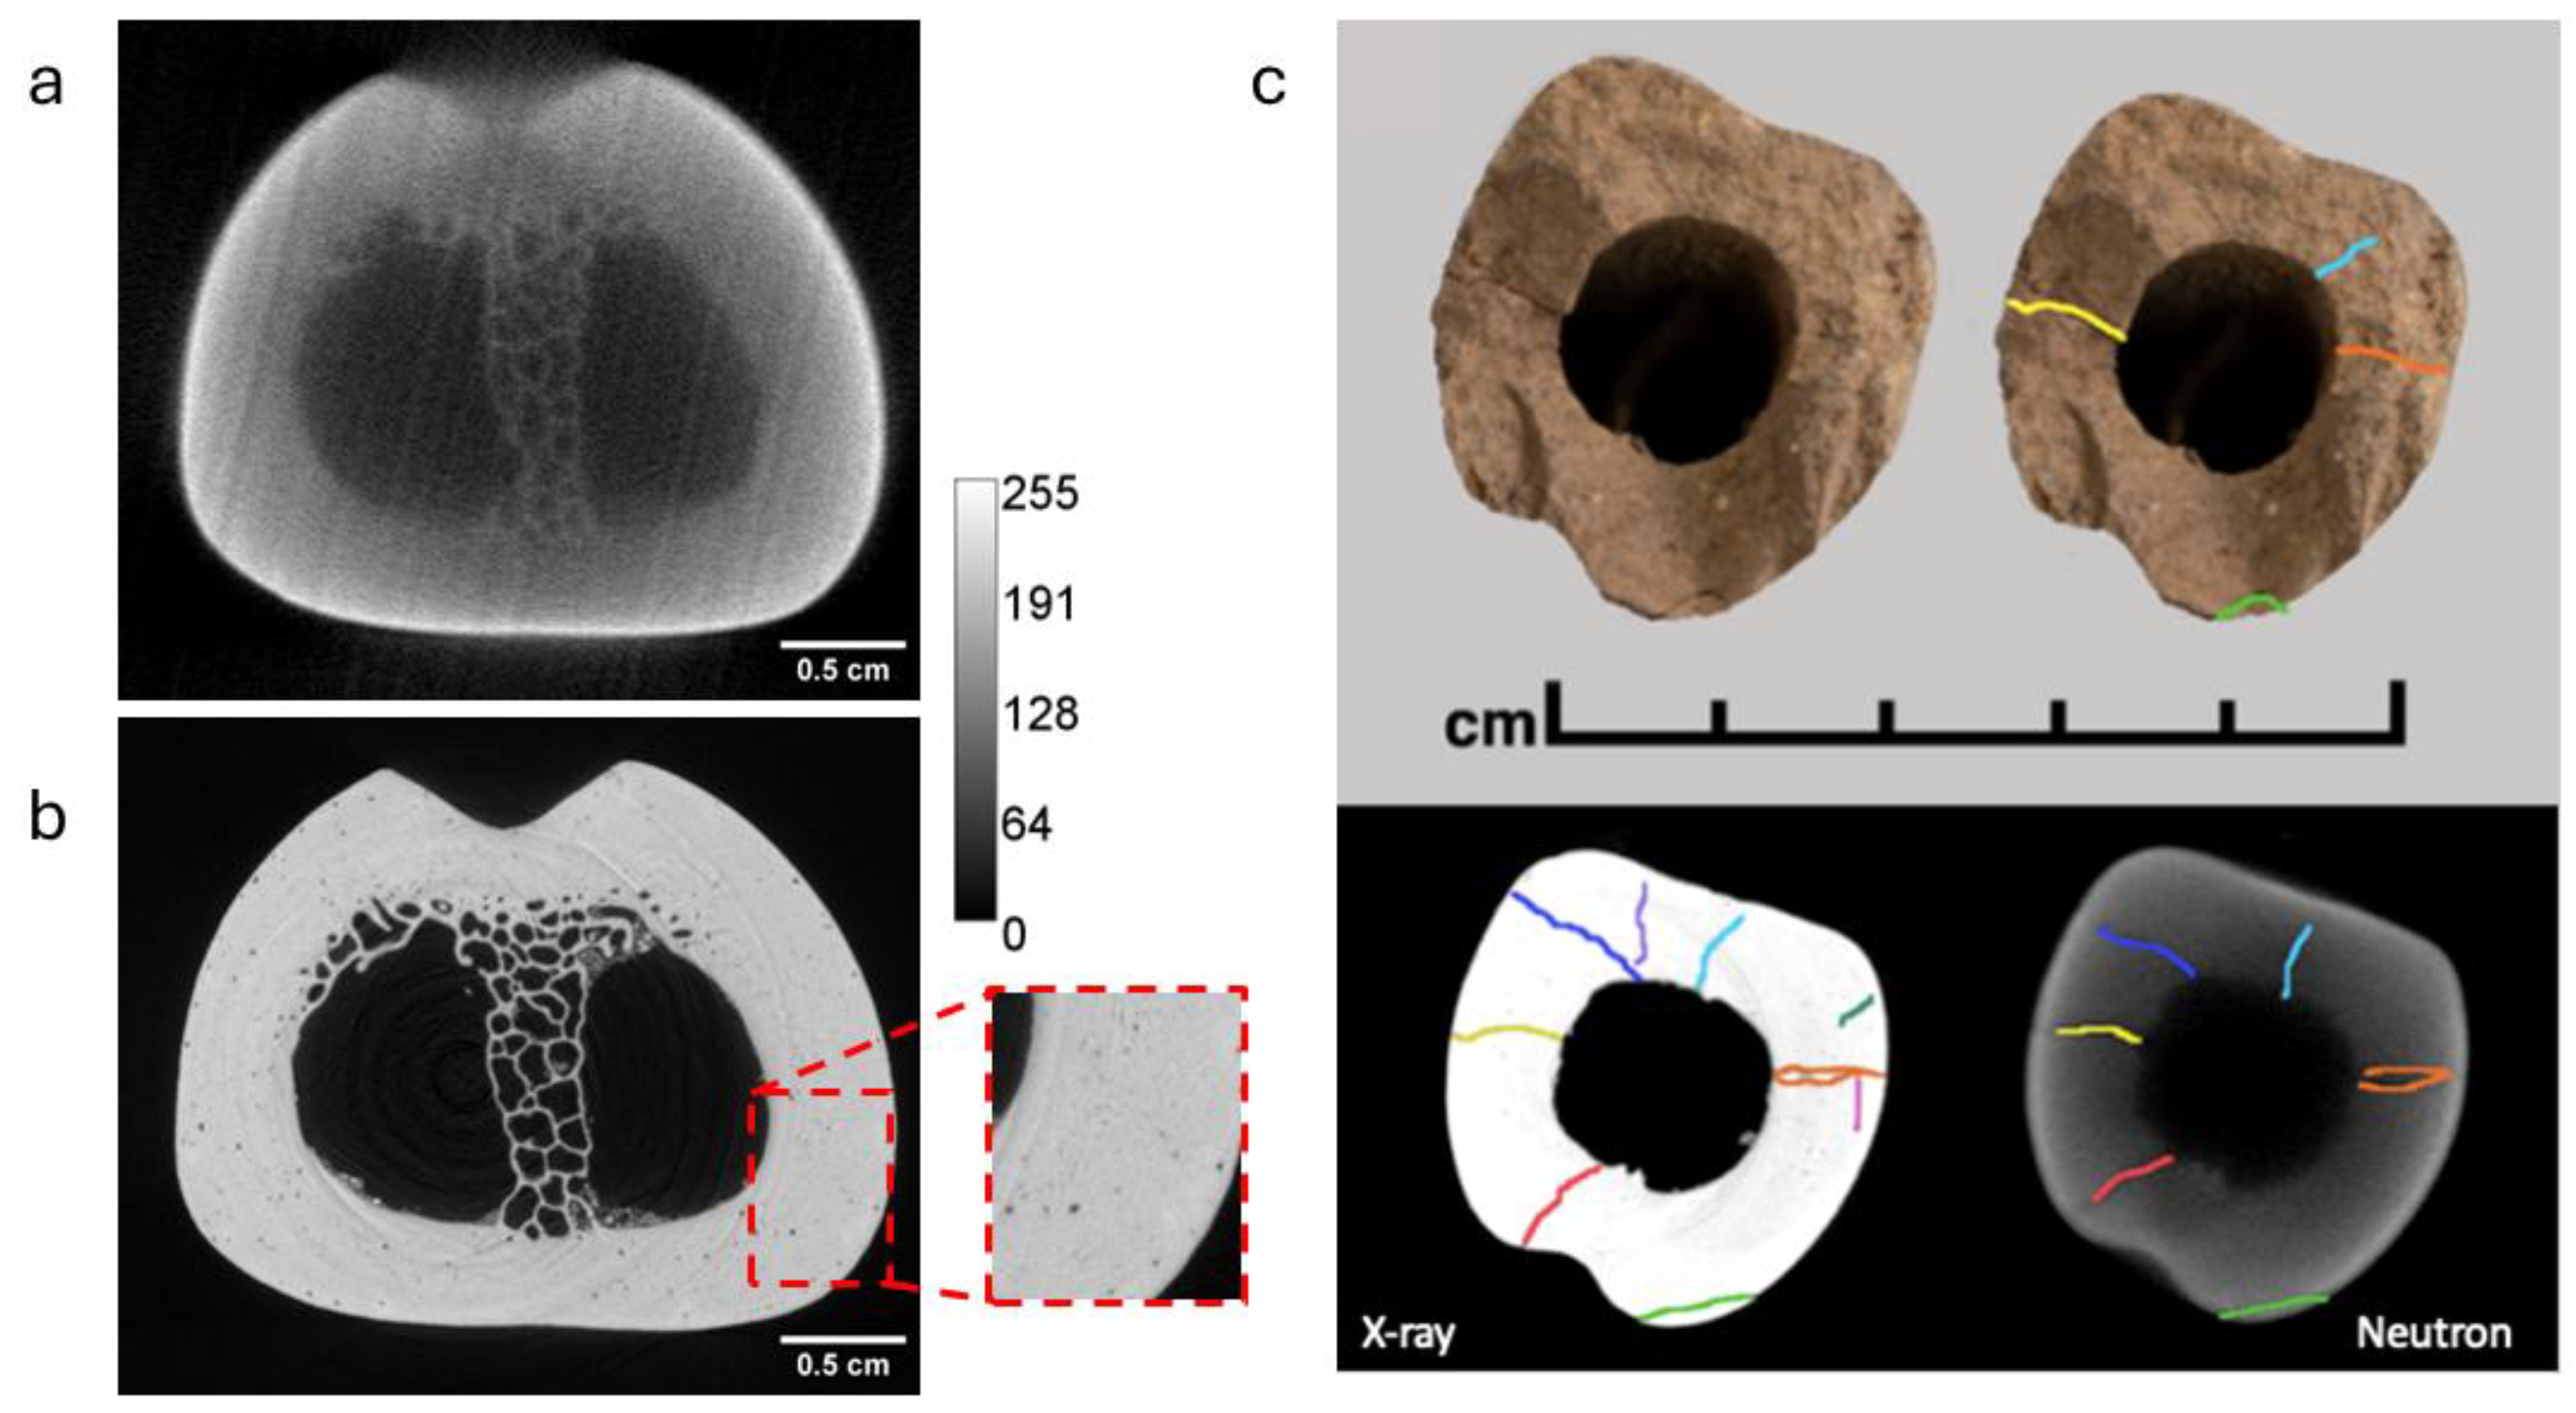
Figure 8.
Neutron and X-ray cross-section of sample CRB3. a) Neutron tomography slice of CRB3, highlighting the very low attenuation channel running intermittently through the centre of the diaphysis, as seen in the dashed red box. b) X-ray tomography slice of CRB3, there is low attenuation in the centre of the diaphysis. The dashed red box shows the fragmentation caused by physical damage.
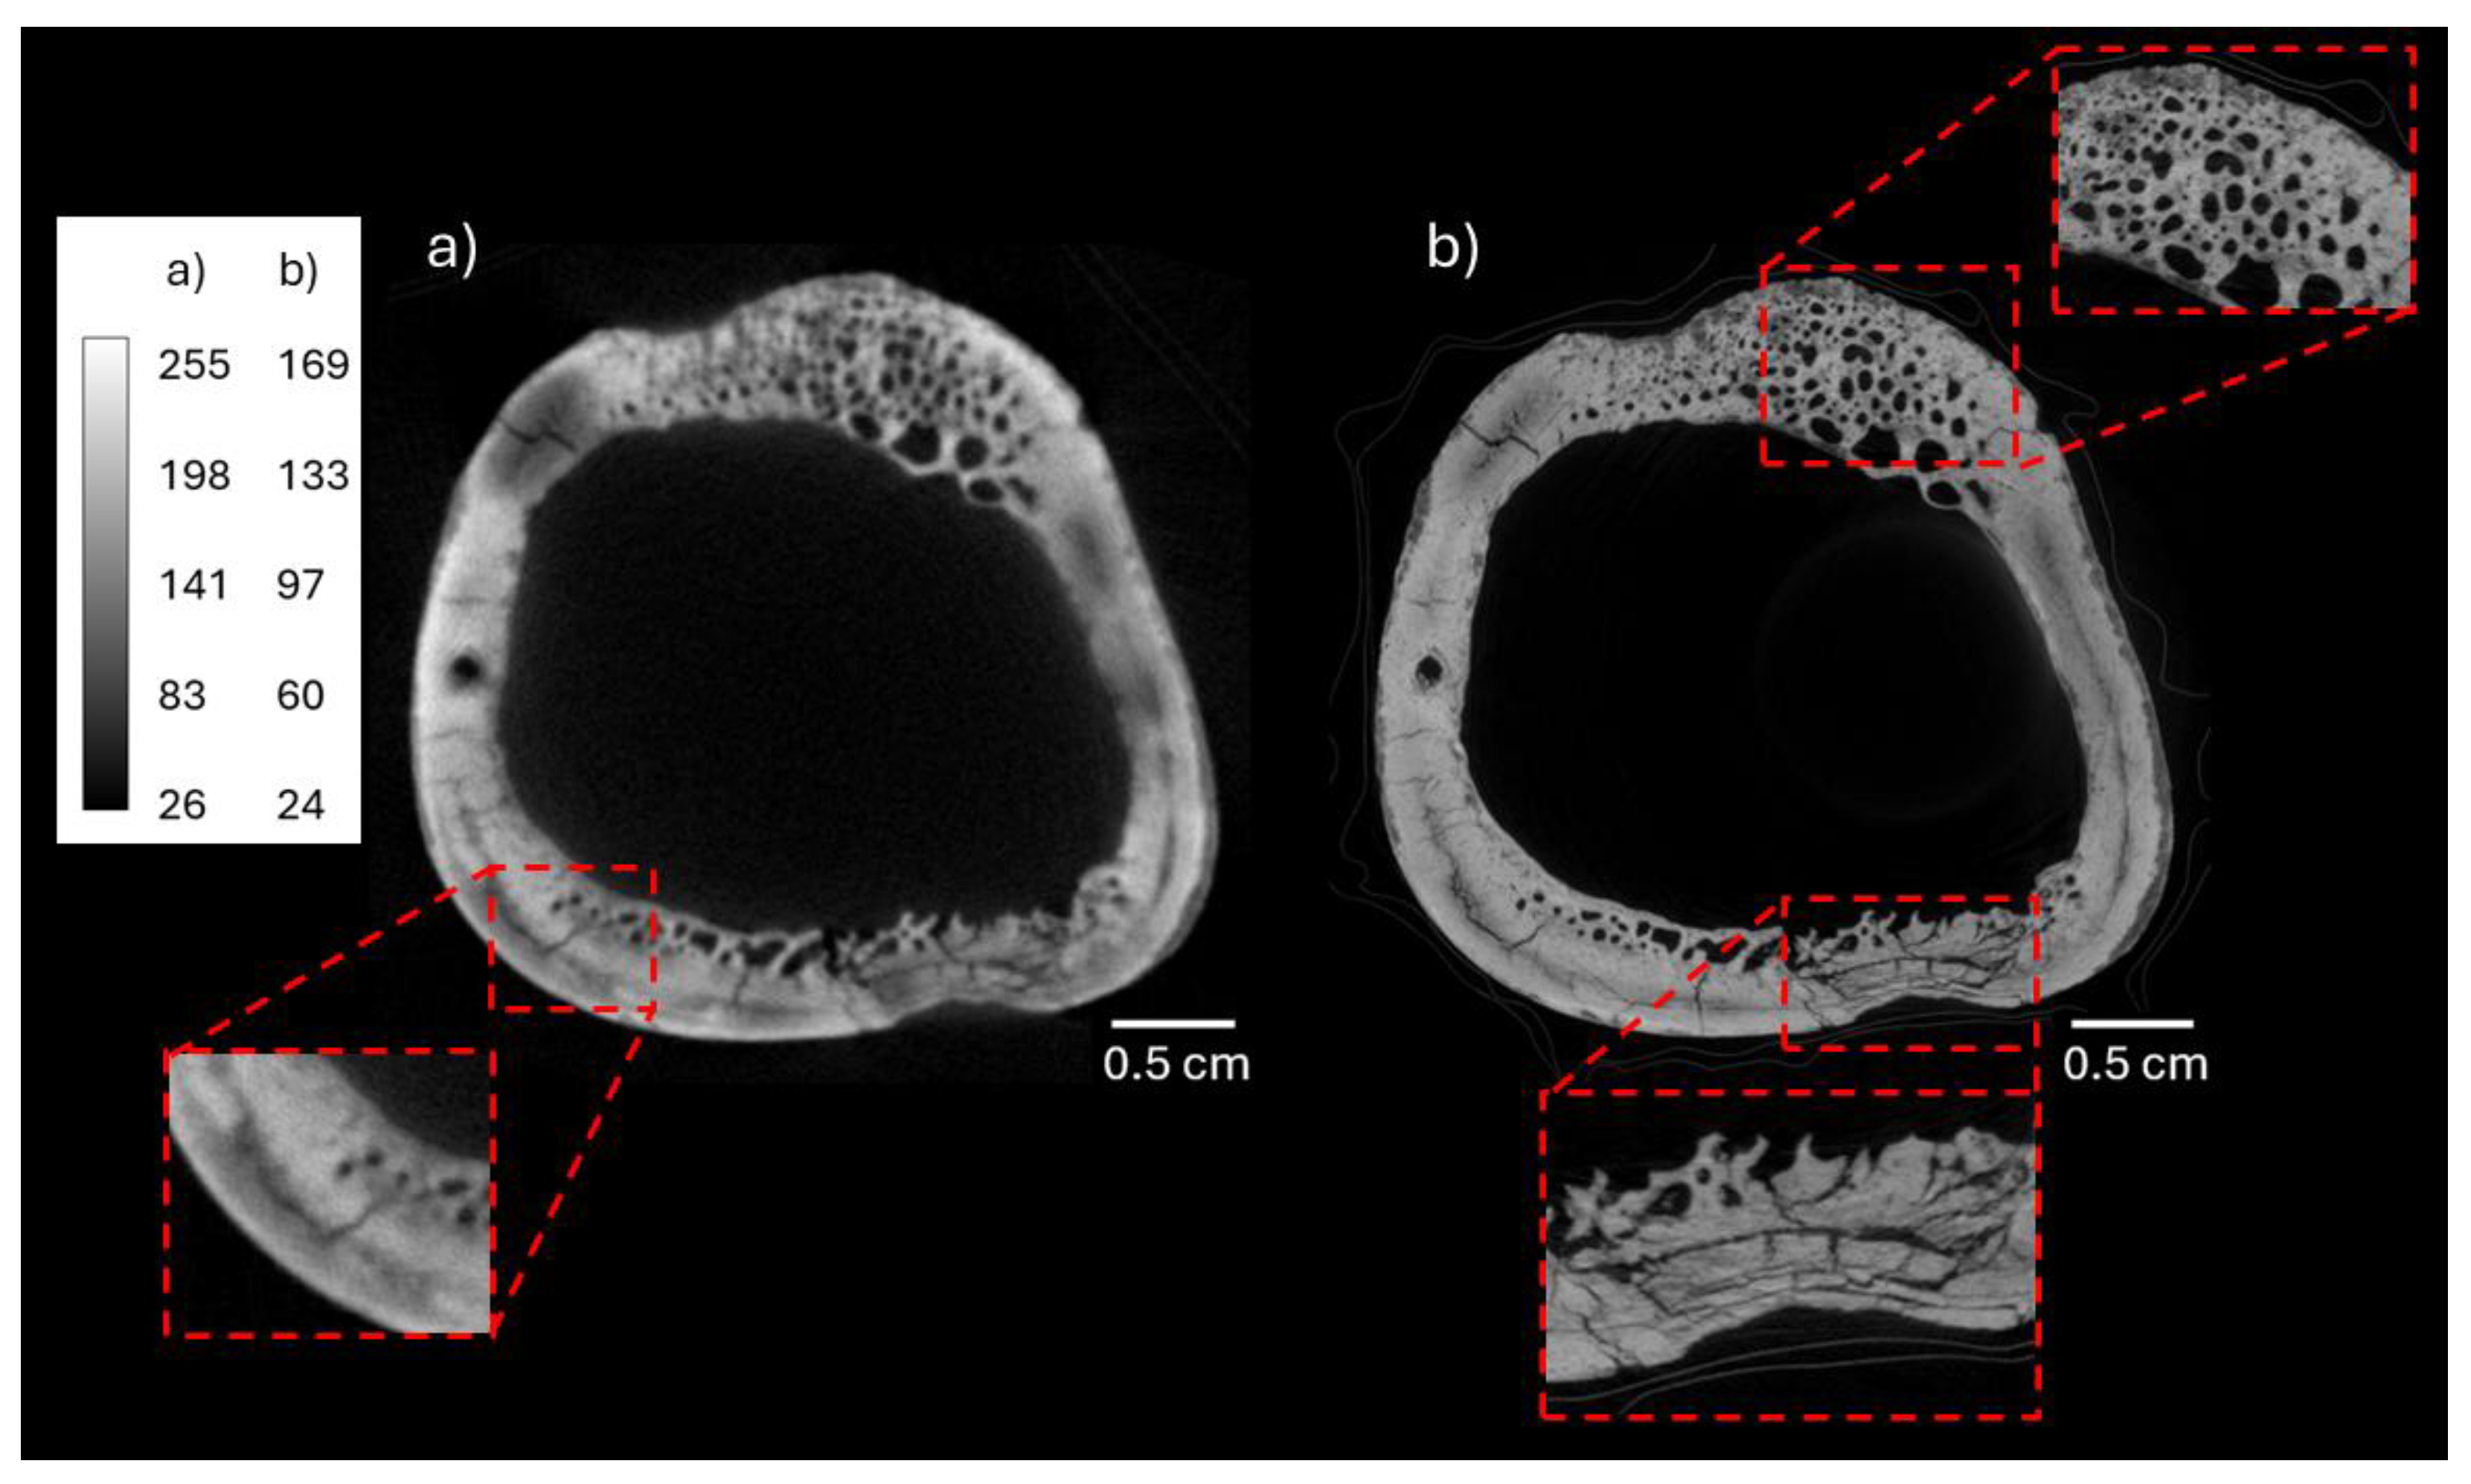
Figure 9.
X-ray and neutron slices of sample CRB12. a) Neutron tomography slice of CRB12 demonstrates the high attenuation on the outer surface of the diaphysis and the patchy attenuation throughout the cortical tissue. B) The X-ray tomography image of CRB12 illustrating the increased attenuation at both the exterior and interior surfaces of the diaphysis. Small cracks can also be seen on the outer surface, depth 0.28 cm ± 0.09 cm. c) Overlaid neutron (red) and X-ray (teal) tomography slices of CRB12. The colour distribution highlights the inhomogeneous distribution of the organic content and the heavy elements, with the red located around the outer surface of the bone while the central surface is more teal.
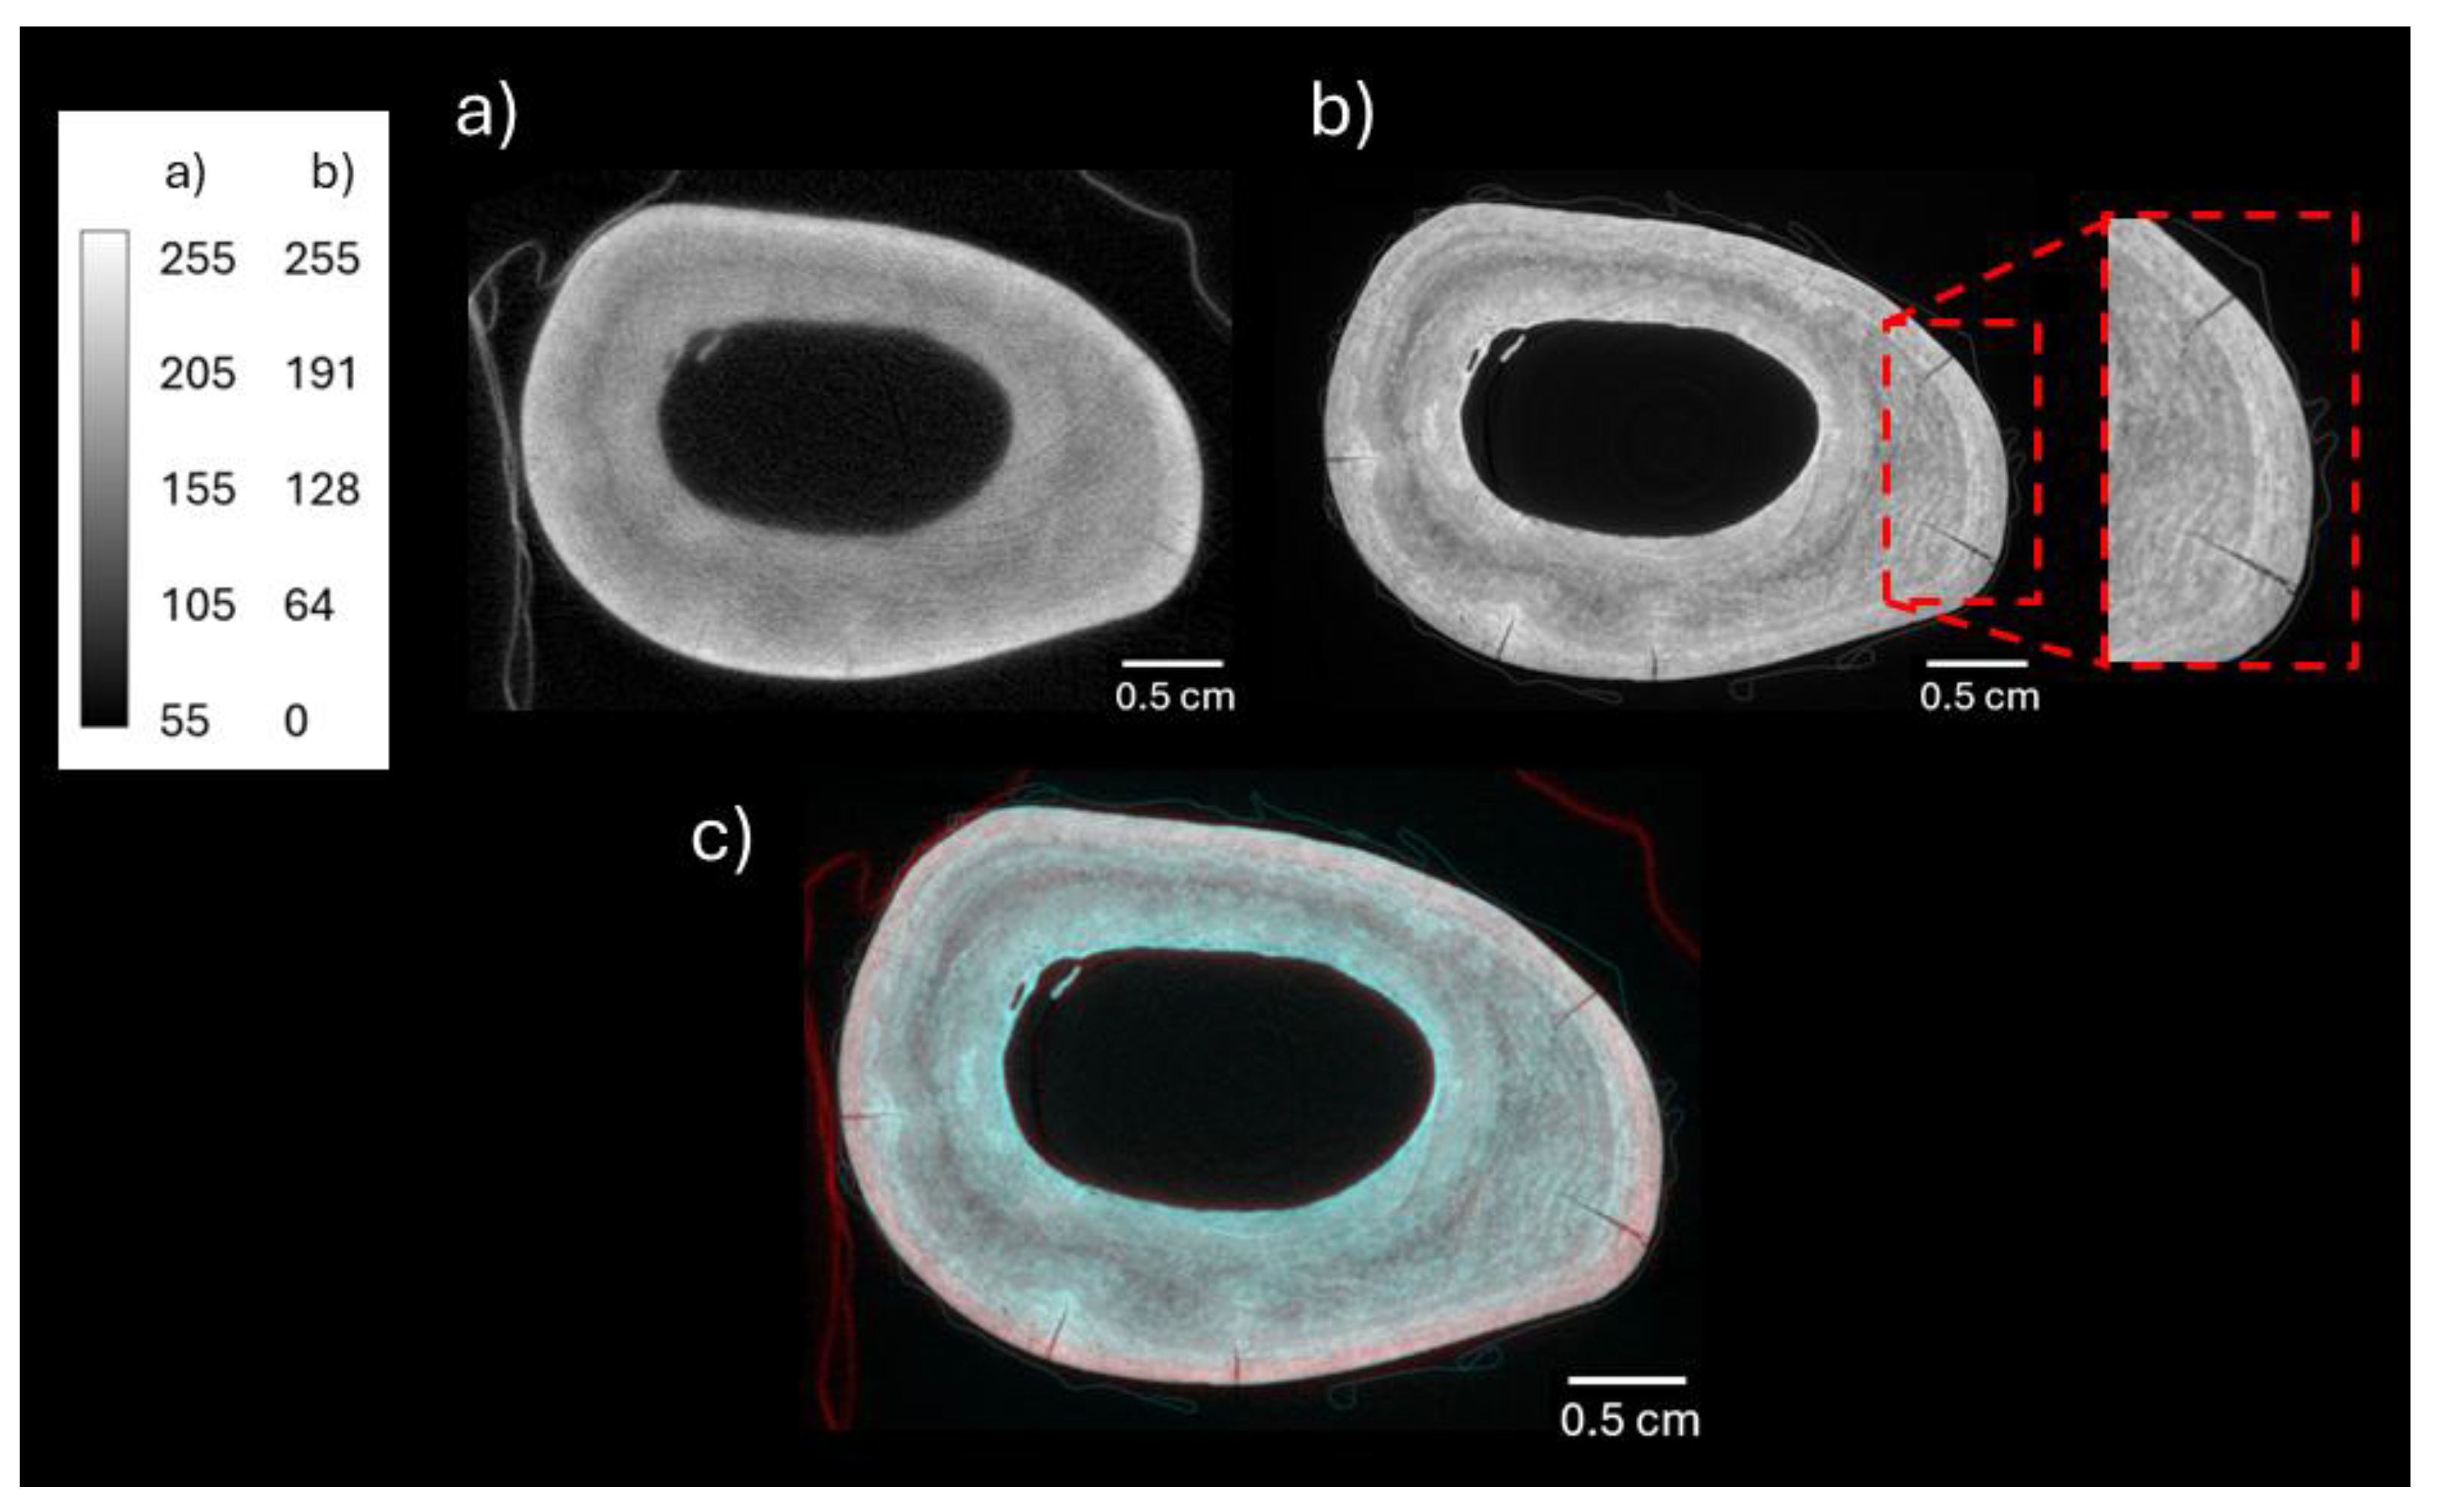
Figure 10.
Modern cattle FTIR spectrum with amide I (c. 1640 cm-1) and phosphate (c. 1010 cm-1) peaks labelled.
Figure 10.
Modern cattle FTIR spectrum with amide I (c. 1640 cm-1) and phosphate (c. 1010 cm-1) peaks labelled.
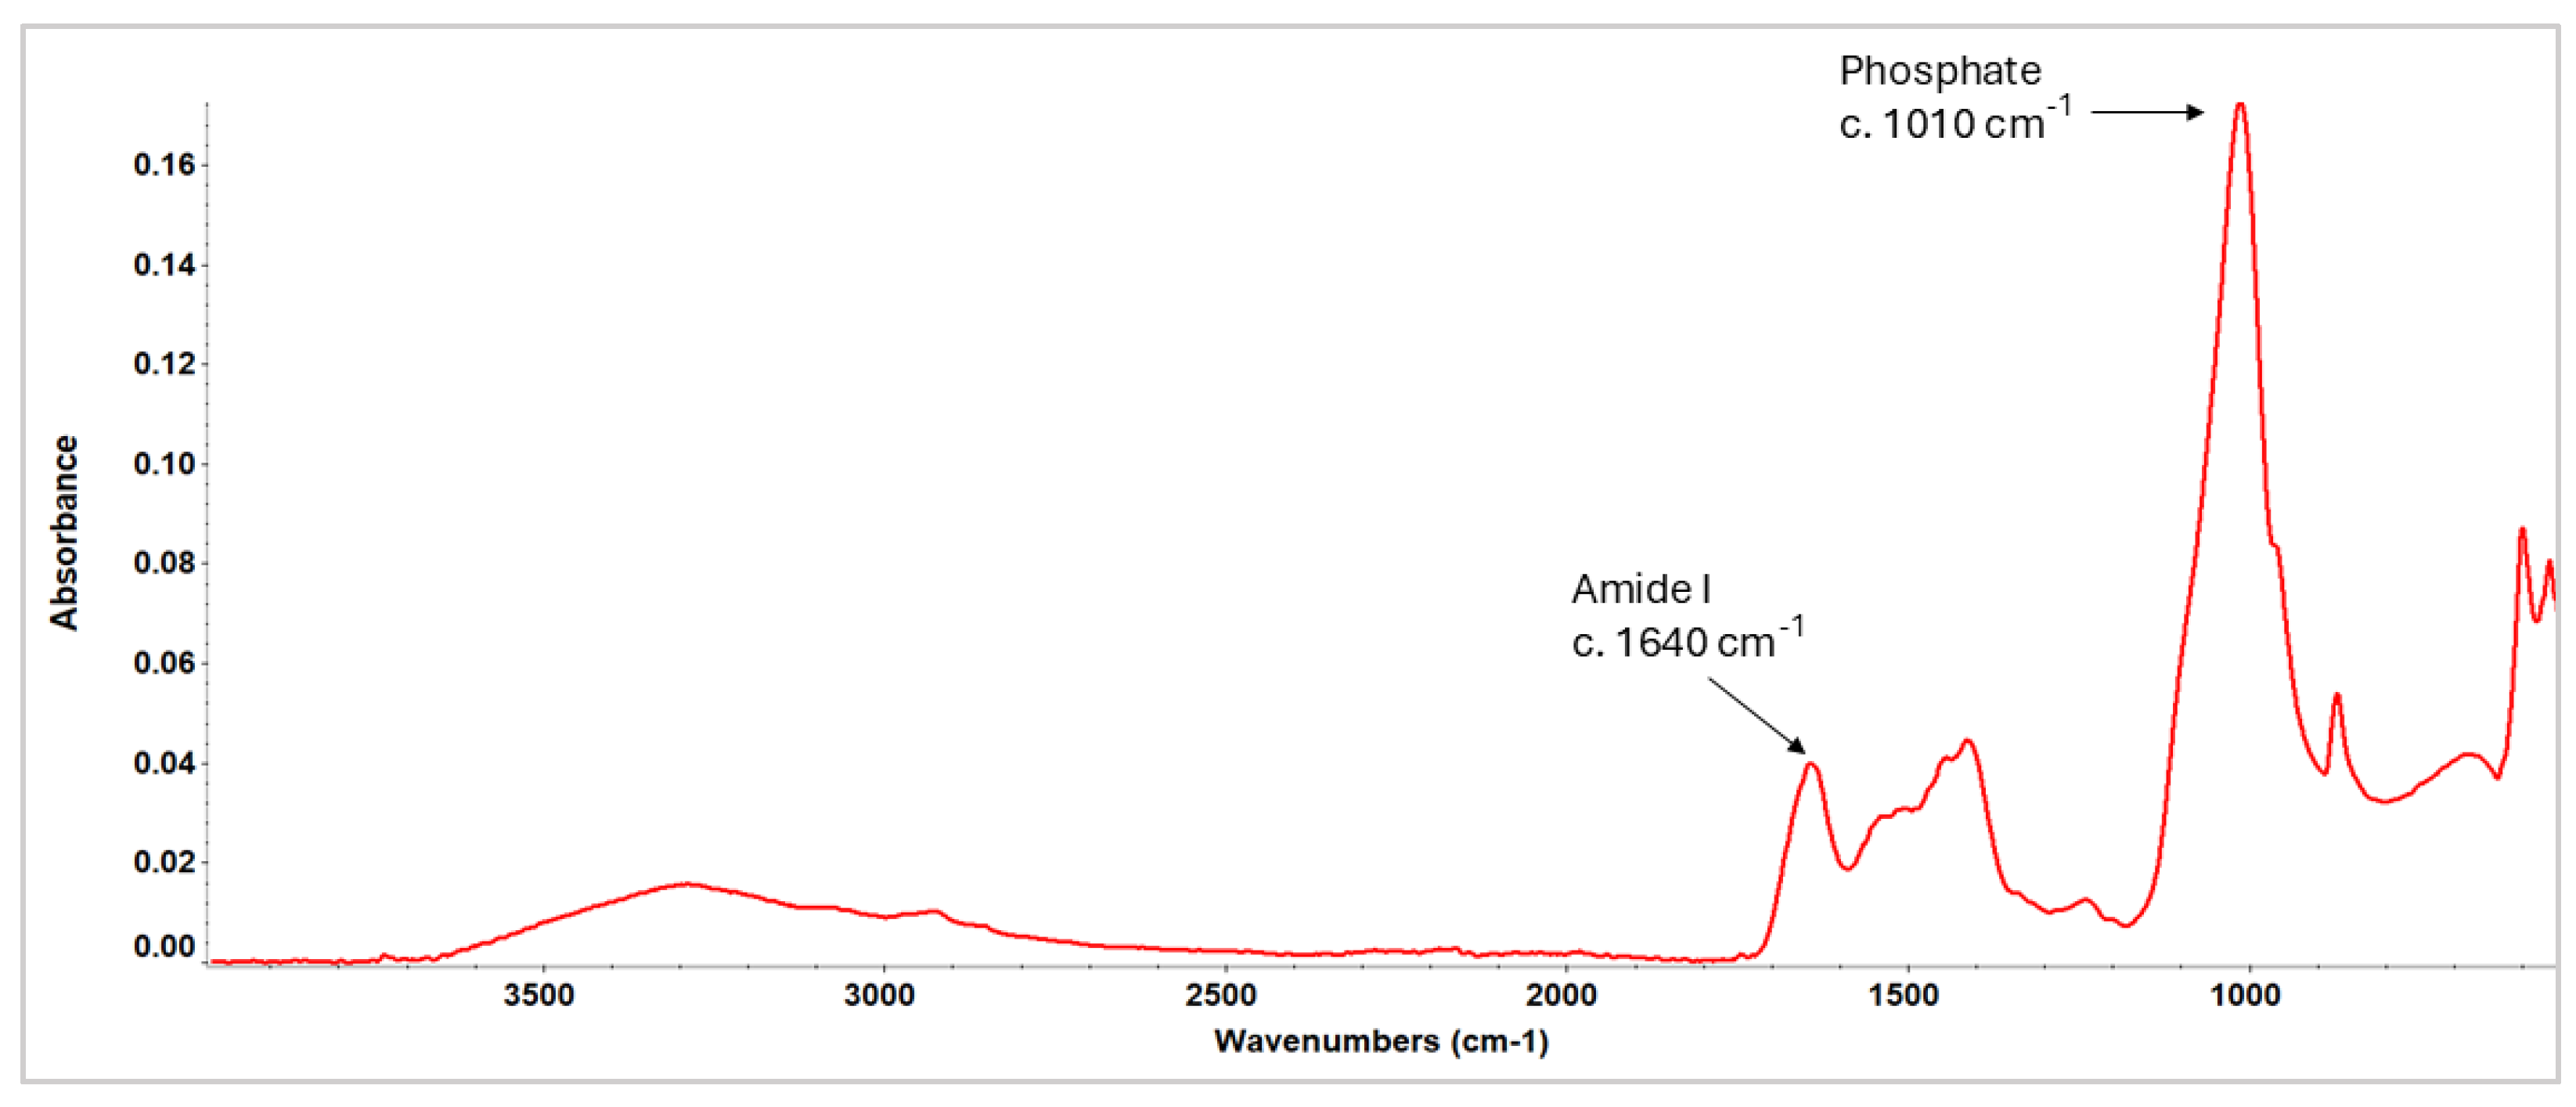
Figure 11.
FTIR AmI/P spectral ratio for each sampled location, mean and standard deviation (n=5). Modern cattle bone 0.227 ± 0.011.
Figure 11.
FTIR AmI/P spectral ratio for each sampled location, mean and standard deviation (n=5). Modern cattle bone 0.227 ± 0.011.
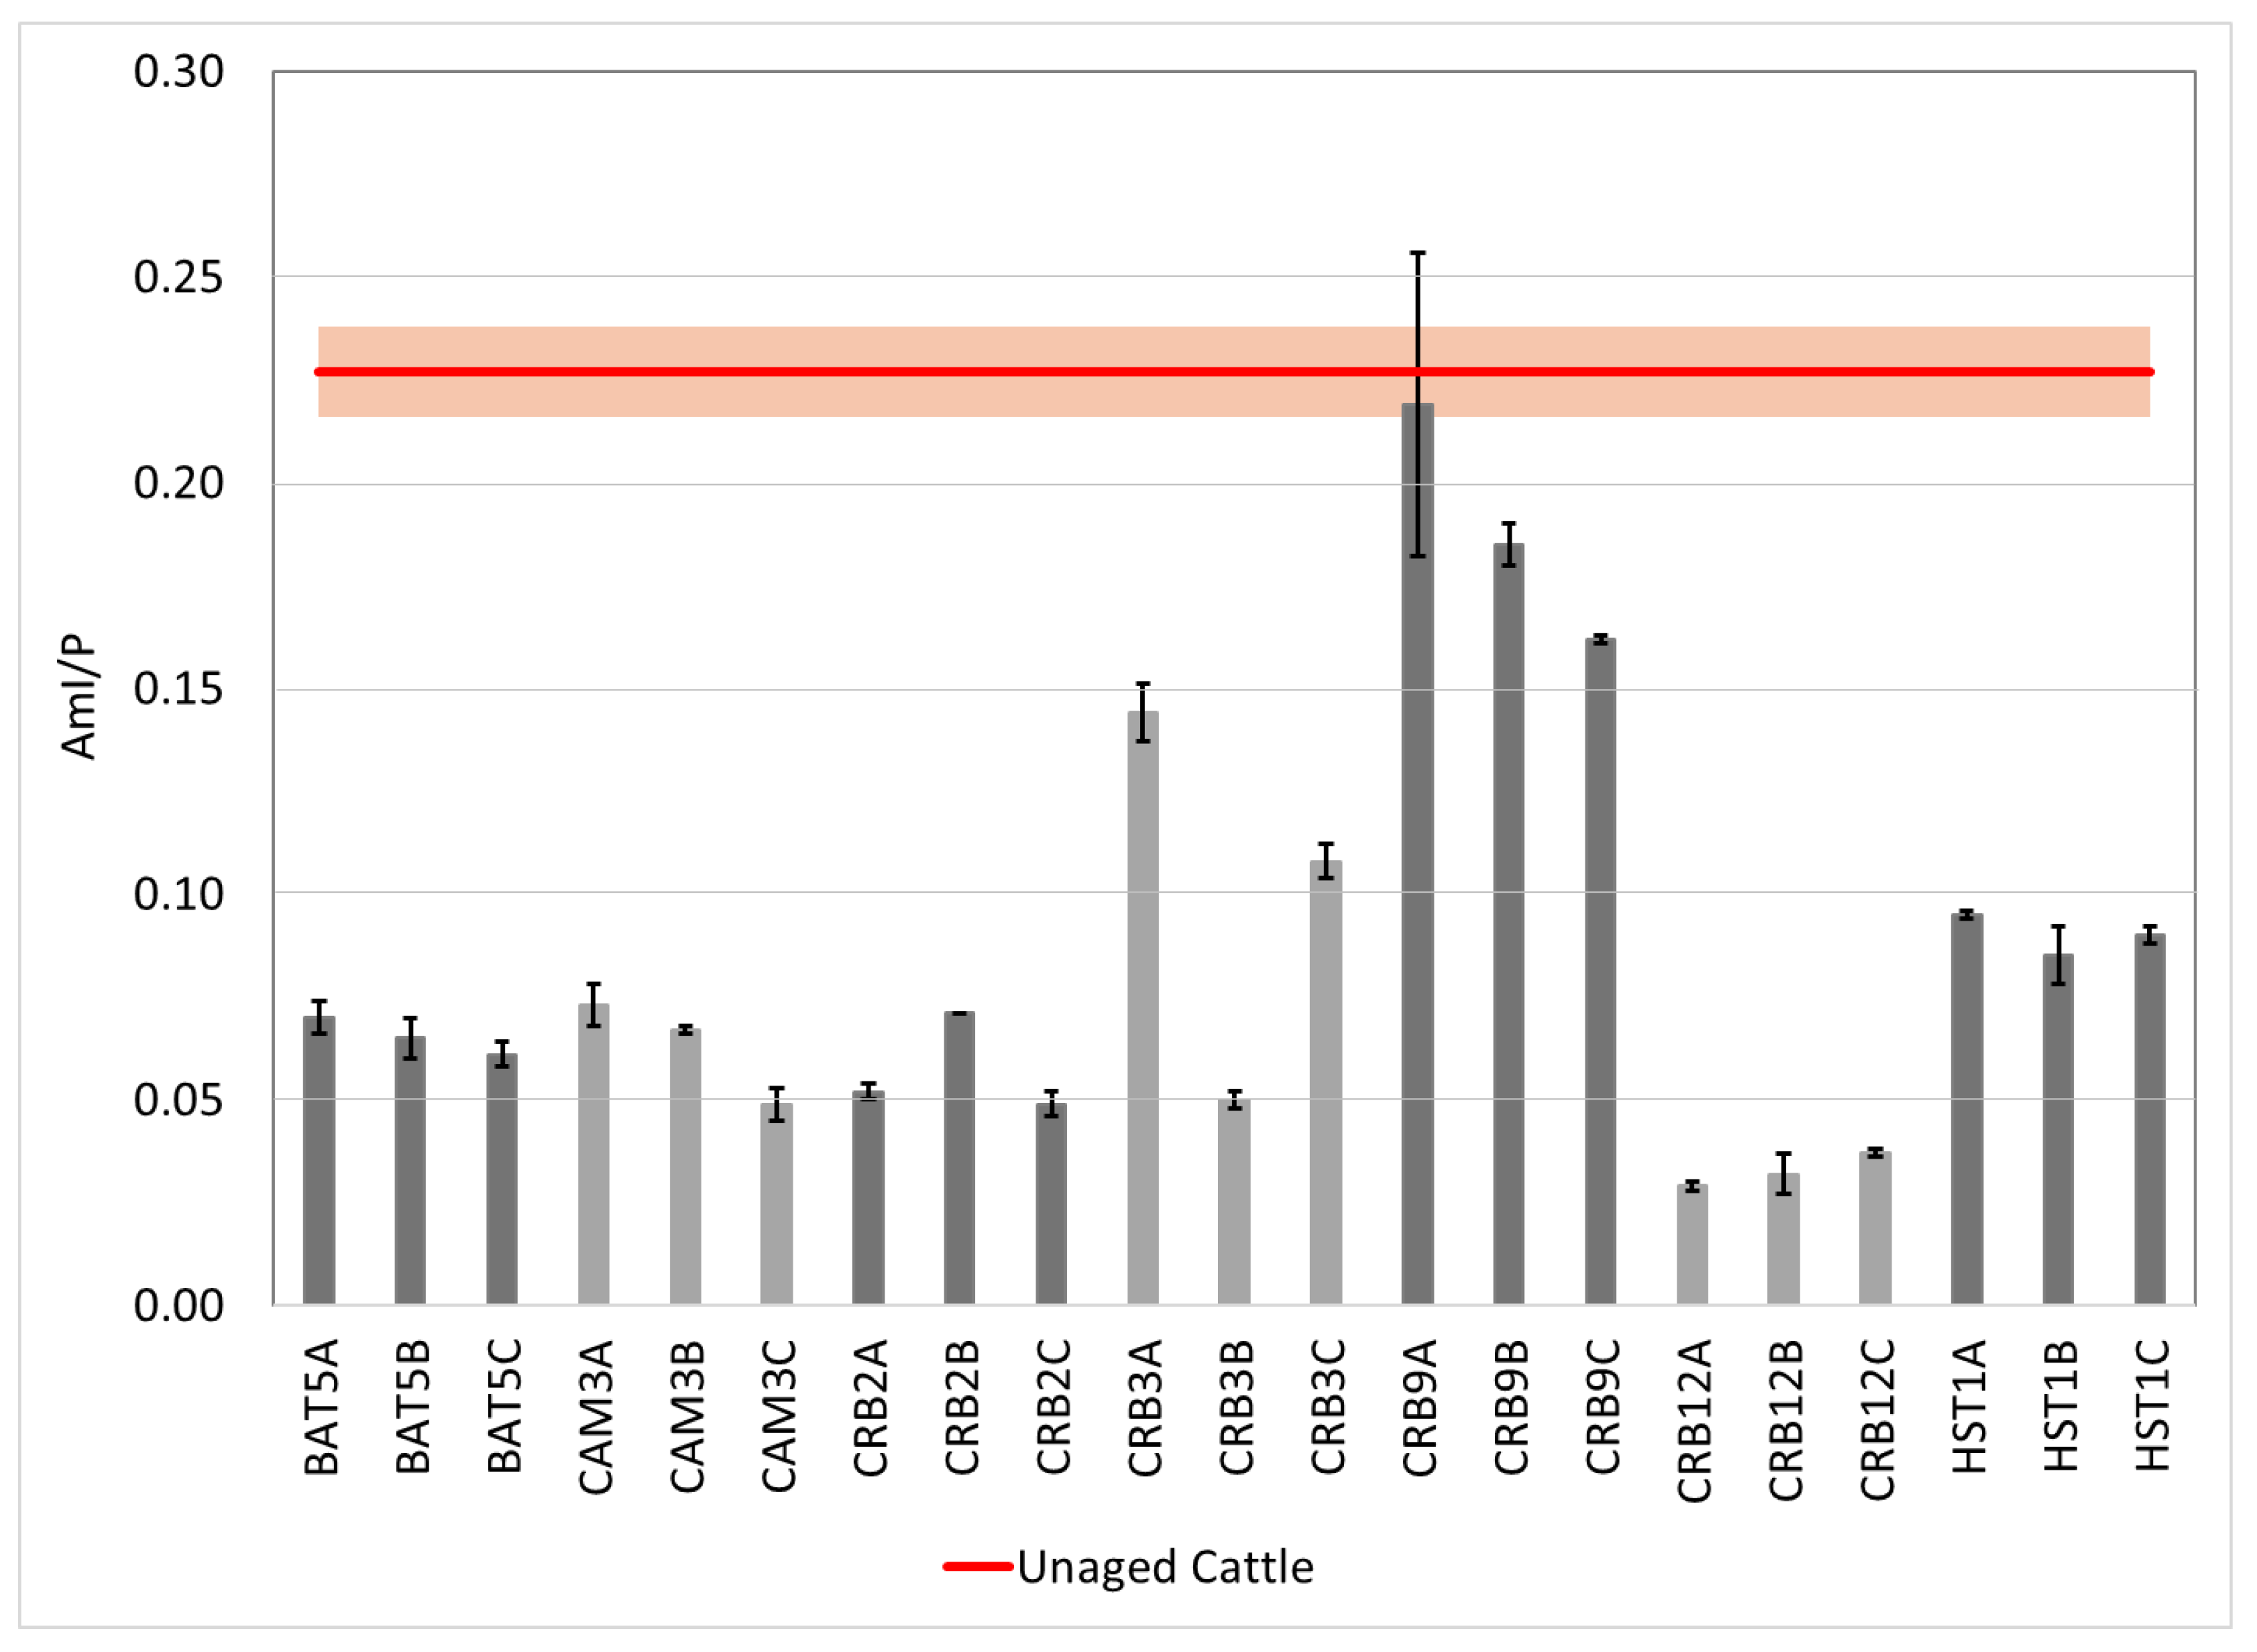

Table 1.
Summary of archaeological and excavation details of the samples.
| Sample | Site | Period | Excavation | Species | Age |
|---|---|---|---|---|---|
| BAT5 | Battle Abbey | Medieval | 1978 – 80 | Cattle | Juvenile |
| CAM3 | Camber Castle | Tudor | 1982 – 83 | Cattle | Adult |
| CRB2 | Corbridge | Roman | 1966 – 67 | Cattle | Adult |
| CRB3 | Corbridge | Roman | 1966 – 67 | Large mammal | Adult |
| CRB9 | Corbridge | Roman | 1966 – 67 | Cattle | Adult |
| CRB12 | Corbridge | Roman | 1966 – 67 | Cattle | Adult |
| HST1 | Housesteads | Roman | 1984 | Cattle | Sud-adult |
Table 2.
XRF elemental analysis showing elements present in major (M), minor (m) or trace (t) concentrations.
Table 2.
XRF elemental analysis showing elements present in major (M), minor (m) or trace (t) concentrations.
| Sample | Location | P Kα | Ca Kα | Mn Kα | Fe Kα | Cu Kα | Zn Kα | Pb Lα |
|---|---|---|---|---|---|---|---|---|
| BAT5 | X1 | m | M | t | m | t | m | m |
| BAT5 | X2 | t | M | t | m | t | t | |
| CAM3 | X1 | m | M | m | t | t | m | |
| CAM3 | X2 | m | M | t | m | t | t | m |
| CRB2 | X1 | t | M | t | M | t | ||
| CRB2 | X2 | m | M | m | M | t | t | |
| CRB3 | X1 | m | M | t | m | t | m | m |
| CRB3 | X2 | m | M | m | M | t | m | m |
| CRB9 | X1 | m | M | m | M | t | m | t |
| CRB9 | X2 | m | M | m | M | t | m | t |
| CRB12 | X1 | m | M | m | m | t | m | |
| CRB12 | X2 | m | M | m | M | t | m | |
| HST1 | X1 | m | M | t | m | t | t | |
| HST1 | X2 | t | M | t | m | t | t | |
| HST1 | X3 | t | M | t | M | t | t |
Disclaimer/Publisher’s Note: The statements, opinions and data contained in all publications are solely those of the individual author(s) and contributor(s) and not of MDPI and/or the editor(s). MDPI and/or the editor(s) disclaim responsibility for any injury to people or property resulting from any ideas, methods, instructions or products referred to in the content. |
© 2025 by the authors. Licensee MDPI, Basel, Switzerland. This article is an open access article distributed under the terms and conditions of the Creative Commons Attribution (CC BY) license (http://creativecommons.org/licenses/by/4.0/).
Copyright: This open access article is published under a Creative Commons CC BY 4.0 license, which permit the free download, distribution, and reuse, provided that the author and preprint are cited in any reuse.


