
Submitted:
05 August 2025
Posted:
06 August 2025
You are already at the latest version
Abstract
This work presents an Internet of Things (IoT) node based on Geostationary Earth Orbit (GEO) satellite communications. The work addresses the issues of low-power agrifood chain tracking in remote areas, where long range terrestrial communications are either denied or impaired. The novelty of the work is the development and characterization of the IoT node with a dedicated radio modem unit providing GEO satellite connectivity. This enables real-time tracking and sensing. As preliminary design, an IoT node conceived for cattle tracking is assembled and tested. The node is equipped with a microcontroller unit, controlling the radio-mode unit and a suitable sensor set installed in the IoT node itself. The set of sensors is capable to acquire position coordinates, acceleration, temperature, humidity, and intensity of solar radiation. The radiating features of radio-modem unit, embedded in the IoT node plastic enclosure, were characterized and exhibits a maximum transmitting effective isotropic radiated power of 27.5 dBm . The experiments measured the average charge drained by the radio-modem unit per cycle, resulting in 356 mC. Considering a battery pack composed of four 2500 mAh AA NiMH, the estimated number of cycles is approximately 25,000.
Keywords:
agrifood chain
; GEO satellite
; IoT
; LoRa
; LoRaWAN
; traceability
; wireless sensor networks
1. Introduction
Precision agriculture (PA), also known as smart farming, aims at improving, among others, the yield and efficiency of involved processes, along with providing sustainability [1]. Despite the name, PA does not limit itself to soil cultivation, but also includes breeding and farming. Recently, specific concerns raised about the traceability of the agrifood chain processes [2]. The institutional interest in PA is proven by ongoing COST actions [3] organized by the European Union, along with the Next Generation EU (NGEU) program, which generated the Italian National Recovery and Resilience Plan (NRRP) specifically devoted to develop National Research Centers, as the one for Agricultural Technologies [4].
PA employs several technologies such as remote sensing sensors, the Internet of Things (IoT), autonomous systems, prediction and decision-making techniques, and global navigation satellite systems (GNSSs). An overview of sensors and technologies for remote sensing for agriculture is given in [5], with a list of all possible techniques (e.g., thermal imaging, multi-spectral imaging, radar, light detection and ranging, aerial imagery, unmanned aerial vehicles). In this context, the role of IoT in agriculture is described in [6], reviewing the IoT sensor technologies applied to PA. An example of an IoT approach for plant growth control is described in [7], while a similar review for livestock is given in [8]. In [6], the authors provide a comprehensive overview of key IoT parameters for PA. In terms of IoT connectivity, one of the most widely diffused is represented by the long range wide area network (LoRaWAN) [9], which is one of the choice technologies for interconnecting IoT nodes to the infrastructure, due to its inherent low power consumption requirements for a covering range of several kilometers or in presence of strong fading ([10] and references therein). These features are enabled by the long range (LoRa) protocol, exploiting very high gain process allowed by the inherent low data rate requirements typical of those involved in smart agriculture [6], [11,12,13].
In this context, the novelty of the present work consists on the development and characterization of a IoT sensor node based on a LoRa connectivity assisted by a satellite radio access technology [14,15,16]. Specifically we adopted an available geostationary Earth orbit (GEO) LoRA satellite connectivity, which permits the real-time connection between the IoT sensors and the remote data storage even in remote areas where other types of radio access technologies are not present or would fail. This feature is especially useful, for example, in outdoor cattle breeding, where animals are free to graze even in remote mountain areas.
To highlight the characteristic and advantages of GEO satellite connectivity for the specific purpose of PA, an IoT node equipped with several sensors and a LoRa satellite modem was developed and tested. Its design was intended for cattle breeding [17,18,19,20,21,22,23,24,25,26], although the architecture can be adapted to other applications.
This paper extends the work described in [27]. While [27] focuses on a proof-of-concept, this work proposes a preliminary design with the IoT node enclosed by a dedicated box and tested on-field. In this work, data processing is limited to collecting sensor measurements and transmitting them to a cloud-based repository, where the data can be accessed through a dedicated user interface.
The paper is organized as follows. The IoT node architecture is described in Section 2. There, the components of the IoT node are described, the cloud service and Python IDE are outlined, and the assembled IoT node is shown. The results in terms of effective isotropic radiated power (EIRP), on-the-field tests, and related energy consumption are presented in Section 3 and discussed in Section 4. Eventually, conclusions are drawn in Section 5.
2. Materials and Methods
2.1. IoT Node Architecture
The high-level block diagram of GEO satellite tracking is depicted in Figure 1.
It is composed of the sensor subsystem, the microcontroller unit (MCU), and the radio-modem unit (RMU). With reference to Figure 1, the MCU (2) acquires data from the environment in which the IoT node is located (1), and drives the RMU (3). This eventually becomes the hardware in charge of transmitting the data to the GEO satellite (4); data transmission then takes place via real-time satellite LoRa communication. This is the key novelty of this work. The GEO satellite receives the data packets and sends them back to Earth where they are made available via an internet cloud service (5). Data are then processed, for instance via blockchain for traceability and integrity [28,29], and made available to the end consumer (6). The last step is outside of the scope of this work.
2.2. Hardware Components
The hardware components of the IoT node are
-
Sensor subsystem
- –
- GNSS module
- –
- accelerometer
- –
- temperature and humidity sensor
- –
- intensity of solar radiation sensor
- –
- current sensor (only for monitoring purpose)
- MCU
- LoRa RMU
The list above indicates the sensors that make up the sensor subsystem (Figure 1). The sensors actually used depend on the application (temperature is common to every application; humidity sensors may be used for soil moisture in crop monitoring, while accelerometers and GNSS are mainly used for cattle-breeding). In particular, the use of GNSS for cattle breeding is established for tracking [30], pasture management [31], grazing habits [32,33], and environmental impact of grazing [34], while the accelerometer is commonly adopted to monitor cattle position and activity, such as ingestion, lying down, standing, walking, and estrus [17]. Ambient temperature and humidity are useful, for example, in assessing cattle induced estrus [35]. The intensity of solar radiation is measured as it affects cattle behavior [36].
2.2.1. GNSS Module
In this work, we adopted a Grove - GNSS, employing the Air530 module, which works with GPS, Beidou, Glonass, Galileo and QZSS constellations. The module communicates with the MCU using a UART interface, and is specified for typical and maximum working currents of 30 and 60 , respectively. To save power, the GNSS module can be set in sleep mode. The coordinates provided by the GNSS module are in the format degrees, primes, decimal of primes. The GNSS module acquires the position every second with a precision of on the Earth surface. The module is connected to a ceramic antenna via a micro-sized coaxial cable. The dimensions of the GNSS module and the antenna are 42 x 24 and 15 x 15, respectively.
2.2.2. Accelerometer
The IoT node integrates a three-axis low-power accelerometer, based on the LIS3DH IC from ST Microelectronics. The accelerometer communicates with the MCU through an I2C serial interface. The current consumption amounts to 150 in measurement mode and to 21 in standby mode. The module dimensions are 23.8 x 20.
2.2.3. Temperature and Humidity Sensor
The temperature and humidity sensor is based on a commercial DHT22 module, which is a basic, low-cost digital temperature and humidity sensor. It uses a capacitive humidity sensor and a thermistor. The data are made available through a single-wire serial interface to the MCU. According to the datasheet, the accuracy is °C for temperature and for relative humidity measurements. The maximum current consumption is during measurements and 50 in standby mode, making this sensor an attractive choice for battery-operated systems. The sensor dimensions are 41.5 x 22.
2.2.4. Solar Radiation Sensor
The Amphenol SUF083J001c integrates a reverse biased photodiode cell to measure the intensity of solar radiation, and provides an output current linearly proportional to the intensity of solar radiation. The conversion factor from current to intensity of solar radiation is /. The biasing circuit is shown in Figure 2(a). The output current is at a solar radiation of of a 2856 standard A light source. Considering a resistance of , the voltage at the input of the ADC ranges between and . The module dimensions are 20 x 20 x 17mm. The relationship for the relative sensitivity versus wavelength and the radiation pattern are provided in the datasheet.
2.2.5. Current Sensor
Power consumption plays an important role in IoT devices [37]. The current over time for the RMU in laboratory conditions is given in [27]. The monitoring of the RMU absorbed current was implemented in the IoT node to estimate the power consumption and the battery life, consequently. Although sensors and the MCU can be optimized for a specific low-power use, there is no low-power version of the RMU, which then remains the most energy-intensive component.
To measure current, the Gravity I2C digital wattmeter, which is based on the INA219 from Texas Instruments, is used. The current sensor is inserted in series to the RMU power supply and senses the current using the voltage drop across a resistor of 100 . A RC filter is also added to filter out higher harmonics [Figure 2(b)]. This sensor is used only during the development of the IoT node, but is not expected to be deployed in the operational version of the IoT node. For this reason the current sensor is in italic in the bullet list at the beginning of the subsection.
2.2.6. Microcontroller Unit
The MCU is the ST Microelectronics evaluation board based on an STM32 ARM microcontroller. The requirements for the MCU unit depends on the complexity of the sensor subsystems and the computing requirements; it is the authors’ opinion that this selection is adequate for most agrifood traceability applications. The MCU has a maximum working current of 500 with a supply voltage range between 4.755.25. The PCB dimensions are 133.3 x 70. A detailed description of the MCU firmware is available at [38].
2.2.7. LoRa Radio-Modem Unit
The Echostar EM2050 [39] constitutes, at the best of the authors’ knowledge, the only commercially available technological solution for IoT connectivity with GEO satellites. Unlike low and medium Earth orbit satellites, the GEO satellite allows real-time connectivity between the sensors and the cloud-based service, as the IoT node and the gateway are always within the coverage area of the satellite. The modem provides all the functions required for the GEO satellite connection. It is equipped with two surface-mount ceramic S-band antennas (M310220 chip antenna from Kyocera/AVX, Tx 19802020, Rx 21702200, linear polarization, maximum input power of W). The modulation used for uplink is the frequency hopping (FH) spread spectrum. The RMU communicates via a UART serial interface to the MCU. The current consumption for the RMU depends on the mode, state and operation performed. Table 1 shows the average current measured for the RMU states. The joining power corresponds to the power at the antenna input and is set to 27 dBm, the maximum input power for the adopted antennas. The RMU can be supplied both with and 5 . The former is preferred since it absorbs less power and avoids the internal voltage regulator. The dimensions of the printed circuit board (PCB) are 107.5 x 69.
In Table 2, we report the list of the maximum working current consumptions for the IoT hardware components. It is worth noting that the MCU maximum current consumption is determined mainly to debug circuitry. This can be removed in an ultimate version, strongly reducing MCU energy demand. The RMU, in its joining state where it transmits at peak power, ranks as the second-highest energy-consuming device.
2.3. Subsystems Integration
The block diagram of the IoT node is shown in Figure 3. The interfaces between the MCU and the peripherals are shown together with the power supply, a battery pack composed of four 2500 mAh AA NiMH rechargeable batteries. The battery pack provides a nominal voltage of and is connected to the MCU. This in turns supplies the peripherals.
The high-level firmware block diagram of the IoT node is the same of the one described in [27]. The MCU reads the sensors periodically and transmits the acquired data to the satellite gateway. A single cycle is composed by the following steps
- sensor reading;
- composition of the message;
- data transmission through the RMU;
- sleep mode (wait until the next cycle).
The firmware sets the peripherals in sleep mode when not operative. The sensors can be turned off in hard mode, by removing the supply voltage; this is particularly important for the most energy-hungry sensors. GNSS and RMU modules are controlled through asynchronous control signals using the proper interface. In particular, the RMU is set in sleep state when the node is not transmitting. Even during sleep, the real-time GEO satellite connection is preserved, eliminating the need for a new joining upon waking.
In the IoT architecture, the RMU deserves a more detailed description. The typical current waveform for the RMU is shown in Figure 4 [27]. The cycle starts at in sleep mode (current ). It is then waked up (current ) before transmitting the data (current ). After transmission (first current burst in the picture), the RMU returns to idle state, awaiting the acknowledgment message (current ); this latter phase requires a second burst of current absorption. Eventually, the RMU is set to the idle state and then to the sleep state. This state remains until the end of the cycle at . When the IoT node is turned on at start up, the RMU joins the satellite and then enters the above cycle indefinitely. In this procedure, energy consumption is maximum at initialization. In our implementation, the RMU remained in idle state for a short period of time about the two current bursts. This is due to the interconnection of the RMU with an external MCU. If the MCU and the RMU were integrated on the same PCB, the idle state would be replaced by the sleep state, thus reducing power consumption.
2.4. Cloud Service and Python Application Programming Interface
The cloud service was provided by Amazon Web Services (AWS) [40]. AWS stores in queues the messages sent by the IoT node. To access and display the messages, polling is required. Within the LoRa network, there is a bi-univocal association between the specific used queue and the serial number of the transmitting RMU module; so the data recovered inside the cloud service are effectively associated to a precise IoT node and distinguished between nodes. The messages recovered in the cloud are encoded (base-64), so a conversion to ASCII encoding is needed. The messages in AWS are labeled with an ID.
Messages in AWS are processed with a Python script. This uses the boto3 [41] library to access AWS and performs the following steps
- 1.
- start a communication with AWS;
- 2.
- read messages in the queue;
- 3.
- delete messages in the queue;
- 4.
- decode the messages;
- 5.
- get data;
- 6.
- process the data in the messages.
A more detailed description of this script is provided as support material [38].
For this specific hardware and LoRA-satellite service, the maximum number of bytes that can be transmitted in a single message is 51, considering a spreading factor of 12, corresponding to a receiver sensitivity of dBm for a bandwidth of 125 kHz (nominal value) [42]; the code rate is 4/6. The parameters of spreading factor and modulation correspond to a minimum allowable signal-to-noise ratio (SNR) of dB at the satellite gateway. An adaptive data rate for LoRaWAN is investigated in [42], where the gateway sensitivity, the end user sensitivity, and the minimum allowable SNR are reported for variable spreading factors.
An example of sensor readings, excluding the current sensor, is shown in Table 3. Offsets are added to the numbers during transmission to prevent negative values, as outlined in the table. Transmitting in base-10 requires converting the data into ASCII characters, resulting in 58 characters, exceeding 51. Decimal points are thus removed, and the characters are combined into a single string, which is then converted into a 34-byte hexadecimal format, under the 51-byte limit. This is sent directly to the RMU using the AT + SENDB command. In the satellite network, this message converts to base-64. The base-64 version of the example from Table 3 is
and the corresponding base-16 representation is
The sent message is in hexadecimal, with its decimal values displayed in Table 3.
2.5. Assembly
For a mechanically sturdy IoT node, a plastic box has been designed to host the electronics. The paradigm used to design the box is that the MCU and the battery pack are at the bottom of the box [Figure 5(b)] while all other peripherals are attached to the lid [Figure 5(a)]. Spacers are used to fix the MCU and the RMU. The battery pack is placed in a specific compartment with a dedicated lid. As a temporary solution for a demonstrator, all parts are connected via wires instead of being integrated on a PCB. In this stage of the work, the focus is to demonstrate design and characterization of an IoT node equipped with satellite connectivity, hence integrating all MCU and peripherals on a same PCBs will be matter of future work.
Regarding the ceramic antennas for the RMU, the documentation recommends mounting the antennas on the top side of the enclosure, keeping them at least 3 mm away from the walls to prevent detuning; avoiding external objects that obstruct the line of sight between the IoT node and the satellite is also recommended. To avoid antenna detuning, spacers are used to support the RMU. In addition, a slot has been created in the lid to increase the distance from the antenna. Regarding the ceramic antenna of the GNSS module, it was installed on the back of the box cover.
The solar radiation sensor was installed in a recess of the box cover, such that it could be exposed directly to the environment (black circle in Figure 5(a)). In the same way, a window on the box cover was opened to host the temperature and humidity sensor – bottom left corner of the lid in Figure 5(a). The box presents slots to allow fixing it to a collar of an animal. The dimensions of the box are 108 x 110 x 320 with slots and 108 x 110 x 220 without slots. The box 3D-printed using acrylonitrile butadiene styrene (ABS) filaments and fused deposition modeling as printing technique. The CAD files of the box are available at [38].
3. Results
The experimental results of the IoT node are given in terms of EIRP, data acquired by the sensors, data of the communication between the RMU and the GEO satellite, and dissipated current. Except for EIRP, the tests performed are two: (i) standing test in which the IoT node remained still for a long duration ( 258 ) to check for hardware reliability; (ii) moving test in which the IoT node was carried in the hand of a pedestrian for a short duration ( 63 ) to check for communication reliability.
3.1. Transmitting Characterization
The simulated box is shown in Figure 6. The dielectric permittivity and loss tangent of the ABS are and , respectively. They are measured with a cavity method [43] at . The RMU transmitting radiation was first investigated by simulations using the frequency domain solver in ANSYS Electronics Desktop [44]. The antenna manufacturer provides the model of the antenna. This was placed on a PCB, as shown in Figure 6. The Tx (Rx) antenna is located on the negative (positive) part of the x-axis. The antennas are fed by coplanar waveguides grounded with vias. The antenna tuning was obtained with LC networks, component values were estimated from simulations: and ( and ), for the Tx (Rx) antenna.
The measurement setup is shown in Figure 7. An Agilent CSA spectrum analyzer N1996A from Agilent Technologies was used. The test antenna is the HyperLOG® 7060 from Aaronia AG.
The simulated and measured EIRP for the Tx antenna inside the box are shown in Figure 8. The picture reports the 3D radiation pattern that provides an overall qualitative description of the radiation characteristics; from the surface we can recognize the expected almost omnidirectional radiation. The plots with measured data reveal instead few blind directions, at , and , , the latter captured also by simulations. During EIRP measurements, the RMU was connected to a dedicated MCU from ST microelectronics to drive the antenna in continuous wave with 27 dBm input power. In simulations, the same input power is added to the realized gain to get the EIRP.
3.2. Sensor Data
The data collected for the two tests are reported in Figure 9: temperature and humidity, acceleration magnitude and intensity of solar radiation, and finally SNR.
For the standing test, the IoT node was placed on the windowsill of our laboratory, located in Via di Santa Marta 3, I-50139 Firenze (FI) Italy, marked with a black dot in Figure 9(a/S). The quality of the uplink radio communication link is assessed by the SNR, which is shown in Figure 9(d/S) and (d/M).
3.3. Current Absorption
The current absorption data were acquired with a sampling rate of 100 , too high to be transmitted through a real-time satellite connection. Thus, the cumulative of the current samples is transmitted along with the number of time counts for each cycle. From these data, the total charge drained per cycle and the cycle time are computed. The results for cycle time, mean current, and total charge are depicted in Figure 10 for both standing and moving tests. Data with outliers removed are shown in aggregate form as histograms.
There was an offset when measuring the current in sleep mode due to the module arrangement within the prototype. To remove this systematic contribution, the mean current in the sleep mode is subtracted from the mean current over the transmitting cycle. An additional cycle in which the modem remains in sleep mode is added to measure the current in this state. This added cycle had a duration of 40 s. The total cycle duration becomes 80 s ( 40 s for data transmission and 40 s for sleep current measurement).
4. Discussion
4.1. Transmitting Radiation Pattern
In terms of transmission capability, a maximum EIRP of dBm is observed. The radiation pattern does not guarantee good coverage for each orientation between the IoT node and the GEO satellite. The arrangement of the subsystems is still preliminary, nevertheless it was proven to not affect the general performances of the IoT node prototype.
4.2. Sensor Data
The RMU adopts a FH technique to reduce the possible interference in a dense IoT deployment. In the case under consideration, the Tx carrier frequency is while the FH deviation from the carrier was one the following quantities: 453 , , , . The deviation between subcarriers is fixed at 156 , while the bandwidth of the signal is 137 . This is a feature of the adopted modulation and hence is the same for both the tests.
Let us now discuss the standing test. The test lasted 258 . In this test, the node was placed in a fixed position [see Figure 9(a/S)], nevertheless there is a jitter in the localization. We can consider that attained accuracy and precision, in the range of a meter, are consistent with most traceability applications in agrifood chains. The number of satellites in line of view to the GNSS module ranges from 5 to 13.
The temperature and humidity for the standing test are visible in Figure 9(b/S). They are stable over time. The temperature ranges from °C to °C. The latter value is too high, since the temperature range recorded from an Italian weather service (https://www.ilmeteo.it/) was °C to °C. It should be noted that no special attention was given to sensor placement, such as shielding from direct sunlight. This explains the apparent inaccuracy in the temperature measurements. The humidity is in the range - ; a variability that can be attributed to the environment conditions rather than sensor accuracy.
The acceleration for the standing test is shown in Figure 9(c/S). The mean value and standard deviation are m/s2 and m/s2, respectively. The mean value is different from the standard value of m/s2, due to the shift acceleration presented by the accelerometer. This results is due to factors that modify slightly the factory calibration, such as thermal stress during soldering and misalignment of the accelerometer package relative to the PCB. Improved calibration can be achieved with more sophisticated procedures.
The intensity of solar radiation for the standing test, reported in Figure 9(c/S), was almost constant during the test; the day of the test was cloudy with diffused daylight. Bearing in mind that the sensor pattern is almost conic, even at midday the intensity of solar radiation that is sensed may be low if the sensor does not point directly to the Sun.
The SNR of the IoT to satellite uplink is reported in Figure 9(d/S) for the standing case. Its SNR ranges from dB to dB, which is significantly larger that the necessary, i.e. dB, to establish the link.
Let us now focus on the moving test. The path for this test is drawn in Figure 9(a/M). Observe that the IoT node was carried on the bank sides of a river, on an open area. The density of the acquisitions is not uniform along the path because some messages were not received. The test lasted 63 . The number of satellites visible to the GNSS module ranges from 9 to 20. These values are greater than those for the standing test, probably because during the test the environment presented fewer obstacles in the line of sight with the GEO satellite.
In the moving test, the temperature variation in Figure 9(b/M) is less than in the standing test and goes from 19.721.3 °C. Similar considerations can be made for the humidity, ranging from 57.162.9. On the other hand, the acceleration for the moving test in Figure 9(c/M) oscillates due to the pedestrian gait oscillations.
With regard to the intensity of solar radiation in Figure 9(c/M), it was slightly cloudy during the test. Indeed, the values for the intensity of solar radiation are greater than for the standing test. However, the values oscillate more because of shadows generated by vegetation and the pedestrian carrying the IoT node.
The SNR for the moving test is shown in Figure 9(d/M) and ranges from -13.2-5.8dB. The SNR for the moving test is greater than that for the standing test, probably because of the better line of sight satellite visibility.
4.3. Battery Life
During tests, a nominal cycle time of 40 s was settled. The cycle is composed of sensor readings, message transmission, and sleep periods within the single packets. However, the distributions of the cycle time, reported in histograms for both standing and moving tests in Figure 10 (a/S) and (a/M), show that the actual cycle time has some dispersion. In particular, the measured cycle time tends to be less than the desired one. This is most likely due to a non-calibrated MCU clock reference.
The mean current absorption reported in Figure 10 (b/S) and (b/M) was evaluated by integrating the current, neglecting the sleep mode current contribution, and then dividing for the cycle time; this for each individual packet. The results show a slight difference for the mean current absorption between the two tests, that are approximately 8 mA and mA, respectively.
The total charge drained per cycle is reported in Figure 10 (c/S) and (c/M). The mean total charge drained over both tests is approximately 356 mC. On this basis, an estimate of the number of cycles that can be handled by the battery pack provided is given below
where is the number of cycles, the battery charge, and the charge per cycle. The battery life depends on the message frequency as follows
where is the battery life and the message frequency. The data rate requested in the typical use case is low. In [31], a 5 interval for cattle tracking is considered. This interval corresponds to a message frequency of and a battery life of approximately 88 days. Besides periodic data transmission, other approaches were adopted for efficient energy management, such as those triggered by an event [45].
The above estimate assumes that the current of the RMU in sleep mode was negligible, actually its value is (Table 1). It results that this additional drain of charge is more relevant in the case of low data rate demands. Not least, the RMU is the most power-hungry component of the realized IoT node prototype; nevertheless, all other sensors and modules, first of all the MCU, absorb a quantity of current that could be non-negligible in very low data rate profile of use. Consequently, the effective battery life estimated in (1) should be considered as an upper limit.
5. Conclusions
In this paper, an IoT node with GEO satellite connectivity developed for PA has been described. Satellite connectivity is obtained with a dedicated commercial RMU operating in S-band. The IoT node was tested in real-life scenarios proving its effectiveness and reliability. To showcase the potentialities of such a system, the IoT node is equipped with a number of sensors suitable for the use case of cattle tracking.
For a deeper insight into the IoT node, the energy required to the satellite modem was monitored through the operative conditions. The charge drained per message transmission by the RMU, which was considered the most power hungry unit, was monitored; this value was estimated in 356 mC. resulting in an estimated number of cycles with the given battery pack (charge of 2500 mAh) of 25280. The study evaluated the approach for the proper connection of low power sensors to a satellite modem compatible with IoT node and evidenced the feasibility of GEO satellite-IoT in the specific area of PA.
Author Contributions
Conceptualization, A.C, G.G., M.B. and G.L.; methodology, G.G., M.B. and G.L.; software, G.G. and M.B.; validation, G.G., M.B., G.L. and S.M.; formal analysis, G.G. and M.B.; investigation, G.G., M.B., S.M. and G.L.; resources, G.G., A.C., M.B. and M.R.; data curation, G.G. and M.B.; writing – original draft, G.G.; writing – review and editing, all authors; visualization, G.G. and M.B.; supervision, A.C.; project administration, G.G.; funding acquisition, A.C.
Funding
This study was carried out within the Agritech National Research Center and received funding from the European Union Next-GenerationEU (PIANO NAZIONALE DI RIPRESA E RESILIENZA (PNRR) – MISSIONE 4 COMPONENTE 2, INVESTIMENTO 1.4 – D.D. 1032 17/06/2022, CN00000022).
Data Availability Statement
The original data presented in the study are openly available in GitHub at https://github.com/Gianne97/IoTnodeWithGEOconnectivity/ DOI: 10.5281/zenodo.16738961
Acknowledgments
The authors thank Dr. Telemaco Melia and Dr. Marcello Cocozza from EchoStar Mobile Ltd. for their help and insight.
Conflicts of Interest
The authors declare no conflicts of interest. The financing body had no role in the design of the study; in the collection, analyses, or interpretation of data; in the writing of the manuscript; or in the decision to publish the results.
Abbreviations
The following abbreviations are used in this manuscript:
| ABS | acrylonitrile butadiene styrene |
| AWS | Amazon web services |
| EIRP | effective isotropic radiated power |
| FH | frequency hopping |
| GEO | geostationary earth orbit |
| GNSS | global navigation satellite system |
| IoT | internet of things |
| LoRa | long range |
| MCU | microcontroller unit |
| NGEU | Next Generation EU |
| NRRP | National Recovery and Resilience Plan |
| PA | Precision agriculture |
| PCB | printed circuit board |
| RMU | radio-modem unit |
| SNR | signal-to-noise ratio |
References
- Singh, R.K.; Berkvens, R.; Weyn, M. AgriFusion: an architecture for IoT and emerging technologies based on a precision agriculture survey. IEEE Access 2021, 9, 136253–136283. [Google Scholar] [CrossRef]
- Cocco, L.; Mannaro, K.; Tonelli, R.; Mariani, L.; Lodi, M.B.; Melis, A.; Simone, M.; Fanti, A. A Blockchain-Based Traceability System in Agri-Food SME: Case Study of a Traditional Bakery. IEEE Access 2021, 9, 62899–62915. [Google Scholar] [CrossRef]
- COST Association. COST, 2025. https://www.cost.eu/ [Accessed: Mar. 27, 2025].
- PNNR MUR - M4C2 (Missione 4 Componente 2) Investimento 1.4 “National Research Centre for Agricultural Technologies” Agritech CUP HUB - B63D21015240004. National Research Centre for Agricultural Technologies (Agritech), 2025. https://agritechcenter.it/ [Accessed: May 27, 2025].
- Victor, N.; Maddikunta, P.K.R.; Mary, D.R.K.; Murugan, R.; Chengoden, R.; Gadekallu, T.R.; Rakesh, N.; Zhu, Y.; Paek, J. Remote sensing for agriculture in the era of industry 5.0—A survey. IEEE Journal of Selected Topics in Applied Earth Observations and Remote Sensing 2024, 17, 5920–5945. [Google Scholar] [CrossRef]
- Shaikh, F.K.; Karim, S.; Zeadally, S.; Nebhen, J. Recent trends in internet-of-things-enabled sensor technologies for smart agriculture. IEEE Internet of Things Journal 2022, 9, 23583–23598. [Google Scholar] [CrossRef]
- Adamo, T.; Colizzi, L.; Dimauro, G.; Guerriero, E.; Pareo, D. Crop planting layout optimization in sustainable agriculture: a constraint programming approach. Computers and Electronics in Agriculture 2024, 224, 109162. [Google Scholar] [CrossRef]
- Akhigbe, B.I.; Munir, K.; Akinade, O.; Akanbi, L.; Oyedele, L.O. IoT technologies for livestock management: a review of present status, opportunities, and future trends. Big Data and Cognitive Computing 2021, 5. [Google Scholar] [CrossRef]
- Alkhayyal, M.; Mostafa, A. Recent Developments in AI and ML for IoT: A Systematic Literature Review on LoRaWAN Energy Efficiency and Performance Optimization. Sensors 2024, 24. [Google Scholar] [CrossRef]
- Alumfareh, M.F.; Humayun, M.; Ahmad, Z.; Khan, A. An intelligent LoRaWAN-based IoT device for monitoring and control solutions in smart farming through anomaly detection integrated with unsupervised machine learning. IEEE Access 2024, 12, 119072–119086. [Google Scholar] [CrossRef]
- Silva, F.S.D.; Neto, E.P.; Oliveira, H.; Rosário, D.; Cerqueira, E.; Both, C.; Zeadally, S.; Neto, A.V. A survey on long-range wide-area network technology optimizations. IEEE Access 2021, 9, 106079–106106. [Google Scholar] [CrossRef]
- Queté, B.; Heideker, A.; Zyrianoff, I.; Ottolini, D.; Kleinschmidt, J.H.; Soininen, J.P.; Kamienski, C. Understanding the tradeoffs of LoRaWAN for IoT-based smart irrigation. In Proceedings of the 2020 IEEE International Workshop on Metrology for Agriculture and Forestry (MetroAgriFor); 2020; pp. 73–77. [Google Scholar] [CrossRef]
- dos Santos, U.J.L.; Pessin, G.; da Costa, C.A.; da Rosa Righi, R. AgriPrediction: a proactive internet of things model to anticipate problems and improve production in agricultural crops. Computers and Electronics in Agriculture 2019, 161, 202–213. [Google Scholar] [CrossRef]
- Devalal, S.; Karthikeyan, A. LoRa technology - an overview. In Proceedings of the 2018 Second International Conference on Electronics, Communication and Aerospace Technology (ICECA); 2018; pp. 284–290. [Google Scholar] [CrossRef]
- Foubert, B.; Mitton, N. Long-range wireless radio technologies: a survey. Future Internet 2020, 12. [Google Scholar] [CrossRef]
- Semtech Corporation. Semtech LoRa Technology Overview, 2025. https://www.semtech.com/lora [Accessed: May 29, 2025].
- da Silva Santos, A.; de Medeiros, V.W.C.; Gonçalves, G.E. Monitoring and classification of cattle behavior: a survey. Smart Agricultural Technology 2023, 3, 100091. [Google Scholar] [CrossRef]
- Shabani, I.; Biba, T.; Çiço, B. Design of a cattle-health-monitoring system using microservices and IoT devices. Computers 2022, 11. [Google Scholar] [CrossRef]
- Awasthi, A.; Awasthi, A.; Riordan, D.; Walsh, J. Non-invasive sensor technology for the development of a dairy cattle health monitoring system. Computers 2016, 5. [Google Scholar] [CrossRef]
- Arshad, J.; Siddiqui, T.A.; Sheikh, M.I.; Waseem, M.S.; Nawaz, M.A.B.; Eldin, E.T.; Rehman, A.U. Deployment of an intelligent and secure cattle health monitoring system. Egyptian Informatics Journal 2023, 24, 265–275. [Google Scholar] [CrossRef]
- Suresh, A.; Sarath, T.V. An IoT solution for cattle health monitoring. IOP Conference Series: Materials Science and Engineering 2019, 561, 012106. [Google Scholar] [CrossRef]
- Pillai, S.; Nazir, M.I.J. Cattle sense-a multisensory approach to optimize cattle well-being. In Proceedings of the 2024 Advances in Science and Engineering Technology International Conferences (ASET); 2024; pp. 1–5. [Google Scholar] [CrossRef]
- Smith, K.; Martinez, A.; Craddolph, R.; Erickson, H.; Andresen, D.; Warren, S. An integrated cattle health monitoring system. In Proceedings of the 2006 International Conference of the IEEE Engineering in Medicine and Biology Society; 2006; pp. 4659–4662. [Google Scholar] [CrossRef]
- Swain, K.B.; Mahato, S.; Patro, M.; Pattnayak, S.K. Cattle health monitoring system using Arduino and LabVIEW for early detection of diseases. In Proceedings of the 2017 Third International Conference on Sensing, Signal Processing and Security (ICSSS); 2017; pp. 79–82. [Google Scholar] [CrossRef]
- Unold, O.; Nikodem, M.; Piasecki, M.; Szyc, K.; Maciejewski, H.; Bawiec, M.; Dobrowolski, P.; Zdunek, M. IoT-based cow health monitoring system. In Proceedings of the Computational Science – ICCS 2020; Krzhizhanovskaya, V.V.; Závodszky, G.; Lees, M.H.; Dongarra, J.J.; Sloot, P.M.A.; Brissos, S.; Teixeira, J., Eds., Cham, 2020; pp. 344–356. [CrossRef]
- Sharma, B.; Koundal, D. Cattle health monitoring system using wireless sensor network: a survey from innovation perspective. IET Wireless Sensor Systems 2018, 8, 143–151. [Google Scholar] [CrossRef]
- Lasagni, G.; Badii, M.; Collodi, G.; Righini, M.; Cidronali, A. GEO satellite Internet of Things node architecture for agrifood supply chain traceability. In Proceedings of the 2024 IEEE International Workshop on Metrology for Industry 4.0 & IoT (MetroInd4.0 & IoT), 2024, pp. 568–573. [CrossRef]
- Onu, P.; Mbohwa, C.; Pradhan, A. Blockchain-powered traceability solutions: pioneering transparency to eradicate counterfeit products and revolutionize supply chain integrity. Procedia Computer Science 2024, 232, 1420–1427. [Google Scholar] [CrossRef]
- García, L.; Cancimance, C.; Asorey-Cacheda, R.; Zúñiga-Cañón, C.L.; Garcia-Sanchez, A.J.; Garcia-Haro, J. Lightweight blockchain for data integrity and traceability in IoT networks. IEEE Access 2025, 13, 81105–81117. [Google Scholar] [CrossRef]
- Schieltz, J.M.; Okanga, S.; Allan, B.F.; Rubenstein, D.I. GPS tracking cattle as a monitoring tool for conservation and management. African Journal of Range & Forage Science 2017, 34, 173–177. [Google Scholar] [CrossRef]
- Turner, L.W.; Udal, M.C.; Larson, B.T.; Shearer, S.A. Monitoring cattle behavior and pasture use with GPS and GIS. Canadian Journal of Animal Science 2000, 80, 405–413. [Google Scholar] [CrossRef]
- Bailey, D.W.; Trotter, M.G.; Knight, C.W.; Thomas, M.G. Use of GPS tracking collars and accelerometers for rangeland livestock production research. Translational Animal Science 2018, 2, 81–88. [Google Scholar] [CrossRef]
- Rivero, M.J.; Grau-Campanario, P.; Mullan, S.; Held, S.D.E.; Stokes, J.E.; Lee, M.R.F.; Cardenas, L.M. Factors affecting site use preference of grazing cattle studied from 2000 to 2020 through GPS tracking: a review. Sensors 2021, 21. [Google Scholar] [CrossRef]
- Hassan-Vásquez, J.A.; Maroto-Molina, F.; Guerrero-Ginel, J.E. GPS tracking to monitor the spatiotemporal dynamics of cattle behavior and their relationship with feces distribution. Animals 2022, 12. [Google Scholar] [CrossRef]
- Polsky, L.B.; Madureira, A.M.L.; Filho, E.L.D.; Soriano, S.; Sica, A.F.; Vasconcelos, J.L.M.; Cerri, R.L.A. Association between ambient temperature and humidity, vaginal temperature, and automatic activity monitoring on induced estrus in lactating cows. Journal of Dairy Science 2017, 100, 8590–8601. [Google Scholar] [CrossRef]
- Tucker, C.B.; Rogers, A.R.; Schütz, K.E. Effect of solar radiation on dairy cattle behaviour, use of shade and body temperature in a pasture-based system. Applied Animal Behaviour Science 2008, 109, 141–154. [Google Scholar] [CrossRef]
- Martinez, B.; Montón, M.; Vilajosana, I.; Prades, J.D. The power of models: modeling power consumption for IoT devices. IEEE Sensors Journal 2015, 15, 5777–5789. [Google Scholar] [CrossRef]
- Giannetti, G. IoTnodeWithGEOconnectivity, 2025. https://github.com/Gianne97/IoTnodeWithGEOconnectivity/ [Accessed: Mar. 27, 2025].
- EchoStar Mobile Ltd.. EM2050-EVK, 2025. https://echostarmobile.com/product/em2050-evk-evaluation-kit/ [Accessed: Mar. 27, 2025].
- Amazon Web Services, Inc.. Amazon Web Services, 2025. https://aws.amazon.com/ [Accessed: Mar. 27, 2025].
- Amazon Web Services, Inc. Boto3 documentation, 2025. https://boto3.amazonaws.com/v1/documentation/api/latest/index.html [Accessed: June 16, 2025].
- Farhad, A.; Kim, D.H.; Subedi, S.; Pyun, J.Y. Enhanced LoRaWAN adaptive data rate for mobile internet of things devices. Sensors 2020, 20. [Google Scholar] [CrossRef]
- Krupka, J. Frequency domain complex permittivity measurements at microwave frequencies. Measurement Science and Technology 2006, 17, R55. [Google Scholar] [CrossRef]
- ANSYS, Inc.. Ansys, 2025. https://www.ansys.com/ [Accessed: Mar. 27, 2025].
- Santos, C.; Jiménez, J.A.; Espinosa, F. Effect of event-based sensing on IoT node power efficiency. Case study: air quality monitoring in smart cities. IEEE Access 2019, 7, 132577–132586. [Google Scholar] [CrossRef]
Figure 1.
High-level block diagram of the GEO satellite tracking.
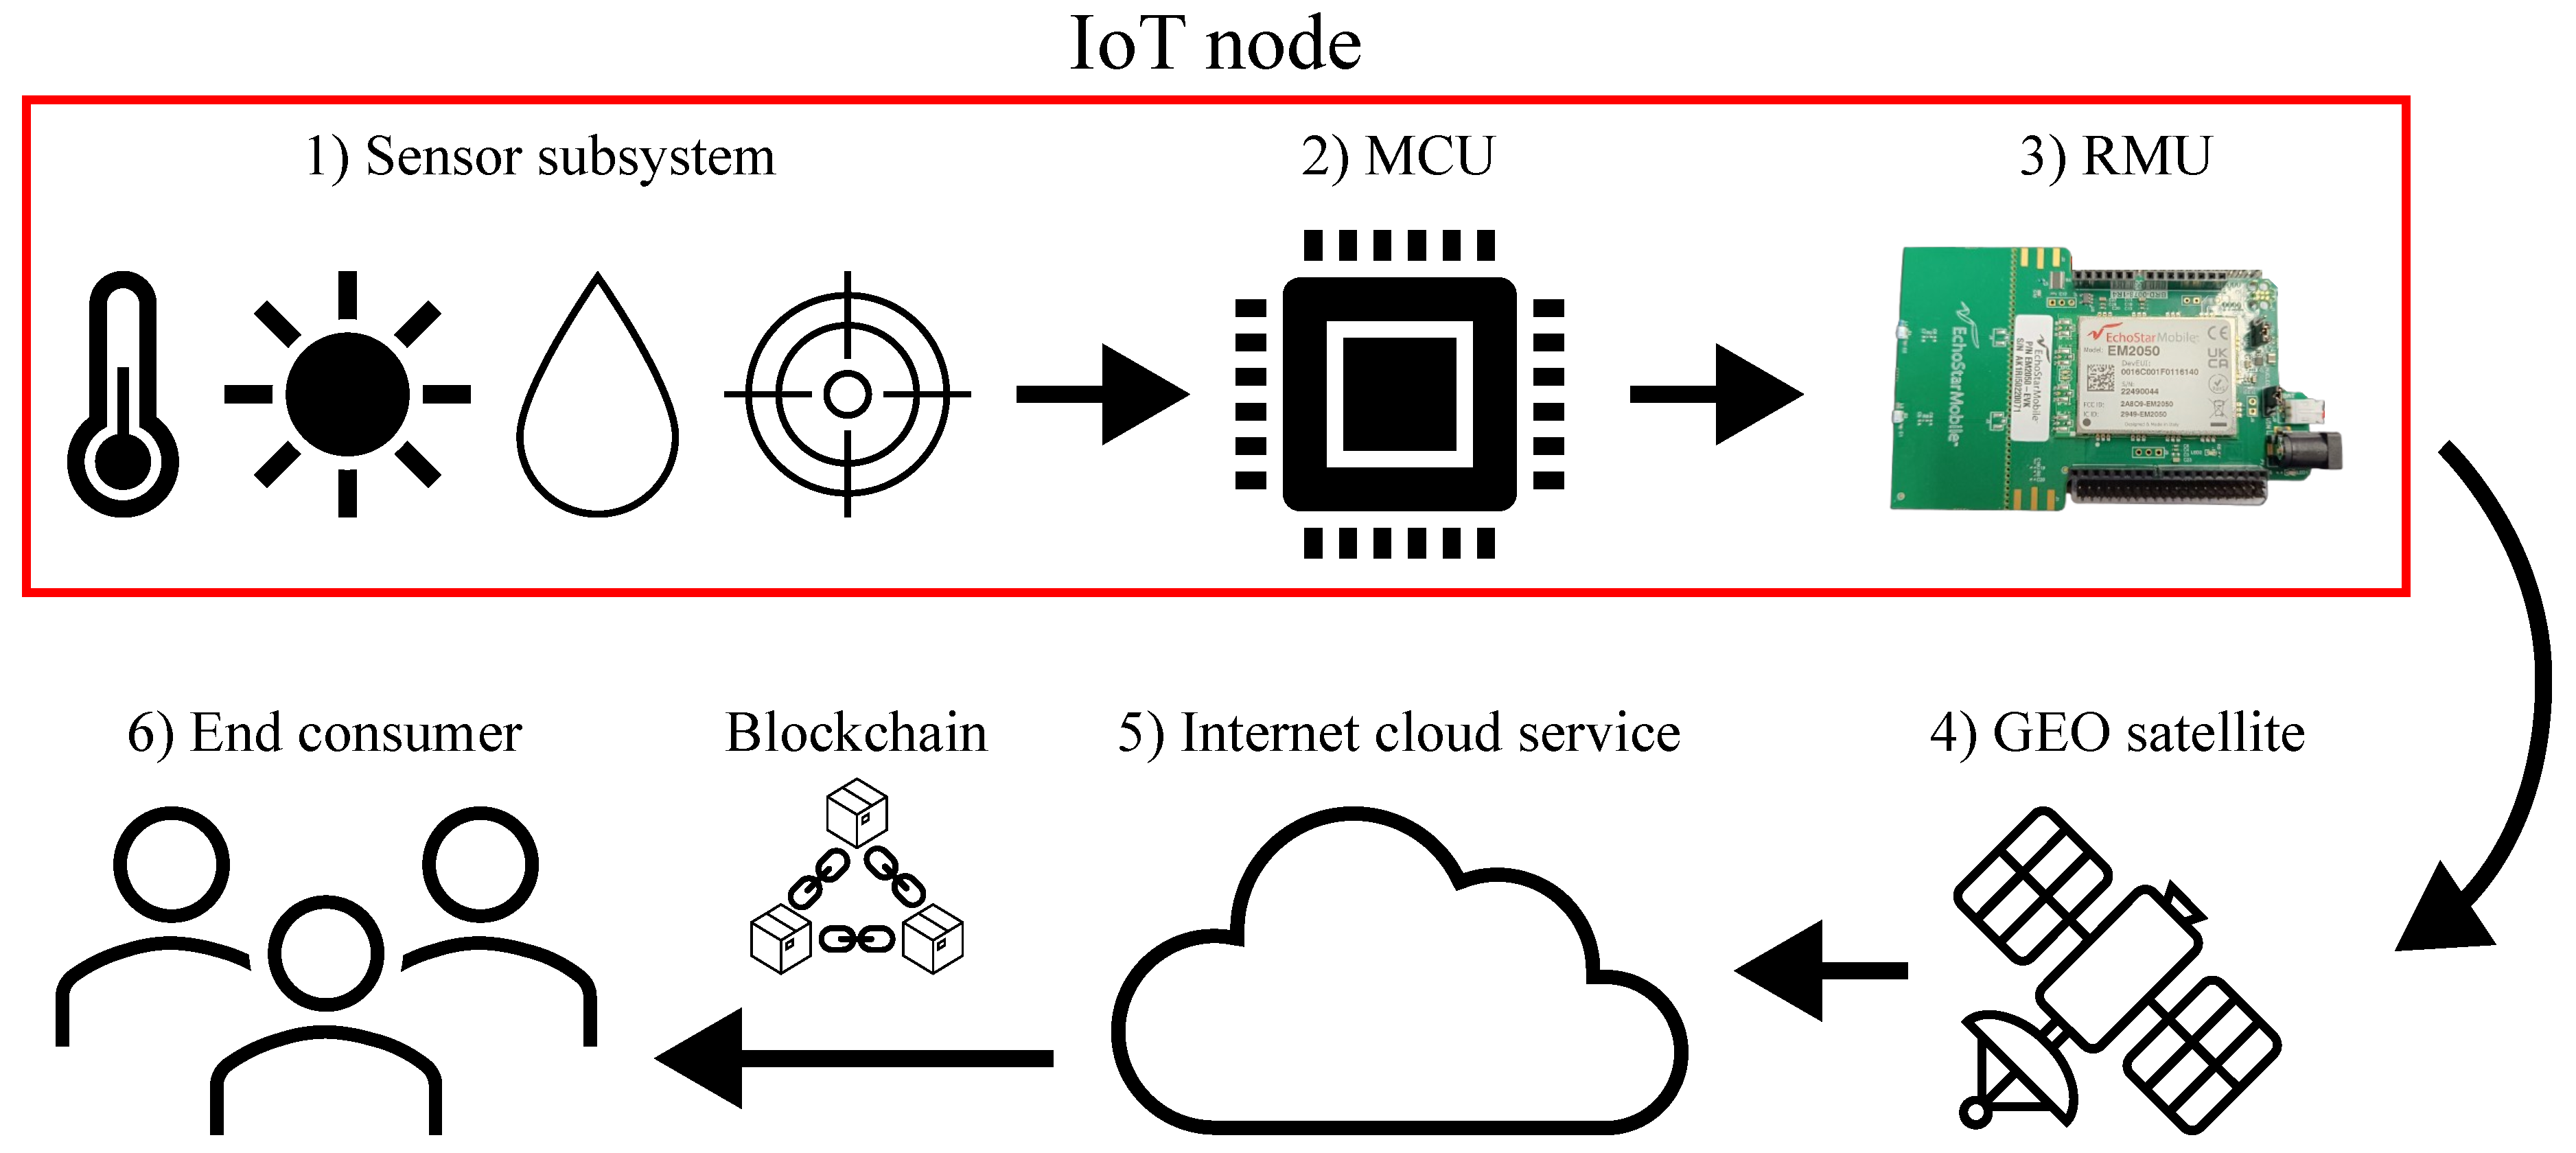
Figure 2.
Circuit schematics: (a) sensor for solar radiation ( and ); (b) current sensor (, , , and ).
Figure 2.
Circuit schematics: (a) sensor for solar radiation ( and ); (b) current sensor (, , , and ).
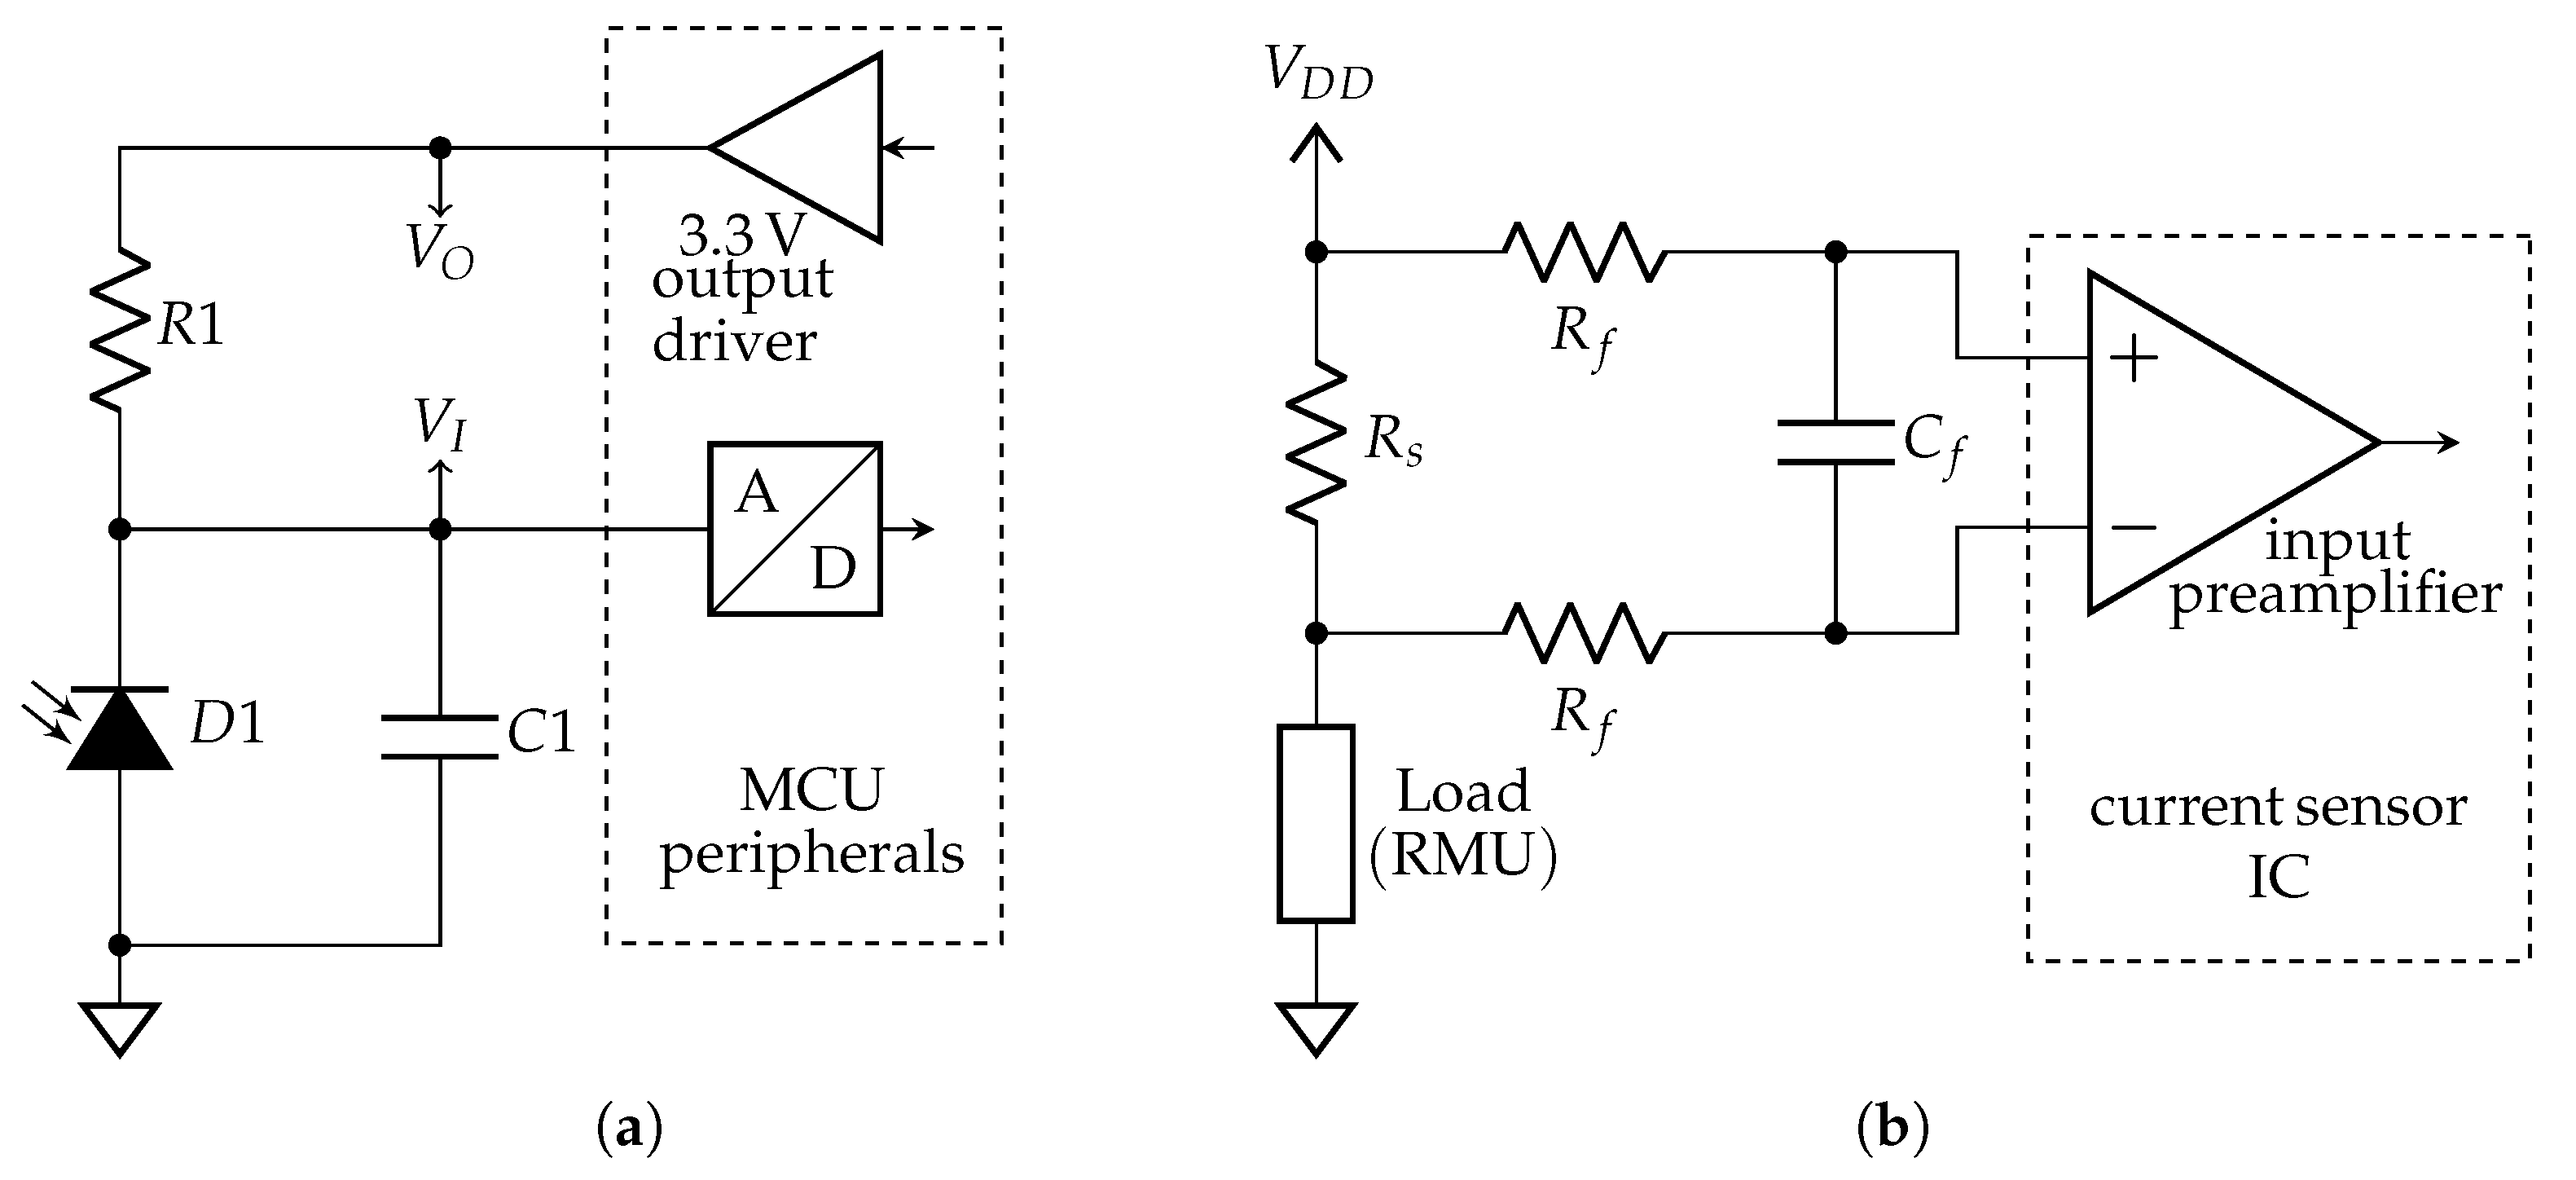
Figure 3.
Block diagram of the IoT node. The arrows indicate the data flow direction.
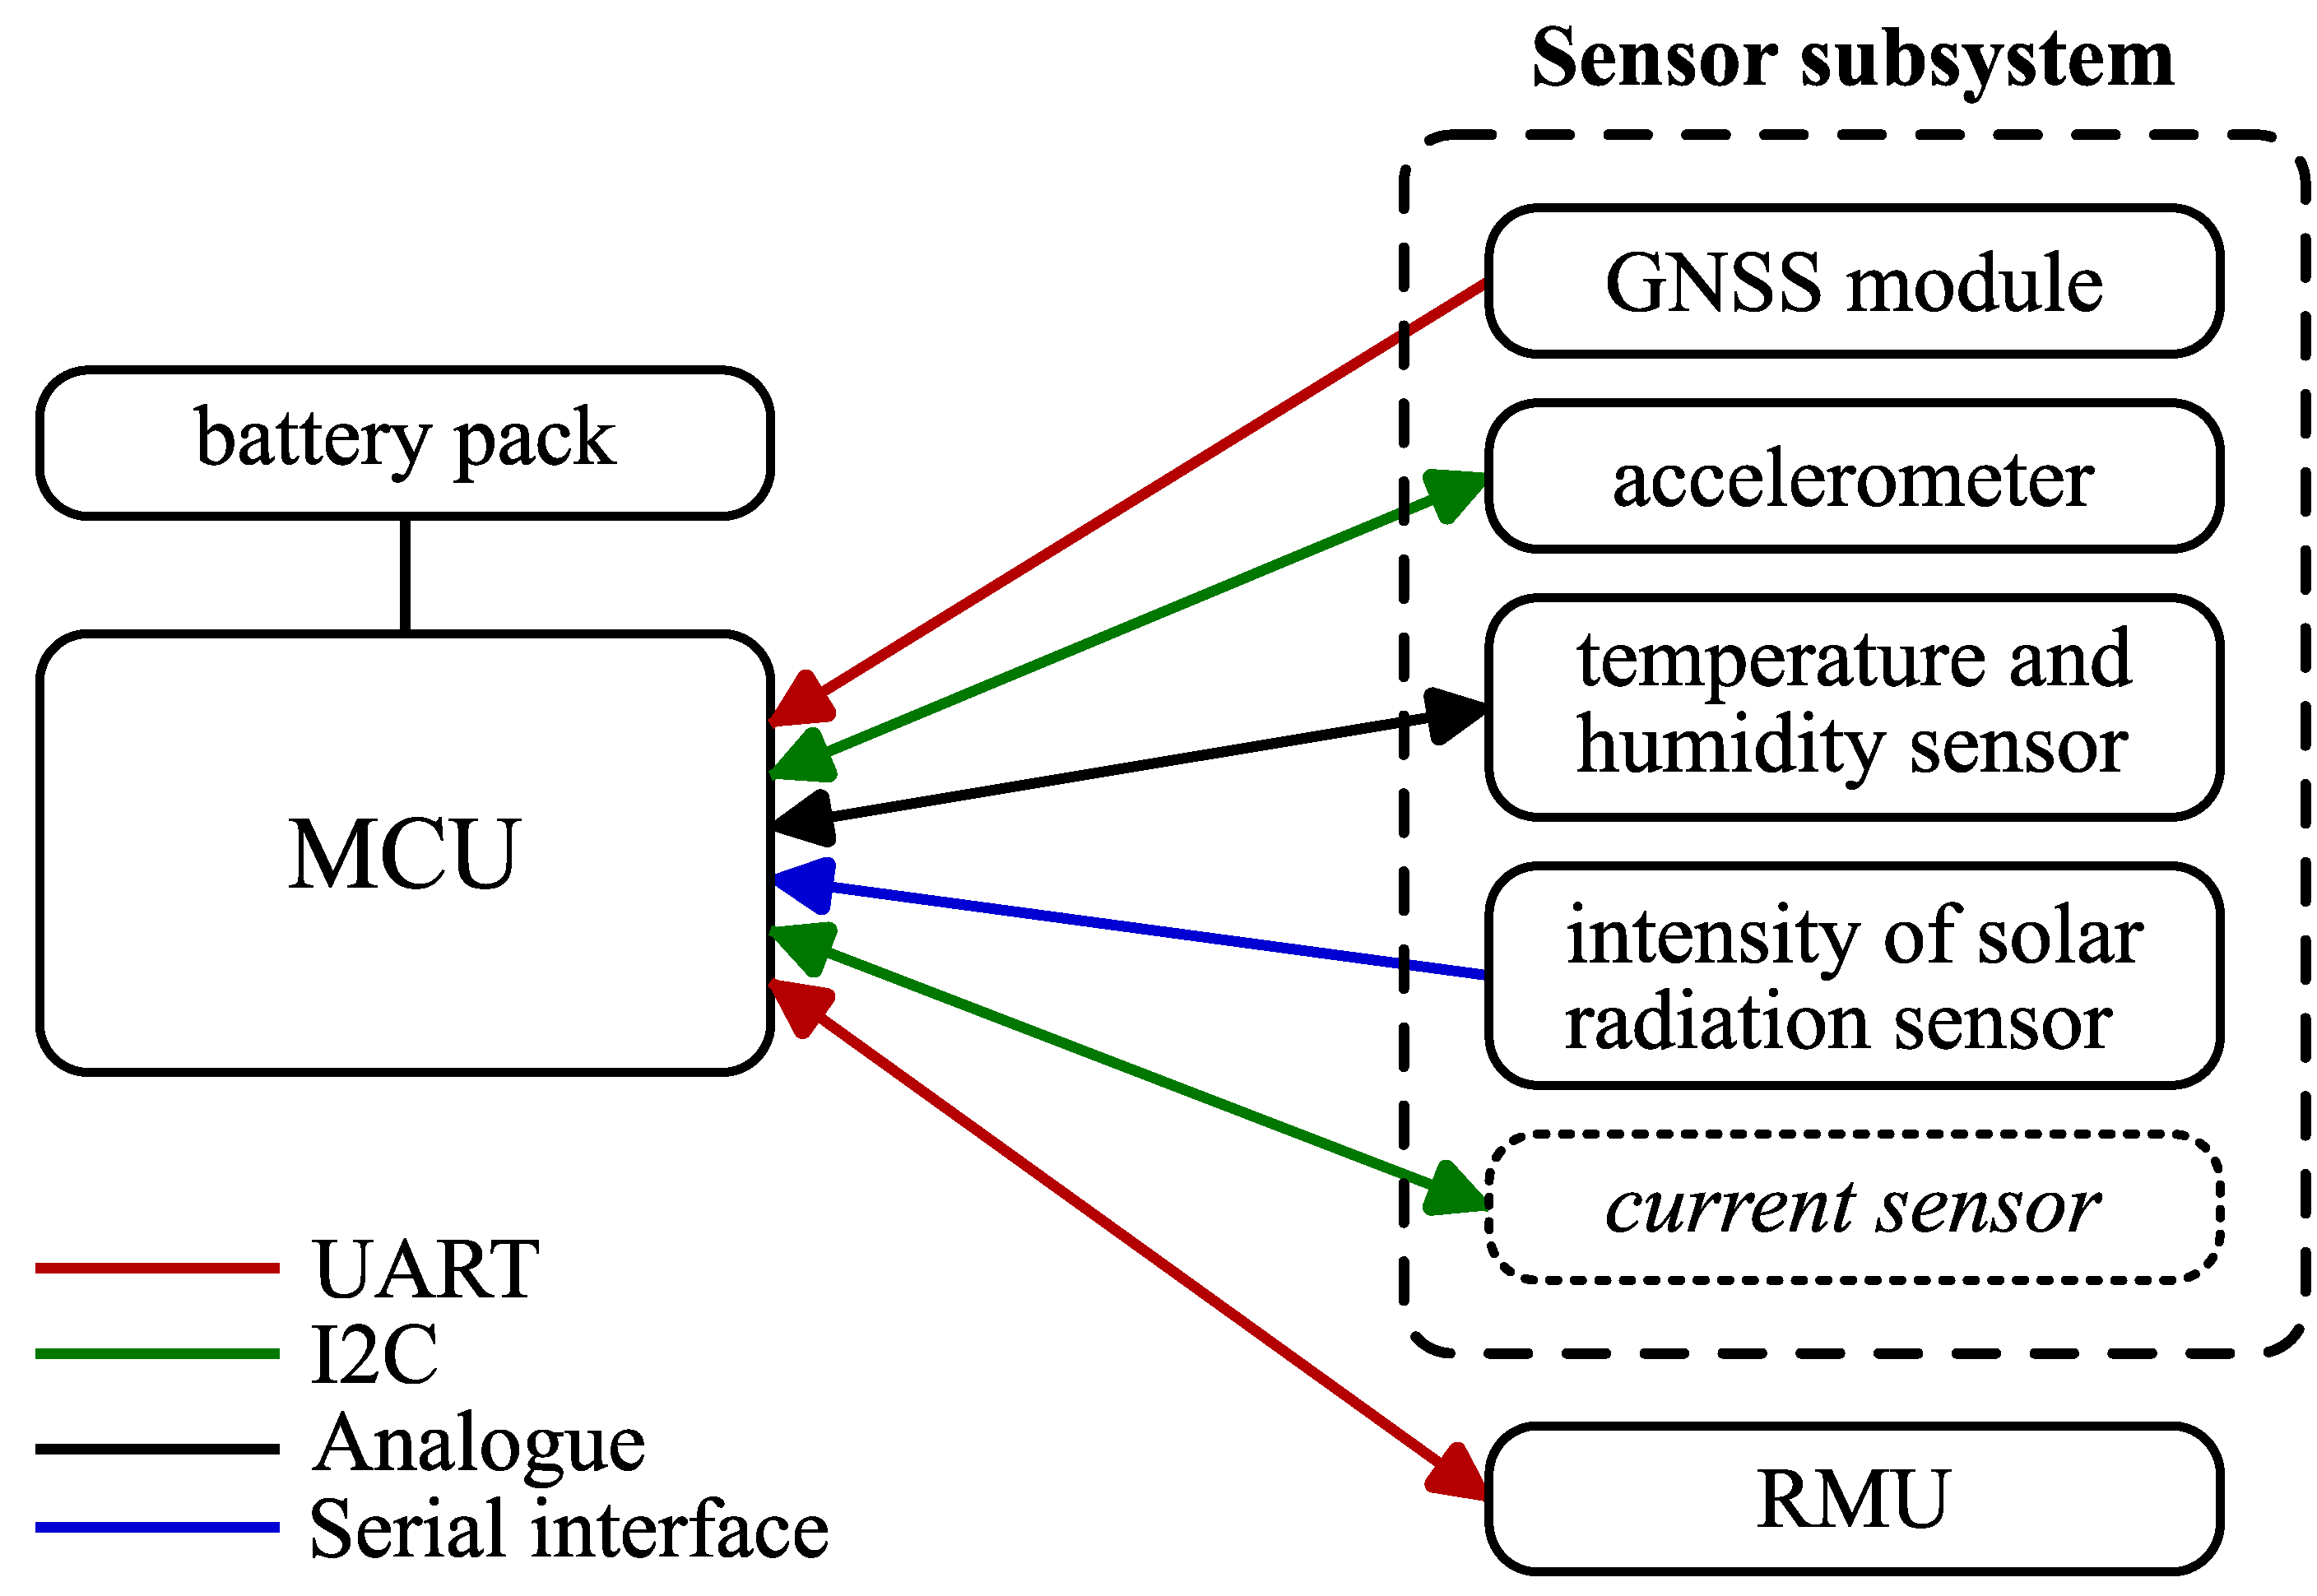
Figure 4.
Qualitative supply current waveform for the RMU. The waveform is not in scale and is only indicative, to better understand the defined time and current quantities.
Figure 4.
Qualitative supply current waveform for the RMU. The waveform is not in scale and is only indicative, to better understand the defined time and current quantities.
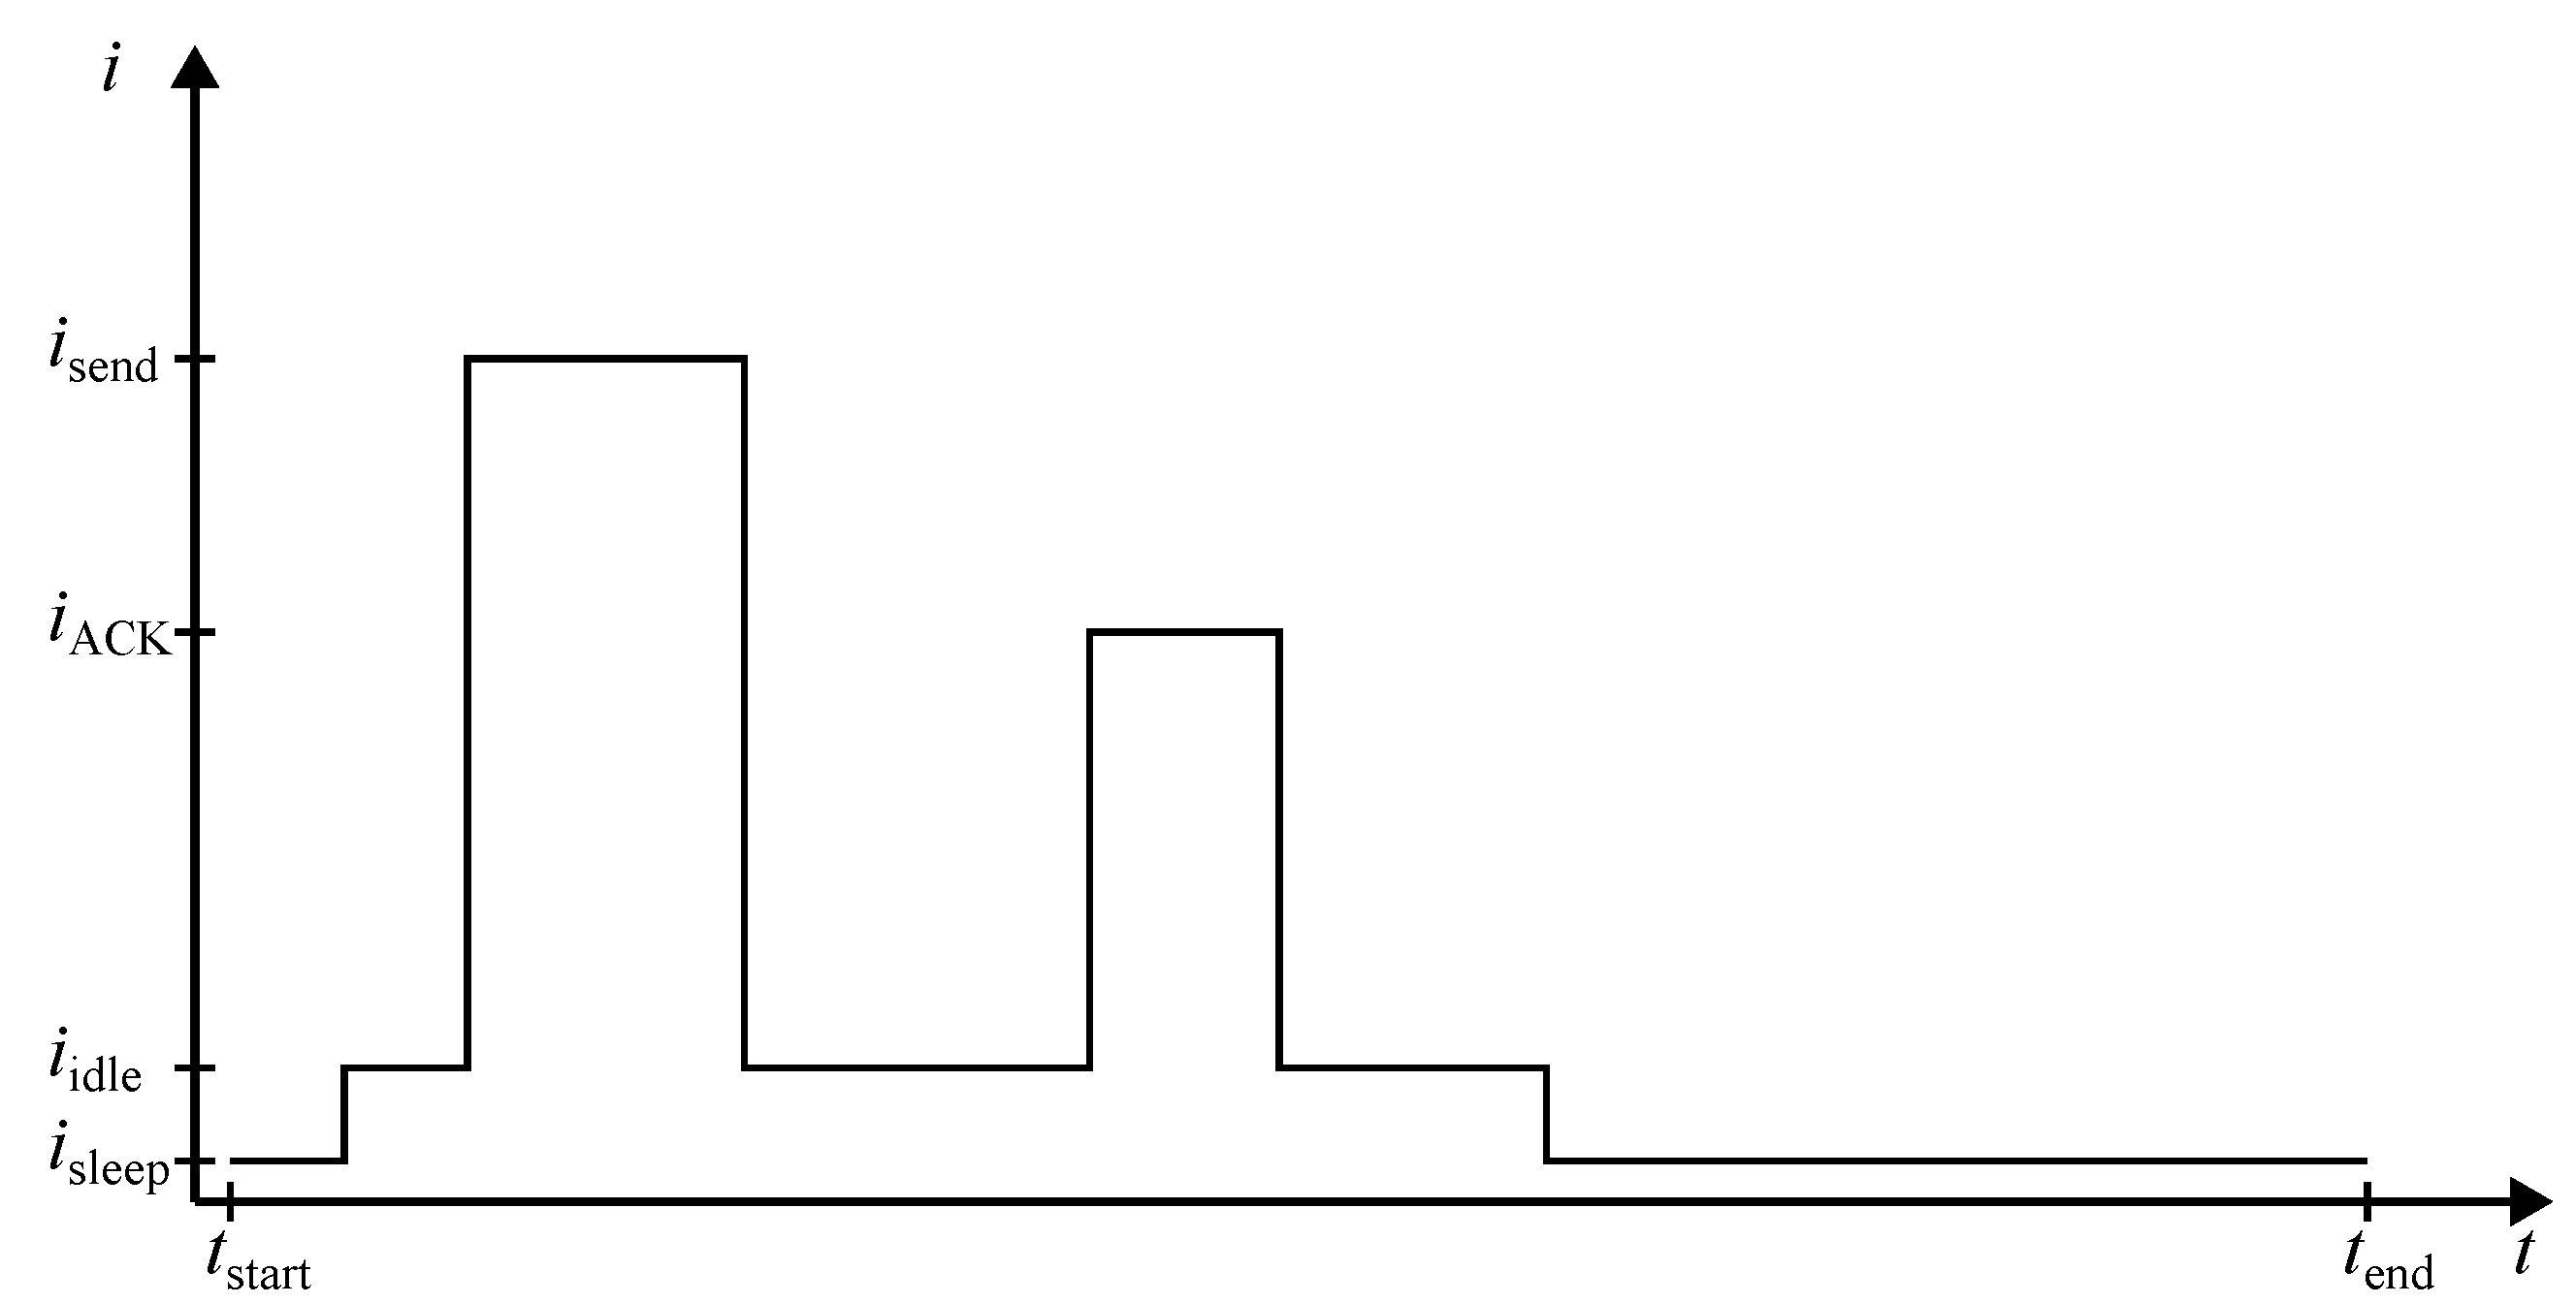
Figure 5.
IoT prototype showing the inside arrangement of the sensors, the RMU and the general purpose MCU unit (b) open. Size are: 108 x 110 x 320.
Figure 5.
IoT prototype showing the inside arrangement of the sensors, the RMU and the general purpose MCU unit (b) open. Size are: 108 x 110 x 320.
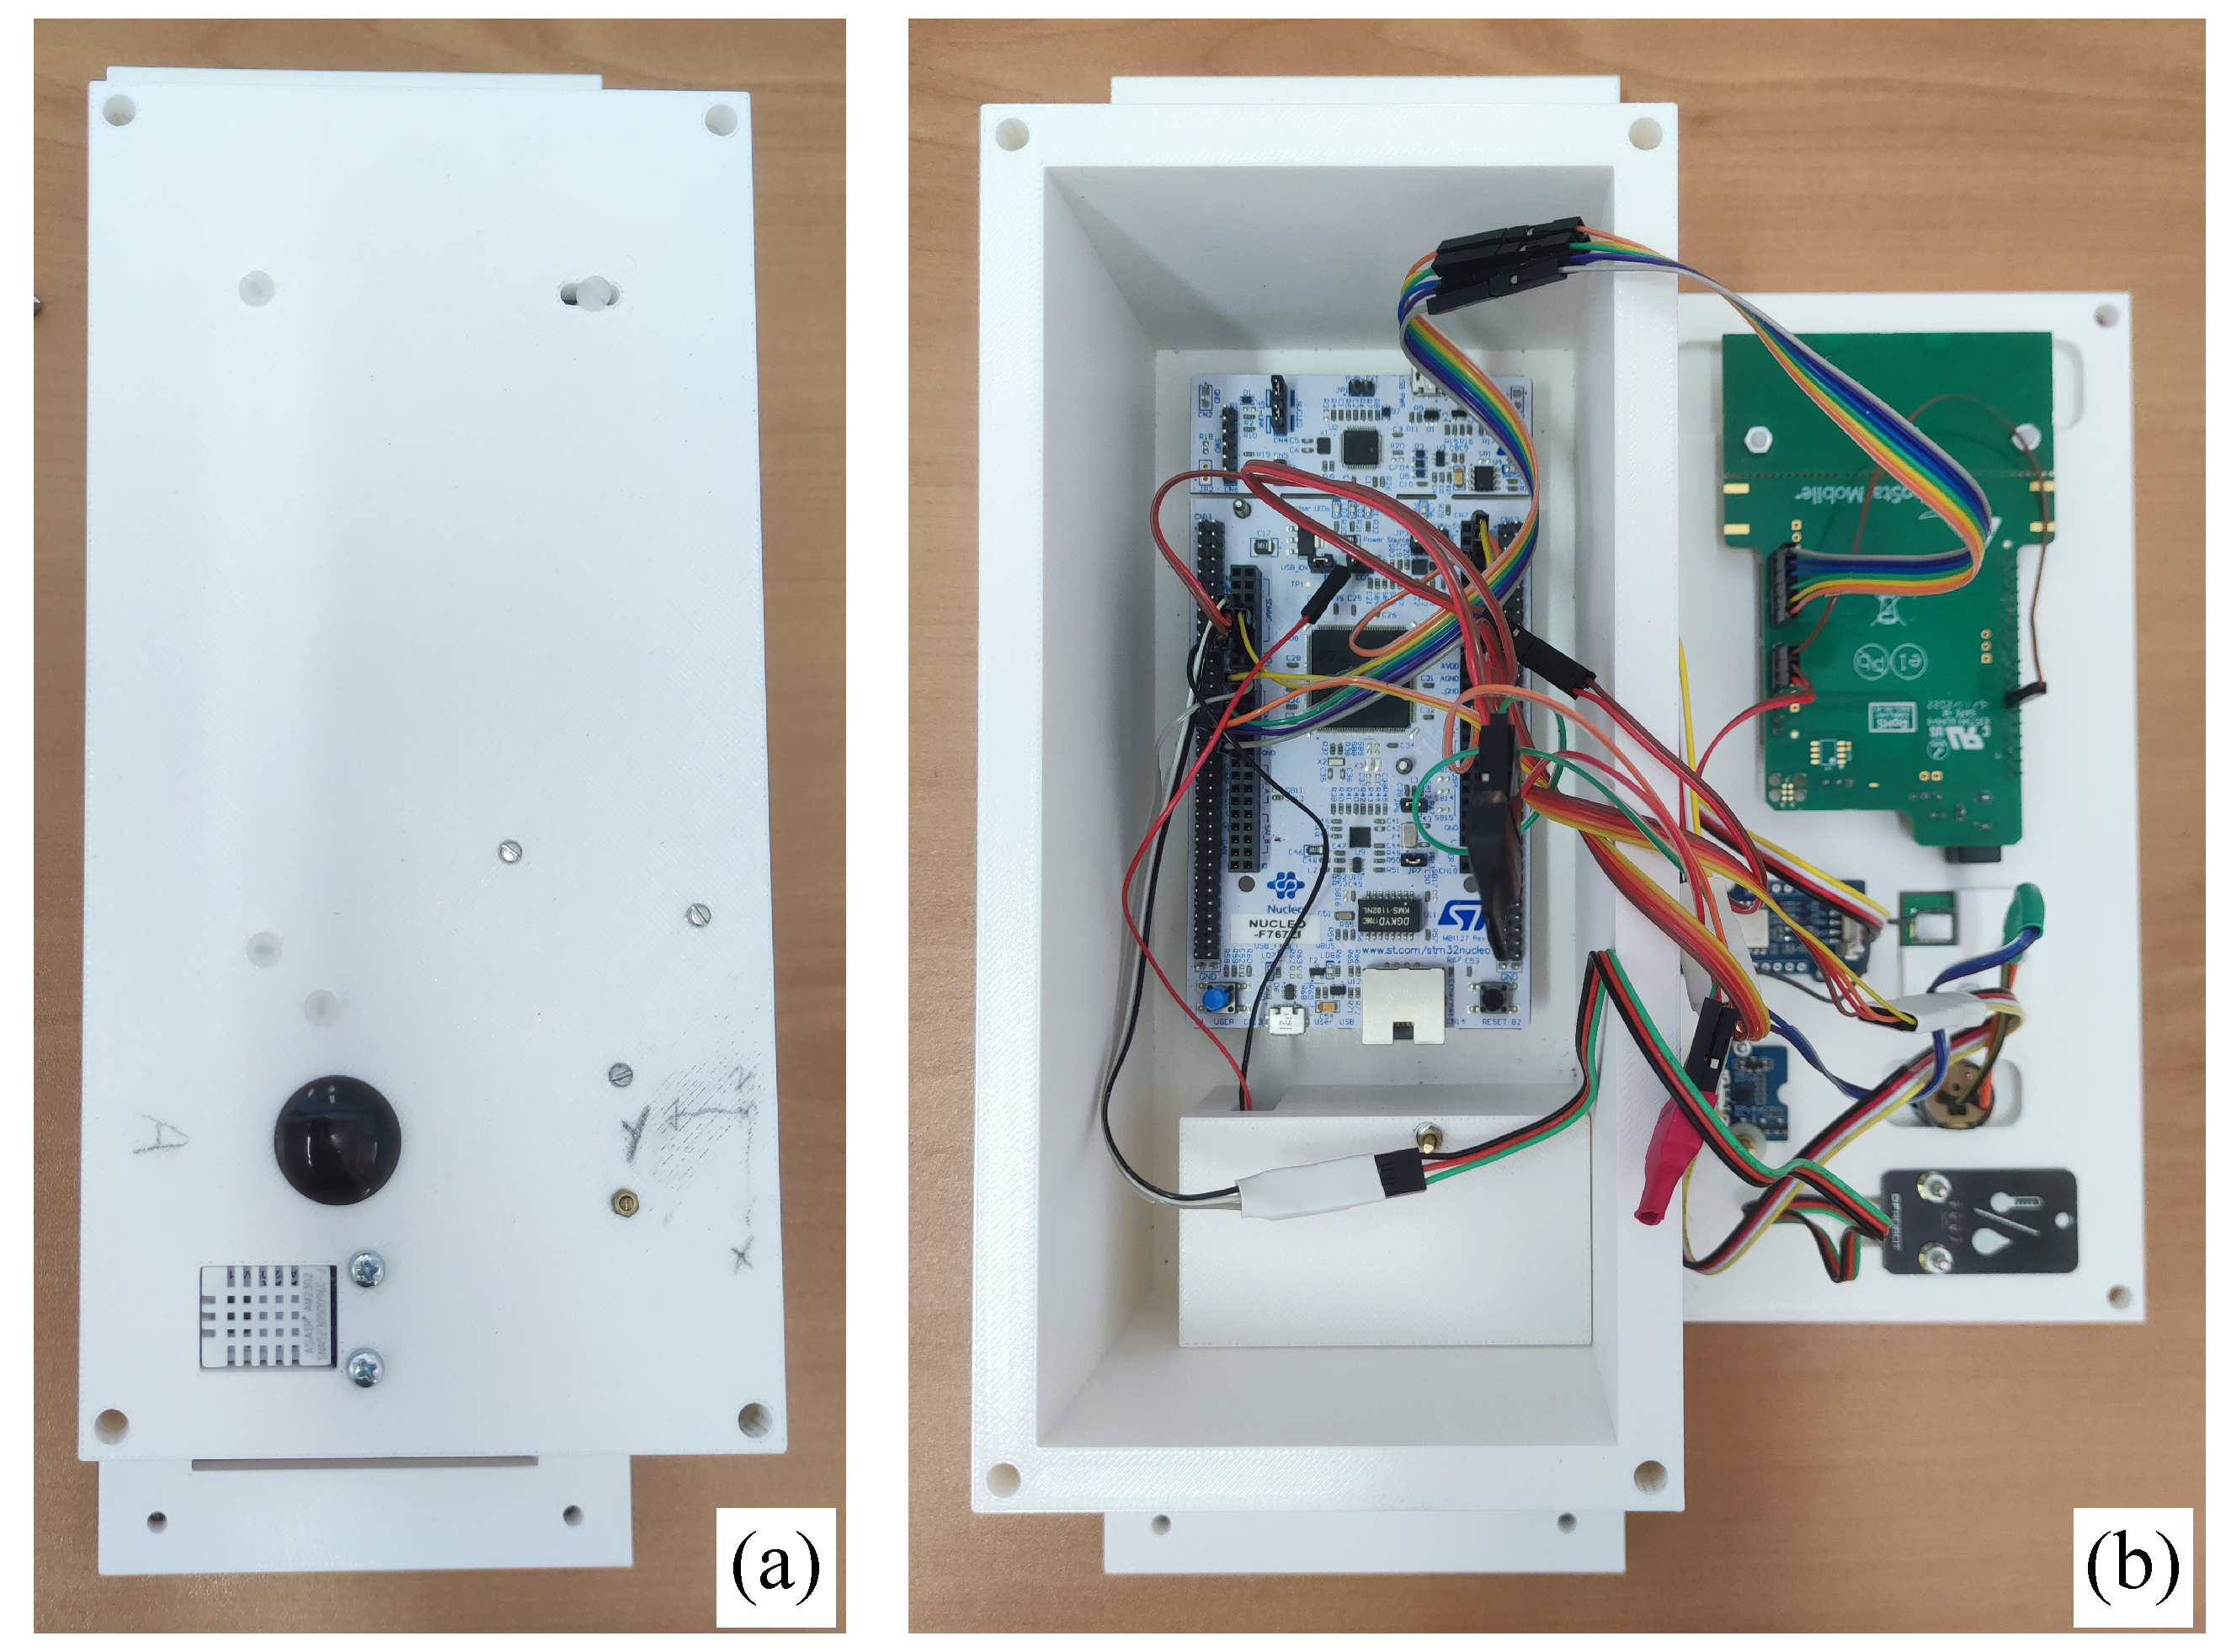
Figure 6.
CAD model of the Tx (at negative x) and Rx (at positive x) antennas mounted on a PCB and CAD model of the box.
Figure 6.
CAD model of the Tx (at negative x) and Rx (at positive x) antennas mounted on a PCB and CAD model of the box.
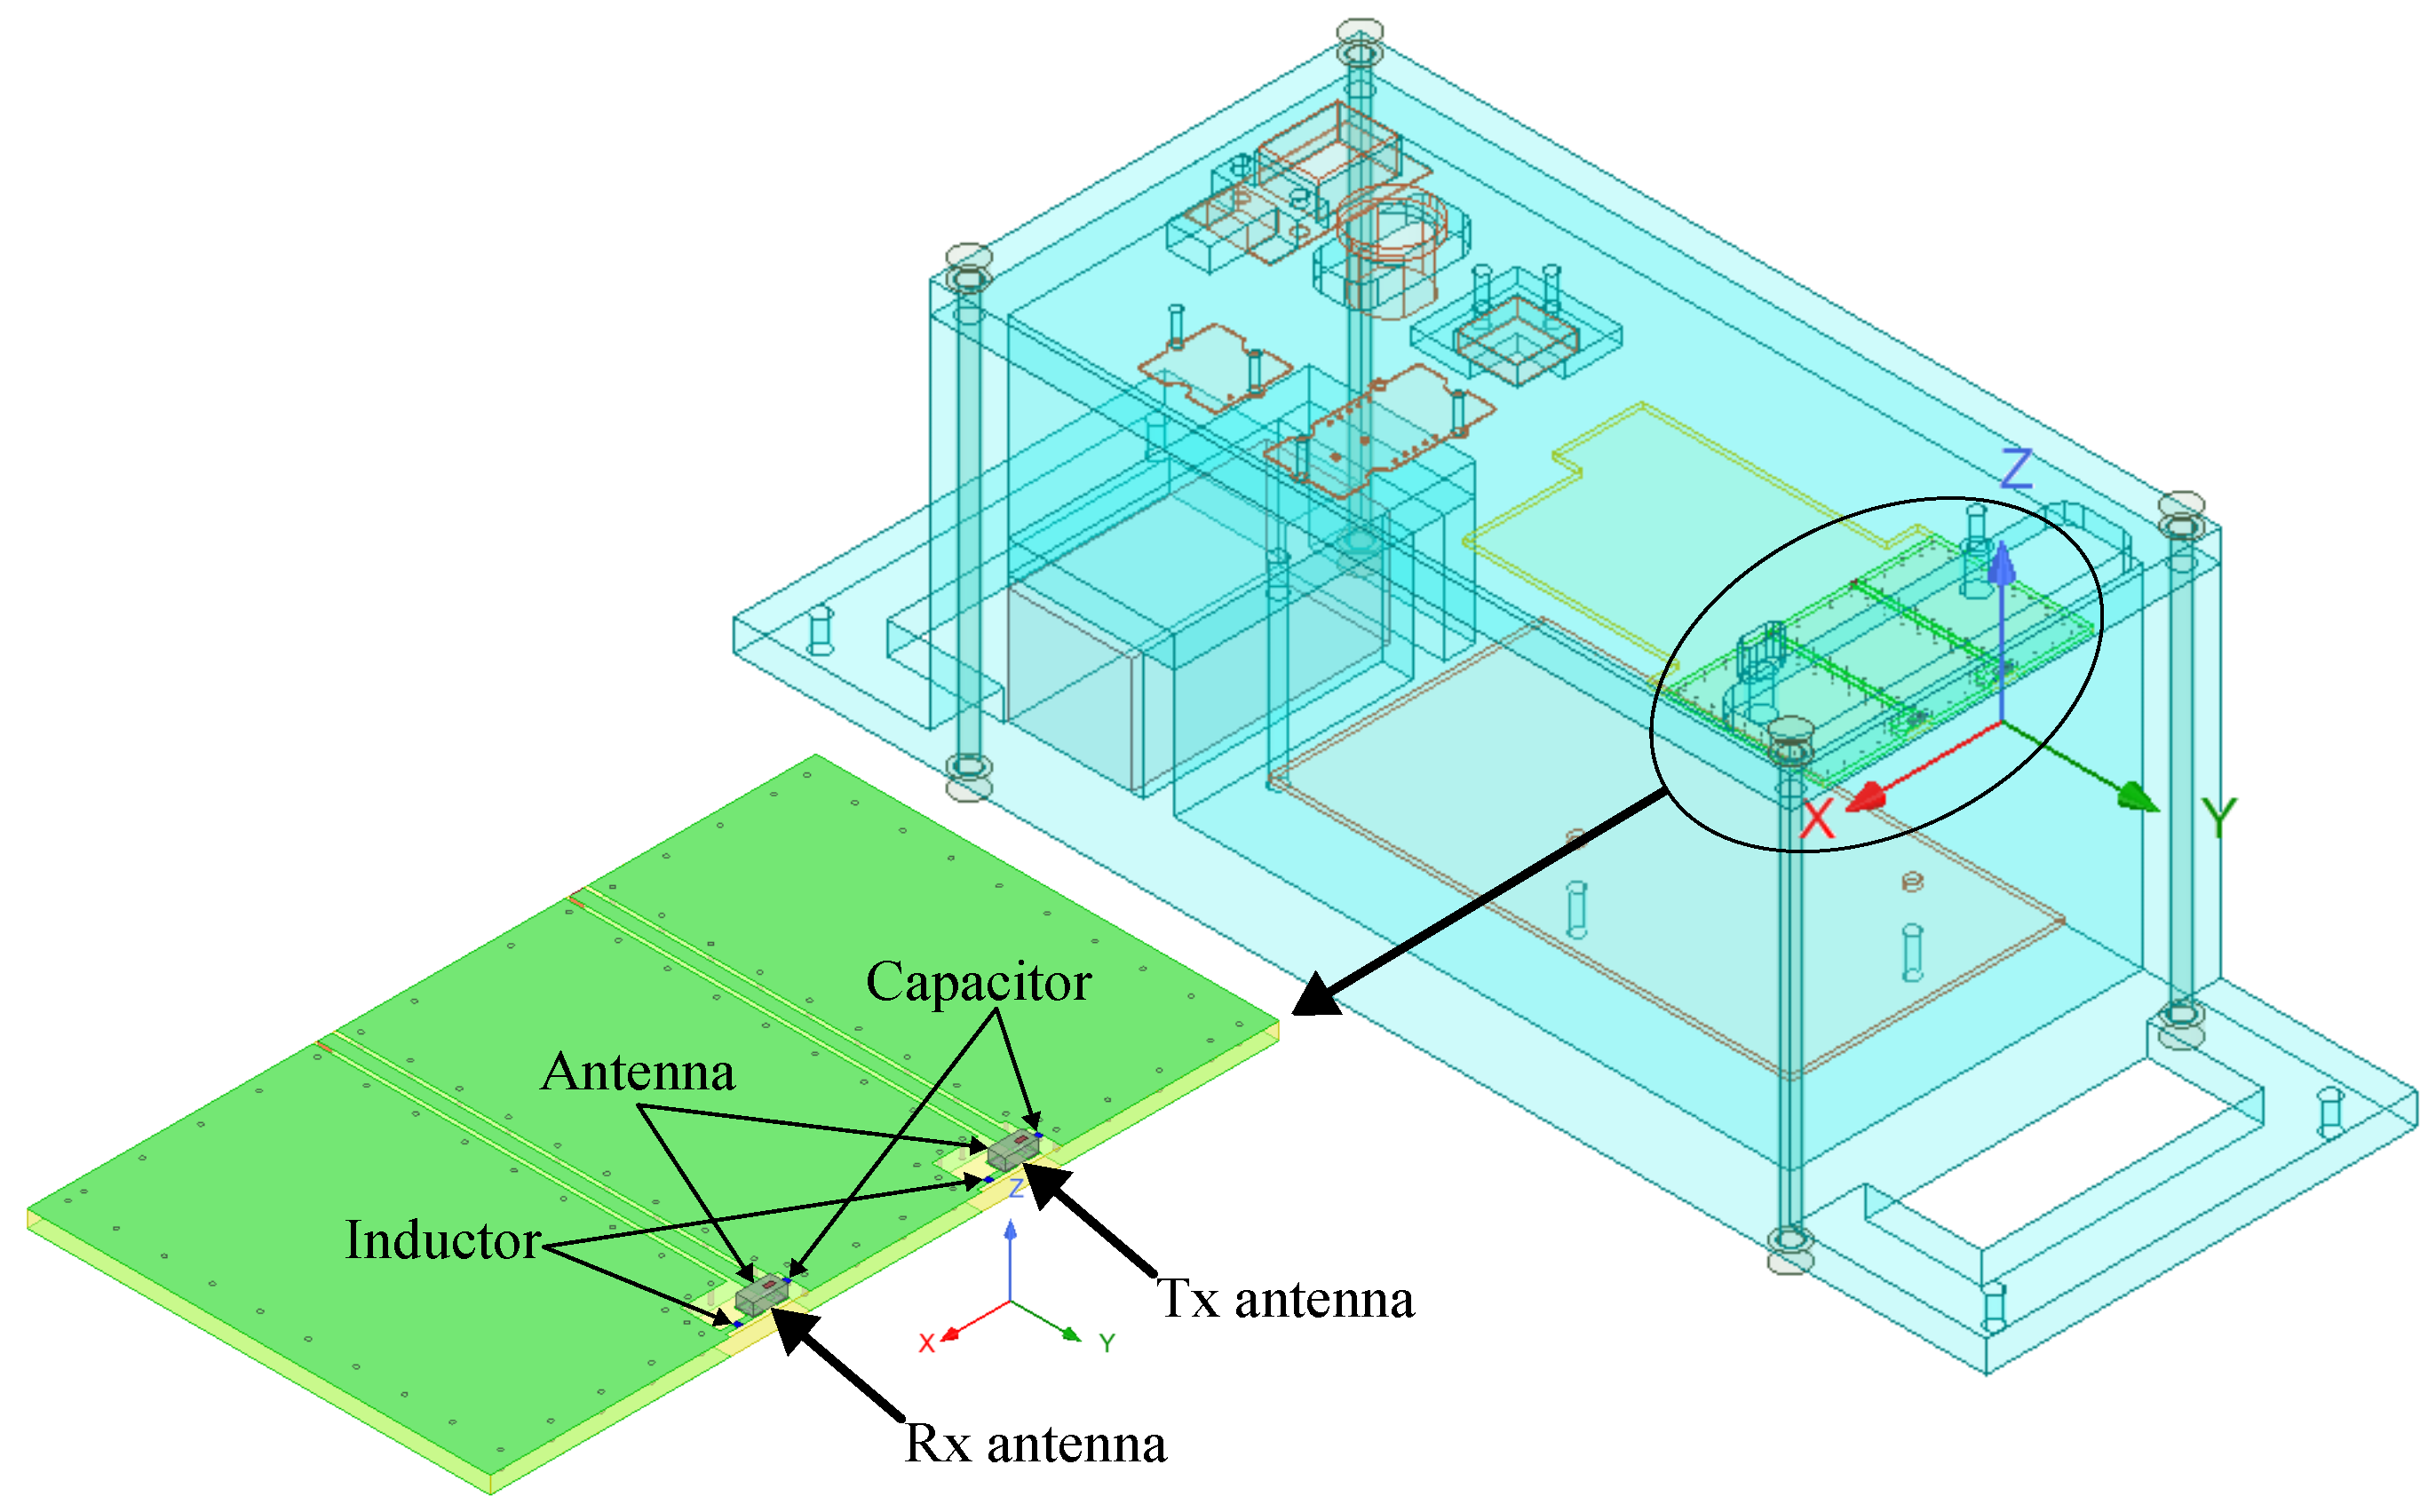
Figure 7.
Anechoic setup for EIRP measurement.
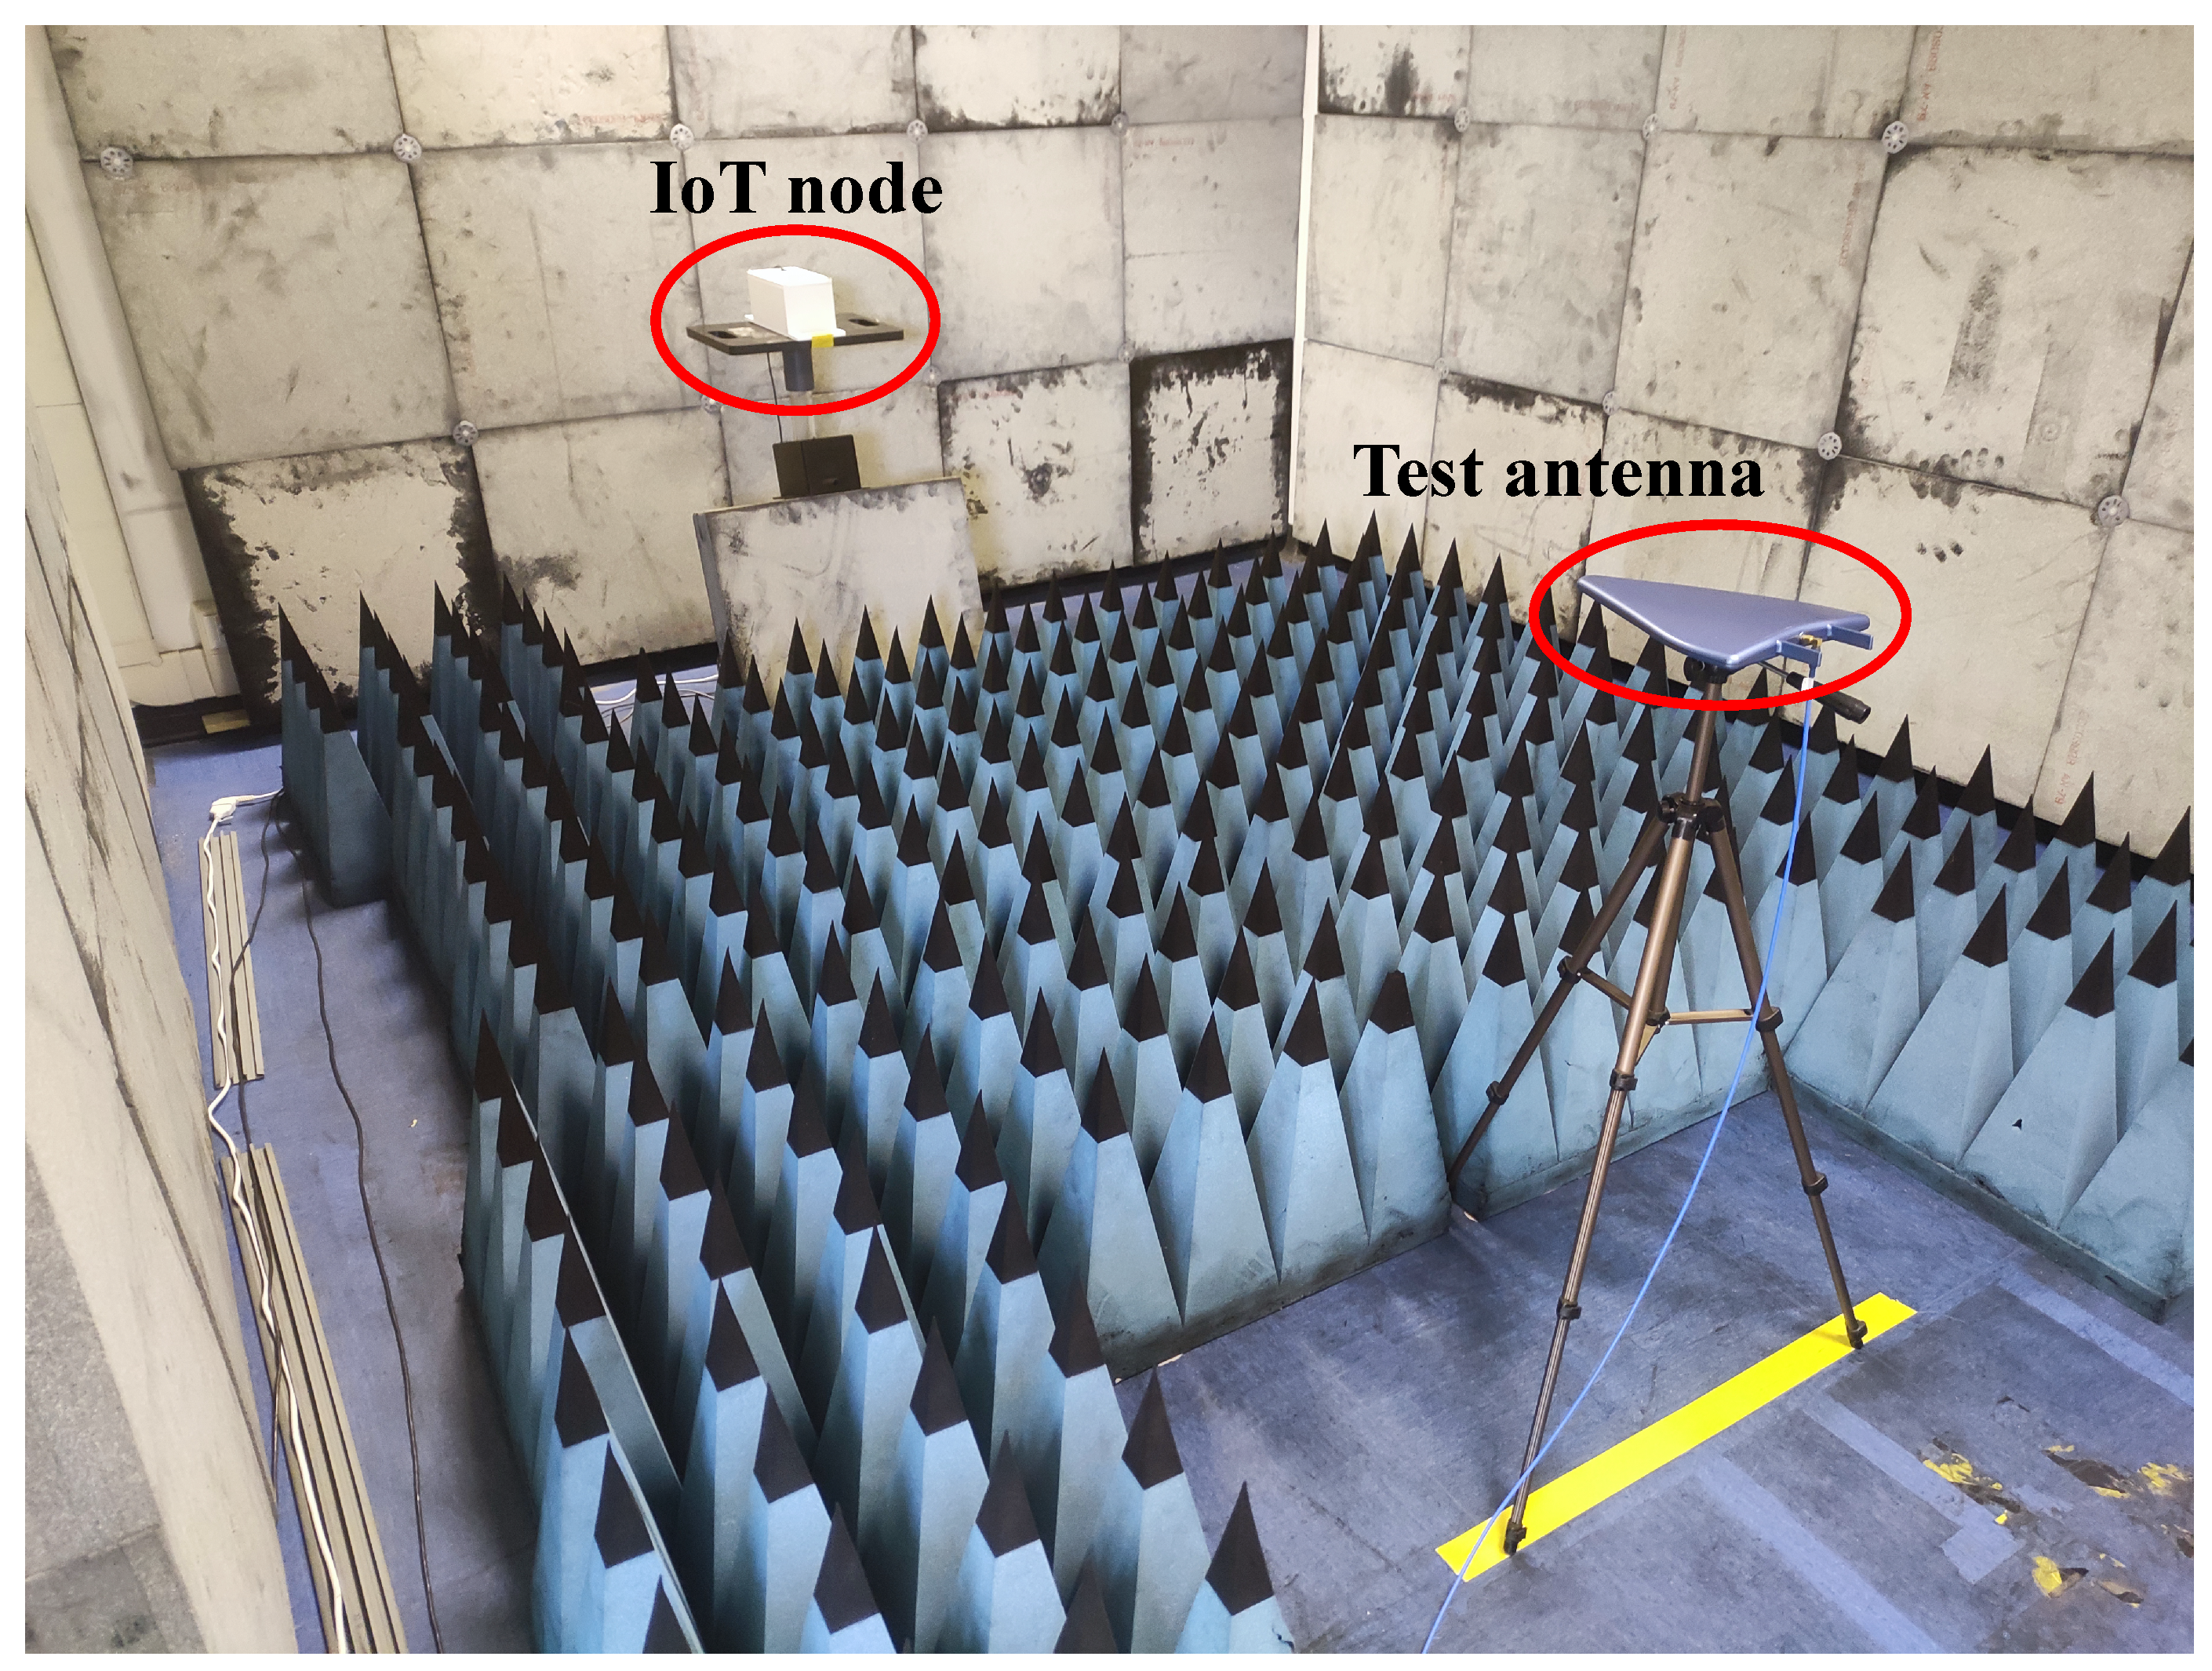
Figure 8.
Tx antenna at GHz: (a) simulated realized gain in dBi for the polarization along ; (b) EIRP in dBm on for the polarization along (E-plane); (c) EIRP in dBm on for the polarization along (H-plane); (d) EIRP in dBm on for the polarization along . For the EIRP, the continuous wave input power is 27 dBm.
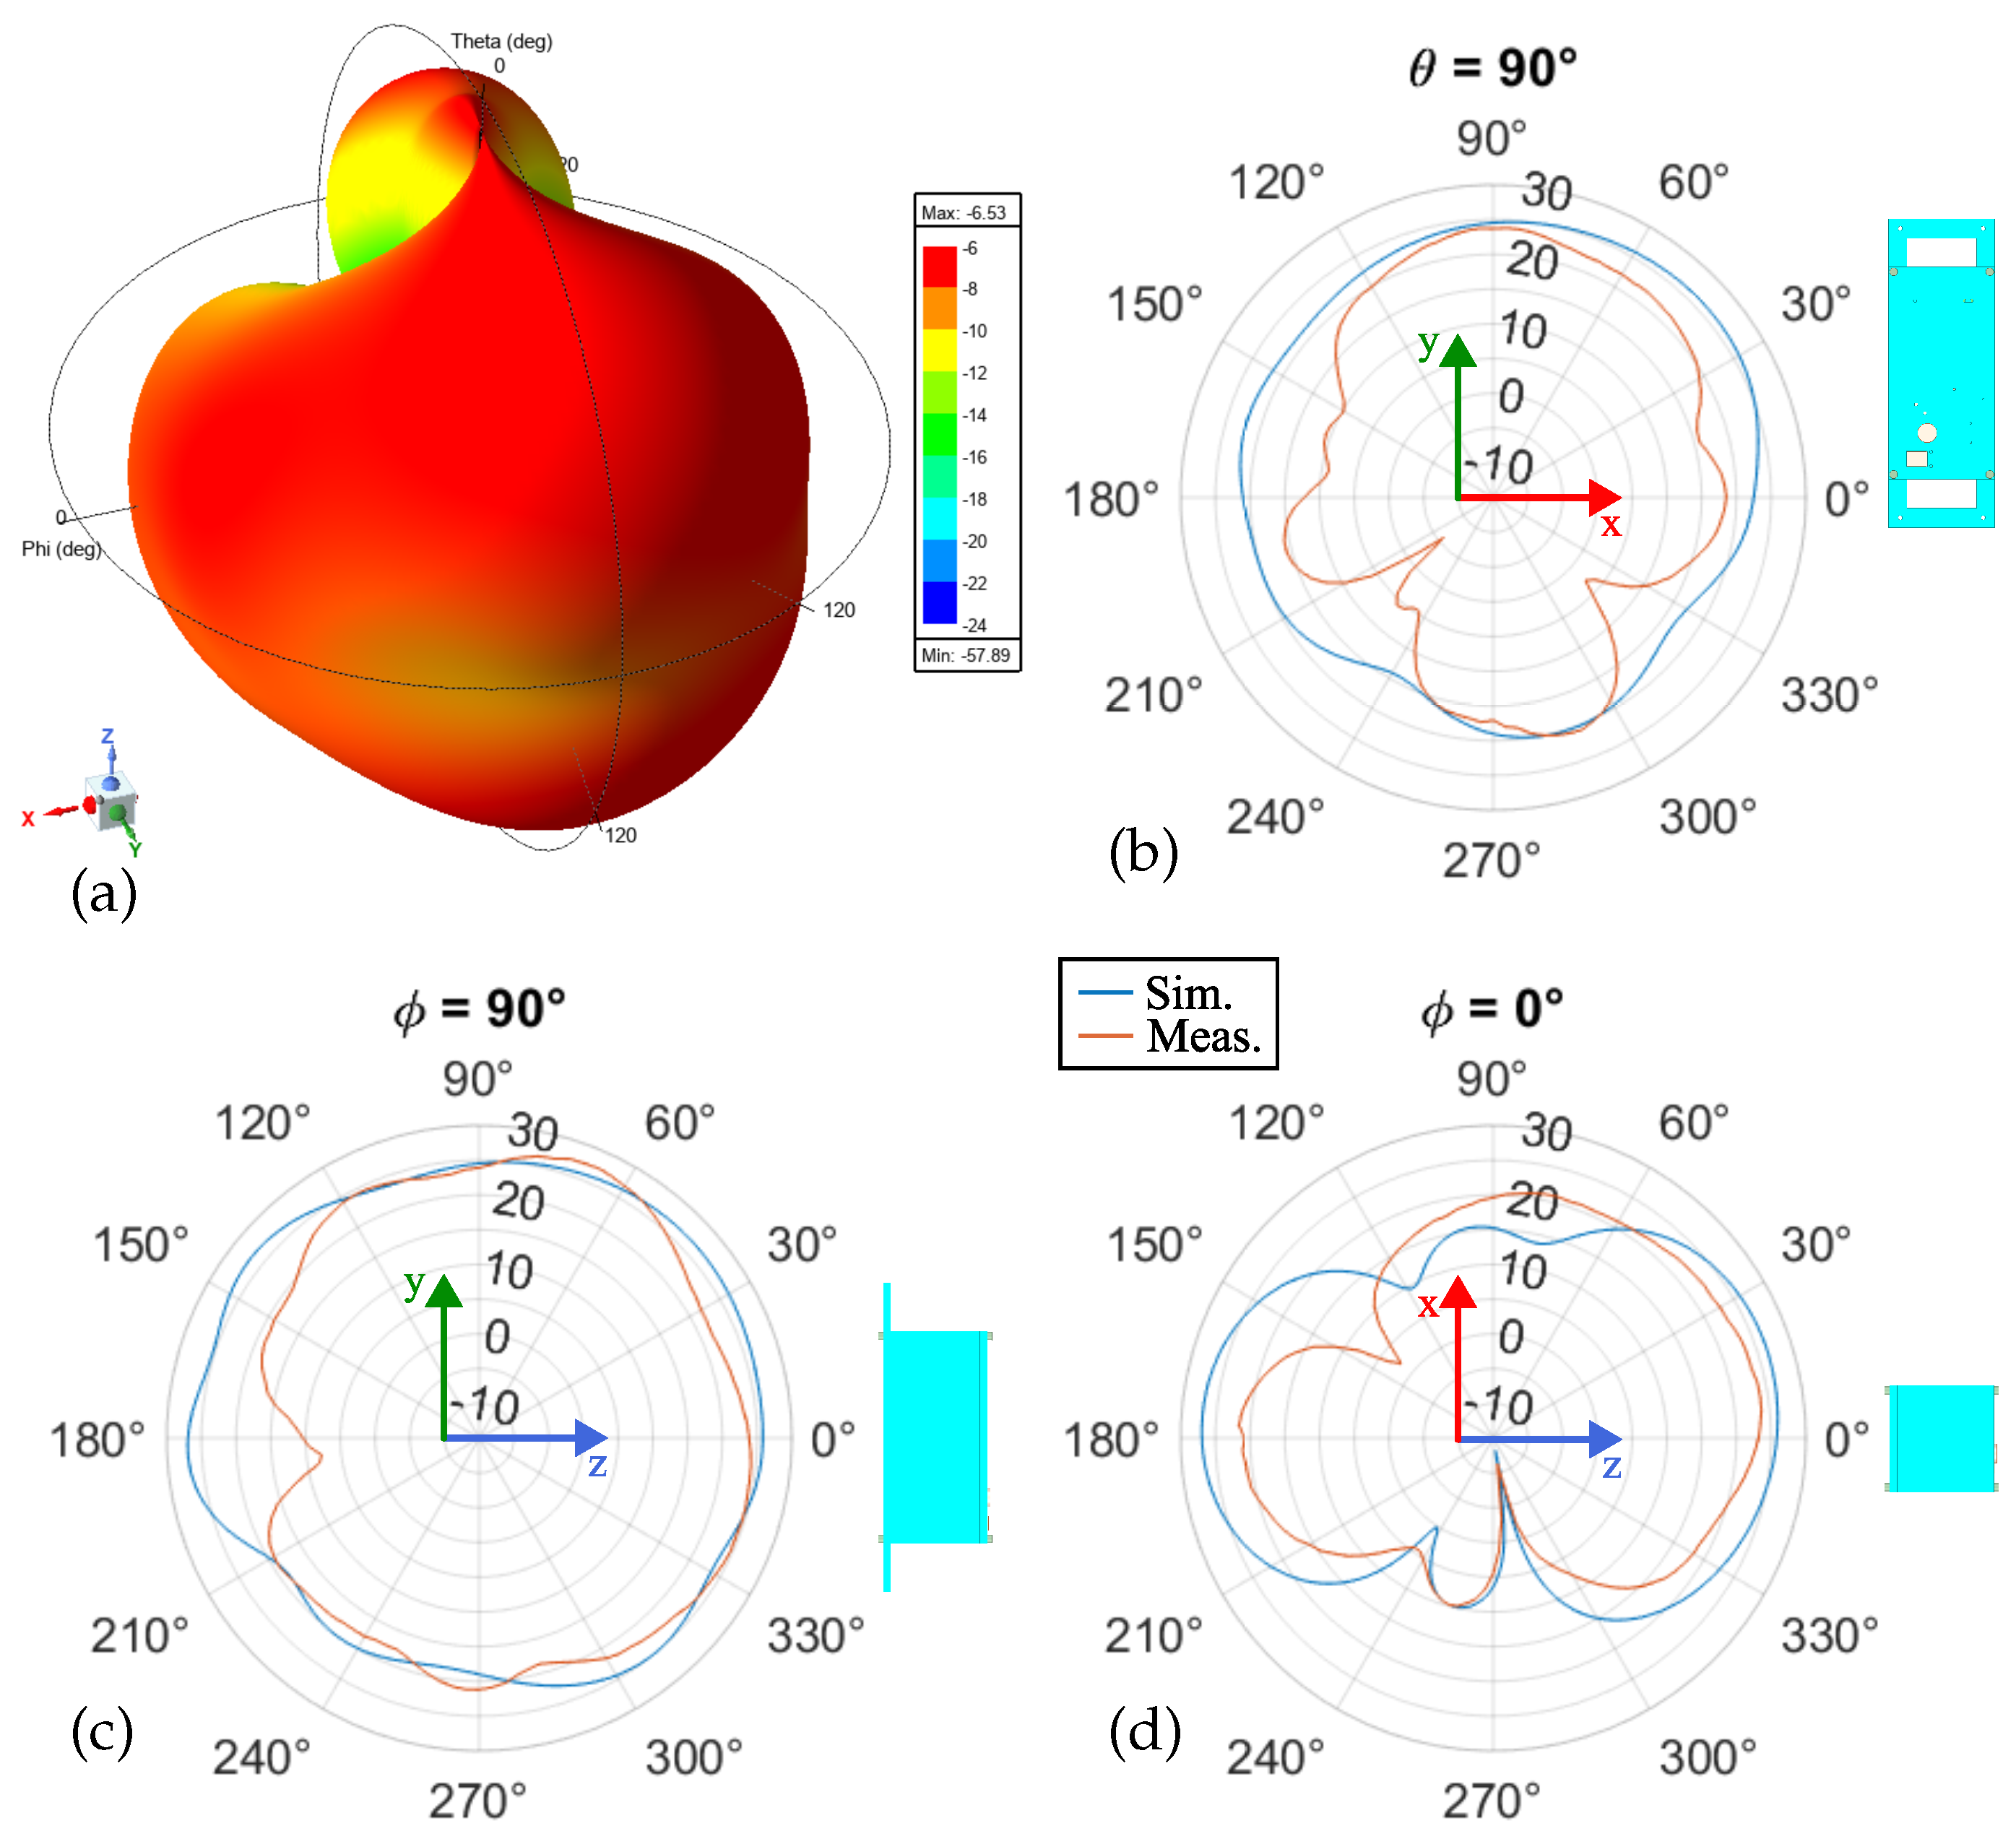
Figure 9.
Standing (S) and moving (M) tests: (a) temperature overlay on the map; (b) temperature and humidity; (c) acceleration and intensity of solar radiation; (d) SNR. Start time (Time = 0) in the GMT time zone for the standing (moving) test is Monday 26 May 2025 13:10:02.823 (GMT+02:00 DST) [Monday 26 May 2025 08:41:44.589 (GMT+02:00 DST)].
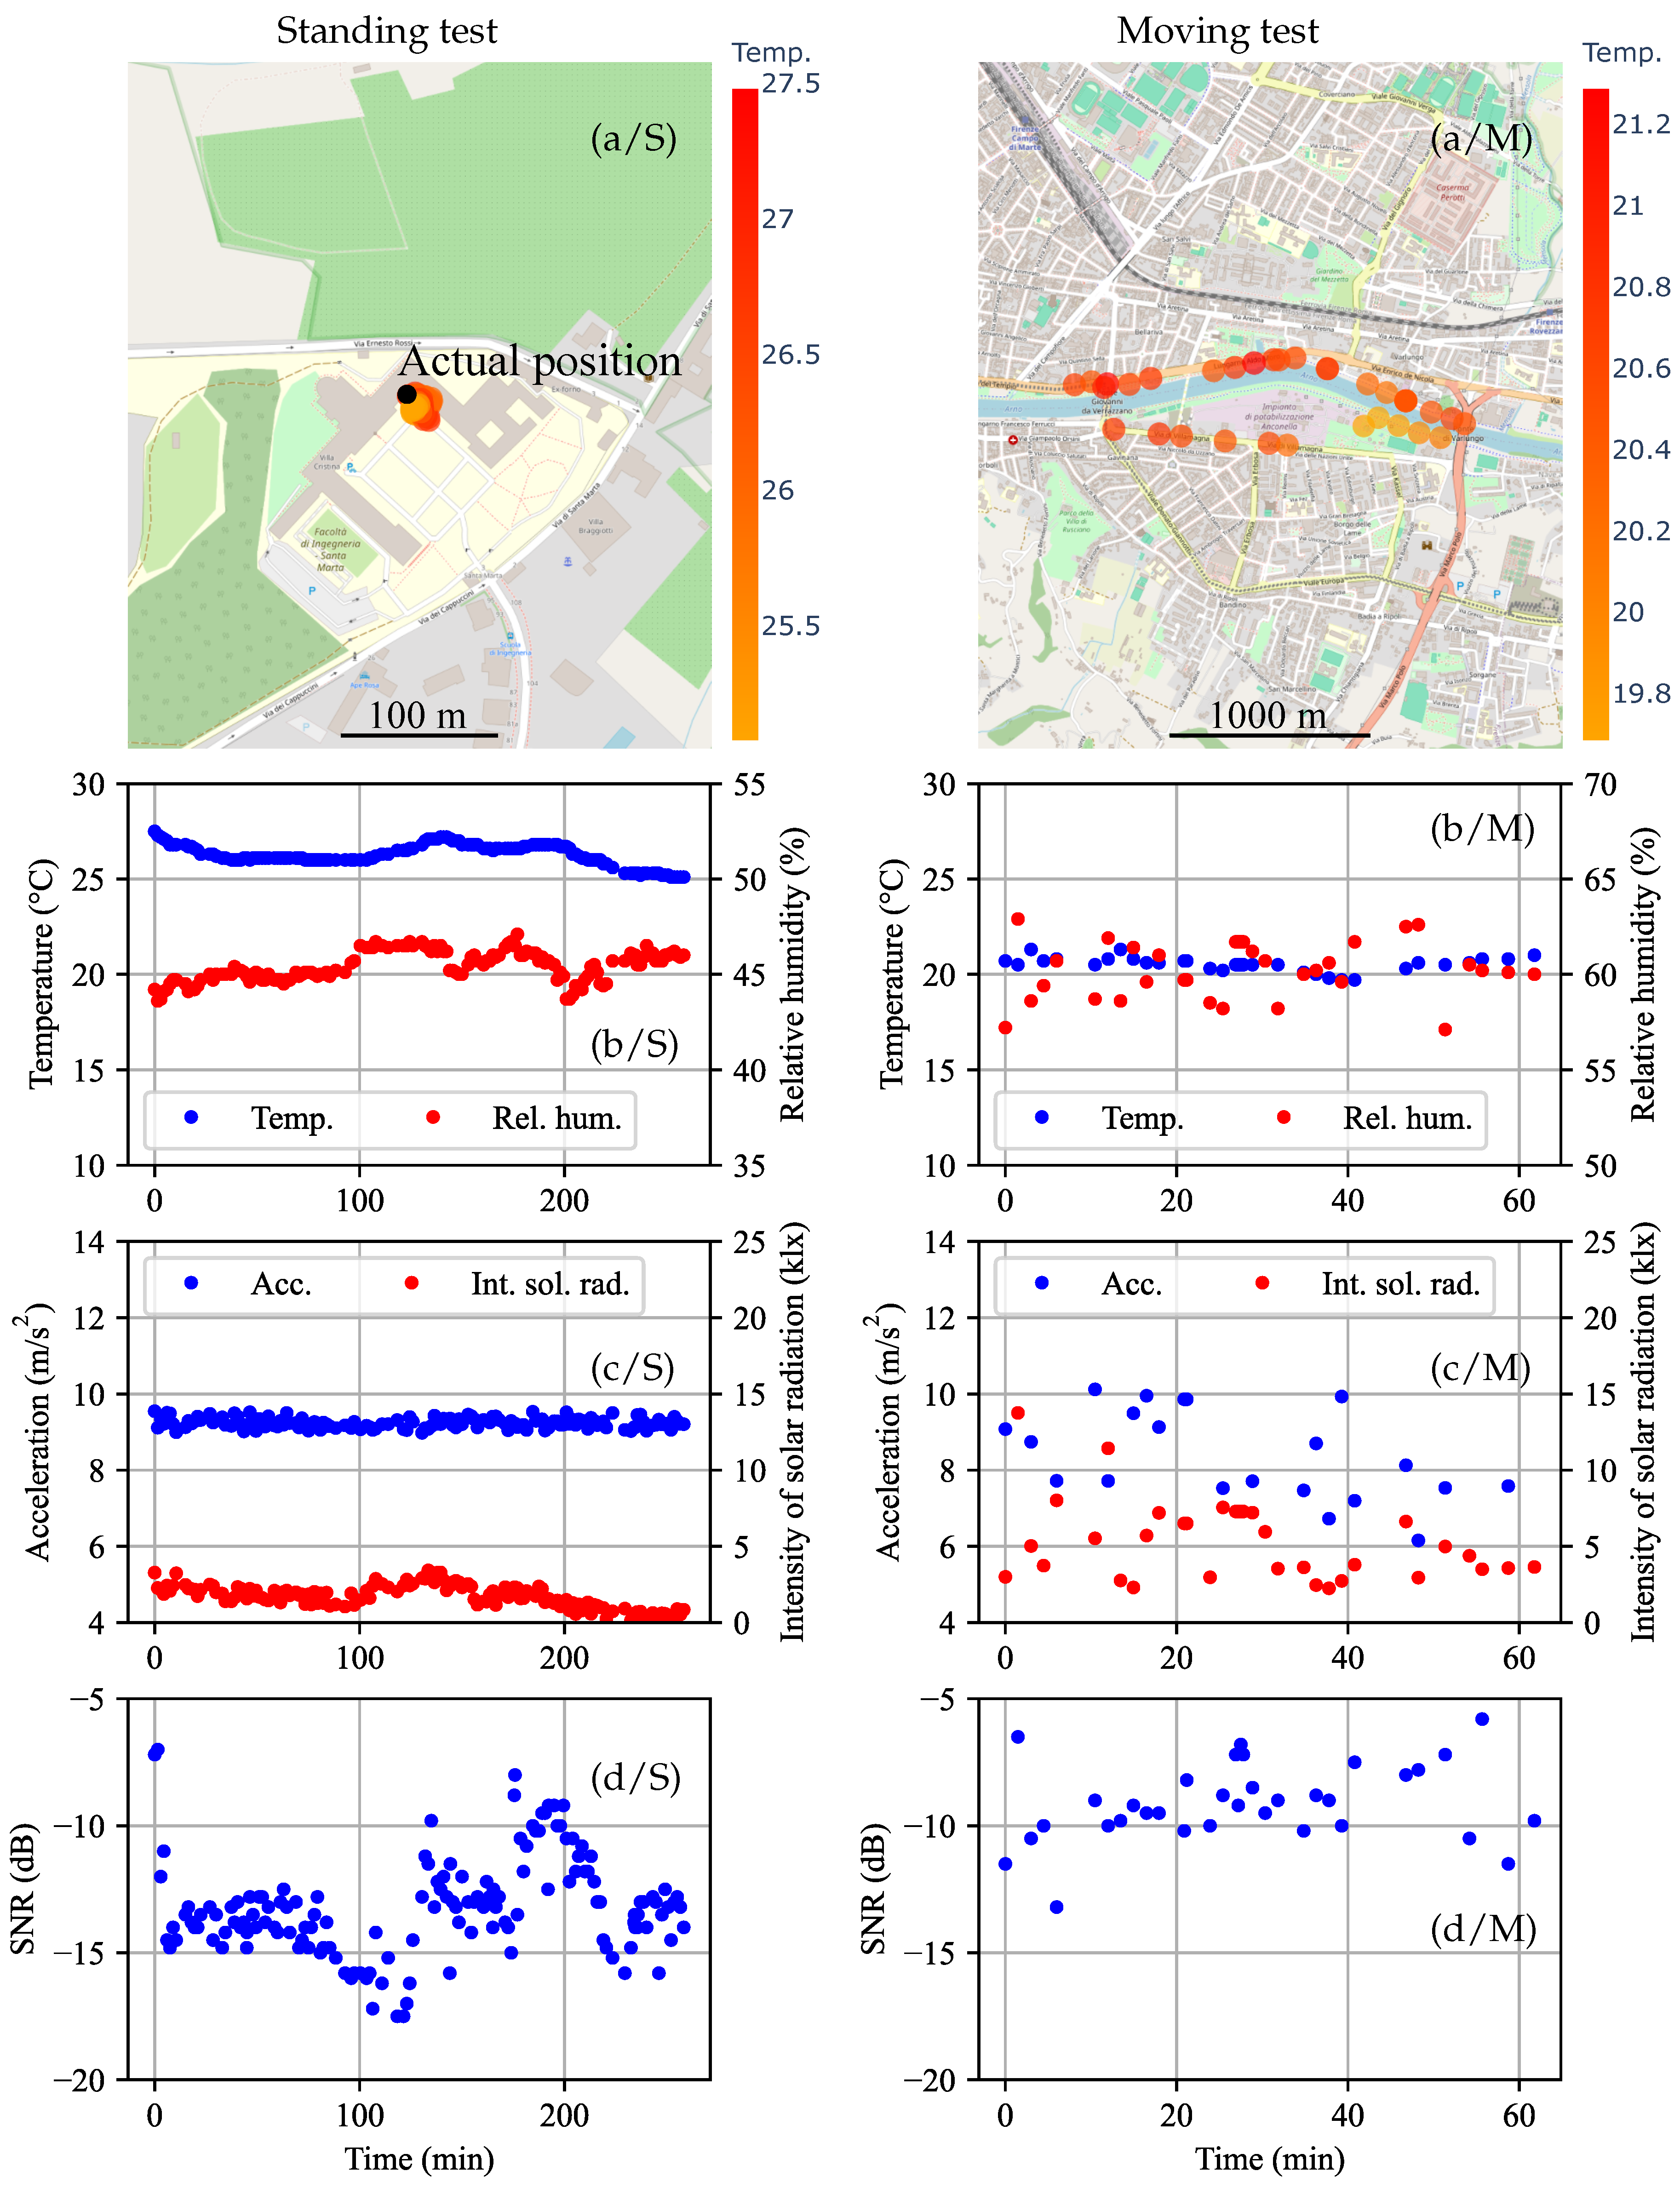
Figure 10.
Measurements from the current sensor in the form of histograms with outliers removed: standing test (left) and moving test (right).
Figure 10.
Measurements from the current sensor in the form of histograms with outliers removed: standing test (left) and moving test (right).
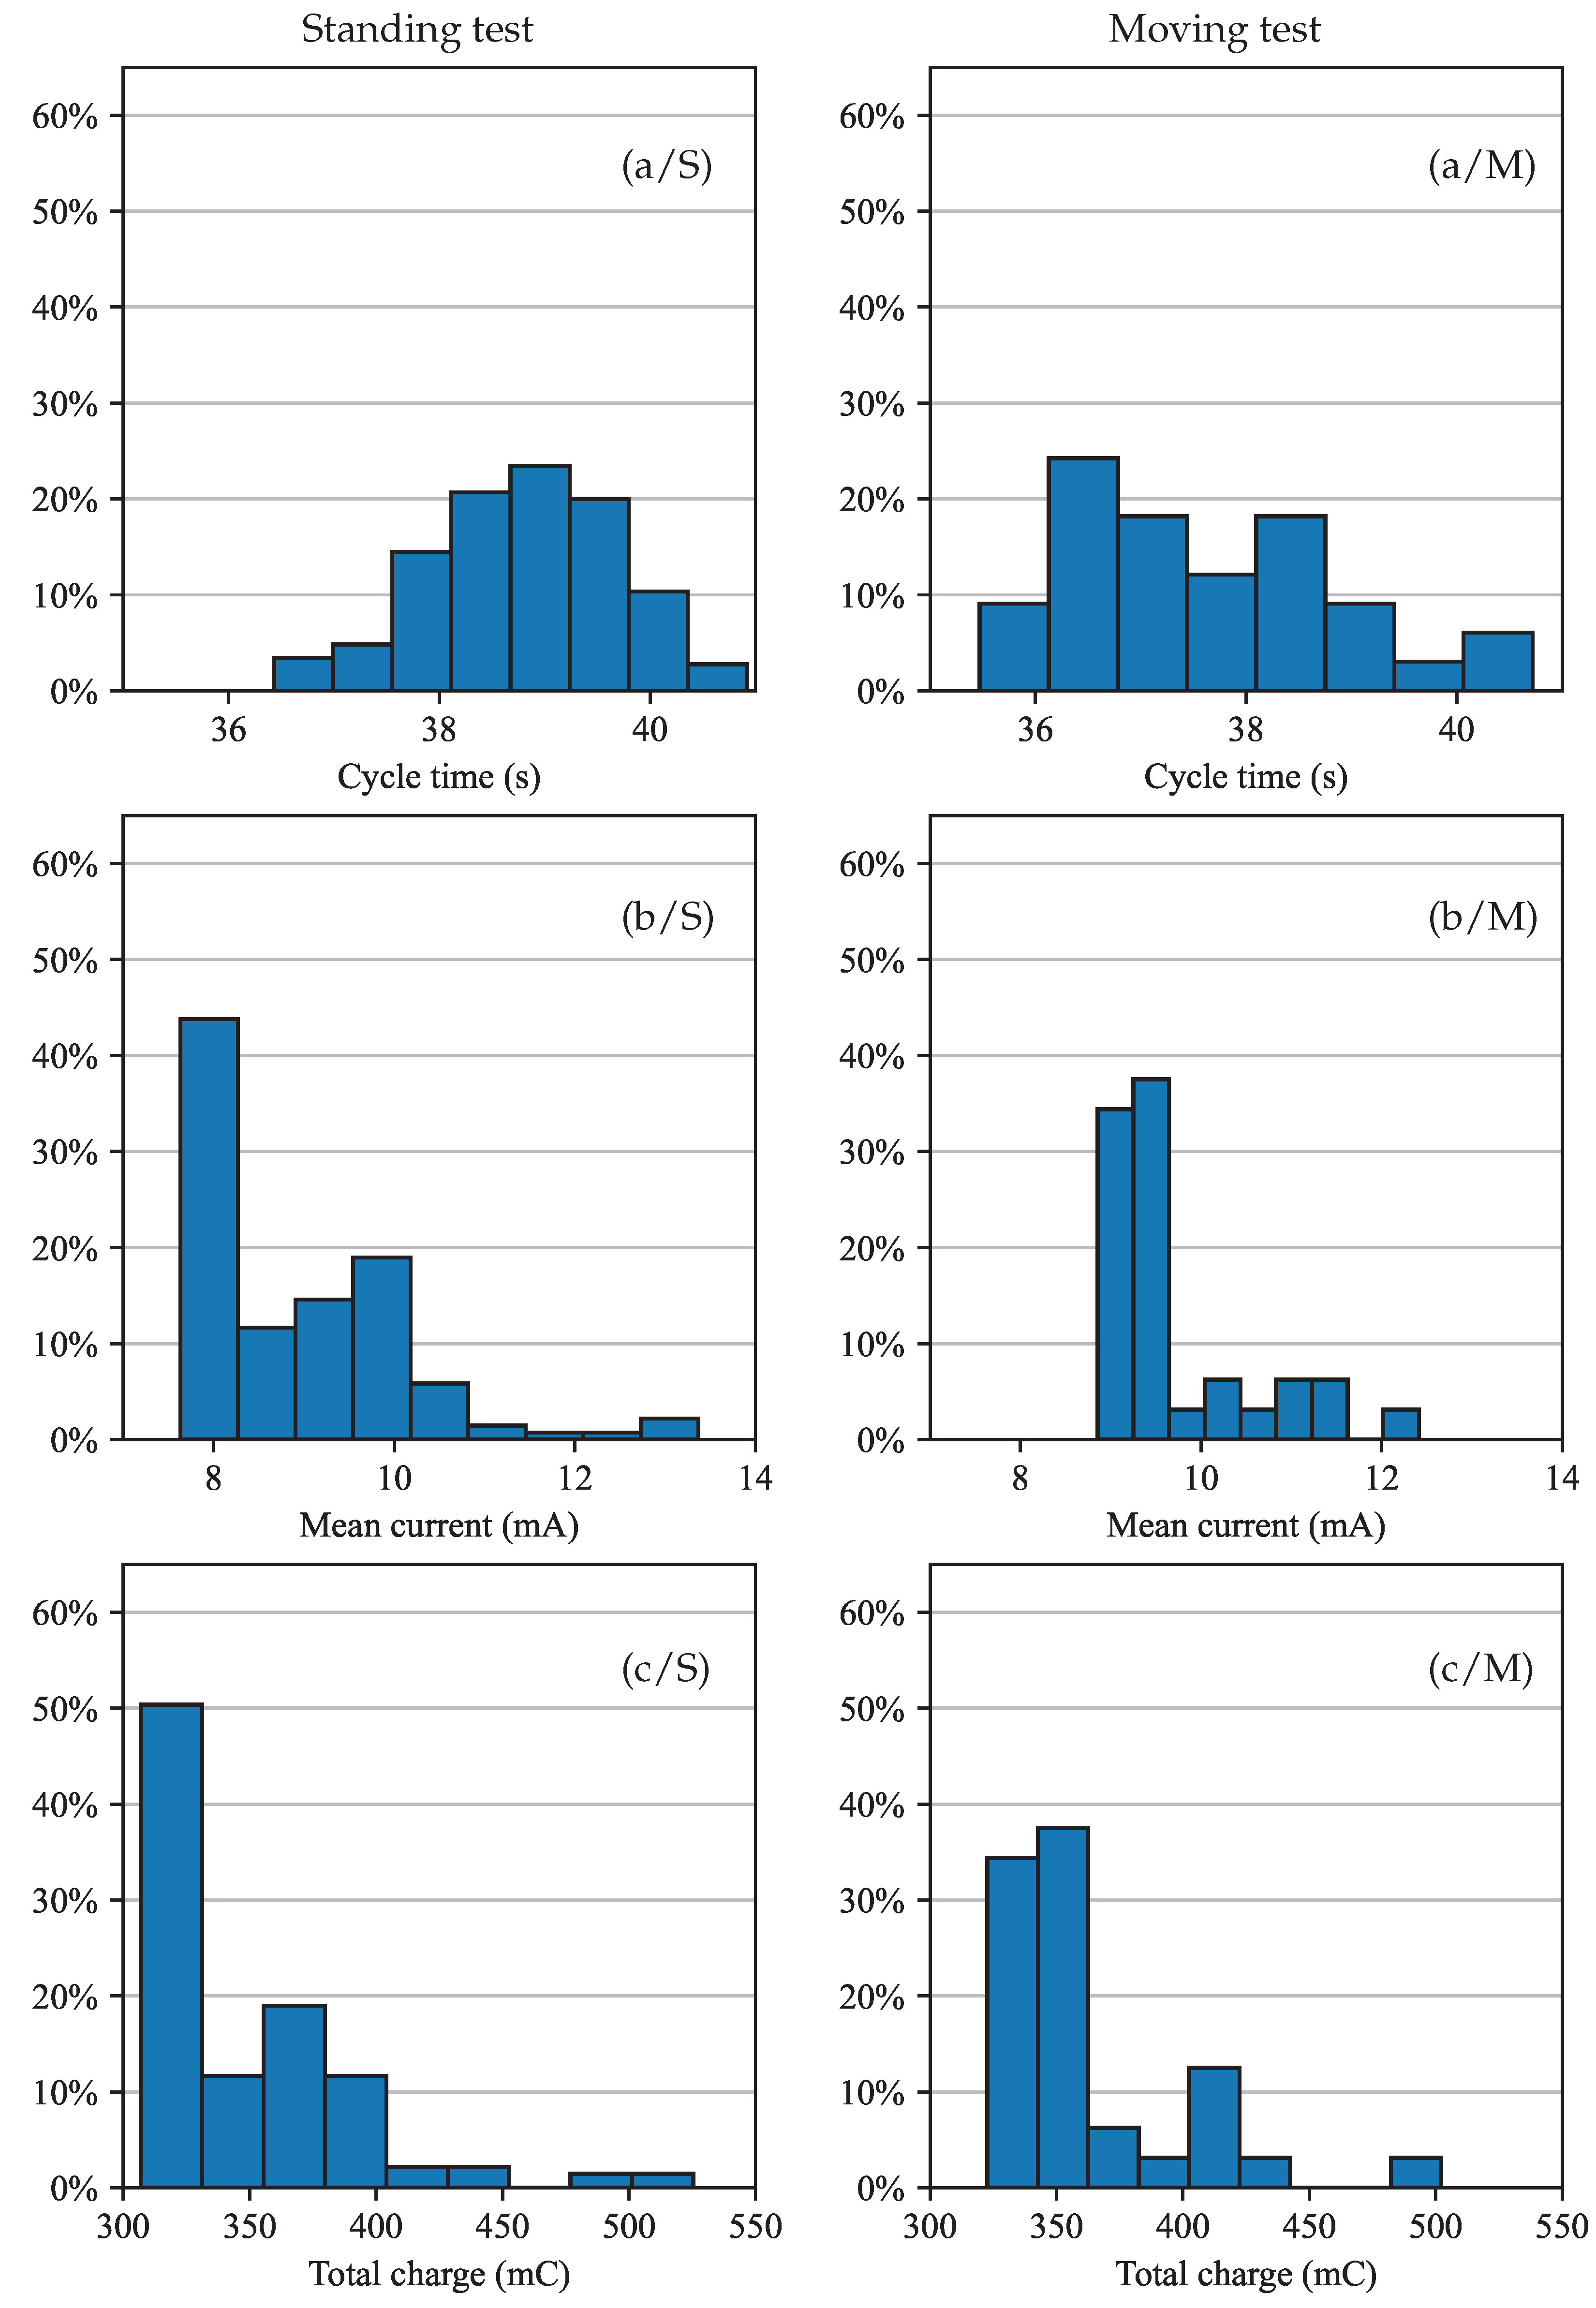

Table 1.
Current consumption for the radio-modem unit [27].
Table 1.
Current consumption for the radio-modem unit [27].
| State | Measured current (mA) | ||
|---|---|---|---|
| Sleep | 0.030 | ||
| Idle | 10 | ||
| Receiving (ACK) | 70 | ||
| Transmitting | () | ||
| Joining | () | 230 | |
(1) The value of changes adaptively to assure a successful communication with the minimum amount of power. The respective current consumption changes accordingly.
Table 2.
The maximum working currents for the modules.
| Module | Max. curr. (mA) |
|---|---|
| GNSS module | 60.00 |
| Accelerometer | 0.15 |
| Temperature and humidity sensor | 1.50 |
| Intensity of solar radiation sensor | 0.50 |
| RMU (joining state) | 230.00 |
| MCU | 500.00 |
Table 3.
Parameters sent in each message with maximum number of ASCII characters required, offset and the results in base 10 for the example. The quantities are zero-padded for the required length.
Table 3.
Parameters sent in each message with maximum number of ASCII characters required, offset and the results in base 10 for the example. The quantities are zero-padded for the required length.
| Sensor | Parameter | ASCII char. | Offset | Example base 10 |
|---|---|---|---|---|
| GNSS | Latitude | 10 | 0900000000 | 0434789850 |
| Longitude | 10 | 1800000000 | 0111520182 | |
| Number of satellites | 2 | 00 | 07 | |
| Altitude | 5 | 10000 | 01802 | |
| Height | 5 | 10000 | 00452 | |
| Accel. | Acc. x | 5 | 16384 | 00064 |
| Acc. y | 5 | 16384 | -11936 | |
| Acc. z | 5 | 16384 | -10832 | |
| Temp. and hum. | Temperature | 3 | 300 | 156 |
| Humidity | 3 | 000 | 522 | |
| Solar Rad. | Int. solar radiation | 5 | 00000 | 01836 |
Disclaimer/Publisher’s Note: The statements, opinions and data contained in all publications are solely those of the individual author(s) and contributor(s) and not of MDPI and/or the editor(s). MDPI and/or the editor(s) disclaim responsibility for any injury to people or property resulting from any ideas, methods, instructions or products referred to in the content. |
© 2025 by the authors. Licensee MDPI, Basel, Switzerland. This article is an open access article distributed under the terms and conditions of the Creative Commons Attribution (CC BY) license (http://creativecommons.org/licenses/by/4.0/).
Copyright: This open access article is published under a Creative Commons CC BY 4.0 license, which permit the free download, distribution, and reuse, provided that the author and preprint are cited in any reuse.


