
Submitted:
05 August 2025
Posted:
06 August 2025
You are already at the latest version
Abstract
Indoor localization in dynamic environments remains a challenging task, as signal fluctuations and structural changes often compromise the reliability of traditional fingerprinting methods. This paper presents M3-DynaFIPS, a novel Multidimensional Metrics Framework for evaluating dynamic fingerprint-based indoor positioning systems (IPSs). The proposed framework integrates a confidence-weighted probabilistic fusion strategy that aggregates outputs from multiple classifiers—Decision Tree (DT), K-Nearest Neighbors (KNN), Logistic Regression (LR), and Random Forest (RF)—trained on principal component-transformed features. Unlike conventional approaches that rely solely on scalar localization error metrics such as RMSE and MAE, M3-DynaFIPS incorporates additional classification-based metrics (Accuracy, Precision, Recall, and F1 Score) to provide a more holistic assessment of localization performance. The framework is evaluated across three distinct real-world indoor environments: an academic office, an indoor parking facility, and a university library. Experimental results demonstrate that the proposed fusion model consistently outperforms individual classifiers in terms of localization accuracy and computational efficiency. However, classification-based metrics revealed critical limitations of the fusion approach in certain settings—indicating that low localization error does not necessarily imply reliable classification. Moreover, the analysis reveals that Principal Component Analysis (PCA) contributes to computational gains with minimal accuracy trade-offs in certain environments. This multidimensional evaluation highlights the importance of metric diversity in performance assessment and underscores the need for scenario-specific optimization in dynamic indoor localization systems.
Keywords:
indoor localization
; Wi-Fi fingerprinting
; multidimensional metrics
; ensemble learning
; principal component analysis
; confidence-weighted fusion
; RMSE
; MAE
; dynamic fingerprints
; classification metrics
; localization accuracy
; machine learning
1. Introduction
Indoor localization systems have garnered increasing attention due to their wide-ranging applications in various sectors such as healthcare, retail, and navigation [1,2,3]. Unlike outdoor positioning systems, which heavily rely on the Global Positioning System (GPS), indoor environments pose significant challenges for accurate localization [4,5,6,7]. These challenges stem from the complex structures, dynamic nature, and frequent signal fluctuations that are often present in indoor spaces [8,9,10,11]. As a result, indoor positioning systems (IPSs), particularly those based on Wi-Fi fingerprinting, have emerged as a promising solution. Wi-Fi fingerprinting relies on collecting signal strength data from multiple access points to determine the position of individuals or objects within an indoor environment. However, despite the effectiveness of this approach in static conditions, performance often deteriorates in dynamic, real-world environments due to the evolving nature of signal patterns and feature spaces [8,9,10,11]. To evaluate the accuracy and effectiveness of indoor localization algorithms, commonly used metrics include Mean Absolute Error (MAE) and Root Mean Square Error (RMSE) [12,13]. Both metrics have become the standard for assessing localization performance by measuring the difference between predicted and actual locations. While MAE calculates the average magnitude of errors without considering their direction, RMSE squares the errors before averaging, giving more weight to larger errors. These metrics provide valuable insights into the overall accuracy of localization algorithms, but they often fall short in capturing the full complexity of real-world scenarios [14,15]. In highly dynamic indoor environments, such as crowded shopping malls or hospitals, signal patterns can vary significantly over time, and both MAE and RMSE may be insufficient in providing a comprehensive assessment of localization performance [16].
The limitations of MAE and RMSE are particularly pronounced when dealing with noisy data or environments characterized by significant signal fluctuations. For instance, in the presence of outliers—such as sudden changes in signal strength due to environmental obstacles—RMSE tends to amplify the effect of these outliers, potentially skewing the evaluation of a localization system’s accuracy [17]. Conversely, MAE may underestimate the impact of these large errors, as it treats all deviations equally. This mismatch between the two metrics in dynamic environments can lead to misleading interpretations of an algorithm's reliability and robustness. It becomes essential, therefore, to evaluate indoor localization systems using more nuanced metrics that account for the complexities inherent in real-world applications [18]. In response to these challenges, this study proposes a Multidimensional Metrics Framework (M3F) for Fingerprint-Based Indoor Positioning Systems (FBIPSs), termed M3-DynaFIPS, that extends beyond conventional error metrics such as MAE and RMSE. The proposed framework integrates additional performance indicators, such as accuracy, recall, and the F1 score, which offer a more detailed understanding of localization performance. These indicators focus on true positives, false positives, and false negatives, providing insights into the system’s ability to accurately detect the position of individuals or objects within a given environment [19]. By incorporating these multidimensional metrics, the framework offers a more holistic evaluation of indoor localization algorithms, particularly in environments where signal variations and noise are prevalent.
Accuracy, for instance, measures the proportion of correct predictions made by the localization system, offering a simple yet effective way of gauging overall performance. However, accuracy alone may not be sufficient, especially in imbalanced environments where certain positions or areas are more frequently sampled than others [20]. To address this, recall—defined as the proportion of true positive predictions relative to the total number of actual positives—becomes an essential metric. Recall provides insight into how well the system performs in detecting true locations, particularly in challenging settings where signal loss or interference may occur [21]. The F1 score, a harmonic mean of precision and recall, balances the trade-offs between these two metrics and is especially useful in scenarios with imbalanced datasets [22]. Another key aspect of the proposed framework is its ability to adapt to different indoor environments by selecting the most appropriate metric based on the specific conditions of the environment. For example, in highly dynamic environments with significant signal fluctuations, MAE might be less reliable than RMSE, as RMSE can capture larger deviations more effectively [23]. On the other hand, in environments where the signal strength remains relatively stable, MAE may be more appropriate due to its simplicity and lower sensitivity to outliers [24]. The flexibility to choose between these metrics based on the environment allows the M3-DynaFIPS framework to offer a more context-aware evaluation, thereby enhancing the accuracy and reliability of IPSs.
Moreover, by exploring the trade-offs between these multidimensional metrics, the proposed framework offers a more comprehensive and nuanced analysis of IPSs. The inclusion of additional performance indicators addresses the limitations of single-dimensional metrics such as MAE and RMSE, enabling a more thorough understanding of localization performance. This, in turn, can lead to improved decision-making in the deployment of IPSs across various real-world applications, including healthcare monitoring, retail analytics, and navigation within complex buildings [6,25,26]. In general, while MAE and RMSE have been widely used to evaluate the performance of indoor localization algorithms, their limitations in dynamic and noisy environments necessitate the use of more comprehensive metrics. The proposed Multidimensional Metrics Framework (M3-DynaFIPS) provides a solution by incorporating additional performance indicators, offering a more accurate and holistic assessment of fingerprint-based IPSs. This framework represents a significant advancement in the evaluation and development of reliable IPSs by leveraging the strengths of diverse metrics tailored to varying environmental conditions.
The rest of the paper is organized as follows: Related works are presented in Section 2. Section 3 described fingerprinting localization framework and its problem formulation. Experimental results, discussions and evaluation metrics are presented in Section 4. Conclusions and recommendations are provided in Section 5.
2. Related Works
The development of robust and accurate indoor positioning systems (IPSs) has attracted growing interest, driven by the increasing demand for location-based services in sectors such as healthcare, retail, and transportation. Among the various approaches, fingerprint-based indoor positioning stands out due to its effectiveness in environments where conventional technologies such as GPS are unreliable [27,28,29,30]. Recent studies have further advanced fingerprinting techniques to enhance localization accuracy and adaptability in complex indoor settings. Authors in [27] provided a comprehensive review of deep learning methods tailored to fingerprint-based IPSs, highlighting their potential to improve localization precision. Reference [28] employed few-shot learning to address the challenge of environmental variability, thereby improving system adaptability with limited data. Authors in [29] demonstrated the utility of deep learning using Wi-Fi CSI/RSSI fingerprints for indoor localization in multipath-rich environments. Furthermore, authors in [30] proposed a hybrid method combining Wi-Fi and Bluetooth Low Energy (BLE) signals, leveraging Kalman filtering and a recurrent neural network to significantly enhance robustness and positioning accuracy.
Dynamic fingerprint-based systems, in particular, have emerged as effective solutions for improving localization accuracy and system adaptability by enabling continuous updates to the fingerprint database over time [31,32,33]. Recent studies have focused on enhancing these systems to better address the challenges posed by environmental variability and signal fluctuations. One approach [31] integrates crowdsensing and compressive sensing techniques to reduce the dependency on manual data collection while maintaining localization accuracy. Another study [32] employs a hybrid fingerprinting framework that fuses Wi-Fi and Bluetooth Low Energy (BLE) signals, using dynamic crowdsourced data to support real-time updates. Furthermore, a machine learning-based method [33] has been proposed to predict signal variations and adaptively update the fingerprint database, thereby increasing robustness and positioning precision in complex indoor environments.
This literature review presents an analysis of the existing works related to indoor positioning metrics, dynamic fingerprinting approaches, and evaluation frameworks, which lay the foundation for a multidimensional metrics framework for evaluating dynamic fingerprint-based IPSs. Fingerprinting-based indoor positioning methods rely on the collection of signal characteristics—such as Received Signal Strength Indicators (RSSIs) or Channel State Information (CSI)—from fixed transmitters (e.g., Wi-Fi access points) at predefined reference points within an environment. These measurements are compiled into a fingerprint database, which is later used to estimate a user’s location during the online phase by matching real-time signal observations with the stored fingerprints [34]. While this method offers high localization accuracy in static indoor environments, its performance tends to degrade over time due to environmental dynamics such as signal interference, the presence of obstacles, and human mobility, which affect the reliability of the static fingerprinting model [35].
To overcome the limitations of static fingerprinting, dynamic fingerprinting methods have been proposed. These methods adapt to environmental changes by continuously updating the fingerprint database to reflect current signal conditions [36]. Such approaches leverage real-time data collection mechanisms and machine learning algorithms to update the signal maps dynamically, thereby improving localization accuracy and reducing the time and cost of manual recalibration [37]. Studies have demonstrated that dynamic fingerprinting systems can achieve higher adaptability in complex environments, but the challenge remains in balancing update frequency, computational cost, and localization performance [38]. The evaluation of IPSs, particularly fingerprint-based systems, involves multiple dimensions that span accuracy, robustness, scalability, and computational efficiency. The most common metric used is positioning accuracy, typically measured as the Euclidean distance between the estimated position and the actual location of the user [39]. However, a comprehensive evaluation requires additional metrics, such as energy efficiency, response time, scalability in large environments, and resilience to environmental changes [40]. These dimensions are crucial for real-world applications, where IPS must not only provide accurate localization but also operate efficiently under dynamic conditions.
Recent studies emphasize that relying solely on positioning accuracy as an evaluation metric is insufficient to comprehensively assess the performance of dynamic fingerprint-based IPSs. While accuracy, commonly expressed as the Euclidean distance between the estimated and actual locations, remains a critical measure, it does not capture the broader operational characteristics that influence real-world deployment and effectiveness [41]. Accordingly, a multidimensional evaluation framework has been advocated to ensure a more balanced assessment of IPSs performance under dynamic and resource-constrained conditions. One of the most crucial dimensions beyond accuracy is energy efficiency, particularly in mobile and resource-limited platforms. Energy consumption during fingerprint data collection and positioning inference must be minimized to extend device usability without sacrificing accuracy. Recent efforts have introduced autonomous and energy-aware data collection techniques that reduce the overhead of manual surveying, improving the practicality of deploying IPSs in large-scale environments [42]. Additionally, scalability plays a vital role in determining whether a system can maintain reliable performance as the spatial coverage expands or the number of users and access points increases. Scalability-aware localization models, such as those incorporating cross-floor knowledge distillation, have shown promising results in maintaining localization fidelity across complex multi-floor indoor settings [43].
Equally important is the update cost—the labor, computational, and data acquisition burden incurred when refreshing fingerprint databases to reflect environmental changes. In dynamic environments, where Wi-Fi signal characteristics are subject to frequent fluctuations due to factors such as human mobility or infrastructure modifications, static fingerprint maps quickly become outdated. To address this challenge, lightweight update mechanisms such as iUpdater have been proposed, which reduce the need for full re-surveys by selectively reconstructing parts of the fingerprint database using low-rank matrix approximation, resulting in significant reductions in time and cost [44]. Despite these advances, a persistent issue in the field is the absence of standardized benchmarking frameworks for IPSs evaluation. Without a consensus on evaluation protocols, comparing different systems remains difficult, particularly under dynamic conditions where trade-offs between accuracy, robustness, energy efficiency, and update cost must be carefully managed. Benchmarking initiatives such as IPIN/EvAAL have made progress toward standardization by offering reference datasets and metrics; however, broader adoption and refinement are still needed to enable fair and consistent performance comparison across IPSs implementations [45]. In general, while MAE and RMSE have been widely used to evaluate the performance of indoor localization algorithms, their limitations in dynamic and noisy environments necessitate the use of more comprehensive metrics. This paper proposes a Multidimensional Metrics Framework (M3F) for Fingerprint-Based Indoor Positioning Systems (denoted as M3-DynaFIPS) that extends beyond conventional error metrics. Recognizing the complexities of accurately determining the position of individuals or objects within indoor environments, our framework incorporates additional performance indicators, including accuracy, recall, and F1 score, which account for true positives, false positives, and false negatives. Moreover, the study emphasizes the importance of identifying the most suitable metric for specific indoor settings, particularly in dynamic and challenging environments. We explore the robustness and applicability of MAE and RMSE within various scenarios, highlighting which metric is more reliable under different conditions. Moreover, the trade-offs between accuracy, update costs, and energy efficiency have not been sufficiently explored in most evaluation frameworks, leaving room for future research to develop more comprehensive and widely applicable methodologies.
3. Problem Formulation and Theoretical Framework
Accurate and robust indoor localization using Wi-Fi fingerprinting is increasingly essential in complex and dynamic indoor environments. However, prevailing approaches often rely on single-metric evaluation criteria and static learning models that fail to capture the variability and uncertainty introduced by signal fluctuations, user mobility, and heterogeneous deployment contexts. To address these limitations, this study introduces a Confidence-Weighted Probabilistic Fusion framework, formulated within the broader context of a Multidimensional Metrics Framework for Evaluating Dynamic Fingerprint-Based Indoor Positioning Systems (M3-DynaFIPS). The proposed fusion approach integrates multiple classifiers trained on principal component-transformed feature spaces and fuses their probabilistic outputs based on individual classifier confidence scores.
Specifically, classifier predictions are weighted by the maximum posterior probability for each test sample, enabling a data-driven ensemble that dynamically adapts to classification certainty across heterogeneous input distributions. This formulation enables the construction of a confidence-weighted spatial estimate by aggregating and normalizing position estimates from all classifiers, improving resilience to individual model biases and promoting robust localization performance. The framework emphasizes not only localization accuracy—quantified via RMSE—but also extends support for multidimensional evaluation by incorporating additional performance indicators such as computational cost, stability under environmental shifts, and interpretability. Thus, this formulation contributes to the overarching M3-DynaFIPS objective by offering a scalable and adaptive mechanism for integrating ensemble learning with confidence-aware spatial reasoning, making it particularly suitable for dynamic and evolving indoor localization scenarios.
3.1. Problem Formulation
Indoor localization using Wi-Fi fingerprinting aims to estimate the physical location of a user based on a RSSI vector. Let Xtest ∈ RN× d denote the test RSSI measurements and the corresponding 2D spatial grid of G reference locations. The goal is to estimate the position for each test sample , such that the mean localization error is minimized:
Where is the true position corresponding to the test label.
3.2. Feature Space Reduction via Principal Component Analysis
RSSI fingerprints are typically high-dimensional and contain redundant or noisy features. To mitigate this, we apply PCA to reduce dimensionality while preserving at least percent of the total variance. Given the training matrix , PCA transforms the data as:
Where is composed of the top eigenvectors of the data covariance matrix, satisfying the varaiance threshold.
3.3. Ensemble of Probabilistic Classifiers
We utilize an ensemble of four diverse classifiers: Decision Tree (DT), K-Nearest Neighbors (KNN), Logistic Regression (LR), and Random Forest (RF). These classifiers are trained on the PCA-transformed data with label vector . Each classifier produces a class probability distribution:
Where contains the probabilitiy estimates for each test sample and each grid class.
3.4. Confidence -Weighted Probabilistic Fusion
To combine the outputs of all classifiers, we propose a confidence-weighted probabilistc fusion mechanisim. For each test sample , the setaps are as follows:
- (a)
- For classifier , extarct the predicted probability vector
- (b)
- Identify the most probable class:
- (c)
- Map this class to the corresponding position:
- (d)
- Obtain the confidence score:
- (e)
- Compute the confidence-weighted fused position:
Here, is a smalll constant added to ensure numerical stability and avoid division by zero.
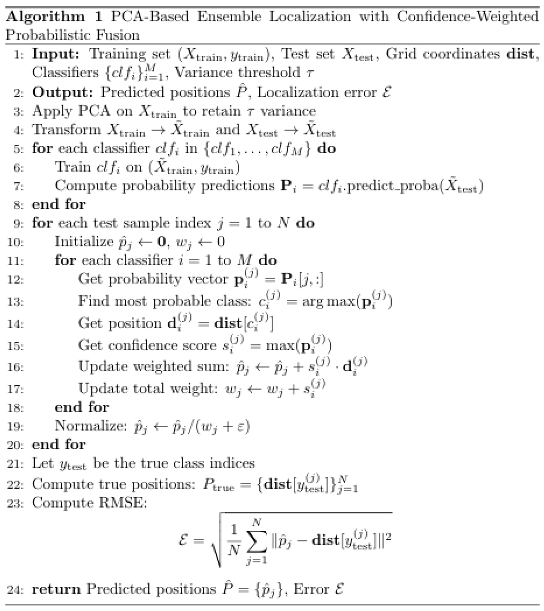
To this end, algorithm 1 briefly presents a PCA-based ensemble localization framework that integrates multiple classifiers using a confidence-weighted probabilistic fusion strategy. The method begins by applying PCA to the training data to reduce dimensionality while retaining a specified amount of variance. Each classifier in the ensemble is trained on the reduced feature space and used to generate class probability distributions for the test samples. For each test instance, the algorithm aggregates predicted positions from all classifiers, where each prediction is weighted by the classifier’s maximum confidence score. This weighted summation of spatial coordinates, corresponding to the most probable classes, is normalized by the total accumulated weight to yield the final predicted location. The overall localization accuracy is then evaluated using the RMSE between the predicted positions and ground truth coordinates. This algorithm robustly combines the predictive strengths of multiple classifiers and enhances localization precision by leveraging both feature reduction and probabilistic confidence weighting.
3.5. Evaluation Metrics for Positioning Performance
This section presents a comprehensive evaluation of the proposed Confidence-Weighted Probabilistic Fusion algorithm within the context of dynamic, real-world Wi-Fi fingerprinting environments. The indoor localization task is formulated as a multiclass classification problem, where each unique location corresponds to a distinct class label. Traditional evaluation metrics such as RMSE and MAE are useful for quantifying localization error in Euclidean space, but they often overlook critical aspects such as classifier balance, robustness, and consistency under environmental variability. To address these limitations, we adopt the Multidimensional Metrics Framework (M3-DynaFIPS), which extends the evaluation beyond spatial error metrics to include classification-oriented performance indicators such as accuracy, recall, and F1-score. These metrics account for true positives, false positives, and false negatives—factors that are especially relevant in dynamic indoor environments where signal variation and positional ambiguity are prevalent. This multidimensional evaluation strategy has been shown to provide a more balanced and holistic view of system performance in prior studies [46,47]. By integrating both spatial and classification metrics, our framework enables a more nuanced and robust assessment of system performance. This multidimensional approach not only highlights the efficacy of the proposed fusion strategy but also ensures a balanced evaluation across accuracy, generalization, and resilience—key qualities for practical deployment in adaptive long-term indoor localization scenarios.
- (1)
- RMSE: This metric is a commonly used metric in indoor localization scenarios to measure the accuracy of a localization system. It quantifies the average difference between the estimated positions and the ground truth positions of objects or devices in an indoor environment. It provides a single value that reflects the overall performance of the localization system, with lower values indicating higher accuracy. Accoringly, the RMSE was used to evaluate the effectiveness of the proposed algorithm and defined as:where and are the predicted location estimate and the true location of a client of the 2-dimensional coordinates of the mth positioning sample respectively. And n is the total number of samples to be located in the target domain.
- (2)
- MAE: This is a metric used in indoor localization scenarios to assess the accuracy of a localization system. It measures the average magnitude of the differences between the estimated positions and the ground truth positions of objects or devices in an indoor environment. It provides a measure of the average deviation between the estimated and true positions, disregarding the direction of the errors. A lower MAE value indicates a higher level of accuracy in the localization system and defined as:
- (3)
- Accuracy: This metric measures the overall correctness of the localization system by calculating the ratio of correctly classified instances to the total number of instances. It provides an indication of the system's ability to correctly identify the location across all classes. The formula for accuracy is:
- (4)
- Recall: This metric, also known as sensitivity or true positive rate, measures the ability of the localization system to correctly identify positive instances within each class. The formula for recall is:
- (5)
- Precision: This metric measures the accuracy of positive predictions made by the localization system. Precision provides insights into the system's ability to avoid false positive predictions and give as:
- (6)
- F1 Score: It is a metric that combines both precision and recall into a single value. It provides a balanced measure of the system's performance by calculating the harmonic mean of precision and recall. It ranges from 0 to 1, with a higher value indicating better performance in terms of both precision and recall and give as:
4. Experimental Results and Discussion
4.1. Experimental Scenarios
To evaluate the robustness and effectiveness of the proposed M3-DynaFIPS framework—a Multidimensional Metrics Framework for Evaluating Dynamic Fingerprint-Based Indoor Positioning Systems—we conduct a comprehensive performance assessment across three diverse real-world indoor environments. Specifically, the proposed error-weighted probabilistic fusion method is evaluated through a comparative analysis in the following settings: (i) an office environment at the University of Electronic Science and Technology of China (UESTC), (ii) an indoor parking facility at Huawei, and (iii) a university library at Universitat Jaume I in Spain. These distinct scenarios represent varying spatial layouts and signal conditions, allowing us to rigorously assess the generalizability, stability, and adaptability of the proposed localization framework.
A. Library
The study was conducted on the 3rd and 5th floors of the Universitat Jaume I library in Spain, covering approximately 308.4 m² (Figure 1a). Over 25 months, Wi-Fi fingerprint data were collected using a Samsung Galaxy S3 smartphone, resulting in a dataset comprising 620 access points (APs) across 106 grid points (Figure 1b). During the first month, 15 offline and 5 online databases were recorded; in the following months, 1 offline and 5 online databases were collected monthly. Four offline databases from the first month were used as the reference training set, while online datasets from subsequent months served as testing samples to assess signal variability over time. To analyze long-term performance, one offline dataset per month was selected as training data and evaluated against five testing samples from randomly selected months. This approach enabled assessment of signal fluctuation and generalization in dynamic indoor environments. The complete dataset is publicly available on Zenodo [48]: https://zenodo.org/record/1066041. A summary of the dataset is provided in Table 1, supporting the development of the proposed PCA-based RSS fingerprinting localization framework.
B. Office
To validate the proposed approach under realistic and varying indoor environmental conditions, a real-world office experiment was conducted at the University of Electronic Science and Technology of China (UESTC), specifically on the 21st floor of the Innovation Building, as depicted in Figure 2. The experimental site covers an area of approximately 1,460 m² and is systematically partitioned into 175 reference points (RPs). To ensure reliable and consistent signal coverage, nine Wi-Fi access points (APs) were strategically installed, with each RP guaranteed to receive signals from at least three APs.
C. Indoor Parking
The experiments were conducted at Huawei within a 75 m² indoor environment, where 225 and 110 RPs were uniformly distributed with a minimum spacing of 0.5 meters, as shown in Figure 2. Two distinct data collection campaigns were carried out: the first in September 2020 and the second in October 2020. During the first phase, data were collected on eight separate days, resulting in eight measurement sets, while the second phase comprised five measurements across five distinct days. In this study, the second-phase dataset—comprising channel state information (CSI) measurements collected over five consecutive days—was used, with the data fused to construct a robust and representative fingerprint database for performance evaluation. The CSI was captured using a setup that included four base stations and one transmitter, with all data collected via a location server. Notably, the number of RPs captured per day varied across the two periods, leading to an inherent imbalance in the dataset. This variability introduces potential bias, which is explicitly addressed in the subsequent analysis. The spatial layouts and environmental configurations of the experimental scenarios are depicted in Figure 2 and Figure 3.
Table 1 [49,50,51] summarizes the key characteristics of the three datasets used to evaluate the performance of the proposed dynamic fingerprint-based indoor positioning algorithms. These datasets were collected across diverse indoor environments—library, office, and indoor parking—with variations in area size, number of RPs, APs, user equipment (UEs), and extracted features.
4.2. Comparative Analysis of Methods
To comprehensively assess the effectiveness of the proposed error-weighted probabilistic fusion approach, a comparative performance analysis was conducted across three distinct indoor environments: an office setting at UESTC, an indoor parking site at Huawei, and a university library at Universitat Jaume I in Spain. The evaluation considered two key dimensions: (i) the use of original feature representations, and (ii) the application of PCA as a dimensionality reduction technique. The analysis employed two complementary accuracy metrics—RMSE and MAE—which align with the Metric dimension of the M3-DynaFIPS framework for multidimensional performance evaluation.
As shown in Table 2 and Table 3, the proposed fusion model consistently outperforms individual classifiers (DT, KNN, LR, and RF) across all environments, both in terms of RMSE and MAE. For instance, in the Office dataset, the proposed method achieved the lowest RMSE (1.810 m) and MAE (3.689 m) using original features, outperforming the next best baseline (KNN) by notable margins. Similarly, in the Huawei indoor parking site—characterized by high signal variability due to structural interference—the proposed model demonstrated superior localization performance (RMSE: 1.804 m, MAE: 3.718 m), highlighting its adaptability in dynamic environments. Even in the Library environment, where signal reflection and occlusion effects are more pronounced, the proposed method maintained its relative advantage over all other models (RMSE: 2.272 m, MAE: 6.454 m).
After applying PCA, while a general trend of marginal degradation in performance was observed—particularly in MAE across environments—the proposed model retained its top ranking. This suggests that, although PCA reduces dimensionality and computational complexity, it may also eliminate subtle but discriminative spatial features that are vital for precise localization. Nonetheless, the fusion model's resilience to such information loss illustrates its robustness and generalization capability. These findings corroborate the principles of the M3-DynaFIPS framework, specifically its emphasis on evaluating fingerprint-based indoor positioning systems through multiple performance metrics, under variable environmental conditions, and across different feature representations. The superior performance of the proposed method in all cases underscores its practical viability and effectiveness as a dynamic, adaptive localization solution in real-world indoor scenarios.
Figure 4, Figure 5 and Figure 6 illustrate the comparative performance of five localization models—DT, KNN, LR, RF, and the proposed error-weighted fusion approach—across three distinct indoor environments: an academic office, an indoor parking facility, and a university library. The metrics used for evaluation include RMSE and MAE, with results presented both before and after the application of PCA.
The figure reveals several key insights. First, the proposed fusion model consistently yields the lowest error values across all scenarios, underscoring its robustness and adaptability in diverse signal environments. Second, while PCA offers dimensionality reduction benefits, its impact on localization accuracy is mixed [52]—resulting in slight performance degradation in most cases, particularly in MAE. This indicates that although PCA preserves major variance components, it may also discard subtle signal characteristics critical for precise localization. Furthermore, the Library environment demonstrates higher error magnitudes overall, likely due to increased signal reflections and dynamic obstructions, thereby validating the environmental sensitivity dimension of the M3-DynaFIPS evaluation framework. In summary, the figure supports the conclusion that fusion-based learning, when paired with original high-dimensional feature representations, provides a more reliable and accurate localization strategy in heterogeneous indoor settings.
Figure 4 presents a comparative analysis of RMSE and MAE for the Office environment using two feature sets: Original and PCA. The bar charts illustrate the performance of five classifiers (DT, KNN, LR, RF, and Proposed Method) in predicting the target variable. The Original feature set is represented in blue for RMSE and orange for MAE, while PCA features are shown in green for RMSE and red for MAE. The results indicate that the Proposed Method consistently outperforms other classifiers, particularly in RMSE, suggesting enhanced predictive accuracy with PCA preprocessing.
Figure 5 compares RMSE and MAE for the Huawei environment, highlighting the efficacy of Original and PCA-derived features across five classifiers. The bar charts reveal distinct performance metrics, with original features (blue for RMSE, orange for MAE) and PCA features (green for RMSE, red for MAE). The analysis shows that while some classifiers exhibit slight variations in performance, the Proposed Method achieves lower RMSE and MAE values, indicating improved model reliability and accuracy when utilizing PCA features. This suggests that dimensionality reduction techniques may enhance predictive modeling in this specific context.
In Figure 6, the RMSE and MAE for the Library environment are compared using Original and PCA features. The bar charts differentiate between the performance of five classifiers, with original features indicated in blue and orange, and PCA features in green and red. The results demonstrate a notable improvement in predictive accuracy for the Proposed Method, particularly in RMSE. This emphasizes the role of PCA in reducing feature dimensionality and enhancing model performance, making it a valuable approach for datasets with complex interactions among features.
Figure 7 illustrates that the Cumulative Distribution Function (CDF) for RMSE in the Office environment indicates that approximately 70% of predictions using PCA features achieve an RMSE below 1.9, compared to only 50% for original features. Similarly, for MAE, around 65% of predictions with PCA fall below 4.0, whereas only 40% do so with original features. This significant shift underscores the effectiveness of PCA in enhancing model accuracy and reliability in the Office setting.
Figure 8 illustrates that the CDF for RMSE and MAE in the Huawei environment demonstrates that about 60% of predictions using PCA features yield an RMSE below 2.0, compared to just 35% for original features. For MAE, approximately 55% of PCA predictions are below 5.0, while only 30% of original predictions reach this threshold. These findings highlight the substantial improvement in predictive performance when applying PCA, reflecting the importance of dimensionality reduction in this context.
Figure 9 illustrates that the CDF analysis for the library environment reveals that nearly 75% of predictions using PCA features attain an RMSE below 2.4, contrasted with only 50% of original predictions. For MAE, around 70% of PCA results are below 7.0, compared to 45% for original features. This marked enhancement in error reduction demonstrates the significant benefits of using PCA for improving model accuracy in complex datasets like those found in the library environment.
4.4. Computational Time Analysis
In this section, we analyze the computational complexity of our proposed algorithm for Wi-Fi Fingerprint-Based Indoor Location Estimation. We specifically focus on the utilization of various data reduction techniques, namely mean signal values, functional discriminant analysis, correlation analysis and principal component analysis, to extract feature spaces. The algorithms under study were executed on a laptop computer equipped with an AMD Ryzen 3 3200U CPU (2.60 GHz) and 16 GB of RAM. The complexity of an algorithm is primarily assessed based on two factors: time complexity and space complexity. The provided tables (Table 4 and Table 5) present the computational time and localization error for various classifiers (DT, KNN, LR, RF) and a proposed fusion model in an "Indoor setting: Office: UESTC" dataset. The analysis covers both original features (Table 3) and features after PCA application (Table 4), evaluating training/testing times (seconds), RMSE, and MAE (meters).
As detailed in Table 3, for the original feature set, the DT classifier exhibited extremely fast training (0.0194 seconds) and testing (0.1555 seconds) times. Its RMSE was 1.890248 m and MAE was 3.9680 m. The KNN classifier, while showing relatively longer training (12.6537 seconds) and testing (1.6511 seconds) times compared to DT and LR, still maintained reasonable efficiency. KNN achieved an RMSE of 1.869913 m and an MAE of 3.8991 m. LR demonstrated fast training (4.0823 seconds) and exceptionally fast testing (0.0040 seconds), with an RMSE of 1.918150 m and MAE of 4.1272 m. The RF classifier was notably efficient in both training (0.1985 seconds) and testing (0.0094 seconds). Its RMSE was 1.971958 m and MAE was 4.3996 m. Among individual classifiers, KNN achieved the lowest RMSE, while KNN also had the lowest MAE. The proposed fusion model consistently achieved superior accuracy, yielding the lowest RMSE of 1.810613 m and MAE of 3.7122 m, with a highly efficient prediction time of 0.0040 seconds.
Following the application of PCA, as presented in Table 4, significant improvements in computational efficiency were observed across most classifiers. The DT classifier maintained its extremely fast performance, with training time slightly reduced to 0.0132 seconds and testing time to 0.1060 seconds. Its RMSE improved slightly to 1.8867 m, and MAE to 3.9704 m. The KNN classifier experienced a slight increase in training time to 13.2847 seconds, but its testing time remained comparable at 1.4232 seconds. KNN's RMSE slightly improved to 1.8782 m, and MAE to 3.9376 m. LR saw its training time notably reduced to 4.2626 seconds, while testing time remained exceptionally fast at 0.0030 seconds. Its RMSE slightly improved to 1.8983 m, and MAE to 4.0172 m. The RF classifier also saw a reduction in training time to 0.4475 seconds, and its testing time increased to 0.0102 seconds. RF's RMSE was 2.0370 m, and MAE was 4.6490 m. Consistent with the original feature analysis, the proposed fusion model continued to demonstrate the best overall performance in terms of localization error, achieving the lowest RMSE of 1.8008 m and MAE of 3.6572 m, with an exceptionally fast prediction time of 0.0040 seconds.
This analysis for the "Indoor setting: Office: UESTC" dataset reveals that PCA effectively optimized the computational efficiency for most classifiers, particularly reducing the training times for DT, LR, and RF. Interestingly, KNN's training time slightly increased after PCA, which could be due to the specific characteristics of the PCA transformation interacting with KNN's distance calculations. Despite these varied individual impacts, all individual classifiers maintained competitive localization errors. Critically, the proposed fusion model consistently achieved the lowest localization errors (both RMSE and MAE) in both scenarios (original and PCA-reduced features), as clearly depicted in Table 3 and Table 4. Its prediction time remained highly efficient, making it an ideal choice for real-time indoor localization applications where both accuracy and speed are paramount. The slight improvements in RMSE and MAE for the fusion model after PCA suggest that the dimensionality reduction, while potentially altering individual classifier dynamics, contributed to a more optimized feature representation for the ensemble, further solidifying its superior performance.
The tables provided (Table 6 and Table 7) detail the computational time and localization error for various classifiers (KNN, SVC, LR, RF, and DT in Table 7) and a proposed fusion model, specifically for an "Indoor setting: Library" dataset. The analysis is presented for both original features (Table 6) and after Principal Component Analysis (PCA) application (Table 7), evaluating training/testing times (seconds), RMSE, and MAE (meters). As shown in Table 5, when using the original features, the DT classifier exhibited a training time of 0.3916 seconds and a testing time of 0.0040 seconds, with an RMSE of 2.3866 m and MAE of 7.0434 m. The KNN had an extremely fast training time of 0.0010 seconds but a slower testing time of 0.1671 seconds; its RMSE was 2.3491 m and MAE was 6.8361 m. LR showed a training time of 2.0389 seconds and a very fast testing time of 0.0030 seconds, achieving an RMSE of 2.3327 m and MAE of 6.7628 m. The RF classifier, while requiring the longest training time among individual classifiers at 4.6775 seconds, had a testing time of 0.1270 seconds and demonstrated the lowest individual RMSE of 2.3275 m and MAE of 6.7584 m. Crucially, the Proposed Fusion Model achieved the lowest overall localization errors, with an RMSE of 2.2845 m and an MAE of 6.5865 m, and a highly efficient prediction time of 0.0060 seconds, underscoring the benefits of an ensemble approach.
Following the application of PCA, as presented in Table 7, some distinct shifts in performance were observed. The DT classifier, which was not explicitly listed in Table 6, appears in Table 7 with a training time of 0.5304 seconds and a testing time of 0.0030 seconds. Its RMSE was 2.3866 m and MAE 7.0434 m. It's noteworthy that these error metrics are identical to those of KNN in Table 6, which could suggest an inconsistency in table labeling or data. For KNN in Table 7, training time significantly reduced to 0.0030 seconds, but its testing time increased to 0.4312 seconds. Its RMSE and MAE appear to be 2.3491 m and 6.8361 m, matching the KNN results from Table 6. For LR, training time slightly increased to 2.2078 seconds, while testing time remained fast at 0.0030 seconds, with consistent RMSE and MAE values. RF also saw an increase in training time to 5.7338 seconds and a slight increase in testing time to 0.1369 seconds, while its error metrics remained consistent with its performance on original features. Consistent with its performance on original features, the proposed fusion model continued to provide the most accurate predictions, yielding an RMSE of 2.2845 m and MAE of 6.5865 m, with a slightly increased prediction time of 0.0070 seconds.
The analysis for the "Indoor setting: Library" dataset highlights a consistent trend where the proposed fusion model consistently delivers superior localization accuracy (lowest RMSE and MAE) across both the original and PCA-reduced feature sets, as evident in both Table 6 and Table 6. This robust performance underscores the efficacy of ensemble learning in improving predictive precision regardless of the underlying feature representation. While PCA was applied with the aim of optimizing computational efficiency, its impact varied. For some classifiers (e.g., LR and RF), training times unexpectedly increased after PCA (comparing Table 6 and Table 7), suggesting that the principal components might have introduced new computational complexities for these algorithms, or that the original feature space was already sufficiently low-dimensional. Conversely, KNN's training time remained minimal, but its testing time unexpectedly increased post-PCA in this specific setting. Despite these individual classifier variations, the fusion model consistently maintained efficient prediction times, making it a practical choice for real-time indoor localization applications. The minor discrepancies in classifier identification and error values across the two tables for the same indoor setting warrant careful review, but the overarching conclusion regarding the fusion model's superior accuracy remains consistent.
Experimental results provided in Table 8 and Table 9 detail the computational time and localization error for various classifiers and a proposed fusion model, both with original features and after PCA application for an Indoor Parking: Huawei dataset. The performance is evaluated using training and testing times (in seconds) and localization error metrics (RMSE and MAE in meters). For the original feature set (Table 8), the DT classifier exhibited a significantly high training time of 980.1522 seconds, but a very fast testing time of 0.0940 seconds. Its RMSE was 1.9551 m, and Mean Absolute Error (MAE) was 4.3474 m. The KNN classifier showed remarkably fast training (0.0923 seconds) but a considerably slow testing time (125.1278 seconds), characteristic of lazy learning. KNN's RMSE was 1.8856 m and MAE was 4.0339 m. LR and RF classifiers had moderate training times (199.2367 and 182.9394 seconds, respectively) and efficient testing times (0.2043 and 0.2492 seconds). Among individual classifiers, RF demonstrated the best performance with an RMSE of 1.8269 m and MAE of 3.7951 m. The proposed fusion model significantly outperformed all individual classifiers in terms of accuracy, achieving the lowest RMSE of 1.8043 m and MAE of 3.7186 m, with a very efficient prediction time of 0.1024 seconds.
The application of PCA (Table 9) for dimensionality reduction led to substantial changes in computational times. For DT, training time drastically reduced to 21.6870 seconds, and testing time to 0.0263 seconds. Its RMSE became 2.1431 m and MAE 5.2113 m. KNN's training time remained minimal at 0.0086 seconds, and its testing time saw a significant reduction to 10.3623 seconds. KNN's RMSE was 2.0354 m and MAE 4.6934 m. LR and RF also experienced substantial decreases in training times (7.8969 and 22.1852 seconds, respectively) and remained efficient in testing (0.0224 and 0.1427 seconds). Among individual classifiers, RF again achieved the lowest RMSE of 2.0857 m and MAE of 4.9166 m after PCA. The Proposed Fusion Model consistently maintained its superior performance, yielding the lowest RMSE of 2.0048 m and MAE of 4.5828 m, with a highly efficient prediction time of 0.0504 seconds.
This analysis clearly demonstrates the trade-offs between computational efficiency and localization accuracy. The original feature set, while yielding slightly better individual classifier performance in terms of error (e.g., lower RMSE for RF), came with significantly higher training times for most models, particularly DT. The application of PCA dramatically reduced training and, notably, KNN testing times across all classifiers, indicating its effectiveness in optimizing computational efficiency. However, this reduction in dimensionality generally led to a slight increase in localization errors for individual classifiers. Crucially, the proposed fusion model consistently emerged as the most robust solution. It not only achieved the lowest localization errors (both RMSE and MAE) in both scenarios (original and PCA-reduced features) but also maintained very efficient prediction times. This highlights the substantial benefits of ensemble learning, as the fusion model effectively mitigates the individual weaknesses of base classifiers and leverages their collective strengths, providing superior and more reliable localization accuracy regardless of the feature set complexity. The reduced prediction time of the fusion model after PCA is particularly noteworthy for real-time applications where computational constraints are critical.

Table 7.
Computational Time and Localization Error Analysis with original features.
| Indoor Parking : Huwaei | Computationl Analysis: Error in meters | |||
|---|---|---|---|---|
| Classifiers | Training/Testing (sec) | RMSE (m) | Training/Testing (sec) | MAE (m) |
| DT | 980.1522 (0.0940) | 1.9551 | 978.3586 (0.0519) | 4.3474 |
| KNN | 0.0923 (125.1278) | 1.8856 | 0.0581 (104.1552) | 4.0339 |
| LR | 199.2367 (0.2043) | 2.2591 | 151.3298 (0.1749) | 5.8233 |
| RF | 182.9394 (0.2492) | 1.8269 | 121.6935 (0.2587) | 3.7951 |
| Proposed Fusion Model | — (0.1024) | 1.8043 | — (0.0624) | 3.7186 |
Table 8.
Computational Time and Localization Error Analysis after PCA applied.
| Indoor Parking : Huwaei | Computationl Analysis: Error in meters | |||
|---|---|---|---|---|
| Classifiers | Training/Testing (sec) | MAE (m) | Training/Testing (sec) | RMSE (m) |
| DT | 21.6870 (0.0263) | 5.2113 | 21.0898 (0.0254) | 2.1431 |
| KNN | 0.0086 (10.3623) | 4.6934 | 0.0150 (12.3805) | 2.0354 |
| LR | 7.8969 (0.0224) | 5.4575 | 9.2242 (0.0371) | 2.1376 |
| RF | 22.1852 (0.1427) | 4.9166 | 21.5566 (0.1845) | 2.0857 |
| Proposed Fusion Model | — (0.0504) | 4.5828 | — (0.0570) | 2.0048 |
The provided line graphs in Figure 10 (a) & (b) visualize the RMSE and MAE performance of the proposed fusion model across three distinct indoor scenarios (Huawei, Library, and Office UESTC), evaluated with both original features and after PCA application.
- (a)
-
RMSE of Proposed Fusion Model Across Scenarios and Conditions
- The RMSE graph illustrates the following trends in the Root Mean Square Error (RMSE) of the Proposed Fusion Model:
- Huawei Scenario: The RMSE for the Huawei dataset increases from approximately 1.80 m with original features to around 2.00 m after PCA. This suggests that for this specific indoor parking environment, the dimensionality reduction performed by PCA led to a slight degradation in the model's ability to precisely estimate location, likely due to the loss of some discriminative information.
- Library Scenario: A distinctive plateau is observed for the library dataset, where the RMSE remains constant at approximately 2.28 m for both original features and after PCA. This indicates that for the library environment, PCA did not significantly impact the fusion model's RMSE performance, implying either that the original feature space was already efficiently utilized or that the principal components effectively retained the critical information without introducing further error. This scenario consistently shows the highest RMSE among the three environments.
- Office UESTC Scenario: In contrast to Huawei, the Office UESTC dataset shows a slight decrease in RMSE, moving from approximately 1.81 m with original features to around 1.80 m after PCA. This suggests that for this office environment, PCA might have successfully removed noise or irrelevant features, leading to a marginal improvement in the fusion model's RMSE. The Office UESTC scenario consistently demonstrates the lowest RMSE among the three environments.
- (b)
-
MAE of Proposed Fusion Model Across Scenarios and Conditions
- The MAE graph reveals similar patterns in the Mean Absolute Error (MAE) of the Proposed Fusion Model:
- Huawei Scenario: The MAE for the Huawei dataset also shows an increase from approximately 3.72 m (original) to around 4.58 m (PCA), mirroring the RMSE trend. This reinforces the observation that PCA might have negatively impacted the average absolute error for this environment.
- Library Scenario: Similar to RMSE, the MAE for the Library dataset remains constant at approximately 6.59 m for both original and PCA-applied features. This consistent behavior across both RMSE and MAE further emphasizes that PCA did not alter the fusion model's average absolute error in this setting, which is also the scenario with the highest MAE.
- Office UESTC Scenario: The MAE for the Office UESTC dataset shows a slight decrease from approximately 3.71 m (original) to around 3.66 m (PCA). This aligns with the RMSE trend, suggesting that PCA contributed to a minor reduction in the average absolute error for this office environment. The Office UESTC scenario generally exhibits the lowest MAE.
The analysis of both RMSE and MAE graphs demonstrates the robust performance of the Proposed Fusion Model across diverse indoor localization environments. However, the impact of PCA as a dimensionality reduction technique on the fusion model's accuracy is scenario-dependent.
- For the Huawei dataset, PCA appears to have a detrimental effect on both RMSE and MAE, indicating that the reduced feature set might have lost crucial information, leading to slightly less accurate predictions.
- For the Library dataset, PCA has a neutral effect on the fusion model's localization error metrics, suggesting that the dimensionality reduction neither significantly improved nor degraded performance in terms of accuracy. This particular environment consistently presents the highest errors among the three.
- For the Office UESTC dataset, PCA leads to a marginal improvement in both RMSE and MAE, implying that it might have helped in filtering out noise or redundant features, thus slightly enhancing the model's predictive capability. This environment consistently achieves the lowest errors.
In conclusion, while the proposed fusion model maintains strong performance across all tested indoor environments, the decision to apply PCA as a preprocessing step for localization error reduction should be made on a per-scenario basis. The results indicate that for optimal accuracy with the fusion model, PCA may be beneficial in certain environments (e.g., Office UESTC), neutral in others (e.g., Library), and potentially detrimental in some (e.g., Huawei), underscoring the importance of empirical evaluation for specific deployment contexts.
Figure 11 illustrates the comparative computational time required for training and testing across five localization models—DT, KNN, LR, RF, and the proposed fusion method—under both RMSE- and MAE-based evaluation metrics, using (a) original features and (b) PCA-reduced features. Each model is assessed for four performance aspects: training time (RMSE), testing time (RMSE), training time (MAE), and testing time (MAE). From Figure 8(a), using the original feature space, the KNN classifier exhibits the highest training and testing times, with training times reaching 12.65 seconds (RMSE) and 13.07 seconds (MAE), and testing times at 1.65 seconds (RMSE) and 1.54 seconds (MAE). This is due to the instance-based nature of KNN, where distance calculations are deferred until inference. The Random Forest model has relatively low training and testing times—0.1985 seconds (RMSE) and 0.0094 seconds (RMSE), respectively—making it more suitable for real-time settings. The proposed fusion model demonstrates negligible training time (~0 sec) and low inference time (~0.004 to 0.0052 seconds) under both metrics, affirming its computational efficiency.
In Figure 11 (b), after applying PCA for dimensionality reduction, training and testing times are generally reduced across all models, particularly for Decision Tree and Logistic Regression. For instance, DT's training time decreased from 0.0194 to 0.0132 seconds, and its testing time dropped from 0.1555 to 0.1060 seconds under the RMSE criterion. However, PCA introduced a slight increase in training overhead for Random Forest (from 0.1985 to 0.4475 seconds) and testing time for KNN remained relatively high due to persistent neighborhood computations even in reduced feature space. Notably, the proposed fusion method maintained its advantage across both feature configurations, with consistently minimal training and inference costs, unaffected by the PCA transformation. This reaffirms its suitability for deployment in real-time or resource-constrained indoor localization systems where computational efficiency is critical.
Figure 12 illustrates the comparative performance metrics of four classifiers— DT, KNN, LR, RF—and a Fusion model for the office environment. The grouped bar chart showcases each classifier's Accuracy, F1 Score, Recall, Precision, and Error in meters. From the figure, it is evident that all classifiers exhibit low performance across the metrics, with DT achieving the highest Accuracy at 0.0554 and Precision at 0.0982. KNN follows closely with slightly better performance in F1 Score and Recall. The RF classifier shows the poorest results overall, with an Accuracy of only 0.0503. The Fusion model, intended to combine the strengths of the individual classifiers, fails to improve predictive performance, resulting in an Accuracy of 0.0000 and highlighting the limitations of the approach in this specific context. The Error metrics indicate that all classifiers struggle with localization accuracy, with the Fusion model yielding a minimal error of 1.834229m, which, despite being the lowest, does not translate into effective classification. This analysis underscores the limitations of relying solely on traditional localization error metrics such as RMSE or MAE for performance evaluation. Instead, a multidimensional assessment framework incorporating classification-based metrics—such as Accuracy, Precision, Recall, and F1 Score—provides a more comprehensive understanding of model behavior and predictive reliability. These metrics reveal critical performance variations across models and conditions, underscoring the need for continued optimization and exploration of alternative algorithms to enhance robustness and generalizability in dynamic indoor environments.
Figure 13 depicts a comprehensive comparison of the performance metrics for four individual classifiers and a fusion model for the indoor parking environment, highlighting key metrics such as Accuracy, F1 Score, Recall, and Precision. The grouped bar chart illustrates that KNN outperforms the other classifiers in all metrics, achieving an Accuracy of 0.2282 and a Precision of 0.2602, indicating its effectiveness in correctly classifying instances. Conversely, LR exhibits the poorest performance, with an Accuracy of only 0.0135 and an F1 Score of 0.0051, suggesting significant limitations in its predictive capability. RF demonstrates moderate performance, while DT shows subpar results across the board. Notably, the fusion model fails to enhance classification performance, achieving a mere Accuracy of 0.0101 and minimal values in Precision and F1 Score, which raises concerns about the efficacy of combining classifiers in this context. Importantly, this analysis underscores that multidimensional metrics are vital for evaluating model efficacy; low localization error, as indicated by RMSE and MAE, does not guarantee robust predictive performance across all dimensions. Metrics such as Accuracy, F1 Score, Recall, and Precision can reveal significant differences in model efficiency, emphasizing the need for comprehensive evaluation to ensure effective predictive capability.
Figure 14 illustrates the performance metrics of four classifiers—DT, KNN, LR, and RF—alongside their fusion. The metrics displayed include RMSE, Accuracy, F1 Score, Recall, and Precision. The RMSE values indicate that all classifiers have moderate prediction errors, ranging from approximately 2.30 to 2.37, with RF exhibiting the lowest RMSE, suggesting it provides the most accurate predictions among the individual classifiers. Interestingly, the fusion method shows a slightly better RMSE than some individual classifiers, hinting at potential benefits in combining predictions. However, the accuracy values for all classifiers are relatively low, with RF achieving the highest accuracy at 0.1702, while the fusion method has the lowest accuracy at 0.0247. This indicates that simply averaging the predictions does not effectively enhance overall performance.
The F1 scores mirror the trends observed in accuracy, with RF performing the best at 0.0908. The fusion method's F1 score of 0.0031 suggests it struggles with balancing precision and recall, limiting its effectiveness. Similarly, recall values align closely with accuracy metrics, highlighting RF's ability to identify relevant instances at 0.1702, while the fusion method's low recall of 0.0247 indicates it likely misses many true positive cases, a critical limitation. Finally, precision scores are low across the board, with RF again leading at 0.0649, while the fusion method's precision of 0.0017 raises concerns about the reliability of its positive predictions. The experimental results demonstrate that the RF classifier consistently achieves superior performance across a range of evaluation metrics. However, the relatively weak performance of the fusion strategy emphasizes the need for careful model selection and tuning within ensemble learning frameworks. Importantly, this analysis underscores the value of adopting a multidimensional evaluation approach—beyond conventional localization error metrics such as RMSE or MAE—by incorporating classification-oriented metrics like Accuracy, Precision, Recall, and F1 Score. Such a comprehensive assessment offers deeper insights into model behavior and robustness. These findings highlight the necessity for further investigation into advanced fusion strategies to enhance the collective performance of integrated classifiers, as illustrated in Figure 14.
4.5. Comparison of Localization Performance
This section presents a comparative evaluation of localization performance using the proposed M3-DynaFIPS framework, emphasizing its distinct capability to assess indoor localization systems through a multidimensional performance lens, rather than the conventional reliance on single scalar error metrics. Unlike prior state-of-the-art localization methods that report performance predominantly through metrics such as RMSE or MAE [53,54,55,56,57,58,59,60,61,62,63,64,65], the proposed framework introduces a confidence-weighted probabilistic fusion strategy supported by a multidimensional evaluation paradigm. This includes classification-based metrics (Accuracy, Recall, Precision, and F1 Score), enabling a more holistic and discriminative assessment of system performance in dynamic indoor environments.
- (a)
- Comparative Accuracy Against State-of-the-Art Models
The proposed fusion model was rigorously benchmarked against several well-established and high-performing localization algorithms, including UFL [53], MMSE [54], DFC [55], KWNN [56], MUCUS [57], KAAL [58], LPJT [59], TCA [60], JGSA [61], CDLS [62], ISMA [63], KNN [64], LSTP [64], and TransLoc [65]. These algorithms, as reported in recent literature, typically yield localization errors ranging between 2 to 3.67 meters under various conditions. In contrast, M3-DynaFIPS achieved consistently lower RMSE values across multiple real-world indoor settings:
- Office (UESTC): 1.80 m (after PCA)
- Library (UJI): 2.28 m (constant across preprocessing)
- Indoor Parking (Huawei): 1.80 m (original) and 2.00 m (after PCA)
In particular, the proposed model outperformed UFL [53], which previously reported an RMSE of 2.60 m in the office setting. Compared to advanced alternatives such as LPJT (2.74 m), TCA (3.14 m), CDLS (2.80 m), and KNN (3.67 m), M3-DynaFIPS consistently demonstrated superior localization accuracy, reaffirming its competitive advantage.
- (b)
- Multidimensional Evaluation vs. Single-Metric Paradigms
A critical distinction between the proposed framework and existing methods lies in the evaluation methodology. While all compared models solely report scalar localization errors (e.g., RMSE or MAE) as the primary performance metric, M3-DynaFIPS explicitly challenges this one-dimensional evaluation practice. Our framework:
- Captures classification performance (Accuracy, Precision, Recall, F1 Score);
- Assesses computational efficiency (training/testing time);
- Evaluates robustness under environmental variability;
- Accounts for generalizability and scalability across multiple environments.
This multidimensional assessment reveals a more comprehensive picture of model behavior. Notably, while RMSE values for the fusion model are the lowest across all environments, classification-based metrics uncover performance limitations in some scenarios—such as lower F1 scores in the Library and Office environments—demonstrating that low localization error does not necessarily equate to strong classification performance.
- (c)
- Preprocessing Strategy and Robustness
The framework was utilized PCA to reduce feature dimensionality while retaining 95% of the variance. The comparative analysis shows that PCA contributes to improved computational efficiency and marginally enhances accuracy in structured environments (e.g., Office), while maintaining robustness in more complex signal spaces (e.g., Library). Despite minor trade-offs introduced by dimensionality reduction, the fusion model's performance remains stable, highlighting its resilience to feature transformation and reinforcing the value of the confidence-weighted ensemble design. In summary, the comparative analysis highlights the following key insights:
- The proposed M3-DynaFIPS framework significantly outperforms state-of-the-art methods in terms of localization accuracy across diverse real-world environments.
- It introduces a novel, multidimensional evaluation approach, unlike conventional methods that rely solely on RMSE/MAE.
- PCA-based preprocessing improves computational efficiency with minimal loss in accuracy, particularly suitable for real-time applications.
- The framework exposes latent performance limitations in classifier decision boundaries that would otherwise be overlooked by traditional evaluation metrics.
Together, these results affirm that M3-DynaFIPS is not only more accurate but also more insightful and practically deployable for dynamic, long-term indoor localization applications.
5. Conclusion
The findings of this study underscore the importance of adopting a multidimensional evaluation paradigm for IPSs, particularly in dynamic and heterogeneous indoor settings. Traditional reliance on spatial error metrics—such as RMSE and MAE—offers a limited perspective, often failing to capture the nuanced variations in classifier behavior and predictive reliability under fluctuating signal conditions. While these metrics remain foundational, our results demonstrate that they must be complemented with classification-based metrics to obtain a comprehensive evaluation of system performance. Across all experimental environments, the proposed confidence-weighted probabilistic fusion strategy proved effective in reducing localization errors while maintaining computational efficiency. Notably, the fusion model consistently achieved the lowest RMSE and MAE values across environments, demonstrating its robustness and adaptability. However, classification-based evaluation (Accuracy, Recall, Precision, and F1 Score) revealed deeper performance characteristics—particularly the limitations of the fusion strategy in certain classification tasks, such as in the office and library environments. For instance, low classification metrics despite low RMSE suggest that accurate localization alone does not necessarily imply reliable classification performance.
The dimensionality reduction via PCA further introduced trade-offs: it improved computational efficiency but occasionally led to minor degradation in localization accuracy. This effect was context-dependent, with environments such as the office setting benefiting slightly, while others (e.g., indoor parking) experienced minor losses in accuracy. These observations reinforce the value of the M3-DynaFIPS framework, which allows for context-aware performance evaluation by incorporating both spatial and classification-based metrics.
Ultimately, this study highlights two key implications:
- (1)
- Metric diversity is essential—no single metric can comprehensively capture system performance in dynamic environments.
- (2)
- Fusion strategies require refinement—particularly in balancing error minimization with classification integrity.
Future work should explore adaptive fusion mechanisms that dynamically adjust weights based on classifier reliability across spatial and semantic dimensions. Additionally, incorporating real-time update mechanisms and domain adaptation techniques could further enhance generalizability and long-term performance.
Author Contributions
Conceptualization, T.G.H. and X.G.; Methodology, T.G.H., X.G. and H.S.; Validation, H.S.; Formal analysis, T.G.H. and H.S. All authors have read and agreed to the published version of the manuscript.
Funding
This work was supported by the National Natural Science Foundation of China under Grant No. 62171086.
Institutional Review Board Statement
Not applicable.
Informed Consent Statement
Not applicable.
Data Availability Statement
The dataset used for this study are available upon request to the corresponding author.
Conflicts of Interest
The authors declare no conflicts of interest.
References
- Tesfay, G.H.; Guo, X.; Si, H.; Li, L.; Zhang, Y. Indoor Positioning Systems as Critical Infrastructure: A Trade-off Analysis for Enhanced Location-Based Services. Sensors 2025, 25. [Google Scholar]
- Mautz, R. (2012). Indoor Positioning Technologies: A Survey. ETH Zurich. [CrossRef]
- Van Haute, T.; De Poorter, E.; Crombez, P.; Lemic, F.; Handziski, V.; Wirström, N.; Wolisz, A.; Voigt, T.; Moerman, I. Performance analysis of multiple Indoor Positioning Systems in a healthcare environment. International journal of health geographics. 2016, 15, 1–5. [Google Scholar] [CrossRef]
- Alarifi, A.; Al-Salman, A.; Alsaleh, M.; Alnafessah, A.; Al-Hadhrami, S.; Al-Ammar, M.A.; Al-Khalifa, H.S. Ultra Wideband Indoor Positioning Technologies: Analysis and Recent Advances. Sensors 2016, 16, 707. [Google Scholar] [CrossRef]
- Hailu, T.G.; Guo, X.; Si, H.; Li, L.; Zhang, Y. Theories and Methods for Indoor Positioning Systems: A Comparative Analysis, Challenges, and Prospective Measures. Sensors 2024, 24, 6876. [Google Scholar] [CrossRef]
- Zafari, F.; Gkelias, A.; Leung, K.K. A Survey of Indoor Localization Systems and Technologies. IEEE Communications Surveys & Tutorials 2019, 21, 2568–2599. [Google Scholar] [CrossRef]
- Gu, Y.; Lo, A.; Niemegeers, I. A survey of indoor positioning systems for wireless personal networks. IEEE Communications surveys & tutorials. 2009, 11, 13–32. [Google Scholar]
- Xiao, J.; Wu, K.; Yi, Y.; Ni, L.M. FIFS: Fine-grained Indoor Fingerprinting System. IEEE Transactions on Mobile Computing 2016, 15, 1176–1189. [Google Scholar]
- Guvenc, I.; Chong, C.C. A Survey on TOA Based Wireless Localization and NLOS Mitigation Techniques. IEEE Communications Surveys & Tutorials 2009, 11, 107–124. [Google Scholar] [CrossRef]
- Mautz, R. Overview of current indoor positioning systems. Geodezija ir kartografija. 2009, 35, 18–22. [Google Scholar] [CrossRef]
- Agualimpia-Arriaga, C.; Govindasamy, S.; Soni, B.; Páez-Rueda, C.I.; Fajardo, A. RSSI-Based Indoor Localization Using Machine Learning for Wireless Sensor Networks: A Recent Review. 2024 IEEE ANDESCON. 2024 Sep 11:1-6.
- He, S.; Chan, S.H. Wi-Fi fingerprint-based indoor positioning: Recent advances and comparisons. IEEE Communications Surveys & Tutorials. 2015, 18, 466–90. [Google Scholar]
- Hossain, A.K.M.M.; Soh, W.-S.; Kim, H.S. (2007). Indoor localization using multiple wireless technologies. IEEE International Conference on Mobile Adhoc and Sensor Systems, 1–8. [CrossRef]
- Diallo, A.; Garbinato, B. A Framework for Devising, Evaluating and Fine-tuning Indoor Tracking Algorithms. arXiv 2025. [CrossRef]
- Yang, T.; Cabani, A.; Chafouk, H. A survey of recent indoor localization scenarios and methodologies. Sensors. 2021, 21, 8086. [Google Scholar] [CrossRef]
- Bamdad, M.; Hutter, H.P.; Darvishy, A. InCrowd-VI: A Realistic Visual–Inertial Dataset for Evaluating Simultaneous Localization and Mapping in Indoor Pedestrian-Rich Spaces for Human Navigation. Sensors. 2024, 24, 8164. [Google Scholar] [CrossRef] [PubMed]
- Bahl, P.; Padmanabhan, V.N. RADAR: An In-Building RF-Based User Location and Tracking System. Proc. IEEE INFOCOM, 2000, pp. 775–784.
- Naser, R.S.; Lam, M.C.; Qamar, F.; Zaidan, B.B. Smartphone-based indoor localization systems: A systematic literature review. Electronics. 2023, 12, 1814. [Google Scholar] [CrossRef]
- He, H.; Garcia, E.A. Learning from imbalanced data. IEEE Transactions on knowledge and data engineering. 2009, 21, 1263–84. [Google Scholar]
- Patwari, N.; et al. Locating the Nodes: Cooperative Localization in Wireless Sensor Networks. IEEE Signal Processing Mag. 2005, 22, 54–69. [Google Scholar] [CrossRef]
- Sokolova, M.; Lapalme, G. A systematic analysis of performance measures for classification tasks. Information processing & management. 2009, 45, 427–37. [Google Scholar]
- Saito, T.; Rehmsmeier, M. The precision-recall plot is more informative than the ROC plot when evaluating binary classifiers on imbalanced datasets. PloS one. 2015, 10, e0118432. [Google Scholar] [CrossRef]
- King, T.; et al. COMPASS: A Probabilistic Indoor Positioning System Based on 802.11 and Digital Compasses. Proc. 1st Int. Workshop Wireless Network Testbeds, Experimental Evaluation, Characterization, 2006, pp. 34–40.
- Yang, J.; Chen, Y. Indoor Localization Using Improved RSS-Based Lateration Methods. *Proc. IEEE Globecom, 2009, pp. 1–6.
- Brena, R.F.; García-Vázquez, J.P.; Galván-Tejada, C.E.; Muñoz-Rodriguez, D.; Vargas-Rosales, C.; Fangmeyer, J., Jr. Evolution of indoor positioning technologies: A survey. Journal of Sensors. 2017, 2017, 2630413. [Google Scholar] [CrossRef]
- Liu, H.; Darabi, H.; Banerjee, P.; Liu, J. Survey of wireless indoor positioning techniques and systems. IEEE Transactions on Systems, Man, and Cybernetics, Part C (Applications and Reviews). 2007, 37, 1067–80. [Google Scholar] [CrossRef]
- Alhomayani, F.; Mahoor, M.H. Deep learning methods for fingerprint-based indoor positioning: A review. Journal of Location Based Services. 2020, 14, 129–200. [Google Scholar] [CrossRef]
- Ma, Z.; Shi, K. Few-Shot learning for WiFi fingerprinting indoor positioning. Sensors. 2023, 23, 8458. [Google Scholar] [CrossRef]
- Mühl, M.; Hassen, W.F. Deep learning based indoor positioning approach using Wi-Fi CSI/RSSI fingerprints technique. UBICOMM. 2019.
- Beigi, A.; Shah-Mansouri, V. An intelligent indoor positioning algorithm based on Wi-Fi and Bluetooth Low Energy. arXiv 2023. [CrossRef]
- Liu, J.; Li, X.; Jin, W. Energy-efficient Indoor Localization Based on the Integration of Crowdsensing and Compressive Sensing. IEEE Transactions on Mobile Computing 2019, 18, 1619–1633. [Google Scholar]
- Kim, S.; Park, J. Crowdsourced Dynamic Fingerprinting Indoor Positioning System Using Wi-Fi and Bluetooth Low Energy. IEEE Access 2021, 9, 106167–106179. [Google Scholar]
- Huang, H.; Chen, L.; Zhang, J. Hybrid Dynamic Fingerprint Updating for Indoor Localization Using Machine Learning. IEEE Sensors Journal 2021, 21, 20399–20410. [Google Scholar]
- Bahl, P.; Padmanabhan, V.N. RADAR: An In-building RF-based User Location and Tracking System. Proceedings of IEEE INFOCOM 2000, vol. 2, pp. 775–784, Mar. 2000.
- Tang, Z.; Gu, R.; Li, S.; Kim, K.S.; Smith, J.S. Static vs. dynamic databases for indoor localization based on Wi-Fi fingerprinting: A discussion from a data perspective. In2024 International Conference on Artificial Intelligence in Information and Communication (ICAIIC) 2024 Feb 19 (pp. 760–765). IEEE.
- Kushki, A.; Plataniotis, K.N.; Venetsanopoulos, A.N. Kernel-based Positioning in Wireless Local Area Networks. IEEE Transactions on Mobile Computing 2007, 6, 689–705. [Google Scholar] [CrossRef]
- Feng, C.; Au, W.S.A.; Valaee, S.; Tan, Z. Received-Signal-Strength-Based Indoor Positioning Using Compressive Sensing. IEEE Transactions on Mobile Computing 2012, 11, 1983–1993. [Google Scholar] [CrossRef]
- Jiao, J.; Wang, X.; Han, C.; Huang, Y.; Zhang, Y. Dynamic Indoor Fingerprinting Localization based on Few-Shot Meta-Learning with CSI Images. arXiv arXiv:2401.05711, 2024.
- Yang, Z.; Zhou, Z.; Liu, Y. From RSSI to CSI: Indoor Localization via Channel Response. ACM Computing Surveys 2014, 46, 1–32. [Google Scholar] [CrossRef]
- Zafari, F.; Gkelias, A.; Leung, K.K. A Survey of Indoor Localization Systems and Technologies. IEEE Communications Surveys & Tutorials 2019, 21, 2568–2599. [Google Scholar] [CrossRef]
- Rai, A.; Chintalapudi, K.; Padmanabhan, V.N.; Sen, R. Zee: Zero-effort crowdsourcing for indoor localization. Proc. ACM MobiCom, pp. 293–304, Aug. 2012.
- Dai, S.; He, L.; Zhang, X. Autonomous WiFi fingerprinting for indoor localization. arXiv 2019. [CrossRef]
- Mutz, D.; Truthmann, L.; Züfle, A. A precise and scalable indoor positioning system using cross-floor knowledge distillation. Sensors 2022, 20. [Google Scholar]
- Shu, Y.; Zhang, Y.; Cheng, P.; Chen, J.; Shin, K.G. iUpdater: Low-cost RSS fingerprints updating for device-free localization. Proc. IEEE ICDCS, pp. 1–10, Jun. 2017.
- Pany, T.K.; Iglesias, M.O.; Prevot, J.C. Comparing and evaluating indoor positioning techniques through the IPIN/EvAAL benchmarking framework. Sensors 2017, 17, 2327. [Google Scholar]
- Tesfay, G.H.; Guo, X.; Si, H.; Li, L.; Zhang, Y. WELoc: Error-Weighted Probabilistic Fusion for Wi-Fi Indoor Localization: Comparing Data Reduction Methods. Sensors 2025, 25. [Google Scholar]
- Hailu, T.; Edris, T. MultiDMet: Designing a Hybrid Multidimensional Metrics Framework to Predictive Modeling for Performance Evaluation and Feature Selection. Intelligent Information Management 2023, 15, 391–425. [Google Scholar] [CrossRef]
- Mendoza-Silva, G.; Richter, P.; Torres-Sospedra, J.; Lohan, E.; Huerta, J. Long-term WiFi fingerprinting dataset for research on robust indoor positioning.
- Hailu, T.G.; Guo, X.; Si, H.; Li, L.; Zhang, Y. Ada-LT IP: Functional Discriminant Analysis of Feature Extraction for Adaptive Long-Term Wi-Fi Indoor Localization in Evolving Environments. Sensors 2024, 24, 5665. [Google Scholar] [CrossRef]
- Gidey, H.T.; Guo, X.; Zhong, K.; Li, L.; Zhang, Y. OHetTLAL: An Online Transfer Learning Method for Fingerprint-Based Indoor Positioning. Sensors 2022, 22, 9044. [Google Scholar] [CrossRef]
- Gidey, H.T.; Guo, X.; Zhong, K.; Li, L.; Zhang, Y. Data Fusion Methods for Indoor Positioning Systems Based on Channel State Information Fingerprinting. Sensors 2022, 22, 8720. [Google Scholar] [CrossRef]
- Gidey, H.T.; Guo, X.; Li, L.; Zhang, Y. Heterogeneous Transfer Learning for Wi-Fi Indoor Positioning Based Hybrid Feature Selection. Sensors 2022, 22, 5840. [Google Scholar] [CrossRef]
- Guo, X.; Zhu, S.; Li, L.; Hu, F.; Ansari, N. Accurate WiFi localization by unsupervised fusion of extended candidate location set. IEEE Internet Things J. 2018, 6, 2476–2485. [Google Scholar] [CrossRef]
- Gwon, Y.; Jain, R.; Kawahara, T. Robust indoor location estima tion of stationary and mobile users. in Proc. IEEE INFOCOM, 2004, pp. 1032–1043.
- Fang, S.-H.; Hsu, Y.-T.; Kuo, W.-H. Dynamic fingerprinting com bination for improved mobile localization. IEEE Trans. Wireless Commun. 2011, 10, 4018–4022. [Google Scholar] [CrossRef]
- Li, B.; Wang, Y.; Lee, H.K.; Dempster, A.; Rizos, C. Method for yielding a database of location fingerprints in WLAN. Proc. Inst. Elect. Eng.—Commun. 2005, 152, 580–586. [Google Scholar] [CrossRef]
- Guo, X.; Ansari, N. Localization by fusing a group of fingerprints via multiple antennas in indoor environment. IEEE Trans. Veh. Technol. 2017, 66, 9904–9915. [Google Scholar] [CrossRef]
- Guo, X.; Li, L.; Ansari, N.; Liao, B. Knowledge aided adaptive localization via global fusion profile. IEEE Internet Things J. 2018, 5, 1081–1089. [Google Scholar] [CrossRef]
- Li, J.; Jing, M.; Lu, K.; Zhu, L.; Shen, H.T. Locality preserving joint transfer for domain adaptation. IEEE Trans. Image Process. 2019, 28, 6103–6115. [Google Scholar] [CrossRef]
- Pan, S.J.; Tsang, I.W.; Kwok, J.T.; Yang, Q. Domain adaptation via transfer component analysis. IEEE Trans. Neural Netw. 2010, 22, 199–210. [Google Scholar] [CrossRef] [PubMed]
- Zhang, J.; Li, W.; Ogunbona, P. Joint geometrical and statistical alignment for visual domain adaptation. in Proc. IEEE Conf. Comput. Vis. Pattern Recognit. (CVPR), Jul. 2017, pp. 1859–1867.
- Tsai, Y.-H.-H.; Yeh, Y.-R.; Wang, Y.-C.-F. Learning cross-domain landmarks for heterogeneous domain adaptation. in Proc. IEEE Conf. Comput. Vis. Pattern Recognit. (CVPR), Jun. 2016, pp. 5081 5090.
- Zhou, M.; Tang, Y.; Tian, Z.; Xie, L.; Nie, W. Robust neighbor-hood graphing for semi-supervised indoor localization with light-loaded location fingerprinting. IEEE Internet Things J. 2017, 5, 3378–3387. [Google Scholar] [CrossRef]
- Li, L.; Guo, X.; Zhang, Y.; Ansari, N.; Li, H. Long short-term indoor positioning system via evolving knowledge transfer. IEEE Trans. Wirel. Commun. 2022, 21, 5556–5572. [Google Scholar] [CrossRef]
- Li, L.; Guo, X.; Zhao, M.; Li, H.; Ansari, N. TransLoc: A heterogeneous knowledge transfer framework for fingerprint-based indoor localization. IEEE Trans. Wirel. Commun. 2021, 20, 3628–3642. [Google Scholar] [CrossRef]
Figure 1.
Library Environment: (a) a picture of the 3rd floor collection area that shows the bookshelves and the stairs that connect the two floors; and (b)the network devices close to the collection area. The red asterisks represent the 3rd floor’s devices, and blue asterisks represent 5th floor’s devices [48].
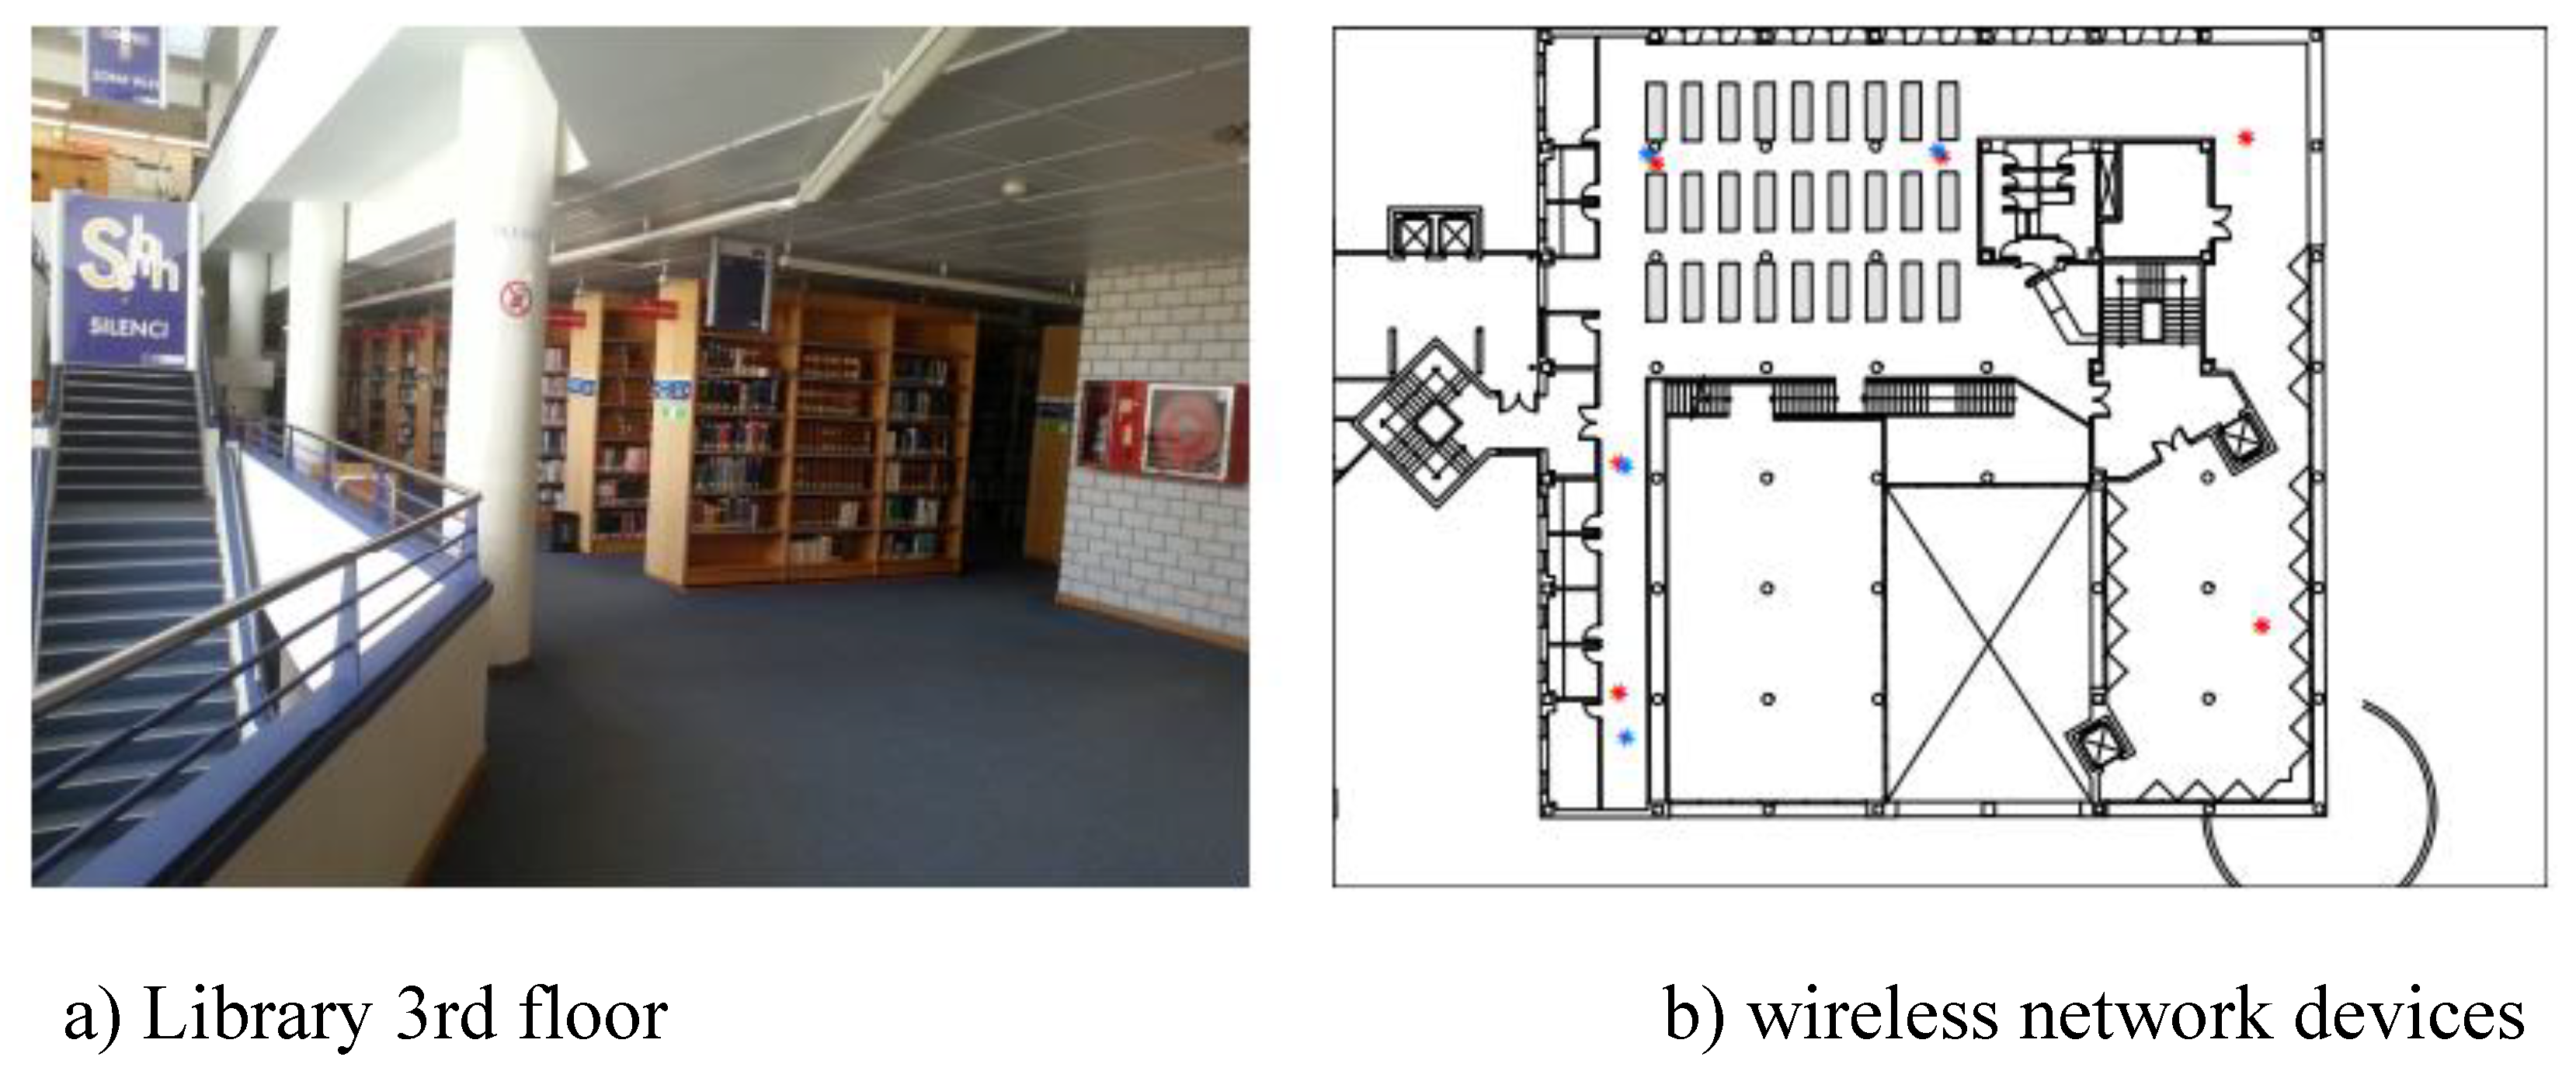
Figure 2.
Experimental layout with reference points and Wi-Fi APs on the 21st floor of UESTC.
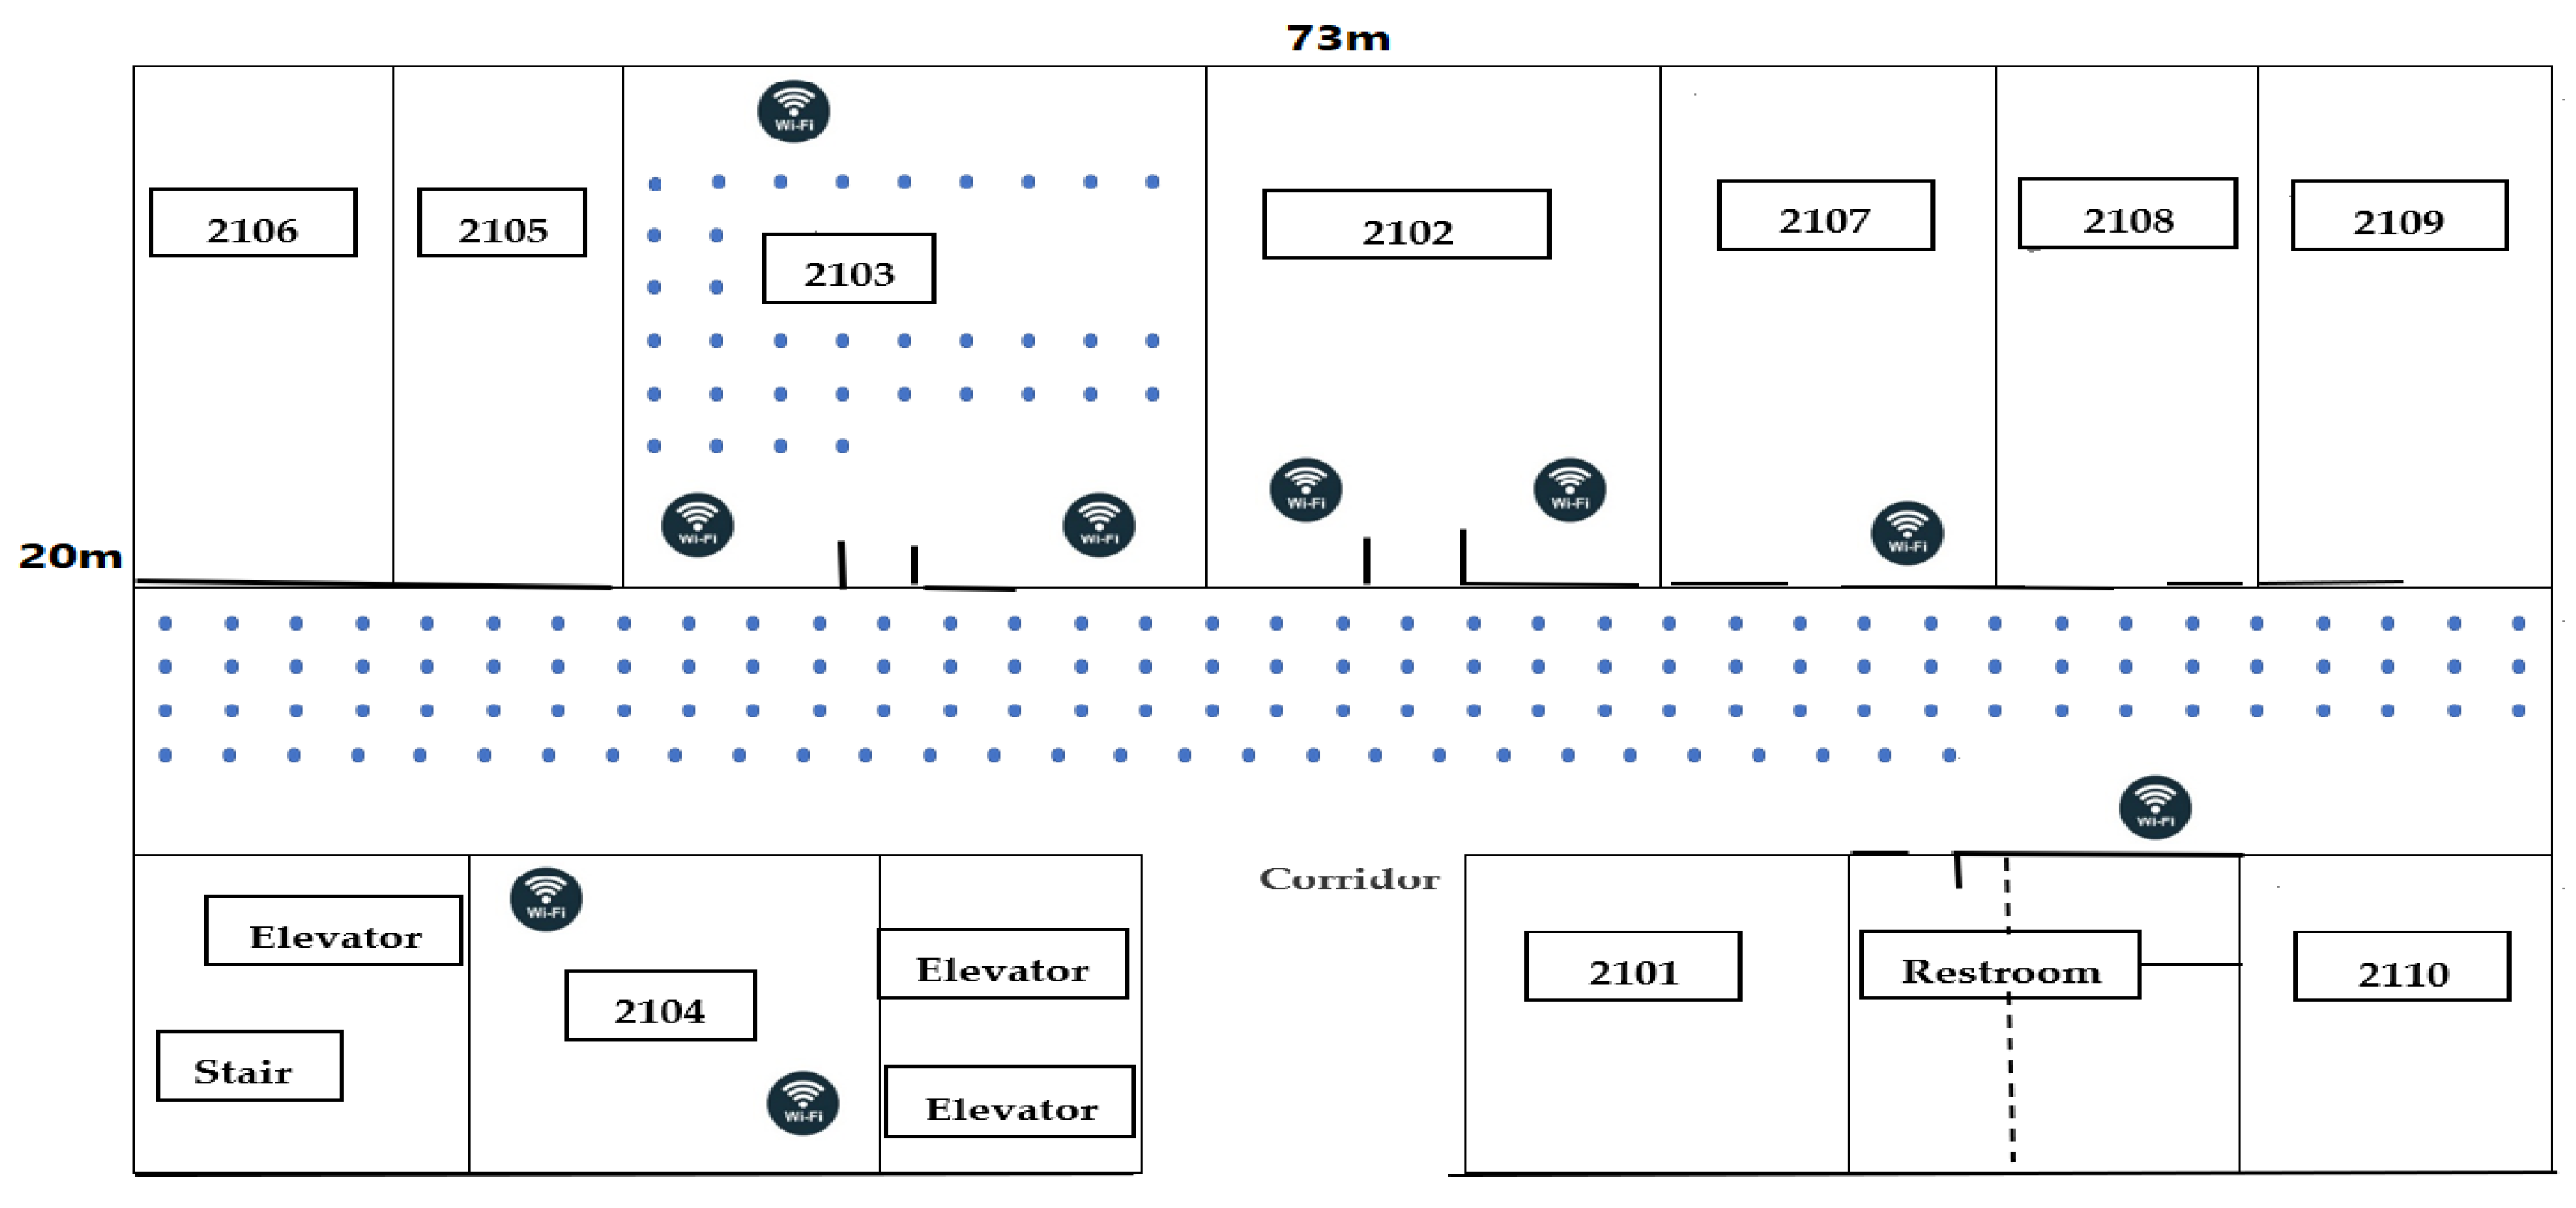
Figure 2.
Experimental layout conducted at Huawei company for indoor parking-based CSI fingerprints.
Figure 2.
Experimental layout conducted at Huawei company for indoor parking-based CSI fingerprints.
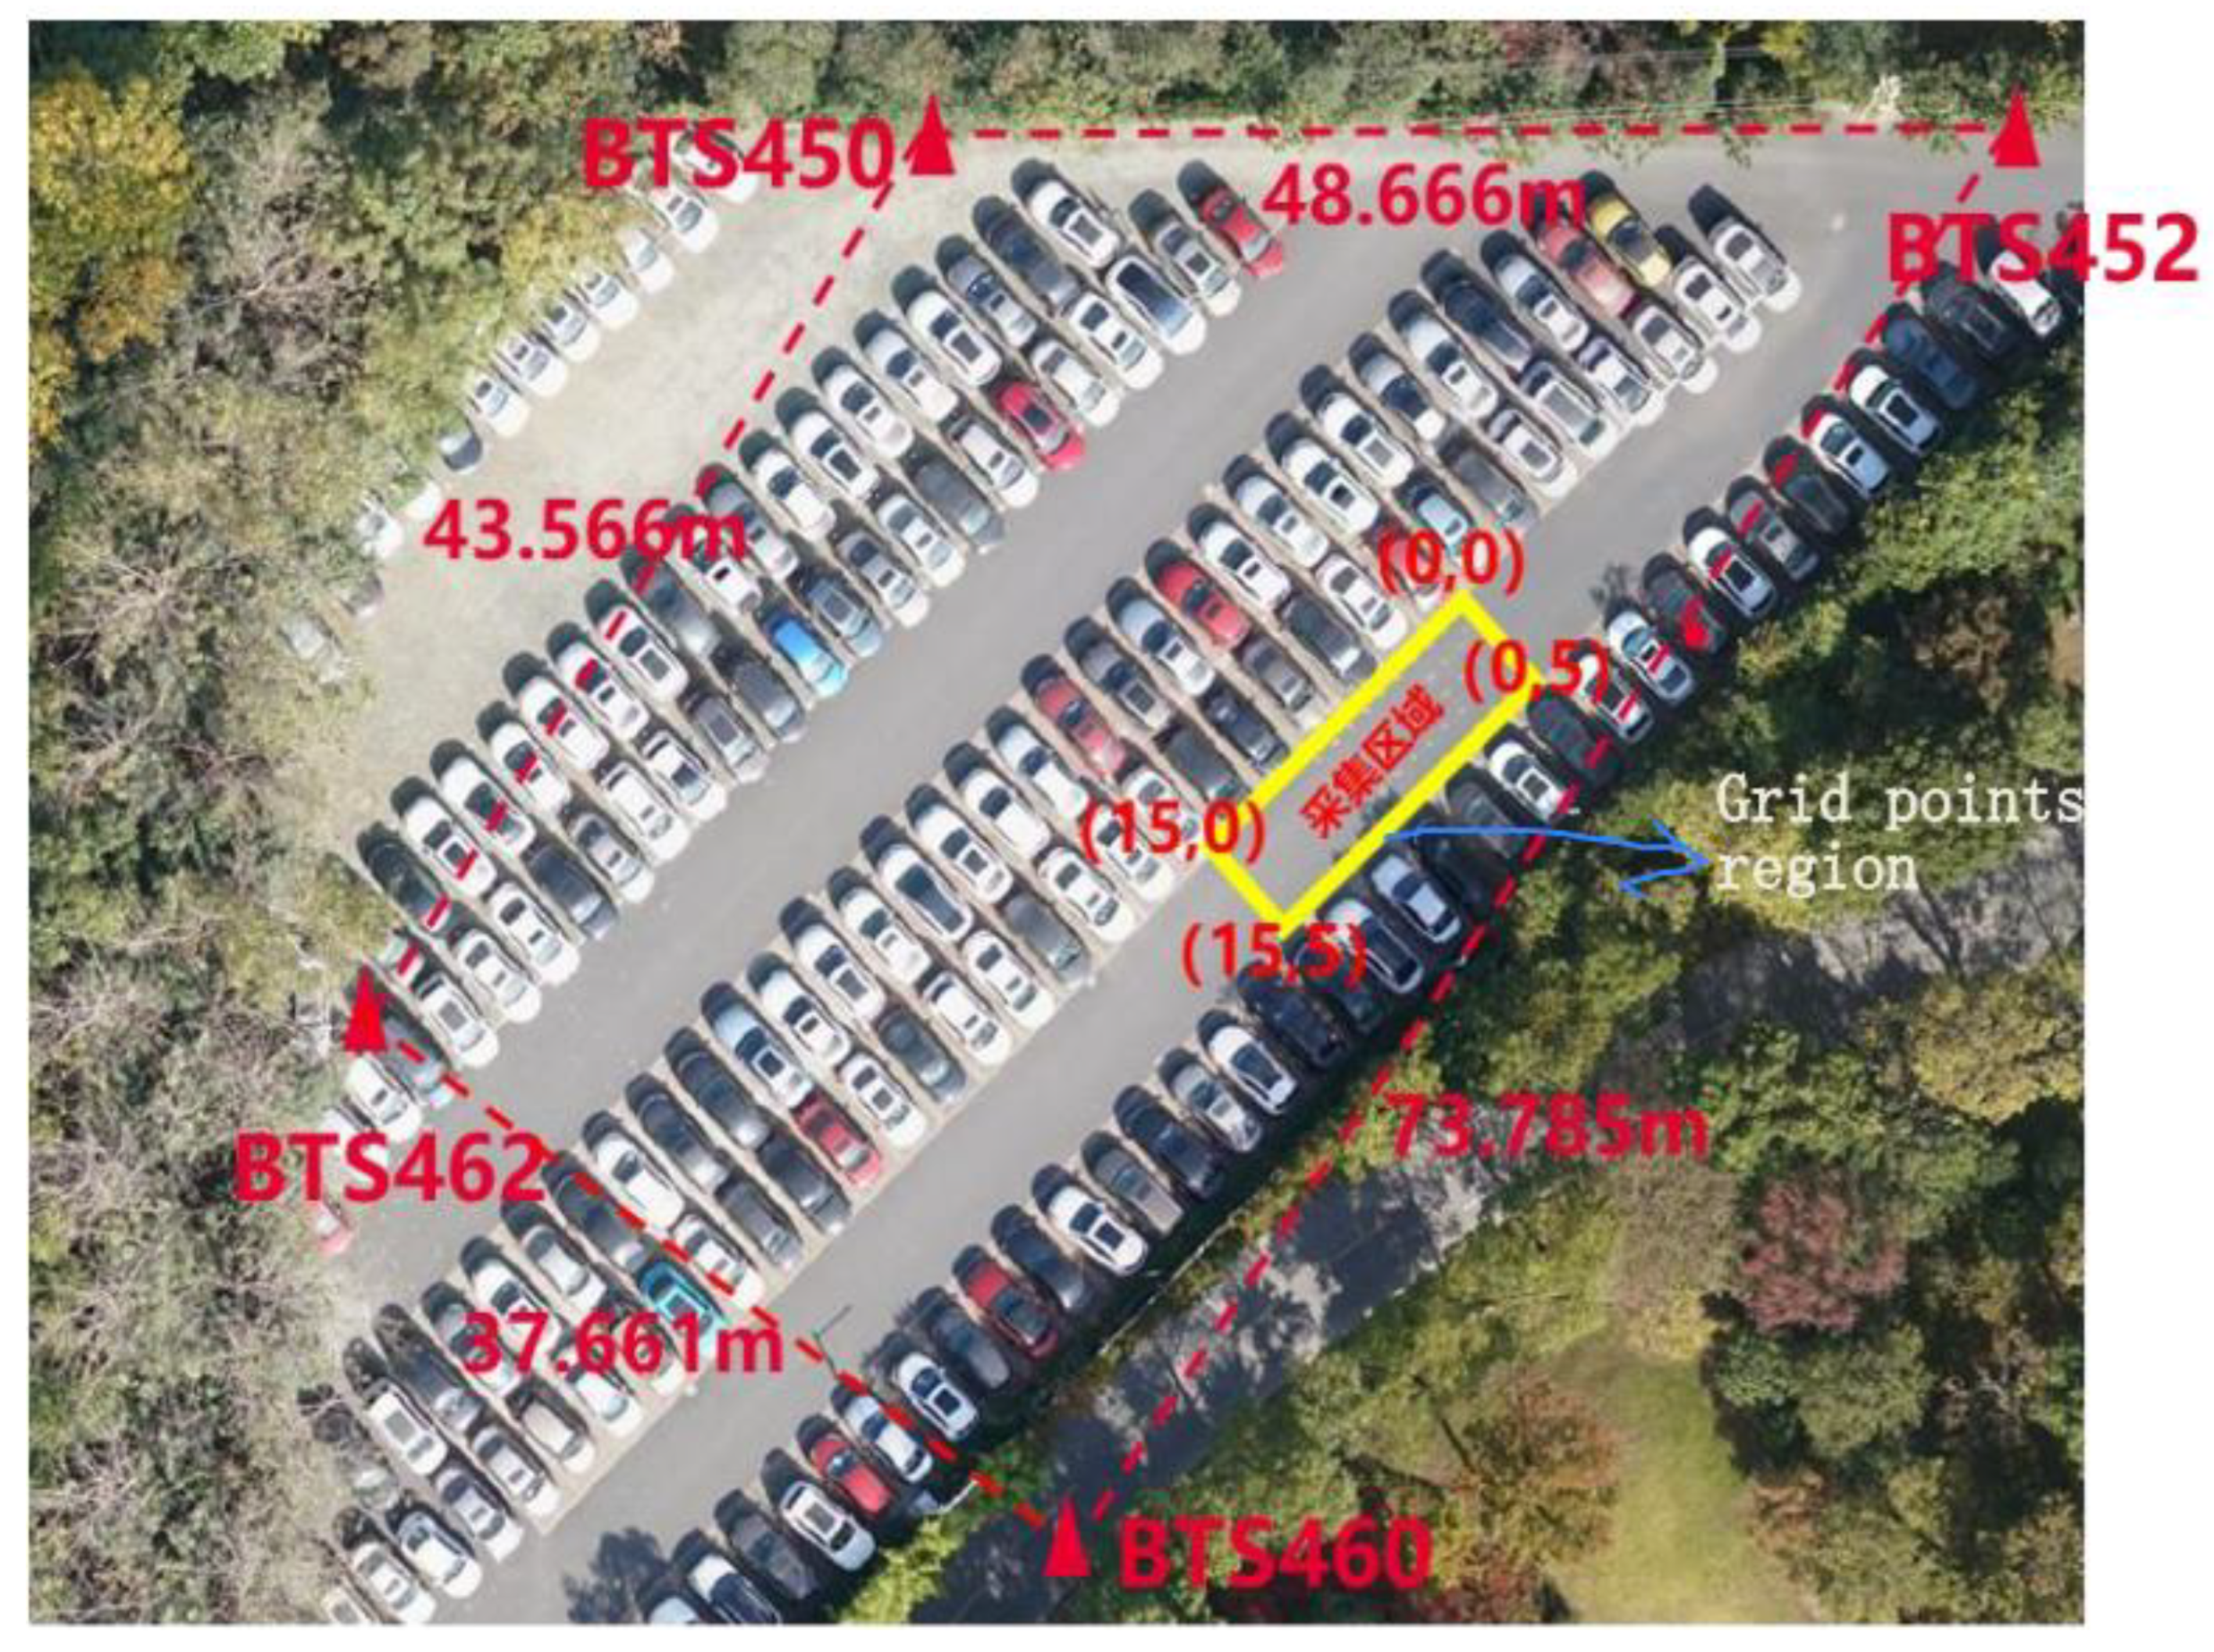
Figure 3.
Distribution of the reference points for generating CSI-based fingerprints during September and October 2020.
Figure 3.
Distribution of the reference points for generating CSI-based fingerprints during September and October 2020.
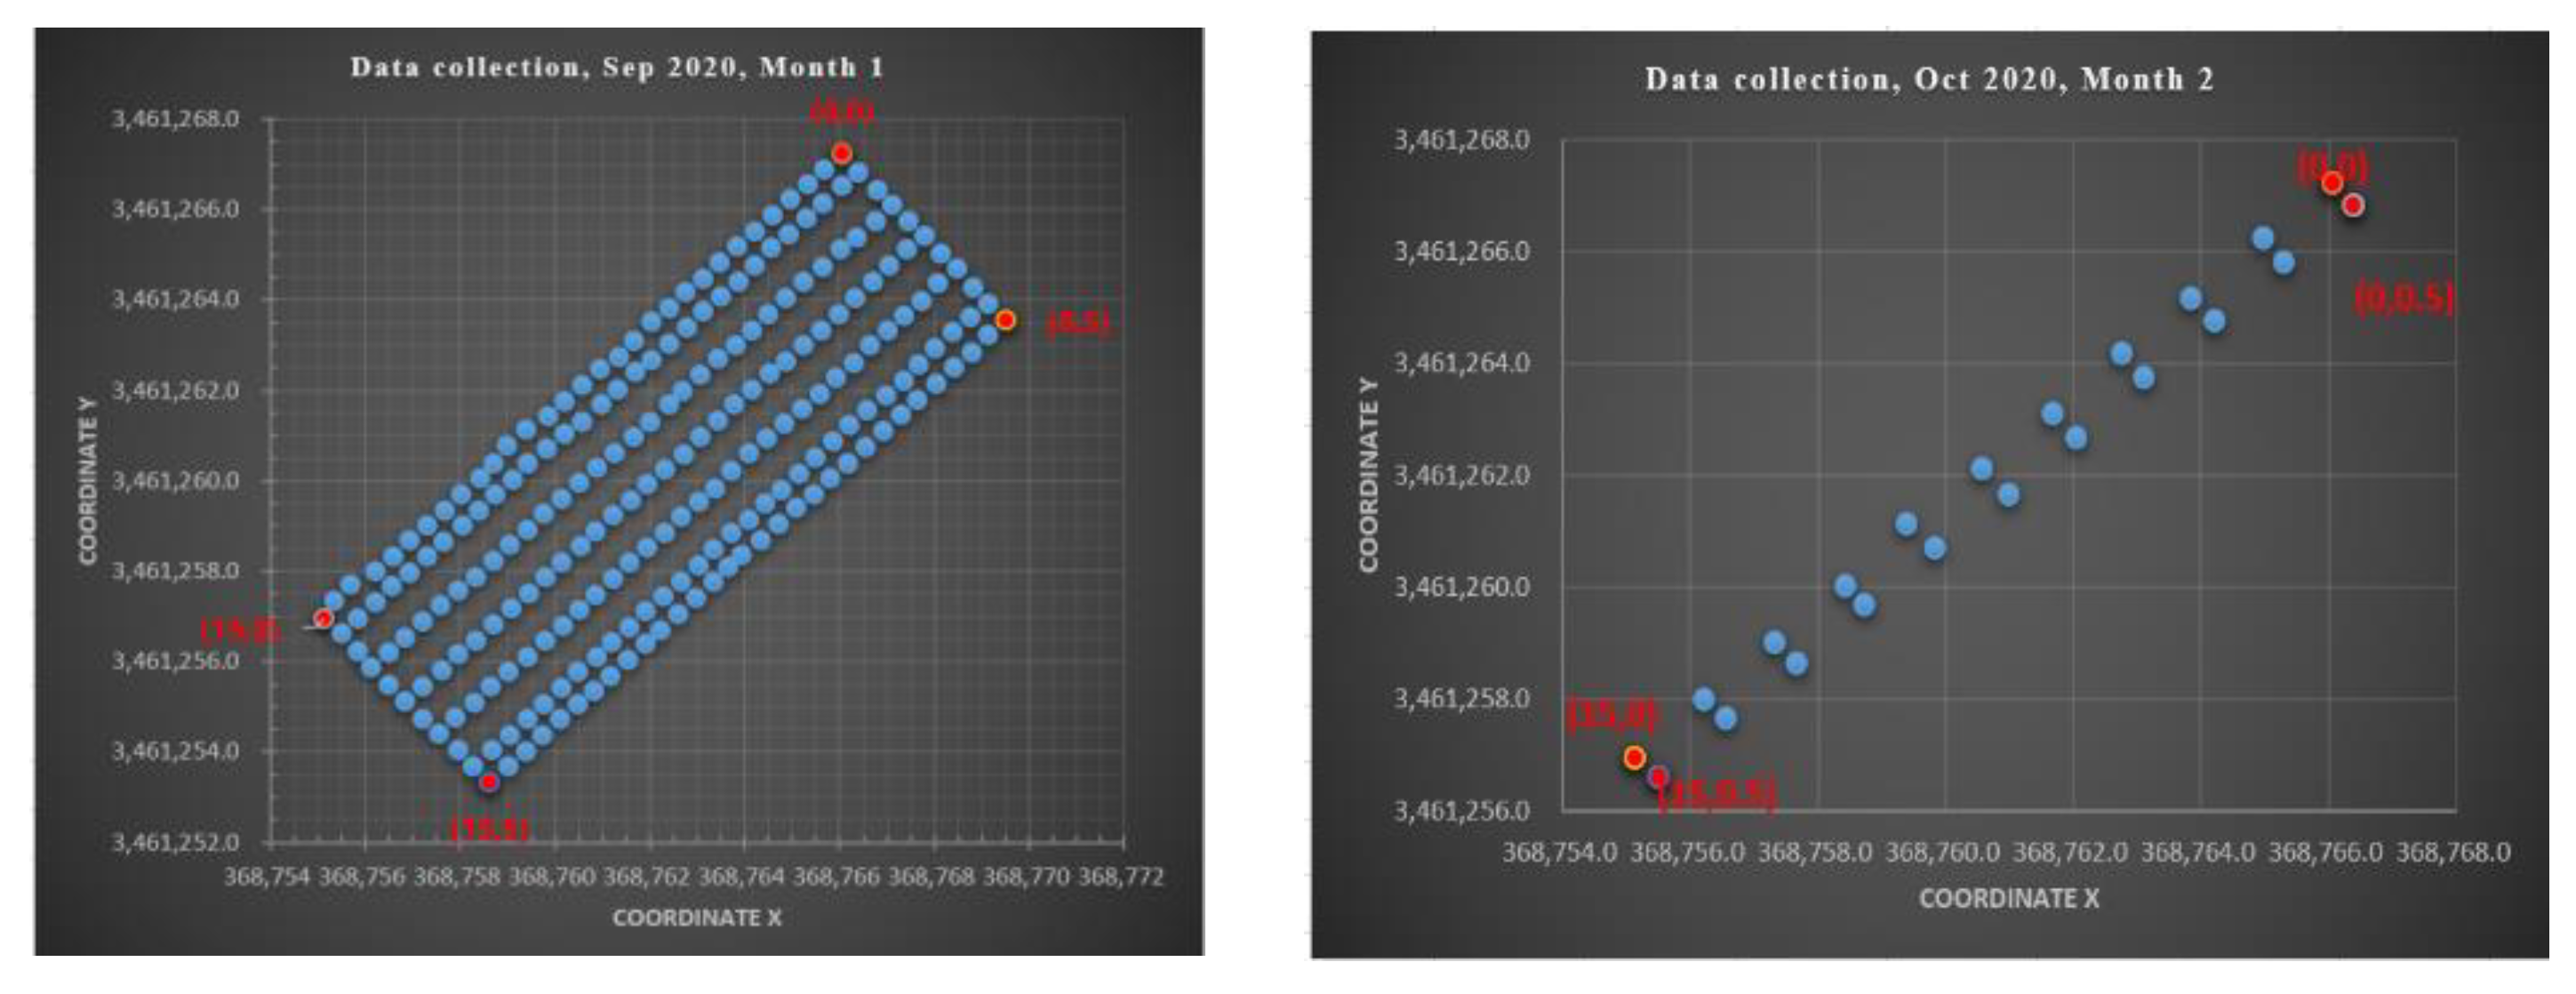
Figure 4.
Comparison of RMSE and MAE for Office Environment (Original vs PCA).
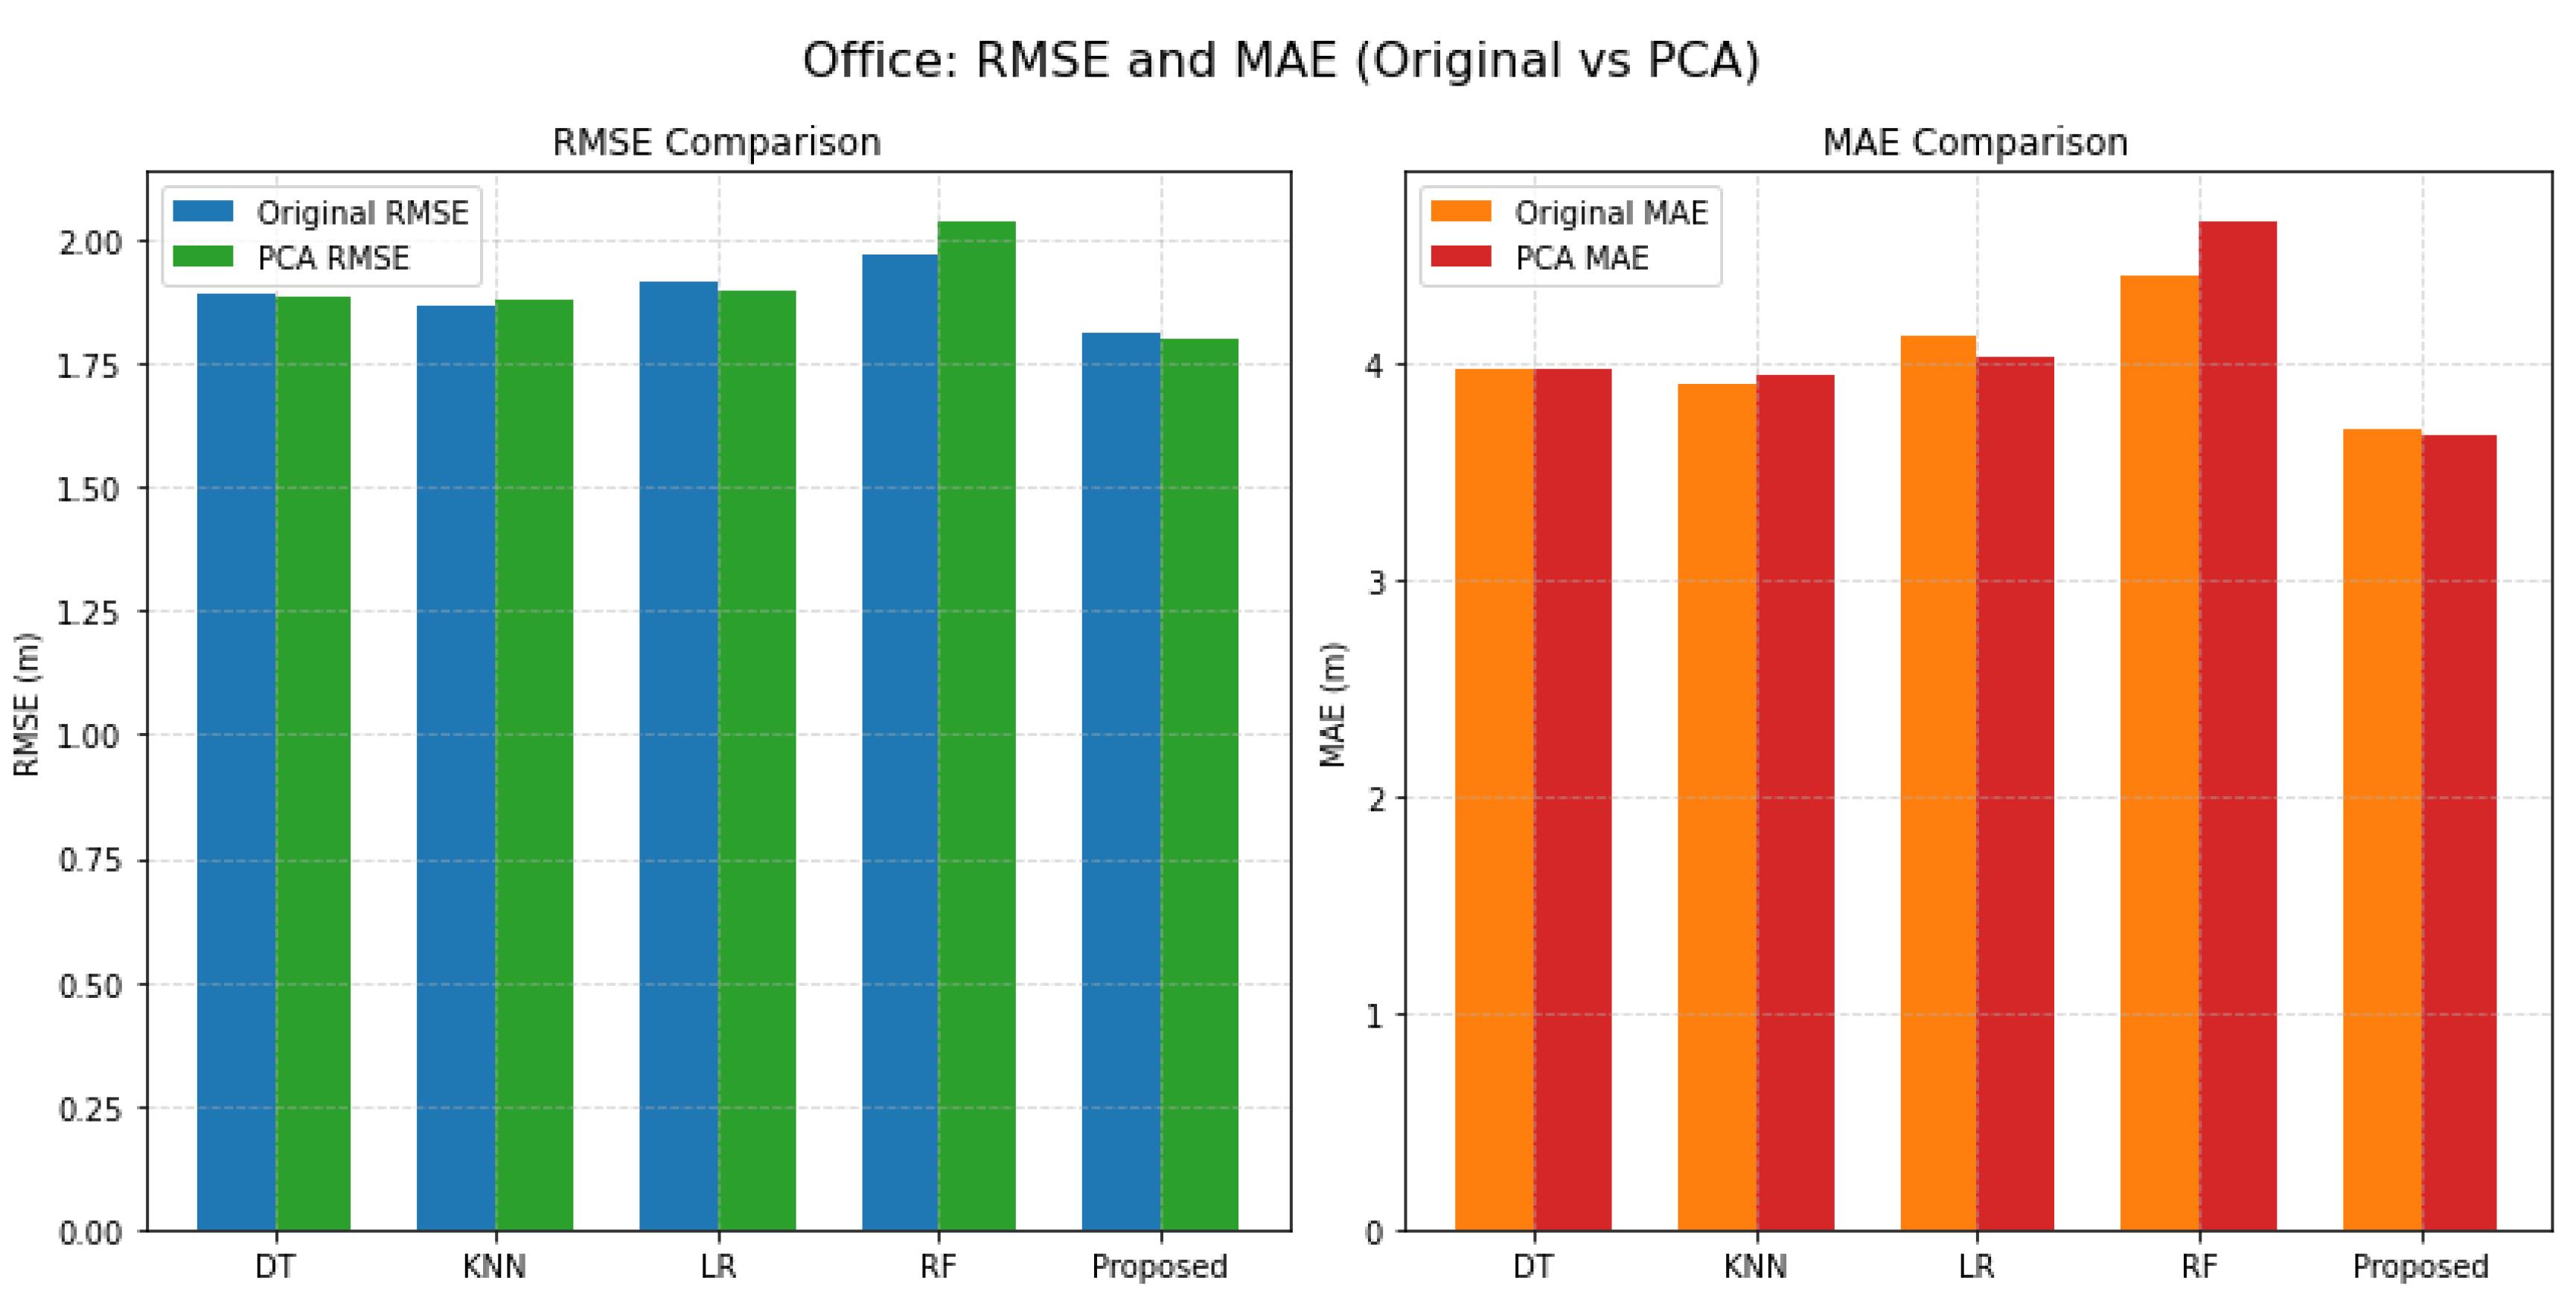
Figure 5.
Comparison of RMSE and MAE for Huawei Environment (Original vs PCA).
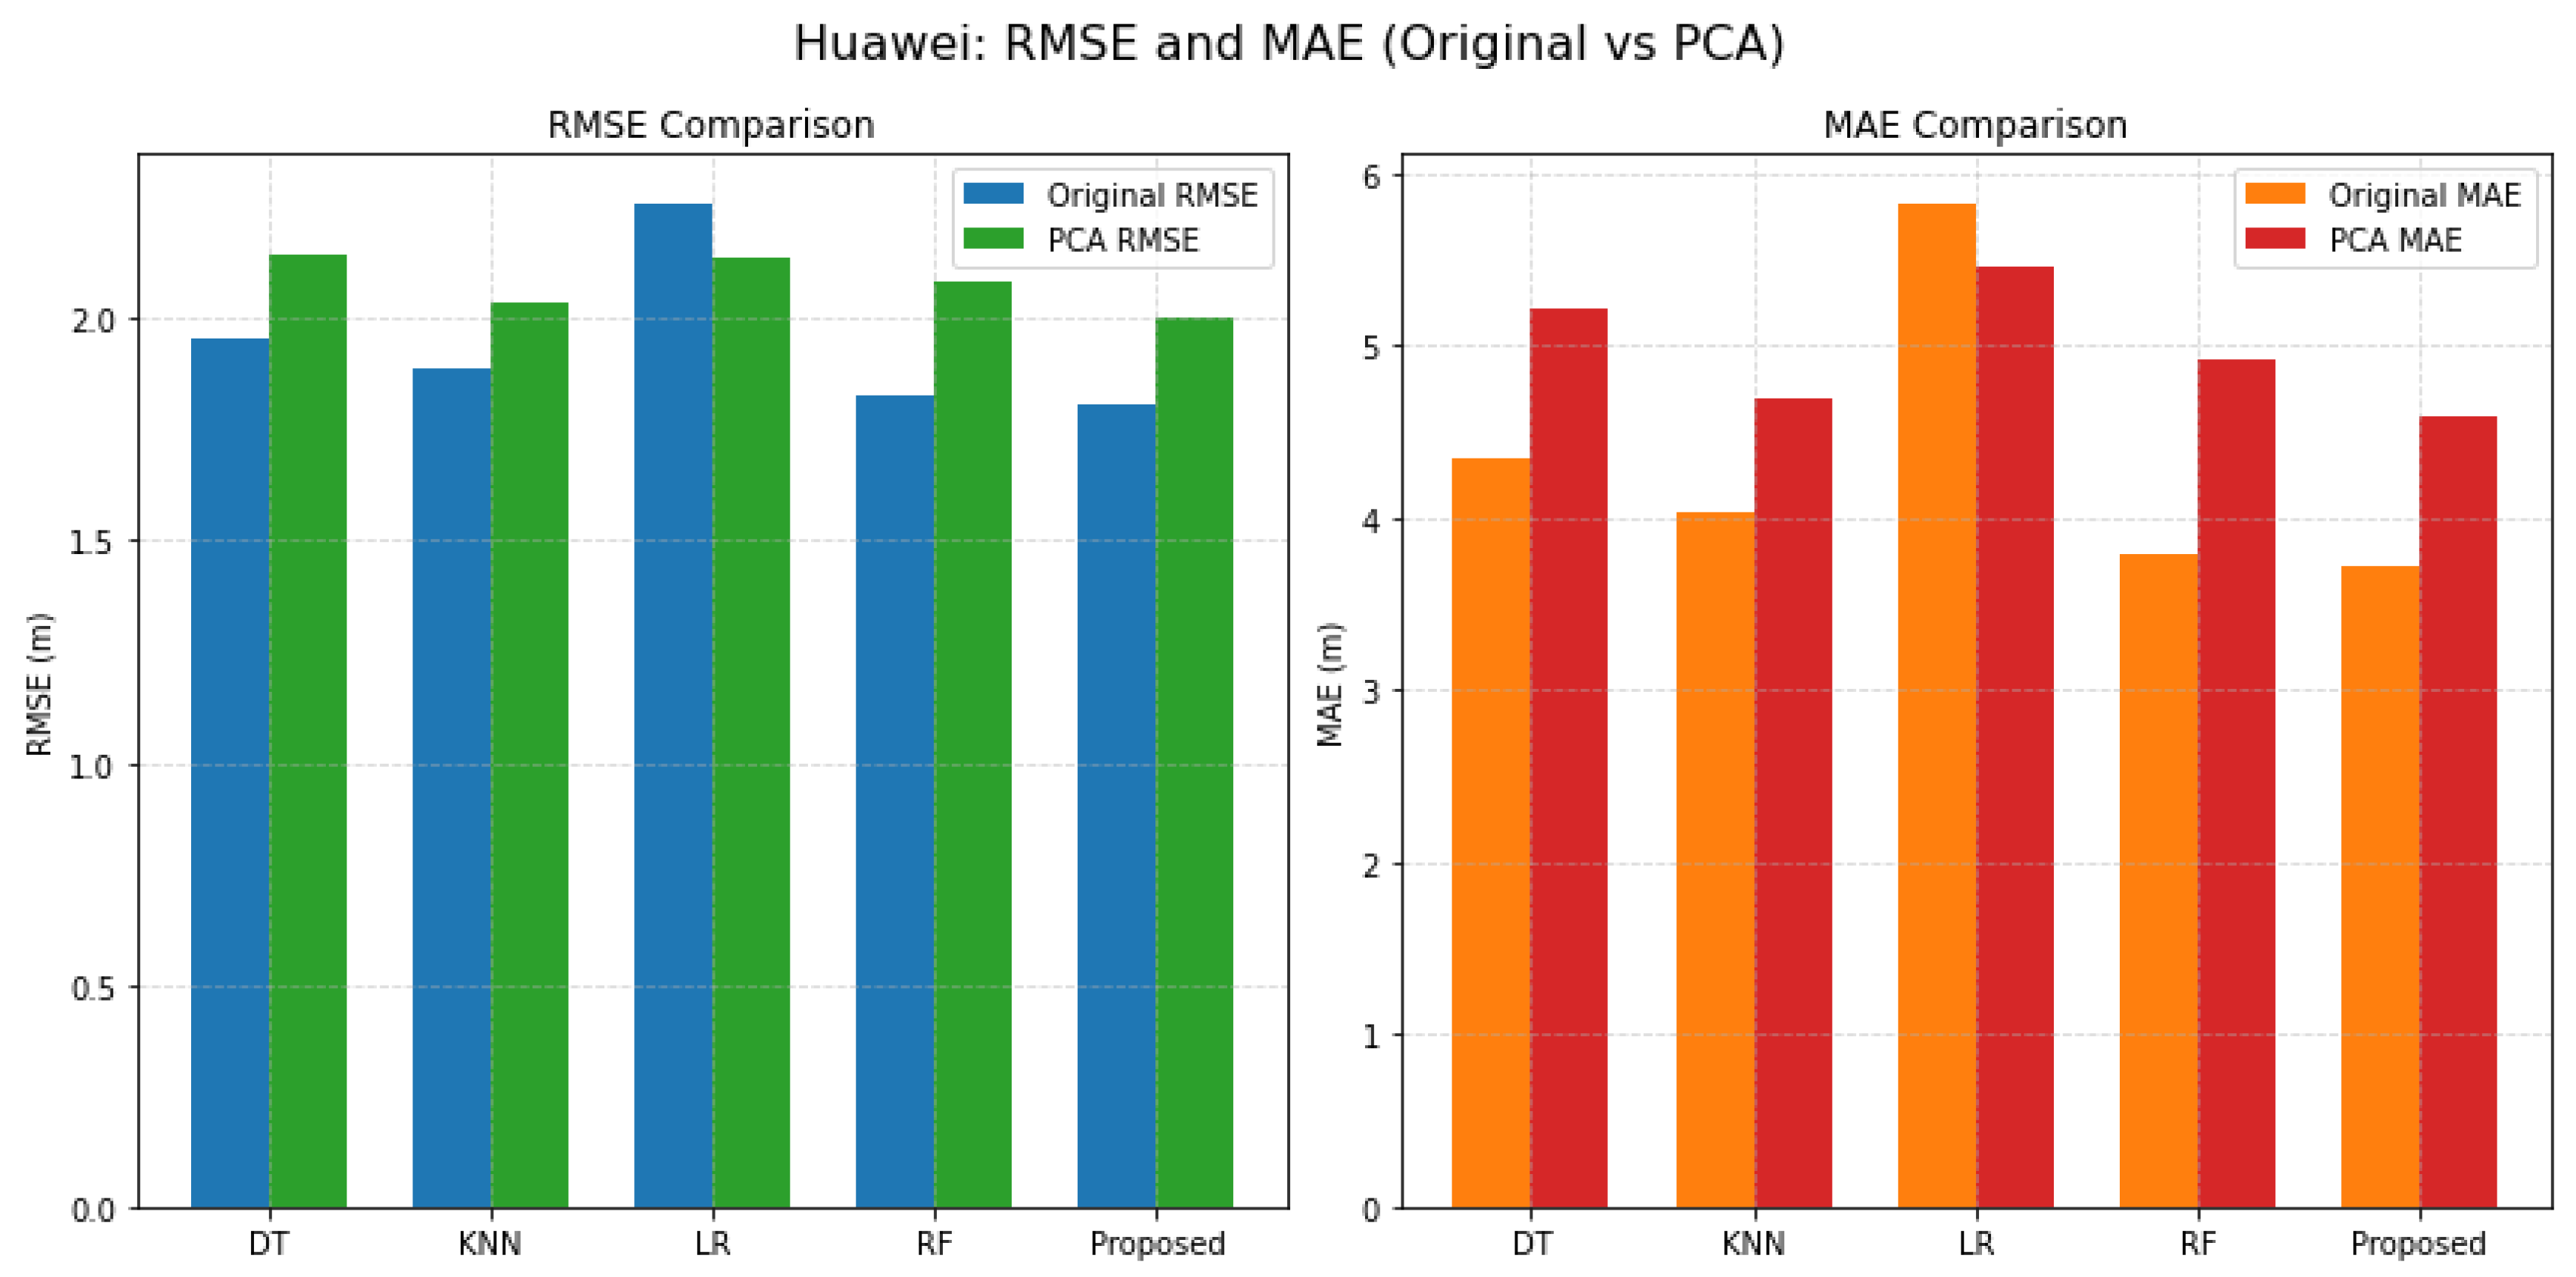
Figure 6.
Comparison of RMSE and MAE for Library Environment (Original vs PCA).

Figure 7.
CDF of RMSE and MAE for Office Environment (Original vs PCA).
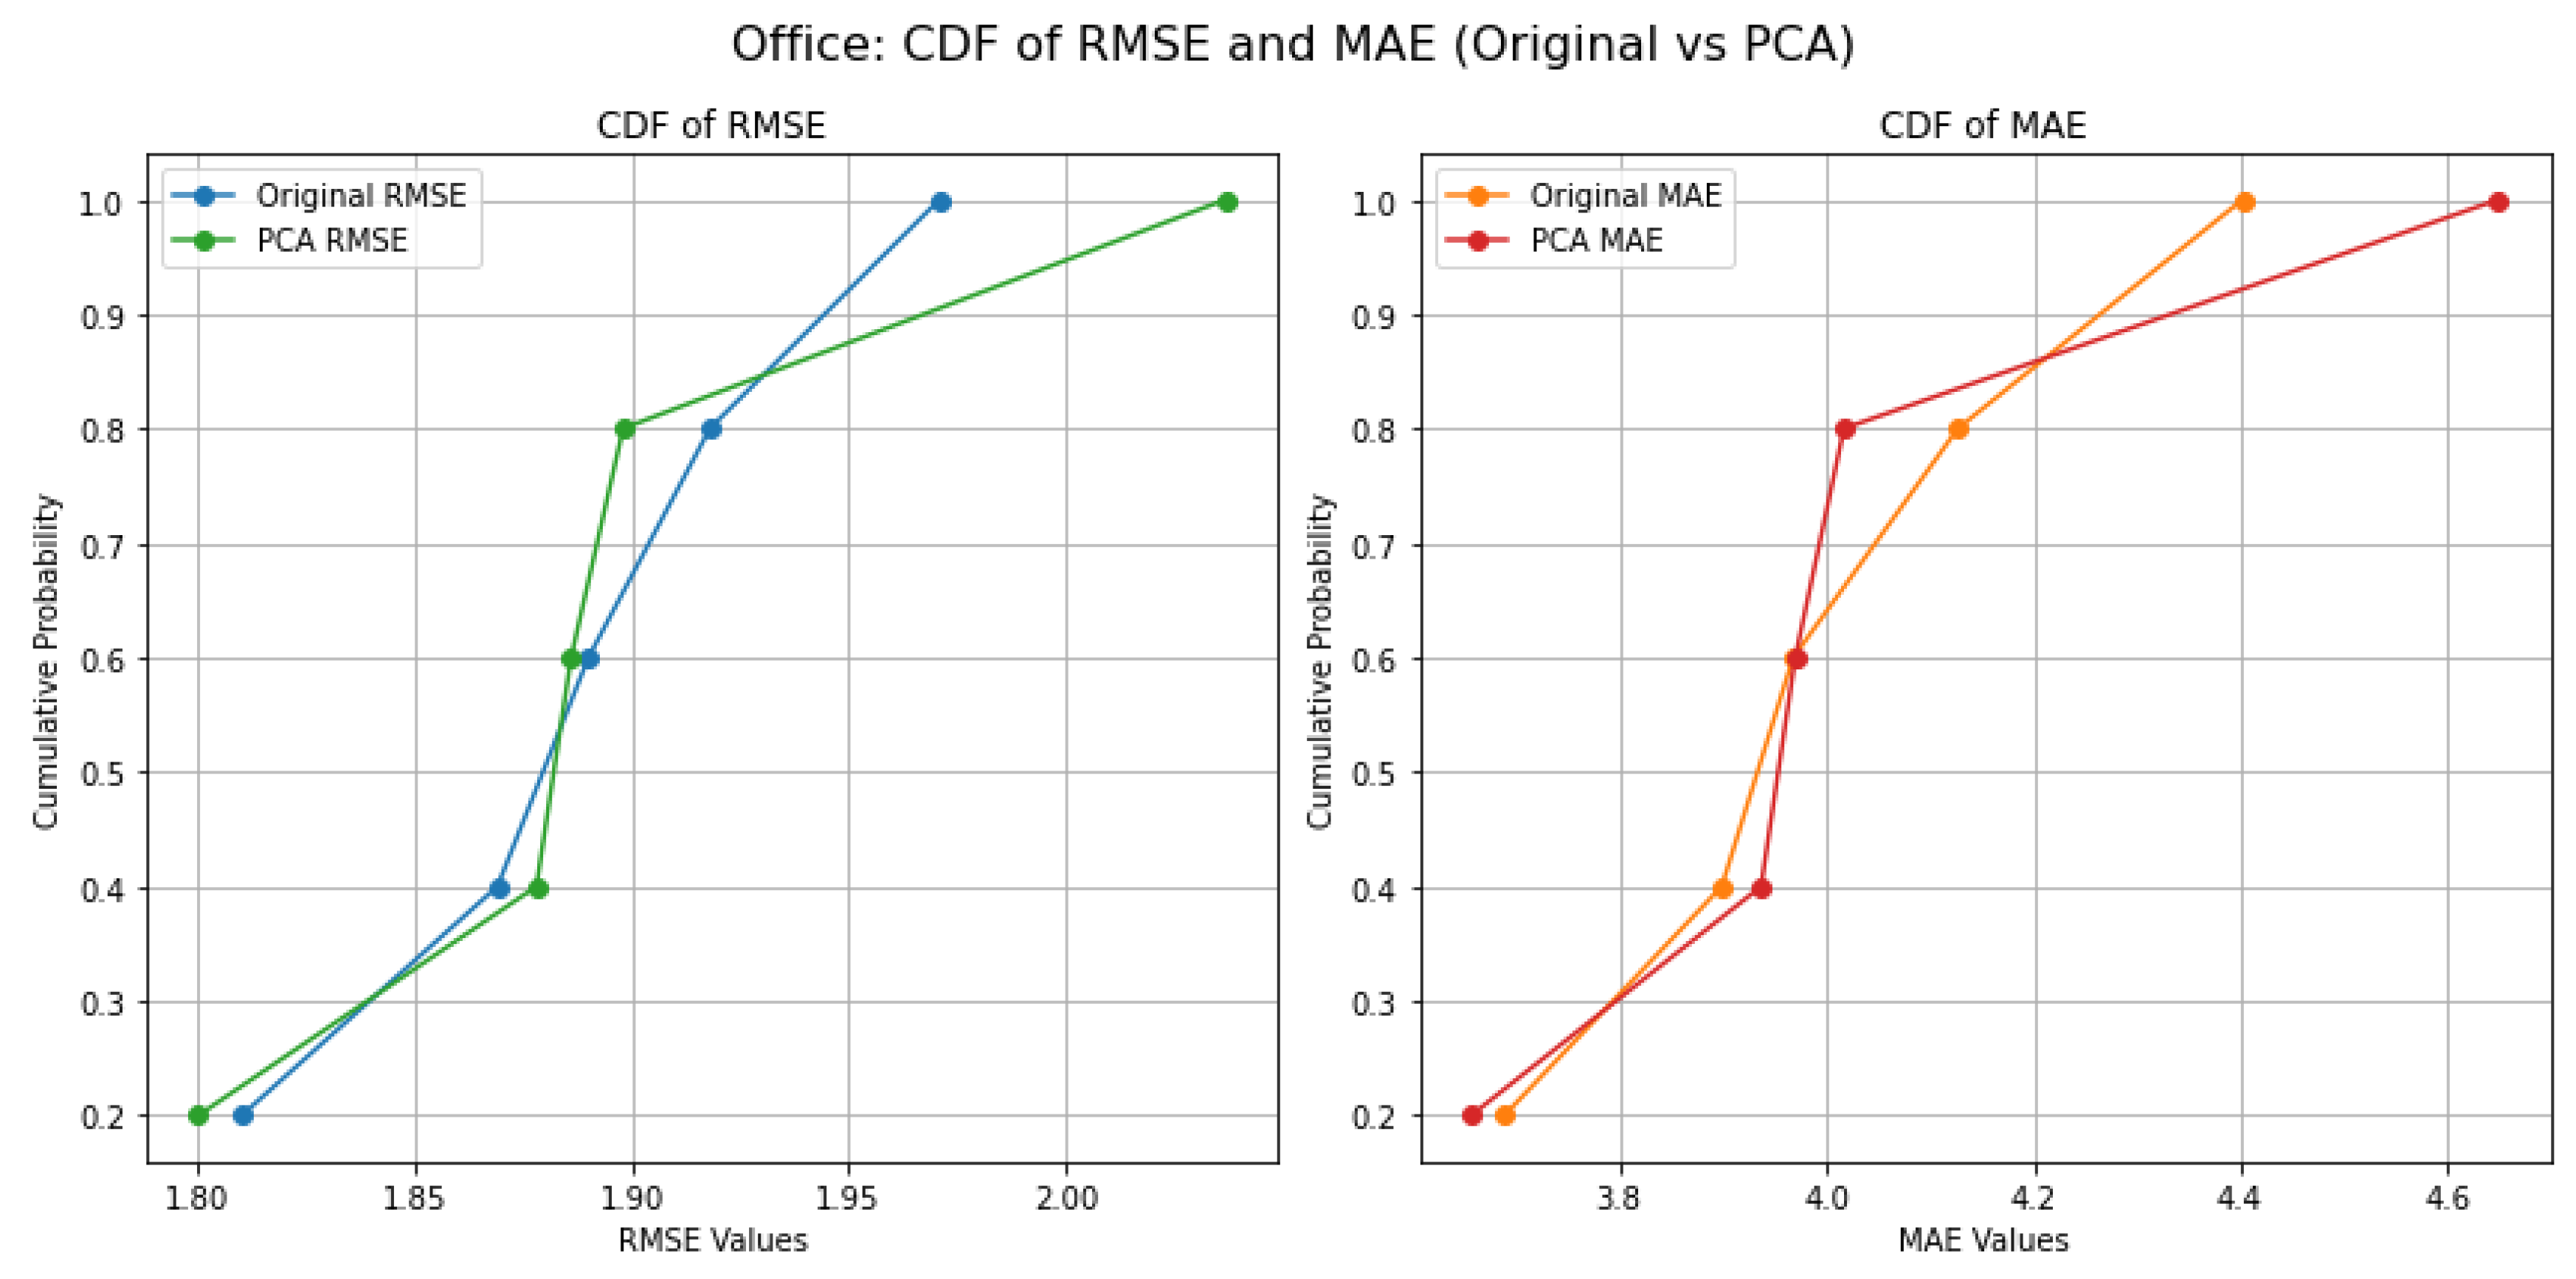
Figure 8.
CDF of RMSE and MAE for Huawei Environment (Original vs PCA).
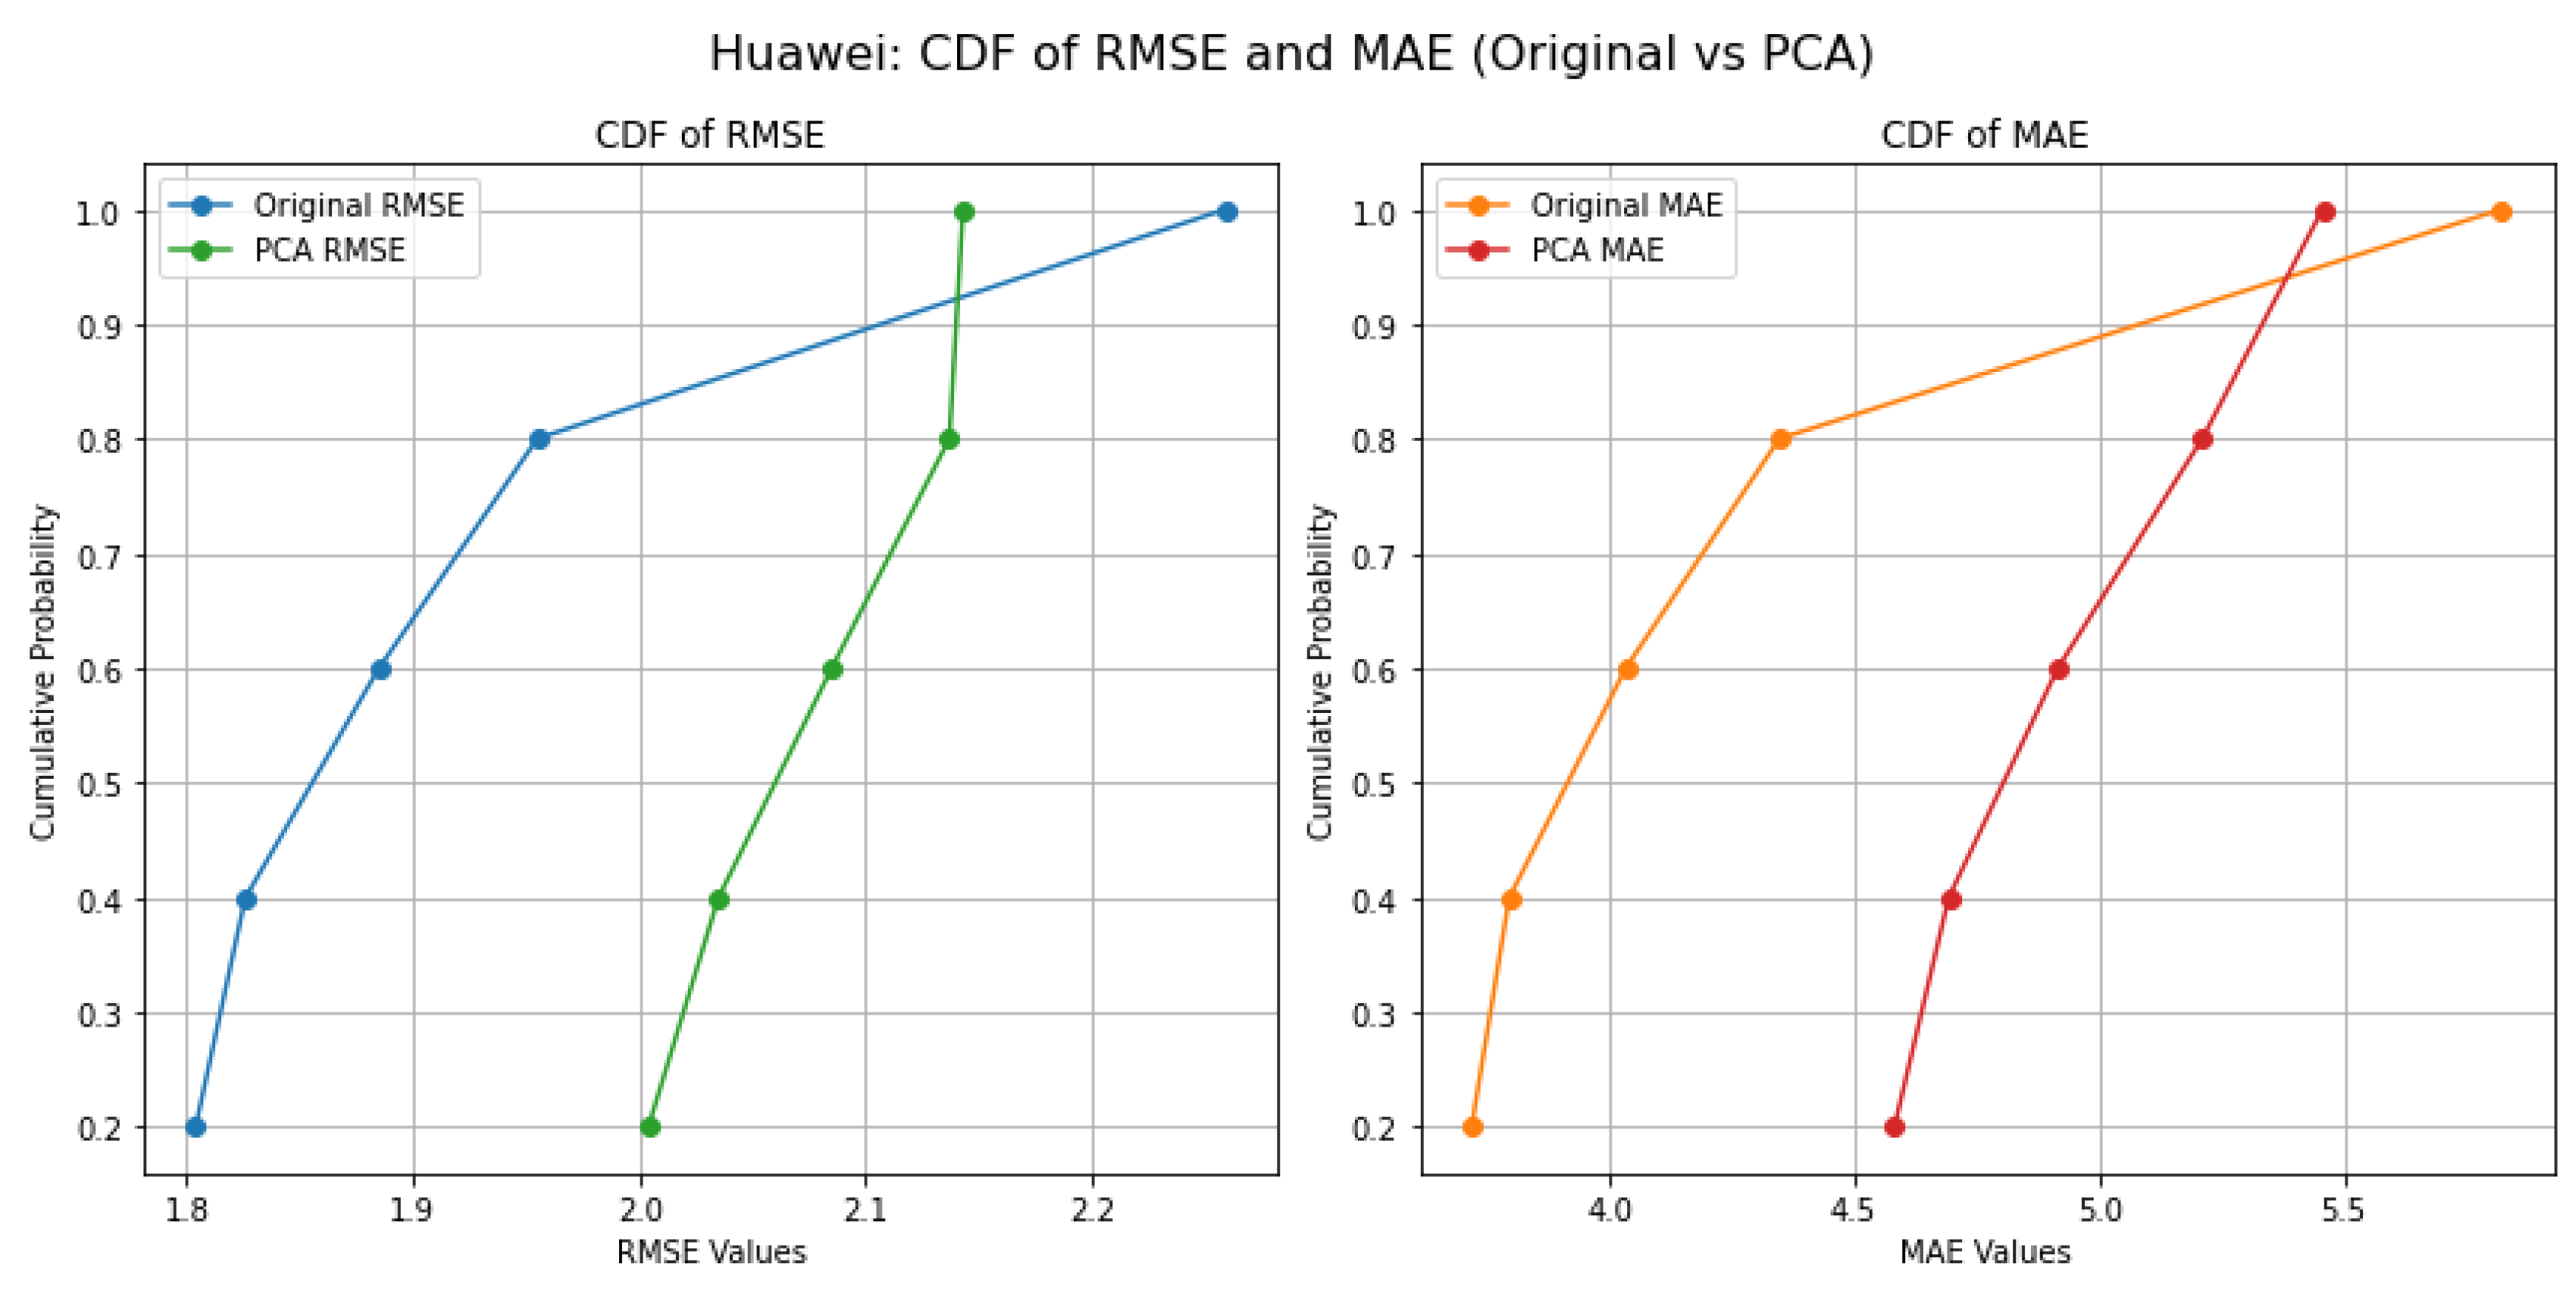
Figure 9.
CDF of RMSE and MAE for Library Environment (Original vs PCA).
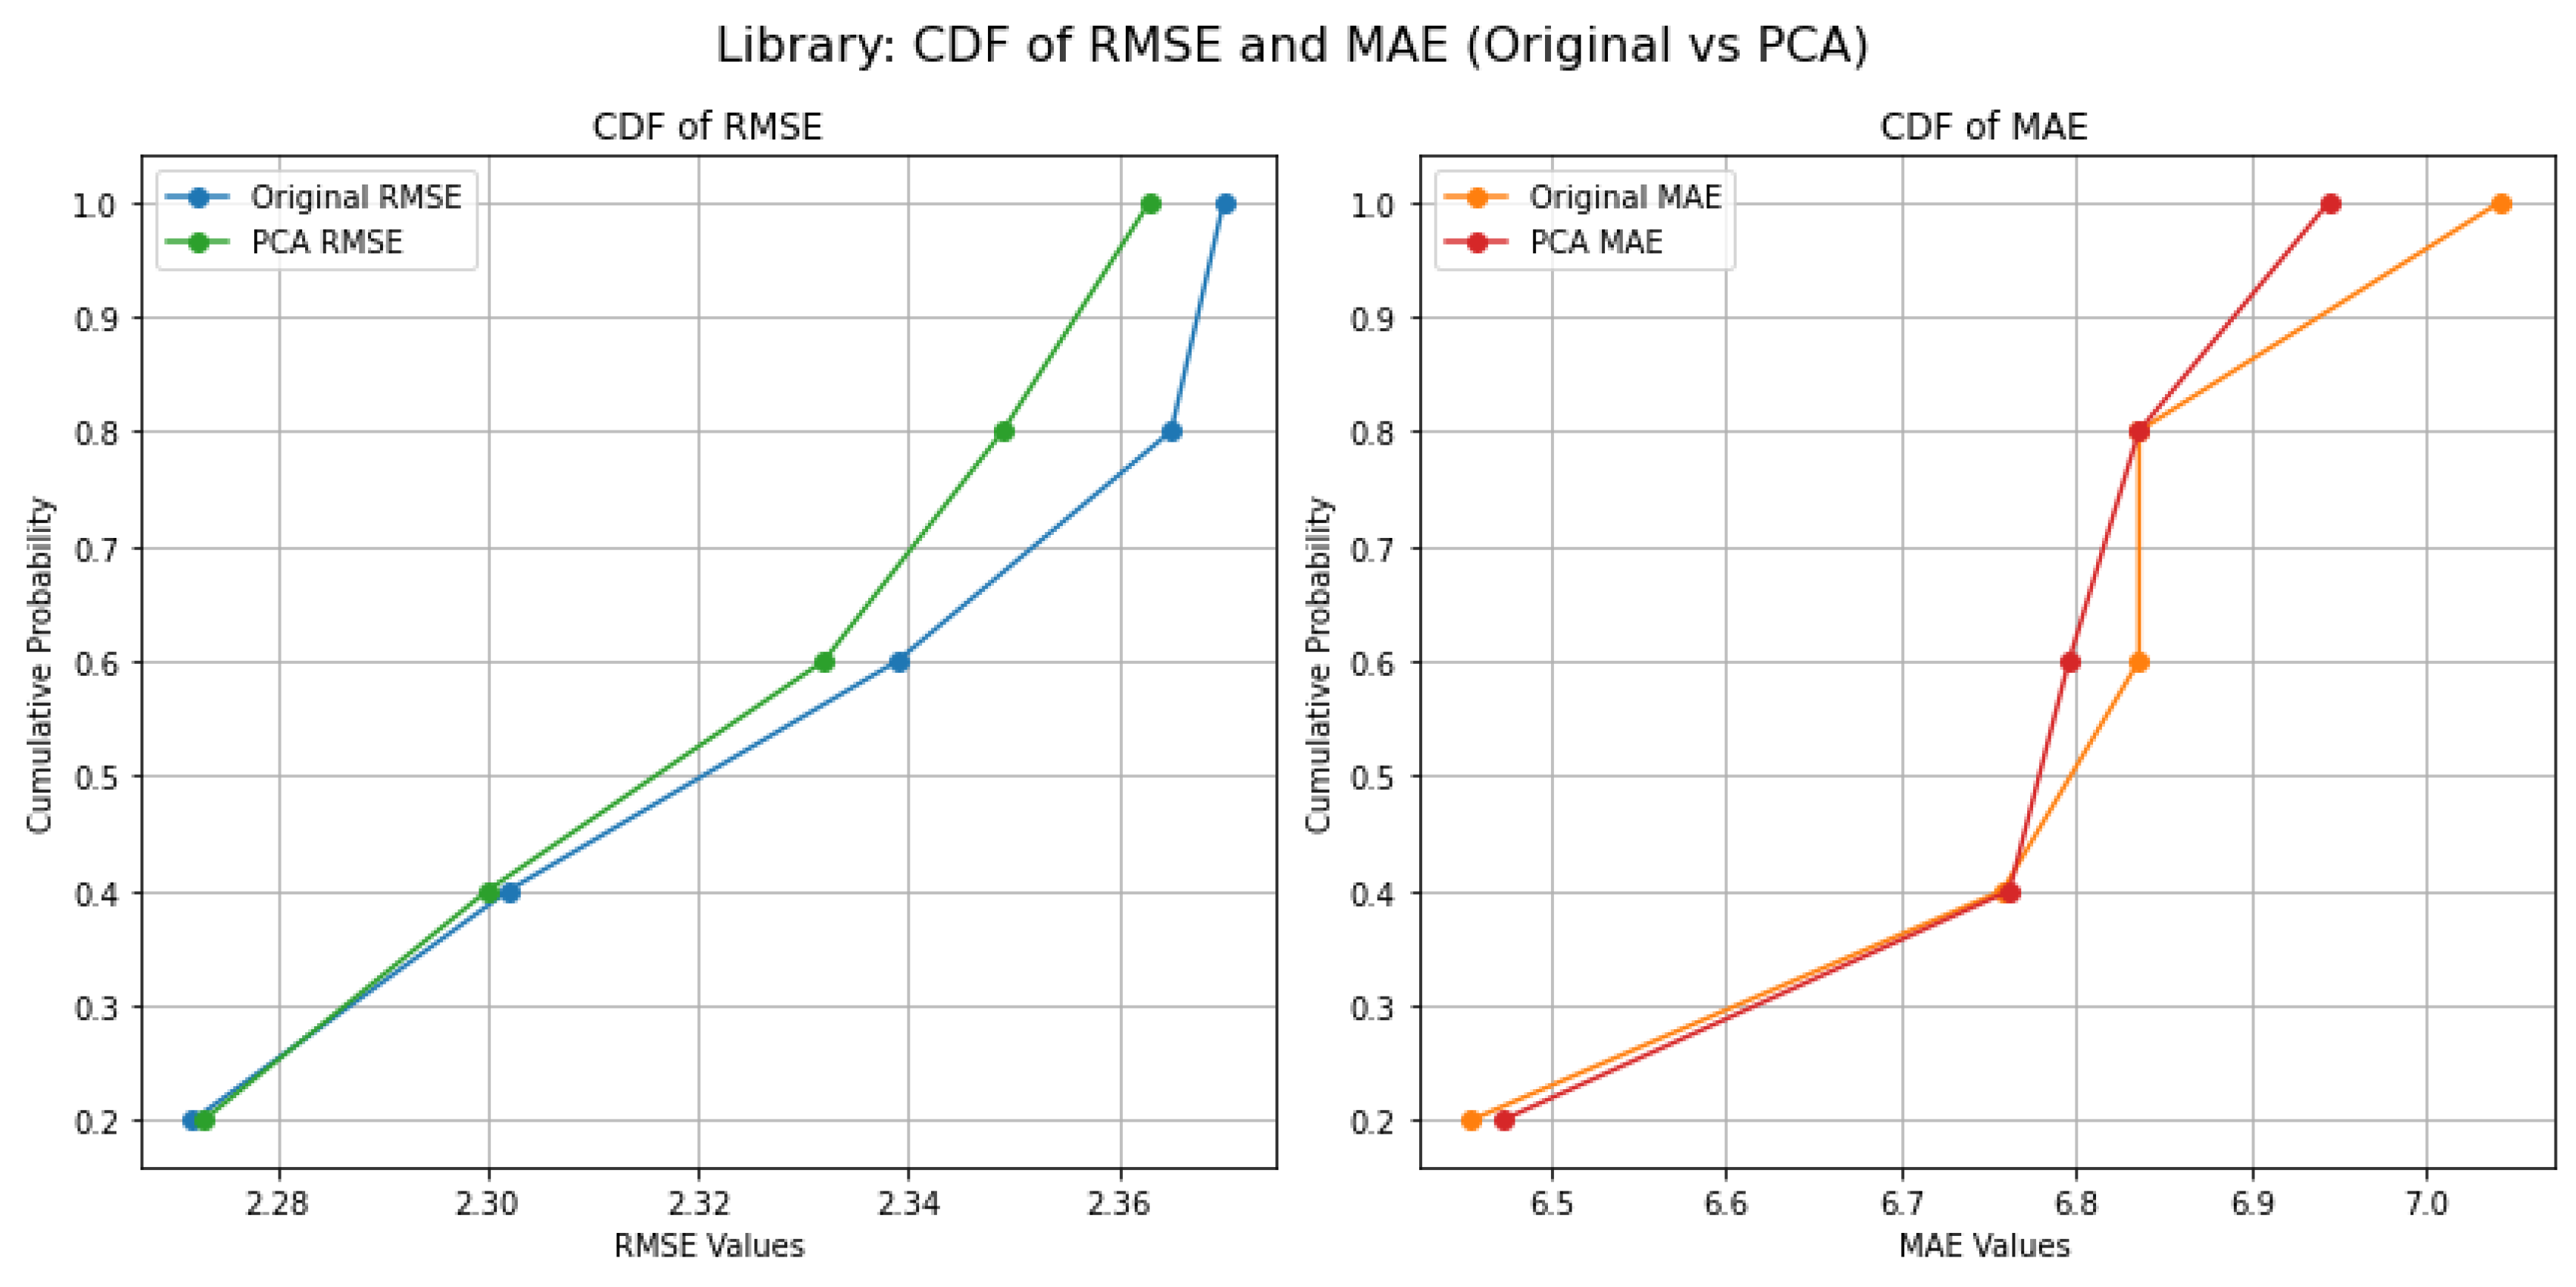
Figure 10.
Performance Comparison of Proposed Fusion Model:.
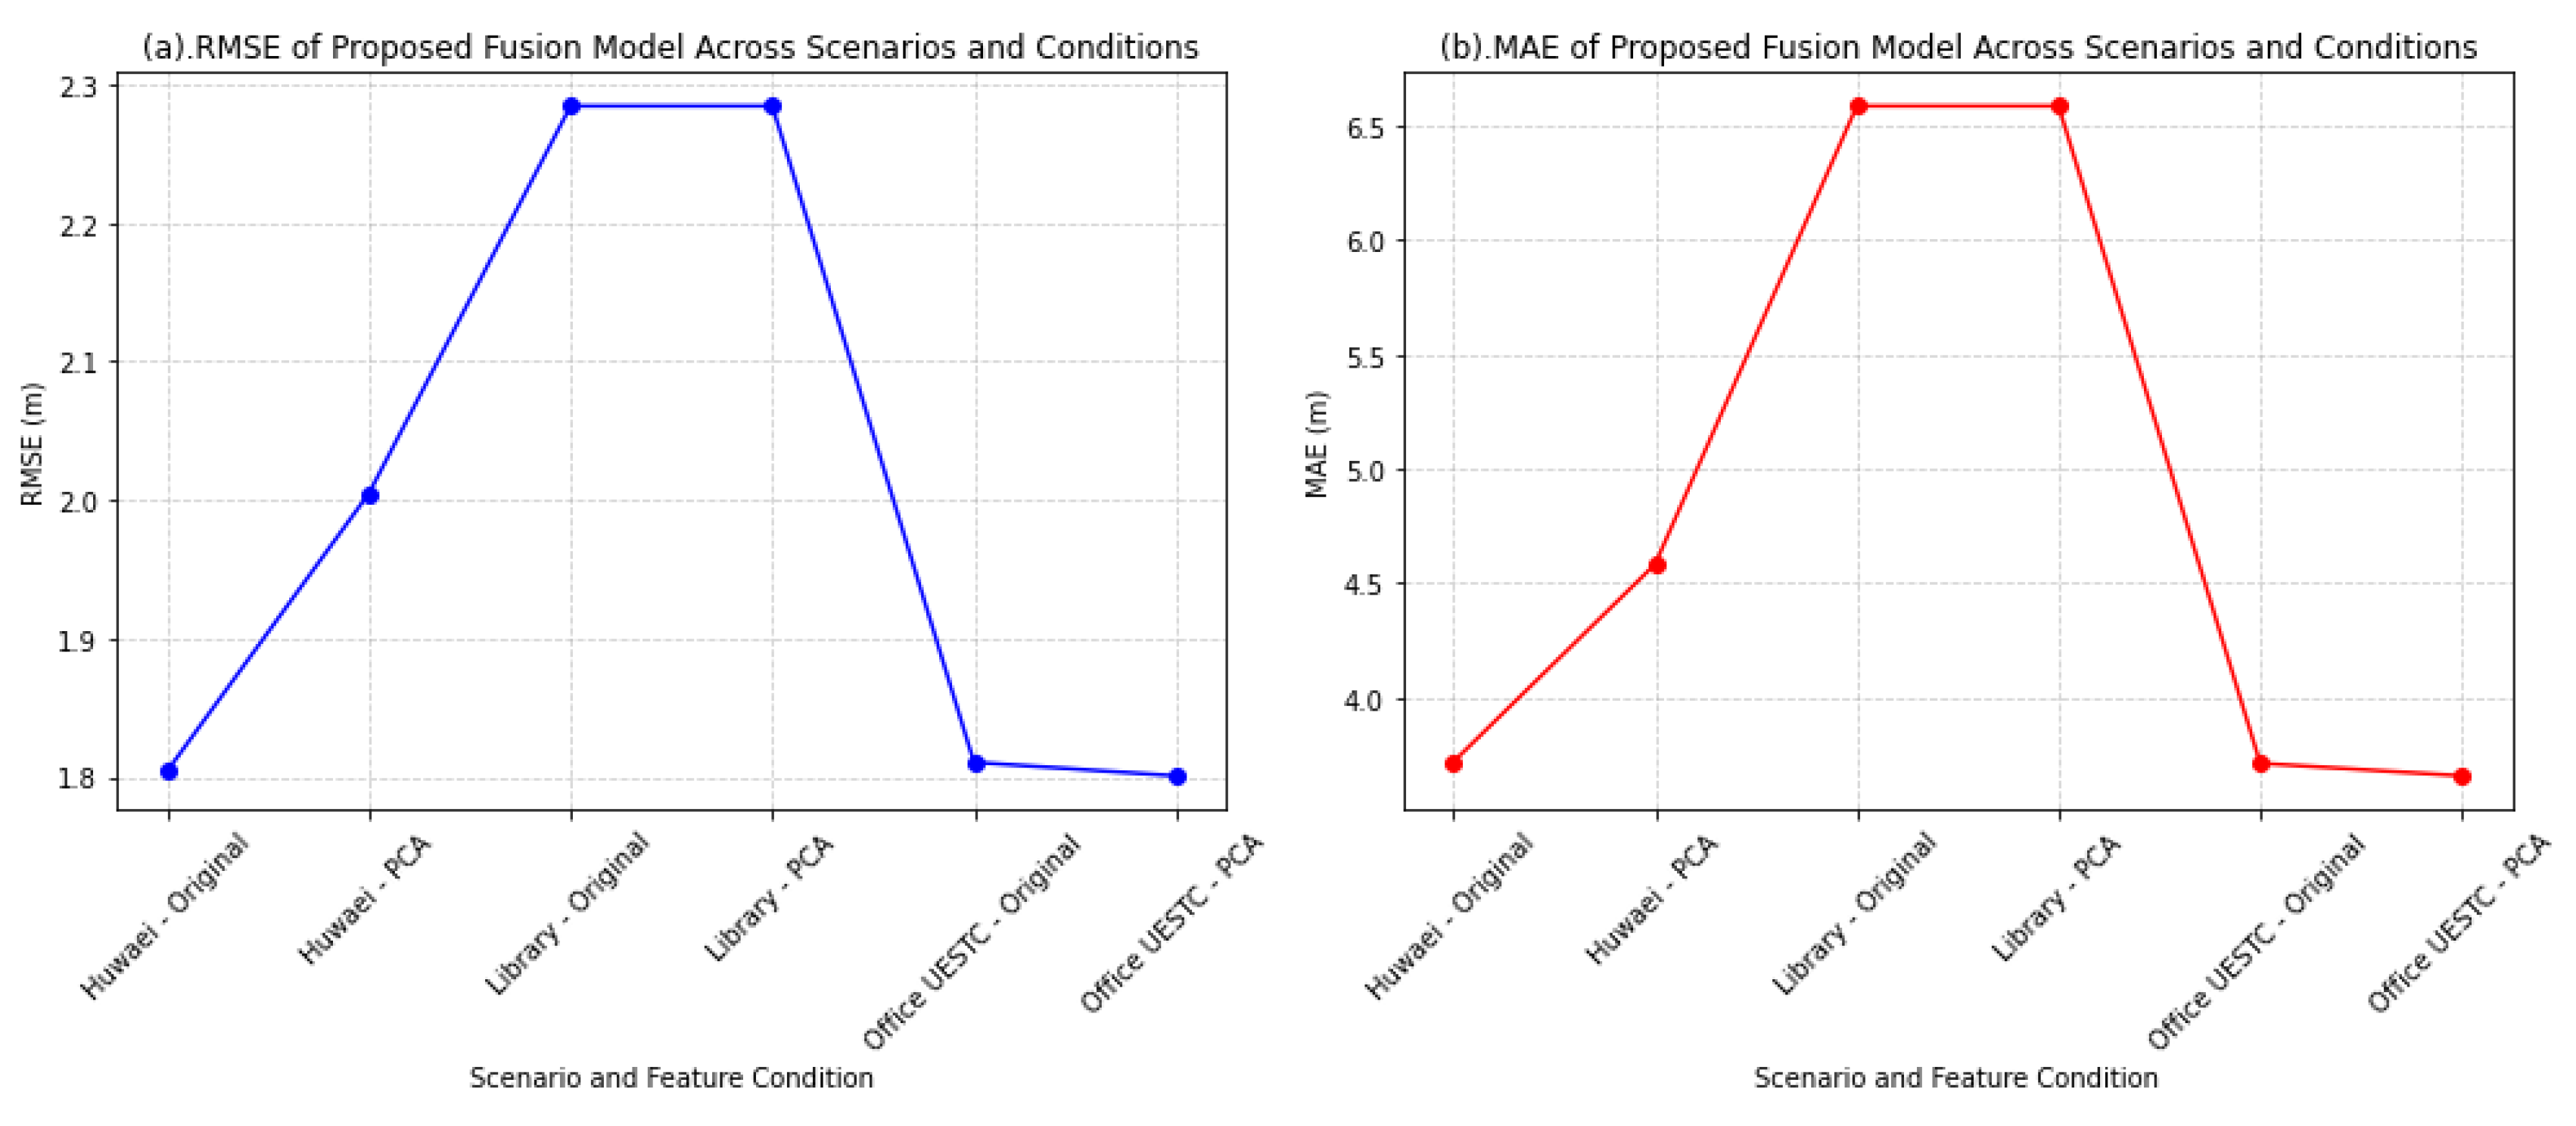
Figure 11.
Training and Testing Time Comparison: Original vs PCA with RMSE and MAE.

Figure 12.
Comparison of Classifiers Metrics for the offcice at UESTC.
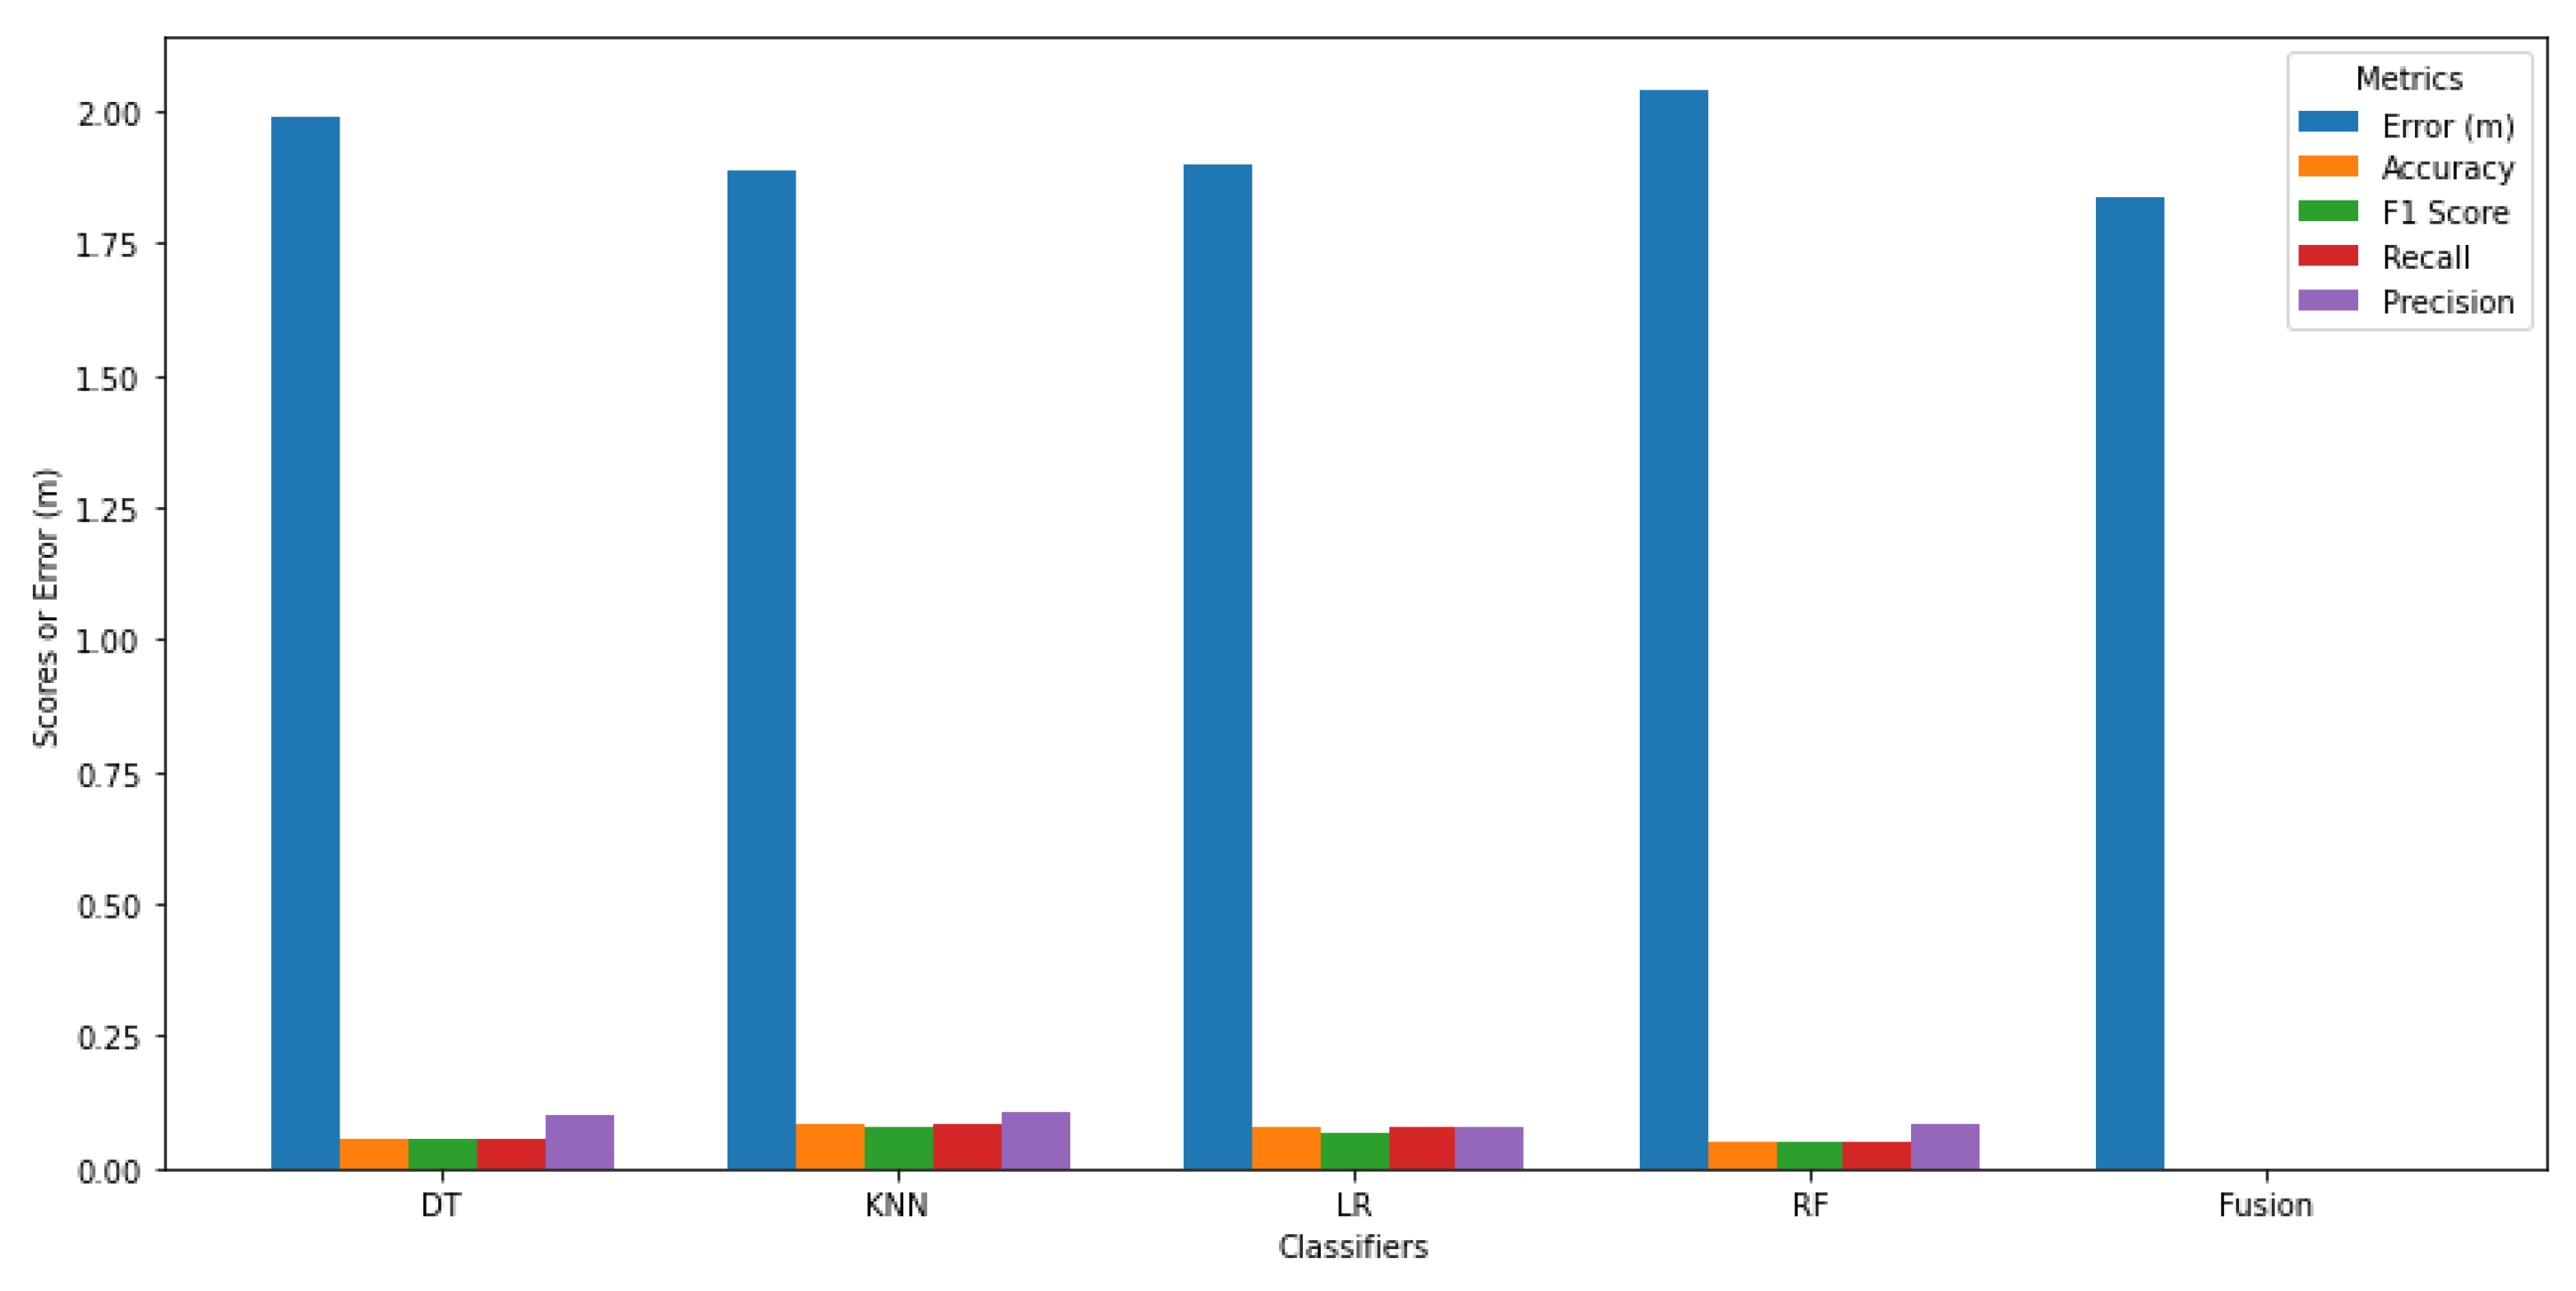
Figure 13.
Comparison of Classifiers Metrics for the indoor parking.
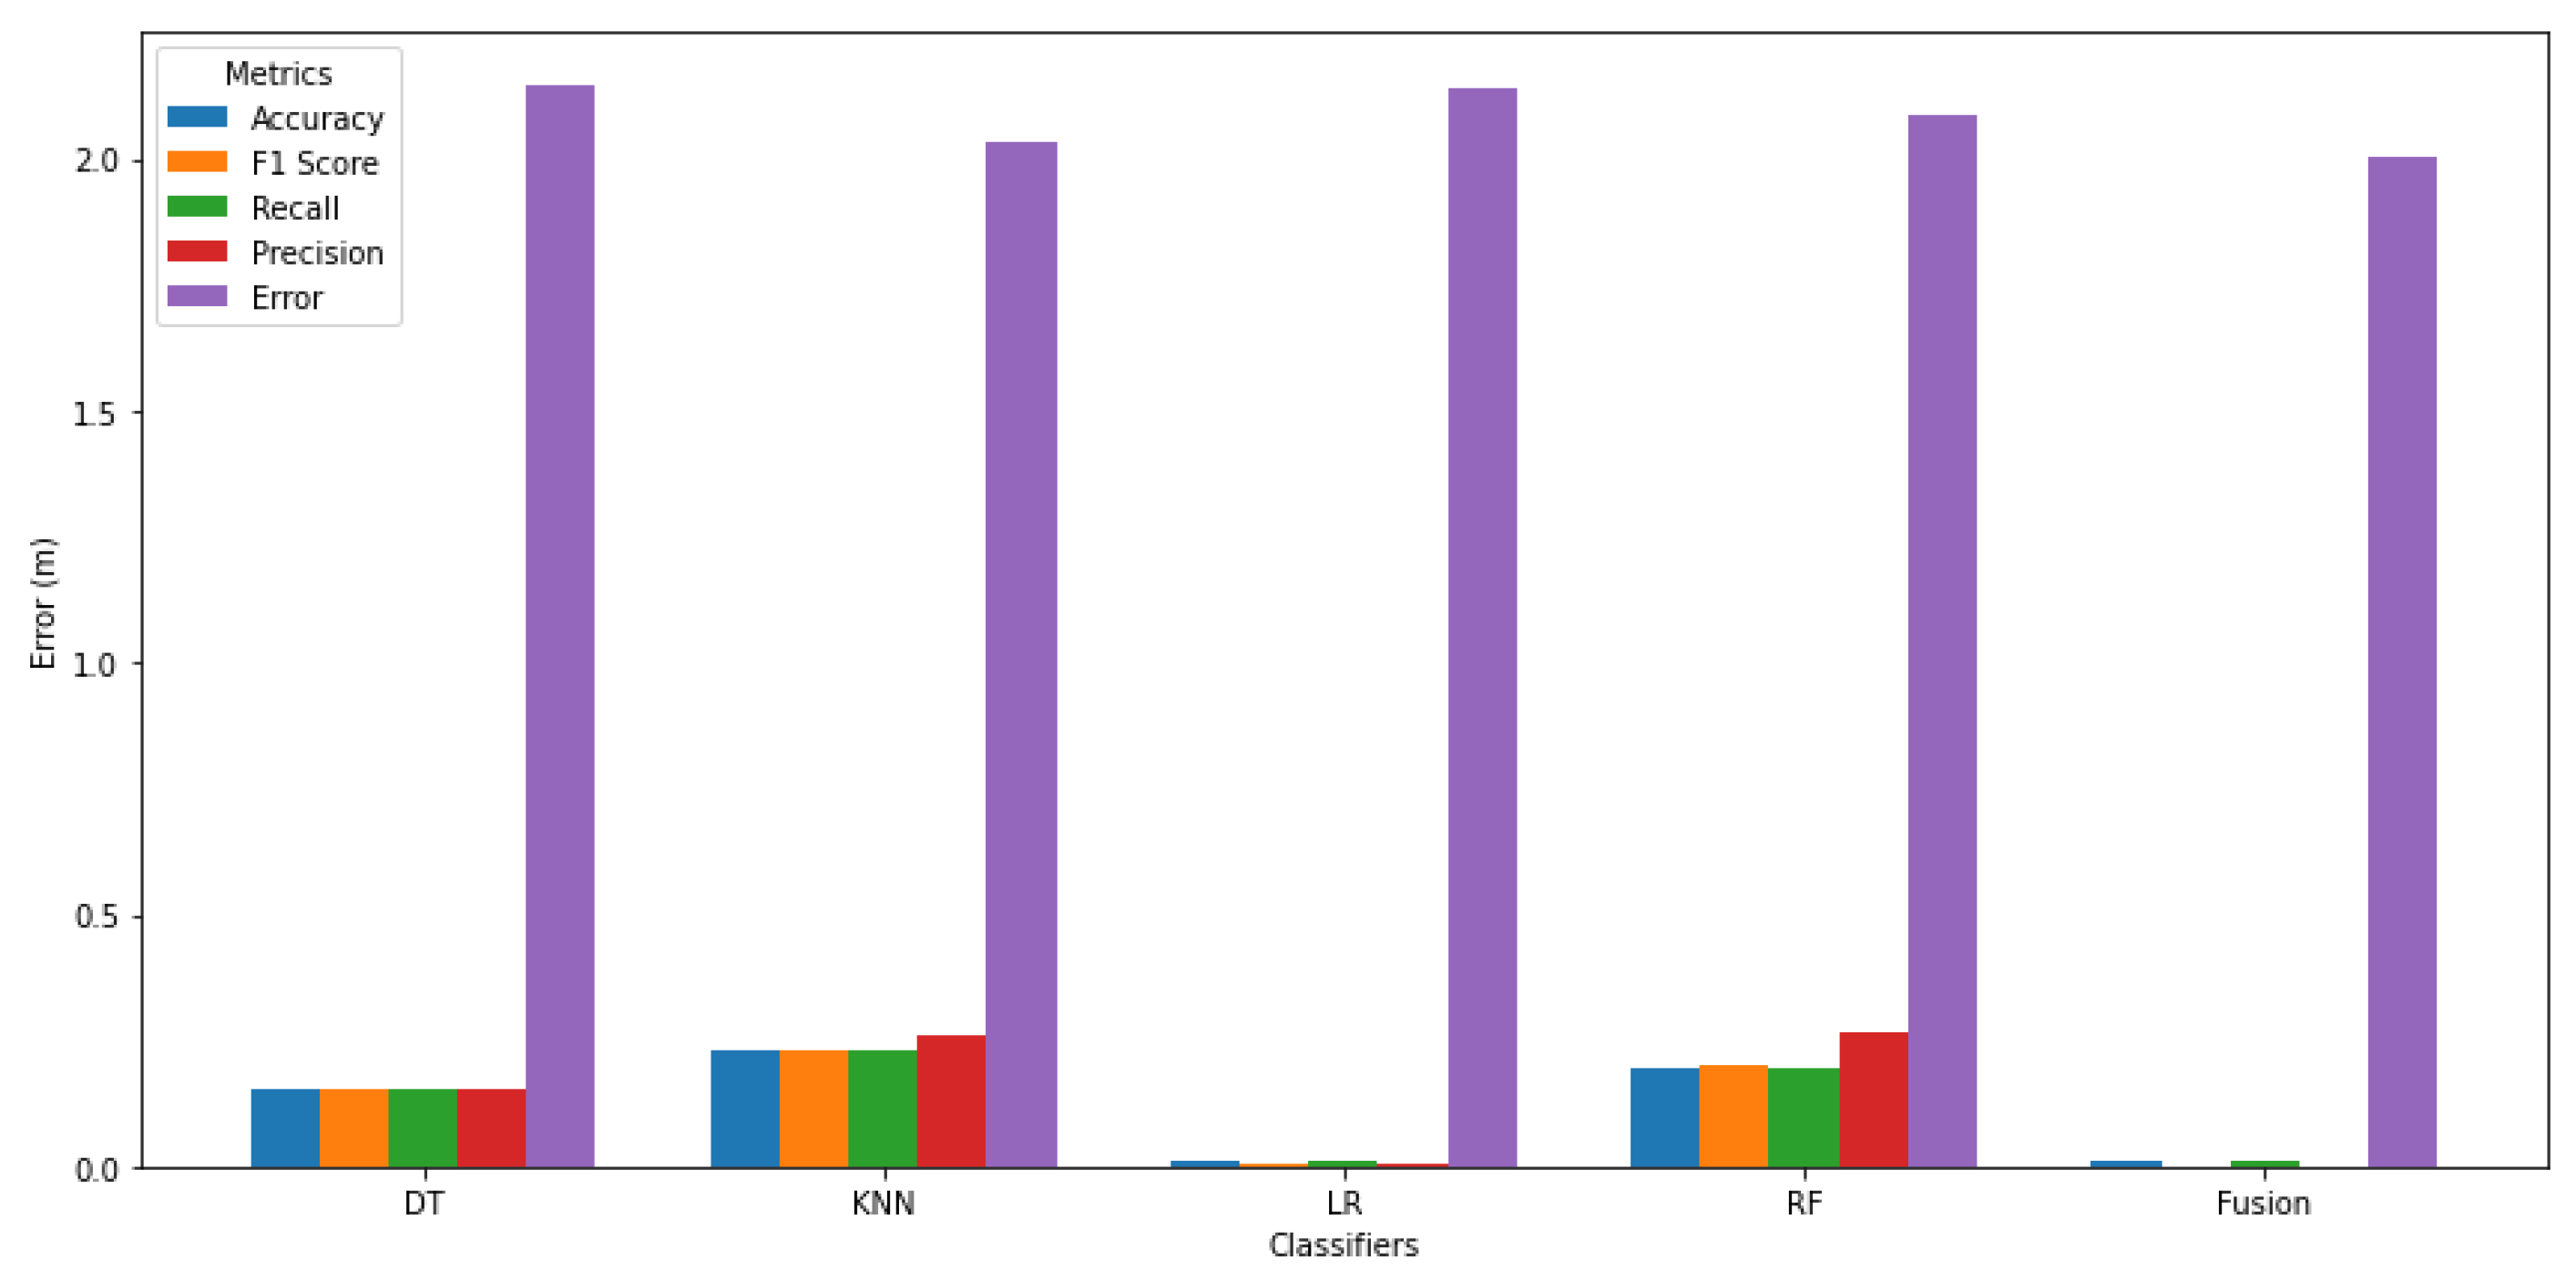
Figure 14.
Comparison of Classifiers Metrics for the Library environment.
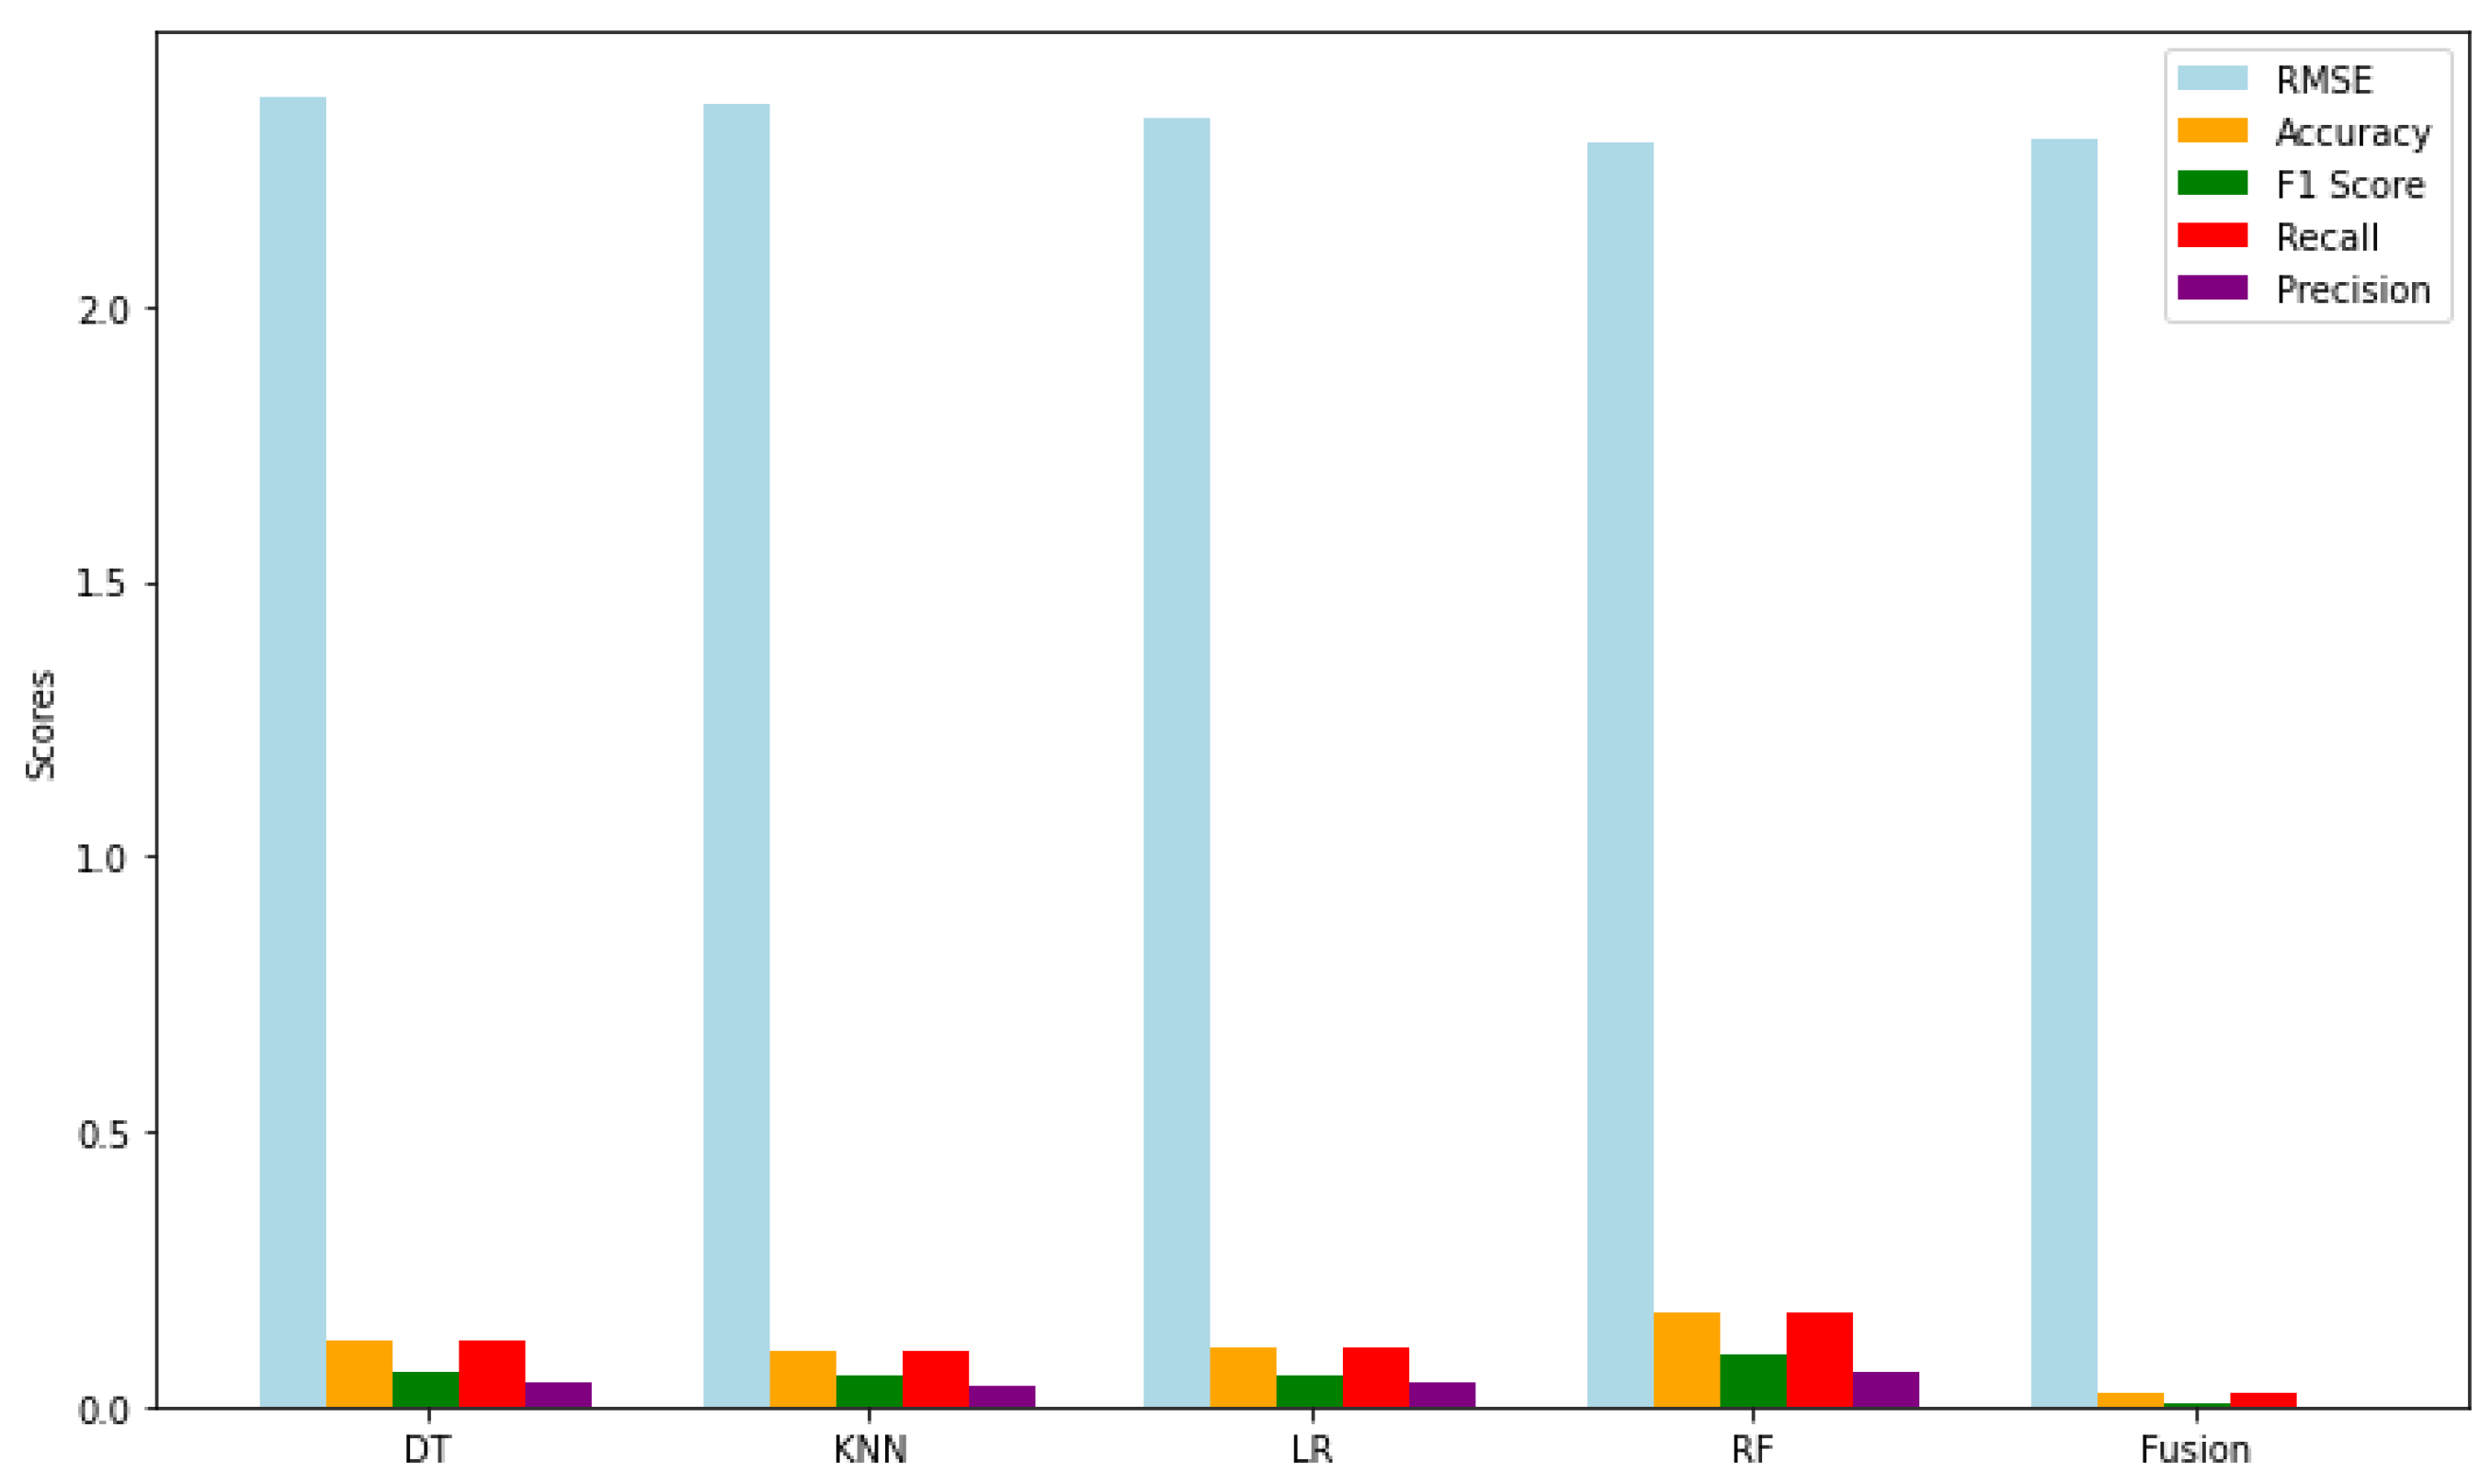
Table 1.
Description of the datasets used for Evaluating a Dynamic Fingerprint-Based IPSs.
| Experimental scenarios | Feature | Size (m2) | BSs | UEs | #RPs | #Features |
|---|---|---|---|---|---|---|
| Library | RSS | 308.4 | AP | Smartphone | 106 | 620 |
| Office | RSS | 1460 | AP | Smartphone | 175 | 9 |
| Indoor Parking | RSS | 75 | AP | Transmiter | 110 | 406 |
Table 2.
Localization Performance Using Original Features Across Indoor Environments.
| Datasets | Office: UESTC | Huawei: Indoor Parking site | Library: Universität Jaume I in Spain | |||
|---|---|---|---|---|---|---|
| Classifiers | RMSE (m) | MAE (m) | RMSE (m) | MAE (m) | RMSE (m) | MAE (m) |
| DT | 1.890 | 3.968 | 1.955 | 4.347 | 2.370 | 7.043 |
| KNN | 1.869 | 3.899 | 1.885 | 4.033 | 2.365 | 6.836 |
| LR | 1.918 | 4.127 | 2.259 | 5.823 | 2.339 | 6.762 |
| RF | 1.971 | 4.402 | 1.826 | 3.795 | 2.302 | 6.758 |
| Proposed model | 1.810 | 3.689 | 1.804 | 3.7186 | 2.272 | 6.454 |
Table 3.
Localization Performance Using PCA Across Indoor Environments.
| Datasets | Office: UESTC | Huawei: Indoor Parking site | Library: Universität Jaume I in Spain | |||
|---|---|---|---|---|---|---|
| Classifiers | RMSE (m) | MAE (m) | RMSE (m) | MAE (m) | RMSE (m) | MAE (m) |
| DT | 1.886 | 3.970 | 2.143 | 5.211 | 2.363 | 6.945 |
| KNN | 1.878 | 3.937 | 2.035 | 4.693 | 2.349 | 6.836 |
| LR | 1.898 | 4.017 | 2.137 | 5.457 | 2.332 | 6.762 |
| RF | 2.037 | 4.649 | 2.085 | 4.916 | 2.330 | 6.796 |
| Proposed model | 1.800 | 3.657 | 2.004 | 4.582 | 2.273 | 6.472 |
Table 4.
Computational Time and Localization Error Analysis with original features.
| Indoor setting : Office: UESTC | Computationl Analysis: Error in meters | |||
|---|---|---|---|---|
| Classifiers | Training/Testing (sec) | RMSE (m) | Training/Testing (sec) | MAE (m) |
| DT | 0.0194 (0.1555) | 1.890248 | 0.0144 (0.1406) | 3.9680 |
| KNN | 12.6537 (1.6511) | 1.869913 | 13.0663 (1.5418) | 3.8991 |
| LR | 4.0823 (0.0040) | 1.918150 | 3.8071 (0.0023) | 4.1272 |
| RF | 0.1985 (0.0094) | 1.971958 | 0.1607 (0.0103) | 4.3996 |
| Proposed Fusion Model | — (0.0040) | 1.810613 | — (0.0052) | 3.7122 |
Table 5.
Computational Time and Localization Error Analysis after PCA applied.
| Indoor setting : Office: UESTC | Computationl Analysis: Error in meters | |||
|---|---|---|---|---|
| Classifiers | Training/Testing (sec) | RMSE (m) | Training/Testing (sec) | MAE (m) |
| DT | 0.0132 (0.1060) | 1.8867 | 0.0092 (0.1118) | 3.9704 |
| KNN | 13.2847 (1.4232) | 1.8782 | 14.0286 (1.4516) | 3.9376 |
| LR | 4.2626 (0.0030) | 1.8983 | 3.5972 (0.0020) | 4.0172 |
| RF | 0.4475 (0.0102) | 2.0370 | 0.4979 (0.0082) | 4.6490 |
| Proposed Fusion Model | — (0.0040) | 1.8008 | — (0.0020) | 3.6572 |
Table 6.
Computational Time and Localization Error Analysis with original features.
| Indoor setting : Library | Computationl Analysis: Error in meters | |||
|---|---|---|---|---|
| Classifiers | Training/Testing (sec) | RMSE (m) | Training/Testing (sec) | MAE (m) |
| DT | 0.3916 (0.0040) | 2.3866 | 0.3451 (0.0020) | 7.0434 |
| KNN | 0.0010 (0.1671) | 2.3491 | 0.0020 (0.1114) | 6.8361 |
| LR | 2.0389 (0.0030) | 2.3327 | 2.7362 (0.0020) | 6.7628 |
| RF | 4.6775 (0.1270) | 2.3275 | 4.0537 (0.0745) | 6.7584 |
| Proposed Fusion Model | — (0.0060) | 2.2845 | — (0.0040) | 6.5865 |
Table 7.
Computational Time and Localization Error Analysis after PCA applied.
| Indoor setting : Library | Computationl Analysis: Error in meters | |||
|---|---|---|---|---|
| Classifiers | Training/Testing (sec) | RMSE (m) | Training/Testing (sec) | MAE (m) |
| DT | 0.5304 (0.0030) | 2.3866 | 0.3647 (0.0040) | 7.0434 |
| KNN | 0.0030 (0.4312) | 2.3491 | 0.0019 (0.1570) | 6.8361 |
| LR | 2.2078 (0.0030) | 2.3327 | 2.5673 (0.0050) | 6.7628 |
| RF | 5.7338 (0.1369) | 2.3275 | 4.6068 (0.1299) | 6.7584 |
| Proposed Fusion Model | — (0.0070) | 2.2845 | — (0.0059) | 6.5865 |
Disclaimer/Publisher’s Note: The statements, opinions and data contained in all publications are solely those of the individual author(s) and contributor(s) and not of MDPI and/or the editor(s). MDPI and/or the editor(s) disclaim responsibility for any injury to people or property resulting from any ideas, methods, instructions or products referred to in the content. |
© 2025 by the authors. Licensee MDPI, Basel, Switzerland. This article is an open access article distributed under the terms and conditions of the Creative Commons Attribution (CC BY) license (http://creativecommons.org/licenses/by/4.0/).
Copyright: This open access article is published under a Creative Commons CC BY 4.0 license, which permit the free download, distribution, and reuse, provided that the author and preprint are cited in any reuse.


