
Submitted:
05 August 2025
Posted:
08 August 2025
You are already at the latest version
Abstract
Background: The rising co-occurrence of HIV and hypertension in sub-Saharan Africa (SSA) presents complex challenges for patients and health systems. In South Africa, despite free healthcare services for HIV and hypertension in the public sector, patients with multiple chronic conditions frequently incur substantial out-of-pocket (OOP) costs. However, limited empirical evidence quantifies this burden from the patient perspective. Purpose: To quantify the economic burden of managing comorbid HIV and hypertension among South African patients, identify socio-demographic predictors of monthly OOP expenditure, and assess financial coping mechanisms. Methods: We conducted a cross-sectional analysis using patient-level data from the MOPHADHIV trial [Trial number: PACTR201811878799717], a randomized controlled trial evaluating SMS adherence support for hypertension care in people with HIV. We calculated the monthly direct non-medical, indirect, and coping costs from a patient perspective, valuing indirect costs using both actual income and minimum wage assumptions. Generalized linear models (GLMs) with a gamma distribution and log link were used to identify cost determinants. Catastrophic expenditure thresholds (10–40% of monthly income) were assessed. Results: Among 683 participants, mean monthly total costs were ZAR 105.81 (USD 5.72) when valuing indirect costs by actual income and ZAR 182.3 (USD 9.9) using minimum wage assumptions. Indirect costs were the largest cost component. Regression models revealed a significant income gradient: participants in the richest quintile incurred ZAR 131.9 (95% CI: 63.6–200.1) more costs per month than the poorest participants (p < 0.00). However, when indirect costs were standardized by minimum wage, cost gradients attenuated or reversed, indicating greater relative burden among middle-income groups. Other socio-demographic factors (gender, employment, education) were not significantly associated with total costs, which may reflect the relative success of South Africa’s district health system and its emphasis on equitable access to primary care that is free at the point of service. Nearly half the participants reported coping costs. Conclusion: Managing comorbid HIV and hypertension imposes substantial economic burdens on patients, primarily driven by indirect costs. Income-related disparities dominate cost variation, with important implications for financial protection and equity. Strengthening the integration of HIV and NCD services and targeting financial support for lower-income patients are critical to advancing South Africa’s Universal Health Coverage reforms.
Keywords:
HIV
; hypertension
; multimorbidity
; economic burden
; out-of-pocket costs
; health equity
; catastrophic health expenditure
; South Africa
; integrated care
; MOPHADHIV trial
1. Introduction
Co-prevalent HIV and hypertension presents a growing challenge for health systems in sub-Saharan Africa (SSA), where services have historically focused on communicable diseases, particularly HIV. In South Africa the epicentre of the global HIV epidemic and home to the largest antiretroviral therapy (ART) programme, declines in HIV-related mortality have given rise to a rapidly aging cohort of people living with HIV (PLWH), who are increasingly affected by non-communicable diseases (NCDs), particularly hypertension [1,2]. This dual burden not only complicates clinical management but also places additional stress on already fragmented and under-resourced health systems [3].
Existing literature highlights the substantial out-of-pocket (OOP) costs faced by patients managing chronic conditions in low-resource settings, with determinants including income level, distance to healthcare facilities, and comorbidity complexity [4,5]. Studies across SSA note that OOP expenditures for HIV care though partially offset by free ART remain catastrophic for 10 – 25% of households, defined as exceeding 10% of total household income [6,7]. However, these figures vary widely by country context; for instance, South Africa’s provision of universal primary care and access to WHO-recommended essential medicines likely mitigates some of the cost burden seen in settings like Malawi or Uganda, where patients often pay out of pocket for a broader range of services ([8,9]). For hypertension, OOP costs are less documented but often include frequent clinic visits and unsubsidized medications, disproportionately affecting low-income populations [10,11]. Catastrophic spending is exacerbated by multimorbidity, yet integrated HIV/NCD care models show promise in reducing costs. However, patient-level data on the combined economic burden of HIV and hypertension remain scarce, particularly in South Africa’s UHC reform context. This paper contributes by quantifying OOP costs, identifying expenditure predictors, and assessing coping mechanisms among MOPHADHIV trial participants, offering evidence to mitigate financial hardship in integrated care programs.
Although South Africa offers free primary healthcare services [12], patients frequently incur significant out-of-pocket (OOP) costs, particularly when managing multiple chronic conditions [13]. These costs include direct non-medical expenses such as transport and food and indirect costs from lost wages due to time spent seeking care. Even for free healthcare services such as ART, total OOP costs can consume 15–30% of a household’s monthly income [14]. Managing hypertension typically involves additional visits, monitoring, and medication procurement expenses that are disproportionately burdensome for low-income households [15,16]. When HIV and hypertension coexist, the cumulative economic burden is likely amplified. Yet there remains a dearth of empirical evidence quantifying this burden at the patient level, with most research still focusing on health system costs or disease-specific expenditures [1,17].
Integrated models of HIV and NCD care have been proposed and piloted across SSA. These models are considered feasible and cost-effective, and can potentially enhance patient outcomes, streamline service delivery, and reduce financial strain [2,18]. Nevertheless, implementation remains limited, with integration often constrained by health workforce shortages, siloed funding streams, inconsistent drug procurement systems, and limited patient-level data to inform policy [2]. Health economists and policymakers have underscored the urgency of expanding chronic care platforms beyond HIV, leveraging established infrastructure and adapting lessons learned from decades of ART delivery to respond to the need to optimally care for rising multimorbidity [18].
This study analyses the economic burden data from the Mobile Phone Text Messages to Improve Hypertension Medication Adherence in Adults with HIV (MOPHADHIV) trial, a cluster-randomized evaluation of integrated HIV and hypertension care in South Africa. Specifically, we aimed to (i) quantify the direct non-medical, indirect, and coping costs associated with managing HIV and hypertension simultaneously, (ii) identify socio-demographic predictors of elevated monthly OOP expenditure, and (iii) assess coping strategies such as borrowing, asset sales, or skipping treatment. Findings from this study will inform South Africa’s Universal Health Coverage (UHC) reforms and offer policy-relevant insights for reducing financial hardship among multimorbid patients in resource-constrained settings.
2. Materials and Methods
2.1. Study Design and Analytical Framework
This study analysed patient-incurred costs using baseline data from the MOPHADHIV trial, a randomized control trial evaluating the effect of SMS adherence support for hypertension care in PLWH across public primary health facilities in the Western Cape Province of South Africa. The trial was conducted between 2021 and 2024 registered on Pan-African Clinical Trial Register, trial number: PACTR201811878799717 [19]. Data were collected from four selected community health centres: Mitchells Plain Community Day Centre (CDC), District 6 Community Health Centre (CHC), Mfuleni CHC, and Kraaifontein CHC. We adopted a cross-sectional study design, with analysis restricted to participants for whom complete cost and socioeconomic data were available. Our primary objective was to quantify the economic burden of care and identify the determinants of monthly OOP expenditure, as well as to assess coping strategies and cost burden thresholds. The analysis was conducted in Stata version 17 and followed a three-stage framework: (i) cost construction, (ii) regression estimation, and (iii) financial burden assessment.
2.2. Costing Perspective and Definitions
The study adopted a patient perspective to estimate the financial burden of care, focusing on three categories of patient-incurred costs: direct non-medical costs, indirect costs, and coping costs ((see Appendix 1 for survey items and measurement details). All costs were adjusted for inflation using year-specific deflators (2021 = 1.21; 2022 = 1.14; 2023 = 1.09; 2024 = 1.00), converted to 2024 South African Rand (ZAR), and subsequently to United States Dollars (USD) using a fixed exchange rate of ZAR 18.50/USD. To normalize the skewed distribution of cost data, all cost variables were log-transformed.
Direct medical costs including consultation fees, diagnostics, and medications were not included in this analysis. This exclusion reflects the South African health system context, where public primary care services are free at the point of use, particularly for chronic conditions such as HIV and hypertension. Therefore, most participants incurred no formal charges for medical services, making it inappropriate to include direct medical costs in the estimation of out-of-pocket expenditures from the patient perspective.
Cost variables were computed using the following formulas:
- Direct Non-Medical Costs
- 2.
- Indirect Costs
- Actual wage (self-reported):
- Minimum wage (ZAR 28.79/hr):
Where and are in minutes; is monthly income in ZAR.
- 3.
- Coping Costs
Coping costs refer to financial strategies’ patients use to manage healthcare-related expenses when regular income or savings are insufficient. These include the monetary value of loans taken, savings withdrawn, assets sold (e.g., household items), and any additional costs incurred from modifying dietary habits due to illness. These were captured through self-reported responses to structured questions (see Section H of Appendix 1).
- 4.
- Total Monthly Cost
All cost variables were adjusted for inflation using year-specific factors (2021=1.21; 2022=1.14; 2023=1.09; 2024=1.00), and log-transformed to correct for right-skewed distributions:
2.3. Covariates and Socioeconomic Measures
Demographic and socioeconomic variables were constructed and recoded as follows:
- ○
- Gender: Binary (0=Male, 1=Female)
- ○
- Age Group: 24–34, 35–49, 50–54, 55+ years
- ○
- Employment: Full-time, part-time/self-employed, unemployed/unable to work
- ○
- Education: No schooling, primary (Grade 1–7), secondary (Grade 8–12)
- ○
- Household Size: Small (≤3), Medium (4–6), Large (≥7)
- ○
- Travel Time (roundtrip): <30 min, 30–60 min, >60 min
Socioeconomic status (SES) was derived from self-reported income. Using Stata’s xtile command, we categorized participants into five income quintiles (poorest to richest). This approach enabled stratification of the cohort into distinct SES classes for analysis.
2.4. Model Construction and Specification
The determinants of total patient-incurred costs were estimated using generalized linear models (GLMs) with a gamma distribution and log link function, selected for their appropriateness in modelling right-skewed, non-negative cost data. Model construction followed a systematic approach: (1) Variable selection was guided by theoretical relevance (e.g., income, employment) and prior literature on healthcare expenditure in low-resource settings; (2) Distributional assumptions were validated through graphical inspection (e.g., Q-Q plots) and comparison of Akaike Information Criterion (AIC)/Bayesian Information Criterion (BIC) values across alternative families (gamma vs. inverse Gaussian); (3) Link function suitability was confirmed via Pearson residuals analysis, with the log link ensuring predicted costs remained positive; (4) Covariate coding adhered to interpretable referent categories (e.g., poorest income quintile as baseline). For robustness, we compared GLM results with ordinary least squares (OLS) on log-transformed costs, with both specifications including identical covariates. Model fit was assessed using scaled deviance statistics and residual plots, with no evidence of overdispersion.
Econometric Specification
We estimated the determinants of total patient-incurred costs using GLM with a gamma distribution and log link, as appropriate for cost data with non-negative skew:
Where:
- is the cost incurred by patient i
- is the vector of covariates described above
- β are coefficients estimated via quasi-likelihood
Sensitivity Analysis
To assess robustness, we estimated OLS regressions on log-transformed cost variables:
Where is the error term assumed to be Normal. Both OLS models included the same predictors as the GLM specification and used heteroskedasticity-robust standard errors.
Cost Burden and Catastrophic Expenditure
We evaluated the cost burden as a share of income:
Where is the percent burden for individual i and Ii is their monthly income. Catastrophic expenditure was defined for each patient as:
for thresholds t = {10%, 20%, 25%, 30%, 40%}. Proportions of individuals exceeding each threshold were tabulated
3. Results
3.1. Descriptive Statistics
The study initially included 697 participants. Most participants were middle-aged adults (35–49 years; 52.7%, 95% CI: 48.9–56.4) or in the pre-retirement (50–54 years; 20.4%, 95% CI: 17.5–23.5) and senior (≥55 years; 20.5%, 95% CI: 17.7–23.7) age groups. Gender distribution was skewed, with 80.6% (95% CI: 77.5–83.4) identifying as female. Regarding employment, 62.1% (95% CI: 58.4–65.7) were unemployed or unable to work, while 25.5% (95% CI: 22.3–28.9) reported full-time employment.
Among the 588 participants with education data, 77.6% (95% CI: 74.4–80.6) had attained secondary education, 18.2% (95% CI: 15.5–21.3) had only primary education, and 4.2% (95% CI: 2.9–5.9) had no formal schooling. Household sizes were mostly small (1–3 members; 46.1%, 95% CI: 42.4–49.8) or medium (4–6 members; 44.3%, 95% CI: 40.7–48.1), while 9.6% (95% CI: 7.6–12.0) lived in large households (7+ members), possibly reflecting urban housing patterns. Income data, available for 436 participants, indicated a relatively even distribution across quintiles, with slightly higher representation in the poorest (Q1: 20.2%, 95% CI: 16.7–24.2) and second (Q2: 23.4%, 95% CI: 19.7–27.6) groups. The richest quintile (Q5) comprised 19.0% (95% CI: 15.6–23.0).

Table 1.
Descriptive Statistics of Study Participants (N = 697 unless otherwise specified).
| Characteristic | N | % |
|---|---|---|
| Age Groups | ||
| Young adults (24–34) | 45 | 6.46 |
| Middle-age adults (35–49) | 367 | 52.65 |
| Pre-retirement (50–54) | 142 | 20.37 |
| Seniors (55+) | 143 | 20.52 |
| Gender | ||
| Male | 135 | 19.37 |
| Female | 562 | 80.63 |
| Employment Status (N = 683) | ||
| Employed full-time | 174 | 25.48 |
| Self-employed/part-time | 85 | 12.45 |
| Unemployed/unable to work | 424 | 62.08 |
| Education (N = 588) | ||
| No Schooling | 29 | 4.16 |
| Primary (Grade 1–7) | 127 | 18.22 |
| Secondary (Grade 8–12) | 541 | 77.62 |
| Household Size | ||
| Small (1–3 members) | 321 | 46.05 |
| Medium (4–6 members) | 309 | 44.33 |
| Large (7+ members) | 67 | 9.61 |
| Income Quintile (N = 436) | ||
| Poorest (Q1) | 88 | 20.18 |
| Second (Q2) | 102 | 23.39 |
| Middle (Q3) | 81 | 18.58 |
| Fourth (Q4) | 82 | 18.81 |
| Richest (Q5) | 83 | 19.04 |
3.2. Pathway from Sexual Violence Experience to Help-Seeking
A socioeconomic gradient is observed in the composition of costs (Table 2). Among the poorest quintile (Q1), coping costs constitute the largest share (61.4%), suggesting significant reliance on potentially adverse financial strategies to manage care-related expenses. In contrast, indirect costs dominate among wealthier groups, accounting for 72.3% of total costs in Q5, indicating that time lost (e.g., from work or caregiving) is a more salient component of economic burden in higher-income groups. Direct non-medical costs such as transport and food remain relatively consistent but modest in overall contribution across quintiles.
Figure 1 presents the mean patient-incurred costs by socio-economic status (SES) quintile, disaggregated into direct non-medical, indirect, and coping cost components. A clear gradient is observed across SES quintiles, with total costs increasing from the poorest (Q1) to the richest (Q5). Participants in the richest quintile incurred the highest average total cost (ZAR 197.93), more than double that of the poorest quintile (ZAR 81.07). This difference is primarily driven by indirect costs, which rose steeply from ZAR 21.19 in Q1 to ZAR 175.01 in Q5. Indirect costs reflect productivity losses from time spent traveling to and waiting at the clinic, calculated using either self-reported income or a standard minimum wage (see Methods). On average, participants reported 47.6 minutes of one-way travel time and 2.3 hours of waiting time per clinic visit, both of which contribute significantly to this cost component.
Figure 2 displays the distribution of total patient costs by socio-economic status. A clear downward trend is visible, with higher median costs among the poorest quintile (Q1) and progressively lower costs among richer quintiles. This visual pattern is supported by the Cuzick’s non-parametric test. As shown in Table 3, Cuzick’s non-parametric test for trend confirmed a significant decreasing trend in median total costs across income quintiles (z = –4.0, SE = 8.2, p < 0.001). The mean response score was highest in the poorest group (14.3 ZAR) and declined to 3.0 ZAR in the richest quintile, suggesting an inverse relationship between socio-economic status and out-of-pocket patient costs.
Direct non-medical costs, primarily transportation expenses, had a mean of ZAR 26.3 (USD 1.4) per month, although the median was substantially lower at ZAR 0.8 (USD 0.0), indicating that half of participants incurred minimal out-of-pocket transport costs (Table 4). The distribution was highly skewed, with the 90th percentile at ZAR 68.4 (USD 3.7) and a maximum of ZAR 436.0 (USD 23.6), suggesting that a subset of patients bore disproportionately high transport-related costs.
Indirect costs, reflecting productivity losses, varied significantly by valuation method. When based on self-reported income losses, the mean was ZAR 47.7 (USD 2.6) and the median was ZAR 28.5 (USD 1.5). However, when valued using the minimum wage to estimate opportunity costs, the mean increased to ZAR 124.2 (USD 6.7), with a median of ZAR 108.9 (USD 5.9). This substantial increase highlights the considerable time burden of care-seeking, even for those not formally employed. The 75th percentile under this valuation reached ZAR 162.1 (USD 8.8), indicating that at least one-quarter of participants experienced productivity losses equivalent to more than half a day's wages per month. Coping costs had a median of zero, indicating no reported financial coping strategies for at least half of participants. Nonetheless, the mean was ZAR 31.7 (USD 1.7), with maximum costs reaching ZAR 1,635.0 (USD 88.4), reflecting that a minority of individuals resorted to potentially harmful financial measures to manage care costs (Table 4).
Total monthly costs averaged ZAR 105.8 (USD 5.7) under the actual cost assumption and ZAR 182.3 (USD 9.9) under the minimum wage valuation for indirect costs. The 72% difference between these estimates underscores the importance of valuation method in assessing the true economic burden of chronic disease management. The distribution of total costs was also right-skewed, with the 90th percentile at ZAR 233.0 (USD 12.6) and ZAR 313.3 (USD 16.9) for actual and minimum wage-based valuations, respectively. Maximum costs exceeded ZAR 1,600.0 (USD 89.0), illustrating that a small proportion of patients experienced potentially catastrophic health expenditures (Table 4).
3.3. Regression
Table 5 reports the average marginal effects (AMEs) from GLMs with a gamma distribution and log link, estimating the association between socio-demographic characteristics and monthly patient-incurred costs. Across both models, most socio-demographic variables including gender, employment status, education level, household size, age group, and travel time were not statistically significantly associated with patient costs. For instance, compared to males, female participants incurred ZAR 4.9 less (95% CI: –42.5 to 32.7) in Model 1 and ZAR 6.8 less (95% CI: –44.5 to 30.9) in Model 2; both differences were statistically insignificant. Similarly, being self-employed or unemployed, relative to full-time employment, was not significantly associated with monthly costs in either model. Education levels and household size also showed no consistent associations, although participants from large households (7+ members) incurred ZAR 257.0 less in Model 2 (95% CI: –512.2 to –0.0), a marginally significant result.
A clearer pattern emerged with respect to income quintiles. In Model 1, which uses actual indirect costs, a significant socio-economic gradient was evident: individuals in the fourth and richest income quintiles incurred significantly higher monthly costs relative to the poorest. Specifically, participants in the fourth quintile incurred ZAR 49.6 more (95% CI: 11.5 to 87.7), and those in the richest quintile incurred ZAR 131.9 more (95% CI: 63.6 to 200.1) monthly costs relative to the poorest quintile. In contrast, when indirect costs were imputed using the minimum wage (Model 2), these gradients largely disappeared or even reversed. For example, individuals in the middle-income quintile (Q3) incurred ZAR 47.3 less than the poorest group (95% CI: –92.3 to –2.2), suggesting that when productivity losses are standardized, lower-income individuals may bear a proportionally higher cost burden. Travel time to the facility was not significantly associated with cost in Model 1. However, in Model 2, those who travelled more than 60 minutes incurred ZAR 42.0 more (95% CI: –8.9 to 92.9) cost, although this difference was not statistically significant.
Table 6 and Figure 3 present the (AMEs of socio-demographic factors on OOP healthcare expenditure, estimated from GLMs with a gamma distribution and log link. Figure 3 visualizes these effects by plotting point estimates and 95% confidence intervals for each covariate. Overall, few variables were statistically significant predictors of OOP costs. Gender was not associated with significant differences; female participants incurred ZAR 4.6 less costs per month than males (95% CI: –45.2 to 36.1). Employment status, education level, household size, and age group similarly showed no statistically meaningful associations. For example, individuals with secondary education incurred ZAR 2.3 more costs than those with no schooling (95% CI: –89.3 to 93.8), and participants from large households (7+ members) had a non-significant increase of ZAR 7.3 (95% CI: –61.0 to 75.6).
In contrast, there was clear evidence of an income-related gradient in monthly OOP costs. Compared to individuals in the poorest quintile (Q1), those in the fourth quintile (Q4) incurred significantly higher costs (AME: ZAR 50.8, 95% CI: 12.9 to 88.7, p=0.009), while participants in the richest quintile (Q5) had the largest incremental cost (AME: ZAR 128.2, 95% CI: 63.0 to 193.4, p<0.001). This pattern may partly reflect greater choice autonomy among higher-income individuals, for example, the ability to opt for additional services, purchase preferred food items, or choose faster (but costlier) transport options. These associations are visually evident in Figure 3, where only Q4 and Q5 have confidence intervals that do not cross zero indicating statistically significant effects. The income quintile results demonstrate both larger point estimates and narrower confidence intervals relative to other covariates, supporting the conclusion that income is the most consistent socio-demographic correlate of OOP healthcare expenditure in this sample.
3.4. Sensitivity Analysis
Figure 4 displays the distribution of log-transformed total patient costs (ln[Total Cost + 1]), which approximates a normal distribution and supports the use of linear regression for sensitivity analysis. Table 7 presents the results from two OLS models regressing log-transformed total costs on socio-demographic variables. Model 1 uses actual reported indirect costs, while Model 2 substitutes these with minimum wage-based imputed costs.
In Model 1, higher household income was positively associated with higher log-transformed total costs. Compared to individuals in the poorest quintile (Q1), those in Q2 (β = 0.8, 95% CI: 0.4 to 1.2), Q3 (β = 0.9, 95% CI: 0.5 to 1.3), Q4 (β = 1.3, 95% CI: 0.9 to 1.7), and Q5 (β = 1.7, 95% CI: 1.3 to 2.1) reported progressively higher costs, with all estimates statistically significant at p < 0.001. These findings are consistent with the earlier marginal effects analysis, highlighting a socio-economic gradient in patient costs when actual opportunity costs are applied. The model explained 28% of the variation in log-transformed total costs (R² = 0.28).
In contrast, when indirect costs were estimated using the minimum wage approach (Model 2), the association between income and costs was attenuated or reversed. Individuals in the middle-income quintile (Q3) had significantly lower costs compared to the poorest group (Q1) (β = –0.3, 95% CI: –0.5 to –0.0, p < 0.05), while differences across other income quintiles were not statistically significant. The explanatory power of Model 2 was substantially lower (R² = 0.06), suggesting that minimum wage-based estimates may obscure socio-economic variation in patient costs.
Other covariates were largely not significantly associated with total costs in either model. Exceptions include household size and travel time in Model 2. Participants from large households (7+ members) incurred significantly lower costs compared to those from small households (β = –0.3, 95% CI: –0.5 to –0.0, p < 0.05), while those who travelled more than 60 minutes to access care reported higher costs compared to those living within 30 minutes (β = 0.3, 95% CI: 0.0 to 0.5, p < 0.05). Gender, employment status, education level, and age group were not significantly associated with costs in either specification.
4. Discussion
This study aimed to quantify the economic burden of accessing and receiving care for hypertension among PLWH in South Africa, assess predictors of monthly OOP expenditure, and explore coping mechanisms used by patients. By adopting a patient-level perspective and drawing on detailed cost data from the MOPHADHIV trial, our findings provide new empirical insights into the financial challenges experienced by patients managing multiple chronic conditions in a resource-constrained setting. Despite both hypertension and HIV services being offered free at the point of care, our findings show that PLWH with comorbid hypertension still incur non-trivial on-medical, indirect, and coping-related costs. When valuing productivity losses using the minimum wage, average monthly expenditures remained meaningful, highlighting the persistent economic burden associated with managing chronic multimorbidity, even in a publicly funded health system. While these costs were not catastrophic for most participants, they underscore the importance of protecting lower-income patients from cumulative financial strain. These figures are consistent with findings from Uganda and Kenya, where PLWH with multimorbidity similarly reported monthly cost burdens that exceeded 10% of household income, particularly when transport, lost income, and supplementary medicine costs were included [20,21].
Our disaggregated data reveal that indirect costs primarily time lost to care-seeking are the single largest cost component, echoing prior studies showing that health-related time loss is a critical but often underestimated driver of patient economic burden [2,22]. Notably, even among unemployed individuals, opportunity costs remain high, underscoring the hidden productivity burden associated with routine clinic visits [23]. Our regression models show a clear socioeconomic gradient in patient-incurred costs: wealthier patients incurred significantly higher absolute expenditures, particularly when using actual reported income to calculate productivity losses. For example, individuals in the richest quintile (Q5) spent more per month than those in the poorest (Q1), a statistically significant difference that persisted across multiple model specifications. These findings mirror national-level data indicating that hypertension care in South Africa generates higher total costs among more affluent patients, likely due to increased use of diagnostics and medication [24]. This may also reflect greater ability among wealthier individuals to navigate the health system and the financial flexibility to opt for additional or higher-cost services, consistent with fundamental cause theory on SES-related access to health resources and evidence linking higher SES to improved health literacy and service utilization [25].
However, sensitivity analyses using standardized (minimum wage) valuations present a different picture, shifting the apparent cost burden toward middle-income groups. This may still reflect wealth-related differences in choice and healthcare-seeking behavior, but highlights how valuation methods influence the interpretation of who bears the greatest relative burden. When controlling for wage differentials, the burden appears to shift disproportionately toward lower-income patients particularly those in the middle-income quintiles who may not qualify for social protection but still face barriers to care [1,22]. This highlights the importance of adopting relative as well as absolute measures of financial burden, especially in settings with vast income inequality and large informal labour markets.
Although the median coping cost was zero, nearly half the sample reported some form of coping expenditure. Importantly, 40 individuals (9.6%) experienced catastrophic health spending exceeding 10% of their income, with a smaller subset of 11–12 individuals (2.6–2.9%) reporting costs above 30% to 40% of monthly income. These outliers illustrate that a non-negligible segment of patients faces substantial financial hardship, even within a system offering free public sector care. While our findings indicate that a smaller proportion of patients reported borrowing or selling assets to cover healthcare costs, such coping strategies were still present and may carry longer-term risks to household financial stability. In comparison, studies from settings with less comprehensive public health coverage such as Zimbabwe have reported substantially higher rates, with over 25% of patients resorting to asset sales or borrowing to afford chronic disease care [26]. Such coping mechanisms can have long-term repercussions on household financial stability and increase vulnerability to future health shocks.
The presence of extreme cost outliers even among the poorest SES groups reinforces the idea that catastrophic expenditure is not limited to higher earners. It can also reflect structural and geographic barriers such as poor transport infrastructure, fragmented healthcare service delivery, and the lack of integrated care [18,22]. Surprisingly, most socio-demographic predictors including gender, education, and employment were not significantly associated with patient costs. This aligns with prior work in Kenya and South Africa, which found that SES, rather than demographic variables per se, was the most consistent predictor of financial burden [12,13,20]. However, travel time emerged as a marginally significant predictor in sensitivity models, supporting arguments that geographic access remains an important structural determinant of care burden [1,27].
Our findings reinforce calls for integrated healthcare service delivery models that combine HIV and NCD care, as this approach can reduce patient time and transport costs by minimizing the need for multiple clinic visits. While some integration exists in South Africa, implementation remains inconsistent and often limited in scope, highlighting the need for more systematic and patient-centred integration efforts [2,18]. In the MOPHADHIV trial clinics, HIV and hypertension services were co-located within primary care facilities, but integration was partial, characterized by separate registers, clinical teams, and follow-up systems. This siloed structure contributed to duplicate visits and fragmented care, inflating both direct and indirect patient costs. Strengthening integration could reduce cumulative time losses, streamline service delivery, and enable more efficient management of multimorbidity without increasing financial burden. The observed income gradient in patient-incurred costs suggests that lower-income individuals may face proportionally higher financial strain, even if absolute costs remain modest. These findings highlight the potential value of exploring targeted financial protection strategies such as transport support or differentiated subsidies to enhance equity within the health system In addition, incorporating indirect costs into benefit design and economic evaluations may help ensure that reforms under South Africa’s UHC agenda are responsive to the time and productivity losses experienced by patients managing multiple chronic conditions.
Strengths and Limitations
This study contributes a unique micro-costing dataset from a real-world primary care setting, using robust econometric methods including GLMs with gamma distribution and log link, and sensitivity checks using OLS models. Nevertheless, limitations include the reliance on self-reported income and time-use data, potential recall bias in coping cost reporting, and limited generalizability beyond public sector facilities in urban settings.
5. Conclusions
Our findings demonstrate that managing comorbid HIV and hypertension in South Africa imposes significant, and often hidden, economic costs on patients particularly through time-related opportunity costs. Income is the primary driver of cost variation, with implications for both health equity and system design. As South Africa moves toward UHC, integrated care and patient-centred financing strategies must be prioritized to prevent financial hardship among the chronically ill.
Author Contributions
D.J.H led the conceptualization, methodology, data curation, formal analysis, and writing of the original draft. A.P.K provided supervision, validation, and contributed to review and editing. N.P contributed to validation and manuscript review. K.N contributed to validation and manuscript review. K.B provided methodological guidance, validation, and contributed to manuscript review. O.A supervised the study, provided validation and methodological guidance, and contributed to the review and editing of the manuscript.
Funding
Funding for this work was obtained from the South African Medical Research Council. The content of this review is solely the responsibility of the authors and does not necessarily represent the official views of the South African Medical Research Council.
Institutional Review Board Statement
The MOPHADHIV trial:from which the baseline data for this study were drawn, was conducted in accordance with the Declaration of Helsinki and received ethical approval from the South African Medical Research Council (SAMRC) Human Research Ethics Committee (Protocol ID: EC006-2/2017; amendment approval granted on 23 April 2021). The present economic burden analysis received separate ethical approval from the Human Research Ethics Committee (HREC) of the University of Cape Town (HREC reference number 284/2022; approval granted on 23 June 2022).
Data Availability Statement
The data used and analyzed during the current study are not publicly available due to participant confidentiality and data protection agreements but may be made available from the corresponding author on reasonable request and with appropriate institutional approvals.
Acknowledgments
The authors gratefully acknowledge the participants of the MOPHADHIV trial for their time and willingness to contribute to this research. We also thank the study teams and clinic staff who supported data collection. Special thanks to the South African Medical Research Council (SAMRC) and the University of Cape Town for institutional support throughout the study. We are also grateful to colleagues who provided input during the design and analysis phases of this work.
Conflicts of Interest
No competing interests.
Consent for publication
All authors have reviewed and consented to the publication of this manuscript.
| 1 | Average Marginal Effects |
| 2 | Standard Error |
| 3 | 95% Confidence Interval |
| 4 | Standard Error |
References
- McCombe G, Lim J, Van Hout MC, Lazarus J V, Bachmann M, Jaffar S, et al. Integrating care for diabetes and hypertension with HIV care in sub-Saharan Africa: a scoping review. Int J Integr Care 2022;22:6. [CrossRef]
- McCombe G, Murtagh S, Lazarus J V, Van Hout MC, Bachmann M, Jaffar S, et al. Integrating diabetes, hypertension and HIV care in sub-Saharan Africa: a Delphi consensus study on international best practice. BMC Health Serv Res 2021;21:1–9. [CrossRef]
- Johnson LCM, Khan SH, Ali MK, Galaviz KI, Waseem F, Ordóñez CE, et al. Understanding barriers and facilitators to integrated HIV and hypertension care in South Africa. Implement Sci Commun 2024;5:87. [CrossRef]
- Desborough J, Maskell-Knight C, Wang S, Parkinson A, Butler D, Law H-D, et al. Lived experience of out-of-pocket costs of health care and medicines by people with chronic conditions and their families in Australia: a systematic review of the qualitative literature. Health Policy (New York) 2025:105359. [CrossRef]
- Reid E, Ghoshal A, Khalil A, Jiang J, Normand C, Brackett A, et al. Out-of-pocket costs near end of life in low- and middle-income countries: A systematic review. PLOS Global Public Health 2022;2:e0000005. [CrossRef]
- Cholong BJ, Mayin KB, Aloysius NM. The Determinants of Catastrophic Health Expenditure and Coping Strategies for Households with People Living With HIV/AIDS in the Nkambe District Hospital, Cameroon. Eur J Health Sci 2022;7:36–48. [CrossRef]
- Adeniran A, Ojo OY, Chieme FC, Shogbamimu Y, Olowofeso HO, Sidibé I, et al. Investigating catastrophic health expenditure among people living with HIV and AIDS in South Western Nigeria. Health Care Science 2023;2:370–80. [CrossRef]
- Wirtz VJ, Hogerzeil H V, Gray AL, Bigdeli M, de Joncheere CP, Ewen MA, et al. Essential medicines for universal health coverage. The Lancet 2017;389:403–76. [CrossRef]
- World Health Organization. Global Health Expenditure Database. World Health Organisation: Global Health Expenditure Database 2020. https://apps.who.int/nha/database (accessed July 23, 2025).
- Herskind J, Zelasko J, Bacher K, Holmes D. The outpatient management of hypertension at two Sierra Leonean health centres: A mixed-method investigation of follow-up compliance and patient-reported barriers to care. Afr J Prim Health Care Fam Med 2020;12. [CrossRef]
- Kohli-Lynch CN, Erzse A, Rayner BL, Hofman KJ. Hypertension in the South African public healthcare system: a cost-of-illness and burden of disease study. BMJ Open 2022;12:e055621. [CrossRef]
- Babikir A, Satty A, Mwambi H. Determinants of out-of-pocket health expenditure and their welfare implications in a South African context. Journal of Economic and Financial Sciences 2018;11:1–7. [CrossRef]
- Gordon T, Booysen F, Mbonigaba J. Socio-economic inequalities in the multiple dimensions of access to healthcare: the case of South Africa. BMC Public Health 2020;20:1–13. [CrossRef]
- Chimbindi N, Bor J, Newell M-L, Tanser F, Baltussen R, Hontelez J, et al. Time and money: the true costs of health care utilization for patients receiving “free” HIV/tuberculosis care and treatment in rural KwaZulu-Natal. JAIDS Journal of Acquired Immune Deficiency Syndromes 2015;70:e52–60.
- Schutte AE, Srinivasapura Venkateshmurthy N, Mohan S, Prabhakaran D. Hypertension in low-and middle-income countries. Circ Res 2021;128:808–26.
- Kostova D, Spencer G, Moran AE, Cobb LK, Husain MJ, Datta BK, et al. The cost-effectiveness of hypertension management in low-income and middle-income countries: a review. BMJ Glob Health 2020;5:e002213. [CrossRef]
- Moyo-Chilufya M, Maluleke K, Kgarosi K, Muyoyeta M, Hongoro C, Musekiwa A. The burden of non-communicable diseases among people living with HIV in Sub-Saharan Africa: a systematic review and meta-analysis. EClinicalMedicine 2023;65. [CrossRef]
- van der Mannen JS, Heine M, Lalla-Edward ST, Ojji DB, Mocumbi AO, Klipstein-Grobusch K. Lessons Learnt from HIV and Noncommunicable Disease Healthcare Integration in Sub-Saharan Africa. Glob Heart 2024;19:85. [CrossRef]
- South African Medical Research Council SACC. Mobile phone SMS for adherence support for hypertension in South African adults in care for HIV infection. Pan African Clinical Trials Registry 2025. https://pactr.samrc.ac.za/TrialDisplay.aspx?TrialID=4711 (accessed May 21, 2025).
- Oyando R, Njoroge M, Nguhiu P, Kirui F, Mbui J, Sigilai A, et al. Patient costs of hypertension care in public health care facilities in Kenya. Int J Health Plann Manage 2019;34:e1166–78. [CrossRef]
- Sando D, Kintu A, Okello S, Kawungezi PC, Guwatudde D, Mutungi G, et al. Cost-effectiveness analysis of integrating screening and treatment of selected non-communicable diseases into HIV/AIDS treatment in Uganda. J Int AIDS Soc 2020;23:e25507. [CrossRef]
- Binyaruka P, Mtenga S. Catastrophic health care spending in managing type 2 diabetes before and during the COVID-19 pandemic in Tanzania. PLOS Global Public Health 2023;3:e0002180. [CrossRef]
- Forsythe SS, McGreevey W, Whiteside A, Shah M, Cohen J, Hecht R, et al. Twenty years of antiretroviral therapy for people living with HIV: global costs, health achievements, economic benefits. Health Aff 2019;38:1163–72. [CrossRef]
- Masupe, TK. Improving Self-management for Type 2 diabetes and hypertension patients in Peri-urban townships in the Western Cape, South Africa 2022.
- Coughlin SS, Vernon M, Hatzigeorgiou C, George V. Health literacy, social determinants of health, and disease prevention and control. J Environ Health Sci 2020;6:3061.
- Timire C, Ngwenya M, Chirenda J, Metcalfe JZ, Kranzer K, Pedrazzoli D, et al. Catastrophic costs among tuberculosis-affected households in Zimbabwe: A national health facility-based survey. Tropical Medicine & International Health 2021;26:1248–55. [CrossRef]
- Evans M V, Andréambeloson T, Randriamihaja M, Ihantamalala F, Cordier L, Cowley G, et al. Geographic barriers to care persist at the community healthcare level: Evidence from rural Madagascar. PLOS Global Public Health 2022;2:e0001028.
Figure 1.
Mean costs by socio-economic status.
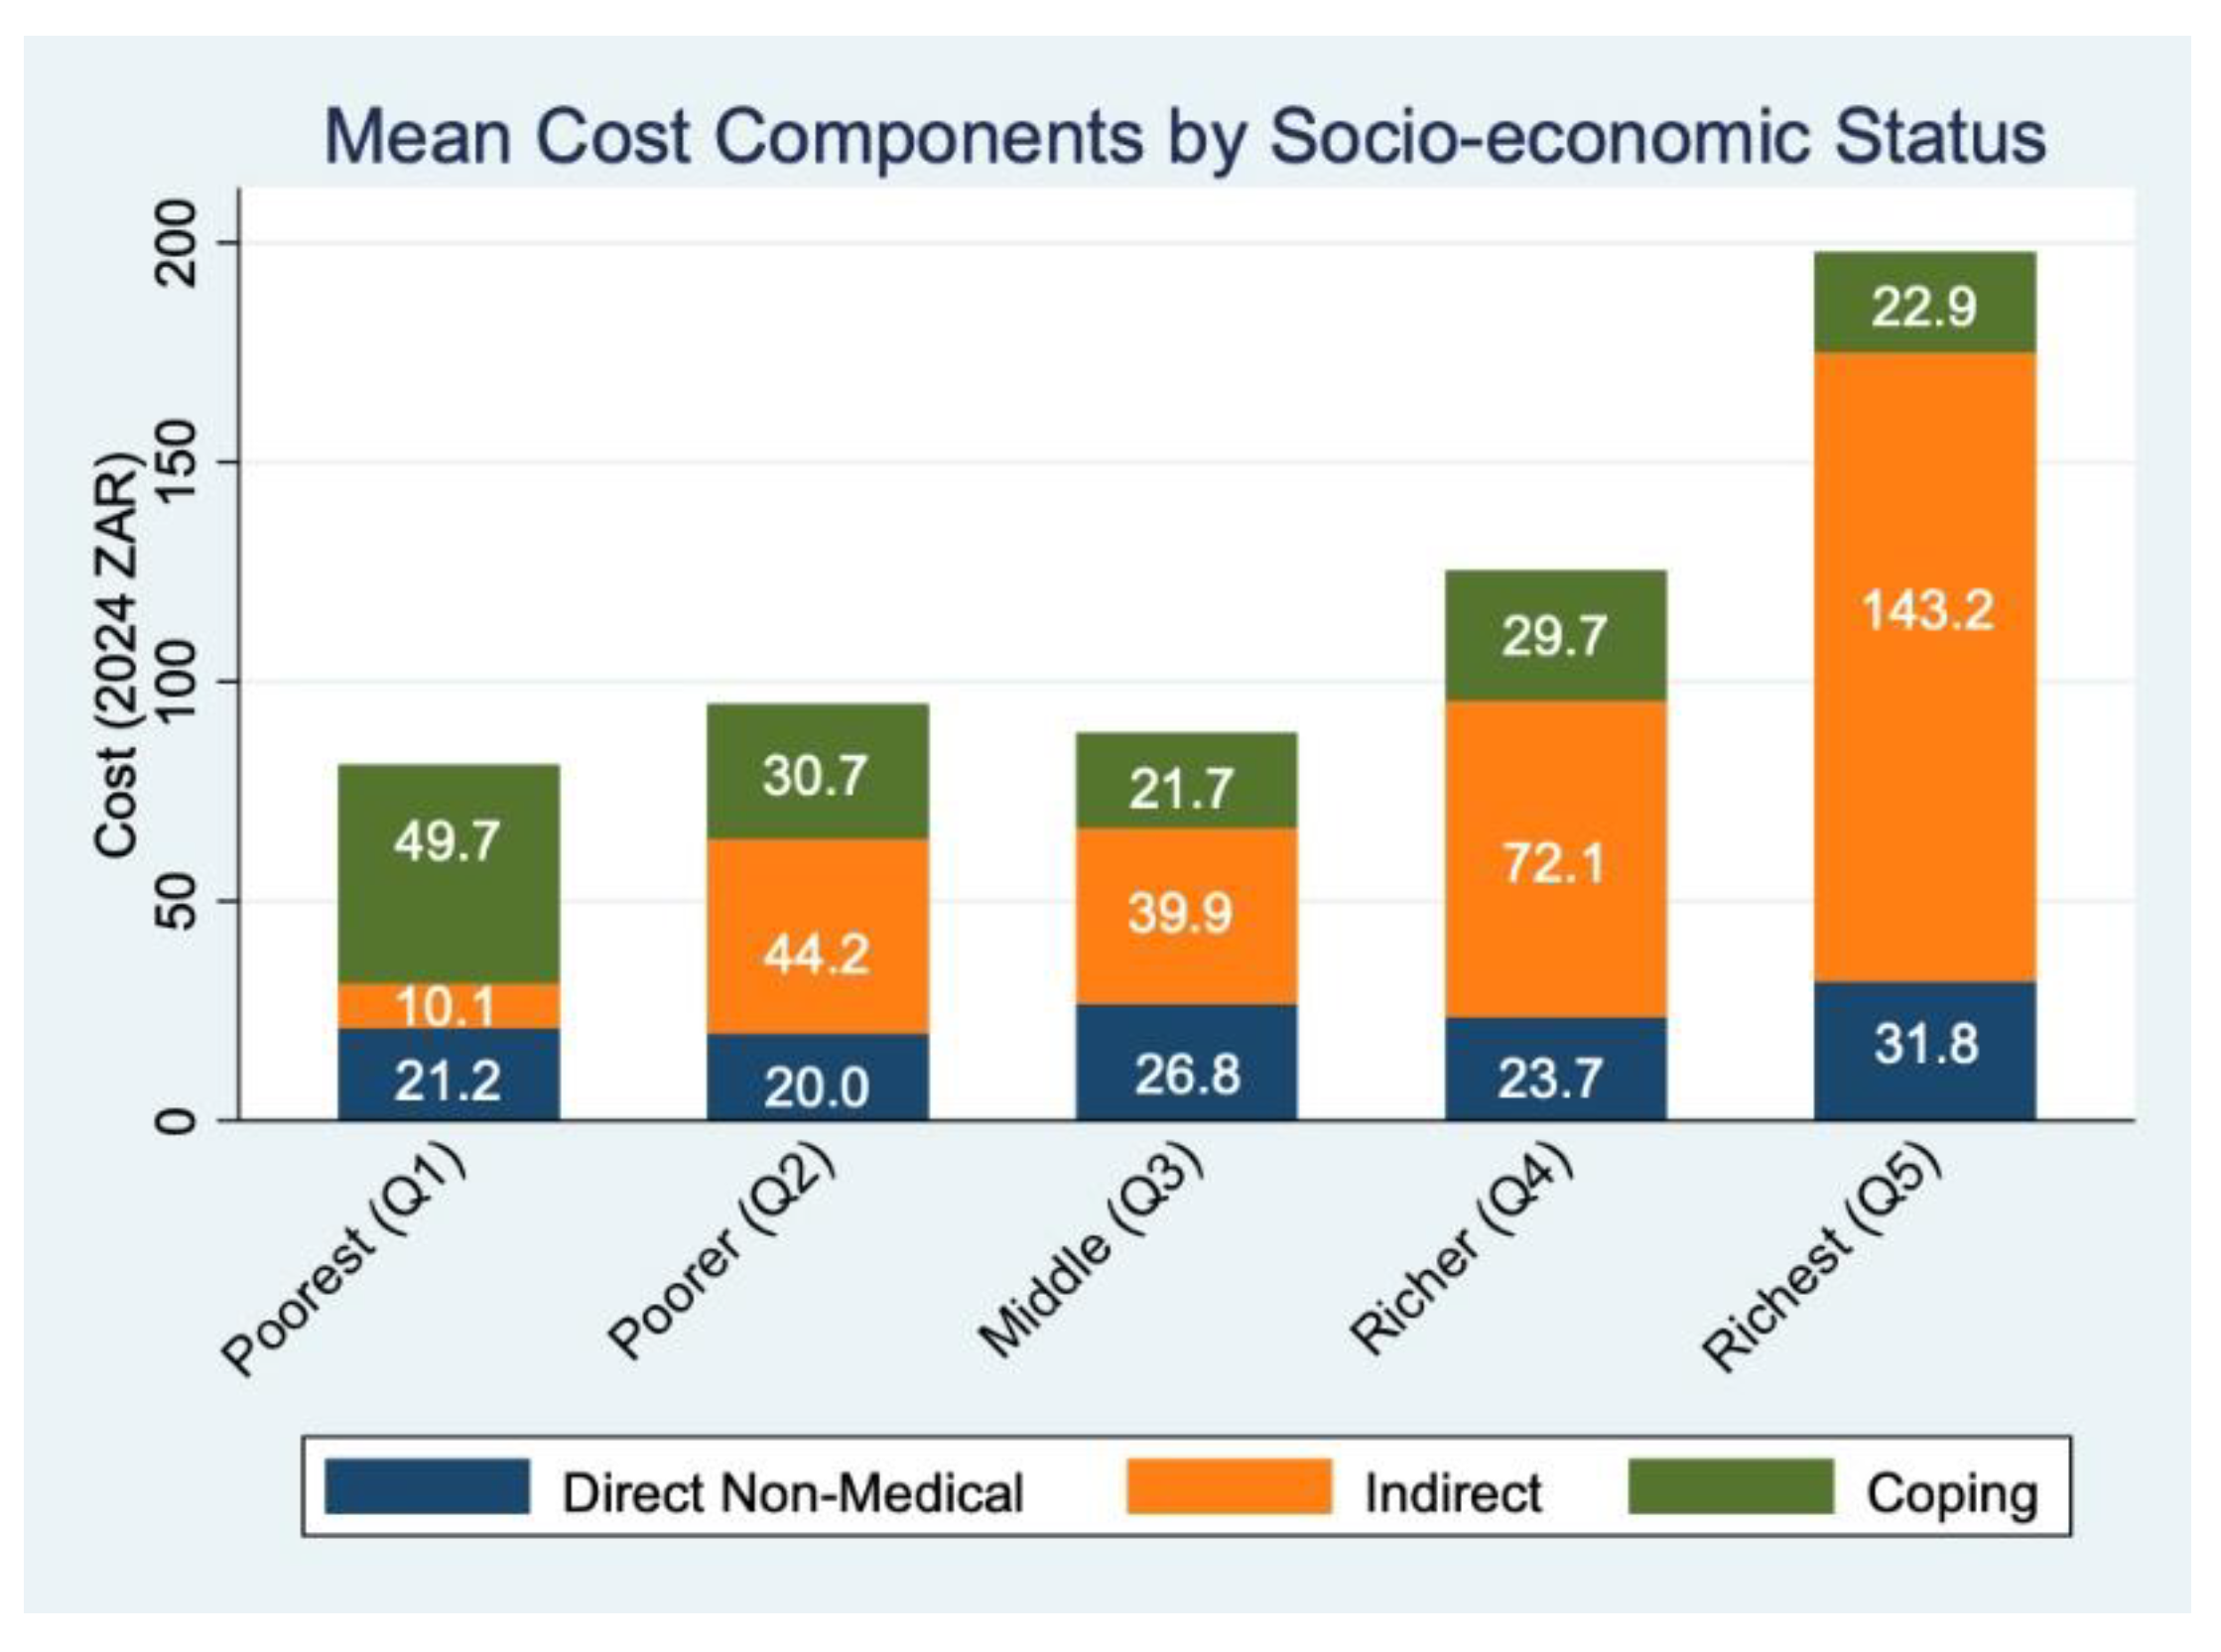
Figure 2.
Mean costs by socio-economic status.
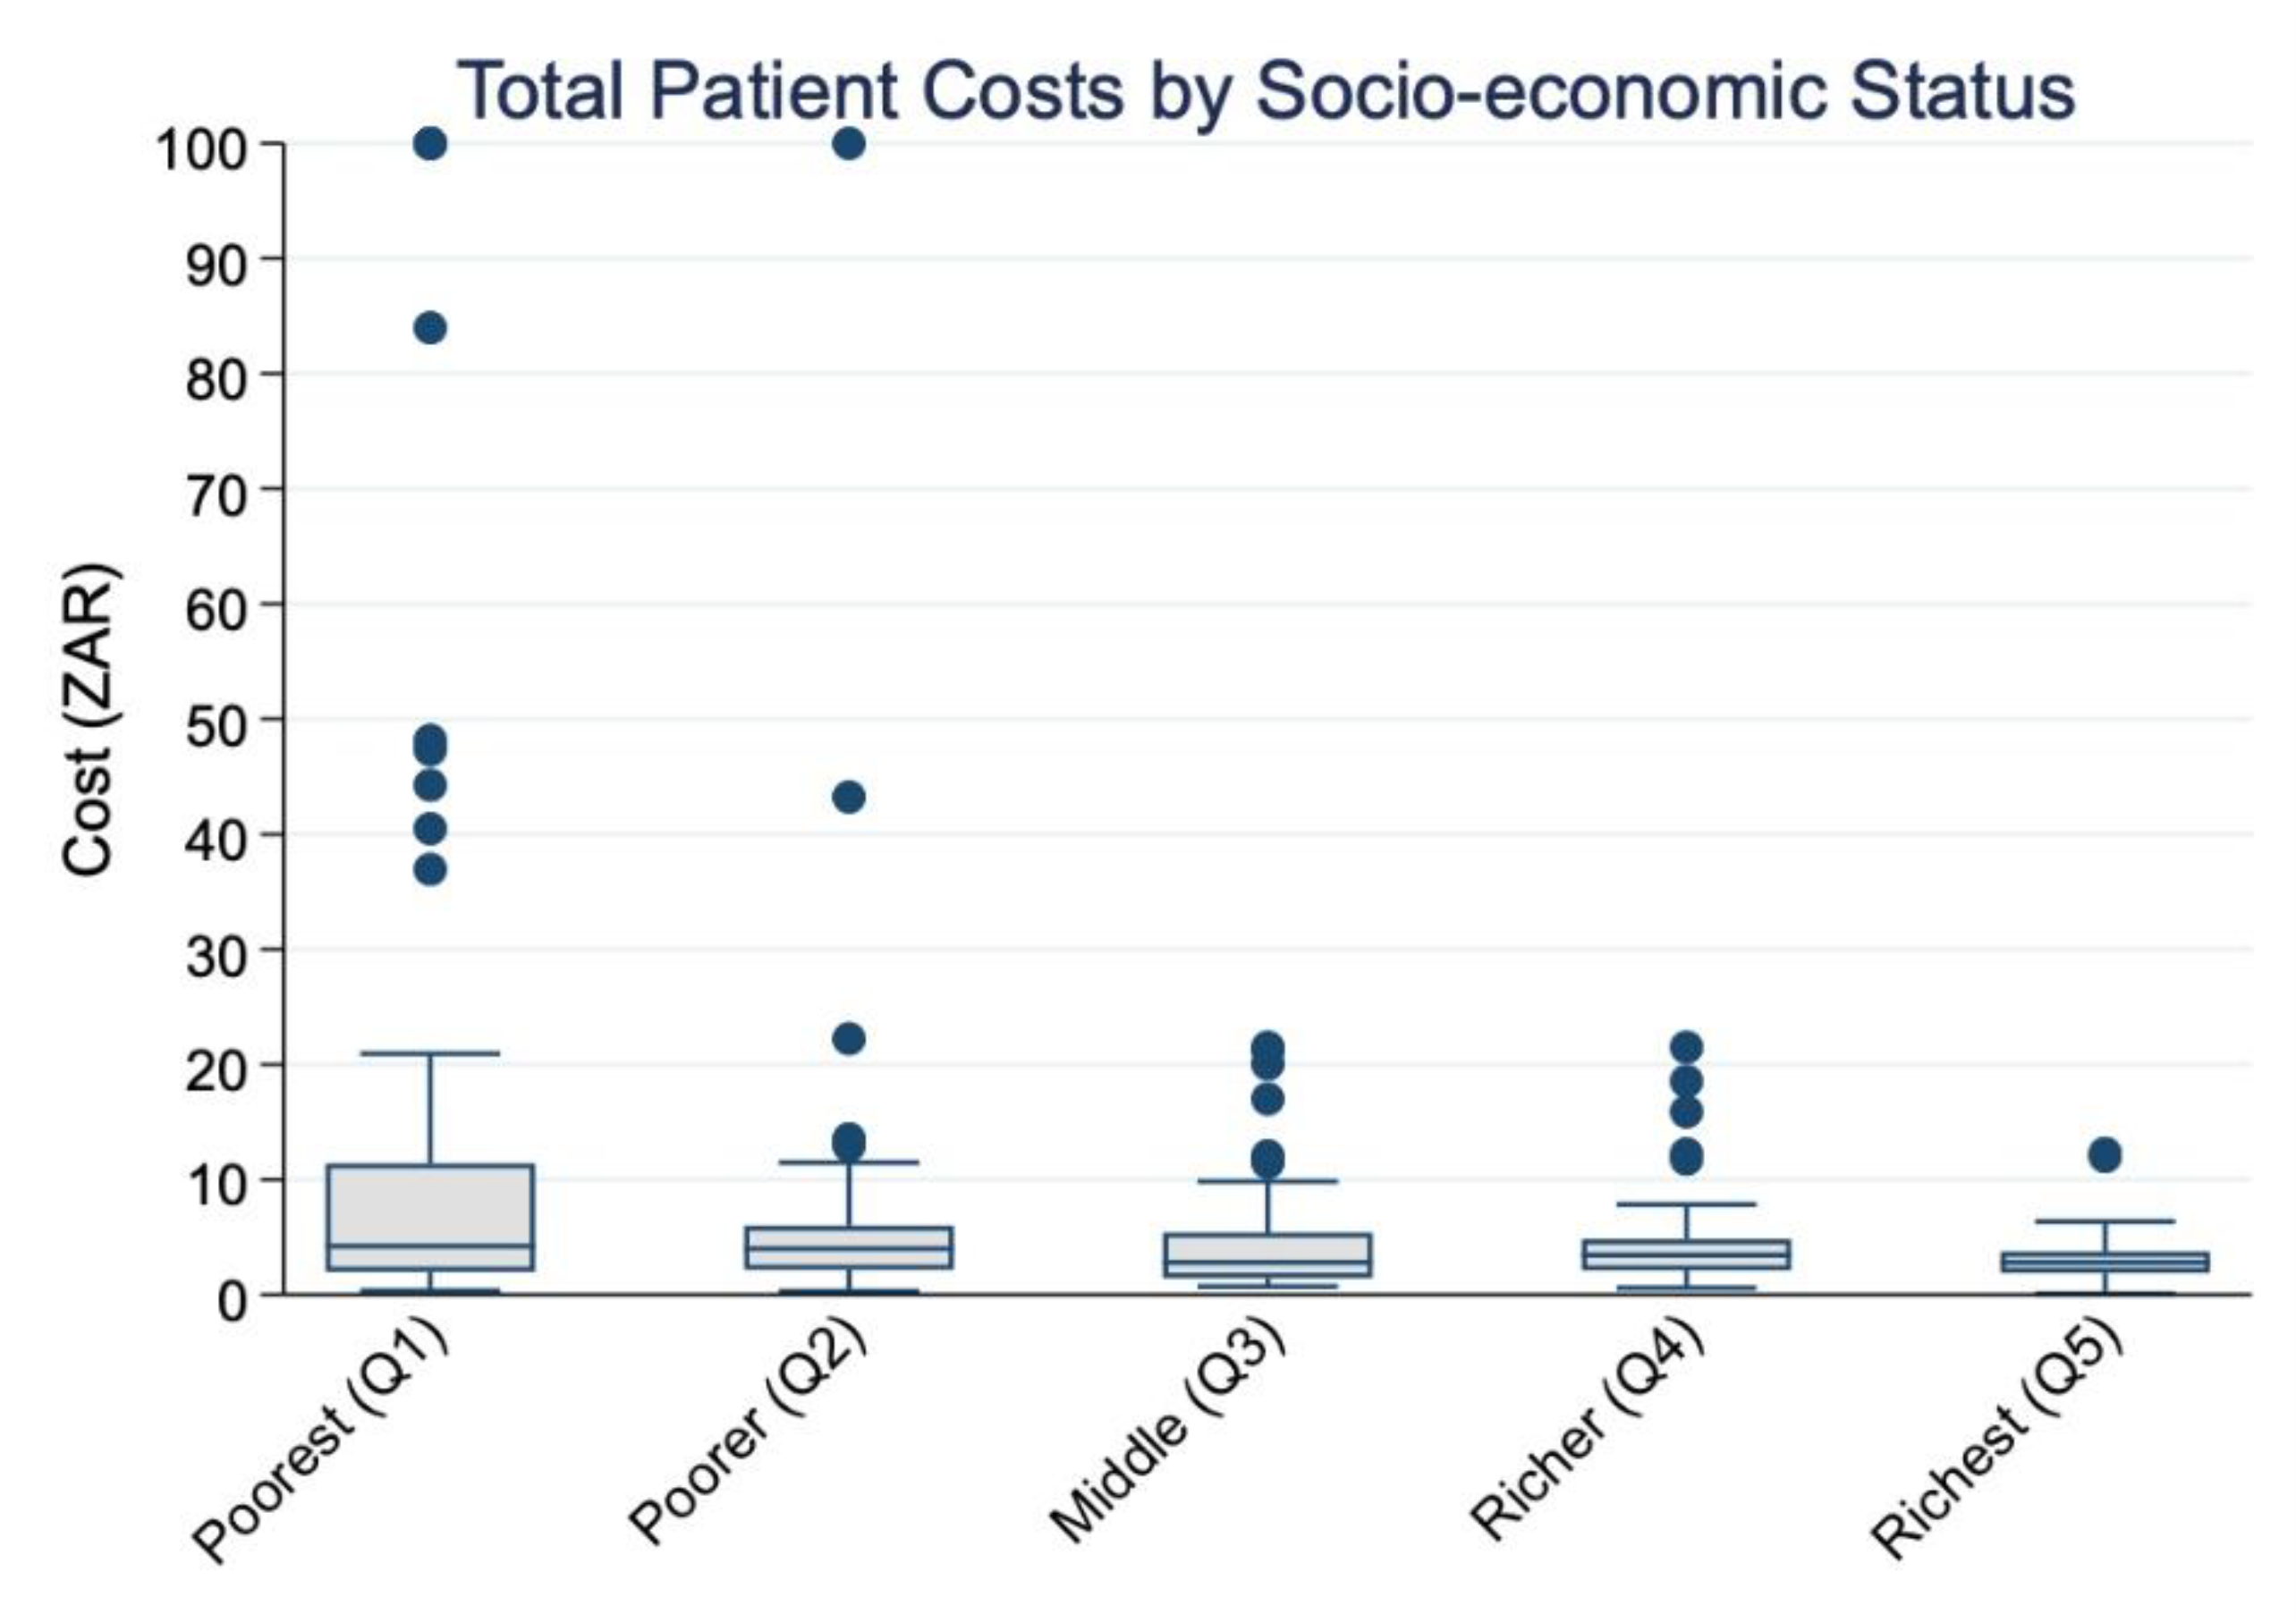
Figure 3.
Marginal effects on total costs (GLM).
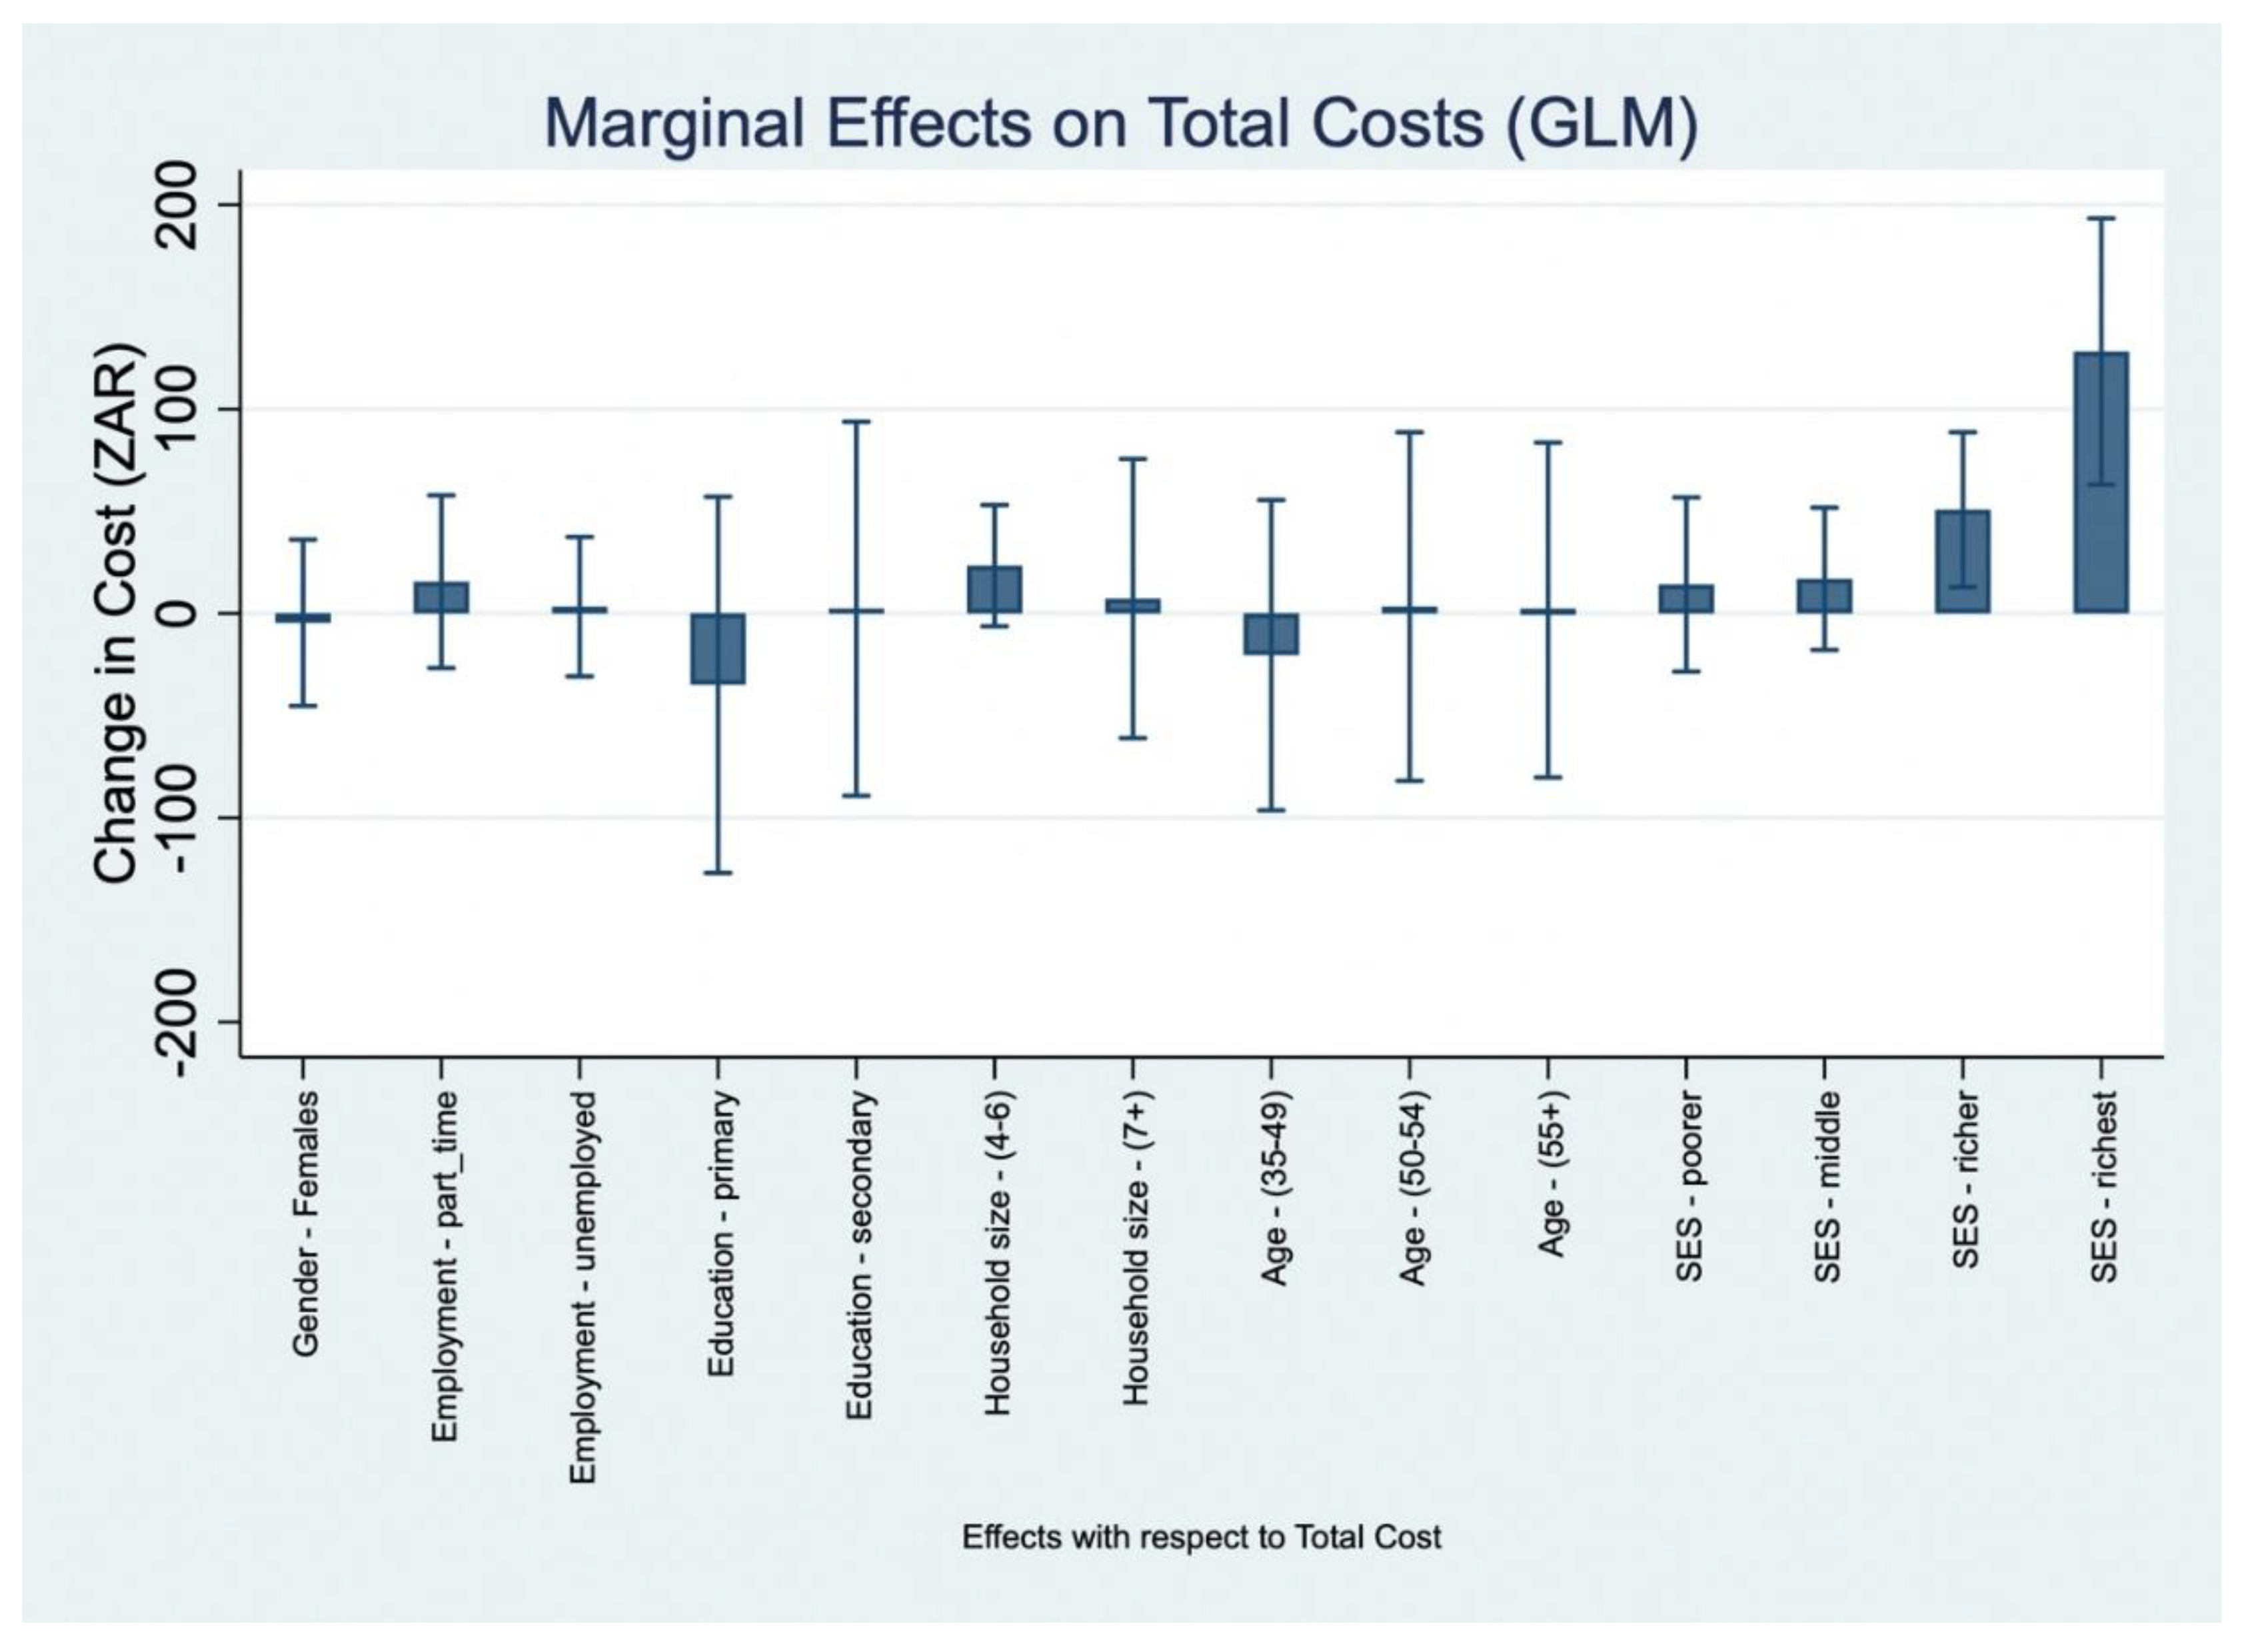
Figure 4.
Log transformed total costs.
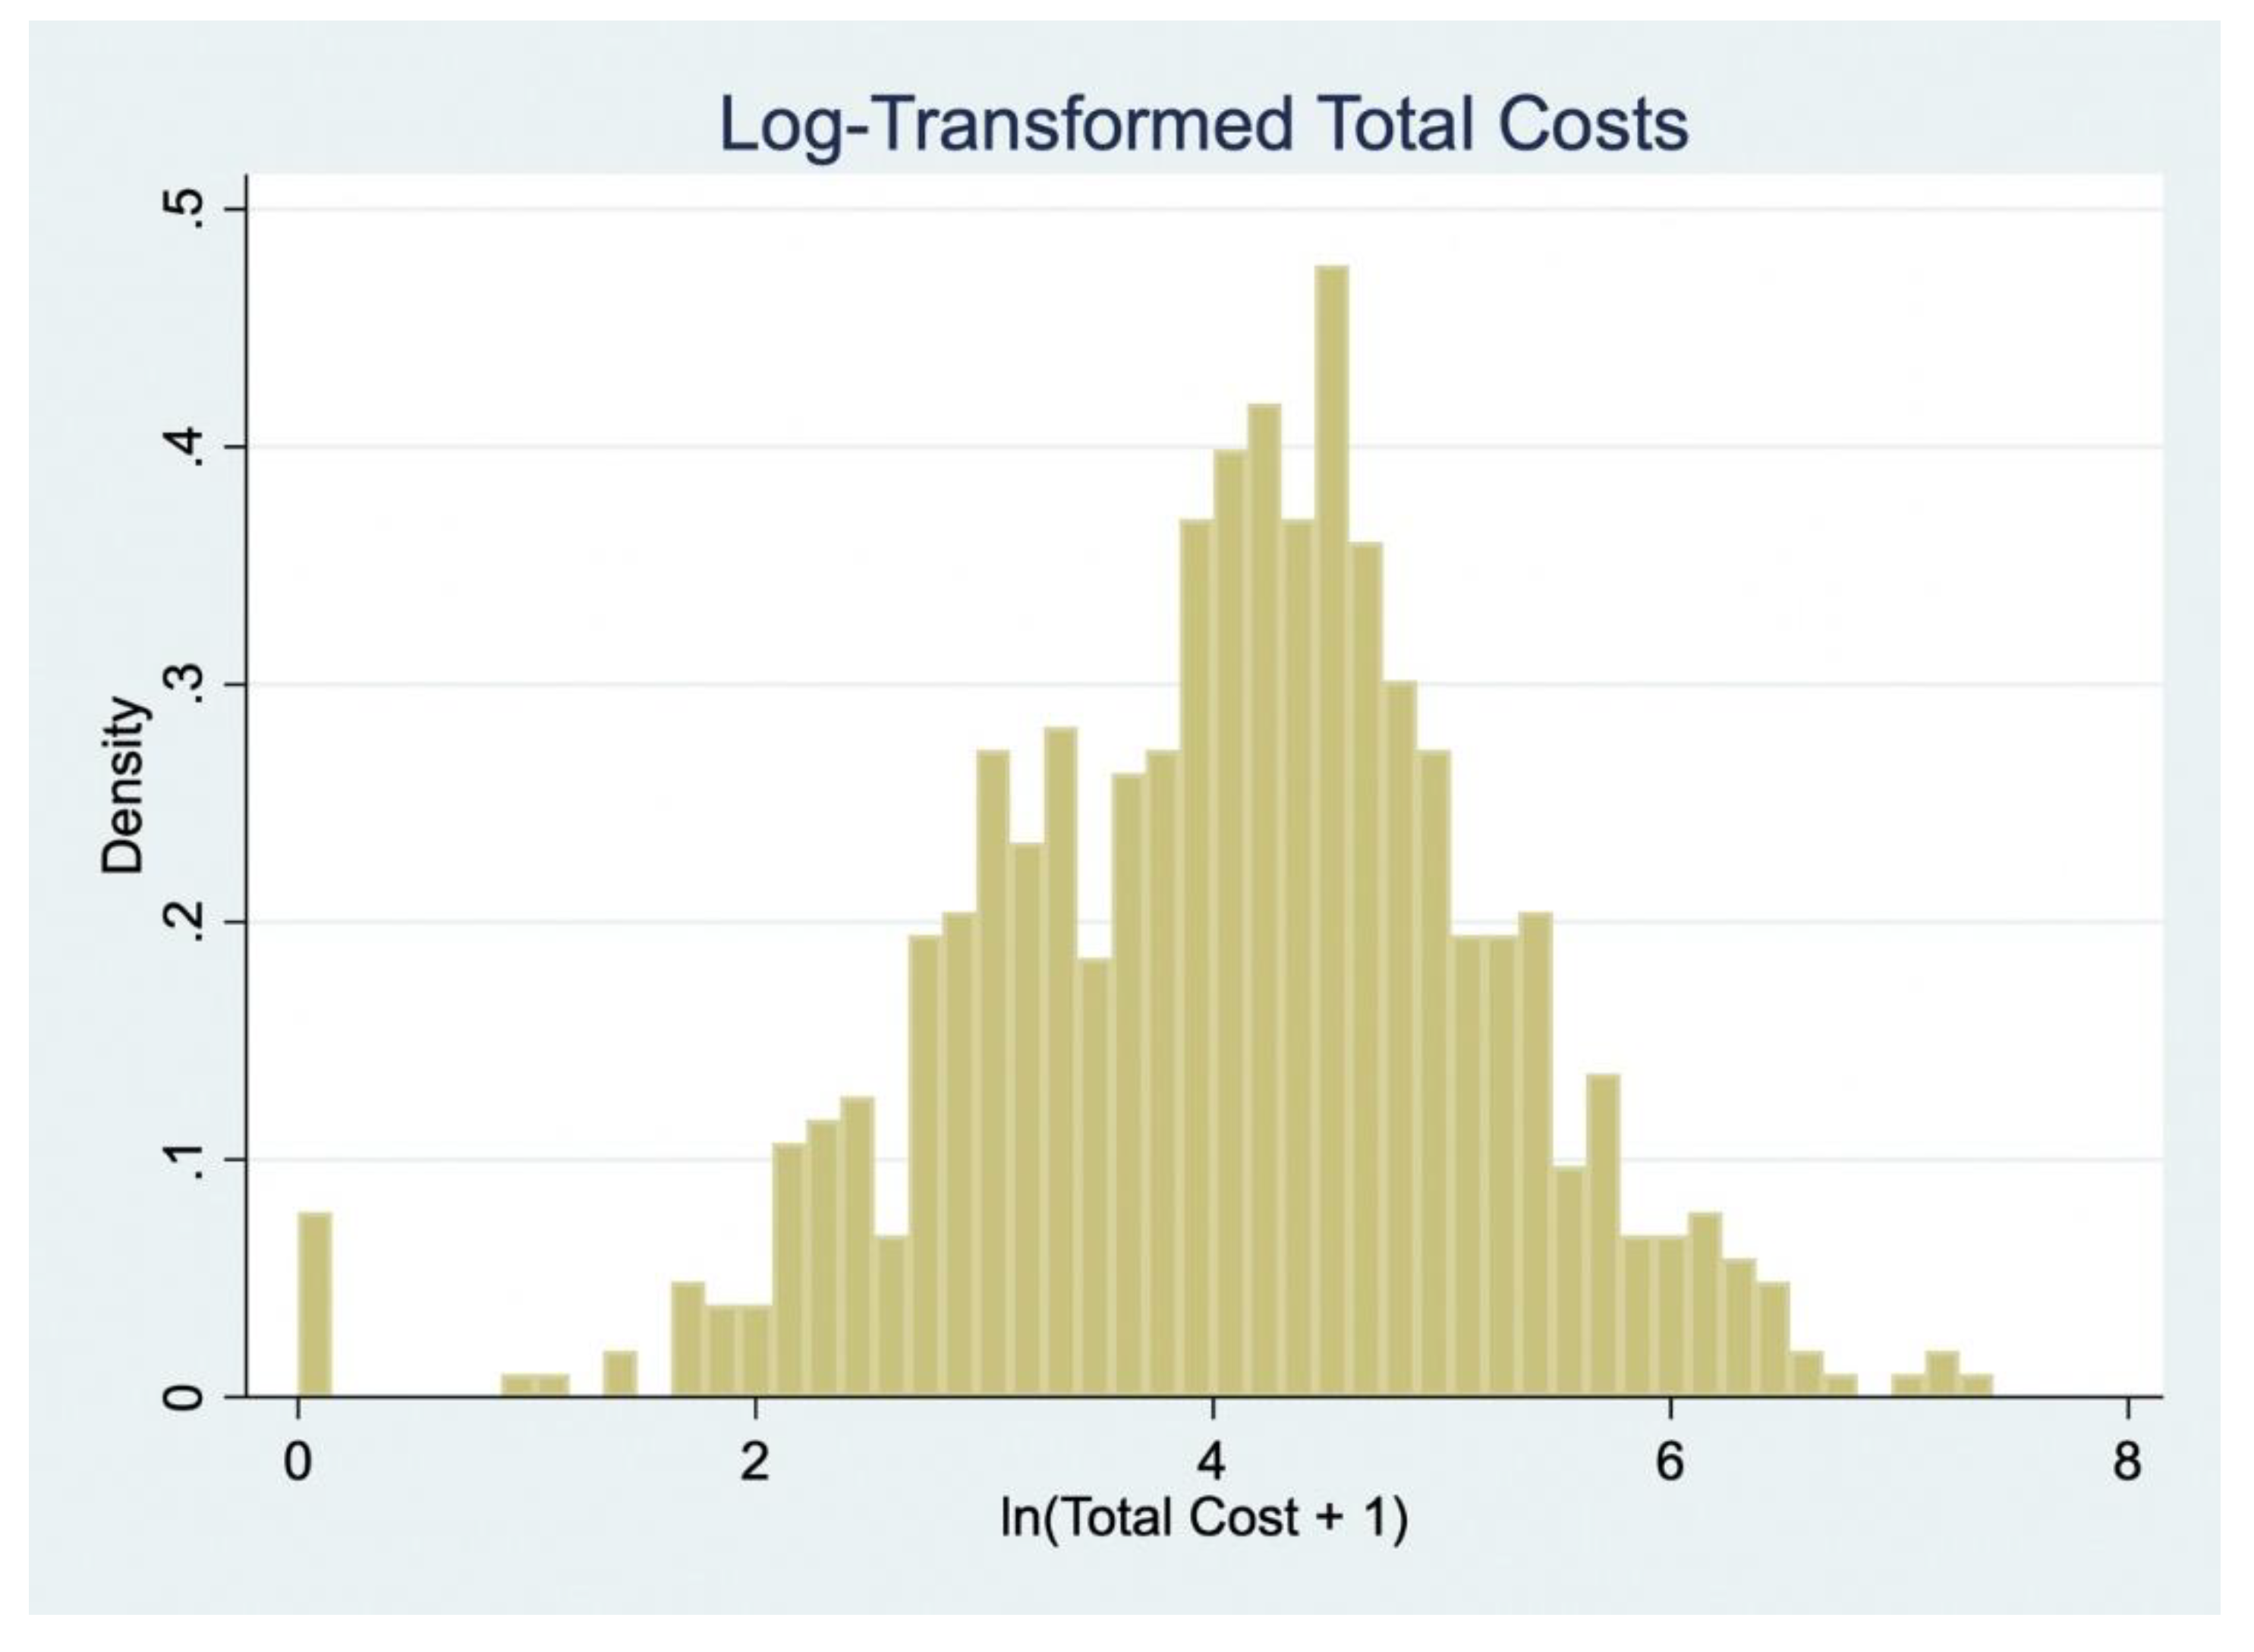
Table 2.
Percentage Contribution of Direct Non-Medical, Indirect, and Coping Costs to Total Patient-Incurred Costs by Socioeconomic Status (SES) Quintile.
Table 2.
Percentage Contribution of Direct Non-Medical, Indirect, and Coping Costs to Total Patient-Incurred Costs by Socioeconomic Status (SES) Quintile.
| SES Quintile | Direct Non-Medical (%) | Indirect (%) | Coping (%) |
|---|---|---|---|
| Poorest (Q1) | 26.1 | 12.5 | 61.4 |
| Poorer (Q2) | 21.0 | 46.6 | 32.4 |
| Middle (Q3) | 30.3 | 45.2 | 24.5 |
| Richer (Q4) | 18.9 | 57.5 | 23.7 |
| Richest (Q5) | 16.1 | 72.3 | 11.6 |
| Overall (All) | 33.2 | 29.8 | 36.8 |
Note: Percentage composition of patient-incurred costs across SES quintiles, showing the relative share of direct non-medical costs (e.g., food and transport), indirect costs (e.g., productivity losses due to time), and coping costs (e.g., borrowing, asset sales, dietary compromise).
Table 3.
Cuzick's non-parametric test for trend in total patient costs across socio-economic quintiles (N = 419).
Table 3.
Cuzick's non-parametric test for trend in total patient costs across socio-economic quintiles (N = 419).
| Socio-economic group | Number of observations | Mean response (cost in ZAR) |
|---|---|---|
| Poorest (Q1) | 72 | 14.33 |
| Poorer (Q2) | 102 | 5.85 |
| Middle (Q3) | 81 | 4.35 |
| Richer (Q4) | 82 | 4.10 |
| Richest (Q5) | 82 | 3.02 |
Note: Cuzick’s test for trend: z = –4.02, SE = 8.17, p < 0.001.
Table 4.
Summary Statistics of Patient-Incurred Costs for Accessing and Receiving Care for receiving care for hypertension by people living with HIV.
Table 4.
Summary Statistics of Patient-Incurred Costs for Accessing and Receiving Care for receiving care for hypertension by people living with HIV.
| Cost Category | Mean (ZAR) | Std Dev (ZAR) | Median (ZAR) | P25 (ZAR) | P75 (ZAR) | P90 (ZAR) | Max (ZAR) | Mean (USD) | Std Dev (USD) | Median (USD) | P25 (USD) | P75 (USD) | P90 (USD) | Max (USD) |
|---|---|---|---|---|---|---|---|---|---|---|---|---|---|---|
| Direct Non-Medical Cost | 26.29 | 46.08 | 0.82 | 0 | 37.06 | 68.4 | 436 | 1.42 | 2.49 | 0.04 | 0 | 2.00 | 3.70 | 23.57 |
| Indirect Cost - Actual | 47.71 | 57.39 | 28.49 | 16.6 | 55.58 | 106.94 | 577.67 | 2.58 | 3.10 | 1.54 | 0.90 | 3.00 | 5.78 | 31.23 |
| Indirect Cost - Minimum Wage | 124.23 | 79.58 | 108.86 | 67.99 | 162.14 | 217.05 | 548.12 | 6.72 | 4.30 | 5.88 | 3.68 | 8.76 | 11.73 | 29.63 |
| Coping Cost | 31.73 | 128.97 | 0 | 0 | 0 | 57 | 1635 | 1.72 | 6.97 | 0.00 | 0.00 | 0.00 | 3.08 | 88.38 |
| Total Cost - Actual | 105.81 | 150.34 | 62.86 | 27.02 | 117.18 | 232.96 | 1649.45 | 5.72 | 8.13 | 3.40 | 1.46 | 6.33 | 12.59 | 89.16 |
| Total Cost - Minimum | 182.34 | 160.33 | 144.97 | 93.62 | 214.44 | 313.29 | 1708.22 | 9.86 | 8.67 | 7.84 | 5.06 | 11.59 | 16.93 | 92.34 |
Table 5.
Estimates of average marginal effects (AME) from generalized linear models with a gamma distribution and log link.
Table 5.
Estimates of average marginal effects (AME) from generalized linear models with a gamma distribution and log link.
| Actual Cost [Model 1] | Minimum Wage [Model 2] | |||||
|---|---|---|---|---|---|---|
| Variable | AME1 | SE2 | 95% CI3 | AME | SE | 95% CI |
| Female (vs Male) | -4.894 | 19.198 | [-42.52, 32.73] | -6.794 | 19.216 | [-44.46, 30.87] |
| Self-employed/part-time (vs Full-time) | 14.013 | 20.753 | [-26.66, 54.69] | 3.85 | 22.42 | [-40.09, 47.79] |
| Unemployed/unable to work (vs Full-time) | 1.763 | 17.298 | [-32.14, 35.67] | -7.958 | 21.123 | [-49.36, 33.44] |
| Primary Education (vs No Schooling) | -33.41 | 46.068 | [-123.70, 56.88] | -37.359 | 49.23 | [-133.85, 59.13] |
| Secondary Education (vs No Schooling) | 2.734 | 45.607 | [-86.66, 92.12] | -11.028 | 48.427 | [-105.94, 83.89] |
| HH Size: Medium (4–6) (vs Small) | 24.313 | 15.109 | [-5.30, 53.93] | 9.518 | 13.76 | [-17.45, 36.49] |
| HH Size: Large (7+) (vs Small) | 9.538 | 35.807 | [-60.64, 79.72] | -16.69 | 29.111 | [-73.75, 40.37] |
| Middle-age (35–49) (vs Young adults) | -22.762 | 39.415 | [-100.01, 54.49] | -28.879 | 48.633 | [-124.20, 66.44] |
| Pre-retirement (50–54) (vs Young adults) | 3.541 | 44.551 | [-83.78, 90.86] | -12.662 | 50.958 | [-112.54, 87.21] |
| Seniors (55+) (vs Young adults) | 4.877 | 42.492 | [-78.41, 88.16] | -3.978 | 49.385 | [-100.77, 92.82] |
| 30–60 min (vs <30 min) | -2.546 | 17.399 | [-36.65, 31.56] | 9.671 | 16.652 | [-22.97, 42.31] |
| >60 min (vs <30 min) | 19.614 | 30.512 | [-40.19, 79.42] | 42.027 | 25.973 | [-8.88, 92.93] |
| Income Q2 (vs Poorest Q1) | 12.015 | 20.263 | [-27.70, 51.73] | -6.997 | 27.18 | [-60.27, 46.28] |
| Income Q3 (vs Poorest Q1) | 14.365 | 17.697 | [-20.32, 49.05] | -47.28 | 22.987 | [-92.33, -2.23]* |
| Income Q4 (vs Poorest Q1) | 49.587 | 19.436 | [11.49, 87.68]* | -25.88 | 24.072 | [-73.06, 21.30] |
| Income Q5 (vs Poorest Q1) | 131.881 | 34.824 | [63.63, 200.13]*** | -29.617 | 29.69 | [-87.81, 28.57] |
Model 1 uses actual indirect costs; Model 2 uses minimum wage-based indirect costs; ***p<0.01, **p<0.05, * p<0.1.
Table 6.
Average Marginal Effects of Socio-Demographic Factors on Monthly Out-of-Pocket Expenditure (ZAR).
Table 6.
Average Marginal Effects of Socio-Demographic Factors on Monthly Out-of-Pocket Expenditure (ZAR).
| Variable | dy/dx | SE4 | z | p-value | 95% Confidence Interval | |
|---|---|---|---|---|---|---|
| Female (vs Male) | -4.55 | 20.76 | -0.22 | 0.827 | -45.24 | 36.14 |
| Self-employed/part-time (vs Full-time) | 15.54 | 21.56 | 0.72 | 0.471 | -26.72 | 57.8 |
| Unemployed/unable to work (vs Full-time) | 3.32 | 17.42 | 0.19 | 0.849 | -30.82 | 37.46 |
| Primary Education (vs No schooling) | -34.95 | 46.97 | -0.74 | 0.457 | -127.01 | 57.12 |
| Secondary Education (vs No schooling) | 2.27 | 46.71 | 0.05 | 0.961 | -89.28 | 93.83 |
| HH Size: Medium (4–6) (vs Small) | 23.38 | 15.13 | 1.54 | 0.122 | -6.28 | 53.04 |
| HH Size: Large (7+) (vs Small) | 7.28 | 34.86 | 0.21 | 0.835 | -61.04 | 75.6 |
| Middle-age Adults (35–49) (vs Young adults) | -20.43 | 38.75 | -0.53 | 0.598 | -96.38 | 55.53 |
| Pre-retirement (50–54) (vs Young adults) | 3.36 | 43.52 | 0.08 | 0.939 | -81.94 | 88.66 |
| Seniors (55+) (vs Young adults) | 1.67 | 41.81 | 0.04 | 0.968 | -80.28 | 83.61 |
| Income Q2 (vs Poorest Q1) | 14.16 | 21.75 | 0.65 | 0.515 | -28.46 | 56.78 |
| Income Q3 (vs Poorest Q1) | 16.99 | 17.78 | 0.96 | 0.339 | -17.85 | 51.84 |
| Income Q4 (vs Poorest Q1) | 50.78 | 19.33 | 2.63 | 0.009 | 12.89 | 88.67 |
| Income Q5 (vs Poorest Q1) | 128.18 | 33.26 | 3.85 | 0.000 | 63 | 193.36 |
Table 7.
Determinants of Log-Transformed Patient Costs: Sensitivity Analysis Using Actual and Opportunity Cost Approaches.
Table 7.
Determinants of Log-Transformed Patient Costs: Sensitivity Analysis Using Actual and Opportunity Cost Approaches.
| Variable | Actual Cost Model (1) | Min Wage Cost Model (2) | ||||
|---|---|---|---|---|---|---|
| Coefficient (β) | Robust SE | 95% CI | Coefficient (β) | Robust SE | 95% CI | |
| Gender (ref: Male) | ||||||
| Female | 0.089 | (0.165) | [-0.236,0.413] | -0.011 | (0.103) | [-0.213,0.191] |
| Employment (ref: Full-time) | ||||||
| Self-employed/part-time | 0.079 | (0.147) | [-0.210,0.368] | 0.016 | (0.116) | [-0.212,0.244] |
| Unemployed/unable to work | -0.161 | (0.117) | [-0.391,0.070] | -0.116 | (0.105) | [-0.323,0.091] |
| Education (ref: None) | ||||||
| Primary (Grade 1-7) | 0.248 | (0.385) | [-0.510,1.005] | 0.026 | (0.252) | [-0.469,0.522] |
| Secondary (Grade 8-12) | 0.398 | (0.383) | [-0.356,1.151] | 0.095 | (0.249) | [-0.394,0.584] |
| Household size (ref: 1-3) | ||||||
| Medium (4-6) | 0.087 | (0.102) | [-0.113,0.287] | 0.022 | (0.068) | [-0.111,0.156] |
| Large (7+) | -0.319 | (0.193) | [-0.698,0.060] | -0.257* | (0.130) | [-0.512,-0.003] |
| Age group (ref: 24-34) | ||||||
| Middle-age adults (35-49) | 0.066 | (0.251) | [-0.428,0.560] | -0.019 | (0.158) | [-0.330,0.293] |
| Pre-retirement adults (50-54) | 0.162 | (0.281) | [-0.390,0.714] | 0.045 | (0.174) | [-0.297,0.387] |
| Seniors (55+) | 0.266 | (0.288) | [-0.299,0.832] | 0.185 | (0.167) | [-0.144,0.514] |
| Travel time (ref: <30 min) | ||||||
| 30-60 min | -0.022 | (0.135) | [-0.288,0.244] | 0.094 | (0.110) | [-0.123,0.311] |
| >60 min | -0.001 | (0.181) | [-0.357,0.354] | 0.276* | (0.126) | [0.028,0.524] |
| Income quintile (ref: Q1) | ||||||
| Poorer (Q2) | 0.839*** | (0.204) | [0.437,1.240] | 0.012 | (0.108) | [-0.201,0.225] |
| Middle (Q3) | 0.871*** | (0.211) | [0.456,1.285] | -0.256* | (0.111) | [-0.474,-0.038] |
| Richer (Q4) | 1.298*** | (0.192) | [0.922,1.675] | -0.058 | (0.112) | [-0.278,0.162] |
| Richest (Q5) | 1.724*** | (0.213) | [1.305,2.143] | -0.128 | (0.143) | [-0.408,0.153] |
| Constant | 2.793*** | (0.544) | [1.724,3.862] | 4.863*** | (0.338) | [4.199,5.527] |
| Model statistics | ||||||
| Observations | 434 | 434 | ||||
| R-squared | 0.28 | 0.06 | ||||
Note: ***p<0.01, **p<0.05, * p<0.1.
Disclaimer/Publisher’s Note: The statements, opinions and data contained in all publications are solely those of the individual author(s) and contributor(s) and not of MDPI and/or the editor(s). MDPI and/or the editor(s) disclaim responsibility for any injury to people or property resulting from any ideas, methods, instructions or products referred to in the content. |
© 2025 by the authors. Licensee MDPI, Basel, Switzerland. This article is an open access article distributed under the terms and conditions of the Creative Commons Attribution (CC BY) license (http://creativecommons.org/licenses/by/4.0/).
Copyright: This open access article is published under a Creative Commons CC BY 4.0 license, which permit the free download, distribution, and reuse, provided that the author and preprint are cited in any reuse.


