
Submitted:
05 August 2025
Posted:
06 August 2025
You are already at the latest version
Abstract
The peroxisome proliferator-activated receptor family of lipid-activated nuclear receptors (PPARs) plays a critical role in the regulation of cellular lipid metabolism. In cardiac muscle, PPARα is highly expressed and regulates genes involved in fatty acid oxidation, but its activity is downregulated in hypertrophic hearts. The functional role of PPARα in cardiac muscle has been investigated through the PPARA−/− mouse model, which, although having a normal life span, develops progressive cardiac fibrosis, but the consequences of chronic PPARα deficiency on the cardiac contractile apparatus remain unclear.
To verify the PPARα role in hypertrophic phenotype, we generated an in vitro model of cardiac hypertrophy (CH) by stable silencing of PPARA gene in H9c2 rat cardiomyoblasts.
We observed that PPARα silencing induces a hypertrophic phenotype, characterized by increased NPPB and decreased FBXO32 expression, mitochondrial dysregulation, impaired lipid metabolism, oxidative stress, and ferroptosis-related alterations. Epigenetically, H3K27ac levels increased while H3K27me3 decreased. Moreover, miR-34a, miR-132, and miR-331 were downregulated, implicating a miRNA-mediated mechanism in PPARα-linked cardiac hypertrophy. Treatment with Ebselen (Ebs), a redox-active compound with epigenetic inhibitory effects, reversed hypertrophic phenotype and restored miRNA levels.
In conclusion, we found that PPARα depletion promotes oxidative stress and a hypertrophic phenotype and Ebs as a potential therapeutic agent.
Keywords:
PPARα
; ROS
; Ebselen
; Cardiac Hypertrophy
1. Introduction
The primary function of the heart is to preserve perfusion of peripheral organs, following their demand during both normal and stress conditions. After birth, cardiomyocytes rapidly become terminally differentiated, so in adulthood, there is no increase in cardiomyocyte number, but a compensatory effect expanding individual cardiomyocyte size [1], a process termed hypertrophy. There are two types of hypertrophy: physiological and pathological. The physiological one is an adaptive response to reduce ventricular wall stress, preserving function and efficiency in response to an increased workload demand; in response to pathological stimuli, hypertrophy generally progresses to ventricular chamber dilatation with wall thinning, to heart failure, to arrhythmias and death [1,2]. Different cellular signaling pathways, such as cellular metabolism and proliferation, epigenetic modifications, and oxidative stress stimuli [1], modulate cardiac hypertrophy (CH).
The peroxisome proliferator-activated receptor (PPARα, β/δ, and γ) family of lipid-activated nuclear receptors plays a critical role in the gene regulation of cellular lipid metabolism [3]. In cardiac muscle, PPARα is expressed at relatively abundant levels and activates numerous genes involved in cellular fatty acid uptake and oxidation [3]. Interestingly, PPARA gene regulatory pathway activity is downregulated in the hypertrophied heart [4]. It is unclear whether this metabolic shift, with increased reliance on glucose metabolism rather than fatty acid oxidation, is a protective response allowing the heart to maintain contractile function or an initial step leading to progressive deterioration of contractile function [4]. The functional and biological roles of PPARα in cardiac muscle have been investigated through the PPARA−/− mouse model [5]. Although PPARA−/− mice have a normal life span, they develop progressive cardiac fibrosis and myofibrillar fragmentation associated with abnormal mitochondrial ultrastructure [6]. However, the precise consequences of chronic PPARα deficiency on the cardiac contractile apparatus and muscle performance remain to be established.
Increased PPARα activity and fatty acid oxidation have been associated with an increase in reactive oxygen intermediates [7]. However, there is also strong evidence that activation of PPARα is necessary to prevent cellular oxidative damage that may occur during physiological cellular metabolism or under conditions of inflammation and oxidative stress, probably through repressing nuclear factor-κB (NF-κB) signaling and reducing inflammatory cytokine production [8]. Therefore, it is possible that chronic deactivation of the PPARα signaling pathway upsets the normal equilibrium between oxidant production and antioxidant defenses and contributes to cardiac damage [5]. Taken together, these findings suggest that PPARα plays a decisive role in the development of hypertrophy, affecting the functional outcome of the heart. Unfortunately, information on the nature of PPARα-dependent processes in cardiac hypertrophy (CH) is fragmentary and incomplete. Therefore, in this study, we generated an in vitro model of CH by using the H9c2 cardiomyoblasts derived from rat ventricles, which mimics cardiomyocytes [9] by stable silencing of PPARA gene expression by the short hairpin RNA interference technique in order to verify the PPARα role in hypertrophic phenotype. We investigated cell morphology, gene expression, and antioxidant response in growing basal conditions, following hydrogen peroxide (H2O2) oxidative insult, and Ebs treatment as an antioxidant, respectively. Our data suggest that PPARA silencing triggers morphological and molecular profiles that prompt hypertrophy and oxidative stress in cardiomyoblasts linked to epigenetic changes, and that Ebs treatment can revert these processes.
2. Materials and Methods
2.1. Cell Cultures and Treatments
The H9c2 rat cardiomyoblasts purchased by American Type Cell Collection (ATCC, Manassas, VA, USA) were cultured in Dulbecco's modified Eagle's medium (Euroclone, Whetherby, UK), and supplemented with 10% w/v fetal bovine serum (Euroclone, Whetherby, UK), 100 U/mL of penicillin and 100 mg/mL streptomycin (Euroclone, Whetherby, UK). During the expansion and experiments, the cells were maintained at 37°C in a humidified 95% air and 5% Carbon dioxide atmosphere. The cells were sub-cultured at 1:2 ratio to prevent differentiation; cells were split before reach 70% confluence. During the logarithmic growth, the cells were treated with Phosphate Buffered Saline (PBS) or 50 μmol/L H2O2 (Sigma-Aldrich, St. Louis, Missouri, USA) for 1h and harvested after 5 days after H2O2 removal. Ebs (Sigma-Aldrich, St. Louis, Missouri, USA) or chloroform, as vehicle, was added to growth medium at 5 μmol/L concentration for 36h.
2.2. PPARA Silencing
Cells were plated the day before the transfection at 80% confluence in 35 mm dishes. Transient transfection was performed using 250 ng of plasmids by using lipofectamine 2000 (Thermo Fischer Scientific, Waltham, Massachusetts, USA) following the manufacturer’s instructions. Transient silencing was obtained using different 29mer shRNA plasmids either pGFP-V_RS (Scramble_TR30013) or PPARA shRNAs (Gene ID_25747_TG7097836A; _TG7097836B; _TG7097836C; _TG7097836D) all from OriGene (OriGene Technologies, Inc., Rockville, MD, USA) that were mixed before transfection. We obtain stably transfected clones by using antibiotic selection 0.5 μg/mL of puromycin (Sigma-Aldrich, St. Louis, MO, USA) in the culture medium. Transient transfection was performed using PPARA rat siRNA oligo duplex (locus ID 25747) (SR514103) from OriGene (OriGene Technologies, Inc., Rockville, MD, USA) by using Interferin siRNA Transfection Reagent (Polyplus, Illkirch-Graffenstaden, France) following the manufacturer’s instructions.
2.3. Quantitative Real-Time PCR (qRT-PCR)
Total RNA was isolated from 100 mm cell culture dishes using the Total RNA Purification Plus Kit (Norgen BioTek Corp., Thorold, ON, Canada) according to the manufacturer's protocol. cDNA was synthesized using SensiFast cDNA Synthesis Kit (Meridian Bioscience, Milan, Italy) according to the kit's instructions. The quantitative gene expression was performed by using 15 ng cDNAs in a 10-μL reaction volume containing: 2× TaqMan Universal PCR Master Mix, No AmpErase UNG (Thermo Fischer Scientific, Waltham, Massachusetts, USA) and qPCR probe-based assays (Thermo Fischer Scientific, Waltham, Massachusetts, USA) including PPARA (Rn00566193_m1); Acyl-CoA Oxidase 1 (ACOX1) (Rn01460628_m1); Muscle Atrophy F-box gene (FBXO32) (Rn00591730_m1); Forkhead box O3 gene (FOXO3) (Rn01441087_m1); Nuclear factor erythroid 2 gene (NFE2) (Rn01533343_m1); Brain Natriuretic Peptide B gene (NPPB) (Rn00580641_m1) and Glyceraldehyde-3-Phosphate Dehydrogenase gene (GAPDH) (Rn01775763_g1) as housekeeping; or 2x SYBR Green PCR Master Mix (Thermo Fischer Scientific, Waltham, Massachusetts, USA) and primers purchased from Sigma-Aldrich (St. Louis, MO, USA) and listed in Supplementary Table S1.
The detection of miRNAs was performed by qRT-PCR using 2x SYBR Green PCR Master Mix (Thermo Fischer Scientific, Waltham, Massachusetts, USA) and primers pur-chased from Sigma-Aldrich (St. Louis, MO, USA) and listed in Supplementary Table S1.
Briefly, cDNA was synthesized using the miRCURY LNA RT Kit (Qiagen #339340) according to the manufacturer’s instructions. 10 ng of total RNA, in a 10 μL-RT reaction, is used as starting material, and the procedure involves incubating the reaction at 40–42°C for 1 hour, followed by an inactivation step through a brief incubation at 95°C.
The cDNAs were amplified in QuantStudio™ 7Pro Real-Time PCR System (Thermo Fischer Scientific, Waltham, Massachusetts, USA). Real-time PCR reactions were per-formed with 0.5 μL of the RT product in 10 μL-PCR reaction volume and done in triplicate using the 2x SYBR Green PCR Master Mix (Thermo Fischer Scientific, Waltham, Massachusetts, USA) and primers purchased from Sigma-Aldrich (St. Louis, MO, USA).
The fold change was calculated by the 2−ΔΔCt method. At least three independent amplifications were performed for each probe evaluated in triplicate samples.
2.4. Immunofluorescence
Cells were fixed in 4% paraformaldehyde (Societa' Italiana Chimici, Rome, Italy) and then permeabilized with 0.1% w/v Triton X-100 in PBS. Cells were incubated in blocking buffer (10% normal goat serum in PBS) for 2 h and then incubated over-night with the following primary antibodies against: PPARα (Antibodies, Stockholm, Sweden), and Natriuretic Peptide B (BNP) (St John's Laboratory, London, UK). Subsequently, cells were incubated with the secondary antibody Alexa Fluor 555 anti-rabbit (Thermo Fischer Scientific, Waltham, MA, USA), and, after a brief wash, Hoechst 33342 (Thermo Fischer Scientific, Waltham, MA, USA) was used to counterstain for the nucleus. F-ACTIN was stained using Phalloidin-Tetramethylrhodamine (Sigma-Aldrich, St. Louis, MO, USA) and nuclei were labelled with Hoechst 33342.
Fluorescence images were acquired using Olympus Fluoview FV1000 confocal microscope equipped with FV10-ASW version 4.1 software (Olympus Corporation, Tokyo, Japan), using 60× (1.42 numerical aperture) oil objective.
2.5. Western Blotting
Briefly, the H9c2 cells, cultured in 100 mm dishes-culture below 80% confluence, were collected and lysed in Ripa buffer (50 mmol/L Tris pH 7.5, 150 mmol/L NaCl, 1% w/v Triton X-100, 1 mmol/L ethylene glycol tetra acetic acid, 1% w/v sodium deoxycholate), and supplemented with protease/phosphatase inhibitor cocktail (Thermo Fischer Scientific, Waltham, MA, USA). After quantitative determination by BCA Protein Assay (Thermo Fischer Scientific, Waltham, MA, USA), the total cell protein extract was prepared in Laemmli sample buffer (Biorad, Hercules, CA, USA) and separated by 10% Sodium Dodecyl Sulfate Polyacrylamide Gel Electrophoresis resolving gels. Proteins were electrophoretically transferred to Hybond-C Extra membranes (Thermo Fischer Scientific, Waltham, MA, USA). The membranes were blocked 1h at room temperature with 5% w/v non-fat milk (Cell Signaling Technology, Danvers, MA, USA) in Tris-buffered saline supplemented with Tween 20 at 0.1% w/v (TBST). The detection of immobilized proteins was performed by sequential steps of incubations with primary antibodies against: PPARα (GeneTex, Irvine, CA, USA), trimethylation of histone H3 at lysine 27 (H3K27me3) (Cell Signaling Technology, Danvers, MA, USA), acetylation of histone H3 at lysine 27 (H3K27ac) (Thermo Fischer Scientific, Waltham, MA, USA), Histone H3 (D1H2) XP® (Cell Signaling Technology, Danvers, MA, USA), GAPDH (D16H11) XP® (Cell Signaling Technology, Danvers, MA, USA), and relative Horseradish peroxidase-conjugated secondary antibody (Jackson ImmunoResearch Labs, Baltimore, PA, USA). Clarity Western enhanced chemiluminescence Substrate (Biorad, Hercules, CA, USA) was used for protein band detection. Protein expression was quantified by comparing band expression using Image J v3.91 software (open source by the National Institutes of Health).
2.6. Cell Proliferation Assay
Cells were plated in a 96 microplate well at a density of 8×10³ cells/well. Next, 5-bromo-2’deoxyuridine (BrdU) assay was performed by using the Dissociation-Enhanced Lanthanide Fluorescent Immunoassay Cell Proliferation Kit following manufacturer’s instructions (Revvity, Waltham, MA, USA). The fluorescent signal is proportional to BrdU incorporation during DNA synthesis as a measure of cell proliferation, and was measured by time-resolved fluorometer 2100 EnvisionTM Multilabel Reader (Perkin Elmer, Waltham, MA, USA).
2.7. Cell Viability Assay
Cells were plated at a density of 8×10³ cells/well in 96-well culture plate per well to analyze viability. The cell viability was evaluated by using a commercial XTT (sodium 3′-[1-(phenylaminocarbonyl)-3,4- tetrazolium]-bis (4-methoxy-6-nitro) benzene sulfonic acid hydrate) kit (The Cell Proliferation Kit II, Roche, Indianapolis, IN, USA) according to the manufacturer's protocol. After the experimental treatment, H9c2 cells were incubated with the XTT labelling mixture for 6h at 37°C. The absorbance of the samples was next measured using a microplate spectrophotometer Enzyme-linked immunosorbent assay reader (Tecan Austria GmbH, Grödig, Austria).
2.8. Determination of Apoptosis by Flow Cytometer
Apoptosis was assessed by Allophycocyanin Annexin V Apoptosis detection Kit (BD Pharmigen, San Jose, CA, USA). Briefly, cells were washed in PBS and re-suspended in Annexin Binding Buffer (10 mmol/L N-2-hydroxyethylpiperazine-N′-2-ethanesulfonic acid pH 7.4, 140 mmol/L NaCl, and 2.5 mmol/L calcium chloride). Cells were then stained with 0.5 mg/mL Annexin V/7- Amino-Actinomycin D for 15 min in the dark before analyzing. Finally, 400 μL of 1× binding buffer was added to each tube, and the frequency of apoptosis was analyzed by flow cytometry within 60 min. Acquisition and analysis were carried out on a Becton Dickinson FACSCanto II flow cytometer (Becton-Dickinson, Milan, Italy, EU), using DiVa Software, version 6.3 (Becton-Dickinson, Milan, Italy, EU).
2.9. Assessment of Hypertrophic Phenotype
H9c2 cells plated at a density of 2×10⁴ cells/well in a 4-well chamber slide (Nunc, Naperville, IL, USA) were treated as indicated. Cells were fixed with 4% w/v paraformaldehyde, and stained with Hematoxylin and Eosin [10]. Images were randomly acquired by the light microscope Leica LMD6500 (Leica Microsystem GmbH, Mannheim, Germany), equipped with a digital color camera, at 40x magnification. The effect of H2O2 on hypertrophic growth of H9c2 cells was measured by measuring changes in cell surface area (n=100 per group). The quantitative analysis of cell surface area was performed by Image J v3.91 software (open source by the National Institutes of Health).
2.10. Analysis of Reactive Oxygen Species (ROS)
Intracellular ROS was determined by 5-(6)-chloromethyl-2',7'-dichlorodihydrofluorescein diacetate, acetyl ester (CM-H2DCFDA) assay (Thermo Fischer Scientific, Waltham, MA, USA). First, 8×10³ cells were plated in 96 VIEWPLATE black and flat bottom plates (Perkin Elmer, Waltham, MA, USA) and let growth for 24h; cells were incubated with 10 μmol/L of CM-H2DCFDA (Thermo Fischer Scientific, Waltham, MA, USA) in KREBS-Henseleit buffer (Sigma-Aldrich, St. Louis, Missouri, USA) for 30 min at 37 °C. Excitation filter for the CM-H2DCFDA was set at 495, and the emission filter was set at 529 nm. The fluorescence intensity data were normalized for the cell number using Hoechst 33342 (Thermo Fischer Scientific, Waltham, MA, USA) at 350 nm as excitation and 461 nm as emission. The probe’s fluorescence was monitored with a Synergy H1 Multi-Mode Reader (BioTek® Instruments Inc., Charlotte, Vermont, USA).
Real-time ROS production changes were also measured by using Incucyte® instrument (Sartorius-Biopharma, Göttingen, Germany).
2.11. HPLC Determination of Reduced (GSH) and Oxidized Glutathione (GSSG)
The cells, differently treated, were sonicated three times for 2 sec in 0.1 mL of 0.1 mmol/L potassium-phosphate buffer, pH 7.2 (Sigma-Aldrich, St. Louis, Missouri, USA). For Free-GSH determinations, 100 μL of 12% sulfosalicylic acid were added to 50 μL of cells lysate, and free GSH content in the acid-soluble fraction was determined. For GSSG determination, the cells were sonicated in the presence of 5 mmol/L N-ethylmaleimide (Sigma-Aldrich, St. Louis, Missouri, USA); 100 μL of 12% w/v sulfosalicylic acid (Sigma-Aldrich, St. Louis, Missouri, USA) were added to 50 μL homogenates, and GSSG content on the acid-soluble fraction was determined. Protein concentrations for results normalization were quantified by BCA Protein Assay (Thermo Fischer Scientific, Waltham, MA, USA). The derivatization and chromatography procedures were performed, with little modifications, as previously reported [11]. The GSH/GSSG ratio was calculated from reduced GSH and GSSG. Reduced GSH was calculated as follows:
Free-GSH – GSSG = reduced GSH.
2.12. Statistical Analysis
All statistical evaluations were performed using GraphPad Prism 8.0 (GraphPad Software, San Diego, CA, USA). The data were analyzed using a 2-tailed Student’s t test. A p-value <0.05 was considered statistically significant, whereas a p-value <0.01 and < 0.001 was considered highly statistically significant. The measurements are shown as mean ± standard deviation (SD).
3. Results
3.1. Effect of PPARA Silencing on Cell Viability and Apoptosis in Cardiomyoblasts
We developed an in vitro model in which the rat cardiomyoblasts, H9c2, were stably silenced for the expression of the PPARA gene using the RNA interference technique. The testing of the silencing model (Sh_PPARA) in comparison to the control (Sh_Scramble) revealed a significant decrease (approximately 50%) in gene and protein expression (Figure 1A and 1B, and Supplementary Figure S1A). The reduction of PPARα protein expression was also confirmed by immunofluorescence imaging (Figure 1C and Supplementary Figure S1B). The effect of the PPARA silencing also caused a downregulation in the transcription of its ACOX1 target gene (Supplementary Figure S1C), thus supporting a reduction of the PPARα activity.
As shown in Figure 1D, stable silencing of PPARA was ineffective in affecting cell viability, as measured by XTT. Accordingly, the apoptotic rate (early plus late apoptosis) assessed by flow cytometry remained unchanged in PPARA stable-silenced cardiomyoblasts (Figure 1E and Supplementary Figure S1D). Otherwise, the cell proliferation rate was significantly lower in the Sh_PPARA cells than in control cells (Figure 1F).
3.2. Effect of PPARA Silencing on Hypertrophic Phenotype in Cardiomyoblasts
To assess the hypertrophic phenotype, we assessed changes in cell shape by measuring the mean cell area after staining with hematoxylin and phalloidin. As shown in Figure 2A and Supplementary Figure S2, the PPARA gene silencing caused an enlargement of cell area with respect to Sh_Scramble cells, inducing a hypertrophic phenotype similar to that observed in Sh_Scramble cells treated for 1 hour with 50μM H2O2. Moreover, we observed a strong effect on cytoskeletal structure in both Sh_Scramble + H2O2 and Sh_PPARA cells in comparison to untreated Sh_Scramble cells (Figure 2B). In particular, we found a noticeable reordering of the actin cytoskeleton in which the number of actin bundles is higher and their distance smaller, indicating a region of greatest stiffness in Sh_PPARA.
Then, we assessed the mRNA expression of some hypertrophic genes, such as the NPPB gene encoding for Protein B-type natriuretic peptide (BNP), the FBXO32 gene encoding for Atrogin-1, FOXO3a encoding for the Forkhead box O3a transcription factor. As reported in Figure 2C and 2D, NPPB gene expression was significantly upregulated while FBXO32 was significantly downregulated in Sh_PPARA cells compared to Sh_Scramble cells. Otherwise, PPARA silencing was ineffective on FOXO3 transcription (Figure 2E). In order to verify the BNP protein expression increase, we performed immunofluorescence experiments (Figure 2G). All these results indicate that PPARA-silenced cells mimic a hypertrophic cardiac model.
3.3. Effect of PPARA Silencing on Redox Metabolism and Ferroptosis in Cardiomyoblasts
We evaluated the effect of PPARA stable silencing on redox metabolism in H9c2 cells by different assays. The analysis of ROS (Figure 3A and Supplementary Figure S3A) showed a significant increase in levels of these oxidative markers in Sh_PPARA stable cells respect to Sh_Scramble cells. The assessment of cell redox status by GSH/GSSG ratio revealed that the silenced Sh_PPARA stable cells displayed a significant decrease of this ratio when compared to Sh_Scramble cells (Figure 3B and Supplementary Figure S3B and S3C).
As we found a redox unbalance in cells silenced for PPARA, and since ROS accumulation might contribute to ferroptosis switching, we verify the PPARα role in ferroptosis pathway by assessing the mRNA expression levels of some genes involved in this process, including AIF family member 2 (AIFM2), mouse double minute 2 homolog (MDM2), glutathione peroxidase 4 (GPX4), and NFE2. We observed a significant increase in AIFM2 transcription and a significant decrease in MDM2 transcription in Sh_PPARA cells with respect to Sh_Scramble cells (Figure 3C and 3D). We also observed a reduced trend of NFE2 expression, and no changes in GPX4 mRNA levels in Sh_PPARA cells with respect to Sh_Scramble (Supplementary Figure 3E and S3F).
3.4. Effect of PPARA Silencing on Epigenetic Mechanisms Upstream of BNP Expression in Cardiomyoblasts
The effects of PPAR silencing on the transcription of NPPB gene could be explained by different epigenetic mechanisms of its promoter regulation [12,13]. Wei and collaborators [14] reported that pressure overload-induced murine cardiac hypertrophy regions near the NPPB promoter are enriched in histone H3 acetylation (H3K27ac) that is associated with a recruitment of the p300 protein, thus inducing transcriptional activation of the NPPB gene. Our data demonstrated that silencing PPARA may lead to increased expression of total histone H3 and H3K27ac (Figure 4A and 4B), and a decrease in H3K27me3 levels (Figure 4C), thereby supporting the hypothesis that these two histone modifications may contribute to increased NPPB gene transcription.
An additional epigenetic mechanism involved in regulating the NPPB transcript was mediated by microRNAs (miRNAs) [13]. Therefore, we performed a search using the TargetScan software [15], which revealed only 13 poorly conserved miRNAs that could target the 3' untranslated region (3’UTR) of the NPPB promoter (Table S2). Among these, we validated miR34a, miR132, and miR331 that previous studies have reported as up-regulated in cardiac hypertrophy [16,17,18]. Our results showed a statistically significant decrease in all these miRNAs in Sh_PPARA-silenced cells compared to the control (Sh_Scramble) (Figure 4D, E, and F), thus reinforcing the hypothesis of PPARα-mediated epigenetic control of NPPB transcription.
3.5. Assessment of Hypertrophic Phenotype and Oxidative Stress After Ebs Treatment in Hypertrophic Cardiomyoblasts
Since our PPARA depletion-dependent hypertropic phenotype was characterized by redox imbalance, we evaluated the possible effect of Ebs, a synthetic organoselenium molecule acting as a mimic of GPX that possesses antioxidant and anti-inflammatory properties [19,20]. In our experimental conditions, we observed a reduction in cell dimensions after Ebs treatment in PPARA-silenced cells (Figure 5A). This was confirmed by a corresponding decrease in NPPB mRNA expression in PPARA-silenced cells, while the FBXO32 mRNA expression increased (Figure 5B and C). Furthermore, we obtain a slight but statistically significant decrease in ROS production (Figure 5D). These results could be explained by a significant Ebs-dependent increase in residual PPARα protein expression (Figure 5E and Supplementary Figure S4). Moreover, Ebs treatment also ameliorated the reordering of the cytoskeleton, indicating a reduced stiffness in Sh_PPARA cells, restoring a phenotype similar to Sh_Scramble cells (Figure 5F).
3.6. Assessment of Epigenetic Changes After Ebs Treatment in Hypertrophic Cardiomyoblasts
The restoration of epigenetic changes observed in PPARA-silenced cells could be a mechanism explaining Ebs-dependent partial recovery of a normal phenotype in hypertrophic cardiomyoblasts. As reported in Supplementary Figure S4, the effect of Ebs on H3K27ac and H3K27me3 was in the opposite direction of recovery status because the compound increased H3K27ac and decreased H3K27me3.
4. Discussion
PPARα is a ligand-activated transcription factor that is the master regulator gene involved in lipid metabolism of various tissues. PPARα may play a key role in transactivating or repressing gene expression in a DNA-binding-independent manner by interfering with other vital players implicated in signaling pathways, thereby regulating various processes such as metabolism, inflammation, proliferation, and differentiation. If deregulated, these processes are associated with a broad range of human diseases [21]. Numerous reports have indicated that the PPARA gene regulatory pathway influences cardiovascular diseases through its role in metabolic regulation. Reduced PPARα expression and excessive mitochondrial fatty acid oxidation contribute to alterations such as heart failure, ischemic heart disease, and diabetic cardiomyopathy [22,23,24]. Additionally, PPARα overexpression reduces doxorubicin-induced cardiotoxicity by inhibiting mitochondria-dependent apoptosis [23]. It is reported that PPARα regulates the balance of redox responses in cardiac tissue and during ageing [24]. Indeed, PPARA-KO mice increase cardiac pyruvate dehydrogenase flux as a compensatory mechanism, perhaps to maximize ATP production, indicating an age-dependent reliance on glucose metabolism in PPARA-KO mice [25].
In this study, we uncovered the silencing of the PPARA role in hypertrophic phenotype in rat cardiomyoblasts. We validated the in vitro model at the molecular and biochemical levels of PPARα depletion and by expression levels of some hypertrophic markers such as NPPB and FBXO32, which were increased and decreased, respectively, according to hypertrophic conditions [12,26]. BNP is considered a sensitive diagnostic biomarker for heart failure onset and disease progression [27]. In particular, BNP and N-terminal proBNP, the cleavage product generated by proBNP processing to mature BNP, are increased in patients [12]. FBXO32 provides a regulatory mechanism to balance the process, causing CH both in vivo and in vitro. Indeed, FBXO32 inhibits pathologic CH by participating in a ubiquitin ligase complex that targets calcineurin for proteasome-dependent degradation, a factor involved in causing pathologic hypertrophy [26,28].
In our study, PPARA silencing did not affect cell viability and apoptosis susceptibility. Indeed, it has been reported that apoptosis susceptibility is associated with increased PPARα expression [29,30]. Moreover, we found a statistically significant reduction in cell proliferation rate in PPARA-silenced cells that could be explained by the presence of hypertrophic cells that sometimes appear polynucleated. It is reported that cardiomyocyte undergo a cell cycle modulation from proliferation to hypertrophy process in post-natal heart [31], known as maturational hypertrophy, in which the cardiomyocyte volume increases despite the cell cycle withdrawal. In order to explain the proliferation rate of cardiomyocytes after heart injury, there are two hypotheses: the presence of binucleated cells or the increase in cellular size. Accordingly, in our in vitro model, PPARA-silenced cells were characterized by enlarged cellular area (hematoxylin and eosin staining) and by actin-F filaments aggregated in disorganized bundles (phalloidin staining). The same morphological and biomolecular (i.e. NPPB and FBXO32) hypertrophic phenotype characteristics were obtained in the control cell line only after H2O2 treatment.
However, PPARα is the master regulator gene for lipid homeostasis by balancing the expression of genes involved in fatty acid transport and oxidation. PPARα modulates the expression of essential genes for mitochondrial fatty acid β-oxidation, such as ACOX1 [15]. Accordingly, in PPARA-silenced cells, we found a significant decrease in ACOX1 mRNA expression level with respect to the control cells. As the ACOX1 gene encodes the first enzyme of the fatty acid β-oxidation pathway, the probable consequence of this decrease could be the metabolic switch toward glucose consumption with an increase in the glycolysis pathway. This aspect could be further investigated in our model.
As it has been demonstrated that the role of oxidative stress in cardiac dysfunction of PPARA-/- mice [5], we evaluated the effect of PPARA silencing on oxidative stress. ROS homeostasis depends on the balance between the antioxidant systems and the redox signaling, contributing to cell viability under stress stimuli [32]. In PPARA-silenced cells, we reported a slight, but significant, increase in ROS production with respect to the control cells. It is reported that many transcriptional factors and proteins involved in hypertrophic processes are subjected to redox regulation following the glutathionylation of susceptible cysteine residues [11]. GSH is usually present in its reduced form, and is converted into its oxidized form by stimulation such as oxidative stress. The GSH/GSSG ratio is thus a valuable indicator of oxidative stress in tissue and cells [33]. In our study, we show a decrease in this ratio, indicating an alteration of oxidative balance in PPARA-silenced cells with respect to the control. This imbalance might be responsible for iron-dependent lipid peroxidation, driving towards a form of regulated cell death known as ferroptosis [34]. In order to investigate the PPARα role in ferroptosis, we assayed the mRNA expression level of some possible ferroptosis-related genes, including GPX4, AIFM2, MDM2 and NFE2, in our models. Even though under PPARA silencing, non-significant effects were observed in GPX4 and NFE2 mRNA levels, the depletion of PPARα significantly increased AIFM2 and decreased MDM2 transcription levels. Accordingly, the AIFM2 pathway was reported as one of the mitochondrial pathways linked to ferroptosis in cardiac diseases [35]. The observed reduction in MDM2 transcription is in line with previous evidence where Hauck et al. [36] demonstrated that cardiac depletion of MDM2 in mice caused a concentric cardiac hypertrophy, strongly associated with down-regulation of the PPARα pathway and an increase in ROS. Furthermore, Xing et al. [37] also reported that PPARA−/− mice displayed higher ROS levels, lower levels of hepatic GSH and were more sensitive to ferroptosis when fed with a high-iron diet.
An explanation of hypertrophic phenotype characterized by NPPB up-regulation observed in PPARA-silenced cells could be a possible epigenetic modulation mediated by dynamic regulation of H3K27 in its promoter region [13]. We found a statistically significant increase in H3K27ac and a decrease in H3K27me3 expression in our PPARA-silenced cells. Epigenetic modifications, such as histone acetylation and methylation, are associated with adult CH and heart failure. Indeed, genome-wide analysis in heart hypertrophy has evidenced many genes and their enhancers modified through histone-3 lysine-27 acetylation (H3K27ac), associated with gene activation, and histone-3 lysine-27 trimethylation (H3K27me3), associated with gene repression and compacted heterochromatin [38]. In particular, NPPB reactivation related to epigenetic modifications at its promoter region was reported in patients with heart failure [38].
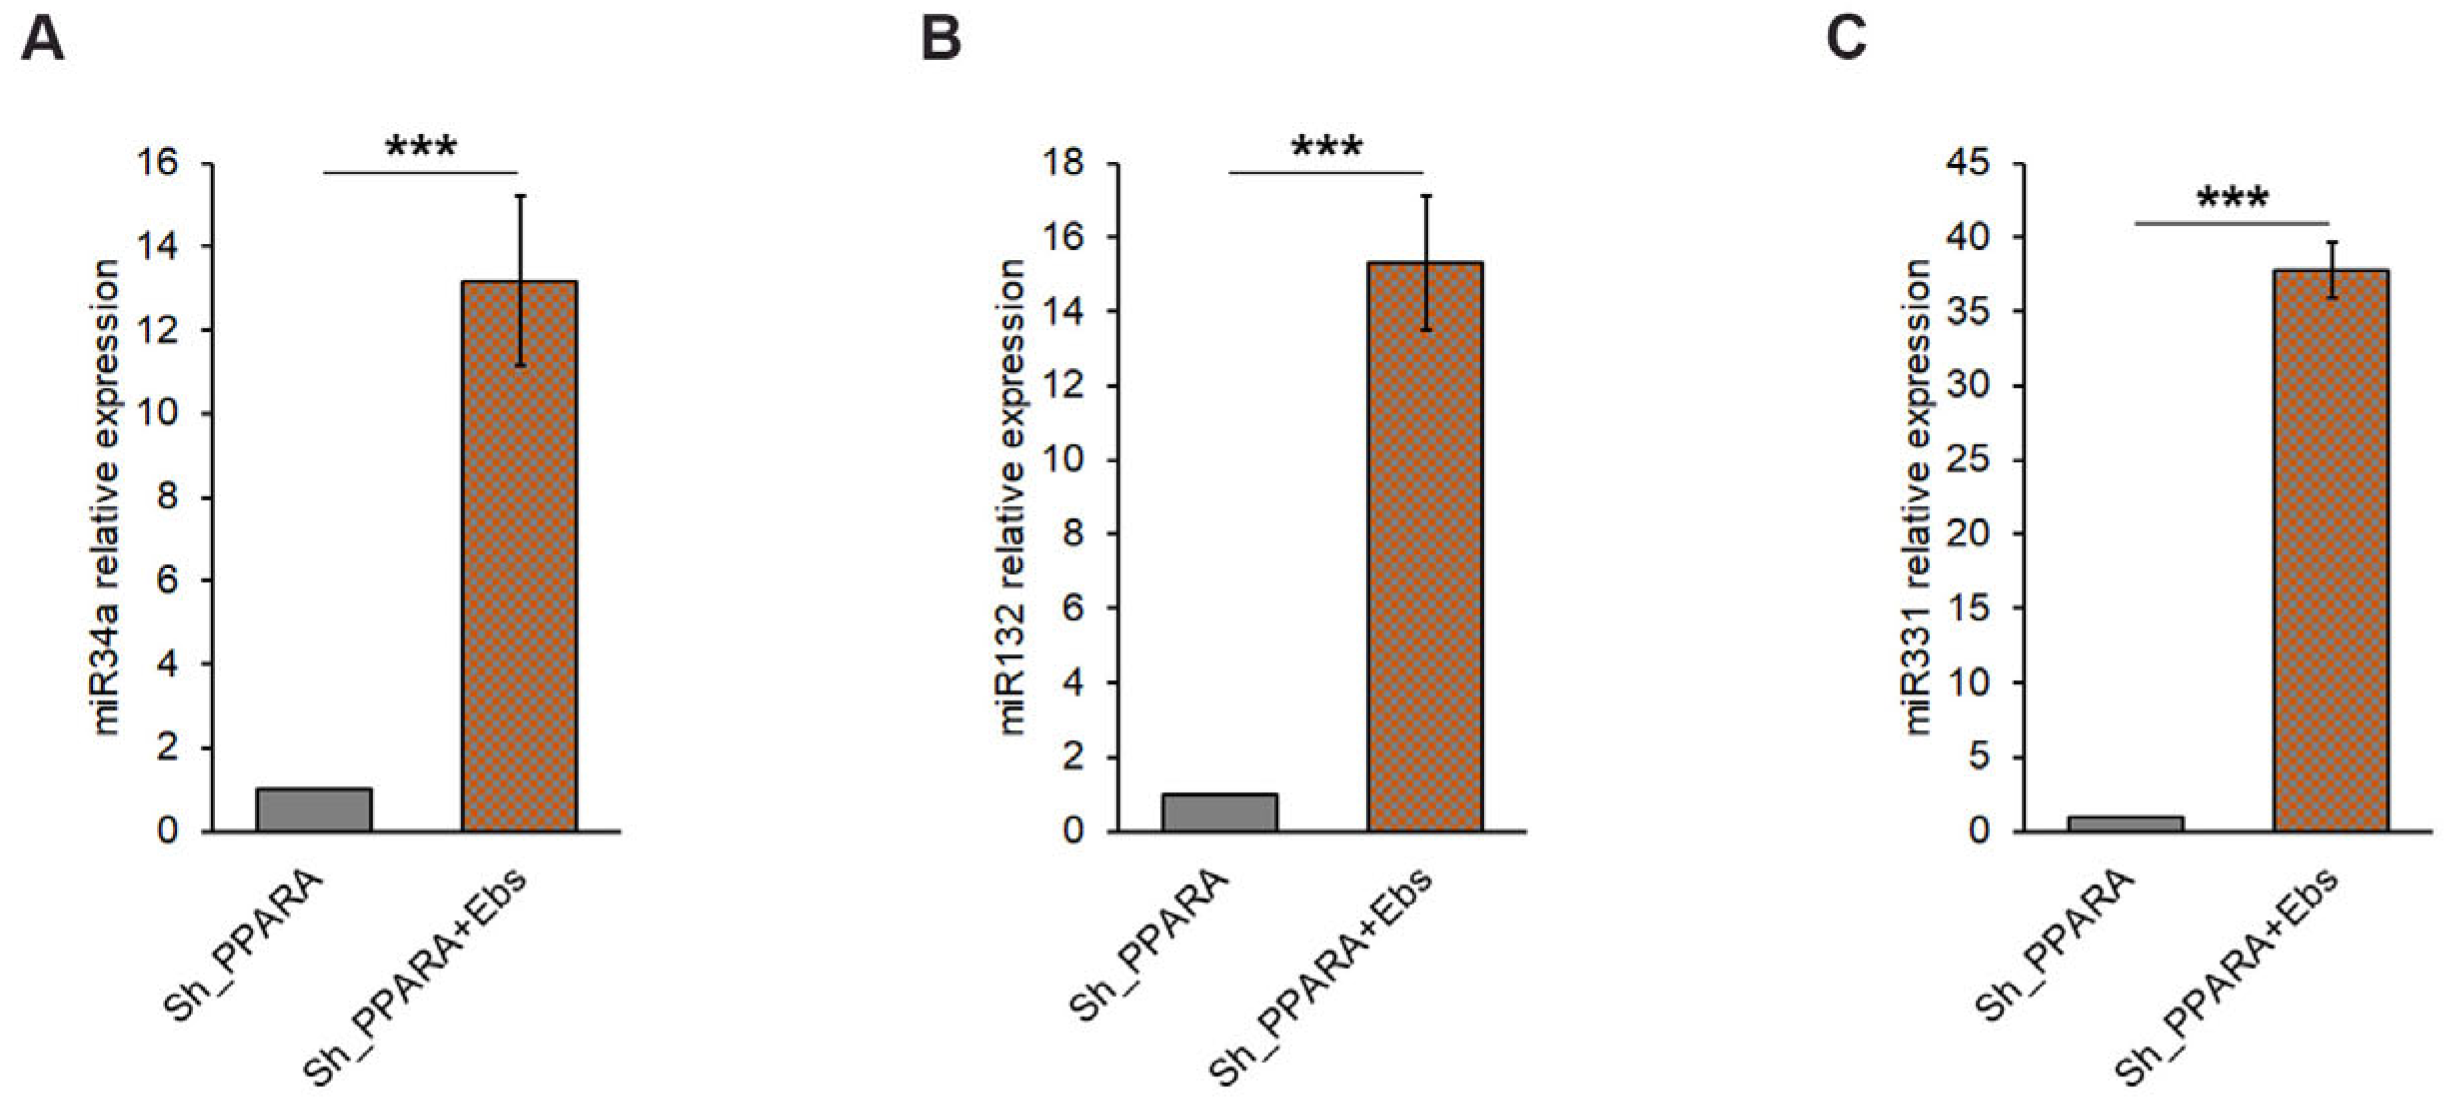
MiRNAs represent a further epigenetic regulatory mechanism upstream of NPPB transcription [13]. Multiple miRNAs modulate the expression of the NPPB mRNA in cardiomyocytes by binding to its 3′-UTR in a sequence-specific manner. TargetScan provided us with a list of 13 miRNAs with only poorly conserved sites on the NPPB promoter in the rat. Among these, we investigated three specific miRNAs, including miR34a, miR132 and miR331, that were also previously associated with cardiac hypertrophy [13,16,17,18]. Our data demonstrated that the hypertrophic model caused by PPARα depletion exhibited a significant downregulation of all these miRNAs. Conversely, most of the evidence reported these miRNAs as potential therapeutic targets in cardiac hypertrophy and remodeling [39,40]. Even if these findings highlight that further studies are necessary to clarify the epigenetic involvement in cardiac hypertrophy, they suggest that the use of compounds able to interfere with epigenetic mechanisms could be a helpful approach. In particular, besides its antioxidant properties [19], Ebs could be considered a pan-epigenetic inhibitor due to its targeting of erasers and readers [41,42]. As expected, in our experimental condition, Ebs treatment reduced hypertrophic phenotype, oxidative stress and determined an up-regulation of miRNAs expression in PPARα-silenced cells, thus restoring a condition that resembled the normal cardiomyoblasts.
In conclusion, our data highlight that PPAR silencing triggers morphological and molecular changes that prompt hypertrophy in rat cardiomyoblasts, and that anti-oxidant Ebs treatment can revert these modifications, thus opening a new scenario for deep pre-clinical studies on the therapeutic value of this small molecule in human CH.
Supplementary Materials
The following supporting information can be downloaded at the website of this paper posted on Preprints.org. Table S1: Primer list; Figure S1: In vitro model of PPARA-silenced H9C2 cells; Figure S2: High-resolution images of the lower panels reported in Figure 2A; Figure S3: Oxidative stress and ferroptosis in PPARA-silenced H9C2 cells; Table S2: Table S2. Characteristics of the 13 poorly conserved miRNAs that could target the 3’UTR region of the NPPB promoter; Figure S4. Representative immunoblotting of PPARα quantification reported in Figure 5E; Figure S5: Effect of Ebs on H3K27ac and H3K27me3 in PPARA-silenced H9c2 cells.
Author Contributions
Conceptualization, A.A. and A.P.; methodology, M.B., N.P., S.P., N.C., C.D.S., M.S.; validation, M.B., N.P. and A.A.; formal analysis, M.B., N.P. and A.A.; investigation, M.B., N.P. and A.A.; data curation, M.B., N.P., D.C., F.P., and A.A.; writing—original draft preparation, M.B., A.A. and A.P.; writing—review and editing, M.B., A.A. and A.P.; supervision, A.A. and A.P.; project administration, A.A. and A.P.; funding acquisition, A.A. and A.P. All authors have read and agreed to the published version of the manuscript.
Funding
This research was funded by the European Union—Next Generation EU—NRRP M6C2—Investment 2.1 Enhancement and strengthening of biomedical research in the NHS (CUP number E83C24000750006), that funded also the APC. The Italian Ministry of Health also supported this work with “Current Research funds”.
Institutional Review Board Statement
Not applicable.
Informed Consent Statement
Not applicable.
Data Availability Statement
The data that support the findings of this study are available from the corresponding author upon reasonable request.
Conflicts of Interest
The authors declare no conflicts of interest.
Abbreviations
The following abbreviations are used in this manuscript:
| 3’UTR | 3'-untranslated region |
| ACOX1 | Acyl-coenzyme A oxidase 1 gene |
| AIFM2 | AIF family member 2 |
| BNP | Protein B-type natriuretic peptide |
| CH | Cardiac hypertrophy |
| CM-H2DCFDA | 5-(6)-Chloromethyl-2',7'-dichlorodihydrofluorescein diacetate, acetyl ester |
| Ebs | Ebselen |
| FBXO32 | Muscle Atrophy F-box gene |
| FOXO3 | Forkhead box O3 gene |
| GAPDH | Glyceraldehyde-3-Phosphate Dehydrogenase gene |
| GSH | Reduced glutathione |
| GSSG | Oxidized glutathione |
| H2O2 | Hydrogen peroxide |
| MDM2 | Mouse double minute 2 homolog |
| NFE2 | Nuclear factor erythroid 2 gene |
| NPPB | Brain Natriuretic Peptide B gene |
| PBS | Phosphate Buffered Saline |
| PPAR | Peroxisome proliferator-activated receptor family of lipid-activated nuclear receptors |
| ROS | Reactive oxygen species |
| SYBR-green | 2-[N-(3-dimethylaminopropyl)-N-propylamino]-4-[2,3-dihydro-3-methyl-(benzo-1,3-thiazol-2-yl)-methylidene]-1-phenyl-quinolinium |
References
- Nakamura, M.; Sadoshima, J. Mechanisms of physiological and pathological cardiac hypertrophy. Nat. Rev. Cardiol. 2018, 15, 387–407. [Google Scholar] [CrossRef] [PubMed]
- Schiattarella, G.G.; Hill, J.A. Inhibition of hypertrophy is a good therapeutic strategy in ventricular pressure overload. Circulation 2015, 131, 1435–1447. [Google Scholar] [CrossRef]
- Desvergne, B.; Wahli, W. Peroxisome proliferator-activated receptors: nuclear control of metabolism. Endocr. Rev. 1999, 20, 649–688. [Google Scholar] [CrossRef]
- Barger, P.M.; Brandt, J.M.; Leone, T.C.; Weinheimer, C.J.; Kelly, D.P. Deactivation of peroxisome proliferator-activated receptor-alpha during cardiac hypertrophic growth. J. Clin. Invest. 2000, 105, 1723–1730. [Google Scholar] [CrossRef]
- Guellich, A.; Damy, T.; Lecarpentier, Y.; Conti, M.; Claes, V.; Samuel, J.L.; Quillard, J.; Hébert, J.L.; Pineau, T.; Coirault, C. Role of oxidative stress in cardiac dysfunction of PPARalpha-/- mice. Am. J. Physiol. Heart Circ. Physiol. 2007, 293, H93–H102. [Google Scholar] [CrossRef]
- Watanabe, K.; Fujii, H.; Takahashi, T.; Kodama, M.; Aizawa, Y.; Ohta, Y.; Ono, T.; Hasegawa, G.; Naito, M.; Nakajima, T.; et al. Constitutive regulation of cardiac fatty acid metabolism through peroxisome proliferator-activated receptor alpha associated with age-dependent cardiac toxicity. J. Biol. Chem. 2000, 275, 22293–22299. [Google Scholar] [CrossRef]
- Russell, L.K.; Finck, B.N.; Kelly, D.P. Mouse models of mitochondrial dysfunction and heart failure. J. Mol. Cell Cardiol. 2005, 38, 81–91. [Google Scholar] [CrossRef]
- Takano, H.; Nagai, T.; Asakawa, M.; Toyozaki, T.; Oka, T.; Komuro, I.; Saito, T.; Masuda, Y. Peroxisome proliferator-activated receptor activators inhibit lipopolysaccharide-induced tumor necrosis factor-alpha expression in neonatal rat cardiac myocytes. Circ. Res. 2000, 87, 596–602. [Google Scholar] [CrossRef] [PubMed]
- Hescheler, J.; Meyer, R.; Plant, S.; Krautwurst, D.; Rosenthal, W.; Schultz, G. Morphological, biochemical, and electrophysiological characterization of a clonal cell (H9c2) line from rat heart. Circ. Res. 1991, 69, 1476–1486. [Google Scholar] [CrossRef] [PubMed]
- Feldman, A.T.; Wolfe, D. Tissue processing and hematoxylin and eosin staining. Methods Mol. Biol. 2014, 1180, 31–43. [Google Scholar] [CrossRef]
- Panera, N.; Gnani, D.; Piermarini, E.; Petrini, S.; Bertini, E.; Nobili, V.; Pastore, A.; Piemonte, F.; Alisi, A. High concentrations of H2O2 trigger hypertrophic cascade and phosphatase and tensin homologue (PTEN) glutathionylation in H9c2 cardiomyocytes. Exp. Mol. Pathol. 2016, 100, 199–206. [Google Scholar] [CrossRef]
- Man, J.; Barnett, P.; Christoffels, V.M. Structure and function of the Nppa-Nppb cluster locus during heart development and disease. Cell Mol Life Sci. 2018, 75, 1435–1444. [Google Scholar] [CrossRef]
- Rubattu, S.; Stanzione, R.; Cotugno, M.; Bianchi, F.; Marchitti, S.; Forte, M. Epigenetic control of natriuretic peptides: implications for health and disease. Cell Mol Life Sci. 2020, 24, 5121–5130. [Google Scholar] [CrossRef]
- Wei, J.Q.; Shehadeh, L.A.; Mitrani, J.M.; Pessanha, M.; Slepak, T.I.; Webster, K.A.; Bishopric, N.H. Quantitative control of adaptive cardiac hypertrophy by acetyltransferase p300. Circulation 2008, 118, 934–946. [Google Scholar] [CrossRef] [PubMed]
- Agarwal, V.; Bell, G.W.; Nam, J.; Bartel, D.P. Predicting effective microRNA target sites in mammalian mRNAs. eLife 2015, 4, e05005. [Google Scholar] [CrossRef]
- Bernardo, B.C.; Gao, X.M.; Tham, Y.K.; Kiriazis, H.; Winbanks, C.E.; Ooi, J.Y.; Boey, E.J.; Obad, S.; Kauppinen, S.; Gregorevic, P.; et al. Silencing of miR-34a attenuates cardiac dysfunction in a setting of moderate, but not severe, hypertrophic cardiomyopathy. PLoS One 2014, 9, e90337. [Google Scholar] [CrossRef] [PubMed]
- Zhang, J.J.; Wang, L.P.; Li, R.C.; Wang, M.; Huang, Z.H.; Zhu, M.; Wang, J.X.; Wang, X.J.; Wang, S.Q.; Xu, M. Abnormal expression of miR-331 leads to impaired heart function. Sci. Bull. (Beijing) 2019, 14, 1011–1017. [Google Scholar] [CrossRef]
- Hinkel, R.; Batkai, S.; Bähr, A. Bozoglu, T.; Straub, S.; Borchert, T.; Viereck, J.; Howe, A.; Hornaschewitz, N.; Oberberger, L.; et al. AntimiR-132 Attenuates Myocardial Hypertrophy in an Animal Model of Percutaneous Aortic Constriction. J. Am. Coll. Cardiol. 2021, 23, 2923–2935. [Google Scholar] [CrossRef] [PubMed]
- Wang, J.; Wang, P.; Dong, C.; Zhao, Y.; Zhou, J.; Yuan, C.; Zou, L. Mechanisms of ebselen as a therapeutic and its pharmacology applications. Future Med. Chem. 2020, 23, 2141–2160. [Google Scholar] [CrossRef]
- Barchielli, G.; Capperucci, A.; Tanini, D. The Role of Selenium in Pathologies: An Updated Review. Antioxidants 2022, 251. [Google Scholar] [CrossRef]
- Lin, Y.; Wang, Y.; Li, P.F. PPARα: An emerging target of metabolic syndrome, neurodegenerative and cardiovascular diseases. Front. Endocrinol. (Lausanne) 2022, 13, 1074911. [Google Scholar] [CrossRef]
- Fillmore, N.; Mori, J.; Lopaschuk, G.D. Mitochondrial fatty acid oxidation alterations in heart failure, ischaemic heart disease and diabetic cardiomyopathy. Br. J. Pharmacol. 2014, 171, 2080–2090. [Google Scholar] [CrossRef]
- Wang, W.; Fang, Q.; Zhang, Z.; Wang, D.; Wu, L.; Wang, Y. PPARα Ameliorates Doxorubicin-Induced Cardiotoxicity by Reducing Mitochondria-Dependent Apoptosis via Regulating MEOX1. Front. Pharmacol. 2020, 11, 528267. [Google Scholar] [CrossRef]
- Ibarra-Lara, L.; Hong, E.; Soria-Castro, E.; Torres-Narváez, J.C.; Pérez-Severiano, F.; Del Valle-Mondragón, L.; Cervantes-Pérez, L.G.; Ramírez-Ortega, M.; Pastelín-Hernández, G.S.; Sánchez-Mendoza, A. Clofibrate PPARα activation reduces oxidative stress and improves ultrastructure and ventricular hemodynamics in no-flow myocardial ischemia. J. Cardiovasc. Pharmacol. 2012, 60, 323–334. [Google Scholar] [CrossRef]
- Dodd, M.S.; Ambrose, L.; Ball, V.; Clarke, K.; Carr, C.A.; Tyler, D.J. The age-dependent development of abnormal cardiac metabolism in the peroxisome proliferator-activated receptor α-knockout mouse. Atherosclerosis 2024, 399, 118599. [Google Scholar] [CrossRef]
- Li, H.H.; Willis, M.S.; Lockyer, P.; Miller, N.; McDonough, H.; Glass, D.J.; Patterson, C. Atrogin-1 inhibits Akt-dependent cardiac hypertrophy in mice via ubiquitin-dependent coactivation of Forkhead proteins. J. Clin. Invest. 2007, 117, 3211–3223. [Google Scholar] [CrossRef]
- Pandey, K.N. Molecular Signaling Mechanisms and Function of Natriuretic Peptide Receptor-A in the Pathophysiology of Cardiovascular Homeostasis. Front. Physiol. 2021, 12, 693099. [Google Scholar] [CrossRef]
- Li, H.H.; Kedar, V.; Zhang, C.; McDonough, H.; Arya, R.; Wang, D.Z.; Patterson, C. Atrogin-1/muscle atrophy F-box inhibits calcineurin-dependent cardiac hypertrophy by participating in an SCF ubiquitin ligase complex. J. Clin. Invest. 2004, 114, 1058–1071. [Google Scholar] [CrossRef] [PubMed]
- Pruimboom-Brees, I.; Haghpassand, M.; Royer, L.; Brees, D.; Aldinger, C.; Reagan, W.; Singh, J.; Kerlin, R.; Kane, C.; Bagley, S.; et al. A critical role for peroxisomal proliferator-activated receptor-alpha nuclear receptors in the development of cardiomyocyte degeneration and necrosis. Am. J. Pathol. 2006, 169, 750–760. [Google Scholar] [CrossRef] [PubMed]
- Smeets, P.J.; Teunissen, B.E.; Willemsen, P.H.; van Nieuwenhoven, F.A.; Brouns, A.E.; Janssen, B.J.; Cleutjens, J.P.; Staels, B.; van der Vusse, G.J.; van Bilsen, M. Cardiac hypertrophy is enhanced in PPAR alpha-/- mice in response to chronic pressure overload. Cardiovasc. Res. 2008, 78, 79–89. [Google Scholar] [CrossRef] [PubMed]
- Elia, A.; Mohsin, S.; Khan, M. Cardiomyocyte Ploidy, Metabolic Reprogramming and Heart Repair. Cells 2023, 12, 1571. [Google Scholar] [CrossRef]
- Bae, Y.S.; Oh, H.; Rhee, S.G.; Yoo, Y.D. Regulation of reactive oxygen species generation in cell signaling. Mol. Cells 2011, 32, 491–509. [Google Scholar] [CrossRef]
- Giustarini, D.; Colombo, G.; Garavaglia, M.L.; Astori, E.; Portinaro, N.M.; Reggiani, F.; Badalamenti, S.; Aloisi, A.M.; Santucci, A.; Rossi, R.; et al. Assessment of glutathione/glutathione disulphide ratio and S-glutathionylated proteins in human blood, solid tissues, and cultured cells. Free Radic. Biol. Med. 2017, 112, 360–375. [Google Scholar] [CrossRef]
- Hadian, K.; Stockwell, B.R. SnapShot: Ferroptosis. Cell 2020, 181, 1188–1188.e1. [Google Scholar] [CrossRef]
- Guo,Y. ; Lu, C.; Hu, K.; Cai, C.; Wang, W. Ferroptosis in Cardiovascular Diseases: Current Status, Challenges, and Future Perspectives. Biomolecules 2022, 3, 390. [Google Scholar] [CrossRef]
- Hauck, L.; Stanley-Hasnain, S.; Fung, A.; Grothe, D.; Rao, V.; Mak, T.W.; Billia, F. Cardiac-specific ablation of the E3 ubiquitin ligase Mdm2 leads to oxidative stress, broad mitochondrial deficiency and early death. PLoS One 2017, 12, e0189861. [Google Scholar] [CrossRef] [PubMed]
- Xing, G.; Meng, L.; Cao, S.; Liu, S.; Wu, J.; Li, Q.; Huang, W.; Zhang, L. PPARα alleviates iron overload-induced ferroptosis in mouse liver. EMBO Rep. 2022, 23, e52280. [Google Scholar] [CrossRef] [PubMed]
- Papait, R.; Cattaneo, P.; Kunderfranco, P.; Greco, C.; Carullo, P.; Guffanti, A.; Viganò, V.; Stirparo, G.G.; Latronico, M.V.; Hasenfuss, G.; et al. Genome-wide analysis of histone marks identifying an epigenetic signature of promoters and enhancers underlying cardiac hypertrophy. Proc. Natl. Acad. Sci. USA 2013, 110, 20164–20169. [Google Scholar] [CrossRef] [PubMed]
- Bernardo, B.C.; Yildiz, G.S.; Kiriazis, H.; Harmawan, C.A.; Tai, C.M.K.; Ritchie, R.H.; McMullen, J.R. In Vivo Inhibition of miR-34a Modestly Limits Cardiac Enlargement and Fibrosis in a Mouse Model with Established Type 1 Diabetes-Induced Cardiomyopathy, but Does Not Improve Diastolic Function. Cells 2022, 19, 3117. [Google Scholar] [CrossRef]
- Kabłak-Ziembicka, A.; Badacz, R.; Okarski, M.; Wawak, M.; Przewłocki, T.; Podolec, J. Cardiac microRNAs: diagnostic and therapeutic potential. Arch. Med. Sci. 2023, 5, 1360–1381. [Google Scholar] [CrossRef]
- Wang, Y.; Wallach, J.; Duane, S.; Wang, Y.; Wu, J.; Wang, J.; Adejare, A.; Ma, H. Developing selective histone deacetylases (HDACs) inhibitors through ebselen and analogs. Drug Des. Devel. Ther. 2017, 11, 1369–1382. [Google Scholar] [CrossRef] [PubMed]
- Dai, W.; Qiao, X.; Fang, Y.; Guo, R.; Bai, P.; Liu, S.; Li, T.; Jiang, Y.; Wei, S.; Na, Z.; et al. Epigenetics-targeted drugs: current paradigms and future challenges. Signal Transduct. Target Ther. 2024, 1, 332. [Google Scholar] [CrossRef] [PubMed]
Figure 1.
PPARA silencing causes a reduction of PPARα gene/protein expression and proliferation rate in H9C2 cells. (A) Bar graph of relative mRNA expression of PPARA by qRT-PCR; ***p< 0.001 vs Sh_Scramble. (B) Bar graph of PPARα protein expression level. GAPDH expression levels were used as a loading reference. The data are representative of three independent experiments; *p < 0.001 vs Sh_Scramble. (C) Representative fluorescence images of PPARα protein expression (red color) in Sh_Scramble and Sh_PPARA stable cells. Nuclei were counterstained with Hoechst 33342 (blue color). Magnification 60×. (D) Bar graph of cell viability measured by XTT assay. (E) The bar graph depicts the percentage of early plus late apoptotic cells measured by flow cytometry. (F) Bar graph of cell proliferation rate expressed as a percentage of Europium counts. *p < 0.05 vs Sh_Scramble equal to 100%.
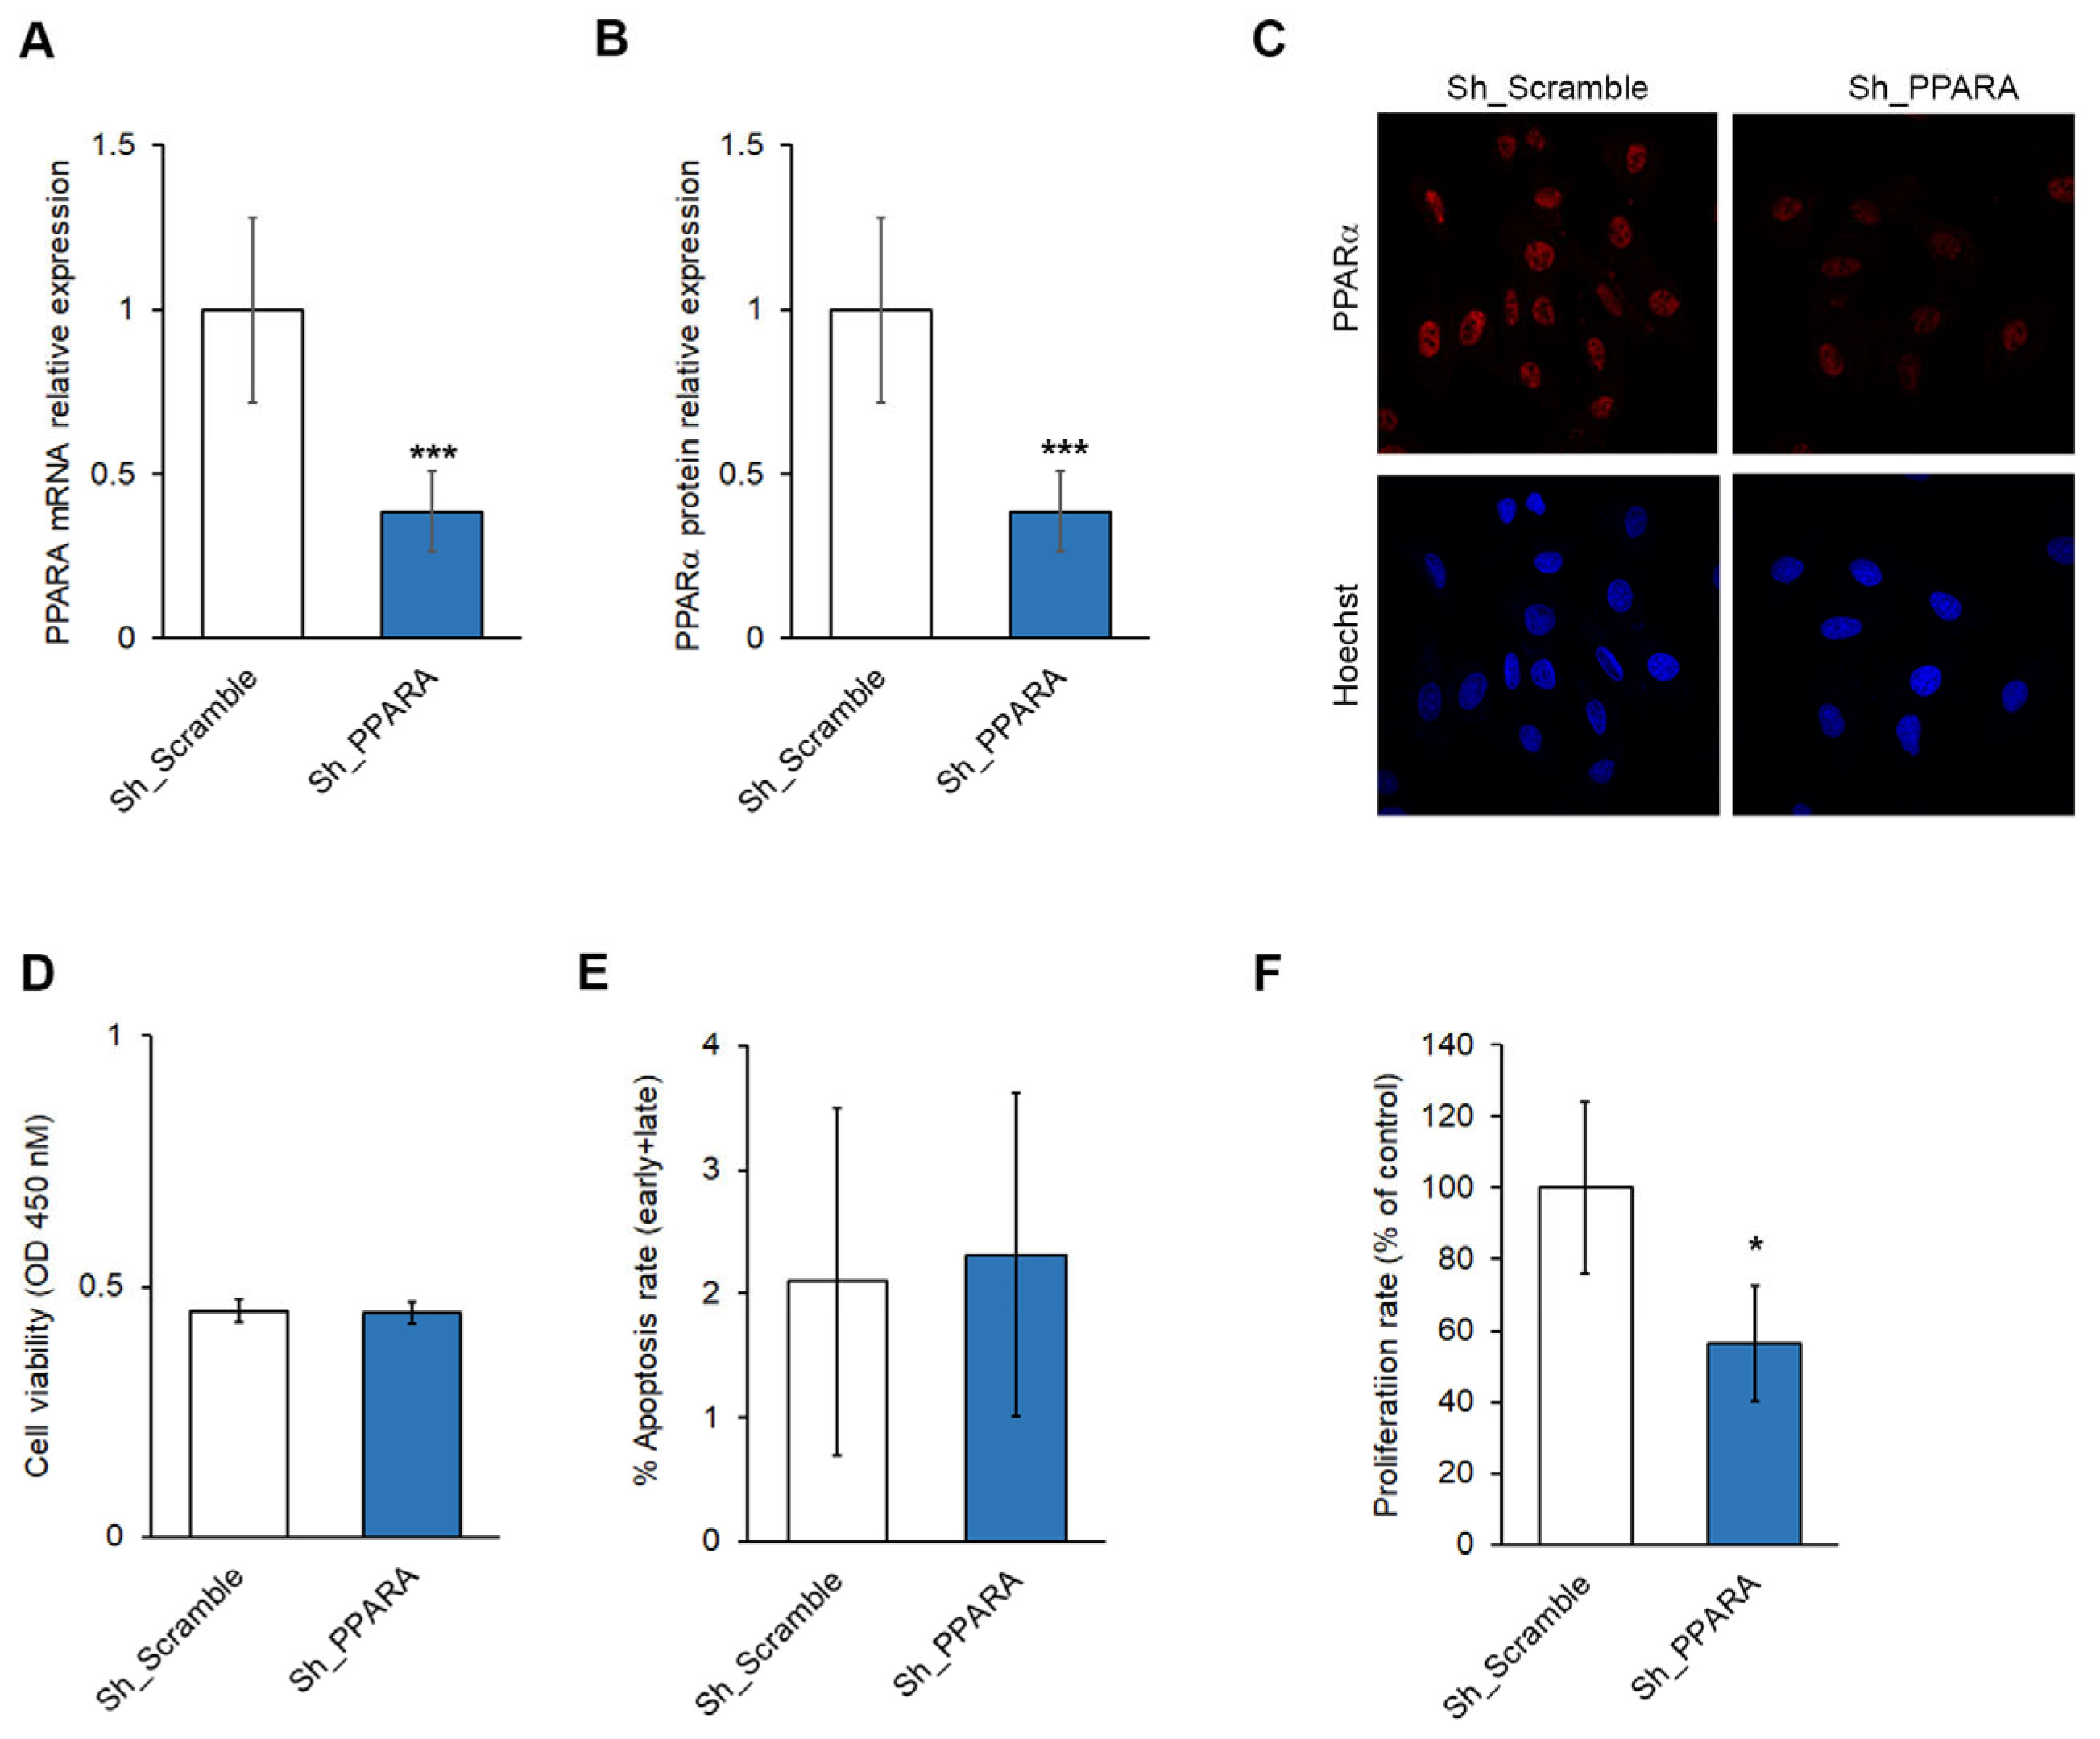
Figure 2.
PPARA silencing causes cell shape changes inducing a hypertrophic phenotype in H9c2 cells. (A) Box plot (upper panel) of mean cell area (n=100) by using Image J and corresponding representative images (lower panel) of H9c2 cardiomyoblasts morphology by hematoxylin and eosin staining. *** p< 0.001 vs Sh_Scramble. (B) Representative images of cytoskeletal structure by merging F-ACTIN labeled with phalloidin (red color) and nuclei stained with Hoechst 33342 (blue color). Magnification 40×. (C-E) Bar graphs of relative mRNA expression of (C) NPPB, (D) FBXO32 and (E) FOXO3a by qRT-PCR. * p< 0.05; **p< 0.01 vs Sh_Scramble. (G) Representative immunofluorescence images of BNP expression (red color) in Sh_PPARA cells and Sh_Scramble cells with or without H2O2. Nuclei were counterstained with Hoechst 33342 (blue color). Control of anti-Rb secondary antibody was also reported. Magnification 60×.
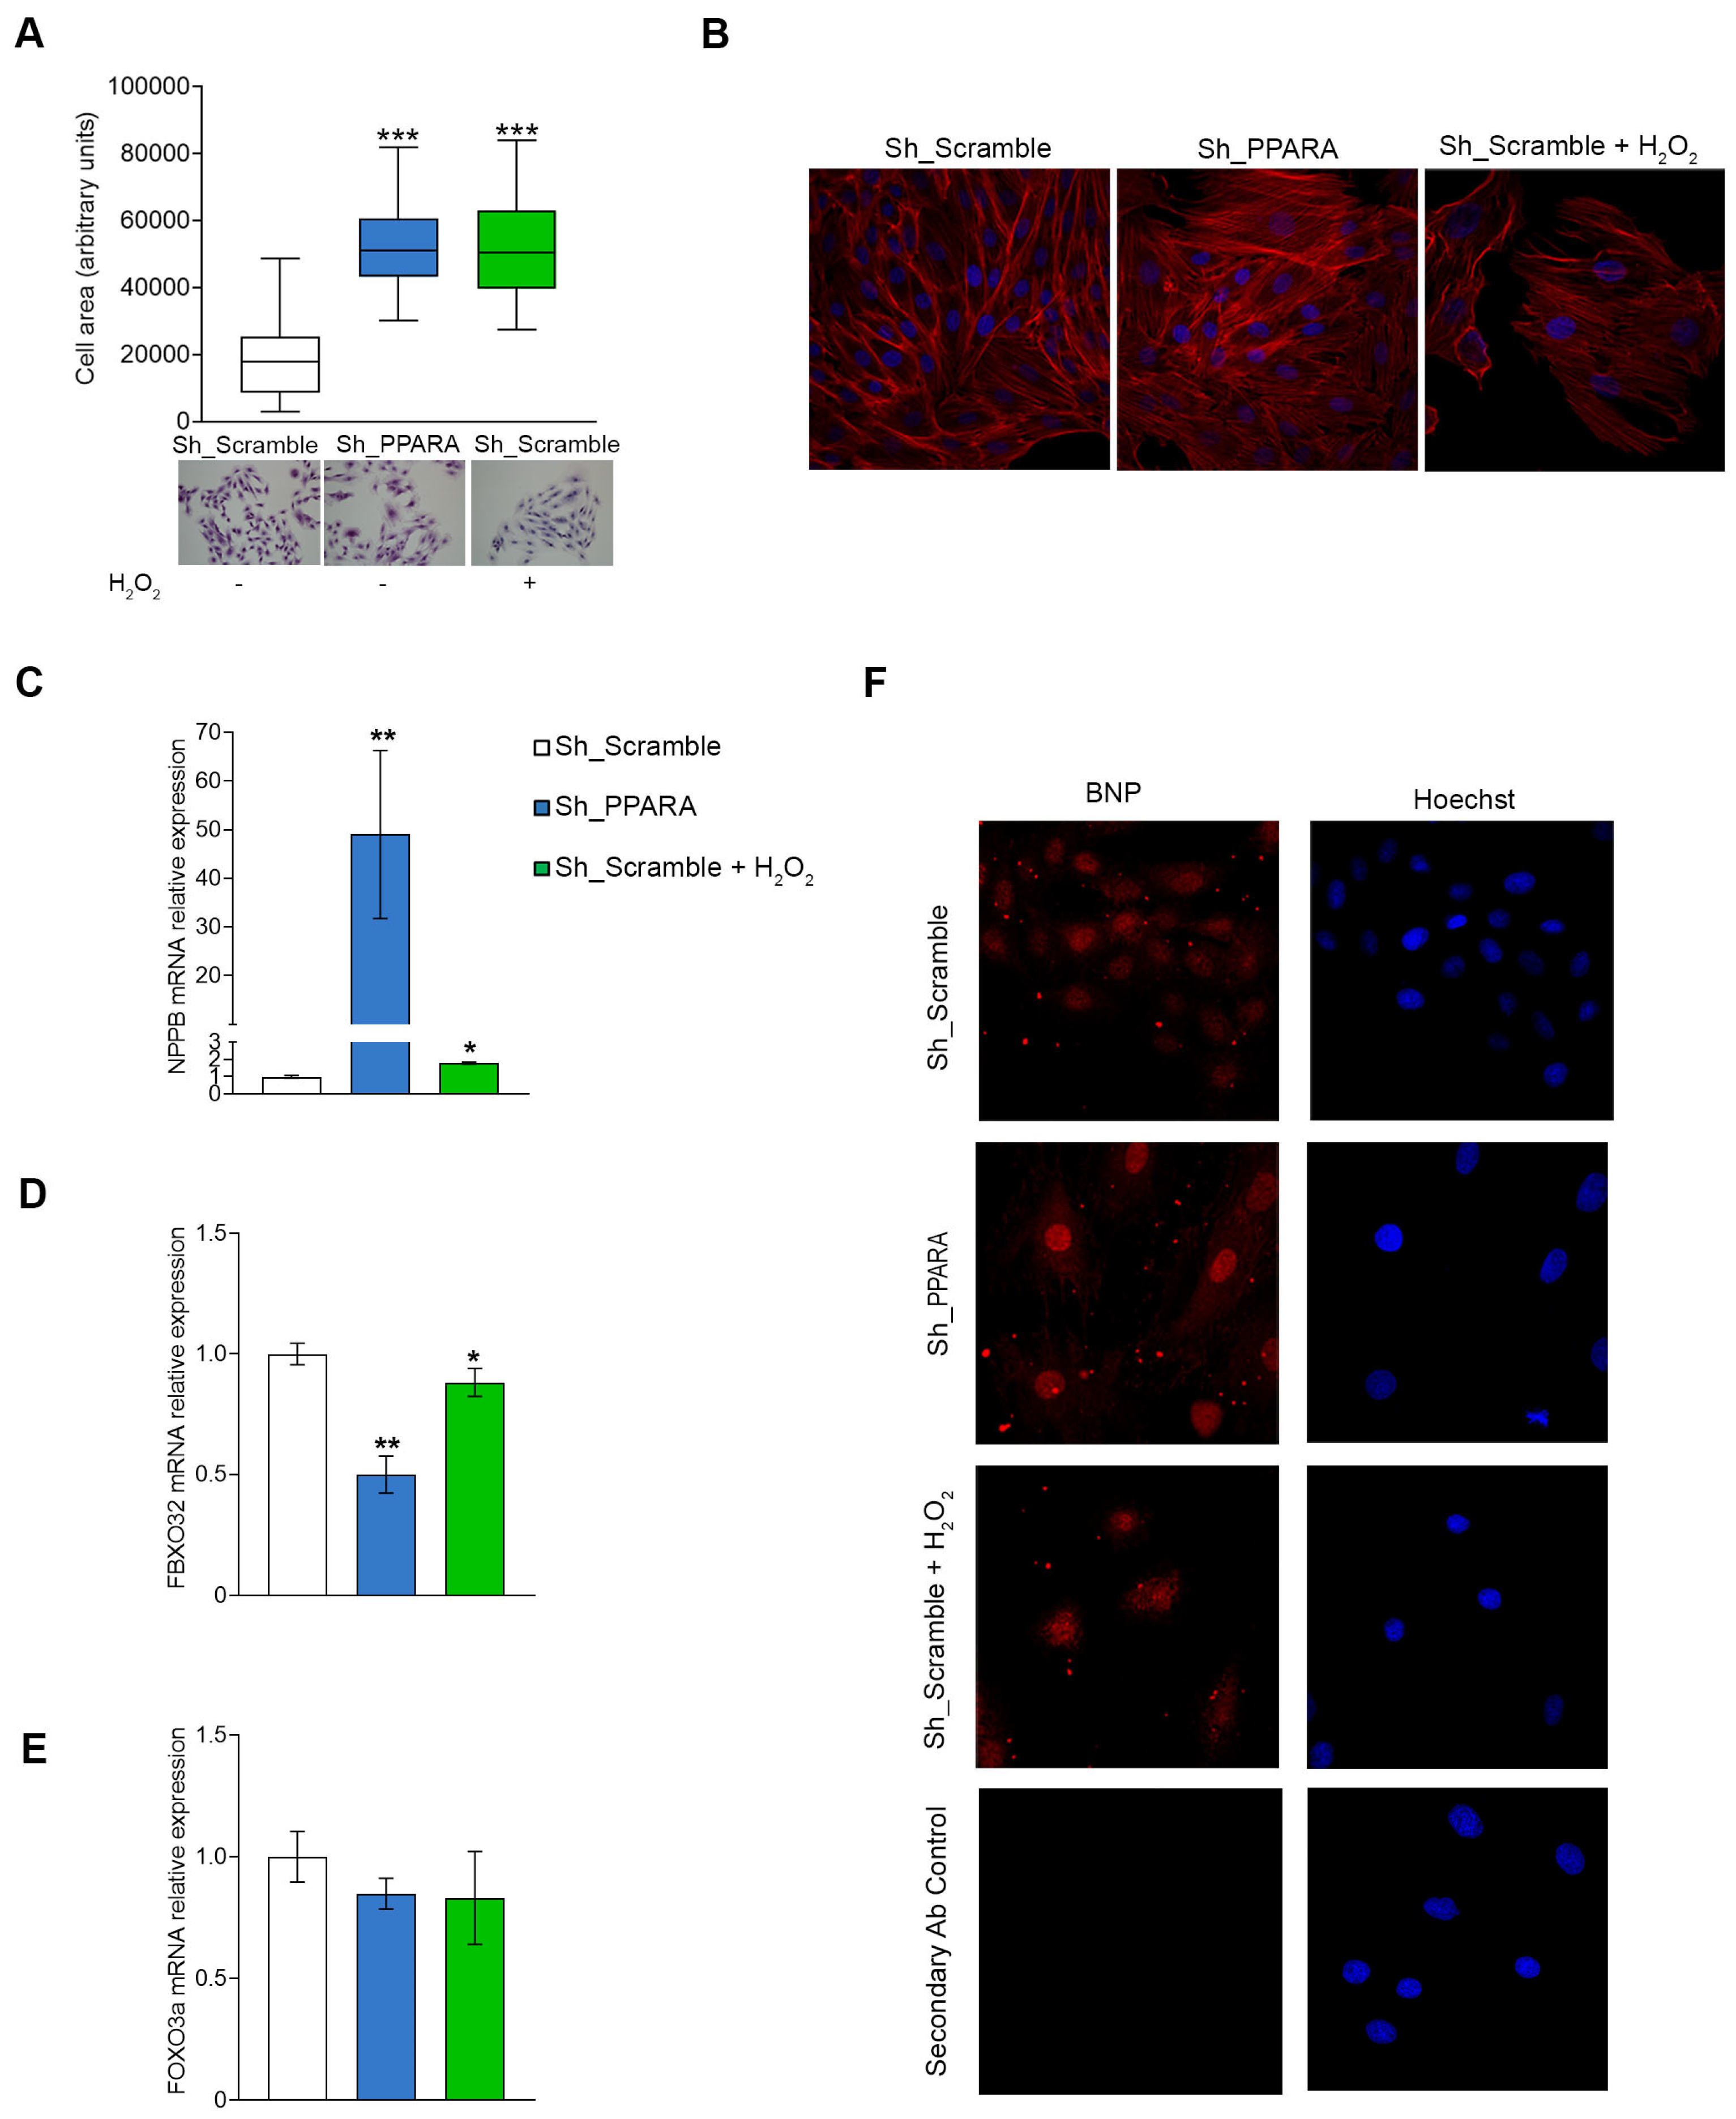
Figure 3.
PPARA silencing affects the oxidative response and ferroptosis genes in H9C2 cells. (A) Bar graph of ROS production by measuring the CM-H2DCFDA fluorescence intensity expressed as fold change respect to Sh_Scramble equal to 1. * p< 0.05 (B) Bar graph of GSH/GSSG ratio. **p< 0.01; vs Sh_Scramble. (C-D) Bar graph of relative mRNA expression of (C) AIFM2, and (E) MDM2 by qRT-PCR. **p< 0.01; vs Sh_Scramble.
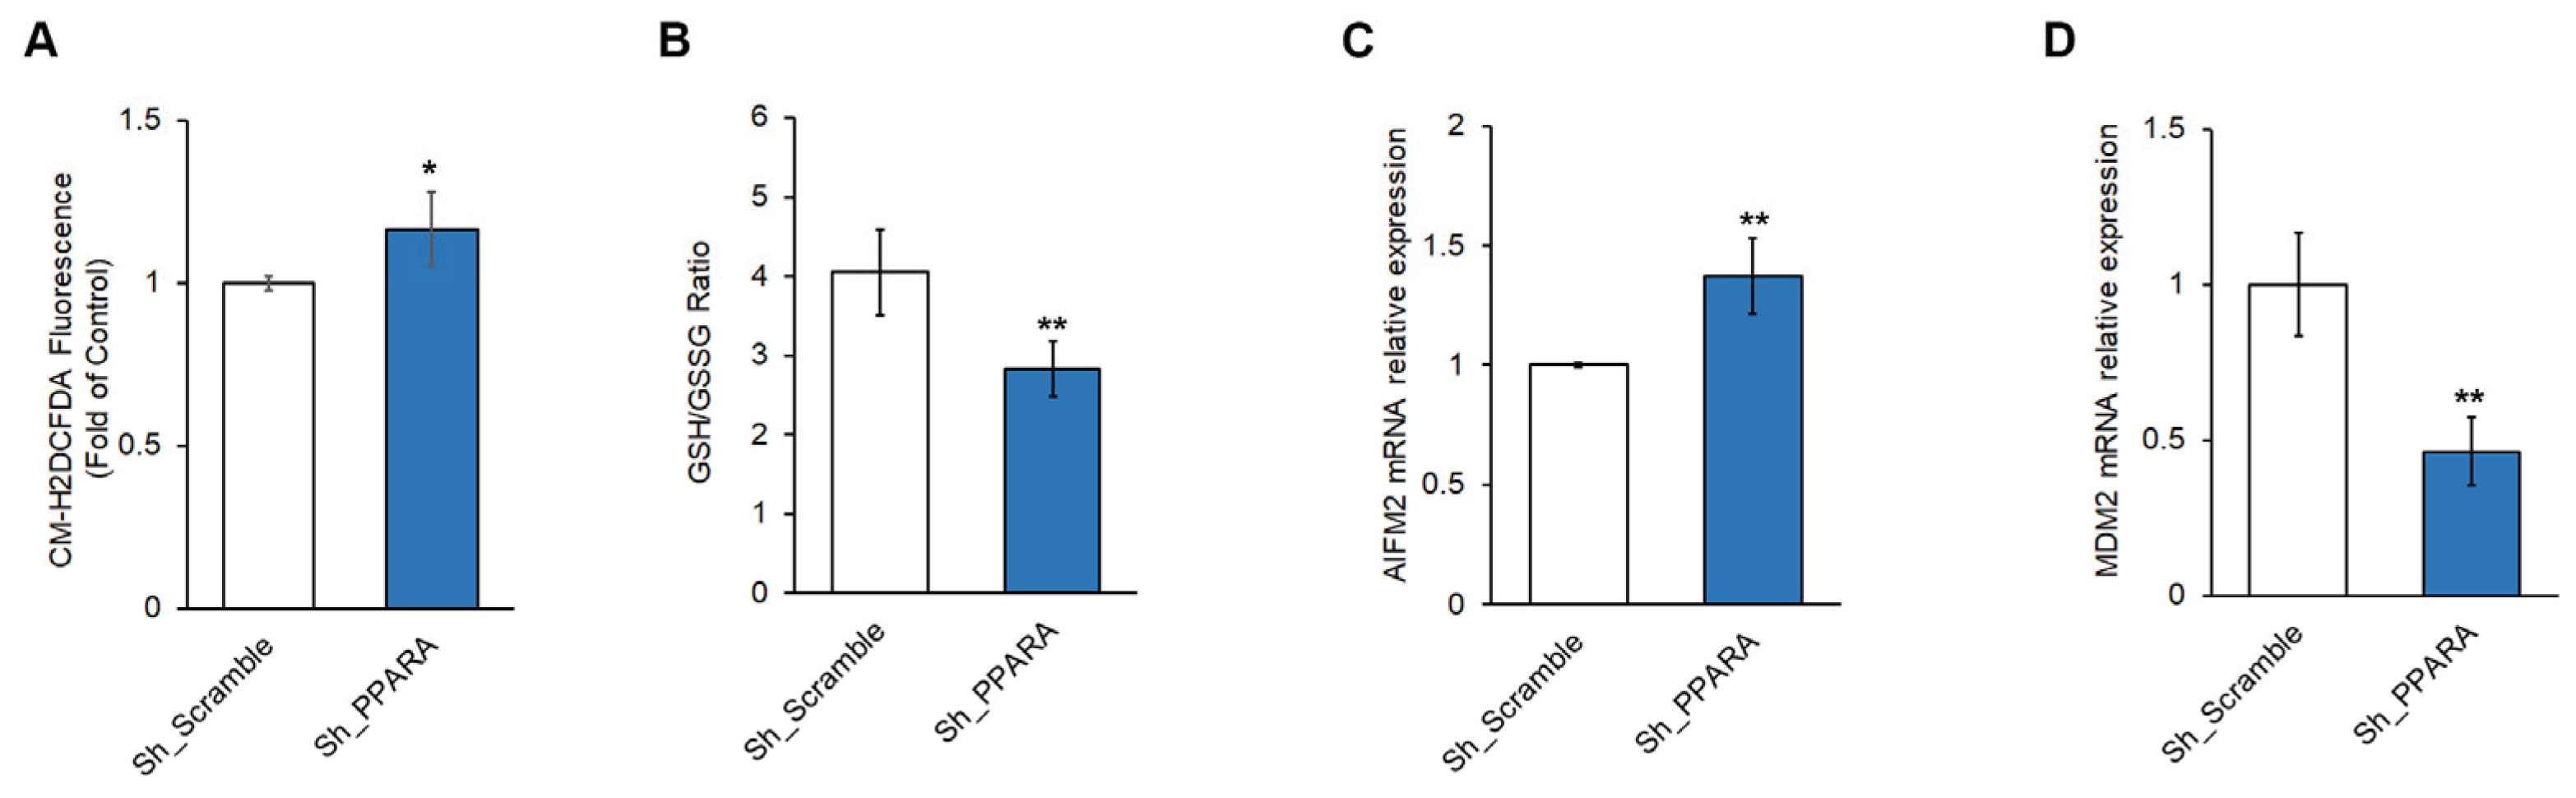
Figure 4.
PPARA silencing determines epigenetic modulation in correspondence with Histone H3 in H9c2 cells. Quantification (upper panels) and representative immunoblotting (lower panels) of the protein expression of (A) H3 total, (B) H3K27ac, and (C) H3K27me3 in Sh_Scramble and Sh_PPPARA cells. GAPDH expression levels were used as a loading reference for H3 total and H3K27ac. For H3K27me3 protein expression level, total histone H3 was used as a loading reference. Data are representative of three independent experiments. *** p < 0.001 **p < 0.01 vs Sh_Scramble. Bar graph of relative miRNAs detection (D) rno-miR-34a, (E) rno-miR-132, and (F) rno-miR-331 by qRT-PCR. ***p< 0.001; vs Sh_Scramble.
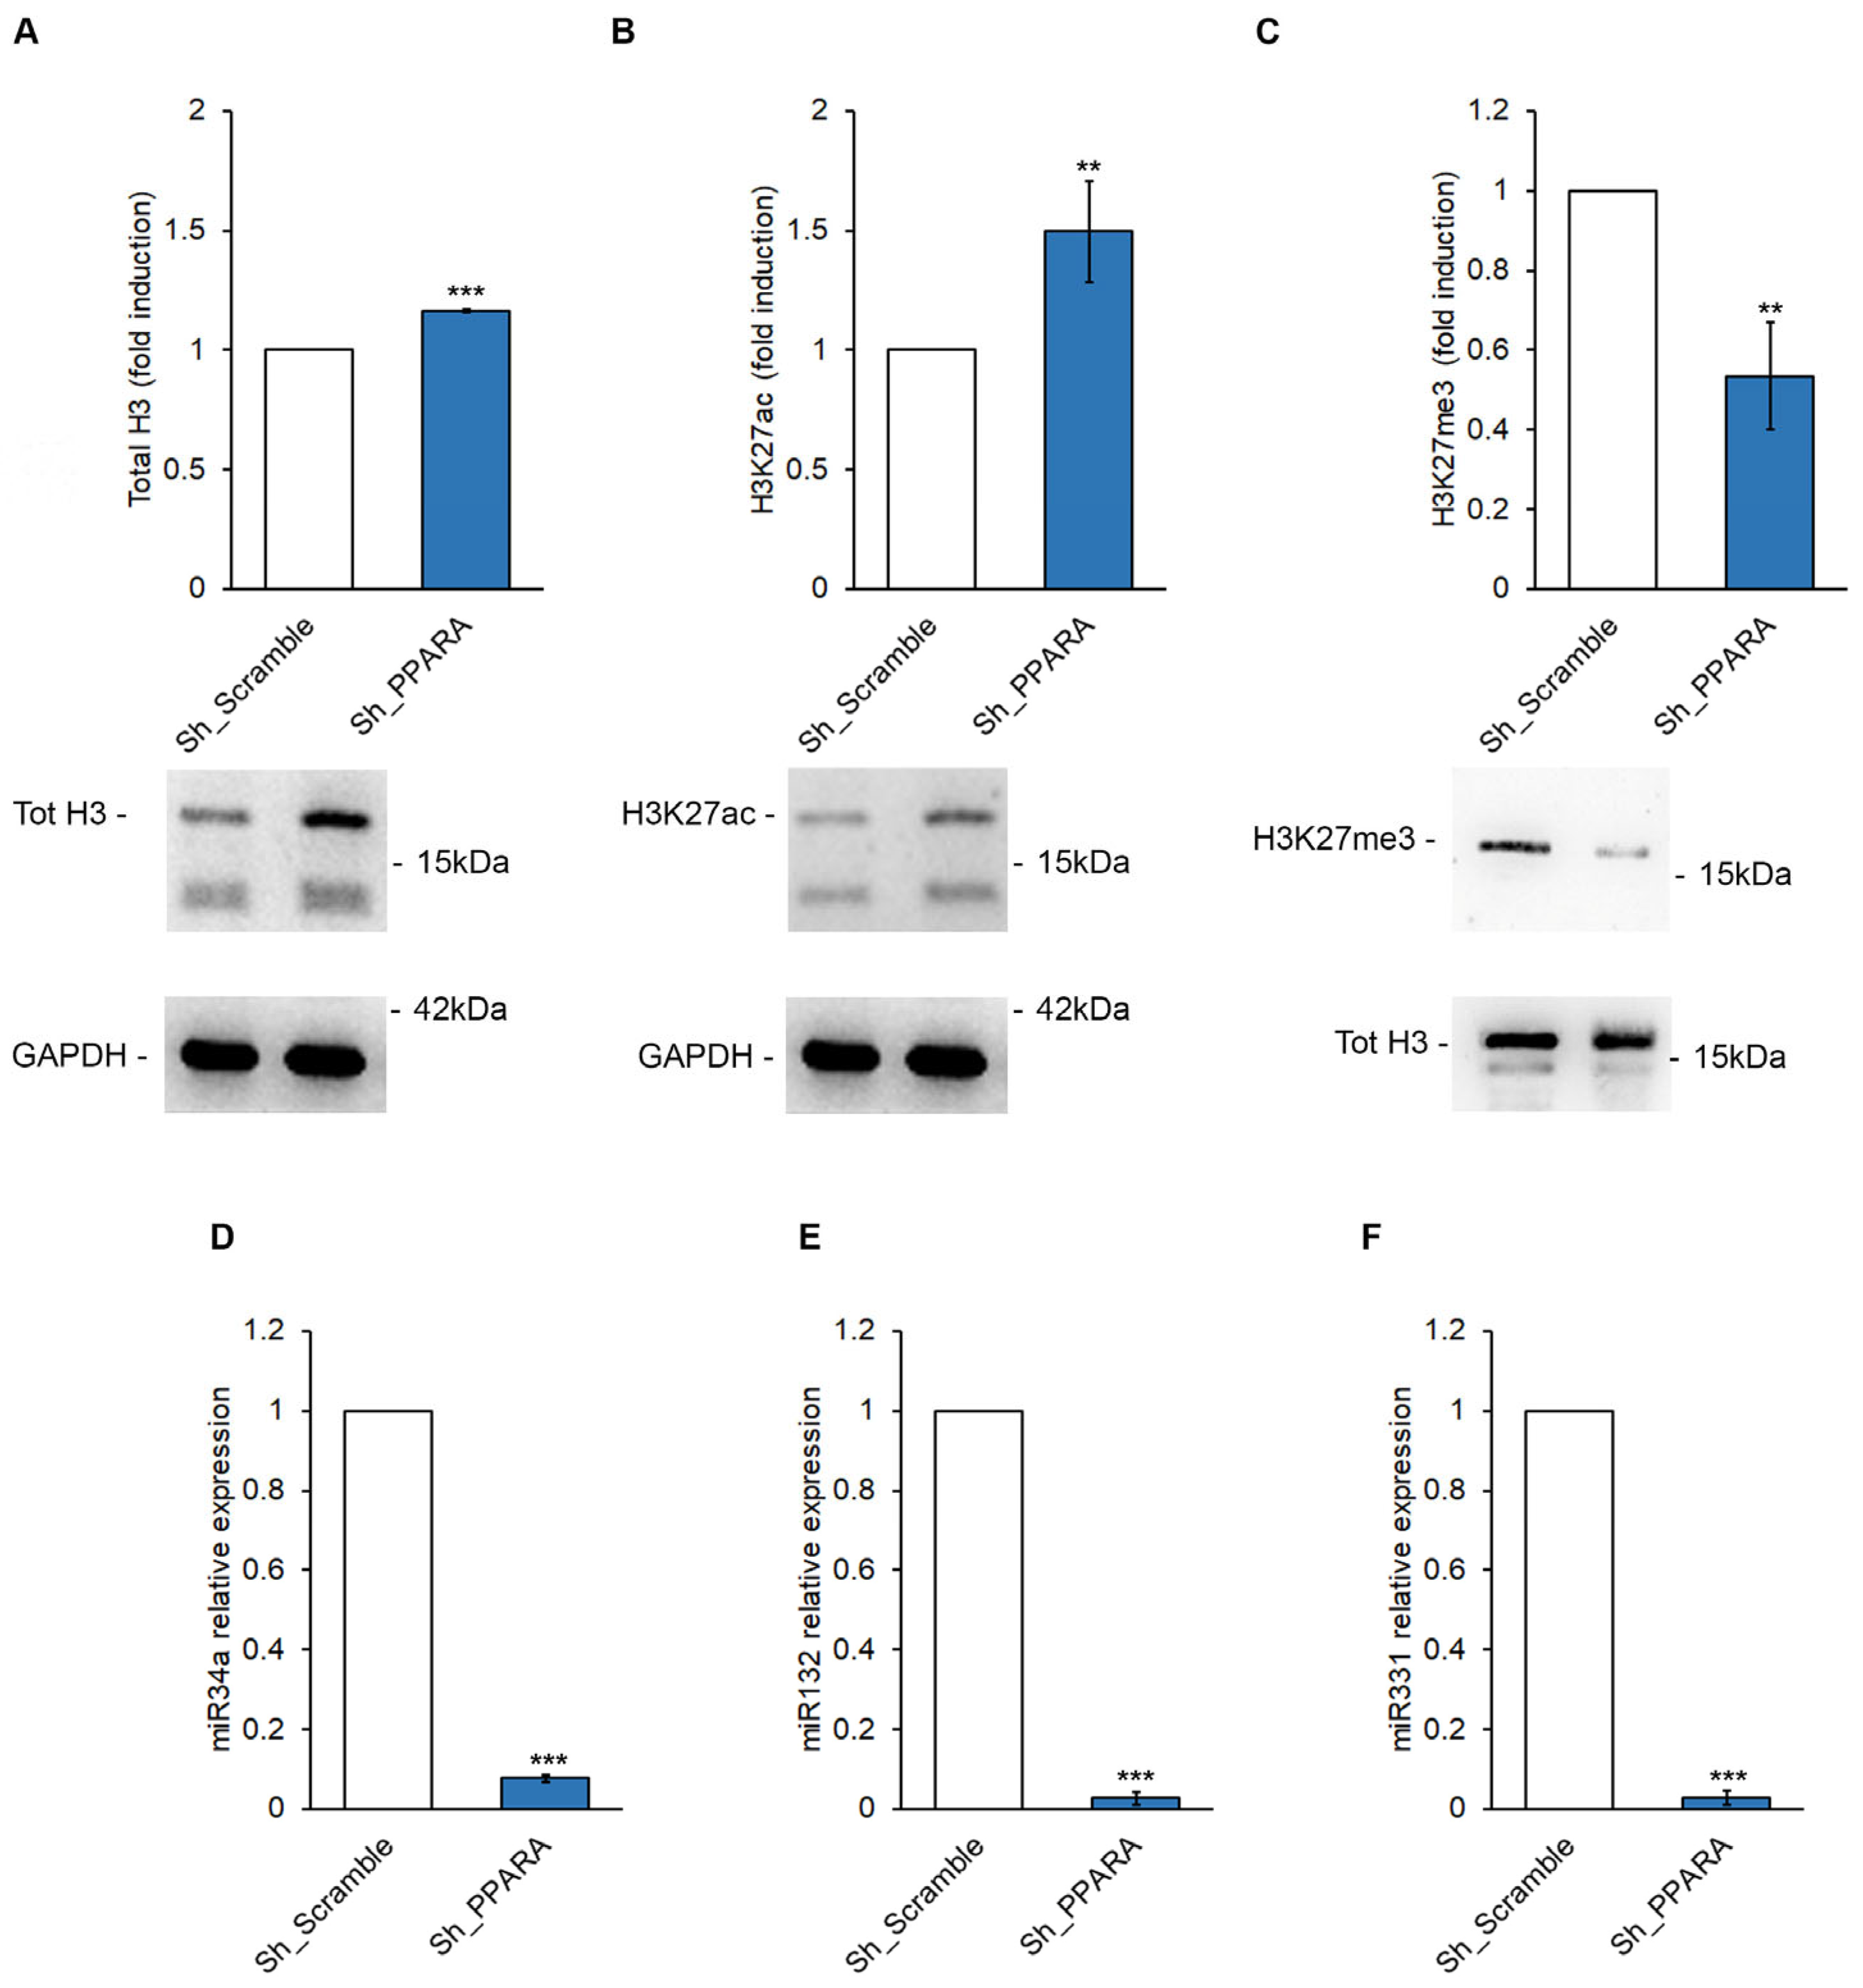
Figure 5.
Rescue effect of Ebs on redox metabolism in PPARA-silenced H9c2 cells. (A) Box plot of mean cell area (n=100) by using Image J. (B and C) Bar graphs of relative mRNA expression of NPPB and FBXO32 mRNA expression level by qRT-PCR. (D) Bar graph of ROS production by measuring the CM-H2DCFDA fluorescence intensity expressed as fold change with respect to Sh_Scramble equal to 1. (E) Quantitative analysis of PPARα protein expression level. GAPDH expression levels were used as loading reference. The data are representative of three independent experiments. *** p < 0.001 *p < 0.05. (F) Representative images of cytoskeletal structure, F-actin labeled with phalloidin. Red: phalloidin; nuclei are counterstained with Hoechst 33342 (blue color), and combined images are shown. Magnification 40×.
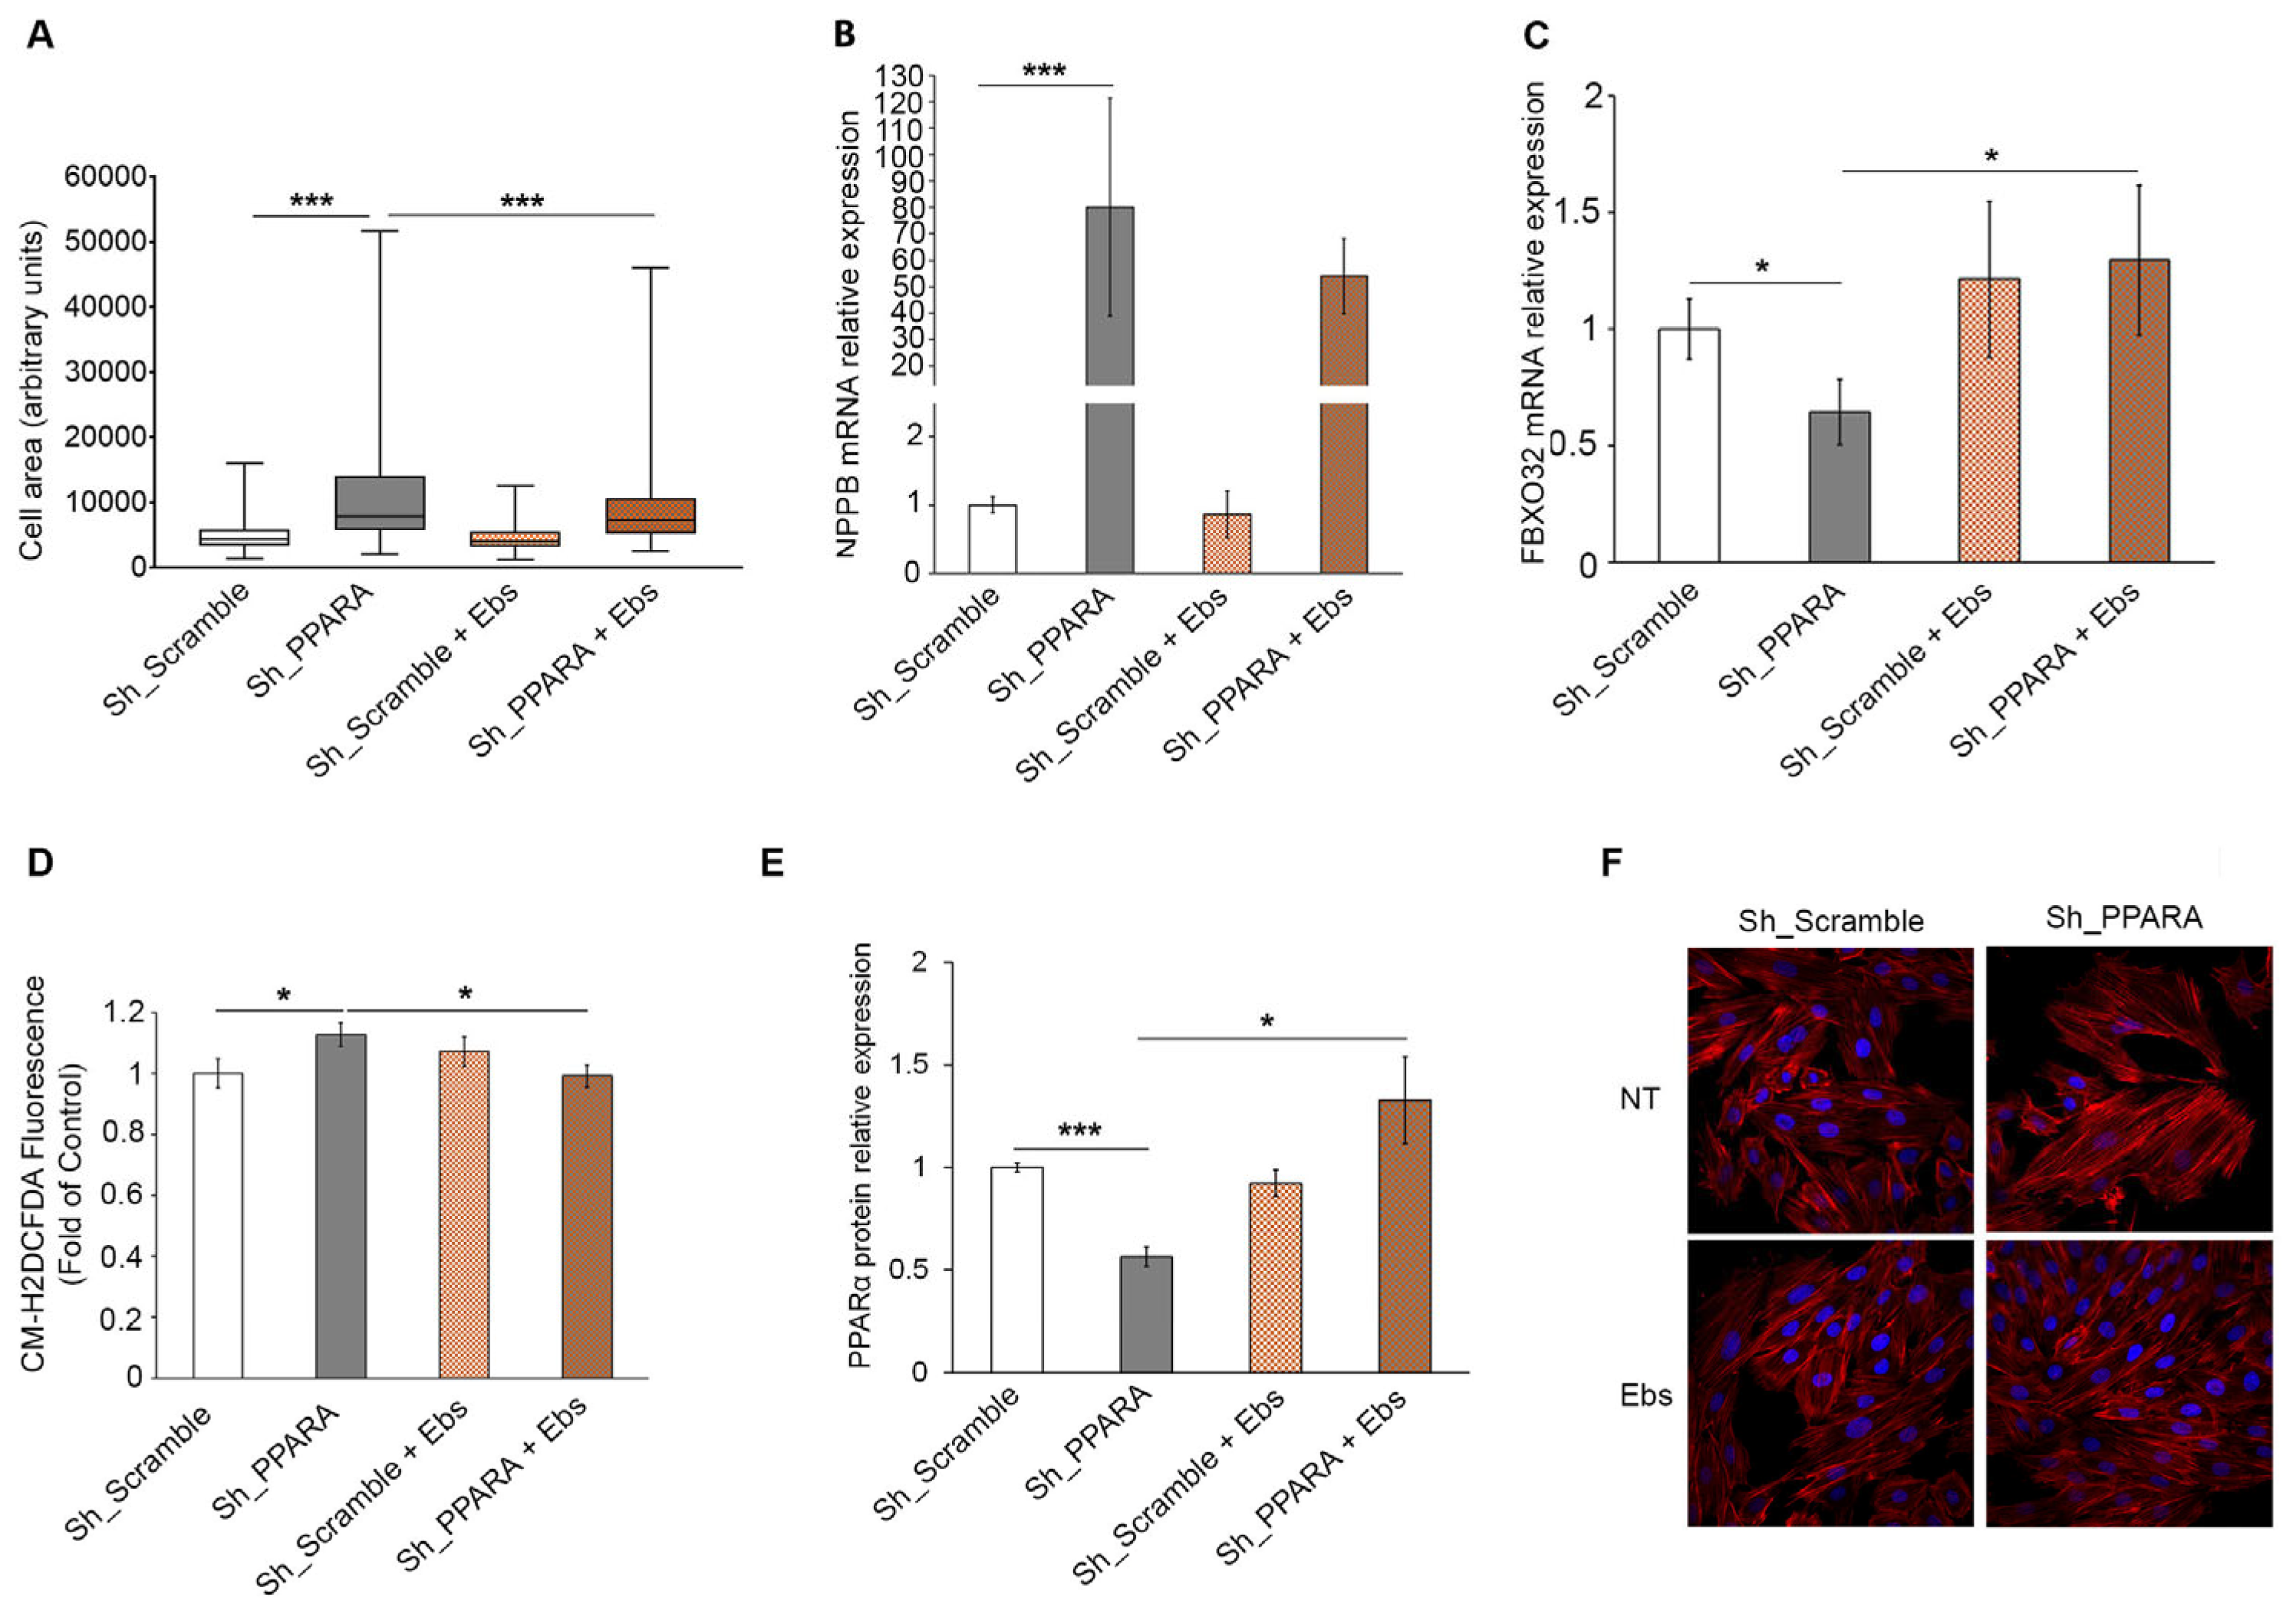
Figure 6.
Rescue effect of Ebs on miRNAs in PPARA-silenced H9c2 cells. Bar graphs of relative miRNAs detection of (A) rno-miR-34a, (B) rno-miR132 and (C) rno-miR331 by qRT-PCR. miRNAs levels are expressed as fold change respect to Sh_PPARA-silenced cells equal to 1. The data are representative of three independent experiments. *** p < 0.001.
Disclaimer/Publisher’s Note: The statements, opinions and data contained in all publications are solely those of the individual author(s) and contributor(s) and not of MDPI and/or the editor(s). MDPI and/or the editor(s) disclaim responsibility for any injury to people or property resulting from any ideas, methods, instructions or products referred to in the content. |
© 2025 by the authors. Licensee MDPI, Basel, Switzerland. This article is an open access article distributed under the terms and conditions of the Creative Commons Attribution (CC BY) license (http://creativecommons.org/licenses/by/4.0/).
Copyright: This open access article is published under a Creative Commons CC BY 4.0 license, which permit the free download, distribution, and reuse, provided that the author and preprint are cited in any reuse.


