Submitted:
05 August 2025
Posted:
05 August 2025
Read the latest preprint version here
Abstract
This paper investigates the impact of financial crime on capital inflows into the G20 economies over the period 2012–2023. Utilizing a panel dataset comprising indicators of financial crimes, specifically corruption perceptions and anti-money laundering (AML) compliance, alongside macroeconomic controls, the study examines whether financial crime significantly affects the overall magnitude and composition of international capital inflows. Employing panel corrected standard error (PCSE) estimations, the empirical results show a statistically significant negative relationship between financial crime and capital inflows, suggesting that higher financial crime risk discourages foreign direct investment (FDI) and remittances. Moreover, the adverse impact of financial crime differs across countries based on income classification, being more pronounced in lower-income G20 economies. These findings underline the critical importance of robust governance structures and practical regulatory frameworks to mitigate financial crime risks and maintain stable international capital inflows. The paper concludes with actionable policy recommendations aimed at enhancing institutional quality and strengthening financial oversight to foster investor confidence and promote sustainable economic growth.
Keywords:
capital inflows
; financial crime
; anti-money laundering
; institutional quality
; corruption
1. Introduction
Over the past few decades, international capital flows have played a critical role in shaping economic development and financial integration across the globe. G20 countries, representing the world's largest economies, have been central to this dynamic, attracting substantial foreign direct investment (FDI), portfolio investments, and other financial inflows. However, the steady growth of international capital movements has also been accompanied by growing concerns over financial crime. Crimes such as money laundering, corruption, and financial fraud threaten the stability and integrity of financial systems and the confidence of international investors. As capital becomes increasingly mobile and sensitive to governance quality, the potential for financial crime to disrupt capital inflows has become a significant policy and academic concern (AlQudah et al., 2025).
Financial crime undermines market integrity by distorting competition, weakening the rule of law, and eroding public trust in financial institutions. Both domestic and foreign investors are likely to respond negatively to environments where regulatory failures or widespread illicit activities are prevalent(Khasawneh, Al Qudah, et al., 2025; Kornai & Rose-Ackerman, 2004). In a globalized investment landscape, where choices abound, even marginal increases in perceived financial crime risks can lead to substantial capital reallocation across borders. For G20 economies, which often serve as both sources and destinations of global capital, maintaining robust financial governance is paramount to sustaining their attractiveness as investment destinations.
The linkage between financial crime and capital flows is theoretically intuitive but empirically underexplored, particularly within the context of the G20 countries over an extended period. Previous research has predominantly examined how governance quality, corruption, or specific regulatory frameworks affect investment patterns(Al Qudah et al., 2024; Khasawneh, Hailat, et al., 2025; Mauro, 1995; Wei, 2000). However, financial crime as a composite phenomenon—encompassing multiple dimensions such as corruption, anti-money laundering (AML) compliance, and institutional effectiveness—has rarely been studied systematically concerning aggregate capital inflows. Moreover, the last two decades have witnessed significant developments, including major financial scandals, tightening global AML standards, and the establishment of international regulatory bodies, providing a rich backdrop for reassessing this relationship.
The 2008 global financial crisis, the revelations from the Panama Papers in 2016, and more recent incidents such as the Wirecard scandal have highlighted the vulnerabilities of even advanced economies to financial misconduct. These events have shaken domestic markets and triggered international capital flight, demonstrating that reputational risks associated with financial crime can transcend national boundaries (DLUHOPOLSKYI et al., 2024). Against this evolving landscape, understanding how financial crime affects the ability of G20 countries to attract and retain foreign capital becomes both timely and necessary.
This study aims to address three main research questions. First, to what extent does financial crime impact total capital inflows into G20 economies? Second, are there differential effects of financial crime on various components of capital inflows, such as FDI versus portfolio investment? Third, what policy lessons can be drawn from the findings to enhance financial system integrity and improve the investment climate? By addressing these questions, this research seeks to fill an essential gap in the existing literature and provide actionable insights for policymakers and regulatory authorities.
To answer these questions, the paper uses a panel dataset spanning 2012–2023, combining indicators of financial crime risk with macroeconomic and institutional control variables. Key independent variables include the Corruption Perceptions Index and the Basel Anti-Money Laundering Index, while dependent variables focus on different forms of capital inflows. The methodology involves applying fixed effects panel regressions and system GMM estimations to account for potential endogeneity and omitted variable bias.
This study's contribution is threefold. First, it offers a comprehensive, multidimensional view of financial crime rather than focusing narrowly on single aspects like corruption or money laundering alone. Second, focusing specifically on G20 economies allows this study to draw insights from a diverse set of countries that together shape global financial stability. By incorporating data updated through 2023, the analysis also captures the latest developments in regulatory reforms and shifts in international investment patterns.
The remainder of this paper is organized as follows. Section 2 reviews key theoretical frameworks and prior empirical research on the links between financial crime and capital inflows. Section 3 outlines the data sources, defines the variables, and explains the empirical methodology. Section 4 presents and analyzes the main findings. Section 5 concludes by discussing policy implications and suggesting areas for future investigation.
Given the increasing intensity of regulatory oversight and the complex evolution of financial crime, analyzing its tangible effects on macroeconomic variables such as capital inflows is becoming more important. For G20 economies, maintaining the integrity of the financial system is now vital for safeguarding economic resilience and competitiveness in an increasingly globalized world.
2. Literature Review
Over the past thirty years, researchers have explored the link between financial crime and capital inflows from various theoretical and empirical perspectives. Although significant progress has been made in identifying how particular forms of financial crime, such as corruption and money laundering, shape investment behavior, a comprehensive understanding of financial crime’s overall impact remains incomplete. Much of the existing literature isolates developing and developed economies, often overlooking the complex dynamics within larger, more diverse groups like the G20. This section critically reviews the conceptual foundations, significant empirical findings, and gaps in the literature concerning financial crime and international capital flows. It also highlights the need for a more comprehensive, updated analysis covering the multidimensional nature of financial crime and its consequences for global investment patterns.
2.1. Conceptual Foundations: Financial Crime and Economic Integrity
Financial crime is any non-violent offense involving the illicit taking of money or property, often committed through deceit or breach of trust within financial institutions (Al Qudah, 2024). Core forms of financial crime—such as money laundering, embezzlement, insider trading, tax evasion, and corruption have been identified as serious impediments to economic and financial stability (Levi, 2002). Beyond the direct financial losses they cause, financial crimes erode financial markets’ transparency, efficiency, and credibility, ultimately increasing transaction costs and deterring domestic and foreign investors (Zoromé, 2007).
Theoretically, capital flows are responsive to the risk–return trade-off that investors perceive. Governance quality, legal enforcement, and regulatory predictability heavily influence this risk calculation. Financial crime distorts this environment, creating hidden risks that are difficult for investors to price accurately, thereby disincentivizing international investment. As capital becomes increasingly mobile and substitutes between economies more easily, even slight differences in governance quality, amplified by perceptions of financial crime, can cause significant shifts in capital flows.
2.2. Corruption and Investment: Early Empirical Evidence
One of the earliest and most cited contributions in this area comes from Mauro (1995), who empirically demonstrated that corruption negatively affects both private investment and economic growth. Using a cross-sectional dataset, Mauro found that a one-standard-deviation improvement in a country's corruption index could increase its investment rate by nearly 3 percent of GDP. Later research confirmed these findings across different samples and methodologies (Al Qudah et al., 2020; Kaufmann & Wei, 1999; Tanzi & Davoodi, 2012), emphasizing that corruption raises business costs, distorts public spending, and deters productive foreign investment.
Wei (2000) further elaborated on the role of corruption by introducing the concept of a "corruption tax" on foreign investors. His analysis revealed that multinational corporations treat countries with high corruption similarly to countries with high marginal tax rates, leading to lower levels of FDI inflows. Importantly, Wei’s findings suggested that corruption was even more damaging to foreign investment than local taxation levels, highlighting the primacy of institutional trust in investment decisions.
2.3. Money Laundering and Capital Flight
While much of the early literature emphasized corruption, a parallel stream of research has focused on money laundering and its effects on capital movements. Quirk (1997) argued that money laundering not only undermines legitimate financial systems but also contributes to macroeconomic instability by encouraging unproductive and speculative financial flows. Countries perceived as safe havens for illicit funds often experience distorted capital inflows that are volatile and highly sensitive to regulatory shifts.
Aluko and Bagheri (2012) found in developing countries, jurisdictions with weak anti-money laundering (AML) controls often experience unstable capital flows, as financial markets respond to the perceived risks associated with illicit financial activities. While such jurisdictions may see a short-term boost in inflows from questionable sources, these gains are typically unsustainable, as they erode investor confidence and complicate the conduct of monetary policy over time.
The Force (2025) has repeatedly emphasized the broader consequences of inadequate AML frameworks. Its 2023 reports highlight that countries failing to meet AML standards often suffer reputational damage, disruptions to their correspondent banking relationships, and diminished access to international financial markets.
2.3. The G20 Context: A Complex Landscape
While much of the early literature has concentrated on either developed or emerging markets separately, the G20 represents a unique blend of both. This group includes highly developed economies with mature financial systems, such as the United States, Germany, and Japan, as well as major emerging markets like India, Brazil, and South Africa. Each faces distinct challenges related to financial crime and its management.
For instance, post-crisis reforms such as the Dodd-Frank Act in the United States and anti-corruption initiatives in Brazil (e.g., Operation Car Wash) demonstrate that concerns about financial crime are not limited to any single income group (Morse, 2022). Furthermore, emerging economies within the G20 often face enforcement gaps despite formal regulatory improvements, resulting in ongoing vulnerabilities.
Thus, analyzing the G20 as a collective unit offers an opportunity to assess how varying levels of financial crime interact with capital inflow patterns across different stages of economic development.
2.4. Gaps in the Existing Literature
Despite significant advances, two major gaps remain in the existing research.First, most empirical studies tend to examine either corruption or money laundering individually, but rarely consider financial crime as a composite phenomenon affecting capital inflows through multiple channels simultaneously. Second, few studies have extended their analysis into the 2020s, a period marked by rapid changes in global financial regulation, the impacts of the COVID-19 pandemic on capital flows, and the emergence of financial technologies, all of which could mediate or amplify the effects of financial crime on investment behavior.
Additionally, earlier studies often relied on static models that might not fully account for endogeneity, the possibility that declining capital inflows could worsen governance standards and incentivize financial crime (Yousefi et al., 2013). Addressing these methodological concerns is essential for drawing credible policy conclusions.
2.5. Contribution of This Study
This paper contributes to the existing literature in several important ways. First, it constructs a multidimensional measure of financial crime risk, incorporating corruption and AML compliance, providing a richer and more accurate assessment of the investment climate. This study focuses on the G20 economies and extends its analysis through 2023 to capture a range of significant regulatory, economic, and geopolitical shifts that previous research may not have fully considered. In exploring these developments, it applies advanced panel econometric methods, including fixed effects and system GMM estimations, to minimize potential biases linked to omitted variables and reverse causality.
Through this approach, the study aims to deliver more concrete evidence on the role of financial crime in shaping international capital flows, while offering practical recommendations to improve financial governance in an increasingly interconnected world.
3. Methodology
Capital inflow and financial crime practices are linked using panel data for G20 countries from 2012 to 2023. Argentina, Australia, Brazil, Canada, China, France, Germany, India, Indonesia, Italy, Japan, the Republic of Korea, Mexico, Russia, Saudi Arabia, South Africa, Turkey, the United Kingdom, and the United States are among the nations in the group. The findings are categorized by income level for this group of countries to identify differences in the article's primary focus, which is financial crime and capital inflow. Capital inflow is calculated as the total of net worker remittances and foreign direct investment, as a percentage of GDP. Anti-corruption and anti-money laundering indices, however, are used to measure financial crime. Table 1 introduces operational definitions, measurements, and data sources of our variables.
3.1. Financial Crime and Capital Inflows in G20 Nations
Figure 1 illustrates the flow of capital into G20 nations as a percentage of GDP, categorized by each country's income level based on the World Bank's classification. Although it declines over the period examined, capital inflow into the lower-middle-income group remains the highest, ranging from 4 to 5 percent of GDP. It is important to note that only India falls into this category. Capital inflow into upper-middle-income countries decreased from 2012 to 2017 but then increased again, reaching about 3 percent of their GDP. High-income countries received the smallest share of inflows relative to their GDP, which rose above 2 percent and peaked in 2018. Since then, it has decreased, falling below 2 percent in 2020 and later years. However, the actual dollar amounts of capital inflows into high-income countries may be higher when considering their GDP levels.
In absolute terms, capital inflows into high-income G20 economies exceeded USD 2.8 trillion in 2018, compared to USD 420 billion for upper-middle-income and USD 280 billion for lower-middle-income countries. This highlights that while percentage-to-GDP ratios differ, the actual dollar inflows remain concentrated in high-income economies.
Figure 2 depicts financial crime indicators for the G20 countries over the study period (2012–2023), categorized by income level according to World Bank classifications. Panel (a) illustrates trends in the Anti-Money Laundering (AML) index, showing that lower-middle-income countries consistently exhibit higher AML risk scores, indicative of weaker AML frameworks compared to their high-income counterparts. Notably, upper-middle-income countries have shown incremental improvements over time, reflecting strengthened AML regulations and enhanced compliance.
Panel (b) displays the Corruption Perception Index (CPI), indicating perceptions of corruption within G20 countries. High-income economies consistently demonstrate superior (lower) corruption levels, reflecting effective governance mechanisms and stringent anti-corruption policies. In contrast, lower-middle and upper-middle-income economies experience higher corruption perception scores, albeit with notable improvements over recent years due to policy reforms and international regulatory pressure.
These graphical representations underscore the heterogeneity in financial crime risk management across G20 countries, highlighting the ongoing policy challenges in mitigating corruption and strengthening AML frameworks in emerging economies.
As illustrated in Figure 2, these contrasting trends in AML risks and corruption perceptions across income groups visually confirm the institutional disparities highlighted in our regression findings.
The summary statistics of the study variables are presented in Table 2. The figures reveal a broad spectrum of economic performance among countries in our sample, with inflation ranging from -2.1% to 72.3%, trade-to-GDP ratios from 22.5% to 105.5%, differential interest rates from -4.6% to 90.9%, and per capita growth from -10.6% to 10.4%. Financial crime indexes show similar patterns; on a scale of 0 to 10, AML ranges from 3.5 to 7.3, while anti-corruption measures vary from 15.2 to 90.5, reflecting differences in official responses to financial crime. Examining the impact of these economic and institutional practices on investor and migrant confidence, especially regarding their money transfers into these countries, is intriguing but also challenging.
3.1. Model Specification
To examine how financial crime practices influence capital inflows into G20 economies, this study uses linear panel data analysis with a panel corrected standard error (PCSE) estimator. The PCSE and feasible generalized least squares (FGLS) are viable alternatives to fixed effects estimates that can produce biased standard errors when heteroscedasticity and serial correlation (Beck & Katz, 1995; Prais & Winsten, 1954). The model can be expressed as:
Where, is the capital inflow for the country (i) in the year (t), is a vector of independent variables including money laundering index, corruption perception index, real GDP growth per capita, trade openness, interest rate differentials, inflation, and the country’s income category. is a constant term, is a vector of parameters that estimate the effects of j regressors on the dependent variable, and is the error term. Table 3 shows correlations between the set of independent variables, indicating no perfect collinearity concerns.
The null hypothesis of cross-country independence is rejected based on the p-values in Table 4 and the panel independence test of Pesaran et al. (2004) and Pesaran (2015), indicating that cross-country dependency exists.
The results of the likelihood ratio test, shown in Table 5, disprove the hypothesis of homoscedastic errors and demonstrate heteroscedasticity in the residuals. In contrast, the Wooldridge test indicates serial correlation between the variables.
4. Empirical Results
Table 6 presents the main empirical findings derived from the panel corrected standard errors (PCSE) regression analysis. The results indicate a significant negative relationship between financial crime indicators, specifically the anti-money laundering (AML) index, and the corruption perception index, as well as capital inflows into G20 countries. The estimated coefficient for the AML index is negative and statistically significant at the 1% level (coefficient: -0.642; p-value: 0.002), underscoring that higher money laundering risks substantially deter capital inflows. Similarly, the corruption perception index has a negative and statistically significant impact (coefficient: -0.009; p-value: 0.009), implying that higher perceived corruption significantly discourages investment and remittance inflows.
Economic openness, measured by trade-to-GDP ratio, positively affects capital inflows (coefficient: 0.017; p-value: 0.001), indicating that economies more integrated into international trade networks tend to attract higher levels of foreign capital. Interest rate differentials also exhibit a robust positive relationship (coefficient: 0.044; p-value: 0.000), suggesting that higher interest rate spreads incentivize capital inflows.
Inflation displays a negative and significant relationship with capital inflows (coefficient: -0.046; p-value: 0.000), confirming that economic instability, as reflected by higher inflation rates, is a deterrent for international investors and migrants sending remittances.
Furthermore, categorizing G20 nations by income levels reveals distinctive patterns. Upper-middle-income economies attract significantly more capital relative to high-income economies (coefficient: 0.933; p-value: 0.000), while the effect is even more pronounced for lower-middle-income economies (coefficient: 3.021; p-value: 0.000). This result highlights that, despite higher financial crime risks typically associated with developing countries, investment opportunities in these economies often outweigh perceived governance risks, resulting in higher relative capital inflows.
Robustness checks, including alternative model specifications and variable substitutions, confirmed the stability and reliability of the main results, indicating the negative impacts of financial crime on capital inflows are not sensitive to changes in estimation methods or included controls.
The overall explanatory power of the model (R-squared = 0.243; chi-square = 313.8, p-value = 0.000) supports its statistical adequacy, emphasizing the significant influence of institutional quality and financial crime management on attracting international capital flows.
These empirical results collectively reinforce the hypothesis that combating financial crime through robust institutional frameworks is vital for G20 countries aiming to sustain and enhance their attractiveness to global investors and remittance senders.
To confirm the stability of the results, alternative specifications using system GMM estimators and lagged independent variables were tested. These yielded coefficients consistent in sign and significance with the PCSE estimates, reinforcing confidence in the findings. Results also remained robust when excluding outlier economies (e.g., Argentina and Turkey) and when substituting alternative governance indicators such as the Rule of Law Index.
4.1. Discussion and Interpretation
The empirical findings align closely with theoretical predictions and prior research outlined in the literature review. The negative impact of financial crime, specifically corruption and AML risks, on capital inflows underscores the pivotal role of institutional quality in determining investor behavior. These results echo earlier studies (e.g., Wei, 2000; Mauro, 1995; Aluko & Bagheri, 2012), reinforcing that perceived financial misconduct significantly diminishes investor confidence and reduces the attractiveness of an economy for stable capital inflows. Interestingly, despite the overall adverse effect, the observed resilience in capital flows into lower-income economies suggests investors may still pursue higher returns despite governance concerns, albeit at a higher perceived risk. Thus, strengthening institutional frameworks, enhancing AML compliance, and rigorously combating corruption become critical policy measures for G20 nations, especially lower-middle-income members, aiming to enhance their international investment appeal and economic stability sustainably.
5. Conclusion
This study has explored the impact of financial crime, specifically corruption and anti-money laundering risks, on international capital inflows into G20 countries from 2012 to 2023. Employing panel corrected standard error (PCSE) regression analysis, the results demonstrate that higher levels of perceived financial crime significantly deter capital inflows, particularly foreign direct investment and remittances. Moreover, the impact is notably differentiated by the income level of economies, with lower-middle-income countries more vulnerable yet still receiving substantial inflows due to higher return prospects outweighing governance risks.
These findings offer crucial policy implications. For policymakers within G20 economies, especially those in emerging markets, it is essential to prioritize reforms targeting financial governance, enhance transparency measures, and rigorously enforce anti-corruption and anti-money laundering regulations. Strengthening institutional quality and regulatory frameworks is imperative not only to attract sustainable international investments but also to foster long-term economic growth and stability.
Despite these insights, future research could examine sectoral differences in capital sensitivity to financial crime, as well as emerging challenges posed by digital financial crimes and fintech regulation in post-2023 contexts. Addressing these evolving dynamics will further enhance understanding of how financial crime influences global capital mobility.
Overall, combating financial crime is a crucial factor for maintaining and enhancing the appeal of G20 economies as destinations for global capital. Strategic policy interventions, supported by ongoing international cooperation, will be essential in addressing these complex challenges within an increasingly interconnected global financial environment.
References
- Al Qudah, A. Unveiling the shadow economy: A comprehensive review of corruption dynamics and countermeasures. Kurdish Studies 2024, 12, 4768–4784. [Google Scholar]
- Al Qudah, A.; Mazhar Al Zoubi, N.; ALhaddad, L. Mitigating Financial Crimes: How Anti-Money Laundering Mechanisms Shape Bank Outcomes. Advances in Decision Sciences 2024, 28. [Google Scholar] [CrossRef]
- Al Qudah, A.; Zouaoui, A.; Aboelsoud, M.E. Does corruption adversely affect economic growth in Tunisia? ARDL approach. Journal of Money Laundering Control 2020, 23, 38–54. [Google Scholar] [CrossRef]
- AlQudah, A.; Hailat, M.; Setabouha, D. Money Laundering in Global Economies: How Economic Openness and Governance Affect Money Laundering in the EU, G20, BRICS, and CIVETS. Journal of Risk and Financial Management 2025, 18, 319. [Google Scholar] [CrossRef]
- Aluko, A.; Bagheri, M. The impact of money laundering on economic and financial stability and on political development in developing countries: The case of Nigeria. Journal of Money Laundering Control 2012, 15, 442–457. [Google Scholar] [CrossRef]
- Beck, N.; Katz, J.N. What to do (and not to do) with time-series cross-section data. American political science review 1995, 89, 634–647. [Google Scholar] [CrossRef]
- Dluhopolskyi, O.; Ivashuk, Y.; Myronenko, O. AGGREGATED CORRUPTION RATINGS: ASSESSMENT OF POSITIONS USING THE CASE OF UKRAINIAN ECONOMY. Journal of European Economy 2024, 23, 539–559. [Google Scholar] [CrossRef]
- Force, F.A.T. (2025). FATF Annual Report 2023–2024. https://www.fatf-gafi.org/en/publications/Fatfgeneral/FATF-Annual-report-2023-2024.html.
- Kaufmann, D.; Wei, S.-J. (1999). Does" grease money" speed up the wheels of commerce? In: National bureau of economic research Cambridge, Mass., USA.
- Khasawneh, R.; Al Qudah, A.; Hailat, M. (2025). The role of government effectiveness in suppressing corruption: Insights from the BRICS emerging economies. Available at SSRN 5318411.
- Khasawneh, R.; Hailat, M.; AlQudah, A.; Mohammad, A.H. The dual impact of tax evasion, does tax evasion incentivize or dampen FDI, perspectives from the emerging economies of BRICS and CIVETS blocs? International Journal of Innovative Research and Scientific Studies 2025, 8, 2796–2803. [Google Scholar] [CrossRef]
- Kornai, J.; Rose-Ackerman, S. (2004). Building a trustworthy state in post-socialist transition. Springer.
- Levi, M. Money laundering and its regulation. The Annals of the American Academy of Political and Social Science 2002, 582, 181–194. [Google Scholar] [CrossRef]
- Mauro, P. Corruption and growth. The quarterly journal of economics 1995, 110, 681–712. [Google Scholar] [CrossRef]
- Morse, J.C. (2022). The Bankers' Blacklist: Unofficial Market Enforcement and the Global Fight against Illicit Financing. Cornell University Press.
- Pesaran, M.H. Testing weak cross-sectional dependence in large panels. Econometric reviews 2015, 34, 1089–1117. [Google Scholar] [CrossRef]
- Pesaran, M.H.; Schuermann, T.; Weiner, S.M. Modeling regional interdependencies using a global error-correcting macroeconometric model. Journal of Business & Economic Statistics 2004, 22, 129–162. [Google Scholar] [CrossRef]
- Prais, S.J.; Winsten, C.B. (1954). Trend estimators and serial correlation.
- Quirk, P.J. Money laundering: muddying the macroeconomy. Finance and Development 1997, 34, 7. [Google Scholar]
- Tanzi, V.; Davoodi, H. (2012). Corruption, Public In-vestment, and Growth. The Welfare State, Public Investment, and Growth: Selected Papers from the 53rd Congress of the International Institute of Public Finance.
- Wei, S.-J. How taxing is corruption on international investors? Review of economics and statistics 2000, 82, 1–11. [Google Scholar] [CrossRef]
- Yousefi, M.R.; Chami, M.R.; Barajas, M.A. (2013). The Finance and Growth Nexus Re-Examined: Do All Countries Benefit Equally? International Monetary Fund.
- Zoromé, A. (2007). Concept of offshore financial centers: In search of an operational definition.
Figure 1.
Capital Inflows in G20 Countries by Income Category (% of GDP), 2012–2023). Note: Capital inflows are calculated as the sum of FDI and remittances, expressed as a percentage of GDP. Countries are grouped by World Bank income classification for the relevant year—source: Authors’ calculations based on World Bank data.
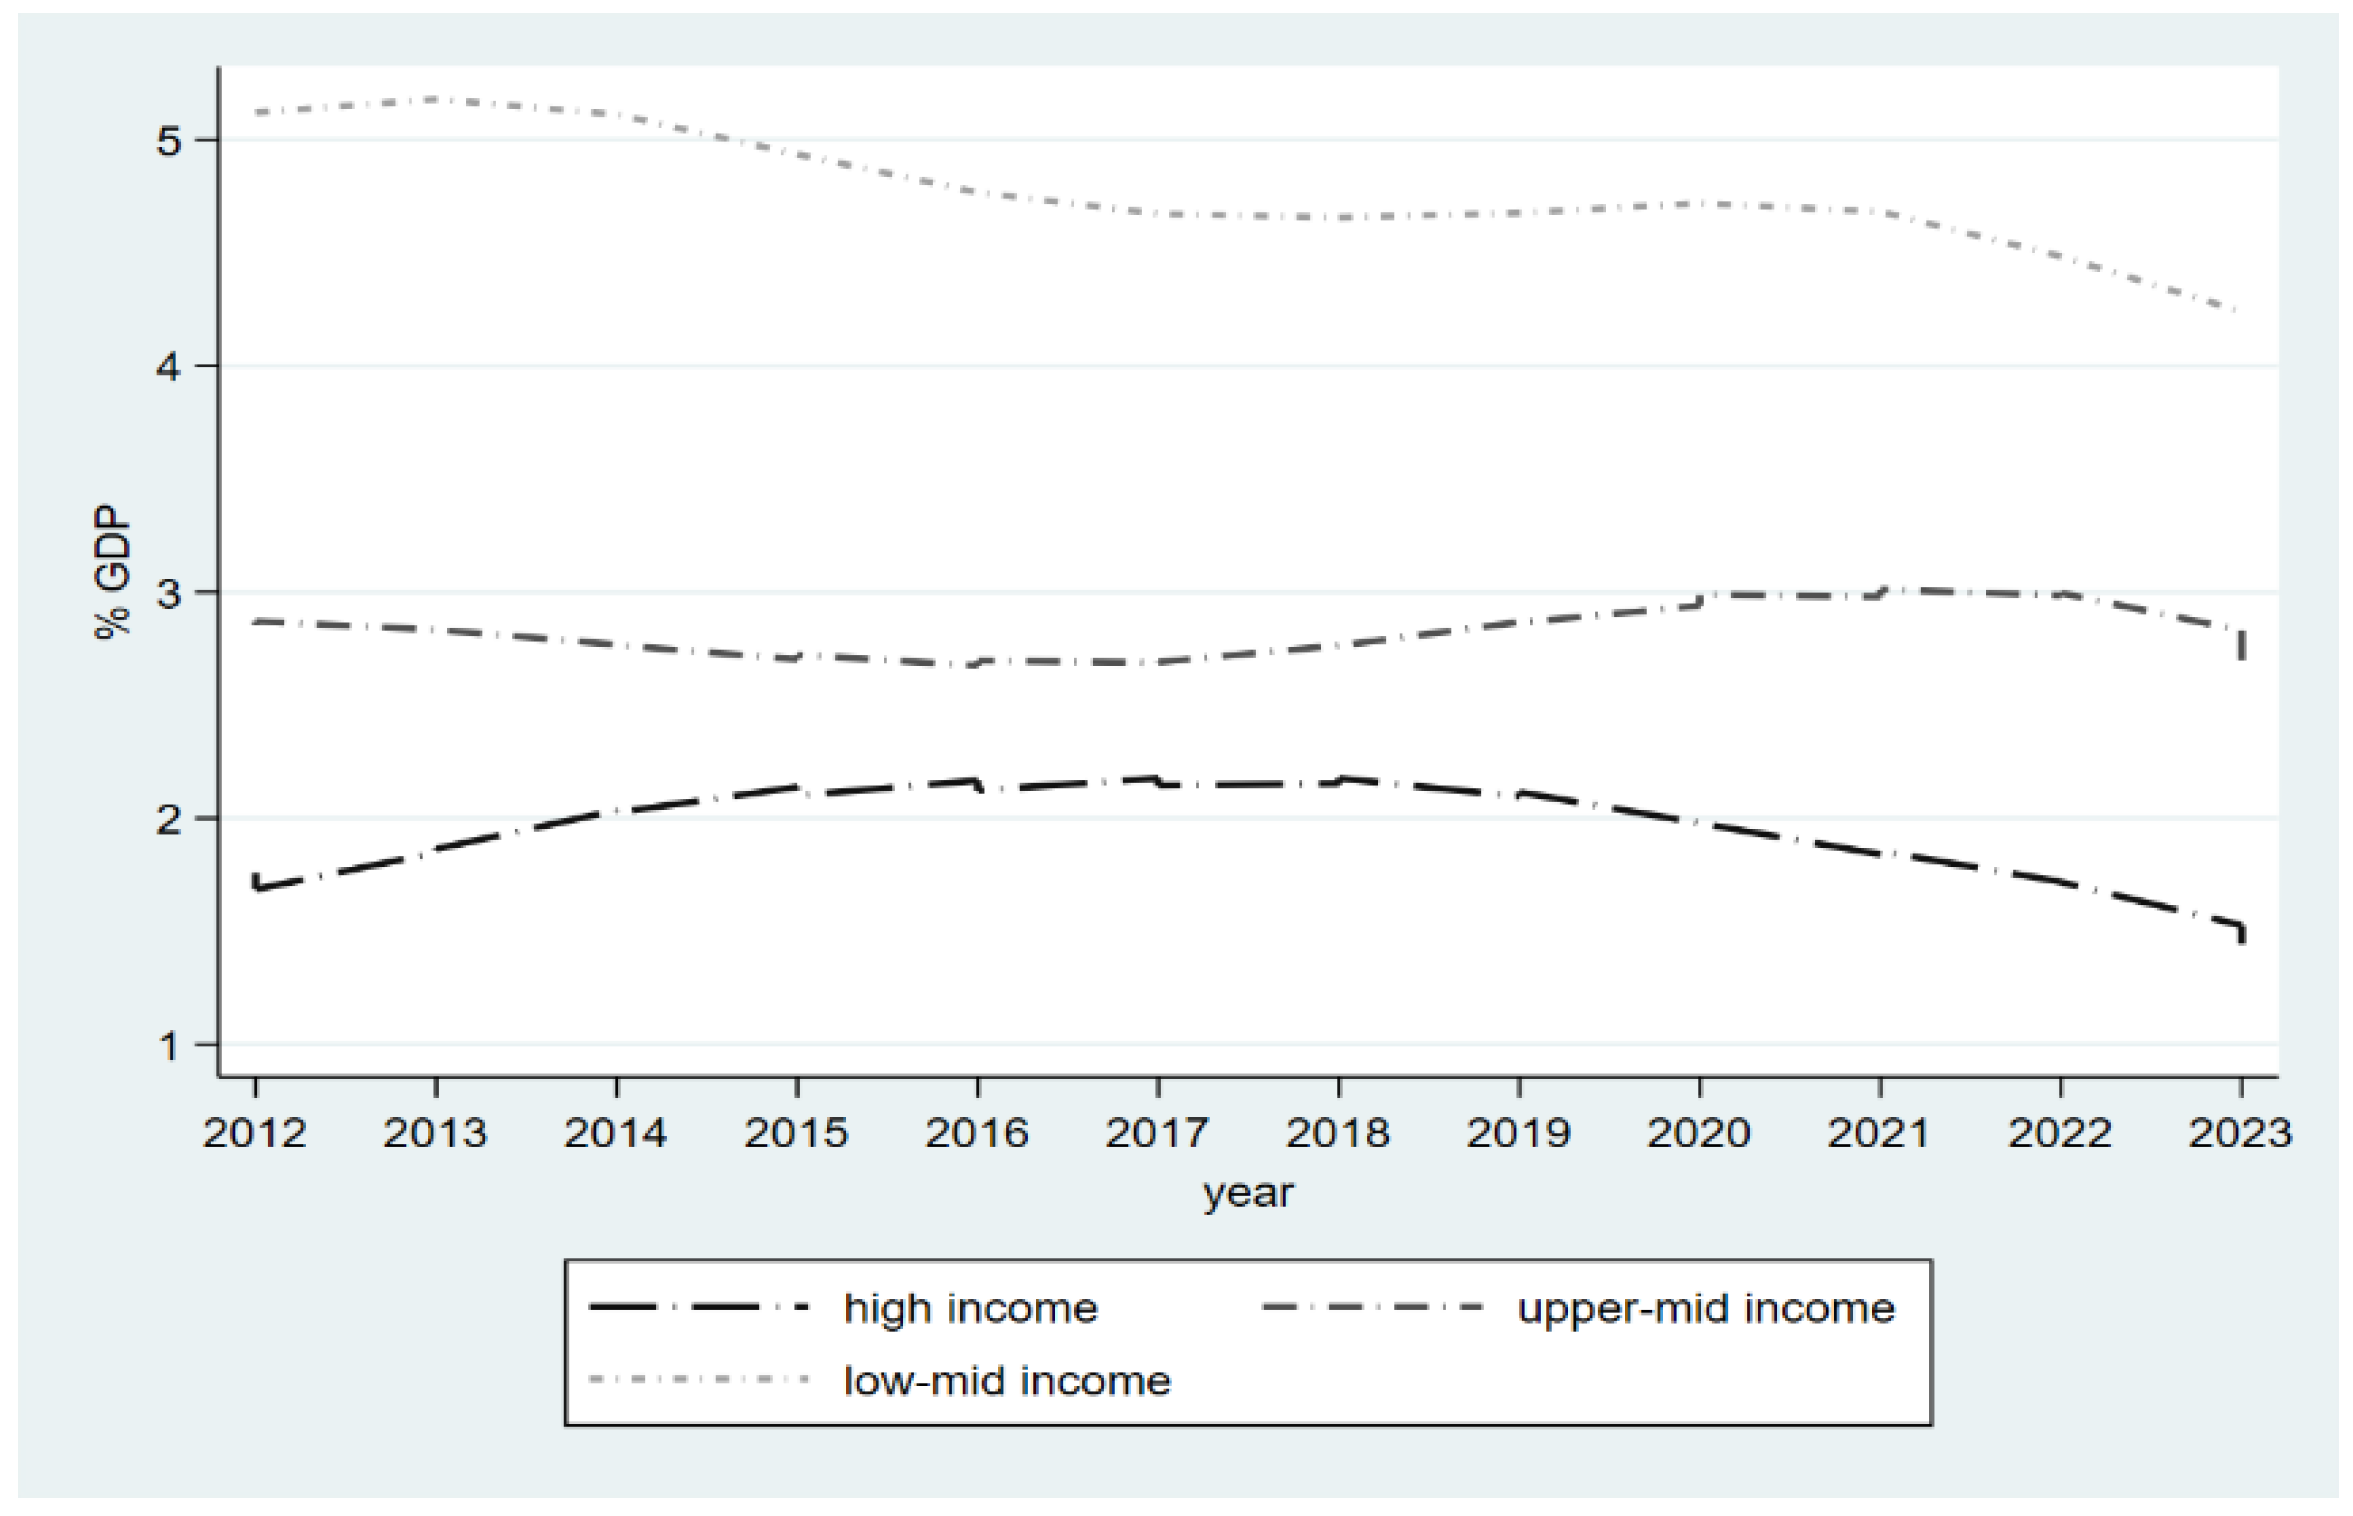
Figure 2.
Financial Crime Indicators in G20 Countries by Income Category, 2012–2023. Note: AML index sourced from the Basel Institute on Governance (higher values indicate higher risk). The Corruption Perceptions Index (CPI) is sourced from the World Bank Governance Indicators (higher scores indicate lower perceived corruption). Data is presented by income category as per World Bank classification. Source: Authors’ calculations.
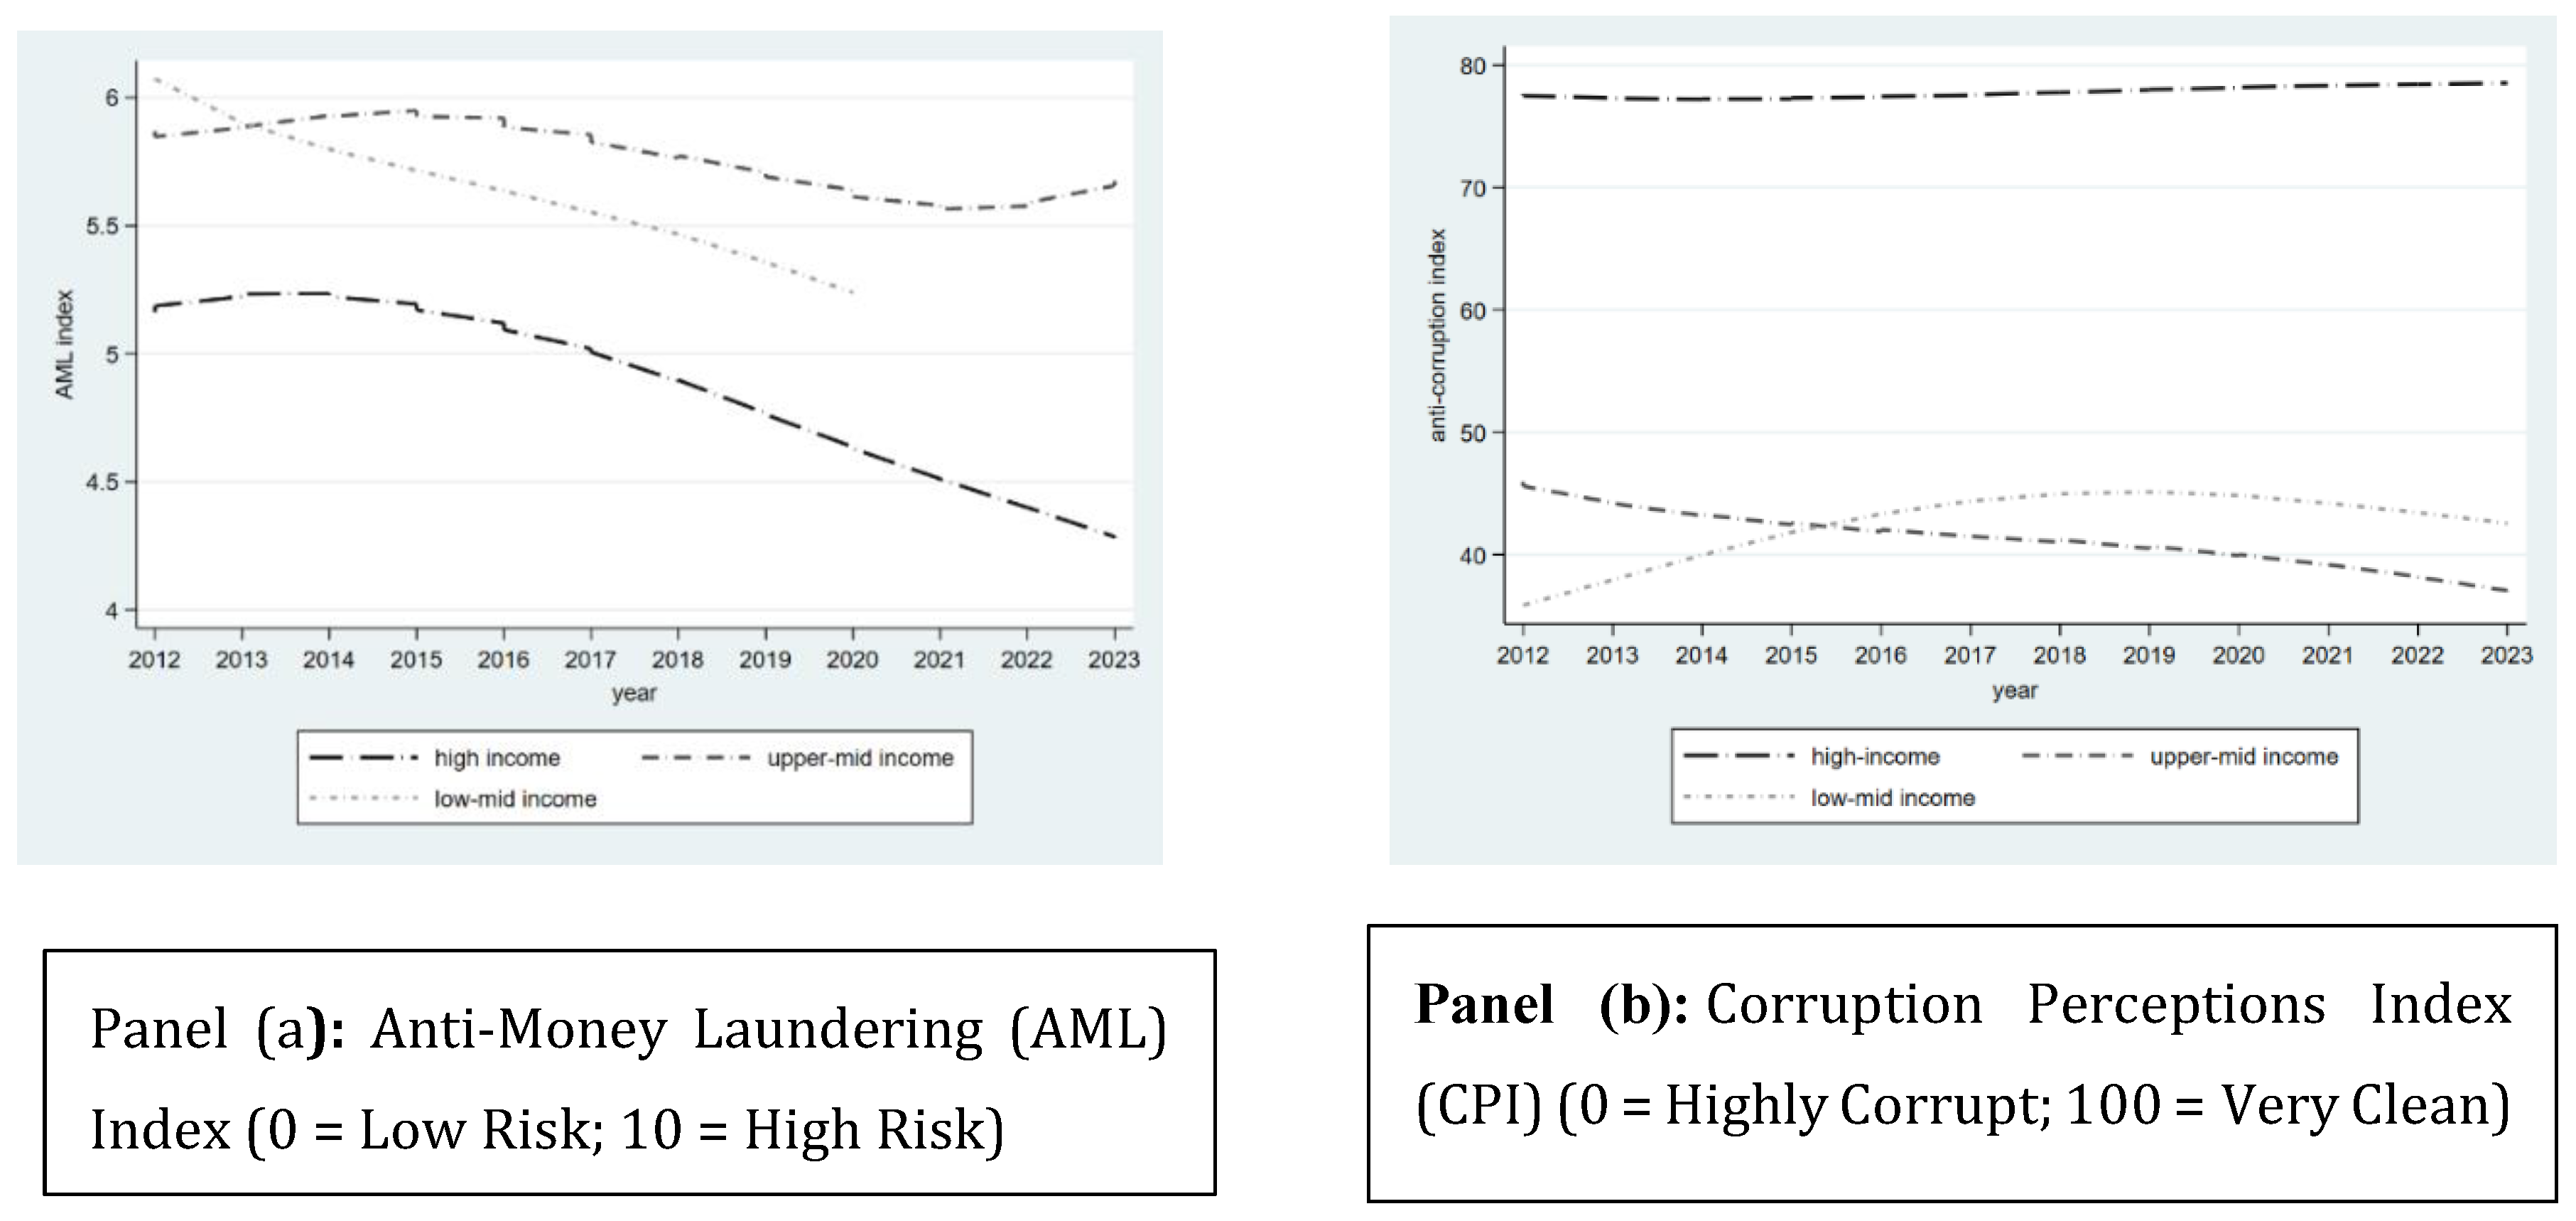

Table 1.
Operational Definitions, Measurements, and Data Sources of Study Variables.
| Symbol | Variable | definition | Source | |
|---|---|---|---|---|
|
The dependent variable |
Cptl = fdi+rem |
fdi |
Foreign direct investment are the net inflows of investment to acquire a lasting management interest (10 percent or more of voting stock) in an enterprise operating in an economy other than that of the investor. It is the sum of equity capital, reinvestment of earnings, other long-term capital, and short-term capital as shown in the balance of payments. This series shows net inflows (new investment inflows less disinvestment) in the reporting economy from foreign investors, and is divided by GDP. |
The World Bank, world development indicators % GDP |
| rem |
Personal remittances comprise personal transfers and compensation of employees. Personal transfers consist of all current transfers in cash or in kind made or received by resident households to or from nonresident households. Personal transfers thus include all current transfers between resident and nonresident individuals. Compensation of employees refers to the income of border, seasonal, and other short-term workers who are employed in an economy where they are not resident and of residents employed by nonresident entities. Data are the sum of two items defined in the sixth edition of the IMF's Balance of Payments Manual: personal transfers and compensation of employees. |
The World Bank, world development indicators % GDP |
||
| AML | Anti-money laundering |
The Basel AML Index is an independent country ranking and risk assessment tool for money laundering and terrorist financing (ML/TF). Produced by the Basel Institute on Governance since 2012, it provides holistic money laundering and terrorist financing (ML/TF) risk scores based on data from 18 publicly available sources such as the Financial Action Task Force (FATF), Transparency International, the World Bank, and the World Economic Forum. |
Basel Institute on Governance Index of 0 to 10 0 = low risk 10 = high risk |
|
|
The Independent variables |
corr | Corruption perception index: Percentile Rank |
Control of Corruption captures perceptions of the extent to which public power is exercised for private gain, including petty and grand forms of corruption and "capture" of the state by elites and private interests. Percentile rank indicates the country's rank among all countries covered by the aggregate indicator, with 0 corresponding to the lowest rank, and 100 to the highest rank. Percentile ranks have been adjusted to correct for changes over time in the composition of the countries covered by the World Governance Indicators (WGI). | The World Bank, world development indicators 0 = very corrupt 100 = very clean |
| cpta_grth | Per-capita real GDP growth | Annual percentage growth rate of GDP per capita based on constant local currency. GDP per capita is gross domestic product divided by midyear population. GDP at purchaser's prices is the sum of gross value added by all resident producers in the economy plus any product taxes and minus any subsidies not included in the value of the products. It is calculated without making deductions for depreciation of fabricated assets or for depletion and degradation of natural resources. | The World Bank, world development indicators (annual %) |
|
| trade | Economic openness index | Trade is the sum of exports and imports of goods and services measured as a share of gross domestic product. | The World Bank, world development indicators (% GDP) |
|
| r_dif | Voice and Accountability captures perceptions of the extent to which a country's citizens are able to participate in selecting their government, as well as freedom of expression, freedom of association, and a free media. Percentile rank indicates the country's rank among all countries covered by the aggregate indicator, with 0 corresponding to lowest rank, and 100 to highest rank. Percentile ranks have been adjusted to correct for changes over time in the composition of the countries covered by the WGI. | The World Bank, world development indicators 0 = lowest 100 = highest |
||
| Inf_cpi | Inflation as measured by the consumer price index | Inflation as measured by the consumer price index reflects the annual percentage change in the cost to the average consumer of acquiring a basket of goods and services that may be fixed or changed at specified intervals, such as yearly. The Laspeyres formula is generally used. | The World Bank, world development indicators (annual %) |
Note: All variables are defined as per World Bank and Basel Institute methodologies. Capital inflow is measured as the sum of net worker remittances and foreign direct investment as a percentage of GDP. AML risk is based on the Basel AML Index. Source: Authors’ calculations using data from the World Bank and Basel Institute on Governance (see Methods section for complete variable list).
Table 2.
Descriptive Statistics for Key Variables (G20, 2012–2023).
| Variable | Obs | Mean | Std. Dev. | Min | Max |
|---|---|---|---|---|---|
| cptl | 228 | 2.5 | 1.8 | -2.5 | 12.2 |
| aml | 220 | 5.2 | 0.8 | 3.5 | 7.3 |
| corr | 228 | 62.5 | 25.8 | 15.2 | 96.2 |
| cpta_grth | 228 | 1.5 | 3.4 | -10.6 | 10.4 |
| trade_gdp | 228 | 53.2 | 17.7 | 22.5 | 105.5 |
| r_dif | 228 | 7.6 | 12.2 | -4.6 | 90.9 |
| inf_cpi | 214 | 4.1 | 6.6 | -2.1 | 72.3 |
Note: Table 2 reports descriptive statistics for all study variables, including capital inflows (cptl), anti-money laundering index (aml), corruption perception (corr), per capita GDP growth (cpta_grth), trade openness (trade_gdp), interest rate differential (r_dif), and inflation (inf_cpi). Source: Authors’ calculations.
Table 3.
Correlation Matrix among Key Independent Variables.
| variable | aml | corr | cpta_grth | trade_gdp | r_dif | inf_cpi |
| aml | 1.000 | |||||
| corr | -0.587 | 1.000 | ||||
| cpta_grth | 0.254 | -0.133 | 1.000 | |||
| trade_gdp | -0.269 | 0.077 | -0.045 | 1.000 | ||
| r_dif | 0.358 | -0.485 | -0.025 | -0.380 | 1.000 | |
| inf_cpi | 0.154 | -0.315 | 0.151 | 0.105 | 0.265 | 1.000 |
Note: Values indicate pairwise correlations between explanatory variables to check for potential multicollinearity issues in the regression analysis. Source: Authors’ calculations.
Table 4.
Pesaran Cross-Sectional Dependence Test Results.
| H0: cross-section independence (no correlation across panels) | |||||
| Variable | CD-test | p-value | average joint T | mean ρ | mean abs(ρ) |
| cptl | 1.5 | 0.125 | 12 | 0.03 | 0.29 |
| aml | 17.6 | 0.000 | 11 | 0.41 | 0.63 |
| corr | -1.4 | 0.156 | 12 | -0.03 | 0.44 |
| cpta_grth | 32.5 | 0.000 | 12 | 0.72 | 0.72 |
| trade_gdp | 10.7 | 0.000 | 12 | 0.24 | 0.43 |
| r_dif | 8.5 | 0.000 | 12 | 0.19 | 0.46 |
| inf_cpi | 14.8 | 0.000 | 12 | 0.31 | 0.43 |
Note: CD-test statistics and associated p-values test the null hypothesis of cross-section independence for each variable across countries. A significant result (p < 0.05) indicates cross-sectional dependence. Source: Authors’ calculations.
Table 5.
Tests for Heteroscedasticity and Autocorrelation in Panel Data.
| Likelihood-ratio test for heteroscedasticity | Wooldridge test for autocorrelation in panel data | |
| H0: homoscedastic error | H0: no first-order autocorrelation | |
| LR chi2(9) = 161.82 | F (1, 8) = 95.137 | |
| Prob > chi2 = 0.0002 | Prob > F = 0.000 |
Note: Likelihood-ratio (LR) test evaluates the null hypothesis of homoscedasticity, while the Wooldridge test assesses the null hypothesis of no first-order autocorrelation in panel data residuals. Source: Authors’ calculations.
Table 6.
Main Regression Results: Panel-Corrected Standard Error (PCSE) Estimates.
| variable | coef. | SE | z | P>z |
| aml | -0.642*** | 0.208 | -3.090 | 0.002 |
| corr | -0.009*** | 0.004 | -2.610 | 0.009 |
| cpta_grth | 0.022 | 0.040 | 0.550 | 0.579 |
| trade_gdp | 0.017*** | 0.005 | 3.200 | 0.001 |
| r_dif | 0.044*** | 0.008 | 5.570 | 0.000 |
| inf_cpi | -0.046*** | 0.010 | -4.540 | 0.000 |
| Income category [ref. cat. = high income] | ||||
| upper_mid | 0.933*** | 0.195 | 4.780 | 0.000 |
| low_mid | 3.021*** | 0.323 | 9.350 | 0.000 |
| cons | 4.922*** | 1.369 | 3.600 | 0.000 |
| observations (N) 209 | ||||
| r-squared 0.243 | ||||
| number of countries 19 | ||||
| chi2 313.8 | ||||
| prob. > chi2 0.000 | ||||
Note: PCSE estimates are based on the linear panel model of capital inflows with robust standard errors. Significant coefficients at the 1% level are denoted by **. Independent variables include AML risk, corruption perception, real GDP growth per capita, trade openness, interest rate differentials, inflation, and income category dummies (reference: high income). Source: Authors’ calculations. See Methods for model specification.
Disclaimer/Publisher’s Note: The statements, opinions and data contained in all publications are solely those of the individual author(s) and contributor(s) and not of MDPI and/or the editor(s). MDPI and/or the editor(s) disclaim responsibility for any injury to people or property resulting from any ideas, methods, instructions or products referred to in the content. |
© 2025 by the authors. Licensee MDPI, Basel, Switzerland. This article is an open access article distributed under the terms and conditions of the Creative Commons Attribution (CC BY) license (http://creativecommons.org/licenses/by/4.0/).
Copyright: This open access article is published under a Creative Commons CC BY 4.0 license, which permit the free download, distribution, and reuse, provided that the author and preprint are cited in any reuse.


