Submitted:
04 August 2025
Posted:
05 August 2025
You are already at the latest version
Abstract
Advances in brain-computer interface technology seek to enable nuanced control of neural activity patterns. This study demonstrates a framework combining artificial intelligence and high-resolution optical sensing to identify and modulate intricate signaling dynamics. Genetically-encoded calcium indicators provide fluorescent readouts of neuronal firing. An autoencoder neural network compresses these optical data into a compact latent space, extracting interpretable features. The custom software Rasa coordinates data flow, deploys the models to translate neural sequences into vector representations. By comparing embedding vectors of target and observed activity, Rasa identifies desired patterns and administers neurofeedback accordingly. Initial in vivo validation demonstrates increased activity of simple correlated firing patterns under this novel stimulation paradigm versus unmodulated recordings in rat motor cortices. While limited by experimental constraints, these preliminary results highlight the potential of integrated machine learning techniques and fine-grained optical sensing to reinforce complex behavior. Looking forward, such AI systems could unlock new therapeutic abilities to remedy dysfunctional neurological signaling underlying disease states.
Keywords:
Brain-Computer Interface
; Neural Activity
; Artificial Intelligence
; Optical Sensing
; Autoencoder
; Latent Space
; Neurofeedback
; Neural Modulation
; Machine Learning
1. Introduction
As scientific understanding of functional neural activity increases, researchers have begun to take an interest in the treatment of the human brain as an input-output (I/O) computational machine [1]. This interest arises from the neurological capacity for conditioning that the brain uses in adapting to its physical environment. A major question in the field of neuroengineering is to what extent this plasticity can be controlled by electrical signals from an external source, which could effect conditioning through the already-observed mechanisms; the impact of the external signals can be determined by a real-time analysis of the brain’s output data streams.
Current neuroimaging and neurophysiological sensors, such as electroencephalography (EEG) and electrocorticography (ECoG), expand our ability to model brain activity, but both technologies fall short in capturing delicate electrical signals with spatial precision due to factors such as large electrode size, which obscures spatial information of signals, and non-invasive application, which limits the precision and sensitivity of output streams [2,3]. Furthermore, both ECoG and EEG confound hemodynamic methods of analysis such as fMRI, a valuable tool for mapping white and grey matter shifts in the brain that indicate a response to training. To address this, calcium sensors based on genetically embedded fluorescent proteins such as GCaMP have emerged as a potential alternative for capturing neurological activity at finer scales [4]. The data generated from calcium sensors can form the foundation of a neurofeedback output stream.
In the wake of recent advancements in neuroscience, there is also a growing consensus that electrical deep brain stimulation, apart from acting as a data receiver from neural sensors, can potentially serve as a robust input channel for neurofeedback and thus form an integral component of a Brain-Machine Interface (BMI). This process commences with an observation of neural activity, which is subjected to online analysis to provide a requisite stimulation [5,6,7]. However, the current neurofeedback techniques are bound by both the complexity of the conditionable signals and also the experimental difficulty of conditioning, which together conspire to severely inhibit the encoding of explicit brain signals and confine conditioning to simplistic binary-enforceable signals (i.e., Do we observe a spike?: Yes/No).
This study seeks to challenge these limitations, targeting the complexity of encodable signals and the rate at which these signals can be trained. We propose to optimize the training of neural signals by defining a continuous function that can be used to robustly evaluate the closeness of two arbitrary signals. We use an autoencoder neural model to define a vector representation of a particular neural signal as the values of latent variables at the bottleneck of an autoencoder model. Through comparing the distance of a target and active vector in the latent space of an autoencoder model, we were able to define an optimizable point to approach for conditioning. This technique aims to amplify the diversity and complexity of encodable signals within the existing feedback framework, while also enhancing the precision and speed of training for even simple signals. In tandem with this, we introduce a new software package, developed in the Rust programming language and specifically crafted to address the glaring issues of data latency, integrity, and performance encountered with existing data logging and real-time visualization software. By integrating this new software with our innovative optimization technique, we aim to introduce a refined, comprehensive solution to the existing limitations in neurofeedback and conditionable signal complexity.
2. Methods
2.1. Surgical Preparation
Several adult female rats were kept in single-housed cages and maintained in accordance with guidelines set by the Institutional Animal Care. We performed an initial surgery to implant a 200 μm-diameter optic
Fiber cannula in the rat’s motor cortex, allowing for the reading of GCaMP8f-based photometry data. The animals were provided with isoflurane analgesic pain relief during and after the operation in addition to general anesthetization [8]. During surgery, the genetically encoded calcium indicator GCaMP8f was introduced virally at stereotaxic coordinates of 2.0 mm anterior of bregma, 3.5 mm lateral, and 2.5 mm ventral from bregma, which are part of a broad area of the motor cortex hypothesized to be under the control of volitional movement [9]. The selected ensembles are believed to carry information about the rat’s intentions to move; the clarity of their purpose and lack of confounding noise makes them an ideal target for feedback. Following the recovery period from this surgery, the rats were again anesthetized for a craniotomy to insert a deep-brain electrode that stimulates the Medial Forebrain Bundle (MFB). The MFB is a dopaminergic pathway that plays a significant role in the brain’s reward system, correlating neural signals with pleasure as part of the closed-loop feedback used in conditioning such signals [10].
Figure 1.
Top: Bipolar deep brain stimulation electrode: (+3.4mm AP, +1.7mm ML, 8.5mm DV); Bottom: Virus (AAV9 containing DNA encoding GCaMP8f cargo) and optic fiber: (- 2mm AP, +/-3.5mm ML, 2.5mm DV)
Figure 1.
Top: Bipolar deep brain stimulation electrode: (+3.4mm AP, +1.7mm ML, 8.5mm DV); Bottom: Virus (AAV9 containing DNA encoding GCaMP8f cargo) and optic fiber: (- 2mm AP, +/-3.5mm ML, 2.5mm DV)
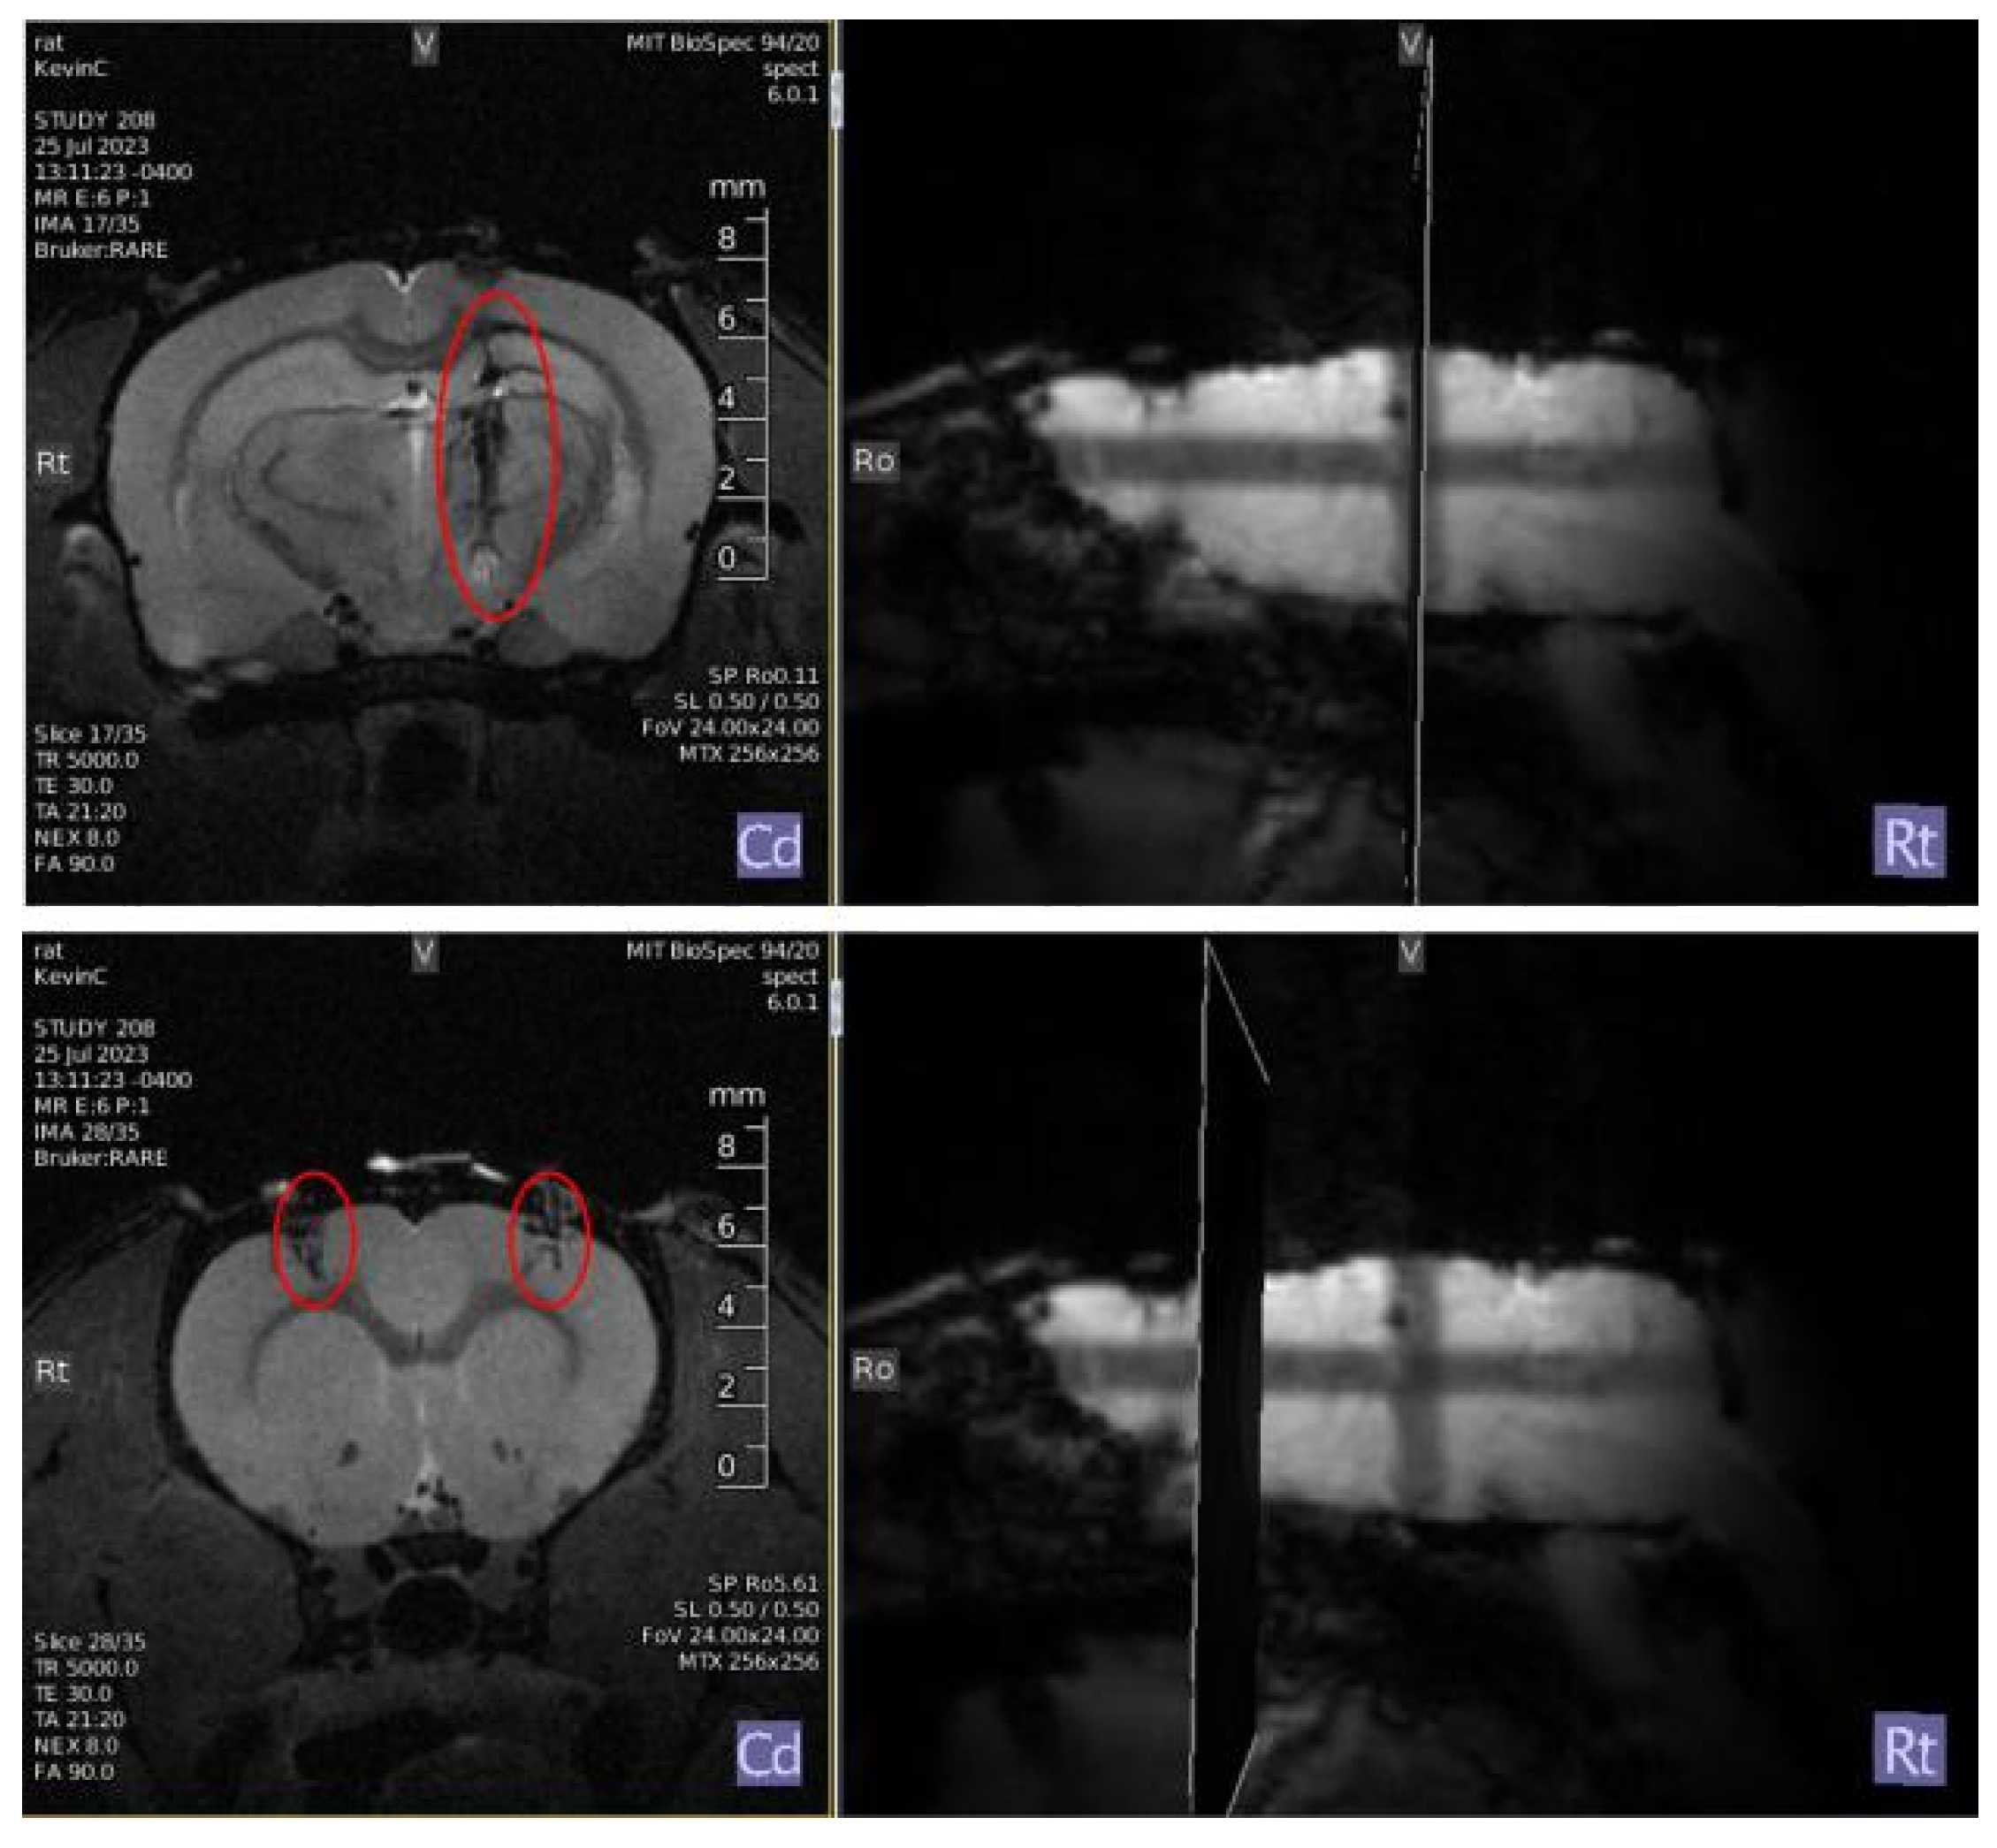
2.2. Data
A set of approximately 18 million data points was generated from an Arduino setup that serializes the output of a highly sensitive photosensor reading the fluorescence intensity of GCaMP proteins passed through an amplification tube. Data from the left and right hemisphere sensors were read concurrently and saved independently. The temporal component of the sensing data was preserved and stored sequentially such that the datastream could be interpreted as the continuous line of calcium concentration, itself a proxy for activity in a neuron ensemble. The full dataset represents over 30 hours of sensing under both dormant and scanning environments. Data was captured for five rats during fMRI sessions, where neural activity was stimulated indirectly by the noise of the EPI scan. The data stream from each GCaMP sensor was subdivided into discrete subsets of 2560 values by a sliding window with no self-overlap. The size of the window was calculated to be approximately equal to the number of data points processed per second, making each subset approximately 1 second in length. Points from this data set were averaged together in groups of 40 to form subsets with 64 values per channel. The averaging procedure serves purposes of (a) reducing noise among the highly sensitive photometer, (b) shrinking the data such that it can be analyzed on a millisecond timescale, and (c) increasing the ease of comparing similar features with slight offsets without the use of excessive pooling layers.
Because the vertical separation between channels, as well as the gain of the signal, are parameters to the photosensor that were non-uniform over the collection of the dataset (and separated from the actual observation), normalization of the channels was essential. For some sequences as a part of stream m,
For the purposes of analysis, without introducing additional dimensionality to the input, the two averaged channels of size 64 were concatenated into a single sequence of size 128 and separated by a consistent value such that the channels maintained their relativity but were nonetheless uniformly offset, offering an efficient and simple, albeit inelegant, way to transmit data to the encoder.
2.3. Model Design
The objective of a model for the task of comparing neural signals does not necessarily belong to the familiar tasks of classification, identification, or segmentation, for which there are extensive precedents and techniques for training. Instead, the computational approach attempts to form the modelling aspect of the abstract task of trying to modulate one signal to another signal as produced by an unpredictable in vivo data source. A model for this task requires a method of classifying with a continuous variable exactly how close a signal is to a target signal. In theory, this would allow incremental improvements in quality, e.g., if one wished to reinforce a strong double peak. Instead of always rewarding that activity when it happens correctly, which happens to be considerably rare and unpredictable, reward more frequent, but incorrect activity, and gradually increase the threshold for correctness based on the continuous numerical evaluation for similarity. This evaluation may be derived with a neural model table to perform analysis that is (a) efficient enough to give the impression of continuity in the evaluation stream and, (b) able to define a loss mechanism to show how the current target should descend towards the optimization signal. We hypothesized that a recurrent autoencoder would be an effective solution to this task. Autoencoder models take a higher-dimensional input stream such as an image or sequence, and instead of performing inference on it, shrink it to a narrow bottleneck layer, in which each weight represents some underlying property of the input data structure [11]. The model trains the weights by attempting to reconstruct this bottleneck into the original input data.
Figure 2.
Visualization of headless autoencoder. Raw embedding vectors considered in embeddings space.)
Figure 2.
Visualization of headless autoencoder. Raw embedding vectors considered in embeddings space.)

In this architecture, the interior values at the bottleneck are referred to as the latent values of the input. Interpreted as a vector, they form the latent space of the autoencoder, an inferential embedding space for the model. Most autoencoder models use this mechanism for generative modeling, employing elaborate decoder blocks, or for data compression and dimensionality reduction, querying the absolute latent values as the endpoint of the model.
The described model takes subsets of neural activity measured through GCaMP and passes them through an autoencoder, which represents the data as a 16-dimensional vector of latent values. Following that, an ideal target signal is subjected to the same vectorization, and the model evaluates the quality as the inverse of the Euclidean distance between vectors t and p, as:
The reward administered, R, acts as a simple way to calculate the expected similarity between two sequences, which can be continuously re-evaluated using a sliding window over the most recent 2,560 datapoints.
2.4. Implementation
Three autoencoder models were implemented in PyTorch for this task: a 1-layer LSTM, a 3-layer LSTM, and a 2-headed Transformer. Each model accepted an input sequence of length 128 and embedded it into a 16-dimensional latent space. Their performance was evaluated and compared to that of Cosine Similarity, a widely used baseline algorithm for sequence comparison.
2.5. Software Design
In addition to optimizing the output of our model, it is essential to consider the continuous datastream output from GCaMP sensors, particularly in terms of performance and safety. For this, a novel software package titled Rasa was developed in Rust as a high-performance, multi-threaded, visual solution to integrate analytical tools with memory-safe and accurate data processing. The previously described Arduino-Photosensor circuit is taken as input, allowing data to be transferred to the computational software via a USB output bus at a very high baud rate of 115,200. The majority of the initial dataset was generated with a provisional Python implementation to log and visualize data constructed prior to the beginning of this study. A key goal for data processing in this study was optimizing this provisional model so that data could be read and analyzed with much lower latency, allowing stimulation to be delivered closer to the observation of the neural signal. The software was designed with thread-safe infrastructure to separate the visualization, input, and analytical components with synchronous channels of two-sided deques from which the most recent data points read from the Arduino can be served to the desired consumer.
3. Results
3.1. Model Evaluation
In order to evaluate the quality of each model, the raw embedding vectors were initially clustered with the SciPy implementation of the PCA algorithm to form a 2D representation. The PCA points were then passed through a t-SNE algorithm and finally clustered with K-Means. The t-SNE visualization shows a largely continuous and evenly distributed grouping of possible signals, with the exception of explicit, correlated spikes, which form a separate cluster. Correlated spikes between the left and right motor cortex are one of the most recognizable common features that occur endogenously and were selected as the point of comparison for the models. This t-SNE cluster was deemed a superset of all peaks observed in the evaluation split of the dataset, as it included many other extreme features that were not strictly peaks. Due to the observed embedding-space distance between points within the cluster, this inconsistency is believed to be a result of the t-SNE clustering, which biases against individual outlying points, as opposed to a flaw in the embeddings. Within this dataset, sequences empirically considered to demonstrate a correlated peak formed a testing dataset by which the models could be evaluated for correctness.
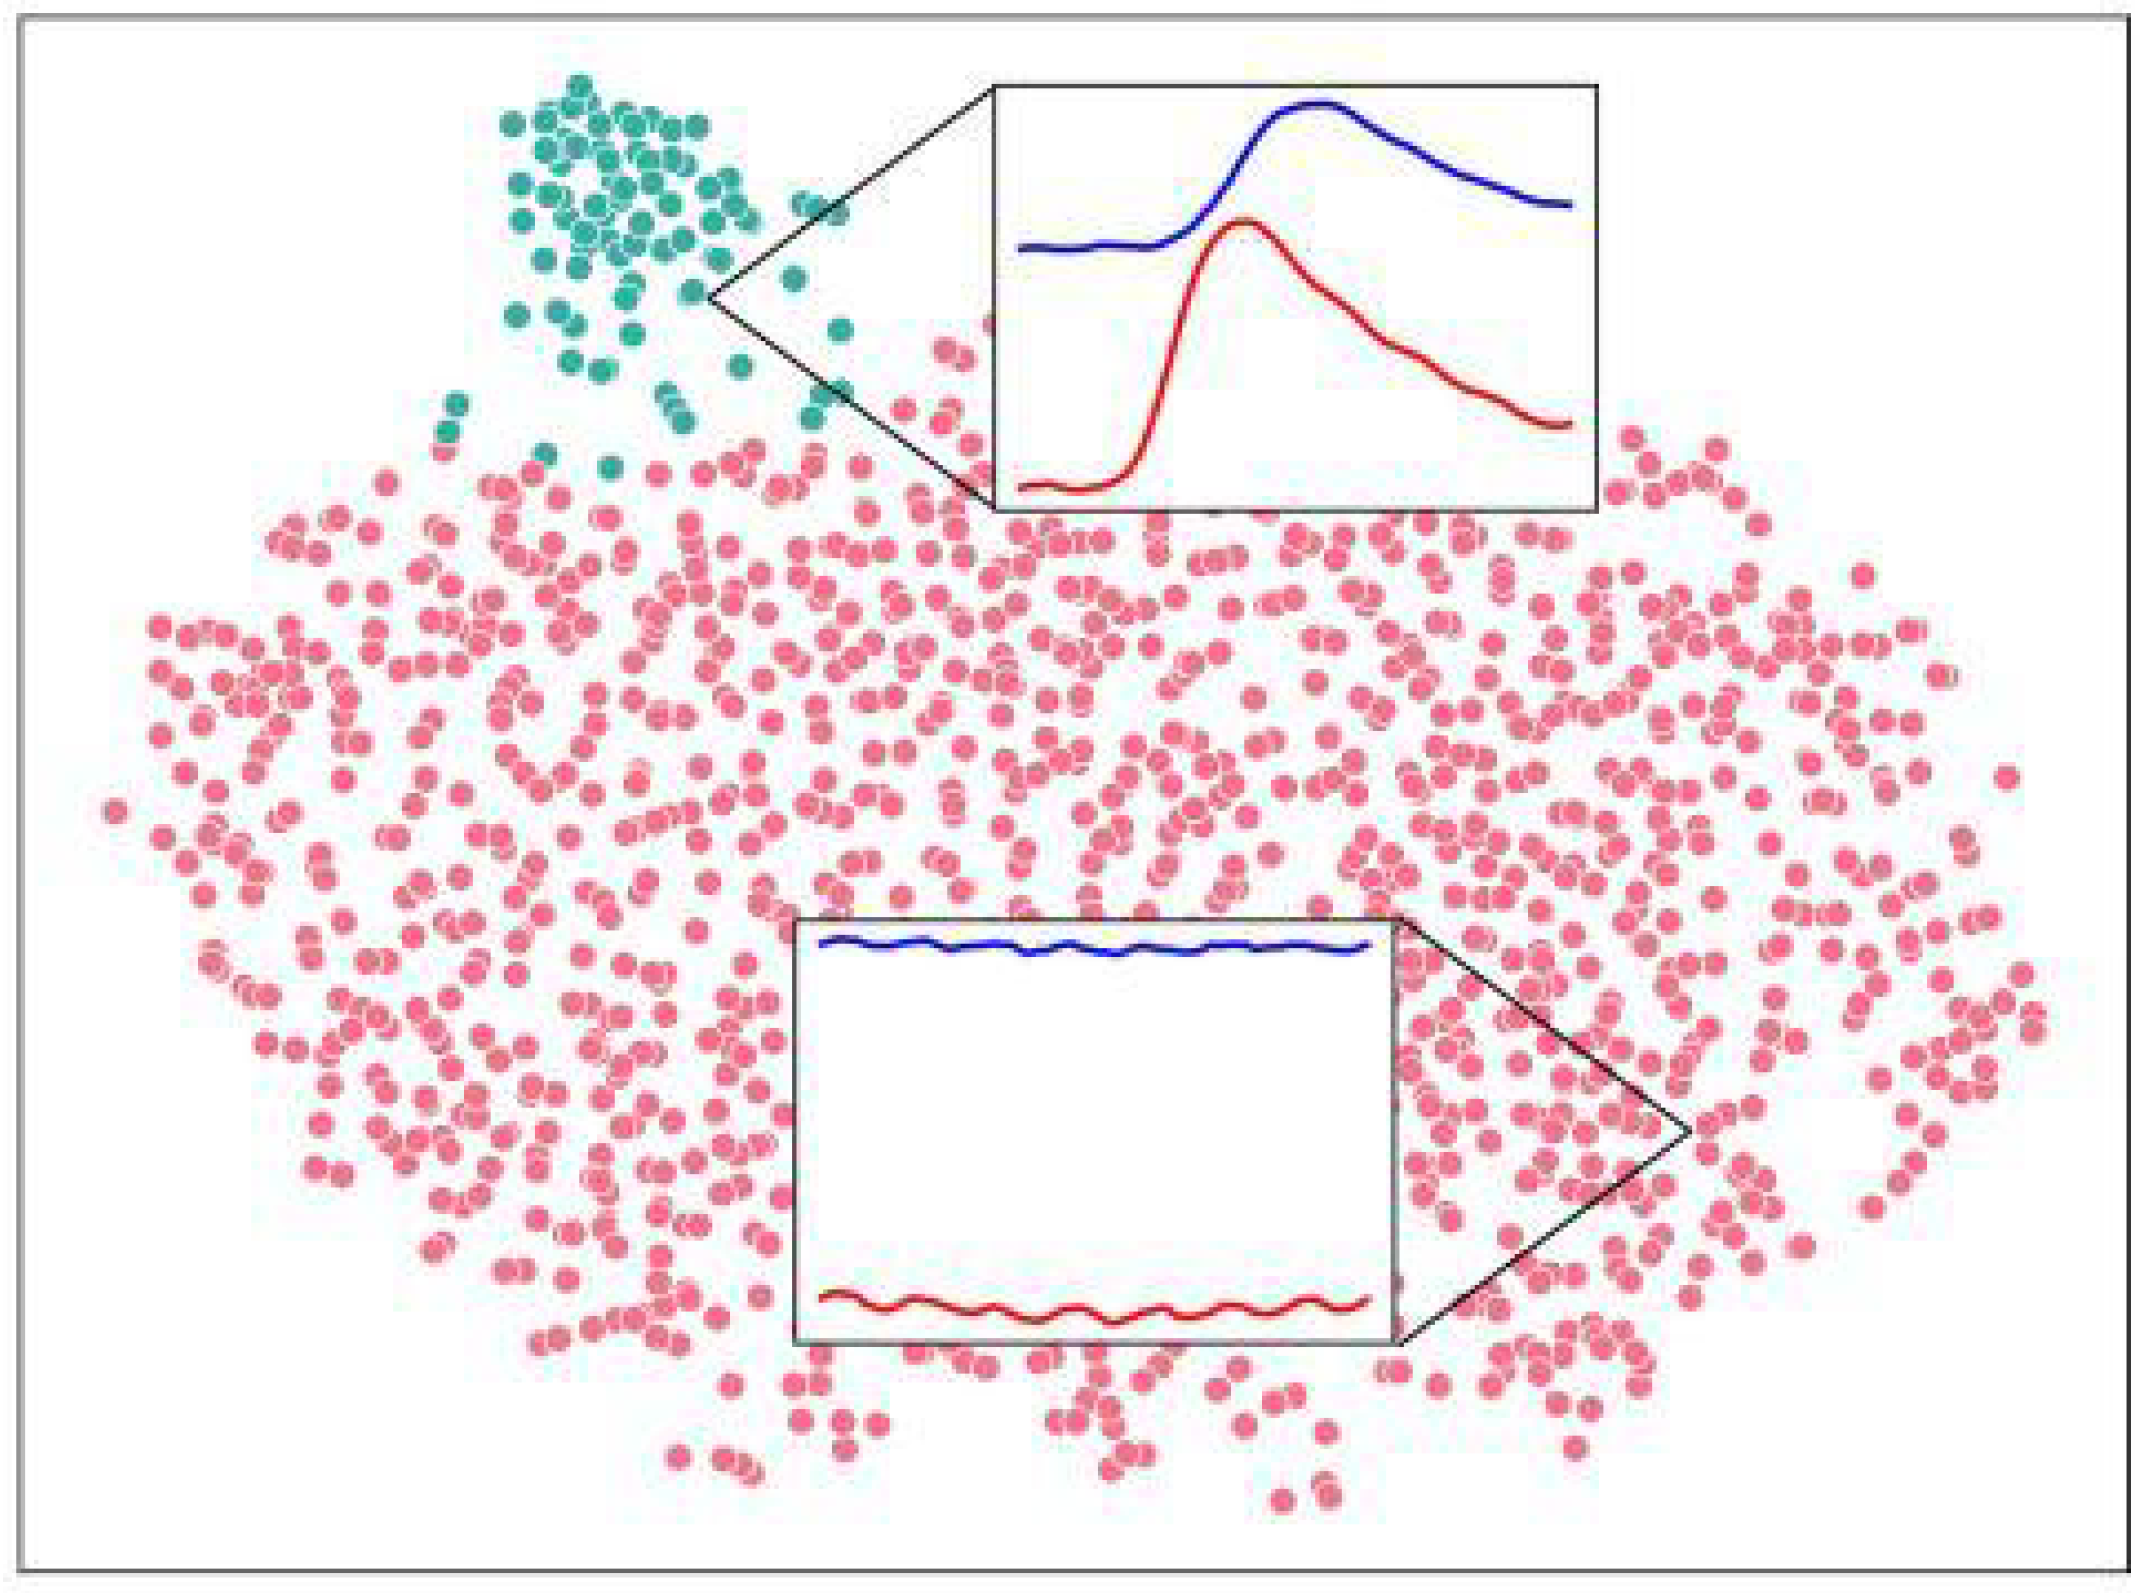
Figure 3.
1,325 latent space vectors mapped to PCA embeddings, further mapped to t-SNE embeddings, clustered with K-Means to visualize a continuous network of signals and strong peak outliers. Two regions were selected from flat and peaked areas of the distribution. Blue: right cortex channel. Red: left cortex channel. Vertical offset is arbitrary and normalized as described.)
| Model | Parameters | Correct (%) | Latency (ms) | |
| Cos. Similarity | 0 | 62.5 | 11.02 | 3.72 |
| 1-Layer LSTM | 12,961 | 92.4 | 691.1 | 2.72 |
| 3-Layer LSTM | 29,857 | 90.7 | 638.8 | 4.08 |
| Transformer | 277,297 | 98.7 | 827.2 | 4.77 |
We compared the specifications of each tested model for their performance and accuracy. Furthermore, the power of the detected peaks relative to the resting stream was considered by
which serves to represent the ratio between the inverse distance of a desirable feature represented as a peak of in the reward graph and the resting average distance of the signals compared to the reward signal. A larger value implies that the peaks are more separated from non-peaks, indicating stronger confidence in the detection. Notably, the latency for each system was approximately equal. Latency was averaged across 5,000 samples per model, performed on a Google Colab V100 GPU instance. The latency of all models was considered within tolerance for use in real-time neurofeedback. Despite the large parameter size and comparatively higher latency, the transformer model was chosen as the ideal design due to its high accuracy.
3.2. Software Evaluation
To compare the effectiveness of the novel software, both the new and old software were tested after five minutes of idling, eliminating cold-start bias and exemplifying the long-term
Figure 4.
Latency after 5 minutes by software. ,
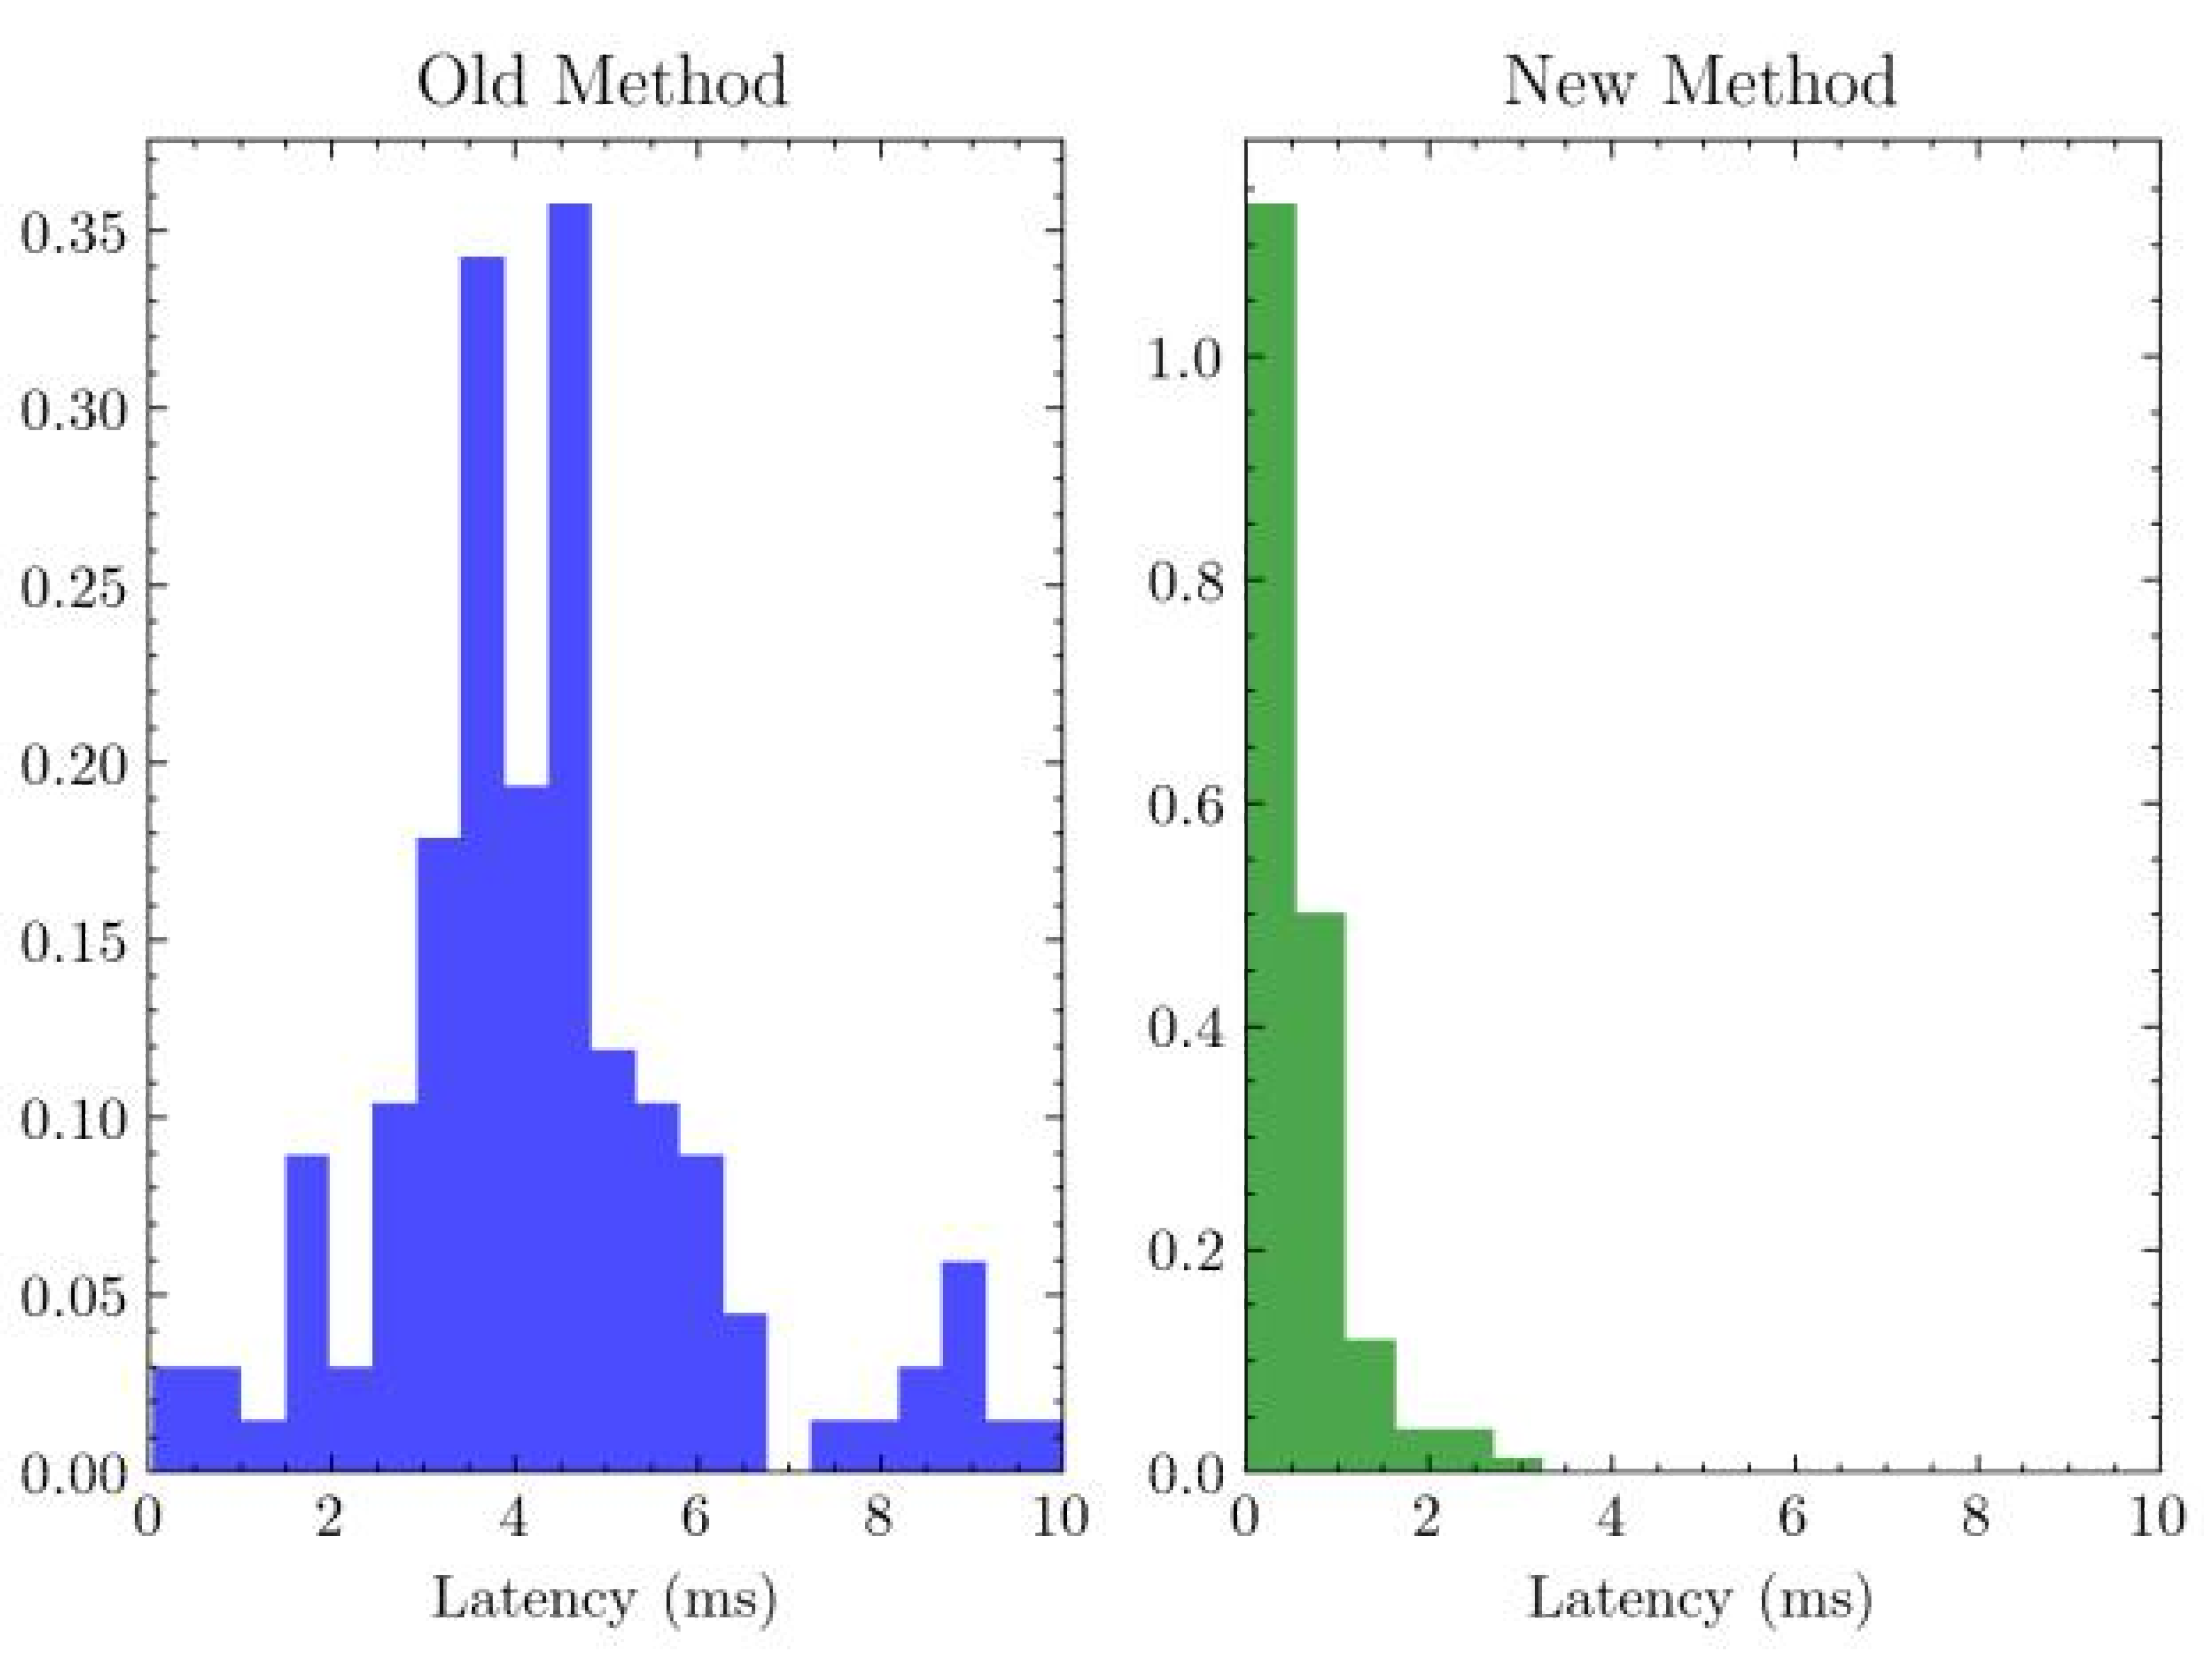
Performance benefits of optimized data structures provided by the new implementation. In order to evaluate the latency of the software, an artificial signal was supplied to the datastream buffer of the respective software every 100 milliseconds by a separate independent timer thread. Following this, the active thread would exhaustively search for the signal among the 128 most recent entries, recording the difference in time between the most recent signal and the beginning of the search. Bias was eliminated by controlling for the search time in Rust (n = 5; ) and Python (n = 5; ).
The distribution of latencies observed from the experiment was evaluated with a two-sample t-test under the hypothesis that the new method has a lower latency than the previous method. The test evaluated to a p-value significant past , indicating strong confidence in the improved performance of the novel software.
3.3. In Vivo Evaluation
The model and software were integrated into the software package Rasa and run on the McGovern Institute 9.4T fMRI Imaging Setup for an EPI scan under neurofeedback. Feedback was administered as described, using a deep-brain electrode as a response to motor cortex activity. For simplicity, we rewarded correlated peaks of electrical activity
Figure 5.
Green: Sum of rewarded values under stimulation based on new criterion. Blue: Sum under no stimulation.
Figure 5.
Green: Sum of rewarded values under stimulation based on new criterion. Blue: Sum under no stimulation.
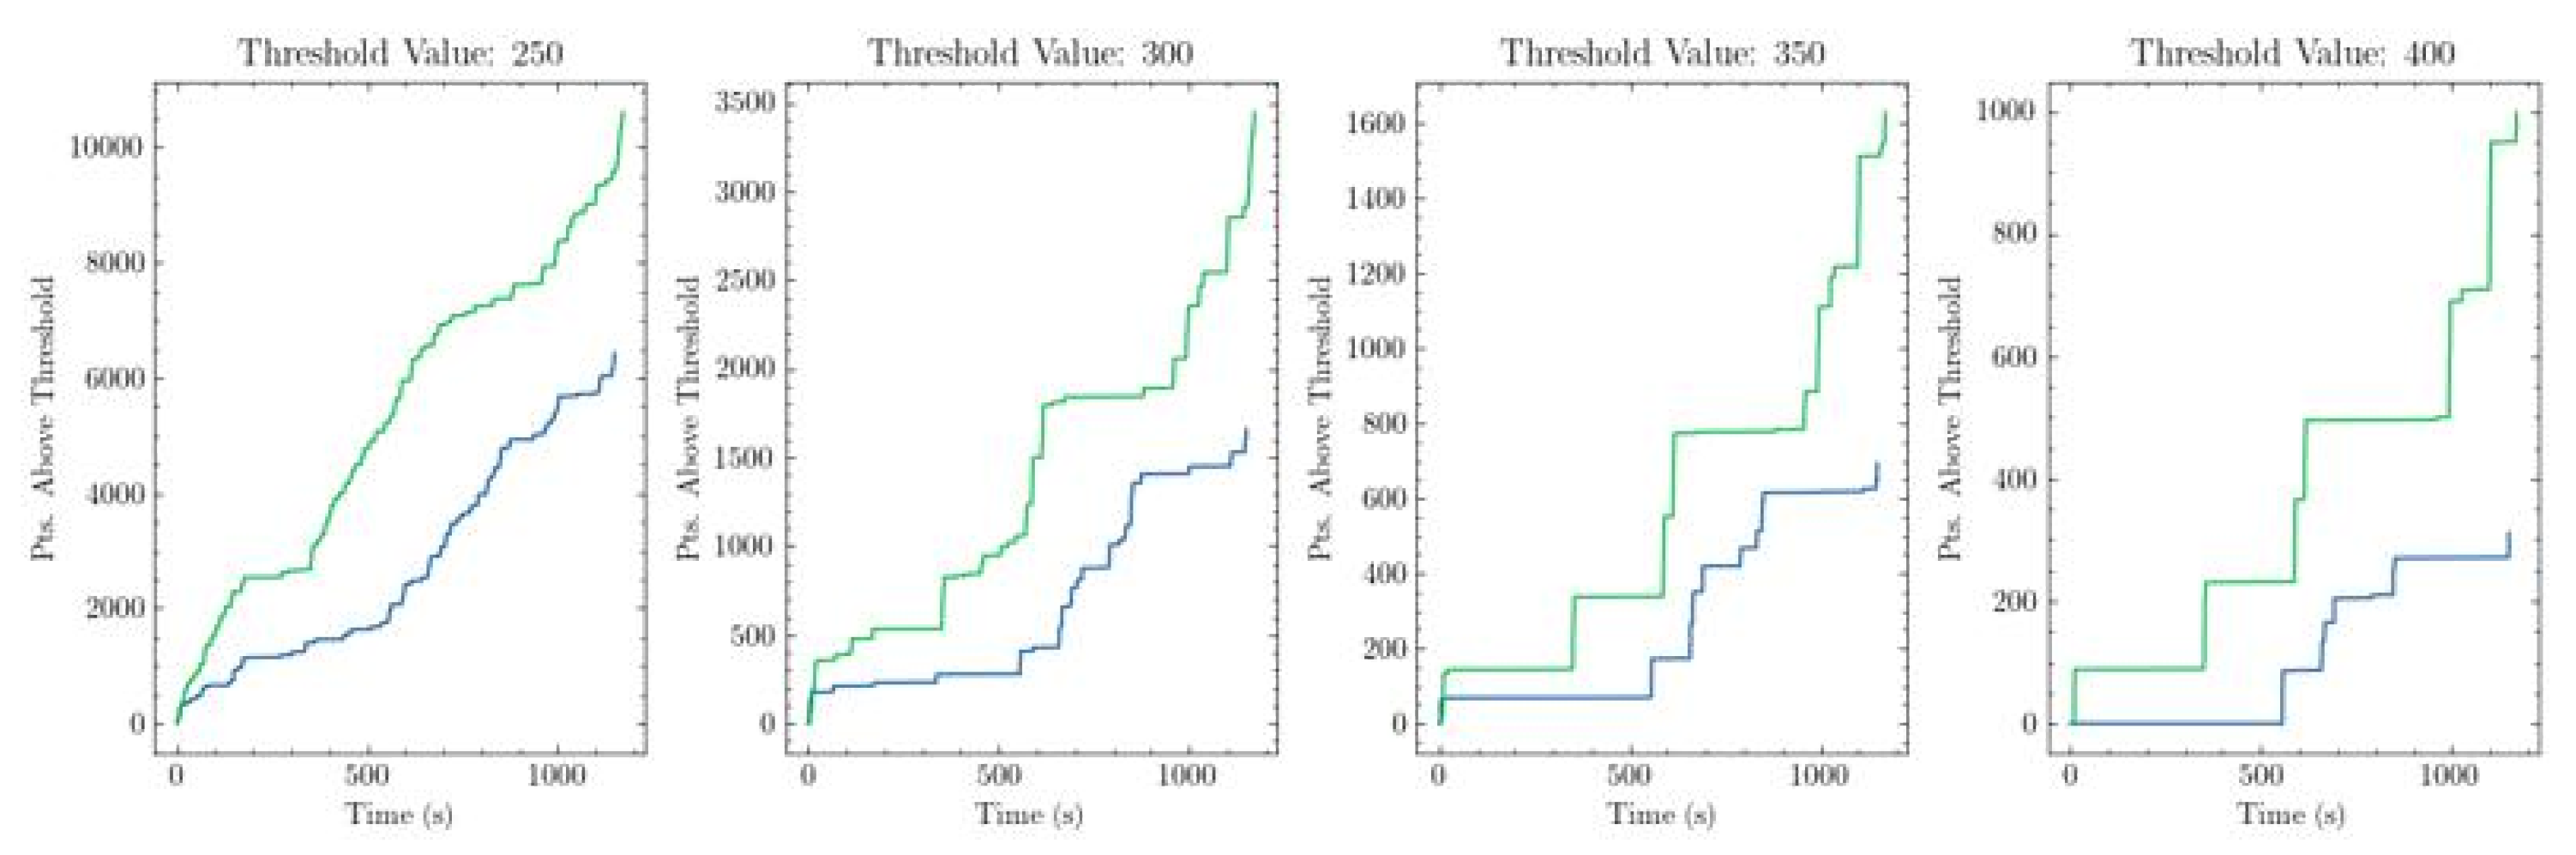
In the two neuronal ensembles considered by the two optical fibers. For the temporarily paralyzed rat, the neural signals and neurofeedback were monitored for two subsequent 20-minute sessions, the first of which generated a naive dataset under no stimulation, and the second of which was performed with neurofeedback monitoring. During the second session, the model and software achieved a correlated peak with above the arbitrary target threshold 15 times and were stimulated 13 times (discrete peaks separated from one another by less than 16 seconds were noted but not rewarded, in order to prevent overstimulation and preserve the health of the animal). Given an arbitrary threshold for inverse distance at a value of 300, the sum of every inverse distance greater than that threshold can be thought of as an evaluation of both the frequency and intensity of desirable behavior in the data. The value of this threshold is a hyperparameter, and its flexibility serves as a principal advantage of this method. The threshold can be constant or changing, depending on the target signal. As such, its value is controllable inside the Rasa software, allowing researchers to control the frequency and lenience with which rewards are administered.
This training session provides strong evidence that the use of stimulation under the novel system provides some benefit in improving the quantity of rewardable events based on a vector embedding. However, due to the small training size and lack of controls, it did not show strong evidence of improvement over the previous method (p = 0.20 + no unbiased comparison).
4. Discussion
The method showed promise in our initial experiments as a means of defining neurofeedback qualification. Unfortunately, due to time constraints and the high demand for use of the 9.4T fMRI, this experiment was only able to be performed once. During the two-week in vivo portion of this study, there were no opportunities to use the machine during weekdays between the hours of 8 AM–5 PM, which were the only available times due to laws involving supervision of minors in biohazardous laboratories. This prevented the execution of the initial experimental design, which was to test the novel method’s unique ability to encode more complex signals by attempting to reinforce the embedding of a non-correlated peak, a signal that does not generally occur endogenously within rats (constituting 1 of 13,709 sequences in the unabridged dataset). This more complex task represents the fundamental advantage of the autoencoder model and loss mechanism. Despite this, the full experiment is now scheduled on the fMRI/photosensor setup for September–October 2023, likely occurring over the course of 5–8 multi-hour training sessions to account for increased signal complexity and additional robustness checks. Even though the central experiment was not executed, the Rasa software system and the use of ML-based signal analysis for simple signals is beginning to underscore the wider neurofeedback procedure outside the scope of this experiment in isolation.
5. Conclusions
This paper outlines the developmental process of the software system Rasa and its constituent transformer model, which represents a novel technique for reinforcing cognition modulation based on closed-loop neural signals. We succeeded in demonstrating the performance effectiveness of the software, which has helped enable more robust data analysis and improved the ability to detect subtler and shorter neuronal signals. Furthermore, we developed three unsupervised models that demonstrated the ability to identify arbitrary neural signals and reward them based on the literal positioning of the embedding vectors.
6. Code Availability
The source code for Rasa, as described in this paper, is available on GitHub at https://github.com/AstroTech-666/rasa.ml
References
- J. Millan. On the need for on-line learning in brain-computer interfaces. In 2004 IEEE International Joint Conference on Neural Networks (IEEE Cat. No.04CH37541), volume 4, pages 2877–2882 vol.4, July 2004.
- Enriquez-Geppert, R. J. Huster, and C. S. Herrmann. EEG-Neurofeedback as a tool to modulate cognition and behavior: A review tutorial. Front Hum Neurosci 2017, 11, 51. [CrossRef]
- H. Marzbani, H. R. Marateb, and M. Mansourian. Neurofeedback: A comprehensive review on system design, methodology and clinical applications. Basic Clin Neurosci, 2016, 7, 143–158. [CrossRef]
- T.-W. Chen, T. J. Wardill, Y. Sun, S. R. Pulver, S. L. Renninger, A. Baohan, E. R. Schreiter, R. A. Kerr, M. B. Orger, V. Jayaraman, L. L. Looger, K. Svoboda, and D. S. Kim. Ultrasensitive fluorescent proteins for imaging neuronal activity. Nature 2013, 499, 295–300. [CrossRef]
- G. Karvat, A. Schneider, M. Alyahyay, F. Steenbergen, M. Tangermann, and I. Diester. Real-time detection of neural oscillation bursts allows behaviourally relevant neurofeedback. Communications Biology 2020, 3. [CrossRef]
- R. J. Schafer and T. Moore. Selective attention from voluntary control of neurons in prefrontal cortex. Science 2011, 332, 1568–1571. [CrossRef] [PubMed]
- K. B. Clancy, A. C. K. B. Clancy, A. C. Koralek, R. M. Costa, D. E. Feldman, and J. M. Carmena. Volitional modulation of optically recorded calcium signals during neuroprosthetic learning. Nature neuroscience 2014, 17, 807–809. [Google Scholar] [CrossRef] [PubMed]
- Z. Liang, Y. Ma, G. D. Watson, and N. Zhang. Simultaneous GCaMP6-based fiber photometry and fMRI in rats. Journal of Neuroscience Methods 2017, 289, 31–38. [CrossRef] [PubMed]
- S. H. Scott. Optimal feedback control and the neural basis of volitional motor control. Nature Reviews Neuroscience 2004, 5, 532–545. [CrossRef] [PubMed]
- R. Nieuwenhuys, L. M. Geeraedts, and J. G. Veening. The medial forebrain bundle of the rat. I. General introduction. Journal of Comparative Neurology 1982, 206, 49–81. [CrossRef] [PubMed]
- D. P. Kingma, M. Welling, et al. An introduction to variational autoencoders. Foundations and Trends® in Machine Learning 2019, 12, 307–392. [CrossRef]
Disclaimer/Publisher’s Note: The statements, opinions and data contained in all publications are solely those of the individual author(s) and contributor(s) and not of MDPI and/or the editor(s). MDPI and/or the editor(s) disclaim responsibility for any injury to people or property resulting from any ideas, methods, instructions or products referred to in the content. |
© 2025 by the authors. Licensee MDPI, Basel, Switzerland. This article is an open access article distributed under the terms and conditions of the Creative Commons Attribution (CC BY) license (http://creativecommons.org/licenses/by/4.0/).
Copyright: This open access article is published under a Creative Commons CC BY 4.0 license, which permit the free download, distribution, and reuse, provided that the author and preprint are cited in any reuse.


