
Submitted:
03 August 2025
Posted:
04 August 2025
You are already at the latest version
Abstract
Operation Stork Speed, launched by the Food and Drug Administration(FDA) in March 2025, represents a comprehensive initiative to update infant formula regulations that have remained largely unchanged since the 1980’s. This expert panel review addresses recommendations for nutrients considering four decades of accumulated scientific evidence since then. Current FDA fatty acid regulations specify only total fat content and minimum linoleic acid requirements despite substantial international consensus on polyunsaturated fatty acid specifications. Evidence strongly supports establishing maximum linoleic acid levels and docosahexaenoic acid (DHA) and arachidonic acid (ARA) requirements, reflecting the critical role of omega-3 fatty acids in neurocognitive development and visual acuity. The panel emphasizes that saturated and monounsaturated fatty acids comprise over 80% of human milk fatty acids, while acknowledging recent concerns about seed oils and supporting balanced PUFA formulations. Carbohydrate composition presents significant concerns, as over half of US formulas contain glucose polymers (e.g. corn syrup solids) despite lactose being the primary carbohydrate energy source in human milk. Observational studies link corn syrup-based formulas to multiple possible health risks, including excess weight gain, warranting reconsideration of the value of non-lactose carbohydrate substitutions in formulas for healthy children. Protein content recommendations support decreasing the upper range of allowable intake, aligning with European standards and addressing concerns about excessive protein intake contributing to later obesity risk. Micronutrient evaluation reveals the need to reduce the iron content in routine formulas to lower levels, consistent with European Food Safety Authority recommendations and emerging safety data and a need to set upper limits for the concentration of calcium and phosphorus. Overall, infant formula is a healthy product and has many decades of successfully feeding infants. These comprehensive updates aim to more closely align US infant formula regulations with current scientific understanding and international standards while supporting optimal infant growth, development, and long-term health outcomes.
Keywords:
infant formula
; infant nutrition
; DHA
; lactose
; iron
; Operation Stork Speed
What Is Operation Stork Speed and What Are Its Goals?
Operation Stork Speed, a joint initiative between the US Department of Health and Human Services (HHS) and the US Food and Drug Administration (FDA) announced in March 2025, sought public input on four key areas: nutrient content of infant formulas, testing of heavy metals and contaminants in infant formulas, formula labeling transparency, and identification of scientific research gaps (1). This paper specifically covers the nutrient content issues with additional manuscripts covering other issues.
The initiative was launched partly in response to the 2022 infant formula shortages, which exposed supply chain vulnerabilities, and a recent report that raised concerns about potential heavy metal exposure in infant formulas (2). After introducing Operation Stork Speed and its planned evaluation of the infant formula landscape, the FDA requested that an expert group be convened to discuss key issues and established a plan for a public meeting. The members included pediatricians, nutritional scientists, dietitians, and community members with a special interest in this field. A transcript of this meeting can be found at this site (3).
The goal of this meeting, and of the processes we describe, is to provide guidance to the FDA and other federal officials and government groups, including Congress, on how to support and improve infant formula in the US. This can be achieved through regulatory and other forms of support that are part of a comprehensive partnership among academia, industry, the community, and government to support the nutritional needs of healthy infants.
Why Is an Update on Nutrient Requirements in Infant Formulas Needed?
The Infant Formula Act (IFA) of 1980 (Pub. L. 96-359) established nutrient requirements and safety standards for infant formula and was amended in 1986 (Pub. L. 99-570) to strengthen quality control, manufacturing practices, and regulatory oversight requirements. The IFA serves as the basis for current regulations on infant formula nutrient specifications are established in 21 CFR 107.100, originally published January 14, 1985 (50 FR 1840), with subsequent amendments in 1985 (50 FR 45108), 2015 (80 FR 35841), and 2016 (81 FR 49895), with the 2015 amendment adding selenium requirements to infant formula. No changes have been made to most of the nutrient regulations since 1985.
The IFA is traceable to the events surrounding the chloride deficiency crisis that unfolded in the United States during 1978-1979. This crisis, which specifically involved two soy-based infant formulas, had profound implications for infant health and public trust which are detailed in a 1984 Congressional Research Service report (4). Although infant formulas were widely used by the mid-20th century, specific nutrient recommendations were primarily issued by professional organizations, primarily the American Academy of Pediatrics (AAP).
In the early 1970s, high sodium intake was identified as a contributing factor to hypertension. Emerging dietary guidelines recommended moderating sodium, including its addition to infant formulas, to prevent infants from developing a reliance on higher sodium levels based on taste or physiological response. What was overlooked in this guidance was the requirement for sodium in normal infant metabolism and the coincident intake of chloride. In the well-intentioned desire to reduce sodium, levels were driven so low that some formulas became chloride deficient.
During 1978 and 1979, reports emerged of infants developing hypochloremic metabolic alkalosis (HMA), a serious electrolyte and acid-base imbalance (5). Investigations quickly linked this condition to the consumption of two specific soy-based infant formulas. The manufacturer had reformulated these products by discontinuing the addition of sodium chloride, resulting in formulas with insufficient chloride content to meet the physiological needs of developing infants. The ability of a manufacturer to make such a critical change to an essential nutrient without prior, stringent regulatory review underscored a significant gap in the oversight mechanisms of the time. The clinical manifestations included failure to thrive, characterized by poor weight gain despite adequate caloric intake, diminished appetite, and constipation. Sequelae were also found at 2-4 (6) and 9-10 (7) years of age.
This unfortunate episode is instructive for updating regulations. Extreme recommendations, even when based on well-founded concerns, can have damaging consequences. For example, severely limiting or omitting seed oils in formulas could lead to deficiencies in omega-6 and omega-3 fatty acids, only some of which manifest through overt criteria like poor growth. Neurocognitive development is particularly sensitive, and subtle effects may require expert measurements to detect issues that could magnify later in life.
As new studies on nutrient metabolism appear, specific nutrient levels are continuously reevaluated. Manufacturers, interested in distinguishing their products, may see emerging trends as beneficial for business, even if these trends are not fully vetted for short or long-term safety. Regular monitoring of requirements based on evolving science is necessary to maintain the highest standards for infant formulas.
Fats and Fatty Acids
Recent public concern about seed oils has prompted a widespread reconsideration of the edible oil supply. Popular influencers have highlighted two major issues: high levels of omega-6 linoleic acid (LA) beyond that in pre-industrial foods, and unintended changes in composition during oil refining.
Oils and fats fall into three categories based on their origins: seed oils, fruit oils, and animal fats. The primary seed oils in the U.S., ranked by production volume (in millions of pounds), are soy (11.7), canola/low erucic acid rapeseed (4.7), corn (2.1), sunflower (0.7), cottonseed (0.3), peanut (0.27), safflower (0.2), grapeseed, and rice bran oils (8). Although high levels of omega-6 LA are characteristic of the original forms of these oils, high-oleic varieties with much lower omega-6 LA are widely available for many. High-oleic sunflower oils are the predominant oils from that plant, and high-oleic versions of soy, safflower, and peanut oils are also available. Notably, high-oleic oils have a fatty acid profile like that of olive oil.
Widely available fruit oils are palm oil and its fractions such as palm olein, coconut, olive, and avocado oils. These oils feature low levels of omega-6 LA, substituting it with either monounsaturated or saturated fatty acids. Apart from extra virgin oils, which are generally cold-pressed, fruit oils are typically processed in a manner like seed oils.
Cow’s milk fat is the animal fat most relevant to human infant formula. Other possible animal fats are lard (pork rendering) and tallow (beef rendering), both of which require processing. Beyond the fatty acid profiles and the degree of processing, the sourcing of fat is important, as all ingredients must consider product uniformity and supply chain stability to obtain the many metric tons required annually. Overall, seed oils as a category are not distinguished from other oils by either their processing or their omega-6 LA content.
Fatty Acids Regulations
Current FDA regulations, 21 CFR 107.100, specify only two requirements for fat and fatty acids. Total fat must be between 3.3 and 6.0 grams per 100 Kcal (30% to 54% of energy), and omega-6 LA must be at least 300 mg per 100 Kcal of formula, or 2.7% of calories; no maximum amount is specified. These fat and fatty acid requirements have not been updated since their enactment in 1985. The only change in allowable infant formula fatty acid composition was enabled by the FDA in 2001, permitting the addition of single-cell sources of omega-3 docosahexaenoic acid (DHA) and omega-6 arachidonic acid (ARA) to infant formulas. Although the most compelling data for including DHA and ARA in formulas emerged from numerous studies of preterm infants, the no-questions letter allowing use of DHA and ARA applied to term infant formulas as well (9).
Many other countries have updated their specifications, including, for instance, a maximum allowable amount of omega-6 LA and required levels of omega-3 DHA and omega-6 ARA (10). More than a dozen individual and ad hoc groups of pediatric researchers and physicians have published recommendations since the late 1990s for updates on polyunsaturated fatty acid (PUFA) contents of infant formulas, addressing LA (10, 11), omega-3 alpha-linolenic acid (ALA) (12), ARA (13-17), and DHA (18-21), as well as their relative proportions (22-24). Consideration of these many treatments has led to a broad consensus on international PUFA regulations for LA, ALA, and DHA levels, with some divergence on ARA (10).
Saturated and Monounsaturated Fatty Acids
Saturated and monounsaturated fatty acids constitute over 80% of the total fatty acids (range 74%-87%) in human milk (25). Like all milks, over 98% is carried by triacylglycerols (TGs), with most of the balance being phospholipids (26). Within TGs, palmitic acid is found more prominently, but not exclusively, in the sn-2 position (27), a characteristic of human milk not present in vegetable oils (28). Lard has palmitic acid in the sn-2 position (29), and cow’s milk has saturated fats, such as myristic and palmitic acid, predominantly in the sn-2 position (30). Palmitic acid in the sn-2 position survives digestion in 3-month-old human infants (28). Non-esterified saturated fatty acids form unabsorbable salts with calcium, leading to the fecal loss of both. On this basis, structured TGs with more palmitic acid (16:0) in the sn-2 position are considered more like those in human milk.
PUFAs are defined as all fatty acids with two or more double bonds. The most relevant PUFAs for infant formula are LA, ALA, ARA, and DHA. LA and ARA are omega-6 (n-6) PUFAs, while ALA and DHA are omega-3 (n-3). Infant formulas with exclusively plant-based oils provide only LA and ALA, requiring the infant’s metabolism to biosynthesize the DHA and ARA that are essential structural components of the brain and all neural tissue. The synthesis and tissue accretion of ARA and DHA proceed with enzymes common to both omega-3 and omega-6 PUFAs (31). This is the origin of the concept of dietary PUFA balance, most commonly manifested by excess omega-6 LA suppressing omega-3 ALA conversion and creating a metabolic demand for omega-3 long-chain PUFAs (LCPUFAs) (32).
Importantly, saturated fatty acids are not vulnerable to attack by reactive oxygen species (ROS), and monounsaturated fatty acids are only minimally affected. In contrast, a key structural feature of PUFAs, the bis-allylic position, is the site of oxidation that must be defended from ROS by antioxidants and other metabolic strategies. Thus, saturated and monounsaturated fatty acids place a minimal oxidative burden on infant metabolism. In contrast, PUFAs in general, and highly unsaturated fatty acids (HUFAs) specifically, are highly vulnerable to ROS attack. Consequently, dietary levels of PUFA and HUFA that meet metabolic requirements without excess are most desirable.
Linoleic Acid and Alpha Linolenic Acid
Early animal research established that the complete absence of PUFAs in the diet leads to several characteristic deficiency symptoms, specifically skin lesions, loss of water barrier function, polydipsia, and failure to grow. Omega-6 LA and ARA were found to be most effective in alleviating these symptoms. Specific studies in human infants established that mild skin lesions, characterized by scaly skin, develop in infants fed formulas with very low PUFA levels, a condition that could be reversed by including small amounts of LA (33, 34). Notably, until the 1990s, no pure source of ARA or DHA was available to be safely provided to human infants. In the absence of evidence on ARA and DHA, LA became known as the “essential fatty acid.”
While subsequent studies show that LA is metabolically essential per se (35), not just as a precursor to ARA, definitive studies also show that it is not a nutritionally essential PUFA: dietary ARA can be converted to LA to fulfill that metabolic skin function (36). Mice have been raised on ARA and DHA as the exclusive sources of PUFA through 10 generations with no overt symptoms; at generation 10, neurocognitive development, the function most sensitive to PUFA insufficiency, is normal (37). LA has persisted as “the essential fatty acid” precisely because of sourcing: the industrial food supply is replete with LA, including oils that are readily available and suitable for use in infant feeds, whereas ARA is a specialty product.
ALA is the omega-3 analogue of LA and serves as the precursor for all omega-3 LCPUFAs in diets where no other omega-3 is present. Unlike LA, with its role in skin barrier function, no essential metabolic functions of ALA have been demonstrated. The presence of ALA in the milk of healthy lactating mothers and its role as a nutrient justify its mandatory inclusion in infant formulas.
ALA is available in a small number of seed oils grown at a large scale in North America: soy, canola/rapeseed, and flax. Most oils are deficient in ALA, including sunflower, safflower, corn, peanut, grapeseed, and high-oleic canola. Moreover, fruit oils such as olive, avocado, and palm oils are also deficient in ALA. Olive oil has a reputation for supporting omega-3 levels, but this is because it is naturally a low omega-6 LA oil; thus, excess LA above requirements does not suppress ALA conversion or accretion to omega-3 LCPUFAs. Olive oil of typical fatty acid composition is marginally deficient in omega-3.
Before 2001, LA and ALA were the only sources of omega-6 and omega-3 PUFAs in US infant formulas. These were endogenously converted to ARA and DHA, respectively, to supply tissue demand. Growth, as determined by body weight gain and anthropometrics, matched or exceeded that of breastfed reference infants. However, the early accretion of DHA in the brain (38) led to concerns that DHA synthesis was insufficient in term and especially early preterm infants (39, 40).
DHA and ARA
Neither DHA nor ARA is present in commercial vegetable oils, necessitating the development of specialty oils for infant formulas. Oil from the marine dinoflagellate Crypthecodinium cohnii, commonly referred to as an alga, was the first DHA oil used in US infant formulas. Schizochytrium oil and egg phospholipids, both generally recognized as safe (GRAS) substances, are also used.
Apart from LA’s function in the skin, DHA and ARA are the bioactive forms of omega-3 and omega-6, respectively. DHA accretion in the neonatal brain accelerates in the last third of term gestation, slows around 2 years of age (40), but continues to 18 years of age (41). Early human studies used fish oil concentrate-based DHA and EPA, without added ARA, in experimental infant formulas (42), which led to some concerns over arachidonic acid-mediated growth (39). Nearly all subsequent studies included a source of ARA because Mortierella alpina oil, a source of ARA, became available. Most of the neurocognitive data ascribed to DHA in infant formulas also contained ARA, and in that sense, their effects on neurocognition apply to the blend of both (13). The independent role of ARA in immune and vascular function is not well explored. Prudence based on available data suggests that ARA should be included in formulas, though expense remains a serious concern.
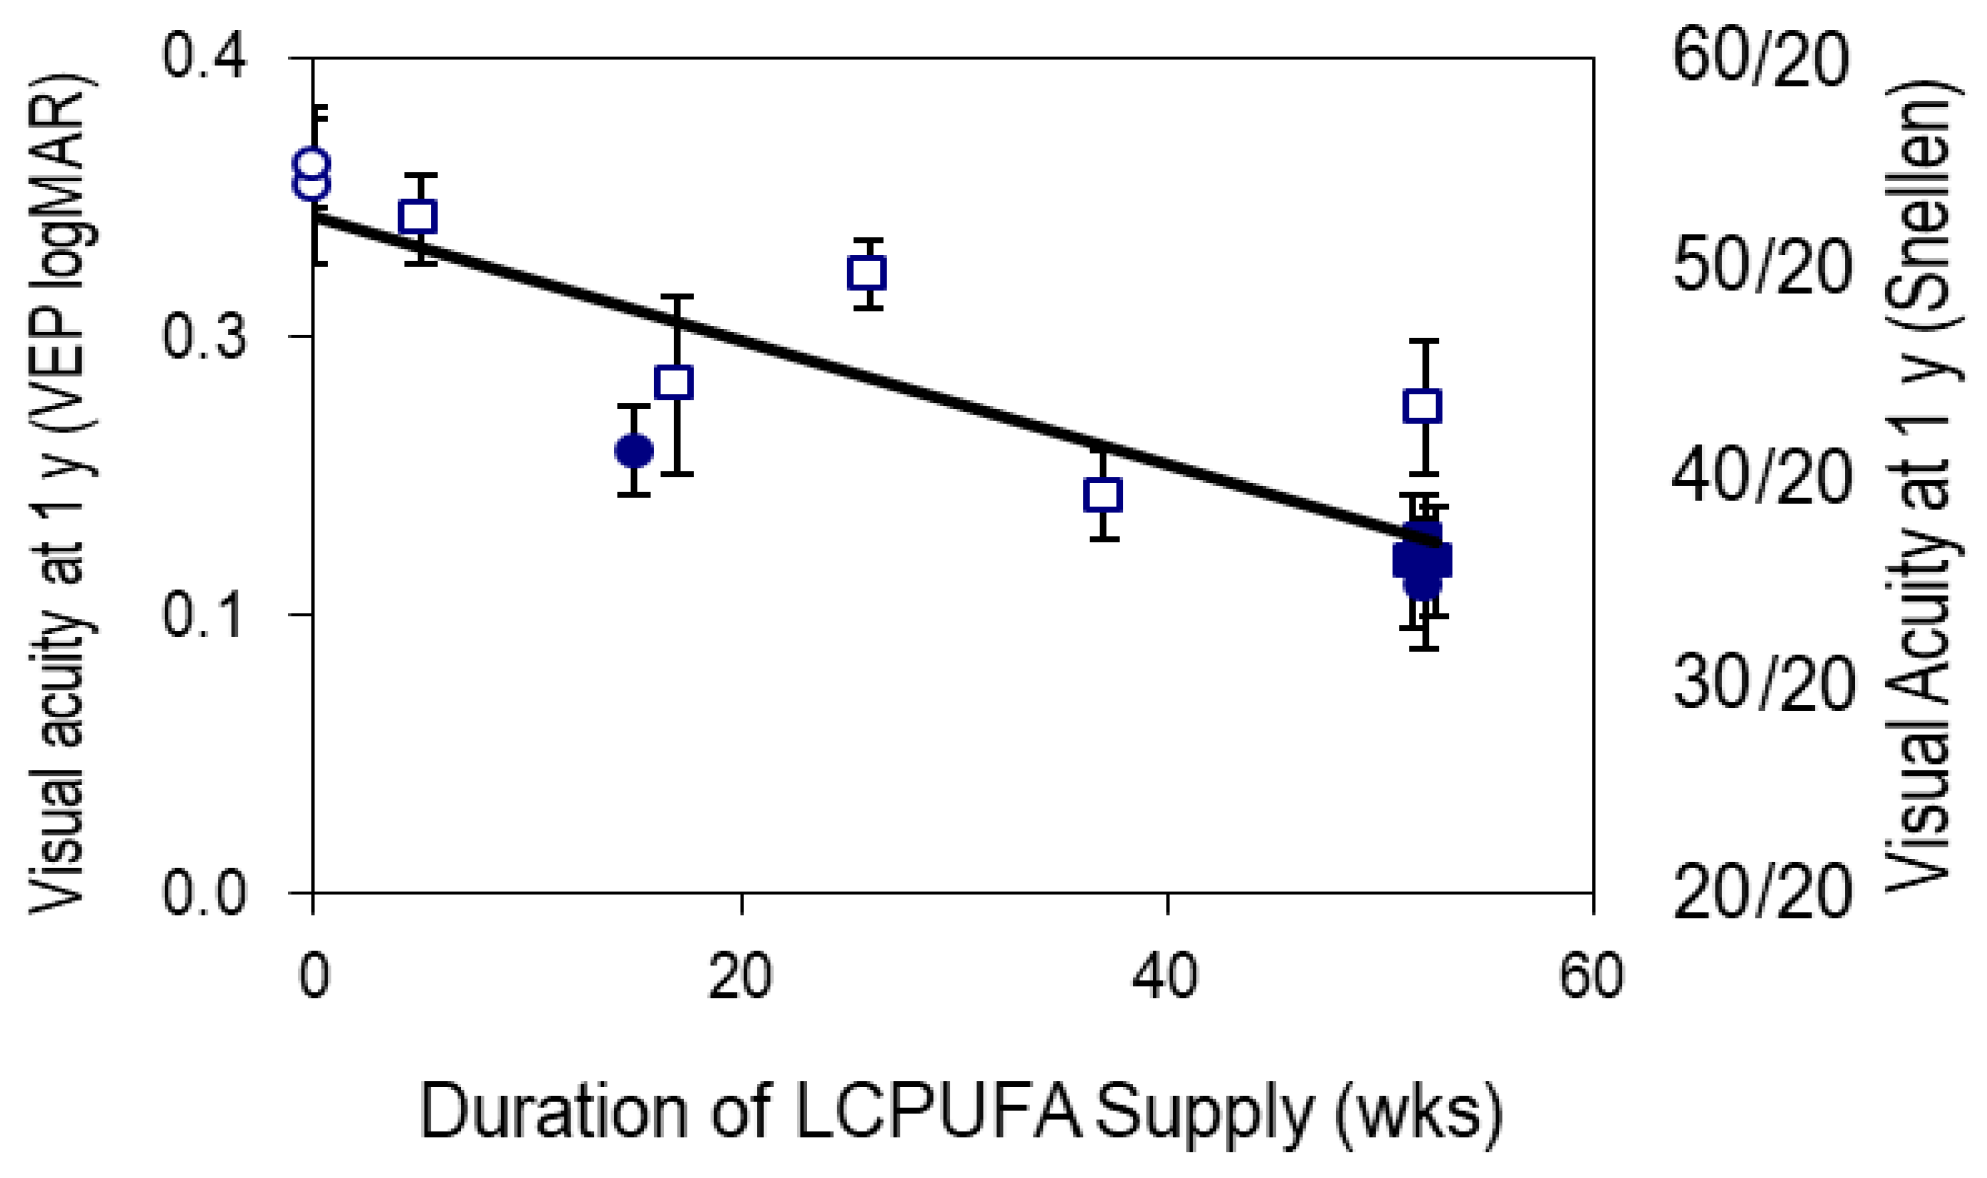
Strong evidence for the requirement of DHA and ARA in visual acuity development was established in multiple studies. Visual acuity improves with development largely because of neural development, rather than being restricted to the light-sensing part of the retina. In a series of four studies (43), DHA/ARA formulas were compared to formulas with only LA and ALA as sources of PUFA. Figure 1 illustrates visual acuity on the familiar Snellen scale (where 20/20 is normal vision), all measured at 1 year of age. These data show that the longer the exposure to DHA/ARA, the better the vision at 1 year of age (44). Remarkably, the effect appears whether the DHA/ARA was delivered from a DHA/ARA-supplemented formula or from breastfeeding. Furthermore, these data qualitatively match results from studies in non-human primates investigating omega-3 deficiency (45, 46), as well as those using DHA/ARA formulas versus no-DHA/ARA formulas (47).
Omega-6 for Body, Omega-3 for Brain
The foregoing evidence strongly supports consideration of the first update to FDA regulations on fatty acids in infant formulas since they were enacted in 1985. The long interval provides an opportunity to incorporate decades of lessons learned to reset baseline requirements, reflecting both the scientific literature and authoritative recommendations from around the world. Ample data support the use of omega-6 for body growth. Concerns are overwhelmingly about high-priority functions beyond growth. Furthermore, compelling data show that omega-3 DHA supports neurocognitive development, with a focus on balanced fatty acids. Updated regulations should support the development of the whole infant, from head to toe, while providing sufficient flexibility to enable innovation in formulation and giving an expanded range of options for caregivers.
Carbohydrate Content of Infant Formula
Human milk contains 6–8% (g/dL) carbohydrates, of which approximately 80% is lactose (a disaccharide of glucose and galactose). Free glucose accounts for only about 0.1% of human milk, while the remaining ~20% comprises roughly 200 oligosaccharides—non-digestible carbohydrates that act as prebiotics for gut bacteria. Thus, lactose is the sole carbohydrate energy source in human milk.
The IFA does not specify carbohydrate type or set minimum or maximum amounts. The only stipulation is that carbohydrate ingredients, like all others, must be designated GRAS for use in infant formula. Consequently, many U.S. formulas have replaced some or all of the lactose with other sugars such as glucose-based polymers (corn syrup solids, maltodextrins) and sucrose (48, 49), which would be classified as added sugars in other foods. Recent analyses indicate that 59% of powdered formulas sold in the U.S. contain glucose polymers (48), with the use of non-lactose carbohydrates increasing over time (50).
The reasons manufacturers substitute lactose with other sugars are not clearly defined but may relate to the cost and solubility advantages of raw ingredients like corn syrup solids compared to lactose. Many lactose-reduced infant formulas are marketed as “gentle” to address possible lactose intolerance in babies. However, lactose intolerance is rare in healthy, full-term infants, as babies are born with the ability to produce the enzyme lactase in the gut, which is needed to break down lactose into glucose and galactose for absorption (51).
Several clinical trials have compared the effects of lactose-based and lactose-reduced formulas in healthy infants (52-54). These trials generally show that lactose-reduced formulas are safe and support normal growth. Minor differences such as softer stools, less spit-up, and slightly faster weight gain in girls on lactose-free formula were observed, although their significance remains uncertain. Importantly, none of the trials evaluated behavioral, metabolic, or obesity-related outcomes, and all were industry-funded.
Observational studies, however, suggest potential effects of lactose-reduced formulas compared to human milk or lactose-based formula on behavioral, obesogenic, and metabolic outcomes. Infants fed formulas with corn syrup exhibited steeper increases in food fussiness and reduced enjoyment of food between 12–24 months (55), as well as higher toddler intake of sugar-sweetened beverages (56). These feeding behavior changes may contribute to an increased risk of future obesity and/or dysregulated eating styles. In a study of over 15,000 infants in California’s WIC program, there was a 10% higher risk of obesity at ages 2 and 4 among infants fed corn syrup formulas compared to lactose-based formulas, with a dose-response relationship (57). For example, 12 months of exposure to a corn syrup-based formula was associated with a 16% higher risk of obesity by age 2 years. Notably, these effects were independent of maternal weight status, total formula issued, and breastfeeding duration, and were not modified by child race or sex.
Infants fed corn syrup solids or sucrose-based formulas also show disrupted gut microbiota at six months, including lower Bifidobacteriaceae, higher Lachnospiraceae, and reduced short-chain fatty acids (58). We currently lack longer-term studies examining whether these gut microbiome shifts persist into childhood and impact clinically relevant outcomes. Theoretical concerns also exist regarding the higher glycemic index of corn syrup formulas, which may lead to elevated blood glucose levels, impair healthy glucose homeostasis, and increase pancreatic insulin demand, potentially elevating the later risk for type 2 diabetes—though direct studies in infants are lacking. Importantly, the Dietary Guidelines for America and FDA definitions have not addressed potential glycemic index issues associated with dietary patterns, physiological status, or behavioral dynamics.
While these findings are observational and subject to confounding (e.g., parental choice of formula, differing formula compositions), they raise potentially important health concerns. The absence of rigorous randomized controlled trials (RCTs) and longer-term outcomes limits causal inferences and potential public health recommendations. Ethical considerations complicate conducting RCTs that might expose infants to formulas that could contribute to adverse health effects during critical developmental stages and later in life. Nevertheless, the growing body of evidence showing adverse effects of lactose-reduced and corn syrup-based formulas justifies the need to revisit the rationale and recommendations for replacing lactose with other sugars like corn syrup solids (glucose polymers) and/or sucrose. These other sugars are not present in human milk. They would otherwise be considered added sugars, which, in line with the most recent Dietary Guidelines for Americans (2020-2025), are not recommended for infants up to 2 years of age.
The other primary carbohydrate source in human milk is human milk oligosaccharides (HMOs). HMOs are a diverse group of complex, indigestible carbohydrates that are the third most abundant component of human milk after lactose and lipids. Built on a lactose core with additional components like fucose and sialic acid, the most abundant HMO in human milk is 2’-fucosyllactose (59). Though infants cannot digest HMOs, they appear to help shape a healthy gut microbiome, support immune development, protect against infections (60), and are thought to play a role in healthy brain and cognitive development by serving as a source of sialic acid and fucose (61, 62). Some infant formulas now add HMOs, innate to human milk, including 2’-fucosyllactose and lacto-N-neotetraose, both considered GRAS. However, there are no current FDA requirements to include HMOs in formula and notably, they are not included in formulas designed for premature infants.
Reassessment of the Recommended Protein Content in Infant Formula for Healthy Full-Term Infants
The current FDA code of regulations requires a protein content of 1.8 to 4.5 g/100 kcal when its biological value is equivalent to or better than that of casein. If the biological quality is less than casein, the minimum amount of protein must be increased proportionately. This range is significantly higher than the protein content of human milk, which ranges from 1.1 to 1.4 g/100 kcal. Furthermore, not all proteins in human milk have a primary nutritional function; some (e.g., immunoglobulins, lactoferrin) have primary immunological and developmental roles (63).
The primary role of dietary protein is to meet growth and physiological needs by providing adequate amounts of essential and conditionally essential amino acids, as well as total protein. It is also essential to provide adequate protein along with sufficient non-protein energy sources to ensure that amino acids are not used for energy (64). Over the past 25 years, significant scientific data have emerged, including: i) new infant growth standards (2006) based on exclusively breastfed infants (65); ii) the observation that breastfed infants gain weight more slowly than formula-fed counterparts (65); iii) the protective effects of breastfeeding against long-term obesity risk; iv) emerging evidence linking high protein intake during infancy to later obesity risk (66, 67); and v) observations that lower-protein formulas, in the range of human milk, do not increase malnutrition risk (68, 69).
In 2005, the European Society of Pediatric Gastroenterology and Nutrition (ESPGHAN) coordinated an International Expert Group (IEG) that recommended a narrower protein range than 21 CFR 107.100, specific to the protein source: cow's milk protein (1.8–3 g/100 kcal), soy protein isolates (2.25–3 g/100 kcal), and hydrolyzed cow's milk protein (1.8–3 g/100 kcal) (70). Additional pertinent data since 1998 include the introduction of two new growth charts: the CDC 2000 growth reference (71) and the 2006 WHO/CDC growth standard for children <24 months (65). The 2006 standard, based on longitudinally collected data from healthy, exclusively breastfed infants, provides a prescription for how healthy infants should grow and highlights significant growth pattern differences compared to formula-fed infants.
As a group, formula-fed infants often gain weight more rapidly than their breastfed counterparts (65). Rapid weight gain during infancy has been associated with an increased risk of adiposity, overweight, and obesity (69, 72). Epidemiological studies suggest a link between higher protein intake in early life and a greater risk of overweight and obesity in children and adolescents (66). Clinical trials comparing lower-protein (1.77 g/100 kcal) with higher-protein (2.9 g/100 kcal) formulas have shown that infants on lower-protein formulas exhibit growth patterns similar to breastfed infants and slower rates of weight gain than those on higher-protein formulas (69).
Therefore, the 1998 broad range for protein content may benefit from being narrowed, for example, to 1.8 to 3 g/100 kcal/day. This aligns with ranges associated with normal growth, decreased long-term risk of overweight and obesity (73), and harmony with ESPGHAN-IEG recommendations (70).
Protein Quantity
Protein quality is a consideration for infant formula protein content. The IFA minimum and maximum levels for protein are 1.8 g/100 kcal to 4.5 g/100 kcal which are consistent with those supported by the Codex Alimentarius standard (74) and Canadian regulations (75). However, a commentary by Liotto (76) suggested that high protein intake by infants, relative to human milk, may alter growth rates and possibly contribute to an increased risk of adiposity and affect renal function. A study of full-term infants in Europe and a subsequent systematic review suggest that protein intake on the lower end or just below the allowable range (~1.7 to 1.8 g/100 kcal) may promote more efficient protein use and a preferred fat-free mass profile, while supporting normal growth (77, 78).
Amino Acid Profiles
Infant formulas in the United States typically consist of bovine casein and whey blends, which are analogous to proteins in human milk. However, the physicochemical properties of the human milk proteins differ from bovine sources. Genetic variants affecting these properties require consideration when formulating infant formula (79, 80). These differences are also apparent in soy protein concentrates/isolates. The respective amino acid profiles and protein quality can influence critical factors such as infant growth and development.
Table 1 depicts amino acid profile differences among bovine casein (at least four types of casein, most of which are A1 and A2 beta-casein), bovine whey, which includes β-lactoglobulin, α-lactalbumin, immunoglobulins, and bovine serum albumin, and typical soy protein isolate (often differs in physicochemical properties). While bovine casein, whey, and soy protein isolates dominate US infant formulas, their amino acid profiles are different than that of human milk. These differences support the need for evaluation of novel protein blends that may improve the amino acid profile and lead to better growth and development outcomes, as well as possibly reduce risks for non-communicable diseases (81, 82).

| Dynamics of Amino Acid Profiles | |||||||||||
|---|---|---|---|---|---|---|---|---|---|---|---|
| Source | His | Ile | Leu | Lys | SAA | AAA | Thr | Trp | Val | ||
| Total | Met | Cys | |||||||||
| (A) Bovine Casein | 26 | 90 | 51 | 75 | 28 | 25 | 3 | 100 | 41 | 13 | 61 |
| (B) Bovine Whey | 16 | 74 | 121 | 109 | 52 | 25 | 27 | 75 | 88 | 17 | 69 |
| (C) Soy Protein Isolate | 27 | 43 | 78 | 65 | 28 | 14 | 14 | 95 | 36 | 10 | 45 |
| (D) Human Milk | 23 | 51 | 94 | 63 | 35 | 14 | 21 | 87 | 43 | 18 | 50 |
| Ratio A:D | 1.13 | 1.76 | 0.54 | 1.19 | 0.80 | 1.79 | 0.14 | 1.15 | 0.95 | 0.72 | 1.22 |
| Ratio B:D | 0.70 | 1.45 | 1.29 | 1.73 | 1.49 | 1.79 | 1.29 | 0.86 | 2.05 | 0.94 | 1.38 |
| Ratio C:D | 1.17 | 0.84 | 0.83 | 1.03 | 0.80 | 1.00 | 0.67 | 1.09 | 0.84 | 0.56 | 0.90 |
* Data presented as mg amino acids per g protein; Bolded font indicates amino acid less than that typically found
in mature human milk.
Protein Quality
In 1994, the FDA adopted the protein digestibility-corrected amino acid score (PDCAAS) method instead of the protein efficiency ratio (PER) to assess protein quality for conventional foods, but not for infant formula (83). The contention was that the PER method, based on ANRC casein, represented the protein requirements for humans when assessed in a rodent model. A recent perspective notes that non-protein nitrogen was not considered in the PER method, which therefore did not reflect the amino acid availability and protein digestibility of human milk (84). When ANRC casein was no longer available, the industry and AOAC International conducted studies to qualify alternative casein standards. In 2023, the FDA announced a draft update for conducting PER studies (85), and AOAC International published an update on the PER method (86).
With respect to PDCAAS, protein digestibility is variable (87). Furthermore, when evaluating protein hydrolysates via PDCAAS, the pre-existing hydrolysis (a process to reduce allergenicity) suggests a lower protein quality than expected (88). This is essential as the international community transitions to the Digestible Indispensable Amino Acid Score (DIAAS), advanced by the FAO in 2013 to replace PDCAAS. This approach is under consideration by the FDA and Health Canada and is considered an improved method for assessing protein quality in complex food matrices (89). However, DIAAS is not without limitations, particularly concerning plant-based diets and the search for New Alternative Methods (NAMs) to reduce animal testing (89, 90).
Micronutrient Considerations in Infant Formula Regulatory Review
Guidance for most micronutrients, such as iron, bone minerals, and trace minerals (except selenium), was set pursuant to the 1980 IFA. Many of these values were based on limited experimental data and were primarily established through estimates of physiological requirements and human milk intake. A large body of evidence has since accumulated, making it appropriate to reevaluate these values and establish maximum intake levels where none existed before. This includes establishing maximum concentrations for calcium and phosphorus.
Of most significant importance is the re-evaluation of guidance related to the iron content of infant formulas. As we have recently reviewed in detail, and as also reviewed by EFSA and others, available data suggest that the maximum iron allowed in US infant formula (3.0 mg/100 kcal, 20 mg/L) is too high (91-94). The usual intake in nearly all US formulas (12 mg/L, 1.8 mg/100 kcal) is far above the maximum set by EFSA of 1.3 mg/100 kcal and is at a level where substantial data suggest a greater risk of harm than benefit. The US maximum should be reduced to no more than 10 mg/L (about 1.5 mg/100 kcal) and consideration should be given to matching the EFSA limit of 8.7 mg/L (1.3 mg/100 kcal) (91), but also to indicate that this value should be the average of analyzed samples, not the lowest found in any sample. This would reduce the need for companies to have an overage during production while targeting 8 mg/L as a usual label goal.
The IFA does not specify maximum values for calcium or phosphorus in infant formulas. In the US minimum, the minimum calcium 60 mg/100 kcal and the minimum phosphorus is 30 mg/100 kcal. The molar calcium to phosphorus ratio must be not <1.1 and not >2.0. In contrast human milk calcium is 31-46/100 kcal. The molar ratio of calcium to phosphorus is about 1.6:1 Although EFSA also does not set a maximum for these nutrients, they are set by CODEX which has a calcium maximum 140 mg/100 kcal and phosphorus maximum 100 mg/100 kcal.
Although calcium bioavailability is likely higher in HM than formula, this has not been tested at the same concentration and actual differences may be minor. This is especially important as human milk phosphorus is often 15-20 mg/100 kcal and this low level is protective against late hypocalcemic tetany. Overall, it is likely that although there is no substantial risk due to excess calcium or phosphorus in infant formula, the CODEX guidance to set maximum levels for these alongside the ratio of the two should be considered especially given their use in smaller full-term infants and early in life.
Conclusions
The nutritional value of infant formula is dependent on an array of components, including fat, carbohydrate, protein and micronutrients. Nearly 30 years ago, the infant formula industry added DHA (docosahexaenoic acid) and ARA (arachidonic acid) to their products, yet the FDA has yet to establish minimum and maximum levels of these fatty acids. Regardless, the industry has attempted to mimic the ratio of these fatty acids relative to human milk composition while relying on emerging scientific evidence related to health benefits. Regarding carbohydrate moieties, lactose is the dominate sugar in human milk, followed by human milk oligosaccharides. However, most infant formulas contain other carbohydrates, such as corn syrup solids, sucrose and maltodextrins which are not present in breastmilk, and emerging evidence indicates adverse effects on infant outcomes including increased risk for obesity.
More than 20 years ago, the formula industry introduced oligosaccharides that are found in human milk to potentially improve immune function and gut flora of infants. Although limited in number these may be important for health and those included represent a small proportion of the over 200 unique carbohydrates in human milk. More research is needed to identify the optimal mix of these oligosaccharides to optimize outcomes. However, they are currently not required by regulation and are not found for example in many formulas such as those used by government programs. In terms of micronutrients these should be reassessed and consideration given to align standards more closely with global standards, especially for iron.
Overall, infant formula is a healthy product and has many decades of successfully feeding infants. Nutrient related updates in regulatory guidance can improve the products consistent with the latest science.
Financial Support
JTB has received honoraria or travel funds from the Global Organization for EPA and DHA, the global dairy platform, Danone, and research support from the National Cattlemen's Beef Association. MIG has previously served as a scientific advisor for Begin Health and Bobbi. VC has served on the Speaker’s Bureau for Nutricia and Abbott Nutrition. Authors have no additional financial support to declare.
Acknowledgments
All authors have read and approved the final manuscript.
Abbreviations
Amino Acid-Based Formulas (AAF)
Adverse outcome pathways (AOP)
Agent-based modeling (ABM)
American Academy of Pediatrics (AAP)
Alpha linolenic acid (ALA)
Arachidonic acid (ARA)
Cow’s Milk Protein Allergy (CMPA)
Docosahexaenoic acid (DHA)
Eicosapentaenoic acid (EPA)
European Food Safety Authority (EFSA)
European Union (EU)
Extensively Hydrolyzed Formulas (EHF)
Food and Agriculture Organization (FAO)
Food and Drug Administration (FDA)
Generally recognized as safe (GRAS)
High-throughput kinetics (HTK)
High-throughput screening (HTS)
Human Milk Fortifier (HMF)
Infant Formula Act (IFA)
Linoleic acid (LA)
Long chain polyunsaturated fatty acids (LCPUFA)
Live biotherapeutic products (LBPs)
Microphysiological systems (MPS)
Necrotizing enterocolitis (NEC)
Neonatal intensive care unit (NICU)
New Approach Methods (NAMs)
National Institutes of Health (NIH)
Polyunsaturated fatty acids (PUFA)
Structure-activity relationships (SAR)
United States Environmental Protection Agency (USEPA)
World Health Organization (WHO)
References
- US Dept of Health and Human Services. Operation Stork: Speeding up the process to bring infant formula to the U.S 2025. Available from: https://www.hhs.gov/about/news/operation-stork-speed.html Accessed July 28,2025.
- Kirchner L. We tested 41 Baby Formulas for Lead and Arsenic Consumer Reports. 2025.
- Video of FDA panel on infant formula, June 4, 2025 https://www.youtube.com/live/MmE6rlMJdwA). Accessed July 28, 2025.
- Porter D. Infant Formula: National Problems. In: Service CR, editor. Washington, DC: Library of Congress; 1984.
- Levy JS, Roy S, Hutcheson Jr RH, Gruskin AB, Hellerstein S, Linshaw M et al. Infant Metabolic Alkalosis and Soy-Based Formula -- United States. Morbidity and Mortality Weekly Report. 1979;28:358-9.
- Willoughby A, Moss HA, Hubbard VS, Bercu BB, Graubard BI, Vietze PM et al. Developmental outcome in children exposed to chloride-deficient formula. Pediatrics. 1987 Jun;79(6):851-7. [CrossRef]
- Malloy MH, Graubard B, Moss H, McCarthy M, Gwyn S, Vietze P et al. Hypochloremic metabolic alkalosis from ingestion of a chloride-deficient infant formula: outcome 9 and 10 years later. Pediatrics. 1991 Jun;87(6):811-22. [CrossRef]
- Kruse J, Foreman M, Denny S. US Seed Oil Ban Scenario. A scenario off the November 2024 baseline. World Agricultural Economic and Environmental Services, 2025.
- Keefe DM. GRN No. 553. Algal oil (40% docosahexaenoic acid) derived from Schizochytrium sp. In: CSFAN FDA_HHS, editor. Washington, DC2015.
- Carlson SE, Schipper L, Brenna JT, Agostoni C, Calder PC, Forsyth S et al. Perspective: Moving Toward Desirable Linoleic Acid Content in Infant Formula. Adv Nutr. 2021 Dec 1;12(6):2085-98. [CrossRef]
- Einerhand AWC, Mi W, Haandrikman A, Sheng XY, Calder PC. The Impact of Linoleic Acid on Infant Health in the Absence or Presence of DHA in Infant Formulas. Nutrients. 2023 May 4;15(9). [CrossRef]
- Udell T, Gibson RA, Makrides M, Group PS. The effect of alpha-linolenic acid and linoleic acid on the growth and development of formula-fed infants: a systematic review and meta-analysis of randomized controlled trials. Lipids. 2005 Jan;40(1):1-11. [CrossRef]
- Brenna JT. Arachidonic acid needed in infant formula when docosahexaenoic acid is present. Nutr Rev. 2016 May;74(5):329-36. [CrossRef]
- Crawford MA, Wang Y, Forsyth S, Brenna JT. New European Food Safety Authority recommendation for infant formulae contradicts the physiology of human milk and infant development. Nutr Health. 2013 Apr;22(2):81-7. [CrossRef]
- Koletzko B, Bergmann K, Brenna JT, Calder PC, Campoy C, Clandinin MT et al. Should formula for infants provide arachidonic acid along with DHA? A position paper of the European Academy of Paediatrics and the Child Health Foundation. Am J Clin Nutr. 2020 Jan 1;111(1):10-6. [CrossRef]
- Hadley KB, Ryan AS, Forsyth S, Gautier S, Salem N, Jr. The Essentiality of Arachidonic Acid in Infant Development. Nutrients. 2016 Apr 12;8(4):216. [CrossRef]
- Tounian P, Bellaiche M, Legrand P. ARA or no ARA in infant formulae, that is the question. Arch Pediatr. 2021 Jan;28(1):69-74. [CrossRef]
- Cunnane SC, Francescutti V, Brenna JT. Docosahexaenoate requirement and infant development. Nutrition. 1999 Oct;15(10):801-2.
- Saldanha LG, Salem N, Jr., Brenna JT. Workshop on DHA as a required nutrient: overview. Prostaglandins, leukotrienes, and essential fatty acids. 2009 Aug-Sep;81(2-3):233-6. [CrossRef]
- Brenna JT, Lapillonne A. Background paper on fat and fatty acid requirements during pregnancy and lactation. Ann Nutr Metab. 2009;55(1-3):97-122. [CrossRef]
- Astrup AV, Bazinet RP, Brenna JT, Calder PC, Crawford MA, Dangour AD et al. Fats and fatty acids in human nutrition. Report of an expert consultation. Food and Agriculture Organization of the United Nations, 2010.
- Fan L, Wang X, Szeto IM, Liu B, Sinclair AJ, Li D. Dietary intake of different ratios of ARA/DHA in early stages and its impact on infant development. Food Funct. 2024 Apr 2;15(7):3259-73. [CrossRef]
- Tian A, Xu L, Szeto IM, Wang X, Li D. Effects of Different Proportions of DHA and ARA on Cognitive Development in Infants: A Meta-Analysis. Nutrients. 2025 Mar 20;17(6). [CrossRef]
- Ni X, Zhang Z, Deng Z, Li J. Optimizing ARA and DHA in infant formula: A systematic review of global trends, regional disparities, and considerations for precision nutrition. Food Res Int. 2024 Apr;182:114049. [CrossRef]
- Yuhas R, Pramuk K, Lien EL. Human milk fatty acid composition from nine countries varies most in DHA. Lipids. 2006 Sep;41(9):851-8. [CrossRef]
- Jensen RG. Handbook of Human Milk Composition. New York: Academic Press; 1995.
- Martin JC, Bougnoux P, Antoine JM, Lanson M, Couet C. Triacylglycerol structure of human colostrum and mature milk. Lipids. 1993 Jul;28(7):637-43. [CrossRef]
- Innis SM, Dyer R, Nelson CM. Evidence that palmitic acid is absorbed as sn-2 monoacylglycerol from human milk by breast-fed infants. Lipids. 1994 Aug;29(8):541-5.
- Yli-Jokipii KM, Schwab US, Tahvonen RL, Kurvinen JP, Mykkanen HM, Kallio HP. Chylomicron and VLDL TAG structures and postprandial lipid response induced by lard and modified lard. Lipids. 2003 Jul;38(7):693-703. [CrossRef]
- Parodi PW. Positional distribution of fatty acids in triglycerides from milk of several species of mammals. Lipids. 1982 Jun;17(6):437-42. [CrossRef]
- Brenna JT, Kothapalli KSD. New understandings of the pathway of long-chain polyunsaturated fatty acid biosynthesis. Curr Opin Clin Nutr Metab Care. 2022 Mar 1;25(2):60-6. [CrossRef]
- Holman RT, editor. A Long Scaly Tale - The Study of Essential Fatty Acid Deficiency at the University of Minnesota. Essential Fatty Acids and Eicosanoids Invited Papers from the Third International Congress; 1992; Adelaide, South Australia, Australia: American Oil Chemist Society.
- Hansen AE, Haggard ME, Boelsche AN, Adam DJ, Wiese HF. Essential fatty acids in infant nutrition. III. Clinical manifestations of linoleic acid deficiency. J Nutr. 1958 Dec 10;66(4):565-76.
- Hansen AE, Wiese HF, Boelsche AN, Haggard ME, Adam DJ, Davis H. Role of Linoleic Acid in Infant Nutrition: Clinical and Chemical Study of 428 Infants Fed on Milk Mixtures Varying in Kind and Amount of Fat. Pediatrics. 1963;31(1):171-92.
- Hansen HS. Essentiality of n-6 fatty acids. J Biol Chem. 2019 Apr 26;294(17):6692.
- Carlson SJ, O'Loughlin AA, Anez-Bustillos L, Baker MA, Andrews NA, Gunner G et al. A Diet With Docosahexaenoic and Arachidonic Acids as the Sole Source of Polyunsaturated Fatty Acids Is Sufficient to Support Visual, Cognitive, Motor, and Social Development in Mice. Front Neurosci. 2019;13:72. [CrossRef]
- Hansen HS, Jensen B, von Wettstein-Knowles P. Apparent in vivo retroconversion of dietary arachidonic to linoleic acid in essential fatty acid-deficient rats. Biochim Biophys Acta. 1986 Sep 12;878(2):284-7. [CrossRef]
- Clandinin MT, Chappell JE, Leong S, Heim T, Swyer PR, Chance GW. Extrauterine fatty acid accretion in infant brain: implications for fatty acid requirements. Early Hum Dev. 1980;4(2):131-8. [CrossRef]
- Carlson SE, Werkman SH, Peeples JM, Cooke RJ, Tolley EA. Arachidonic acid status correlates with first year growth in preterm infants. Proc Natl Acad Sci USA. 1993;90:1073-7. [CrossRef]
- Martinez M. Tissue levels of polyunsaturated fatty acids during early human development. J Pediatr. 1992 Apr;120(4 Pt 2):S129-38. [CrossRef]
- Carver JD, Benford VJ, Han B, Cantor AB. The relationship between age and the fatty acid composition of cerebral cortex and erythrocytes in human subjects. Brain Res Bull. 2001 Sep 15;56(2):79-85. [CrossRef]
- Hoffman DR, Birch EE, Birch DG, Uauy RD. Effects of supplementation with omega 3 long-chain polyunsaturated fatty acids on retinal and cortical development in premature infants. Am J Clin Nutr. 1993 May;57(5 Suppl):807S-12S. [CrossRef]
- Morale SE, Hoffman DR, Castaneda YS, Wheaton DH, Burns RA, Birch EE. Duration of long-chain polyunsaturated fatty acids availability in the diet and visual acuity. Early Hum Dev. 2005 Feb;81(2):197-203. [CrossRef]
- Brenna JT. Long-chain polyunsaturated fatty acids and the preterm infant: a case study in developmentally sensitive nutrient needs in the United States. Am J Clin Nutr. 2016 Feb;103(2):606S-15S. [CrossRef]
- Neuringer M, Connor WE, Van Petten C, Barstad L. Dietary omega-3 fatty acid deficiency and visual loss in infant rhesus monkeys. J Clin Invest. 1984;73(1):272-6. [CrossRef]
- Neuringer M, Connor WE, Lin DS, Barstad L, Luck S. Biochemical and functional effects of prenatal and postnatal omega 3 fatty acid deficiency on retina and brain in rhesus monkeys. Proc Natl Acad Sci U S A. 1986 Jun;83(11):4021-5. [CrossRef]
- Sarkadi-Nagy E, Huang MC, Diau GY, Kirwan R, Chueh Chao A, Tschanz C et al. Long chain polyunsaturate supplementation does not induce excess lipid peroxidation of piglet tissues. Eur J Nutr. 2003 Oct;42(5):293-6. [CrossRef]
- Strzalkowski AJ, Jarvinen KM, Schmidt B, Young BE. Protein and carbohydrate content of infant formula purchased in the United States. Clin Exp Allergy. 2022 Nov;52(11):1291-301. [CrossRef]
- Larson-Nath C, Bashir A, Herdes RE, Kiernan B, Lai J, Martin N et al. Term infant formula macronutrient composition: An update for clinicians. Journal of pediatric gastroenterology and nutrition. 2025 May;80(5):751-9. [CrossRef]
- DiMaggio DM, Abersone I, Porto AF. Infant consumption of 100% lactose-based and reduced lactose infant formula in the United States: Review of NHANES data from 1999 to 2020. Journal of pediatric gastroenterology and nutrition. 2024 Nov;79(5):1017-23. [CrossRef]
- Heyman MB, Committee on N. Lactose intolerance in infants, children, and adolescents. Pediatrics. 2006 Sep;118(3):1279-86.
- Abrams SA, Griffin IJ, Davila PM. Calcium and zinc absorption from lactose-containing and lactose-free infant formulas. Am J Clin Nutr. 2002 Aug;76(2):442-6. [CrossRef]
- Heubi J, Karasov R, Reisinger K, Blatter M, Rosenberg L, Vanderhoof J et al. Randomized multicenter trial documenting the efficacy and safety of a lactose-free and a lactose-containing formula for term infants. J Am Diet Assoc. 2000 Feb;100(2):212-7. [CrossRef]
- Moya M, Lifschitz C, Ameen V, Euler AR. A metabolic balance study in term infants fed lactose-containing or lactose-free formula. Acta Paediatr. 1999 Nov;88(11):1211-5. [CrossRef]
- Hampson HE, Jones RB, Berger PK, Plows JF, Schmidt KA, Alderete TL et al. Adverse Effects of Infant Formula Made with Corn-Syrup Solids on the Development of Eating Behaviors in Hispanic Children. Nutrients. 2022 Mar 7;14(5). [CrossRef]
- Griebel-Thompson AK, Fazzino TL, Cramer E, Paluch RA, Morris KS, Kong KL. Early exposure to added sugars via infant formula may explain high intakes of added sugars during complementary feeding beyond maternal modeling. Front Nutr. 2023;10:1188852. [CrossRef]
- Anderson CE, Whaley SE, Goran MI. Lactose-reduced infant formula with corn syrup solids and obesity risk among participants in the Special Supplemental Nutrition Program for Women, Infants, and Children (WIC). Am J Clin Nutr. 2022 Oct 6;116(4):1002-9. [CrossRef]
- Jones RB, Berger PK, Plows JF, Alderete TL, Millstein J, Fogel J et al. Lactose-reduced infant formula with added corn syrup solids is associated with a distinct gut microbiota in Hispanic infants. Gut Microbes. 2020 Nov 9;12(1):1813534. [CrossRef]
- Bode L. Human milk oligosaccharides: every baby needs a sugar mama. Glycobiology. 2012 Sep;22(9):1147-62. [CrossRef]
- Dinleyici M, Barbieur J, Dinleyici EC, Vandenplas Y. Functional effects of human milk oligosaccharides (HMOs). Gut Microbes. 2023 Jan-Dec;15(1):2186115. [CrossRef]
- Berger PK, Bansal R, Sawardekar S, Yonemitsu C, Furst A, Hampson HE et al. Associations of Human Milk Oligosaccharides with Infant Brain Tissue Organization and Regional Blood Flow at 1 Month of Age. Nutrients. 2022 Sep 16;14(18). [CrossRef]
- Ottino-Gonzalez J, Adise S, Machle CJ, Mokhtari P, Holzhausen EA, Furst A et al. Consumption of different combinations of human milk oligosaccharides in the first 6 mo of infancy is positively associated with early cognition at 2 y of age in a longitudinal cohort of Latino children. Am J Clin Nutr. 2024 Sep;120(3):593-601. [CrossRef]
- Moughan PJ, Deglaire A, Yan Y, Wescombe P, Lim WXJ, Stroebinger N et al. Amino acid requirements of the infant: the amino acid composition of human breast milk. Front Nutr. 2024;11:1446565. [CrossRef]
- Duffy B, Gunn T, Collinge J, Pencharz P. The effect of varying protein quality and energy intake on the nitrogen metabolism of parenterally fed very low birthweight (less than 1600 g) infants. Pediatr Res. 1981 Jul;15(7):1040-4. [CrossRef]
- Grummer-Strawn LM, Reinold C, Krebs NF, Centers for Disease C, Prevention. Use of World Health Organization and CDC growth charts for children aged 0-59 months in the United States. MMWR Recomm Rep. 2010 Sep 10;59(RR-9):1-15.
- Arnesen EK, Thorisdottir B, Lamberg-Allardt C, Barebring L, Nwaru B, Dierkes J et al. Protein intake in children and growth and risk of overweight or obesity: A systematic review and meta-analysis. Food Nutr Res. 2022;66. [CrossRef]
- Stokes A, Campbell KJ, Yu HJ, Szymlek-Gay EA, Abbott G, He QQ et al. Protein Intake from Birth to 2 Years and Obesity Outcomes in Later Childhood and Adolescence: A Systematic Review of Prospective Cohort Studies. Adv Nutr. 2021 Oct 1;12(5):1863-76. [CrossRef]
- Abrams SA, Hawthorne KM, Pammi M. A systematic review of controlled trials of lower-protein or energy-containing infant formulas for use by healthy full-term infants. Adv Nutr. 2015 Mar;6(2):178-88. [CrossRef]
- Koletzko B, von Kries R, Closa R, Escribano J, Scaglioni S, Giovannini M et al. Can infant feeding choices modulate later obesity risk? Am J Clin Nutr. 2009 May;89(5):1502S-8S.
- Koletzko B, Baker S, Cleghorn G, Neto UF, Gopalan S, Hernell O et al. Global standard for the composition of infant formula: recommendations of an ESPGHAN coordinated international expert group. Journal of pediatric gastroenterology and nutrition. 2005 Nov;41(5):584-99. [CrossRef]
- Kuczmarski RJ, Ogden CL, Grummer-Strawn LM, Flegal KM, Guo SS, Wei R et al. CDC growth charts: United States. Adv Data. 2000 Jun 8(314):1-27.
- Appleton J, Russell CG, Laws R, Fowler C, Campbell K, Denney-Wilson E. Infant formula feeding practices associated with rapid weight gain: A systematic review. Matern Child Nutr. 2018 Jul;14(3):e12602. [CrossRef]
- Koletzko B, von Kries R, Closa R, Escribano J, Scaglioni S, Giovannini M et al. Lower protein in infant formula is associated with lower weight up to age 2 y: a randomized clinical trial. Am J Clin Nutr. 2009 Jun;89(6):1836-45. [CrossRef]
- Codex Alimentarius. Standard for Infant Formula and Formulas for Special Medical Purposes Intended for Infants. Codex Stan, 2007.
- Health Canada. Proposed compositional requirements for infant foods and foods currently regulated as foods for special dietary use. 2025.
- Liotto N. Protein content of infant formula for the healthy full-term infant. Am J Clin Nutr. 2020 May 1;111(5):946-7. [CrossRef]
- Kouwenhoven SMP, Antl N, Finken MJJ, Twisk JWR, van der Beek EM, Abrahamse-Berkeveld M et al. A modified low-protein infant formula supports adequate growth in healthy, term infants: a randomized, double-blind, equivalence trial. Am J Clin Nutr. 2020 May 1;111(5):962-74. [CrossRef]
- Liotto N, Orsi A, Menis C, Piemontese P, Morlacchi L, Condello CC et al. Clinical evaluation of two different protein content formulas fed to full-term healthy infants: a randomized controlled trial. BMC Pediatr. 2018 Feb 13;18(1):59. [CrossRef]
- Gai N, Uniacke-Lowe T, O'Regan J, Faulkner H, Kelly AL. Effect of Protein Genotypes on Physicochemical Properties and Protein Functionality of Bovine Milk: A Review. Foods. 2021 Oct 11;10(10). [CrossRef]
- Meng F, Uniacke-Lowe T, Ryan AC, Kelly AL. The composition and physico-chemical properties of human milk: A review. Trends Food Sci Technol. 2021;112:608-21. [CrossRef]
- Baker RD, Merritt RJ. Welcome to a New Infant Formula. Journal of pediatric gastroenterology and nutrition. 2022 Oct 1;75(4):389-90. [CrossRef]
- Tinghall Nilsson U, Hernell O, Lonnerdal B, Hartvigsen ML, Jacobsen LN, Kvistgaard AS et al. Low-Protein Formulas with Alpha-Lactalbumin-Enriched or Glycomacropeptide-Reduced Whey: Effects on Growth, Nutrient Intake and Protein Metabolism during Early Infancy: A Randomized, Double-Blinded Controlled Trial. Nutrients. 2023 Feb 17;15(4). [CrossRef]
- Federal_Register. Alternate Foods for Meals: Enriched Macaroni Products with Fortified Protein; National School Lunch Program. Federal Register 59(194) Docket No 1994 October 7. 1004; 94-24902.
- Wallingford JC. Perspective: Assuring the Quality of Protein in Infant Formula. Adv Nutr. 2023 Jul;14(4):585-91. [CrossRef]
- Federal_Register. Protein Efficiency Ratio Rat Bioassay Studies to Demonstrate that a New Infant Formula Supports the Quality Factor of Sufficient Biological Quality of Protein. Draft Guidance for Industry. Federal Register Docket No 2023 February 10, 2023;2023-02836. 88 FR 8868:8868-72.
- AOAC. AOAC Official Method 982.30. Protein Efficiency Ratio: Calculation Method. In: Latimer J, G.W., editor. Official Methods of Analysis of AOAC INTERNATIONAL. 22 ed. New York: AOAC Publications; 2023.
- Boye J, Wijesinha-Bettoni R, Burlingame B. Protein quality evaluation twenty years after the introduction of the protein digestibility corrected amino acid score method. Br J Nutr. 2012 Aug;108 Suppl 2:S183-211. [CrossRef]
- Moughan PJ, Lim WXJ. Digestible indispensable amino acid score (DIAAS): 10 years on. Front Nutr. 2024;11:1389719. [CrossRef]
- Craddock JC, Genoni A, Strutt EF, Goldman DM. Limitations with the Digestible Indispensable Amino Acid Score (DIAAS) with Special Attention to Plant-Based Diets: a Review. Curr Nutr Rep. 2021 Mar;10(1):93-8. [CrossRef]
- USFDA. FDA Roadmap to Reducing Animal Testing in Preclinical Safety Studies, . [July 13, 2025 ]; Available from: https://www.fda.gov/media/187092. Accessed Aug 1, 2025.
- EFSA Panel on Nutrition NF, Food A, Turck D, Bohn T, Castenmiller J, de Henauw S et al. Scientific opinion on the tolerable upper intake level for iron. EFSA J. 2024 Jun;22(6):e8819.
- S. Gahagan, E. Delker, E. Blanco, R. Burrows, B. Lozoff, Randomized controlled trial of Iron-Fortified versus Low-Iron Infant Formula: developmental Outcomes at 16 years, J Pediatr 212 (2019) 124–130, e1. [CrossRef]
- M. Domellöf, C. Braegger, C. Campoy, V. Colomb, T. Decsi, M. Fewtrell, et al., Iron requirements of infants and toddlers. J Pediatr Gastroenterol Nutr. 2014. 58 (1):119–129. doi: 10.5167/uzh-106040. [CrossRef]
- Codex Alimentarius https://www.fao.org/fao-who-codexalimentarius/en/ accessed August 1, 2025.
Figure 1.
Visual acuity at 52 wk of age as measured by sweep VEP (logMAR). Data are drawn from four RCTs in human infants conducted in one laboratory and published 1998–2005. The corresponding Snellen acuities are indicated. Infants who had formula with no LC-PUFAs (○) are plotted at 0 wk; others at durations of LC-PUFAs from formula or human milk or both (□, ●, ■, as indicated). Values are means ± SEMs; n = 15–40/group. Longer exposure to LC-PUFAs yielded improved visual acuity at 52 wk of age, reflecting accelerated neural development. Modified from reference 44 with permission. logMAR, log of the minimum angle of resolution; VEP, visually evoked potential. Reprinted by permission.
Disclaimer/Publisher’s Note: The statements, opinions and data contained in all publications are solely those of the individual author(s) and contributor(s) and not of MDPI and/or the editor(s). MDPI and/or the editor(s) disclaim responsibility for any injury to people or property resulting from any ideas, methods, instructions or products referred to in the content. |
© 2025 by the authors. Licensee MDPI, Basel, Switzerland. This article is an open access article distributed under the terms and conditions of the Creative Commons Attribution (CC BY) license (http://creativecommons.org/licenses/by/4.0/).
Copyright: This open access article is published under a Creative Commons CC BY 4.0 license, which permit the free download, distribution, and reuse, provided that the author and preprint are cited in any reuse.


