Submitted:
03 August 2025
Posted:
04 August 2025
You are already at the latest version
Abstract
This study aimed to describe the computed tomographic (CT) dimensions and contrast attenuation characteristics of the eye in cross-breed horses. CT images from 20 horses without ocular abnormalities were analyzed to assess ocular measurements and attenuation values. The incorporation of cranial measurements, such as nasal-occipital length and zygomatic width, provided a novel insight into the anatomical relationship between the skull and intraocular structures. While most correlations between cranial and ocular parameters were weak, statistically significant associations—particularly involving lens dimensions and anterior chamber measurements—suggest that skull morphology may exert a subtle influence on ocular anatomy.
Keywords:
computed tomography
; ocular morphometry
; head morphometry
; horses
1. Introduction
In daily equine veterinary practice, ophthalmologic consultations are becoming increasingly relevant. Ocular issues in horses can affect their performance, well-being, and quality of life, making early diagnosis and appropriate treatment essential [1]. The growing awareness of the importance of equine eye health has led to an increased demand for ophthalmologic examinations in routine clinical practice. In this context, equine ophthalmology is becoming a key area of interest within veterinary medicine, looking for updated knowledge and improved diagnostic and therapeutic tools, such as imaging techniques [10]. Advancements in technology and treatment options have improved the prognosis for many equine eye diseases. However, continuous training remains crucial for veterinarians to manage these conditions effectively.
Currently, equine ophthalmologic evaluation has become increasingly prominent. Ultrasonography facilitates the identification and assessment of ocular structures, including the anterior chamber, iris, ciliary body, lens, vitreous body, retina, sclera, optic disc and optic nerve [3]. Advanced imaging diagnostic techniques, such as magnetic resonance imaging (MRI) and computed tomography (CT), are excellent imaging modalities to complete the diagnostic procedure and assess the most appropriate treatment. While MRI allows better soft tissue imaging and contrast resolution than CT, it provides relevant evaluation of the orbital cortical bone, using less time than the MR scan [4]. Hence, the use of CT is quite helpful for understanding variations in ocular measurements, which is not only beneficial for diagnosis but can be used in treatment or to provide the horse with the appropriate surgical approach [5]. To date, several procedures have been used, including ultrasound imaging, ophthalmometer, and retinoscopy to measure the equine eye [6]. However, these instruments do not provide all the necessary information for proper diagnosis and treatment.
In recent years, computed tomography (CT) has been increasingly used to assess various ocular structures across a range of species, including horses [5], dogs [7], cats [8], sea turtles [9], puffins [10], and even extinct species [11]. In horses, previous studies have reported CT-based measurements of different ocular components across various breeds, establishing reference values relative to body weight [5]. However, none of these studies have explored potential associations between ocular dimensions and visual function, nor have they considered cranial morphology as a contributing factor. Therefore, this study aimed to characterise the CT features of the normal equine eye by establishing reference values for the dimensions, volumes, and radiodensities of ocular structures, and to evaluate potential correlations between these parameters and skull measurements.
2. Materials and Methods
Animals
The study population consisted mainly of twenty crossbreed horse cadavers of different ages, all of which had been evaluated by a certified ophthalmologist and showed no history or clinical signs of ocular abnormalities. Horses were excluded from this investigation if they presented any history, clinical, or radiological evidence of ocular or retrobulbar disease, as well as any obvious pathology affecting the caudal maxillary sinus or orbit. Since the study was conducted exclusively on cadaveric specimens, we did not require approval from the animal welfare committee. However, informed consent was obtained from the owners, who were made aware that all data derived from the animals would be handled confidentially, in accordance with applicable laws, and used solely for research or educational purposes.
CT Technique
CT scans of the skulls were conducted on previously frozen specimens following a 12-hour thawing period at ambient temperature. Sequential images were obtained using a 16-slice helical CT scanner (Toshiba Astelion, Canon Medical System, Tokyo, Japan). Each head was positioned symmetrically in a prone position on the examination table, with rostrocaudal orientation. A standard clinical scanning protocol was applied, using the following parameters: 120 kVp, 80 mA, a 512 × 512 acquisition matrix, a 1809 × 858 field of view, a pitch of 0.94, and a gantry rotation of 1.5 seconds. Images were acquired with a slice thickness of 0.6 mm in dorsal, transverse, and sagittal planes in bone and soft tissue reconstruction algorithms. All images’ datasets were subsequently imported to an image viewer (OsiriX MD, Apple, Cupertino, CA, USA) for visualisation, manipulation, and morphometric measurements of the equine eyeball and orbit.
Measurements
Manual contouring on every slice of the CT images was performed by a single examiner, with contours for the eyeball and the lens generated for both eyes in each patient. Measurements for the intraocular distances were calculated by the same single examiner in all patients. The measurement approach followed the protocol outlined in previous studies conducted on dogs and cats [7,8], the loggerhead turtle [9], the puffin [10], and horses [5]. Cranial measurements, including head length, head width, and orbital depth, were performed [12]. Additionally, both eyes (n= 40) were evaluated using CT images reconstructed in oblique sagittal, transverse, and dorsal planes for all animals. Image assessment was carried out using a soft tissue window setting to enhance the contrast of non-osseous structures. The specific parameters and dimensions obtained are detailed below:
- Orbital cavity height: Maximal dorsoventral distance of the orbital cavity at the level of the eyeball.
- Anterior chamber, posterior chamber, and lens densities: Attenuation values measured by placing regions of interest (ROIs) centrally in each structure (Figure 3).
- Eyeball rostrocaudal length: Maximal anteroposterior distance of the eyeball from the internal surface of the cornea to the internal surface of the choroid/retina/sclera (Figure 4A).
- Orbital cavity rostrocaudal length: Maximal anteroposterior distance of the orbital cavity measured at the level of the eyeball.
- Lens rostrocaudal length: Maximum anteroposterior distance of the lens measured along its midline (Figure 4B).
- Anterior and posterior chambers width: Maximal lateromedial distance across the anterior and posterior chambers. (Figure 5)
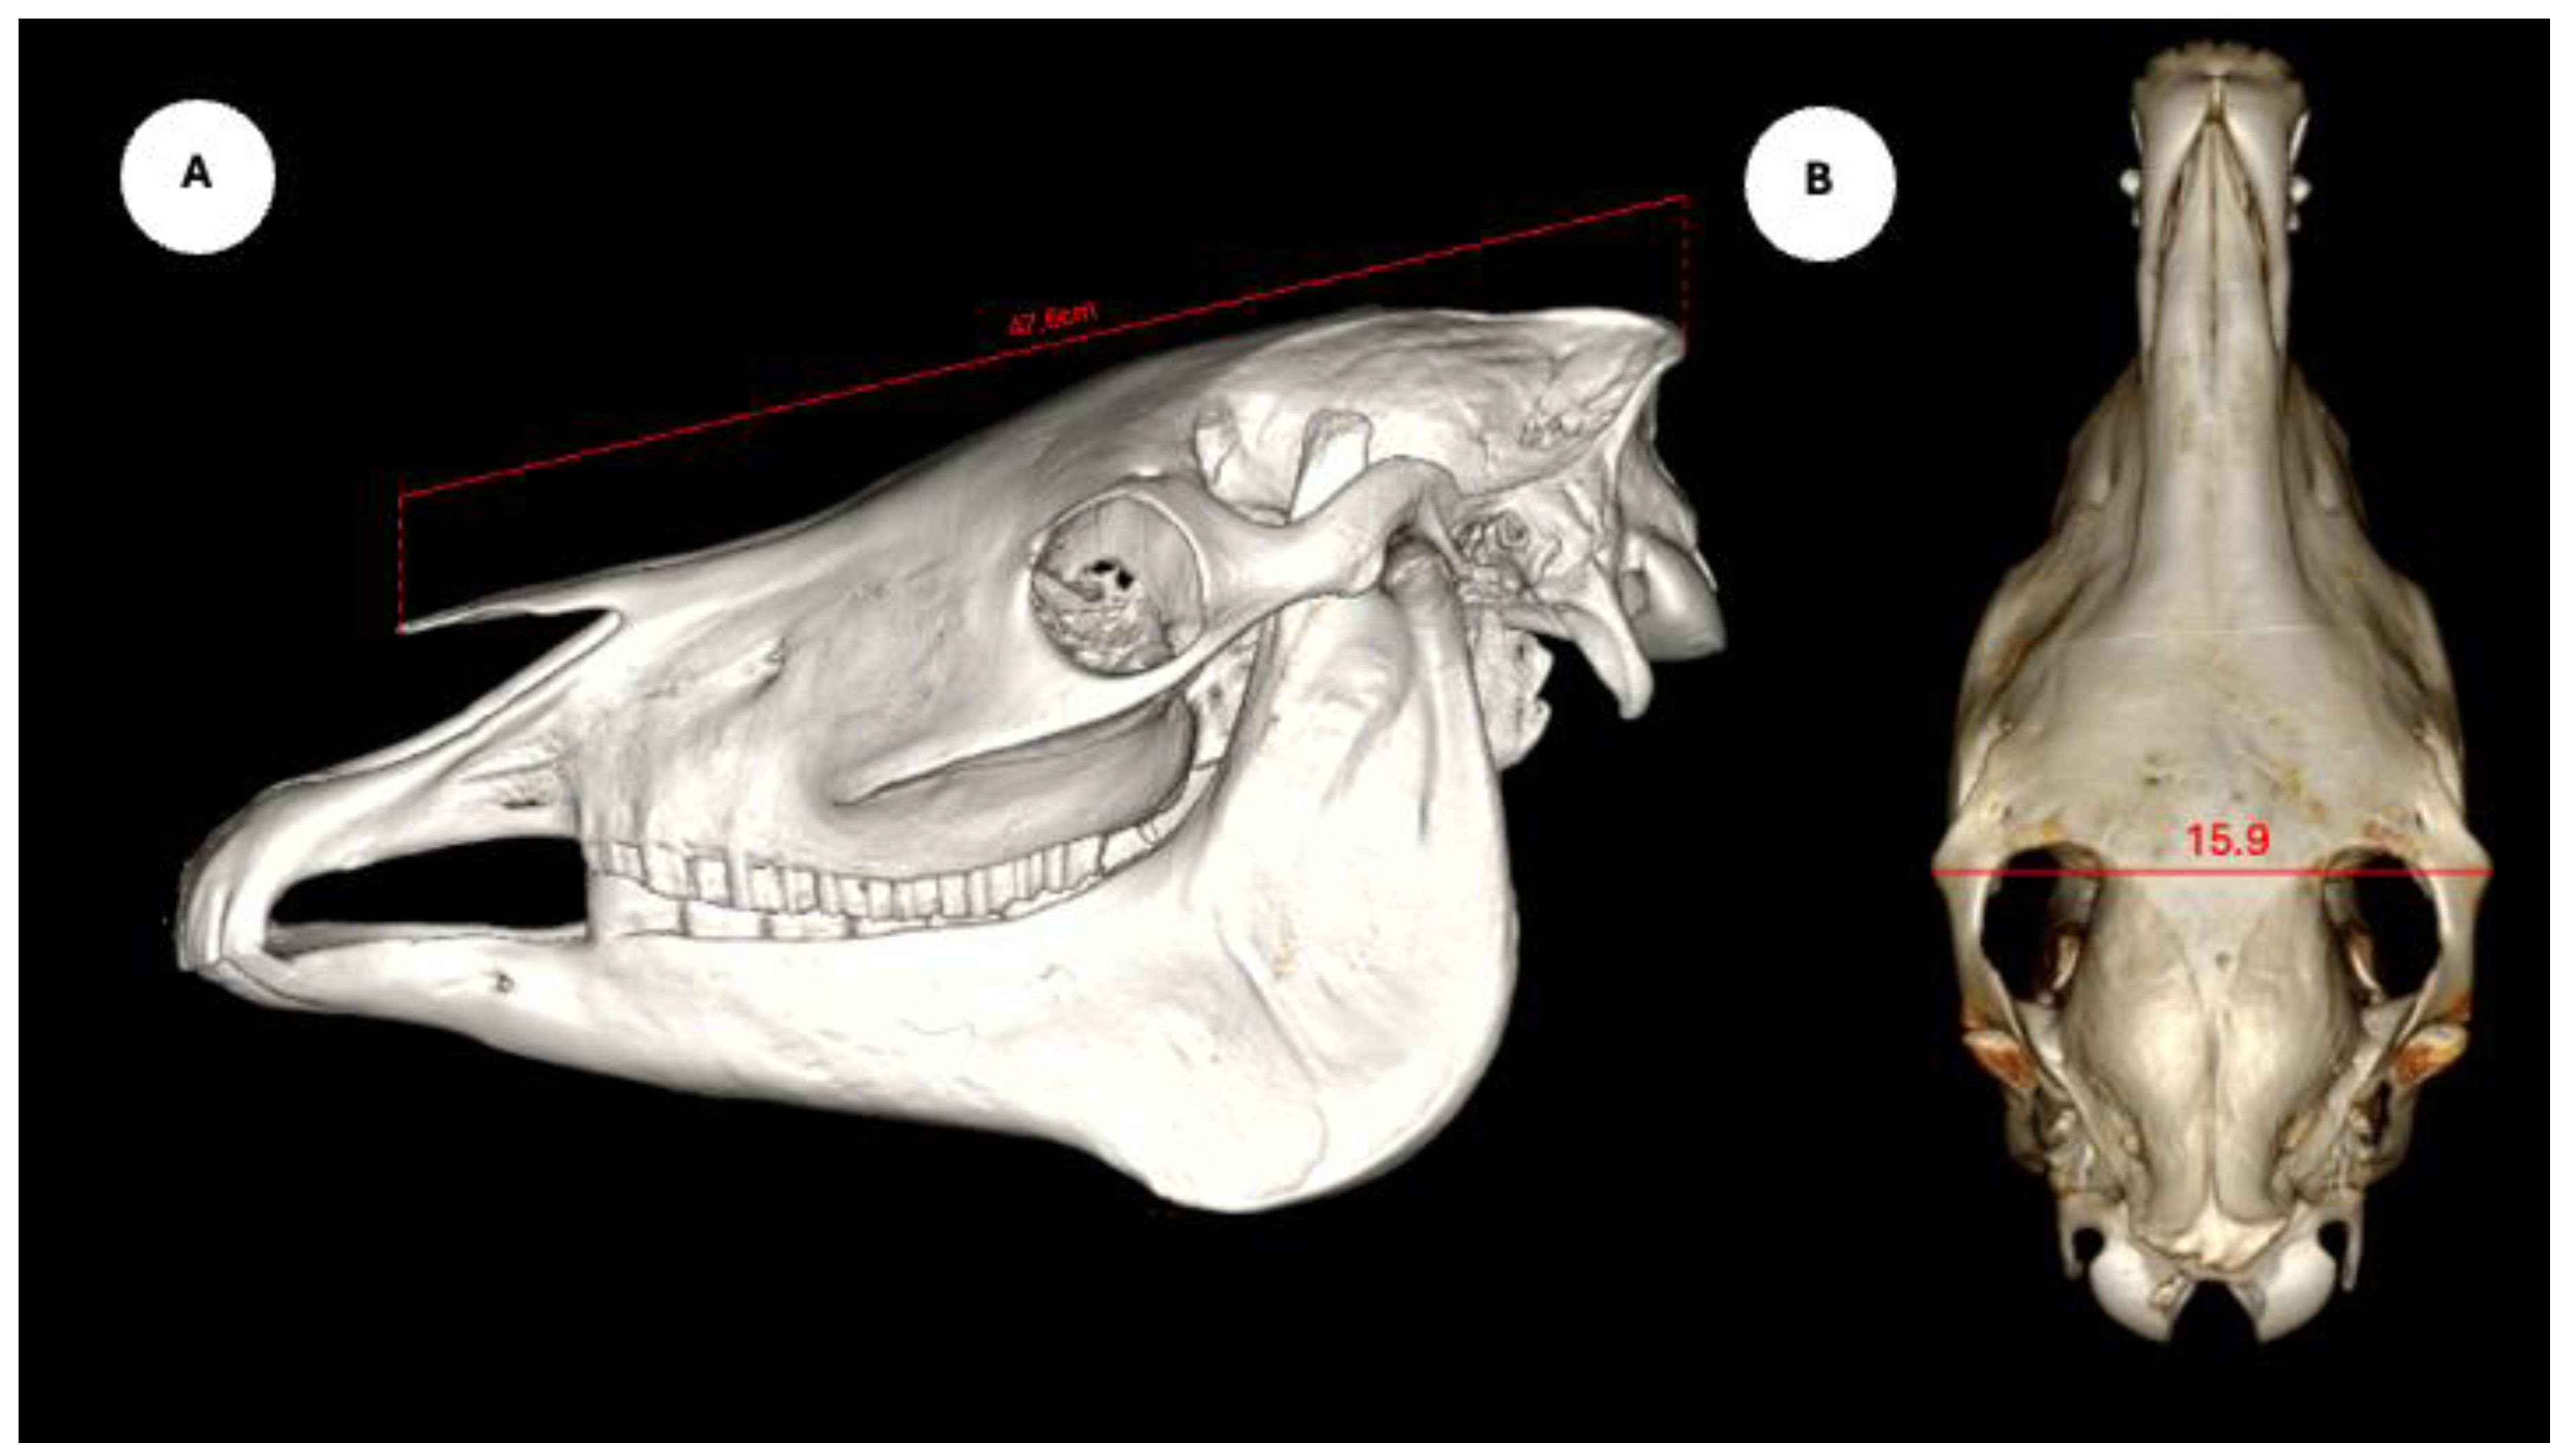
The study also evaluated cranial dimensions by measuring skull length - from the occipital protuberance to the rostral border of the nasal bone (Figure 6A) -and zygomatic width, defined as the distance between zygomatic bone borders (Figure 6B) [12].
Figure 4.
Parasagittal MPR images related to the equine eyeball, displaying measurement of the eyeball length (A), and maximum anteroposterior distance of the lens measured along its midline (B).
Figure 4.
Parasagittal MPR images related to the equine eyeball, displaying measurement of the eyeball length (A), and maximum anteroposterior distance of the lens measured along its midline (B).
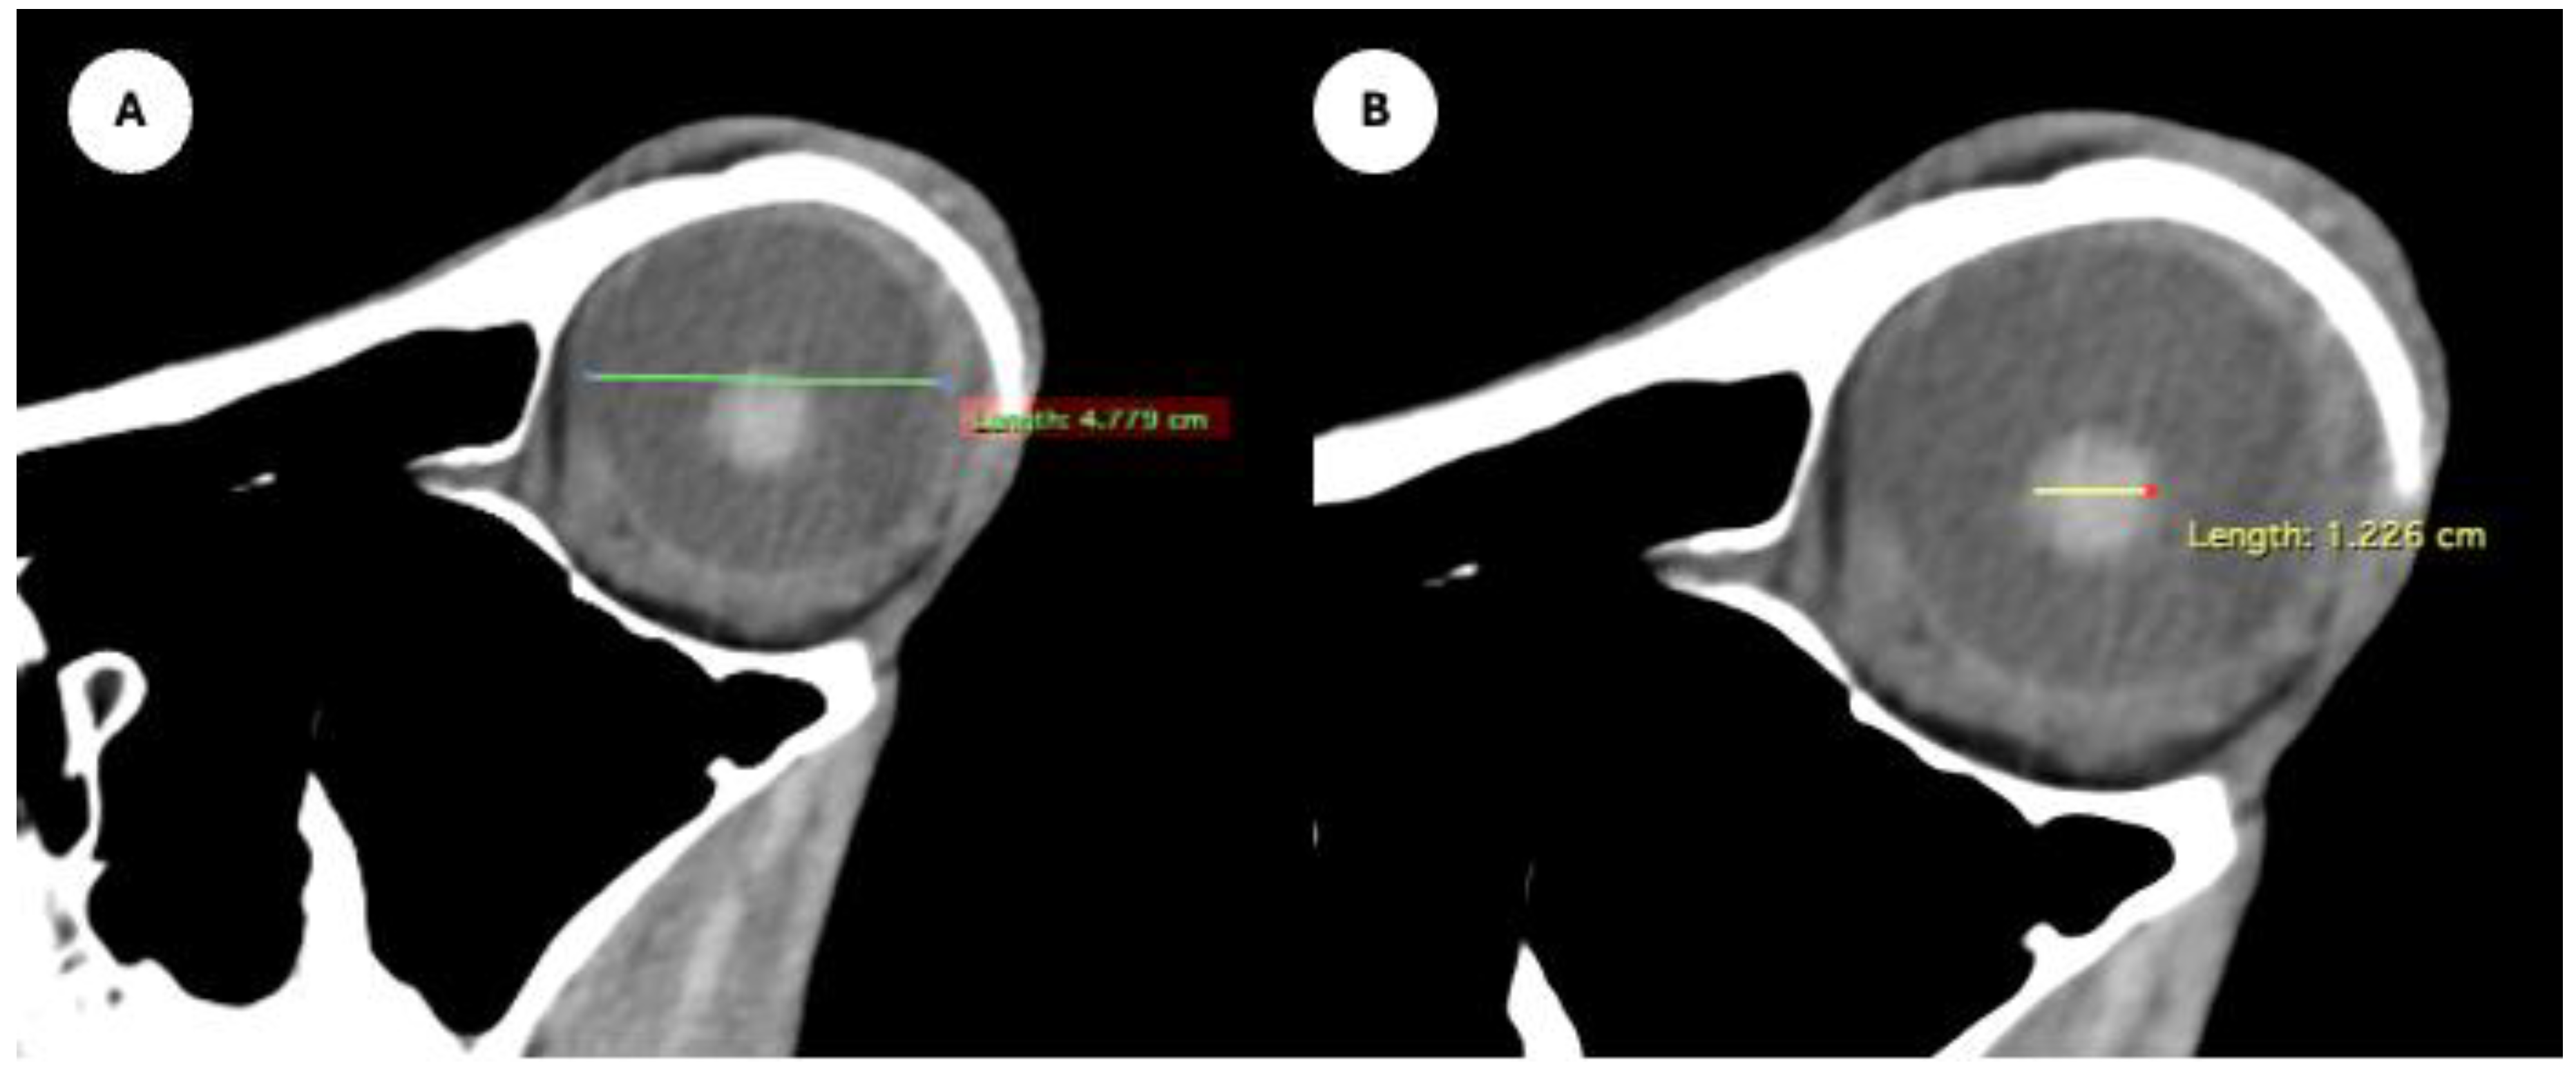
Figure 5.
Transverse MPR image showing anterior and posterior chambers width, maximal lateromedial distance across the chambers.
Figure 5.
Transverse MPR image showing anterior and posterior chambers width, maximal lateromedial distance across the chambers.
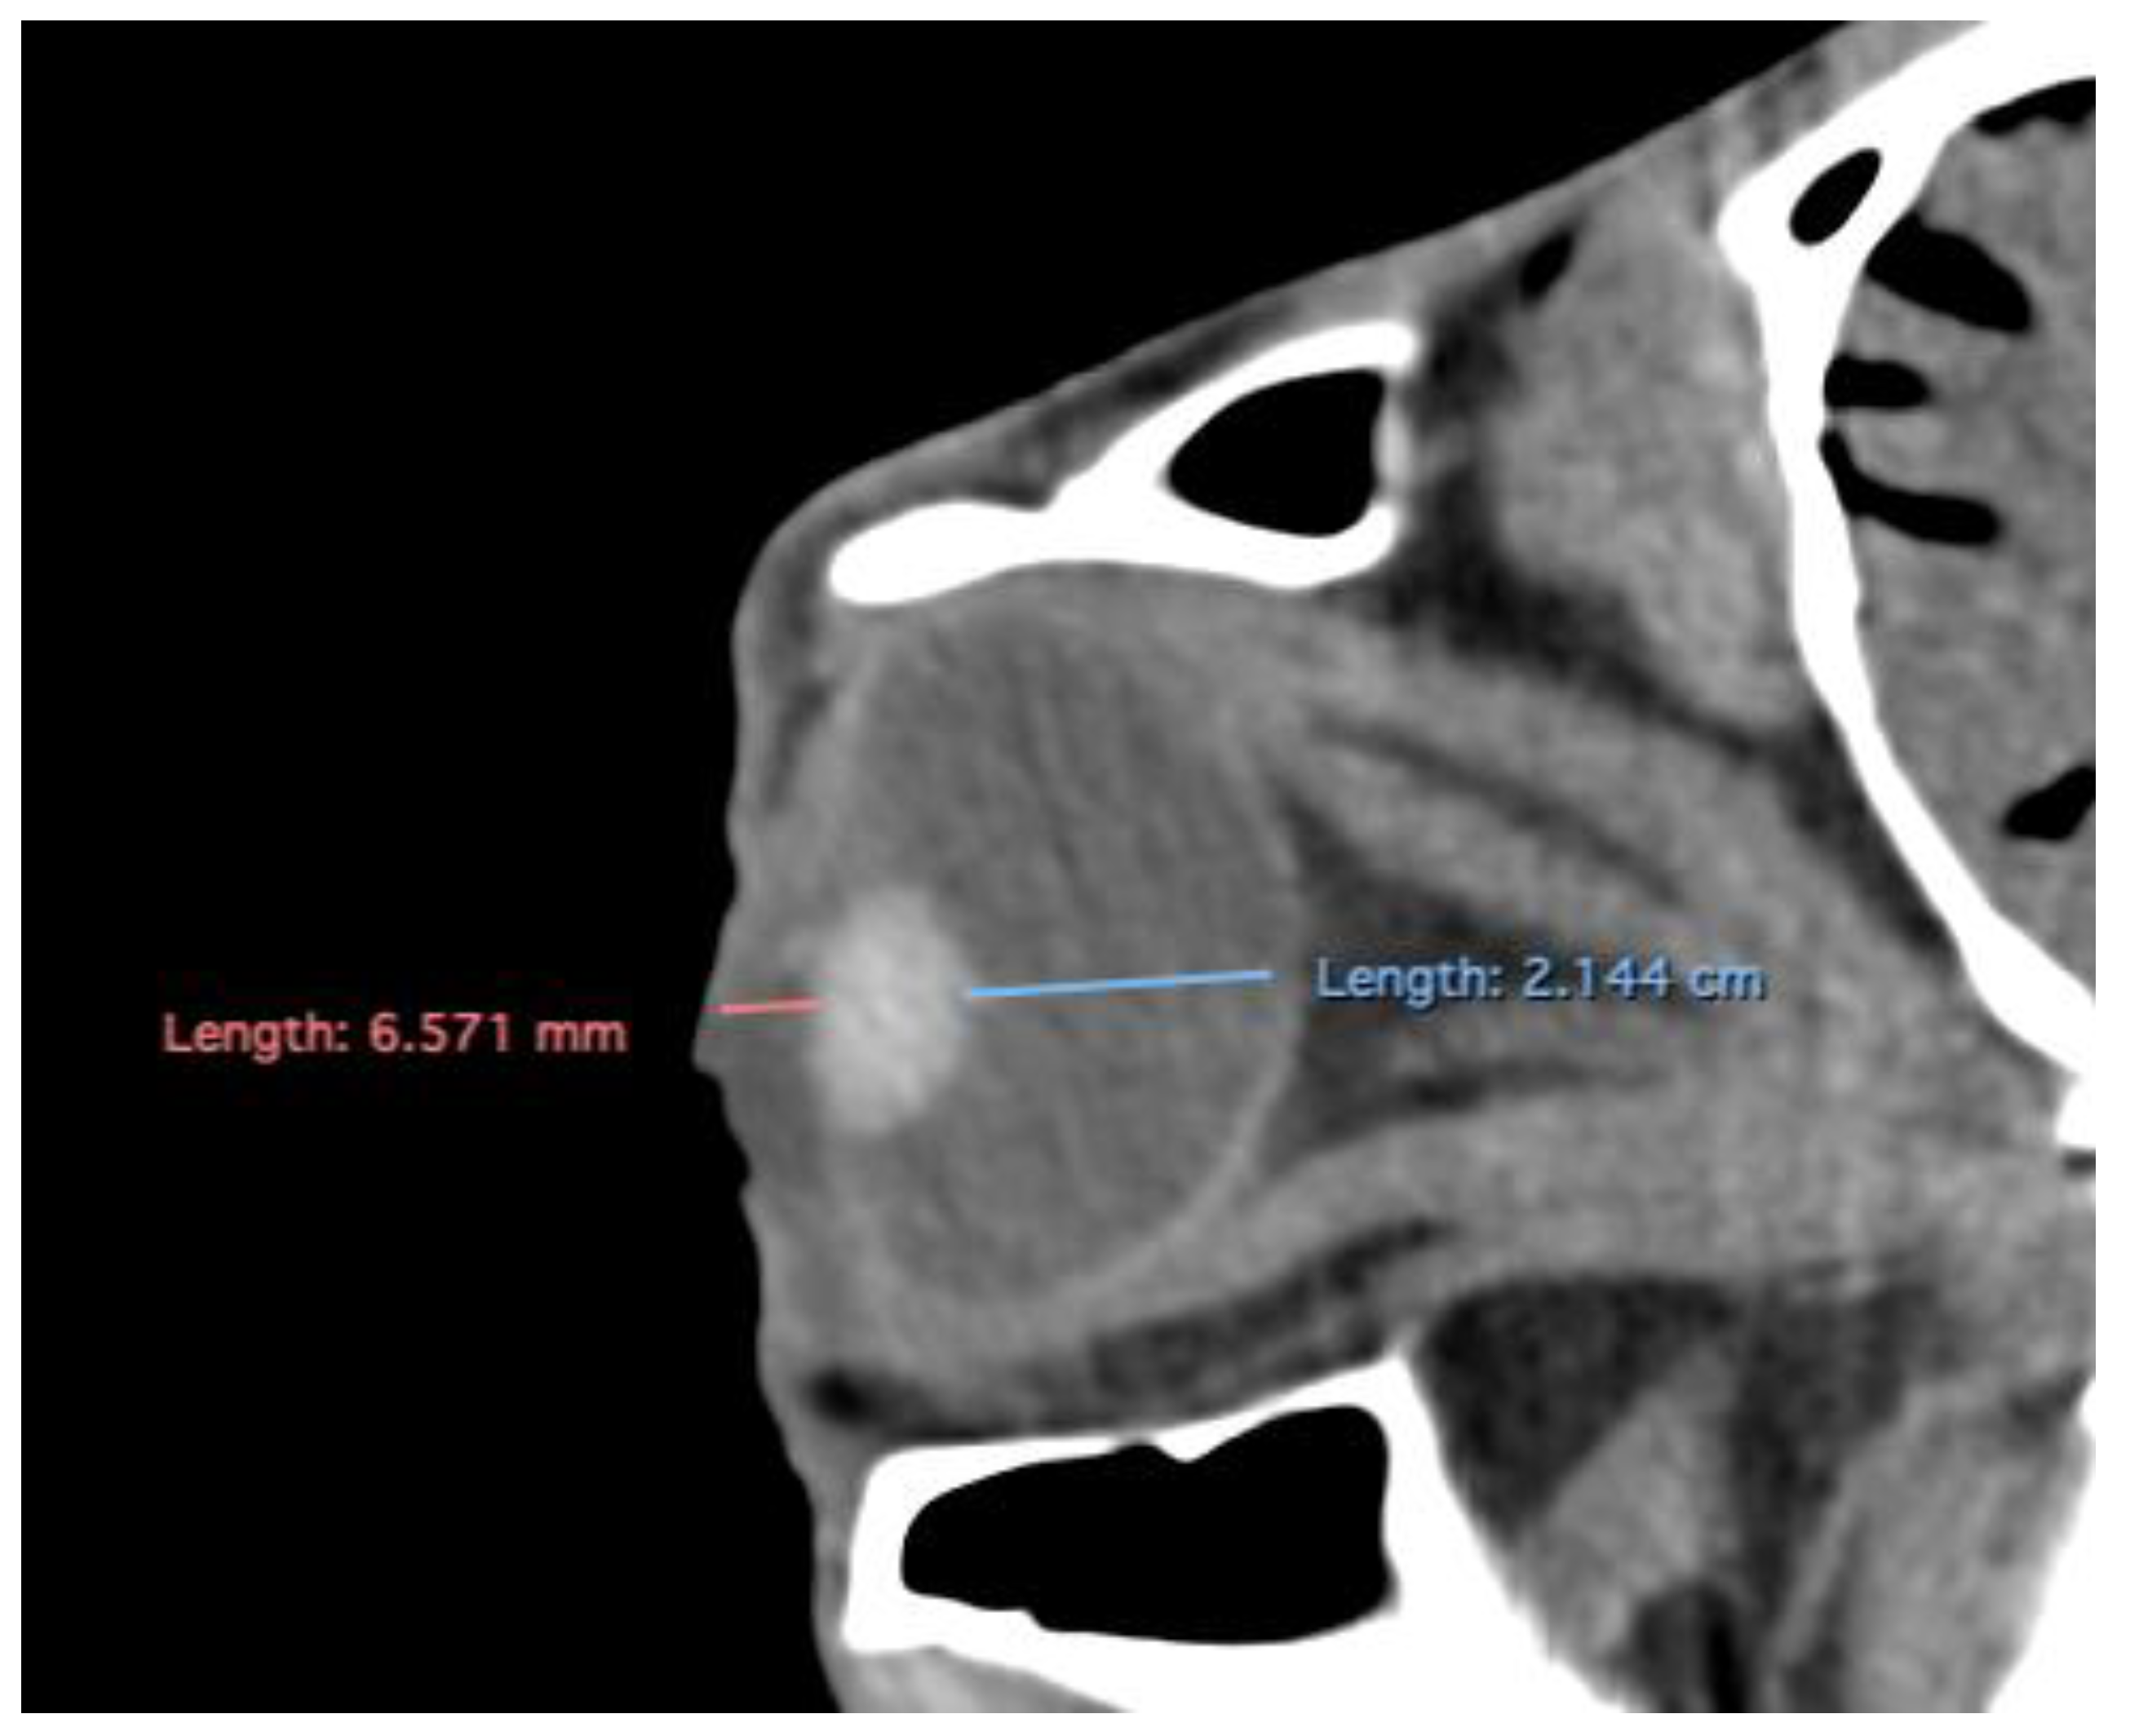
Figure 6.
Volume rendering images of the horse skull, including its length measured from the occipital protuberance to the rostral border of the nasal bone (A), and the width measured between both zygomatic edges (B).
Figure 6.
Volume rendering images of the horse skull, including its length measured from the occipital protuberance to the rostral border of the nasal bone (A), and the width measured between both zygomatic edges (B).
Statistical Analysis
Statistical analysis was performed using IBM SPSS Statistics (Statistical Package for the Social Sciences version 29, Chicago, IL, USA). The data were described using descriptive statistics such as mean, median, range and standard deviation (SD), while data distribution was assessed using a Shapiro-Wilk test for normality. The Mann-Whitney U test was used to compare measurements between the right and left eye. Correlations between various eyeball measurements and other quantitative variables were assessed by calculating Spearman´s Rank correlation. The level of significance was set at a p-value of less than 0.05.
3. Results
Descriptive statistics for the study population are summarised as follows. Regarding breed distribution, 20 animals (95.23%) were crossbred, and one (4.76%) was a pure English Horse. In terms of sex, 18 individuals (85.71%) were male and 3 (14.29%) were female. The average body weight was 467.54 ± 34.94 kg (range: 400–530 kg), and the mean age was 17.00 ± 4.99 years (range: 10–25 years). Regarding head measurements, the mean nasal-occipital length was 47.80 ± 2.00 cm (range: 46.5–53.0 cm), and the mean zygomatic width was 17.15 ± 1.25 cm (range: 16.0–20.0 cm).
Table 1 provides sum.
Table 1 provides summary statistics (mean, median, range, and standard deviation) for the internal ocular measurements of the left eye, right eye, and both eyes combined across all 20 horses. The mean ± SD of the eyeball dimensions (both eyes combined) were as follows: height, 5.06 ± 0.13 cm (range: 5.0–5.5 cm); width, 4.18 ± 0.12 cm (range: 4.1–4.6 cm); and length, 4.98 ± 0.17 cm (range: 4.78–5.4 cm). The orbital cavity measurements included a mean height of 5.14 ± 0.12 cm (range: 5.0–5.5 cm) and a mean length of 6.14 ± 0.14 cm (range: 6.0–6.6 cm). Concerning the eye chambers measurements, the posterior chamber width averaged 2.21± 0.09 cm (range: 2.09–2.4 cm), while the anterior chamber width was 0.56± 0.07 cm (range: 0.4–0.69 cm). Regarding lens dimensions, the mean height was 1.50 ± 0.06 cm (range: 1.4–1.66 cm), the mean width was 1.20 ± 0.06 cm (range: 1.05–1.35 cm), and the mean length was 1.59 ± 0.04 cm (range: 1.5–1.69 cm).
Following a Shapiro–Wilk test, approximately half of the variables were found to deviate from a normal distribution. Consequently, the non-parametric Spearman correlation test was employed to assess relationships among morphological measurements. Thus, four of the eleven measurements showed significant weak correlations with head measurements. Nasal-occipital length showed a positive correlation with zygomatic width (ρ = 0.305, p = 0.049), and weak negative correlations with lens height (ρ = –0.337, p = 0.029) and lens width (ρ = –0.375, p = 0.014). Zygomatic width also showed a weak but statistically significant negative correlation with posterior chamber width (ρ = –0.333, p = 0.031). No other significant correlations were found between head measurements and the dimensions of the eyeballs, orbital cavities, lens size, or anterior–posterior chamber widths.
Age showed a statistically significant correlation only with zygomatic width (ρ = –0.516, p < 0.001), indicating a moderate negative association with high statistical significance. Additionally, two variables exhibited moderate-to-weak correlations with body weight: nasal-occipital length (ρ = 0.429, p = 0.005) and lens width (ρ = –0.370, p = 0.016).
All eyeball measurements were intercorrelated. Weak correlations were observed between length and width (ρ = 0.329; p = 0.033) and between length and height (ρ = 0.371; p = 0.015). A strong correlation was found between width and height (ρ = 0.704; p < 0.001). Orbital cavity height and length were significantly correlated (ρ = 0.639; p < 0.001), indicating a strong association. Orbital cavity height also showed significant correlations with all eyeball measurements: width (ρ = 0.360; p = 0.019), height (ρ = 0.419; p = 0.006), and length (ρ = 0.542; p < 0.001). In contrast, orbital cavity length was only correlated with eyeball length (ρ = 0.422; p = 0.005). Lens dimensions showed varying degrees of correlation. A strong correlation was found between lens height and lens width (ρ = 0.788; p < 0.001), while a weak correlation was observed between lens height and lens length (ρ = 0.306; p = 0.048). No significant correlation was found between lens width and lens length (ρ = 0.279; p = 0.074). Lens width demonstrated moderate-to-weak correlations with several eyeball and orbital cavity measurements: eyeball width (ρ = 0.346; p = 0.025), eyeball height (ρ = 0.332; p = 0.032), eyeball length (ρ = 0.523; p < 0.001), orbital cavity height (ρ = 0.349; p = 0.023), and orbital cavity length (ρ = 0.484; p = 0.001). Lens height showed moderate correlations with eyeball length (ρ = 0.538; p < 0.001), orbital cavity height (ρ = 0.435; p = 0.004), and orbital cavity length (ρ = 0.539; p < 0.001). Conversely, lens length was not significantly correlated with any eyeball or orbital cavity measurements. Finally, the widths of the posterior and anterior chambers were moderately correlated (ρ = 0.580; p < 0.001). Both variables showed weak to moderate correlations with all eyeball, orbital cavity, and lens dimensions (ρ = 0.337–0.650; p = 0.029 to <0.001), except for the posterior chamber width with eyeball length (ρ = 0.232; p = 0.140), and the anterior chamber width with lens length (ρ = 0.204; p = 0.195), which were not statistically significant.
Related to attenuation, the ROI (regions of interest) for measuring the attenuations of the anterior chamber, posterior chamber and lens densities are shown with different colour circles (illustrated in Figure 3). The mean lens attenuation was 124.93 Hounsfield units (HU) with a range of 101-147 HU. The posterior chamber exhibited an average attenuation of -4.26 HU (range: -8 to -2 HU), while the anterior chamber displayed an attenuation of -8.05 HU (range: -14 to -4 HU).
4. Discussion
Modern diagnostic imaging modalities, including ultrasound, CT and MRI, have revolutionised the assessment of ocular structures in veterinary medicine [1,2,3,4,5,6,7]. These techniques enable the acquisition of images in multiple tomographic planes, offering high anatomical resolution, excellent tissue contrast and differentiation, and the ability to avoid tissue superimposition [1,2,8,9,10]. Consequently, these imaging technologies have significantly facilitated the visualisation and diagnosis of ocular and periorbital structures, facilitating the detection and characterisation of a wide range of associated pathologies [2,4,5]. MRI offers superior soft tissue contrast without exposing the patient to ionising radiation and allows for multiplanar image acquisition. However, it requires general anaesthesia and significantly longer acquisition times compared to CT [7]. This last imaging technique, in turn, offers high-quality images and allows for fast evaluations and three-dimensional reconstructions, making it a valuable tool for differentiating extra- and intraocular structures. Moreover, it helps obtain anatomical measurements and evaluate orbital anatomy [7].
To the best of our knowledge, this is the first study reporting quantitative measurements of normal equine cadaveric eyes while evaluating potential associations between ocular and cranial dimensions. To date, available information on this issue in clinically normal horses is scarce [5,13], and existing studies have mainly focused on comparing ocular CT measurements between breeds or correlating them with body weight. Nonetheless, these studies presented some limitations related to the absence of ophthalmologic examination due to the nature of retrospective studies. Moreover, Hollis et al. (2019) reported computed tomographic ocular dimensions only performed in one eye, which could provide incomplete information since studies done in other species, such as dogs [7], cats [8], sea turtles [9], puffins [10], extinct species [11], and Jeju horses [13] were taken in both eyes.
The CT images obtained in this study displayed adequate visualization of orbital soft tissues and ocular adnexa in horses, providing high spatial and moderate contrast resolution. While some studies have employed contrast media to enhance the visibility of ocular components like the aqueous and vitreous humours [7,8], this was not necessary in our case since the sclera, extraocular muscles, ciliary body, lens, and vitreous chamber were sufficiently delineated without contrast, allowing for identification of most intraocular structures previously reported in other species, including reptiles such as the Komodo dragon [14,15], the green iguana, the common tegu, and the bearded dragon [16], the rhinoceros iguana [17], as well as various turtle species inhabiting marine, freshwater, and terrestrial environments such as the green turtle, the black-bellied slider, the loggerhead turtle, and the red-footed tortoise [9,17]. Comparable findings have also been reported in domestic mammals, such as dogs [7] cats [8], and horses [5,13].
Previous studies conducted in horses have focused exclusively on adult specimens [5,13], whereas our study included a broader age range, incorporating a foal specimen. This inclusion allows for preliminary insights into age-related anatomical variation, although further research with larger juvenile cohorts is necessary to draw definitive conclusions. Additionally, Hollis et al. examined correlations between ocular dimensions and body weight, reporting significant positive correlation for all ocular dimensions except for the lens and the anteroposterior diameter of the anterior chamber. However, these correlations ranged from fair to moderate, suggesting that ocular dimensions cannot be reliably predicted based solely on body weight.
In contrast, our study investigated the relationship between ocular anatomy and cranial morphometrics—specifically nasal-occipital length and zygomatic width—providing a more skeletal-based morphometric perspective. Interestingly, although the correlations observed between skull dimensions and certain intraocular structures (such as lens height and posterior chamber width) were weak, they were statistically significant. These findings align with those reported by Hollis et al. (2019), as lens length did not significantly correlate with skull measurements or other ocular parameters. However, we did identify strong internal correlations among lens dimensions (height and width), which may be relevant for surgical planning and prosthetic design. Overall, our results suggest that cranial morphology may exert subtle but measurables influences on ocular anatomy, highlighting the need for further investigations with larger and more diverse populations to validate and expand upon these preliminary associations.
Beyond examining relationships between the cranium and ocular structures, our study provides a biomechanical perspective on equine visual anatomy. Horses possess some of the largest eyes among terrestrial mammals; nonetheless, their visual acuity remains relatively low—typically ranging between 20/30 and 20/60-- meaning they must be significantly closer to an object than humans to perceive comparable detail [19,20,21]. This limited resolution has been attributed to a low density of retinal ganglion cells, especially within the narrow visual streak, which serves as the main area of visual focus in the equine retina [21,22,23,24,25]. Supporting this, Harman et al. (1999) demonstrated that even the zone of highest retinal acuity in horses achieved only ~16.5 cycles per degree, with peripheral areas dropping to ~2.7, challenging the notion that head movement compensates for limited ocular resolution [19,20]. In contrast, species with high retinal acuity tend to exhibit strong correlations between cranial dimensions and ocular metrics [9,10,11,18,23]. In our study, we observed weak but statistically significant associations between cranial parameters and ocular metrics such as lens height and posterior chamber width. This pattern mirrors findings in other species where similar low correlations are associated with limited visual acuity [18,23]. Thus, our results suggest that while ocular geometry in horses is anatomically constrained by cranial morphology, it does not necessarily enhance visual resolution, highlighting a key functional limitation in the equine visual system.
While similar evaluations have been previously documented in horses [13], our results indicate that, despite the different composition of the aqueous and vitreous humours, their radiodensities appeared subjectively similar, both being hypodense compared to the lens. These findings are consistent with observations described in other species [7,8]. Nonetheless, previous studies in dogs and cats have demonstrated significant differences between the densities of both humours and significant enhancement following contrast administration. It is important to highlight that changes in the radiodensity of the vitreous and aqueous humours could be consistent with underlying conditions such as haemorrhage, inflammation, degeneration, clot formation or neoplasia. Such differences could be clinically relevant for determining the aetiology of ocular abnormalities. Given that the present investigation was conducted using cadaveric specimens, further studies involving live animals are required to evaluate the clinical applicability of these findings.
The limited sample size represents one of the primary limitations of this study. However, the animals were deliberately selected following ophthalmological examinations to ensure the absence of ocular, retrobulbar, or adjacent structural pathology that could potentially affect ocular measurements. This careful selection aimed to establish accurate and reliable baseline CT reference values for normal ocular dimensions in horses. While post-mortem imaging eliminates issues such as motion artefacts and avoids the need for anaesthesia, it may introduce subtle changes in tissue hydration, intraocular pressure, or anatomical integrity—factors known to affect ocular dimensions in cadaveric specimens compared to live animals (e.g. lens position shifts in porcine eyes approximately 6 days postmortem) [26,27,28]. Despite these considerations, post-mortem CT remains a valid and practical tool for anatomical characterisation, particularly when ethical or logistical challenges preclude in vivo imaging of healthy, anaesthetised horses. Furthermore, comparative studies in other species (e.g. porcine cardiac DTI) have shown high concordance between in vivo and post-mortem quantitative imaging parameters [28], supporting the reliability of ex vivo measurements under controlled conditions [29,30,31,32].
5. Conclusions
This study provides a detailed CT characterisation of normal ocular dimensions and radiodensities in cadaveric horses, including a preliminary analysis of their correlations with cranial morphometrics, The data presented here establish reference values for ocular and intraocular structures, contributing valuable information for future diagnostic and surgical applications in equine ophthalmology.
Although weak, the statistically significant associations found between skull dimensions (nasal-occipital length and zygomatic width) and certain intraocular parameters (e.g., lens height, posterior chamber width) suggest that cranial morphology may exert subtle influences on ocular anatomy. However, these weak correlations—consistent with findings in other species with limited visual resolution—are unlikely to support accurate prediction of ocular measurements from external morphometry alone.
These results align with the known modest visual acuity of horses, which, despite having large eyes, is limited by factors such as low retinal ganglion cell density and the narrow visual streak. Thus, while CT morphometry allows for precise anatomical assessment, it also highlights inherent functional constraints of the equine visual system. Further studies including live animals and larger sample sizes, particularly juvenile and geriatric populations, are needed to refine normative data and explore age-related anatomical or functional changes in equine vision.
Author Contributions
Conceptualization, E.L.P., L.P., M.E., M.F.H., and M.L.D.; methodology, E.L.P., L.P., M.E., and M.L.D.; formal analysis, J.R.J., E.L.P., L.P., M.E., M.F.H., I.M., A.A., and M.L.D.; investigation, J.R.J., E.L.P., L.P., M.F.H., I.M., A.A., and M.L.D.; data curation, A,S.R.; writing—original draft preparation, J.R.J, and E.L.P.; writing—review and editing, , J.R.J., E.L.P., L.P., M.E., M.F.H., I.M., A.S.R., A.A. and M.L.D. All authors have read and agreed to the published version of the manuscript.
Funding
This research received no external funding.
Institutional Review Board Statement
Not applicable.
Informed Consent Statement
An informed consent from the owners, allowed us to carry out this study. Therefore, the owners were informed that all the information obtained from this study was treated as confidential to the extent permitted by law and only used for research or teaching purposes.
Data Availability Statement
The information is available at “https://accedacris.ulpgc.es”, accessed on 25 June 2025.
Acknowledgments
In loving memory of Alvaro Domingo Rodriguez Garcia. We also thank Marisa Mohamad, Ayesh Mohamad, Carmen Mingot, Emilia Mingot, Concepción Mingot, Nicolas Aquino and Jamal Jaber for their support and constructive comments.
Conflicts of Interest
The authors declare no conflicts of interest.
References
- Stoppini, R.; Gilger, B. C. Equine ocular examination basic techniques. In: Equine Ophthalmology, B.C. Gilger (Ed.), 2017, Wiley and Sons, Inc. New York, p. 1-39.
- McMullen, R. J. Advancements in equine ophthalmic imaging enhance understanding of ocular and orbital anatomy and disease in standing sedated horses. J. Am. Vet. Med. Assoc. 2024, 262, S47–S56. [Google Scholar] [CrossRef]
- Gallhoefer, N. S.; Bentley, E.; Ruetten, M.; Grest, P.; Haessig, M.; Kircher, P. R.; Dubielzig, R. R.; Spiess, B. M.; Pot, S. A. Comparison of ultrasonography and histologic examination for identification of ocular diseases of animals: 113 cases (2000–2010). J. Am. Vet. Med. Assoc. 2013, 243, 376–388. [Google Scholar] [CrossRef] [PubMed]
- Dennis, R. Use of magnetic resonance imaging for the investigation of orbital disease in small animals. J. Small Anim Pract. 2000. 41, 145–155. [CrossRef] [PubMed]
- Hollis, A. R.; Dixon, J. J.; Berlato, D.; Murray, R.; Weller, R. Computed tomographic dimensions of the normal adult equine eye. Vet Ophthalmol. 2019, 22, 651–659. [Google Scholar] [CrossRef] [PubMed]
- Grinninger, P.; Skalicky, M.; Nell, B. Evaluation of healthy equine eyes by use of retinoscopy, keratometry, and ultrasonographic biometry. Am J Vet Res. 2010, 71, 677–681. [Google Scholar] [CrossRef]
- Salgüero, R.; Johnson, V.; Williams, D.; Hartley, C.; Holmes, M. ; Dennis R, et al. CT dimensions, volumes and densities of normal canine eyes. Vet Record, 2015, 176, 386. [Google Scholar] [CrossRef]
- Chandrakumar, S.; Linden, A. Z.; Owen, M.; Pemberton, S.; Pinard, C. L.; Matsuyama, A.; Poirier, V. J. Computed tomography measurements of intraocular structures of the feline eye. Vet Record, 2019, 184, 651. [Google Scholar] [CrossRef]
- Fumero-Hernández, M.; Encinoso, M.; Ramírez, A.S.; Fariña, I.M.; Calabuig, P.; Jaber, J.R. Morphometric Study of the Eyeball of the Loggerhead Turtle (Caretta caretta) Using Computed Tomography (CT). Animals, 2023;13,1016. [CrossRef]
- Fumero-Hernández, M.; Encinoso, M.; Ramírez, A. S.; Morales, I.; Pérez, A. S.; Jaber, J. R. A Cadaveric Study Using Computed Tomography for Measuring the Eyeball and Scleral Skeleton of the Atlantic Puffin (Aves, Alcidae, Fratercula arctica). Animals, 2023, 13, 2418. [Google Scholar] [CrossRef]
- Hall, M. I. The anatomical relationships between the avian eye, orbit and sclerotic ring: implications for inferring activity patterns in extinct birds. J Anat. 2008, 212, 781–794. [Google Scholar] [CrossRef]
- Evans, K.E.; McGreevy, P.D. Conformation of the Equine Skull: A Morphometric Study. Anat Histol Embryol. 2006, 35, 221–7. [Google Scholar] [CrossRef]
- Yoo, H.; Lee, S.; Shin, K.; Seo, J. Computed tomographic dimensions and densities of the normal eye in Jeju horses. J Vet Med Sci. 2024. 86, 308–311. [CrossRef]
- Pérez, S.; Encinoso, M.; Corbera, J.A.; Morales, M.; Arencibia, A.; González-rodríguez, E.; Déniz, S.; Melián, C.; Suárez-bonnet, A.; Jaber, J.R. Cranial Structure of Varanus Komodoensis as Revealed by Computed-tomographic Imaging. Animals, 2021, 11, 1078. [Google Scholar] [CrossRef]
- Pérez, S.; Encinoso, M.; Morales, M.; Arencibia, A.; Suárez-Bonnet, A.; González-Rodríguez, E.; Jaber, J.R. Comparative evaluation of the Komodo dragon (Varanus komodoensis) and the Green iguana (Iguana iguana) skull by three dimensional computed tomographic reconstruction. Slov. Vet. Res. 2021, 58, 111–116. [Google Scholar] [CrossRef]
- Banzato, T.; Selleri, P.; Veladiano, I.A.; Martin, A.; Zanetti, E.; Zotti, A. Comparative evaluation of the cadaveric, radiographic and computed tomographic anatomy of the heads of green iguana (Iguana iguana), common tegu (Tupinambis merianae) and bearded dragon (Pogona vitticeps). BMC Vet. Res. 2012, 11, 53. [Google Scholar] [CrossRef] [PubMed]
- González Rodríguez, E.; Encinoso Quintana, M.; Morales Bordon, D.; Garcés, J.G.; Artiles Nuez, H.; Jaber, J.R. Anatomical Description of Rhinoceros Iguana (Cyclura cornuta cornuta) Head by Computed Tomography, Magnetic Resonance Imaging and Gross-Sections. Animals, 2023, 13, 955. [Google Scholar] [CrossRef] [PubMed]
- Andrade, S.B.D.; Araujo, N.L.L.C.D.; Raposo, A.C.S.; Muramoto, C.; Oriá, A.P. Morphometric descriptive report of scleral ossicle rings, by ultrasound and computed tomography, in three Testudines specimens. Ciênc Rural, 2023, 53, 1–10. [Google Scholar] [CrossRef]
- Harman, A. M.; Moore, S.; Hoskins, R.; Keller, P. Horse vision and an explanation for the visual behaviour originally explained by the 'ramp retina'. Equine Vet J. 1999, 31, 384–90. [Google Scholar] [CrossRef]
- Hanggi, E.B.; Ingersoll, J.F. Lateral vision in horses: A behavioral investigation. Behav Process. 2012, 91, 70–76. [Google Scholar] [CrossRef]
- Timney, B.; Keil, K. Visual acuity in the horse. Vision Res. 1992, 32, 2289–93. [Google Scholar] [CrossRef]
- Guo, X.; Sugita, S. Topography of ganglion cells in the retina of the horse. J. Vet. Med. Sci. 2000, 62, 1145–1150. [Google Scholar] [CrossRef]
- Bartol, S.M.; Musick, J.A.; Ochs, A.L. Visual acuity thresholds of juvenile loggerhead sea turtles (Caretta caretta): An electrophysiological approach. J. Comp. Physiol. A Neuroethol. Sens. Neural Behav. Physiol. 2002, 187, 953–960. [Google Scholar] [CrossRef]
- Timney, B.; Macuda, T. Vision and hearing in horses. J Am Vet Med Assoc. 2001, 218, 1567–1574. [Google Scholar] [CrossRef]
- Cappellato, A.; Miletto Petrazzini, M.E.; Bisazza, A.; Dadda, M.; Agrillo, C. Susceptibility to Size Visual Illusions in a Non-Primate Mammal (Equus caballus). Animals 2020, 10, 1673. [Google Scholar] [CrossRef]
- Hall, C.A.; Cassaday, H.J.; Derrington, A.M. The effect of stimulus height on visual discrimination in horses. J Anim Sci. 2003, 81, 1715–1720. [Google Scholar] [CrossRef] [PubMed]
- Yoshimiya, M.; Noriki, S.; Shimbashi, S.; Uesaka, H.; Hyodoh, H. Postmortem changes in porcine eyes on computed tomography images. Leg Med. 2025, 102568. [Google Scholar] [CrossRef] [PubMed]
- Stoeck, C.; Deuster, C.; Fleischmann, T.; Lipiski, M.; Cesarovic, N.; Kozerke, S. Direct comparison of in vivo versus postmortem second-order motion-compensated cardiac diffusion tensor imaging. Magn Reson Med. 2018, 79, 2265–2276. [Google Scholar] [CrossRef] [PubMed]
- Mckenna, M.F.; Goldbogen, J.A.; Leger, J.; Hildebrand, J.A.; Cranford, T.W. Evaluation of postmortem changes in tissue structure in the bottlenose dolphin (Tursiops truncatus). Anat Rec. 2007, 290, 1023–1032. [Google Scholar] [CrossRef]
- Crespigny, A.; Bou-Reslan, H.; Nishimura, M.; Phillips, H.; Carano, R.; D'Arceui, H. 3D micro-CT imaging of the Postmortem Brain. J Neurosci Methods, 171, 207-13. [CrossRef]
- Bryce, A.J.; Dandrieux, J.R.; Tyrrell, D.; Milne, M.E. The evolving use of post-mortem veterinary imaging in a university specialist hospital. Forensic Imaging, 2021, 26, 200475. [Google Scholar] [CrossRef]
- Germonpré, J.; Vandekerckhove, L.M.J.; Raes, E.; Chiers, K.; Jans, L.; Vanderperren, K. Post-mortem feasibility of dual-energy computed tomography in the detection of bone edema-like lesions in the equine foot: a proof of concept. Front. Vet. Sci. 2024, 10, 1201017. [Google Scholar] [CrossRef]
Figure 1.
(A) Transverse multiplanar reconstruction (MPR) related to the equine eyeball, including maximum anterior-posterior distance of the globe (axial length) from the external surface of the cornea to the internal surface of choroid/retina/sclera, and maximum latero-medial distance of the globe (equatorial width), measured perpendicular to the axial length. (B) MPR including the lens size, the latero-medial distance (equatorial width), measured at the widest dimension.
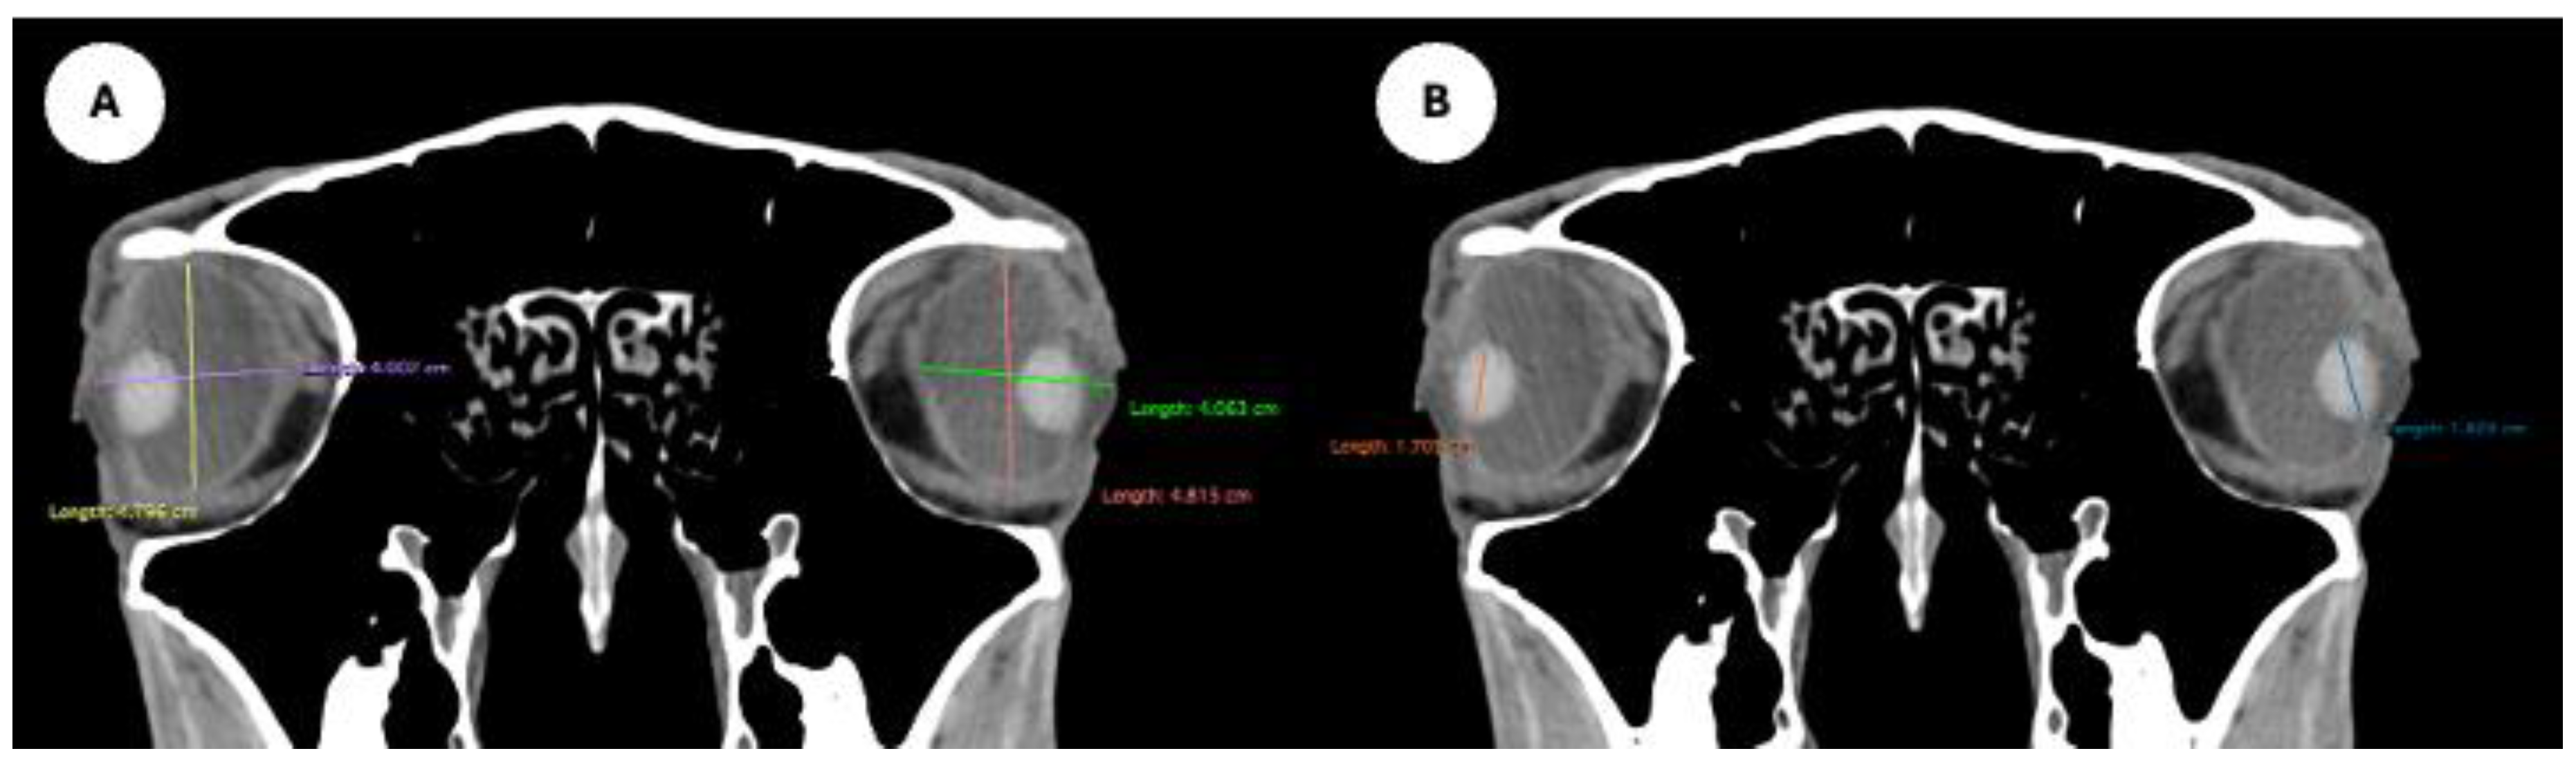
Figure 2.
Dorsal MPR images show (A) Maximal lateromedial distance of the lens. (B) Maximal lateromedial distance of the eyeball, measured perpendicular to the axial length, just caudal to the lens.
Figure 2.
Dorsal MPR images show (A) Maximal lateromedial distance of the lens. (B) Maximal lateromedial distance of the eyeball, measured perpendicular to the axial length, just caudal to the lens.
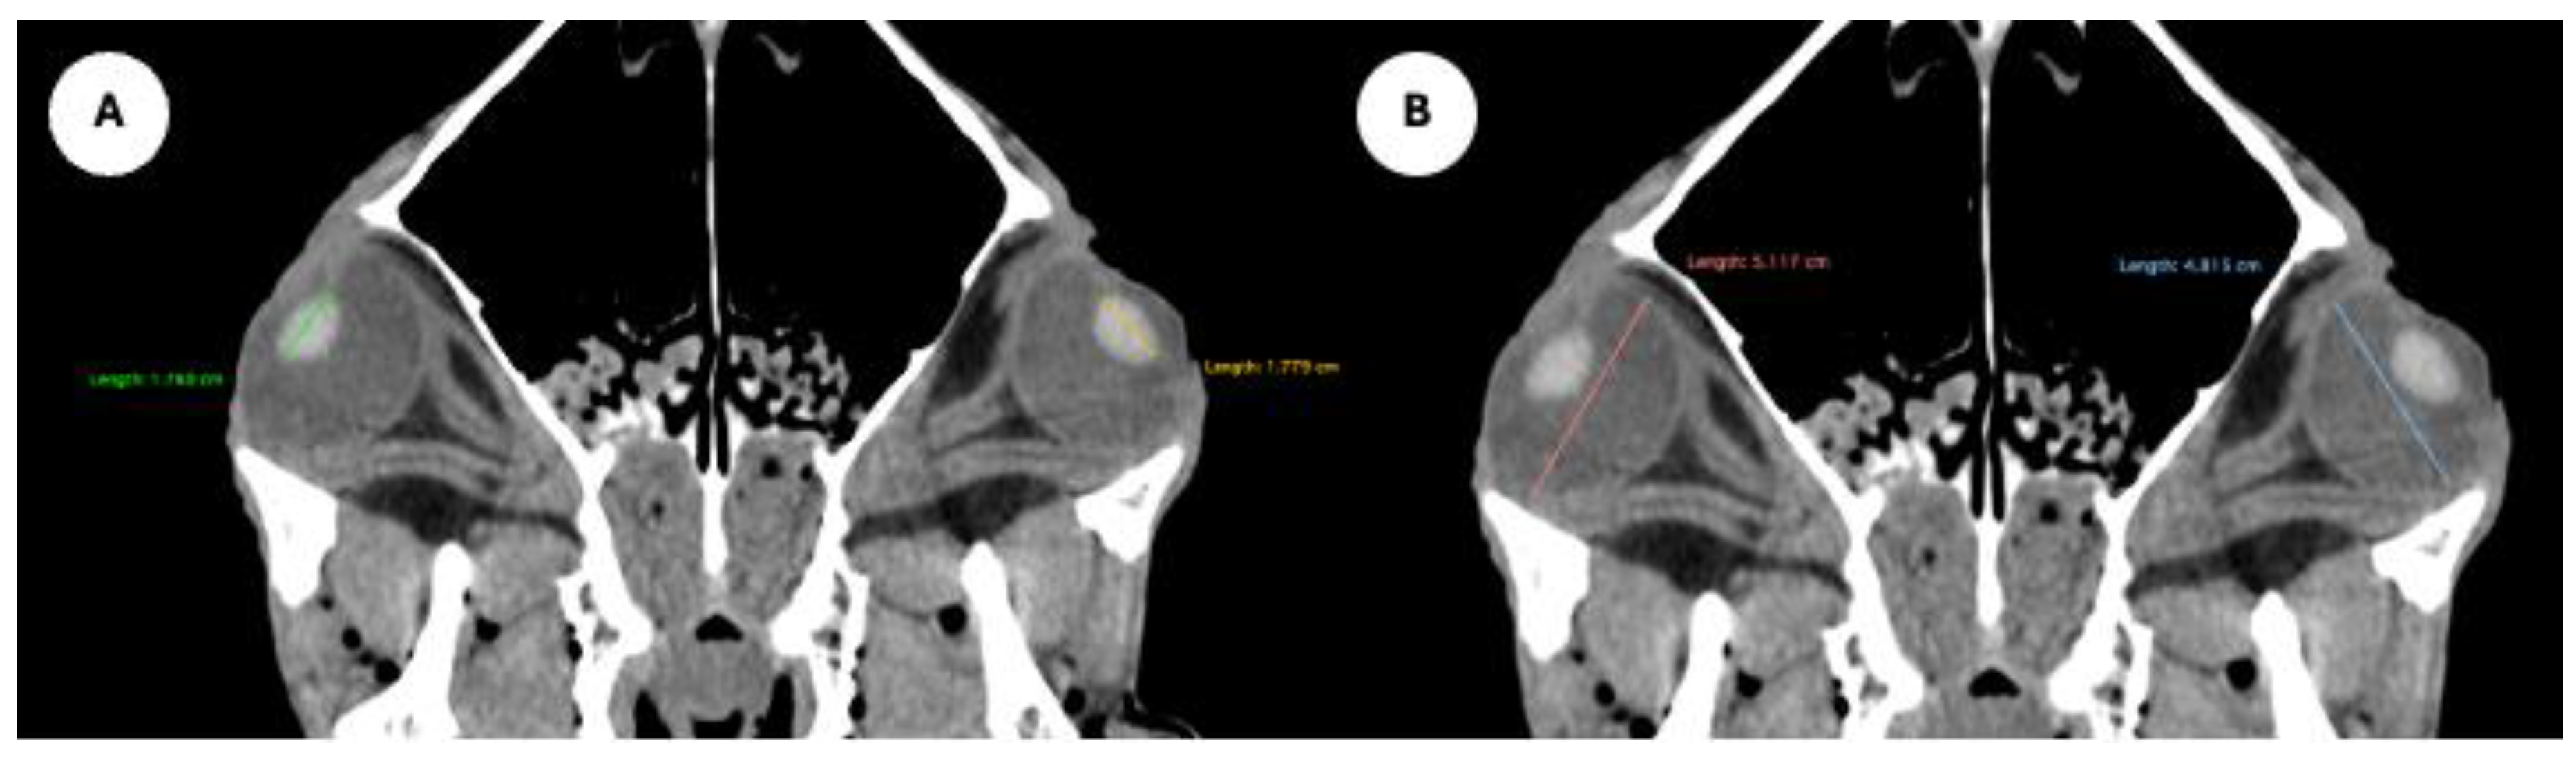
Figure 3.
Transverse MPR includes attenuation values measured by placing ROIs centrally in each structure to measure anterior chamber, posterior chamber, and lens densities.
Figure 3.
Transverse MPR includes attenuation values measured by placing ROIs centrally in each structure to measure anterior chamber, posterior chamber, and lens densities.
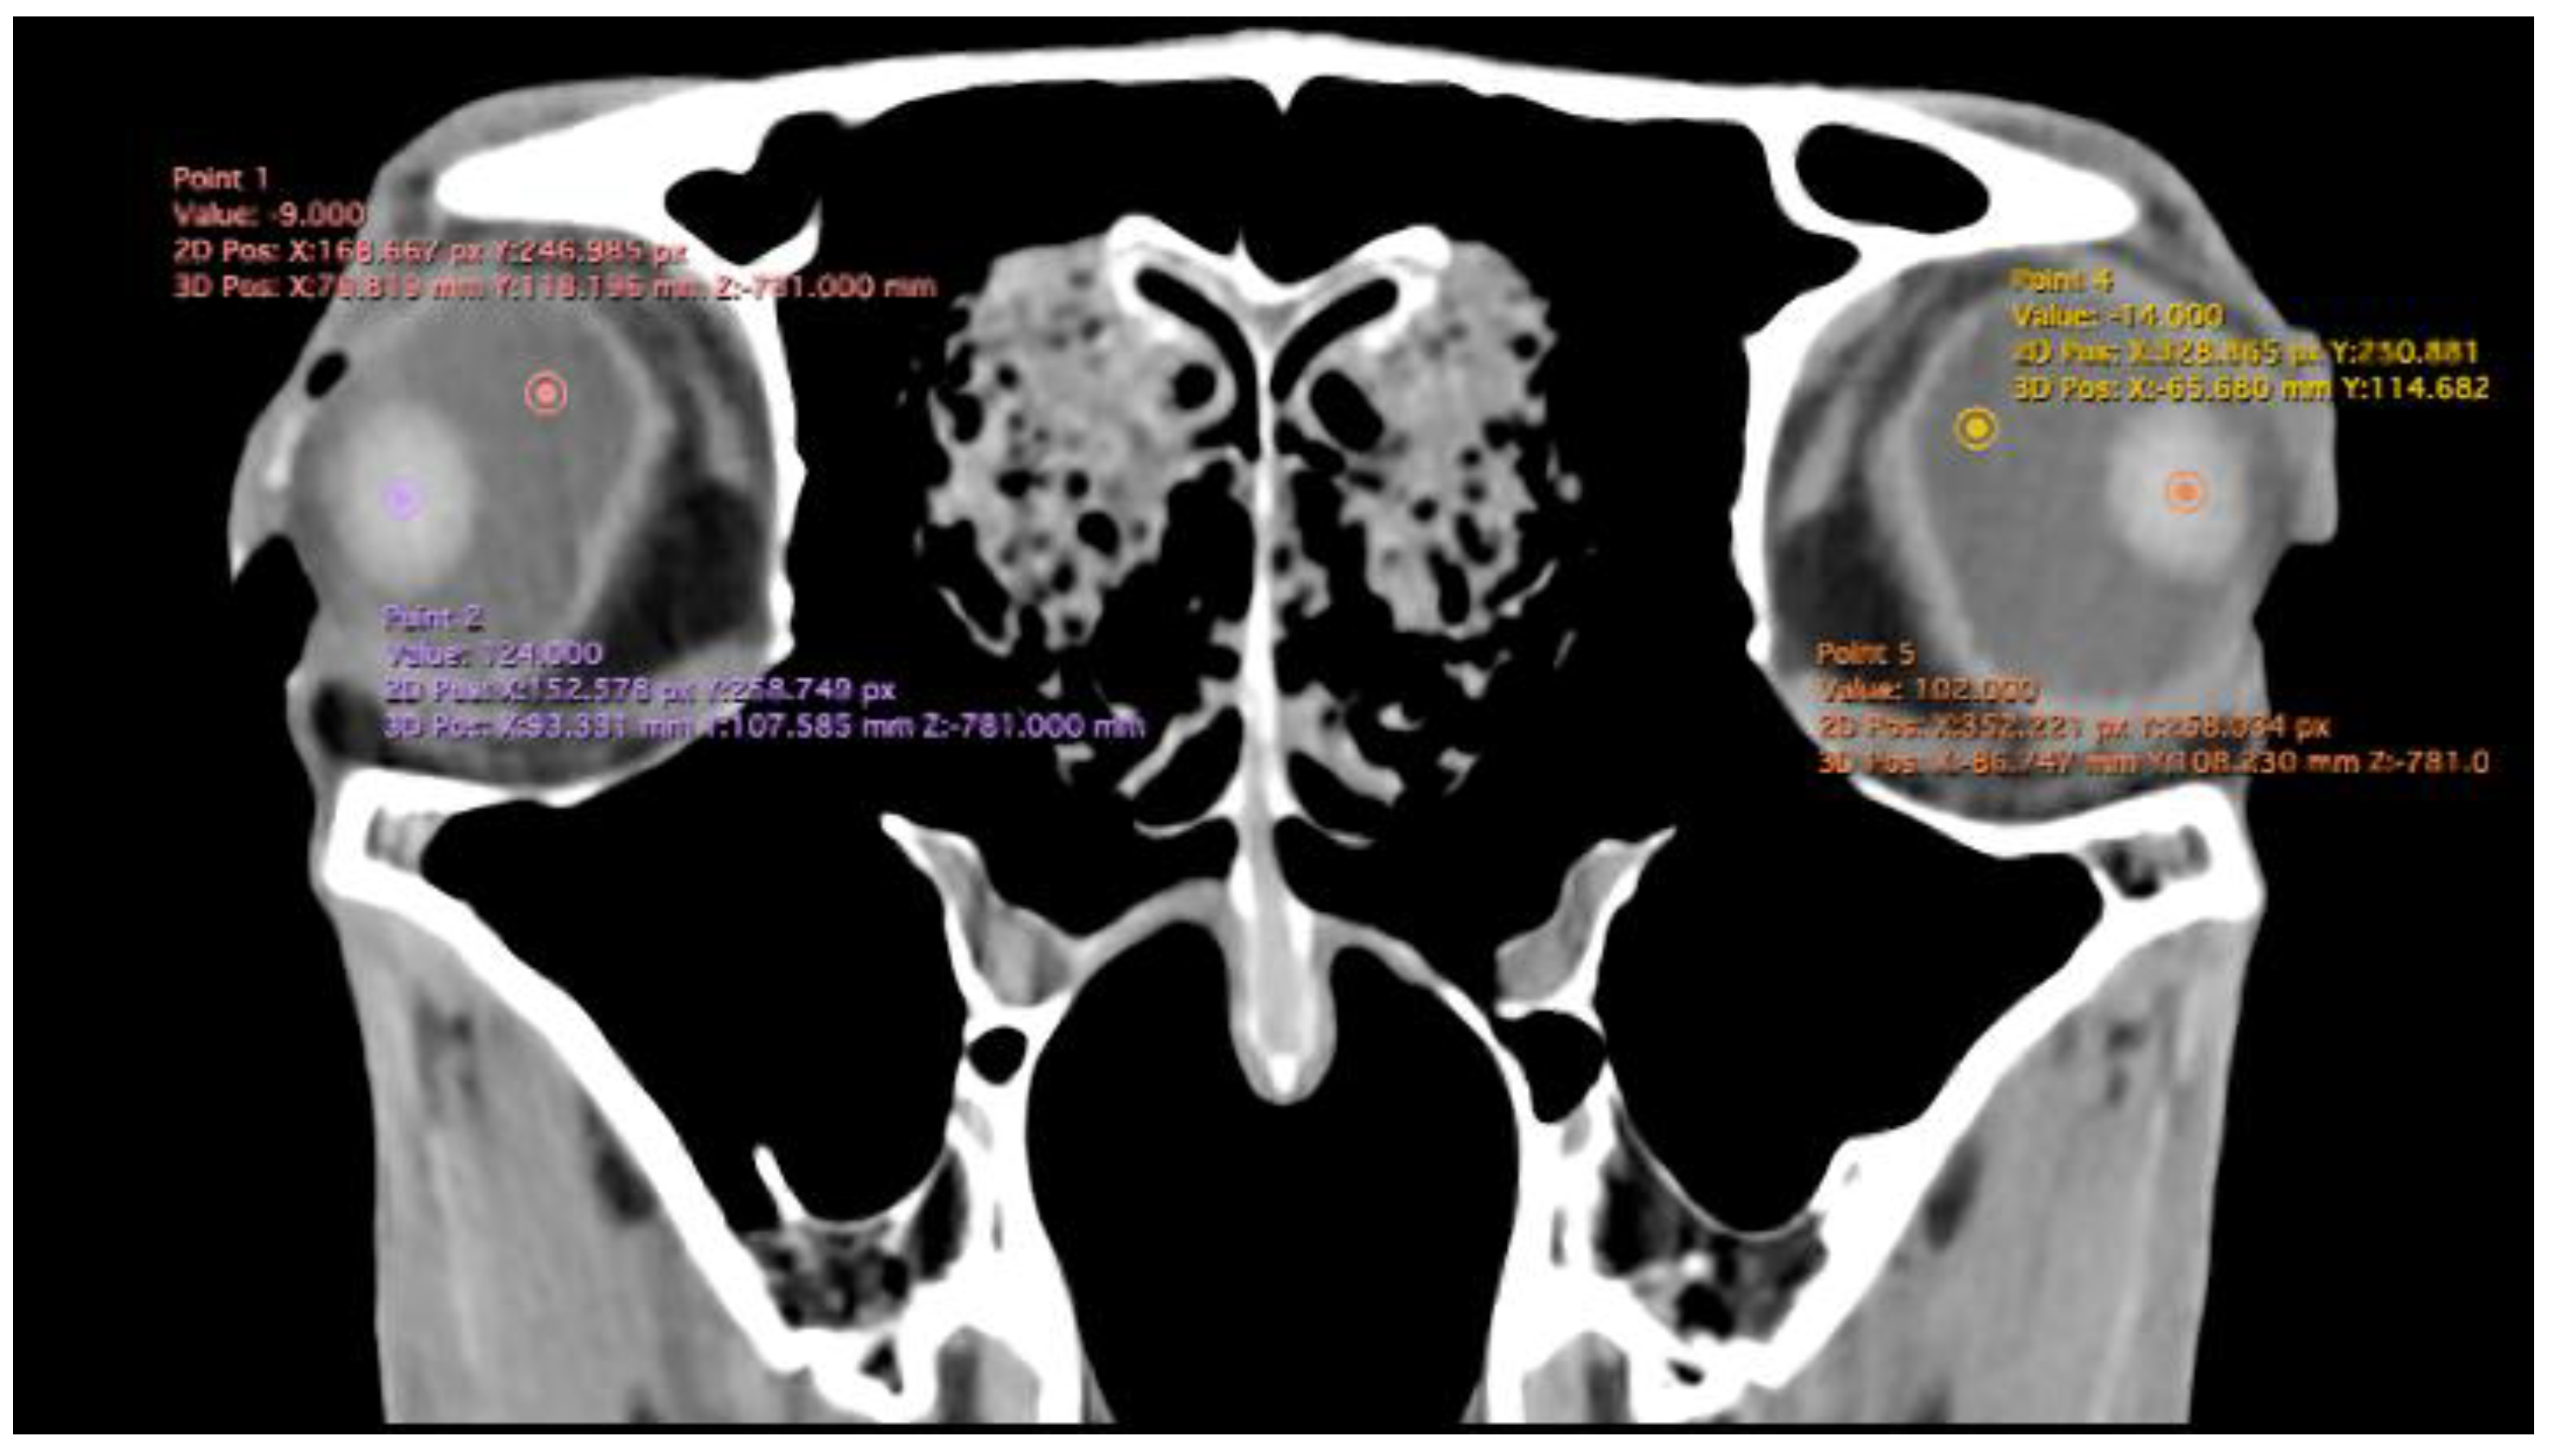

Table 1.
Measurements of the right and left eye.
| Right eye | Left eye | Both eyes | ||||||||||
|---|---|---|---|---|---|---|---|---|---|---|---|---|
| Mean | Median | Range | sd | Mean | Median | Range | sd | Mean | Median | Range | sd | |
| Ocular bulb height (cm) | 5.19 | 5.20 | (5 - 5.5) | 0.14 | 5.19 | 5.20 | (5 - 5.4) | 0.11 | 5.06 | 5.19 | (5 - 5.5) | 0.13 |
| Ocular bulb width (cm) | 4.29 | 4.25 | (4.1 - 4.6) | 0.14 | 4.27 | 4.27 | (4.1 - 4.47) | 0.10 | 4.18 | 4.26 | (4.1 - 4.6) | 0.12 |
| Ocular bulb length (cm) | 5.09 | 5.08 | (4.86 - 5.4) | 0.16 | 5.09 | 5.10 | (4.78 - 5.32) | 0.18 | 4.98 | 5.1 | (4.78 - 5.4) | 0.17 |
| Orbital cavity height (cm) | 5.27 | 5.23 | (5.1 - 5.5) | 0.10 | 5.28 | 5.27 | (5 - 5.46) | 0.14 | 5.14 | 5.27 | (5 - 5.5) | 0.12 |
| Orbital cavity length (cm) | 6.29 | 6.28 | (6.04 - 6.5) | 0.13 | 6.29 | 6.30 | (6 - 6.6) | 0.15 | 6.14 | 6.3 | (6 - 6.6) | 0.14 |
| Lens height (cm) | 1.53 | 1.52 | (1.47 - 1.66) | 0.05 | 1.53 | 1.52 | (1.4 - 1.63) | 0.06 | 1.50 | 1.52 | (1.4 - 1.66) | 0.06 |
| Lens width (cm) | 1.24 | 1.24 | (1.12 - 1.34) | 0.05 | 1.22 | 1.22 | (1.05 - 1.35) | 0.07 | 1.20 | 1.23 | (1.05 - 1.35) | 0.06 |
| Lens length (cm) | 1.63 | 1.63 | (1.52 - 1.69) | 0.04 | 1.63 | 1.65 | (1.5 - 1.69) | 0.05 | 1.59 | 1.64 | (1.5 - 1.69) | 0.04 |
| Posterior chamber width (cm) | 2.24 | 2.25 | (2.1 - 2.39) | 0.09 | 2.28 | 2.29 | (2.09 - 2.4) | 0.09 | 2.21 | 2.26 | (2.09 - 2.4) | 0.09 |
| Anterior chamber width (cm) | 0.57 | 0.57 | (0.42 - 0.67) | 0.06 | 0.56 | 0.54 | (0.4 - 0.69) | 0.07 | 0.56 | 0.57 | (0.4 - 0.69) | 0.07 |
| Posterior chamber (UH) | -4.62 | -5.00 | (-8 - -2) | 1.63 | -3.81 | -4.00 | (-7 - -2) | 1.50 | -4.26 | -4 | (-8 - -2) | 1.60 |
| Anterior chamber (UH) | -8.57 | -8.00 | (-14 - -6) | 2.13 | -7.48 | -7.00 | (-13 - -4) | 2.02 | -8.05 | -8 | (-14 - -4) | 2.12 |
| Lens (UH) | 129.62 | 129.00 | (113 - 147) | 7.41 | 128.43 | 129.00 | (101 - 139) | 7.62 | 124.93 | 129 | (101 - 147) | 7.45 |
Disclaimer/Publisher’s Note: The statements, opinions and data contained in all publications are solely those of the individual author(s) and contributor(s) and not of MDPI and/or the editor(s). MDPI and/or the editor(s) disclaim responsibility for any injury to people or property resulting from any ideas, methods, instructions or products referred to in the content. |
© 2025 by the authors. Licensee MDPI, Basel, Switzerland. This article is an open access article distributed under the terms and conditions of the Creative Commons Attribution (CC BY) license (http://creativecommons.org/licenses/by/4.0/).
Copyright: This open access article is published under a Creative Commons CC BY 4.0 license, which permit the free download, distribution, and reuse, provided that the author and preprint are cited in any reuse.


