
Submitted:
30 July 2025
Posted:
05 August 2025
You are already at the latest version
Abstract
(1) Background: Estrogen Receptor Beta 1 (ERβ1), encoded by the ESR2 gene, plays a key tumor-suppressive role in hormone-dependent cancers. However, the impact of nonsynonymous single-nucleotide polymorphisms (nsSNPs) and untranslated region (UTR) variants in ESR2 remains underexplored.; (2) Methods: We performed a comprehensive in silico analysis of high-risk pathogenic nsSNPs and UTR variants using genomic data from Ensembl and predictive tools including PredictSNP, I-Mutant, MUpro, MutPred2, CScape, STRING, KEGG, GO, RegulomeDB, polymiRTS, and cBioPortal. Variants were assessed for their effects on ERβ1 protein structure, stability, regulatory interactions, and oncogenicity; (3) Results: Ninety-three missense nsSNPs were predicted as deleterious across all tools. Key variants such as C149G, D154G, and L380P destabilized ERβ1, especially within the DNA-binding and ligand-binding activation function 2 domains. Oncogenic drivers such as R198P and D154N showed high CScape scores and extremely low allele frequencies, indicating pathogenic potential. Mutations impaired coactivator recruitment and disrupted interactions with transcription factors including NCOA1, SP1, and JUN. Additionally, 3′ UTR variants such as rs4986938 and miRNA-disrupting SNPs such as rs139004885 demonstrated strong post-transcriptional regulatory effects; (4) Conclusions: This integrative computational study identifies high-impact ESR2 variants that compromise ERβ1 function and regulation, revealing their oncogenic potential in hormone-sensitive cancers. These findings highlight the importance of further experimental validation and their relevance in targeted therapy and biomarker development.
Keywords:
ESR2
; estrogen receptor beta 1
; nsSNPs
; structural modeling
; cancer genomics
; UTR variants
; protein stability
; endocrine resistance
; in silico analysis
1. Introduction
Estrogen receptor beta 1 (ERβ1), encoded by the ESR2 gene, is a crucial component of the nuclear hormone receptor superfamily and functions as a ligand-activated transcription factor [1,2,3,4]. ERβ1 is implicated in estrogen action in various tissues, including the breast, ovary, prostate, colon, and brain [1,2,3,4]. In contrast to ERα, which predominantly exerts growth-stimulating effects, ERβ1 primarily exhibits anti-proliferative and pro-apoptotic actions, underscoring its potential role as a tumor suppressor [5].
ERβ is structurally organized into five main domains: the N-terminus A/B domain (containing activation function-1, AF-1), the DNA binding domain (DBD), the hinge region, the ligand-binding domain (LBD), which includes activation function-2 (AF-2), and the C-terminus F domain. The AF-1 region is shorter and transcriptionally less active in ERβ than in ERα [6], but the DBD enables the specific recognition of estrogen response elements (EREs) in various target genes [7]. The LBD is essential for ligand binding, recruitment of coactivators, and transcriptional activation [8]. Specifically, structural disparities in helix 12 among ERβ isoforms (e.g., ERβ2, ERβ4, and ERβ5) affect their transcriptional ability, and only ERβ1 displays full transcriptional activation [8]. In addition, ERβ function is modulated by post-translational modifications, such as phosphorylation and O-GlcNAcylation, as well as by dimerization with itself or ERα [9].
Mutations across the ERβ1 domains, particularly in the DBD and LBD, may lead to significant disruptions in the functional integrity of the receptor. For instance, changes in helix 12 of the LBD disrupt ligand binding and coactivator recruitment, which in turn affect downstream gene regulation [8,10]. Splice variants lacking a functional helix 12, including ERβ2, ERβ4, and ERβ5, are unable to transactivate DNA by themselves, but may dimerize with ERβ1 and affect its function [8]. Mutations in the DBD, particularly in zinc finger motifs, disrupt the DNA binding potential and disrupt the interaction of ER with Stat5b, which is critical for transcriptional synergy. These mutations can affect the sensitivity of the ligand/antagonist through its receptor, such as tamoxifen, ICI 182,780, emphasizing the scope of the structural disruptions in ERβ signal transduction [11].
Functional effects are not confined to protein domains. Genetic variation within the ESR2 gene, particularly nsSNPs, can cause ERβ1 to function abnormally by altering the protein structure, receptor-ligand and receptor-cofactor interactions, and post-translational modifications. Such changes might disrupt the functions of ERβ1 in controlling the expression of cell cycle, apoptosis, and differentiation-related genes. For instance, polymorphisms, specifically rs1256049 and rs4986938, have been associated with varying cancer risks in various populations [12,13,14,15].
Non-coding variants also exert regulatory effects, including SNPs located in UTRs, promoters, and introns, that can alter the transcription, stability, and translation of ESR2. For instance, the rs35036378 variant in the TATA-box decreases promoter activity by approximately 50%, highlighting the functional effect of regulatory mutations. Additionally, miRNA target site polymorphisms in the 3′ UTR can disrupt miRNA binding capability and alter ERβ1 expression. Although such effects have been firmly established in ESR1, studies of miRNA-mediated regulation in ESR2 are still emerging [14,16,17,18].
Polymorphisms in miRNA target sites in the 3′UTR of genes contribute to disease susceptibility by affecting gene expression through changing the binding affinity of a miRNA. In contrast, functional miRNA target site variants have been well-characterized in several genes, including the ESR1 gene, where the rs2747648 SNP influences breast cancer risk through altered miR-453 binding [19]. However, evidence from studies on other genes suggests that SNPs within 3 ′ UTRs frequently disrupt or enhance miRNA interactions, thereby affecting gene regulation [20].
The context-dependent nature of ESR2 variants is also evident in their diverse associations with cancer. ERβ1 downregulation is associated with a poorer prognosis in breast cancer, and the ERβ rs4986938 polymorphism has been associated with an increased risk for colorectal cancer, especially in the setting of high levels of estrogen [21]. Similar relationships have been reported in ovarian and lung cancers [22], indicating that both gene-environment interactions and tissue-specific factors contribute to the pathogenicity of ESR2 variants [23].
Several investigations have reported a strong relationship between polymorphisms in ESR1 and ESR2 and the development of polycystic ovary syndrome (PCOS). In particular, nsSNPs such as rs9340799 and rs1999805 in the ESR1 gene have been linked to increased PCOS susceptibility among Pakistani and Chinese populations, respectively [15,24]. Additional supporting data have been reported in a Tunisian cohort, which identified strong associations between PCOS and ESR1 SNPs rs2234693 and rs3798577, as well as rs1256049 in ESR2 [25]. In a similar study, SNPs rs2234693, rs9340799, rs8179176 (ESR1), and rs4986938 (ESR2) showed significant correlations with PCOS in women from Punjab, Pakistan [15].
At the structural level, SNPs such as rs1554259481, rs104893956, and rs755667747 in ESR1 and seven SNPs in ESR2—including rs1463893698 and rs140630557—were predicted to induce significant alterations in protein conformation and physicochemical properties. These structural changes may impact receptor function, particularly their ability to bind estrogen (E2), a crucial step in downstream hormonal signaling. Indeed, docking studies revealed that SNPs rs1467954450 (ESR1), rs1463893698, and rs140630557 (ESR2) significantly impaired E2 binding, which may contribute to estrogen insensitivity and hormonal imbalance in patients with PCOS [26].
A significant challenge in cancer genomics is to differentiate between “driver” mutations, which promote tumor development, and “passenger” mutations, which accumulate without functional effect. Understanding how nsSNPs and non-coding variants affect ESR2 gene regulation and protein function is essential for classifying these variants and evaluating their biological relevance [27,28,29].
Despite the increasing recognition of ERβ1 as a tumor suppressor in hormone-related cancers, the comprehensive characterization of nsSNPs within the ESR2 gene remains limited. While individual variants have been associated with cancer risk, there is a lack of systematic analysis integrating structural modeling, protein stability assessment, and functional prediction to determine the precise molecular consequences of these mutations. In particular, the impact of nsSNPs on critical ERβ1 domains, such as the DBD, LBD, and AF-1/2 region, has not been fully elucidated. Furthermore, few studies have examined whether these variants act as driver mutations that influence cancer initiation and progression, or merely as passenger alterations. This gap hinders the translation of ESR2 variant profiling into clinically actionable biomarkers or therapeutic targets.
This study aims to comprehensively characterize the functional impact of high-risk nsSNPs within the ESR2 gene, with particular emphasis on their effects on the structure, stability, and pathogenic potential of the ERβ1 protein. To achieve this, we will first identify and prioritize deleterious nsSNPs using a consensus of computational prediction tools that evaluate sequence conservation, physicochemical disruption, and structural impact. We will then employ molecular modeling approaches to assess how these variants alter the three-dimensional conformation and thermodynamic stability of ERβ1, with a focus on key functional domains, including the DBD, LBD, and AF-1/ 2. To evaluate the clinical significance of these variants, we will associate the identified oncogenic nsSNPs with public cancer datasets to investigate potential correlations between nsSNPs and various cancers. Finally, we will explore whether the identified variants act as driver mutations with oncogenic potential or represent neutral passenger mutations, thereby advancing our understanding of ESR2 variant biology.
2. Materials and Methods
2.1. Data Retrieval
The dataset of nsSNPs associated with the ESR2 gene encoding ERβ1 protein (Ensembl Gene ID: ENSG00000140009) was retrieved from the ENSEMBL database [30]. A missense variant filter was applied to isolate missense nsSNPs specifically linked to this gene. The overall methodological workflow is illustrated in Figure 1. Additionally, the corresponding ERβ1 protein sequence was obtained in FASTA format from the UniProt database (UniProt ID: Q92731).
2.2. Identification of Functionally Damaging nsSNPs
PredictSNP was employed to evaluate the potential functional impact of the identified nsSNPs, determining whether each variant is likely to be benign or deleterious [31] (accessed on January 22, 2024). This integrative tool consolidates the predictive outputs of multiple established algorithms, including SNAP, MAPP, PhD-SNP, SIFT, PolyPhen-1, and 2, to generate a comprehensive consensus prediction. By leveraging the complementary strengths of these individual tools, PredictSNP enhances predictive accuracy and offers a more robust assessment of the potential pathogenicity of nsSNPs compared to single-method approaches.
2.3. Identification of nsSNPs Within Conserved Domains of the ERβ Protein
The InterPro tool [32,33] (https://www.ebi.ac.uk/interpro/, accessed on February 1, 2024) was utilized to map the identified nsSNPs onto the conserved domains of the ERβ protein. InterPro integrates multiple protein signature databases, including Pfam, PROSITE, PRINTS, ProDom, SMART, TIGRFAMs, PIRSF, SUPERFAMILY, Gene3D, and PANTHER, enabling comprehensive annotation of protein domains and functional motifs. This integrative approach facilitates the identification of conserved regions and provides insights into the potential functional consequences of nsSNPs. The ERβ protein sequence in FASTA format was retrieved directly from InterPro for this analysis.
2.4. Prediction of Protein Stability Alterations
To evaluate the impact of amino acid substitutions on ERβ protein stability, two predictive computational tools were employed: I-Mutant 2.0 and MUpro. I-Mutant 2.0 (https://folding.biofold.org/cgi-bin/i-mutant2.0.cgi, accessed on February 8, 2024) is a support vector machine (SVM)-based algorithm designed to predict protein stability changes resulting from single-site mutations. It classifies mutations as stabilizing or destabilizing with approximately 80% accuracy, particularly when the protein’s three-dimensional structure is available. In this study, missense nsSNPs were analyzed under standard conditions (25°C, pH 7.0). The tool outputs the predicted Gibbs free energy change (ΔΔG), a qualitative classification of the stability effect, and a reliability index (RI) for each prediction [34].
In parallel, MUpro (http://mupro.proteomics.ics.uci.edu/, accessed February 8, 2024) was also used to assess the impact of mutations on protein stability. MUpro integrates two machine learning models—SVM and neural networks—trained on extensive mutation datasets, achieving an accuracy of over 84% through 20-fold cross-validation. Unlike I-Mutant 2.0, MUpro does not require structural information and can operate solely on sequence data. The tool provides a predicted ΔΔG value and a confidence score ranging from -1 to 1, where scores below 0 indicate reduced stability and scores above 0 suggest increased stability [35]. All predictions were performed using default parameters, and interpretation followed established criteria.
2.5. Structural Impact Assessment of nsSNPs on the Human ERβ Protein
To evaluate the potential structural implications of nsSNPs on the human ERβ1 protein, the Project HOPE platform (Have Our Protein Explained) version 1.1.1 was employed, accessible at https://www3.cmbi.umcn.nl/hope/, accessed on February 8, 2024). This tool requires the input of protein sequences in FASTA format along with detailed SNP information. Project HOPE integrates data from various bioinformatics resources, including the WHAT IF modeling software, UniProt database, and the Distributed Annotation System (DAS), to provide comprehensive insights into structural alterations.
The platform generates a homology-based model that enables in-depth exploration of the potential impact of mutations. Through comparative analysis of the wild-type and mutant protein forms, Project HOPE elucidates the structural and functional consequences of each nsSNP. The results are presented with extensive annotations, illustrative graphics, and dynamic animations to facilitate interpretation.
2.6. Evaluation of the Molecular Pathogenicity of nsSNPs
To investigate the potential functional consequences and molecular pathogenicity of amino acid substitutions within the ERβ1 protein, the MutPred2 algorithm was employed (available at: http://mutpred.mutdb.org; accessed February 8, 2024). MutPred2 predicts the pathogenic potential of nsSNPs by estimating the probability that an amino acid substitution is deleterious, using a significance threshold of p < 0.05 [36].
This tool integrates a broad range of structural and functional protein features, including secondary structure, transmembrane regions, signal peptides, catalytic activity, binding affinities (macromolecular and metal), post-translational modifications (PTMs), and allosteric regulation. Variations in amino acid residues can disrupt these properties, potentially resulting in altered protein stability, loss or gain of PTM sites, impaired structural integrity, and compromised interactions with other biomolecules—thereby affecting protein behavior and function at the molecular level.
In this study, the FASTA sequence of the human ERβ1 protein, along with precise details of the amino acid substitutions, was submitted to the MutPred2 server. The algorithm outputs a probabilistic score reflecting the likelihood that each nsSNP is associated with a deleterious or disease-related effect. Additionally, it provides a ranked list of predicted molecular alterations, each accompanied by an empirical p-value, highlighting specific functional disruptions associated with each variant that fall within the defined statistical threshold.
2.7. Oncogenic and Phenotypic Characterization
The oncogenic potential of the identified nsSNPs was comprehensively assessed using the CScape and CScape Somatic tools. CScape assigns a predictive score to each nsSNP, categorizing variants as oncogenic with high confidence or benign. These classifications are based on machine learning models trained on large cancer genomics datasets, with prediction accuracies of approximately 92% in coding regions and around 76% in the non-coding areas [37]. The scoring system reflects the likelihood of a variant possessing oncogenic characteristics, with higher scores indicating a stronger association with tumorigenic potential. CScape thus enables the prioritization of variants for further investigation based on their predicted impact on cancer development. Additionally, CScape Somatic was employed to evaluate somatic point mutations identified in coding regions of the cancer genome. This tool distinguishes whether such mutations are likely to be oncogenic—acting as potential drivers of cancer—or neutral, thereby refining the functional interpretation of the mutation landscape in oncogenesis [38]. CScape-somatic: Trained on pan-cancer somatic mutations (COSMIC, TCGA), incorporating protein structure, evolutionary conservation, and mutational hotspots. Scores >0.7 indicate high-confidence drivers.
2.8. Prediction of Protein–Protein Interactions via the STRING Database
To elucidate these protein-protein interactions (PPIs) of the ESR2, the Search Tool for the Retrieval of Interacting Genes/Proteins (STRING) database was utilized (available at: http://string-db.org; accessed February 25, 2024) [39,40]. STRING facilitates the identification of functional associations among proteins, drawing on diverse sources, including experimental data, computational prediction methods, and public text collections.
As of the most recent update, the STRING database encompasses 24,584,628 proteins across 5,090 different species, enabling broad-spectrum interactome analyses. For this study, the FASTA sequence of the human ESR2 protein was submitted to identify its potential interaction partners. The resulting output provides a comprehensive interaction network annotated with confidence scores, quantifying the reliability of each predicted interaction. These interaction insights contribute to a deeper understanding of ESR2's functional role in cellular and molecular pathways.
2.9. Functional and Pathway Enrichment Analysis Utilizing STRING
The functional analysis entailed annotating and refining proteins within the network based on their specific roles. Pathway enrichment was predominantly executed utilizing Gene Ontology (GO) terms, which encompass biological processes, molecular functions, and cellular components, in conjunction with pathway-based analyses. To comprehend the physical and biological significance of the network, conducting a functional analysis is essential. Specifically, GO and KEGG pathway enrichment analyses were carried out using the STRING database.
2.10. Analysis of the Functional Significance of Non-Coding SNPs (ncSNPs) in the ESR2 Gene: An Evaluation of Regulatory Function Using RegulomeDB
We obtained ncSNPs from the non-coding regions of the ESR2 gene utilizing data from the ENSEMBL and genomeAD databases. These ncSNPs were subsequently mapped to human genome regulatory elements using RegulomeDB [41]. The input consisted of SNP IDs with a minor allele frequency (MAF) below 0.001, originating from the 5′ or 3′ untranslated regions (UTRs), as retrieved from the Ensembl database. The results encompassed information such as chromosomal position, dbSNP ID, rank, and score. Detecting functional variants within these regions is crucial, as they have the potential to influence regulatory functions. RegulomeDB facilitates the prediction and ranking of ncSNPs as regulatory elements by integrating data from various sources, including ENCODE ChIP-seq, FAIRE, DNase I hypersensitive sites, eQTLs, and dsQTLs. This ranking system categorizes ncSNPs into six groups based on their potential effects on transcription factor binding or gene expression (see Table S1).
2.11. Analysis of How 3UTR SNPs Influence microRNA (miRNA) Binding Sites
To evaluate the impact of UTRs variants on microRNA-binding sites, we utilized PolymiRTS Database 3.0 to analyze both 3′ and 5′ UTR variants (https://compbio.uthsc.edu/miRSNP/; accessed on 22 November 2024) [42] . This tool requires the input of a specific variant ID and provides outputs including the corresponding miRNA ID, functional annotation, and Context+ score. Variant effects are categorized into four functional classes: “D” (disruption of a conserved miRNA-binding site), “N” (disruption of a non-conserved site), “C” (creation of a novel miRNA-binding site), and “O” (ancestral allele data unavailable). The Context+ score further quantifies the impact, with more negative values suggesting a greater potential for disease association due to disrupted miRNA targeting.
3. Results
3.1. Identifying the Functional Impact of nsSNPs Within the ESR2 Gene
To evaluate the potential functional consequences of missense variants in the ESR2 gene, a total of 93 nsSNPs were analyzed using multiple in silico prediction tools. The identified missense nsSNPs exhibited a consistent prediction across all platforms, being classified as "Deleterious" by PredictSNP, "Deleterious" by the combined MAPP, PhD-SNP, SIFT, and SNAP tools, and "Damaging" by PolyPhen-1 and PolyPhen-2. This uniformity across diverse algorithms highlights a strong consensus regarding the detrimental impact of these amino acid substitutions on protein structure and function (Table 1). Notably, several SNPs, such as rs766405281, which presented multiple amino acid substitutions at position C191 (C191G, C191R, C191S, C191Y), were consistently predicted as deleterious, suggesting that this residue may represent a critical functional or structural hotspot within the protein. Similarly, recurrent mutations at residues like R198, L339, and R388 further underscore regions of potential functional importance.
3.2. Identification of ERß1 Gene Domains Using InterPro
Figure 2 illustrates the domain architecture of the ERβ1 protein as predicted by InterPro software, emphasizing three principal functional regions: the N-terminal domain (residues 1–125), the DNA-binding domain (DBD; residues 146–217), and the C-terminal ligand-binding domain (LBD; residues 264–498). The N-terminal domain encompasses the activation function 1 (AF-1) region, which mediates ligand-independent transcriptional activity. The centrally located DBD contains two zinc finger motifs, essential for DNA recognition and binding to estrogen response elements (EREs). The LBD, accounting for nearly half of the protein length, facilitates hormone binding, receptor dimerization, and coactivator recruitment via its activation function 2 (AF-2) surface. A short hinge region (residues 217–264), serving as a flexible linker, connects the DBD and LBD, influencing nuclear localization and protein stability.
3.3. Predicted Effects of Missense SNPs on Protein Stability Across Functional Domains
The I-Mutant analysis revealed that a majority of variants are predicted to decrease protein stability, with reliability index (RI) values ranging from 1 to 9. Free energy change (ΔΔG) values from I-Mutant were largely negative, supporting destabilizing effects, particularly in functionally critical regions such as the DBD and LBD. Variants such as C149G, D154G, and L380P showed substantial negative ΔΔG values (e.g., −3.26, −2.25, and −3.44 kcal/mol, respectively), suggesting strong destabilizing effects.
In concordance, MUpro predictions also indicated that most variants reduce protein stability, as evidenced by negative ΔΔG values. A small subset of mutations, such as S112L, K208M, T290I, and S529F, were predicted to increase stability by at least one tool; however, their ΔΔG values were modest, implying limited stabilizing potential.
Mutations in the DBD and LBD were especially frequent and consistently predicted to destabilize ESR2, emphasizing their potential functional significance. Notably, several residues, including C191, R198, and L339, had multiple reported substitutions, all of which were predicted to impact protein stability negatively.

Table 2.
Predicted effects of nsSNPs on ESR2 protein stability based on I-Mutant and MUpro analyses. This table presents nsSNPs in the ESR2 gene and their predicted impact on protein stability. The table includes the SNP ID, associated amino acid (AA) change, and corresponding protein domain (N-terminal, DBD, hinge, or LBD) if known. Predictions from I-Mutant include the direction of stability change (increase/decrease), the reliability index (RI), and the ΔΔG free energy change (in kcal/mol). Similarly, MUpro predictions indicate the stability trend and provide a corresponding ΔΔG value. Negative ΔΔG values imply decreased stability, while positive values suggest increased stability. Variants predicted by both tools to destabilize the protein may represent functionally disruptive mutations with potential pathological relevance.
| SNP Id | AA change |
Protein domain |
I-mutant | RI | DDG-Free energy change value |
MUpro | DDG |
|---|---|---|---|---|---|---|---|
| rs1241458487 | P44L | AF-1 | Decrease | 3 | -0.68 | Increase | 0.12 |
| rs147382781 | R93C | AF-1 | Decrease | 5 | -1.76 | Decrease | -0.59 |
| rs911726841 | P106R | AF-1 | Decrease | 4 | -0.25 | Decrease | -1.13 |
| rs141516067 | S112L | AF-1 | Increase | 0 | 0.14 | Increase | 0.16 |
| rs774742997 | A134T | AF-1 | Decrease | 4 | -0.18 | Decrease | -0.71 |
| rs1351313879 | C149G | DBD | Decrease | 8 | -3.26 | Decrease | -1.71 |
| rs1353654623 | C152Y | DBD | Decrease | 2 | 0.2 | Decrease | -0.74 |
| rs775445438 | D154G | DBD | Decrease | 4 | -2.25 | Decrease | -1.88 |
| rs760612953 | D154N | DBD | Decrease | 3 | -0.33 | Decrease | -1.17 |
| rs1472743418 | A156T | DBD | Decrease | 6 | -0.5 | Decrease | -1.27 |
| rs1016270637 | S157L | DBD | Decrease | 4 | -0.22 | Decrease | -0.1 |
| rs1411758930 | H160R | DBD | Decrease | 7 | -0.28 | Decrease | -0.82 |
| rs770224156 | Y161C | DBD | Decrease | 5 | -0.14 | Decrease | -0.93 |
| rs1261390478 | G162R | DBD | Decrease | 8 | 0.07 | Decrease | -0.63 |
| rs141760704 | S165L | DBD | Increase | 0 | -0.09 | Increase | 0.37 |
| rs1273276574 | C169F | DBD | Decrease | 3 | 0.02 | Decrease | -0.86 |
| rs1029338063 | C169R | DBD | Decrease | 5 | -0.67 | Decrease | -1.19 |
| rs1457342604 | S176R | DBD | Decrease | 3 | -1.17 | Decrease | -0.78 |
| rs1367633095 | N189Y | DBD | Decrease | 3 | -0.01 | Decrease | -0.39 |
| rs766405281 | C191G | DBD | Decrease | 6 | -1.18 | Decrease | -1.85 |
| rs766405281 | C191R | DBD | Decrease | 5 | 0.57- | Decrease | -1.2 |
| rs766405281 | C191S | DBD | Decrease | 6 | -0.64 | Decrease | -1.56 |
| rs1305200621 | C191Y | DBD | Decrease | 4 | 0.01- | Decrease | -1.03 |
| rs773394073 | I193N | DBD | Decrease | 8 | 0.65- | Decrease | -1.98 |
| rs145278854 | D194N | DBD | Decrease | 6 | -0.45 | Decrease | -1.01 |
| rs760053106 | R197W | DBD | Decrease | 5 | 0.04 | Decrease | -1.1 |
| rs768839285 | R198C | DBD | Decrease | 4 | 0.14- | Decrease | -1.03 |
| rs1489920793 | R198P | DBD | Decrease | 4 | 0.96- | Decrease | -1.59 |
| rs748841139 | R205Q | DBD | Decrease | 9 | 0.87- | Decrease | -0.69 |
| rs371856990 | R207W | DBD | Decrease | 6 | 0.02 | Decrease | -1.184 |
| rs368924653 | R207Q | DBD | Decrease | 9 | -0.84 | Decrease | -1.17 |
| rs909370443 | K208M | DBD | Increase | 4 | 0.67 | Decrease | -0.12 |
| rs556956556 | E211K | DBD | Decrease | 9 | -1.37 | Decrease | -0.67 |
| rs1410117865 | M214V | DBD | Decrease | 7 | 0.62- | Decrease | -0.95 |
| rs1290256152 | M214I | DBD | Decrease | 7 | 0.84- | Decrease | -0.67 |
| rs1190163038 | R220Q | DBD | Decrease | 9 | -1.51 | Decrease | -0.55 |
| rs1307959271 | R227C | DBD | Decrease | 3 | 0.26- | Decrease | -0.32 |
| rs755401425 | D236Y | DBD | increase | 0 | 0.31- | Decrease | -0.81 |
| rs766843910 | E237K | DBD | Decrease | 8 | -0.93 | Decrease | -0.65 |
| rs576722274 | K244E | DBD | Decrease | 4 | 0.06 | Decrease | -0.14 |
| rs1220163606 | R247K | DBD | Decrease | 8 | 0.99- | Decrease | -0.82 |
| rs543025691 | A252T | DBD | Decrease | 5 | 0.22- | Decrease | -0.2 |
| rs1307959271 | R227C | Hinge | Decrease | 3 | 0.26- | Decrease | -0.32 |
| rs1199203068 | R256W | LBD | Decrease | 7 | 0.47- | Decrease | -0.08 |
| rs768870975 | P277Q | LBD | Decrease | 8 | 1.93- | Decrease | -0.86 |
| rs1436572414 | P277S | LBD | Decrease | 8 | 1.90- | Decrease | -1.08 |
| rs1488031774 | T290I | LBD | Increase | 6 | 1.03 | Decrease | -0.23 |
| rs747036560 | D303N | LBD | Decrease | 2 | 0.16- | Decrease | -1.11 |
| rs539389612 | K304T | LBD | Increase | 5 | 0.01- | Decrease | -0.77 |
| rs550448628 | W312C | LBD | Increase | 2 | 0.35 | Decrease | -0.77 |
| rs138920605 | P317T | LBD | Decrease | 8 | -1.82 | Decrease | -1.23 |
| rs2229618 | L322V | LBD | Increase | 7 | 0.48 | Decrease | -0.99 |
| rs905821436 | D326N | LBD | Decrease | 2 | -0.78 | Decrease | -0.87 |
| rs145661652 | R329Q | LBD | Decrease | 9 | -1.31 | Decrease | -0.43 |
| rs1276302781 | L330H | LBD | Decrease | 8 | -2.42 | Decrease | -2.64 |
| rs149090049 | W335R | LBD | Decrease | 7 | -1.57 | Decrease | -1.17 |
| rs755668062 | L339P | LBD | Increase | 5 | 0.35 | Decrease | 1.96- |
| rs755668062 | L339Q | LBD | Decrease | 3 | -0.37 | Decrease | 1.61- |
| rs553390407 | G342E | LBD | Increase | 3 | 0.56 | Decrease | -0.6 |
| rs553390407 | G342V | LBD | Decrease | 5 | -0.64 | Decrease | 0.24- |
| rs1194417609 | W345C | LBD | Decrease | 5 | -0.47 | Decrease | 0.85- |
| rs200264592 | R346C | LBD | Decrease | 6 | -1.6 | Decrease | 0.78- |
| rs1339881550 | R346H | LBD | Decrease | 8 | -0.89 | Decrease | 1.36- |
| rs368060197 | G352S | LBD | Decrease | 8 | -1.25 | Decrease | -0.66 |
| rs1294597204 | A357V | LBD | Decrease | 3 | -0.21 | Decrease | 0.49- |
| rs141474553 | R364S | LBD | Decrease | 8 | -0.69 | Decrease | 1.38- |
| rs745947456 | V370I | LBD | Decrease | 8 | -1.01 | Decrease | -0.58 |
| rs1249242790 | L380P | LBD | Decrease | 8 | -3.44 | Decrease | -2.26 |
| rs112017626 | L381P | LBD | Decrease | 8 | -2.25 | Decrease | -1.99 |
| rs1010629502 | R386G | LBD | Decrease | 9 | -2.46 | Decrease | -1.38 |
| rs764756707 | R388Q | LBD | Decrease | 5 | -0.14 | Decrease | -0.7 |
| rs764756707 | R388P | LBD | Decrease | 7 | -1.66 | Decrease | -1.05 |
| rs1012693115 | Y397H | LBD | Decrease | 8 | -1.27 | Decrease | -1.66 |
| rs1197276001 | L398R | LBD | Decrease | 3 | 0.12 | Decrease | -1.54 |
| rs1432744457 | M403R | LBD | Increase | 3 | 0.79 | Decrease | -1.81 |
| rs111471356 | L406R | LBD | Increase | 2 | 0.45 | Decrease | -1.49 |
| rs778031158 | N407Y | LBD | Decrease | 7 | -0.97 | Decrease | -0.48 |
| rs2229618 | L413V | LBD | Decrease | 8 | -0.86 | Decrease | -0.88 |
| rs1217623435 | L426R | LBD | Decrease | 3 | -0.02 | Decrease | -1.44 |
| rs755668062 | L430P | LBD | Increase | 6 | -0.18 | Decrease | -1.85 |
| rs768924970 | R454C | LBD | Decrease | 1 | -0.36 | Decrease | -0.74 |
| rs775944471 | L455P | LBD | Increase | 4 | -0.45 | Decrease | -2.28 |
| rs375446581 | L462P | LBD | Increase | 2 | 1 | Decrease | -1.9 |
| rs767658683 | E474G | LBD | Decrease | 6 | -0.46 | Decrease | -1.37 |
| rs1451169980 | V485A | LBD | Decrease | 1 | -0.69 | Decrease | -1.03 |
| rs528840784 | R501C | LBD | Decrease | 5 | -0.75 | Decrease | -0.77 |
| rs766524153 | G502R | LBD | Decrease | 8 | -0.81 | Decrease | -0.65 |
| rs565210086 | P514L | LBD | Decrease | 1 | -0.5 | Decrease | -0.05 |
| rs757686092 | S529F | LBD | Increase | 7 | 1.52 | Increase | 0.33 |
3.4. Structural Implications of ESR2 nsSNPs on Protein Conformation
The HOPE-based structural predictions revealed that the examined nsSNPs can profoundly affect ESR2's molecular architecture through diverse alterations in residue properties, including size, charge, hydrophobicity, and conservation patterns, with many occurring in evolutionarily conserved regions.
A substantial proportion of the analyzed variants affected cysteine residues (C149G, C152Y, C191Y/S/G/R, Y161C, C169F/R, R227C, R444C), resulting in the loss of structurally critical disulfide bonds and aromatic interactions. These substitutions frequently introduced steric clashes due to the bulkier side chains (e.g., C152Y, C191Y) or destabilized the protein core by introducing smaller residues (e.g., C191G). Notably, mutations impacting proline and glycine residues (P156R, G162R, G352S, G502R, G542V) were particularly disruptive, as they compromised backbone flexibility and secondary structure stability, suggesting potential folding defects.
Electrostatic interactions were significantly altered by charge-reversing mutations (E211K, E237K, K244E) and loss-of-charge variants (D154N/G, D303N, D326N, R197W/Q, R198P/C, R205Q, R207W/Q, R329Q, R388Q). Such modifications may impair ligand binding, protein dimerization, or DNA recognition, particularly when occurring in conserved functional domains. Additionally, the stability of the hydrophobic core was affected by increased hydrophobicity (S157L, N179Y, V370I) or loss of hydrophobic packing (W535R), which may lead to misfolding or aggregation.
Several high-impact variants were identified in highly conserved regions (D303N, G352S, V370I, R388Q, G502R), reinforcing their likely functional significance. Mutations involving glycine (G352S, G502R) and charged residues (E237K, R554S) in these regions were particularly concerning, given their roles in maintaining structural integrity and regulating molecular interactions. Collectively, these findings suggest that ESR2 nsSNPs may contribute to altered receptor function through various structural mechanisms, warranting further experimental investigation to assess their phenotypic consequences.
3.5. Predicted Pathogenicity and Molecular Impact of ESR2 nsSNPs
To investigate the potential molecular consequences of selected nsSNPs in the ESR2 gene, we employed MuPred2, a predictive model integrating protein-level features to estimate mutation pathogenicity and associated molecular mechanisms. Each variant was evaluated for its MuPred2 score (ranging from 0 to 1) and related functional alterations, including structural, biochemical, and post-translational modifications, with emphasis on those supported by p-values < 0.05. Among the 29 analyzed mutations, all had MuPred2 scores above 0.6, indicating a high likelihood of pathogenicity. Notably, several variants exhibited scores above 0.9, including C169R (0.936), C169 R/F (0.936/0.919), and G162R (0.910), indicating robust predictions of deleterious effects. The most commonly affected molecular mechanisms included: Altered disordered or ordered interface regions, found in numerous mutations (e.g., H160R, C169R, R198C), suggesting possible impacts on protein-protein interactions, Loss or gain of post-translational modifications (PTMs), including disulfide linkages (C191G/R/S/Y), GPI-anchor amidation (N189, N407), and ubiquitylation (K300), indicating significant changes in protein regulation and localization. Structural perturbations, such as loss/gain of helices or strands and changes in metal binding capacity, imply effects on overall protein folding and function. Variants at C191 (C191G, C191R, C191S, C191Y) were of particular interest, as they consistently exhibited: Loss of disulfide linkage, Disruption of transmembrane or DNA-binding regions, and changes in glycosylation or GPI-anchor modification at nearby residues (notably N189). Moreover, mutations such as R198P, D154N, and N189Y demonstrated multi-mechanistic impacts, suggesting broad structural and functional consequences. The collective findings highlight critical residues—particularly within the DNA-binding and transmembrane regions—as hotspots for functionally impactful mutations in ESR2.
Table 3.
MuPred2 predictions of pathogenicity and associated molecular mechanisms for selected ESR2 missense variants. This table presents the predicted functional impact of selected amino acid substitutions in the ESR2 gene, as determined by MuPred2. The MuPred2 score (ranging from 0 to 1) reflects the probability of pathogenicity, with higher scores indicating greater predicted impact. Molecular mechanisms with p-values < 0.05 are listed and include structural alterations (e.g., gain/loss of helix or strand), disruption of interaction interfaces (ordered/disordered), changes in post-translational modifications (e.g., sulfation, glycosylation, ubiquitylation), and effects on DNA binding or transmembrane regions.
| AA change | MuPred2 Score |
Molecular mechanisms With p p-value less than 0.05 |
|---|---|---|
| C149G | 0.868 | Gain of Strand Altered Stability |
| C152Y | 0.899 | Altered Ordered interface. Gain of Sulfation at Y155 |
| D154G | 0.849 | Altered Ordered interface. Loss of Sulfation at Y155 |
| D154N | 0.723 | Loss of Loop Loss of Sulfation at Y155 |
| S157L | 0.82 | Altered Ordered interface. Loss of Sulfation at Y155 |
| H160R | 0.897 | Altered Ordered interface. Loss of Sulfation at Y155 |
| Y161C | 0.851 | Altered Ordered interface. Altered Metal binding |
| GI62R | 0.91 | Gain of Helix Altered Ordered interface. Altered Metal binding |
| C169F | 0.919 | Altered Metal binding. Altered Disordered interface Altered Transmembrane protein. Gain of Disulfide linkage at C166 |
| C169R | 0.936 | Altered Metal binding. Altered Disordered interface. Gain of Acetylation at K174 Altered Transmembrane protein. Gain of Disulfide linkage at C166 |
| S176R | 0.899 | Gain of ADP-ribosylation at S176 Altered Transmembrane protein |
| N189Y | 0.868 | Altered Disordered interface. Loss of Disulfide linkage at C191 Altered Ordered interface. Altered Metal binding Altered Transmembrane protein Loss of GPI-anchor amidation at N189 |
| C191G | 0.898 | Loss of Disulfide linkage at C191 Altered Disordered interface. Loss of helix Altered Transmembrane protein Altered DNA binding. Altered Stability Gain of GPI-anchor amidation at N189 |
| C191R | 0.927 | Loss of Disulfide linkage at C191 Altered Disordered interface. Altered Transmembrane protein. Altered DNA binding. Loss of GPI-anchor amidation at N189 |
| C191S | 0.852 | Loss of Disulfide linkage at C191 Altered Disordered interface. Altered Transmembrane protein. Altered DNA binding. Gain of N-linked glycosylation at N189 Gain of GPI-anchor amidation at N189 |
| C191Y | 0.892 | Altered Disordered interface. Loss of Disulfide linkage at C191 Altered Transmembrane protein. Loss of Helix Altered DNA binding. Loss of GPI-anchor amidation at N189 |
| R197W | 0.852 | Altered DNA binding. Loss of Helix Altered Disordered interface. Altered Transmembrane protein |
| R198C | 0.867 | Altered Disordered interface. Loss of Helix Altered DNA binding. Altered Metal binding |
| R198P | 0.95 | Loss of Helix Altered Disordered interface Altered DNA binding |
| R205Q | 0.727 | Altered Disordered interface. |
| L330H | 0.847 | Loss of Helix Altered Stability |
| W335R | 0.885 | Gain of Helix |
| N407Y | 0.809 | Altered Ordered interface Loss of GPI-anchor amidation at N407 |
| R454C | 0.635 | Gain of Pyrrolidone carboxylic acid at Q449 |
| D194N | 0.841 | Altered Disordered interface Altered DNA binding Gain of Disulfide linkage at C191 Altered Transmembrane protein Gain of GPI-anchor amidation at N189 |
| R207Q | 0.609 | Altered Disordered interface |
| D303N | 0.742 | Loss of Ubiquitylation at K300 |
3.6. Oncogenicity Determination Using CScape and CScape-Somatic Tools.
To comprehensively evaluate the oncogenic potential of ESR2 gene variants, we employed the CScape and CScape-somatic predictive frameworks, both of which assign oncogenicity scores (ranging from 0 to 1) and classify mutations as either drivers or passengers based on their likelihood of contributing to cancer development. Higher scores correspond to a greater probability of driver status. In parallel, allele frequency (AF) data from GenomeAD and tumor-type associations from CBioPortal were integrated to provide contextualization of mutational significance. A considerable proportion of the analyzed variants were classified as high-confidence oncogenic drivers, with CScape oncogenicity scores exceeding 0.90 for multiple substitutions, including C149G (0.9295), D154G (0.9292), D154N (0.9626), C191G (0.9656), and R198P (0.9744). These findings were consistent with CScape-somatic predictions, which also identified several of these mutations—including D154N, R198C, and R454C—as likely drivers. Notably, the C191 residue was recurrently altered across multiple variants C191R/S, all of which were predicted as drivers with consistently high oncogenic scores, underscoring this position as a putative mutational hotspot. This observation aligns with prior structural and functional predictions from MuPred2, further reinforcing the pathogenic relevance of this region.
Additionally, CBioPortal data indicated specific cancer-type associations for several variants: R197W was linked to colon, papillary, and stomach adenocarcinomas; R207Q to stomach adenocarcinoma; D303N to chromophobe renal cell carcinoma; D326N to breast invasive ductal carcinoma; G352S to uterine endometrioid carcinoma; V370I to renal clear cell carcinoma; R388Q to lung squamous cell carcinoma; and G502R to rectal adenocarcinoma. Furthermore, the majority of these driver-classified variants exhibited exceedingly low allele frequencies in the general population (AF < 0.00001), consistent with their somatic origin and possible pathogenic roles in tumorigenesis. These integrative findings are summarized in Table 4.
3.7. Determination of ESR2 Protein Interactions
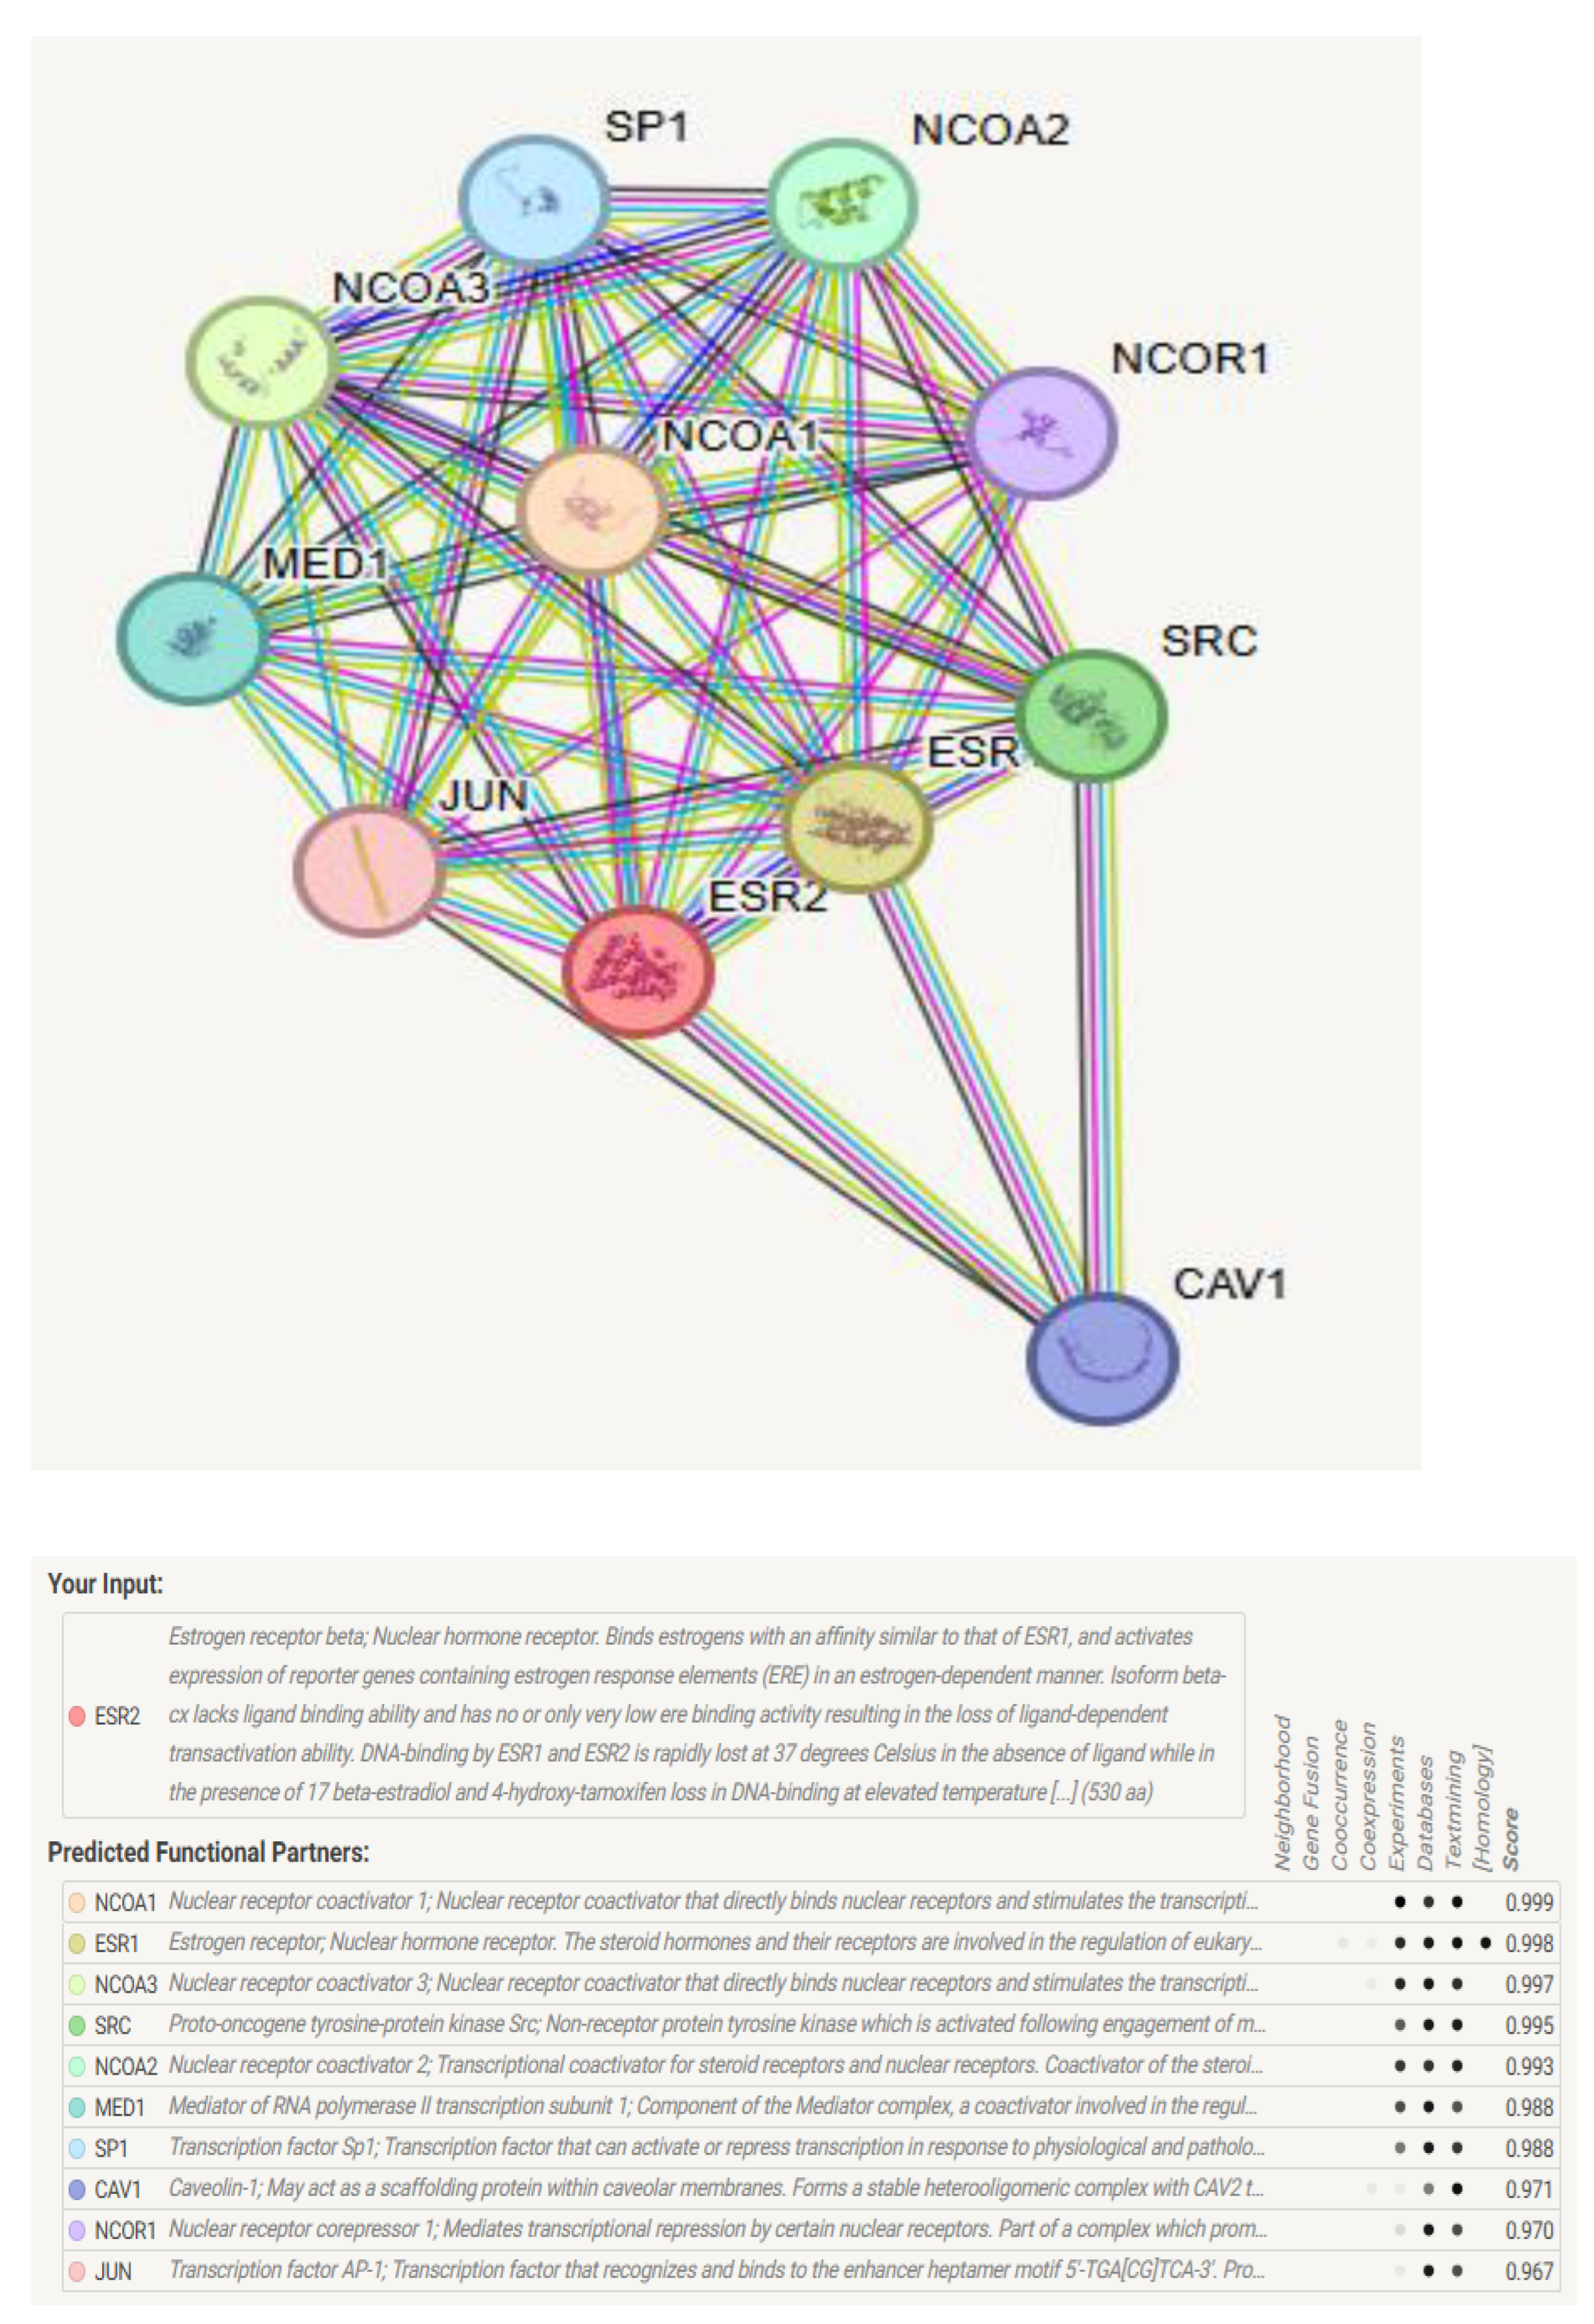
STRING analysis of ERβ1 PP interactions uncovered a diverse network of partners, including transcriptional co-regulators, signaling mediators, and structural proteins (Figure 3). The high-confidence interaction map (score ≥ 0.9) revealed associations with nuclear receptor coactivators (NCOA1-3, NCOA2, NCOA3, SRC) and the mediator complex subunit MED1, supporting ESR2's role in ligand-dependent transcription. NCOA1-3 and MED1 formed a tightly linked cluster, indicating cooperative enhancement of ESR2-driven gene expression.
Corepressor NCOR1 supports ESR2's dual regulation in estrogen tissues. Interactions with SP1 and JUN suggest cross-talk between estrogen and stress pathways, influencing gene regulation. CAV1 suggests ESR2 roles in membrane signaling, independent of its genomic actions.ESR1 was notably identified as a primary heterodimerization partner, underscoring potential compensatory mechanisms in tissues co-expressing both receptors. NCOA2 and MED1 exhibited the highest binding affinity for wild-type ESR2 (STRING scores: 0.99 and 0.98, respectively). CAV1 and JUN showed context-dependent associations (scores: 0.97–0.96).
Figure 3.
shows the Protein-Protein Interaction (PPI) network of ESR2 from the STRING database. It depicts ESR2's direct and indirect interactions with proteins like transcriptional co-regulators, nuclear receptor coactivators, and signaling mediators. Key partners include NCOA1/2/3, MED1, SRC, NCOR1, SP1, JUN, and CAV1, which enhance, bridge, modulate, or facilitate ESR2 activity and signaling.
3.8. Functional Enrichment Analysis of ESR2-Associated Pathways
To elucidate ESR2's functional landscape and associated protein network, pathway enrichment analyses were performed using GO biological processes and KEGG pathways from the STRING database protein interaction data.
The GO enrichment analysis revealed ESR2-interacting proteins associated with hormone signaling and development. Key enriched terms included "intracellular receptor signaling," "response to hormone stimulus," "PPAR signaling," and "mammary gland morphogenesis." These had high scores (2.4-2.8) and very low FDRs (as low as 3.0e-09), indicating significance. Several terms are associated with steroid hormones and mammary development, underscoring the biological roles of ESR2. Bubble size indicated gene count, with some terms involving up to nine genes, emphasizing ESR2's role in hormone processes (Figure 4).
Complementary KEGG pathway enrichment analysis reinforced ESR2's role in hormone signaling and cancer pathways. Key pathways included "endocrine resistance," "estrogen signaling," "thyroid hormone signaling," and "breast cancer," with signal values up to 6.0 and FDRs as low as 1.0e-14. These findings suggest that ESR2 plays a regulatory role in hormone-related cancers and resistance. Enrichment in "prolactin signaling" and "fluid shear stress and atherosclerosis" indicates broader physiological relevance (Figure 5).
Together, these enrichment profiles strongly suggest that ESR2 plays a key role in regulating hormone responses, development, and cancer pathways. They support their role in endocrine signaling and disease, especially in breast cancer and hormonal contexts of resistance.
3.9. RegulomeDB Analysis Identifies High-Confidence Regulatory Variants in ESR2 3'UTR Regions
To investigate potential post-transcriptional regulatory elements within the ESR2 3′ untranslated region (3′UTR), we performed variant annotation using RegulomeDB v2.0, a comprehensive tool for assessing the regulatory impact of non-coding variants. This analysis identified 34 variants located within the ESR2 3′UTR that are predicted to affect gene regulation, particularly through mechanisms such as altered mRNA stability, translation efficiency, or microRNA binding.
The most significant variant, rs4986938, was assigned a Rank 1b and received the maximum functional score (1.0), indicating high-confidence disruption of regulatory motifs or factor binding sites. In addition, 20 other variants (representing 23.8% of all annotated 3′UTR variants) were classified as Rank 2b with scores ≥0.8, further supporting their potential involvement in post-transcriptional regulation. Notable examples include rs989397691 (score: 0.94) and rs1023533876 (score: 0.89), both of which may influence ESR2 expression dynamics (Table 7). Collectively, these findings highlight a subset of non-coding SNPs within the ESR2 3′UTR as strong candidates for regulatory activity and merit further functional validation.
3.10. Identification of Functional miRNA Target Site Variants in the ESR2 3'UTR
Our analysis identified ncSNPs and INDELs in the ESR2 gene with high potential to affect post-transcriptional regulation via altered miRNA binding. The polymiRTS algorithm highlighted key variants, notably rs139004885, which disrupts four miRNA binding sites (hsa-miR-1185-5p, hsa-miR-3679-5p, hsa-miR-5191, hsa-miR-5004-5p), with significant score reductions (-0.16 to -0.229). Conservation analysis found variants in conserved miRNA regions, including rs184960071 in a highly conserved hsa-miR-4704-3p site (conservation class 7, Δcontext+ = -0.126), rs142219923 in a hsa-miR-490-5p site (class 6, Δcontext+ =- 332), and rs201485281 in a hsa-miR-5591-3p site (class 6, Δcontext+ =- 135). Notably, rs192894852 created a new high-affinity site for hsa-miR-4648 (Δcontext+ = -0.472) (Table 8).
4. Discussion
The present study represents an in silico analysis of functional consequences of high-risk disease-causing missense nsSNPs in the ESR2 gene, highlighting the ability of these nsSNPs to affect the molecular integrity of ERβ1 protein and its UTRs. Considering the developing role of ERβ1 as a tumour suppressor in hormone-sensitive tumours, it will be crucial to evaluate how coding and non-coding variants impact its structure, stability, and regulatory networks. Using a large amount of genomic data retrieved from the Ensembl database and a variety of computational prediction methods, the current study systematically screened and characterized missense nsSNPs that may impair the function of the ERβ1 protein or destabilize UTRs, thereby illuminating their possible contributions to cancer development.
To assess the impact of nsSNPs on the stability of the ERβ1 protein, predictive computational tools I-Mutant and MUpro were employed. Both tools consistently indicated that the majority of the analyzed nsSNPs significantly reduce protein stability, particularly those located within the DBD and LBD regions, which are essential for the functional integrity of ERβ1. Notably, mutations such as R454C (rs768924970), C149G (rs1351313879), D154G (rs775445438), and L380P (rs1249242790) exhibited markedly negative ΔΔG values across both platforms, suggesting a high probability of structural destabilization and impaired receptor function. Protein stability is a critical determinant of receptor activity, and alterations within these core functional domains may compromise the receptor's ability to bind DNA and ligands, thereby disrupting estrogen-mediated signaling cascades [43]. These findings are consistent with recent studies reporting that the L380P (rs1249242790) and R454C (rs768924970) variants specifically decrease ESR2 protein stability in patients with polycystic ovary syndrome (PCOS), supporting their potential pathogenic role in hormone-related disorders [26].
HOPE-based structure predictions suggest that most of the nsSNPs on the ERβ1 protein tend to significantly affect protein conformation by altering residue properties such as size, charge, hydrophobicity, and are located in conserved regions. Mutations affecting cysteine residues such as C149G, C152Y, C191Y/S/G/R are particularly deleterious, as they result in the loss of crucial disulfide bonds and aromatic interactions [44]. Proline-glycine substitutions (e.g., P156R, G352S, G502R), as proposed by other studies, could potentially clash with backbone flexibility and secondary structure formation [45]. Charge-changing substitutions, including E211K, D154N/G, and R197W/Q, could compromise key electrostatic networks involved in DNA recognition, ligand binding, or dimerization, as reported by other studies [46,47,48]. Changes in residues within the hydrophobic core (e.g., S157L, V370I, W535R) contribute to the decrease in folding stability [49]. Taken together, these predictions reveal several structural mechanisms (disulfide loss, changes in steric packing, loss of flexibility, electrostatic disruption, and hydrophobic destabilization) by which ESR2 nsSNPs can compromise receptor function, providing a solid basis for further biochemical and cellular validation.
To explore the molecular pathogenetics of the identified nsSNPs, we used MutPred2 analysis for ESR2 coding variants, that indicated that mutations involving cysteine residues, and in particular C149, C152, C169 and C191 might affect disulfide bond formation This is consistent with effects of conservative cysteine-to-serine changes reported in Ca²⁺ receptor studies that interfere with dimerization and cell surface expression. Specifically, C129 and C131 were found to be required for intermolecular disulfide bonding and receptor-function assembly [50]. These similarities lead us to propose that ESR2 stability and activity may also rely on a disulfide-mediated interface, and that cysteine mutations should have a profound impact on receptor conformation and regulatory signaling.
In addition, we found that modified sulfation at Y155 is a common molecular outcome of five ESR2 variants, indicating that this site may represent an essential regulatory hotspot. Sulfation is emerging as a crucial post-translational modification in endocrine signaling, but its implications still require further investigation. Sulfation, as emphasized in recent reviews, can have a profound impact on hormone action, receptor binding, and clearance [51]. These changes are essential, for example, for the functionality of the steroid and neuroendocrine systems. In this context, the disruption of Y155 sulfation in ESR2 is therefore predicted to reduce receptor stability or signaling, consistent with the general observation that sulfonation is critical but not well understood for hormonal action.
A comprehensive integrated analysis was performed to assess the oncogenic potential of ESR2 gene variants, using two CScape and CScape-somatic predictive methods. An extensive set of ESR2 mutants showed strong high-confidence driver potential, with multiple mutants (C149G, D154N, C191G, and R198P) having oncogenicity scores greater than 0.90. The high concordance of CScape and CScape-somatic predictions supports the pathogenic potential of these mutations.
Notably, the C191 residue has emerged as a recurrently mutated hotspot, with four distinct substitutions (C191G/R) consistently classified as drivers. This observation aligns with prior structural and functional modeling data from MuPred2, further substantiating the critical role of this region in ESR2-mediated oncogenic processes. The tumor-specific associations derived from CBioPortal provide additional biological context, revealing that several high-confidence variants—such as R197W, R207Q, D326N, G352S, V370I, R388Q, R454C, and G502R—are enriched in specific cancer subtypes, including colorectal, renal, breast, and lung carcinomas. Moreover, the exceptionally low allele frequencies observed in population-level data (AF < 0.00001) support the somatic nature of these variants and bolster their candidacy as rare but functionally significant drivers. Collectively, these findings underscore the pathogenic relevance of ESR2 alterations and demonstrate the utility of integrative computational frameworks in prioritizing variants for functional validation in cancer research.
أسفل النموذج
STRING analysis of the protein partners of ERβ1 demonstrated a high-confidence interaction network with main coactivators (NCOA1-3, MED1), corepressor (NCOR1), and signaling partners (SP1, JUN, CAV1), which strongly emphasized the importance of ERβ1 in transcription regulation and cross-pathway signaling. Notably, NCOA1-3 and MED1 formed a tightly linked module essential for ligand-dependent transcription, with the highest STRING scores.
Estrogen receptor coactivator binding occurs within a hydrophobic groove formed by helix 12, lysine 366 on helix 3, and conserved hydrophobic residues in the ligand-binding domain [10]. This site accommodates the p160 coactivator LXXLL motif, with adjacent basic residues enhancing high-affinity binding through electrostatic interactions during transcriptional activation [10]. Driver oncogenic nsSNPs in the AF-2/LBD domain, such as D326N, G352S, V370I, R388Q, and R454C, are expected to impair coactivator recruitment and attenuate ESR2-mediated gene activation. Similarly, driver oncogenic nsSNPs in the DBD, located in the region 146-217, such as C169F/R, R197W, and R207Q, may disrupt the interaction with SP1 and JUN, thereby affecting the cross-talk between stress and estrogen pathways. CAV1 and JUN interactions that are context-dependent may indicate potential perturbation of non-genomic signaling. Overall, these results suggest that cancer-associated mutations can impact the ESR2 interactomic network, leading to uncontrolled transcription and tumorigenesis.
An integrated analysis of Gene Ontology (GO) biological processes and KEGG pathways in the context of ESR2 nsSNPs provides critical mechanistic insights into estrogen receptor biology and disease development. The most promising enrichment in intracellular steroid hormone receptor signaling (GO) and Endocrine resistance (KEGG) suggests that nsSNPs exert their effect dominantly on the classical nuclear receptor actions, mainly including LBD, the AF-2 region.
The strong enrichment for mammary gland morphogenesis (GO) and breast cancer pathways (KEGG) further demonstrates that ESR2 nsSNPs could have essential roles in tissue homeostasis and oncogenic transformation. Cysteine-substitution mutations (C169F/R and C191R/Y) are particularly notable, as they likely destabilize the ZnF motifs in the DBD domain and, in principle, can result in altered target gene specificity.
The pathway analysis reveals extensive cross-talk between ESR2 signaling and other endocrine systems, notably via the thyroid hormone signaling pathway (KEGG). This raises the possibility that nsSNPs may disrupt the delicate balance of nuclear receptor cross-regulation and may likely play a role in the complex etiology of endocrine disorders. The concurrent enrichment of prolactin signaling (KEGG) also suggests this possibility, suggesting that ESR2 variants may affect multiple axes of hormonal regulation.
Regulatory annotation of ESR2 3′UTR SNPs by RegulomeDB demonstrates an enrichment of SNPs with putative regulatory effects. The rs4986938 was graded as 1b, which indicates strong confidence based on eQTL, TF binding, motif disruption, and DNase footprinting. The rs113851861 was ranked as 1f, suggesting a considerable regulatory function as well. The majority of the variants are 2b, suggesting TF binding and chromatin accessibility, but no support from eQTL. These results reveal a multifaceted regulatory network in which ESR2 expression is influenced in a tissue-type-specific manner. They further validate previous associations of rs4986938 with cancer risk, particularly in hormone-related cancer. For example, decreased ERβ1 levels in breast cancer are associated with less protection, while in colorectal cancer, rs4986938 is linked to increased risk under high estradiol levels [21].
Extending previous findings that miRNA target site variants in 3′ UTRs may also strongly impact ESR1 regulation and breast cancer susceptibility [19], our analysis reveals novel insights into ESR2, which has been less studied in the context of miRNA-target gene interactions. By applying the polymiRTS algorithm, we identified numerous ncSNPs and INDELs in ESR2 with a high probability of affecting regulation at the post-transcriptional level, including the interruption of miRNA binding. One of the top variants, rs139004885, was observed to interfere with four distinct miRNAs, including hsa-miR-1185-5p, hsa-miR-3679-5p, hsa-miR-5191, and hsa-miR-5004-5p, with obviously decreased binding scores.
Conservation analysis also identified variants such as rs184960071 and rs142219923 within highly conserved miRNA binding regions (conservation classes 7 and 6), and therefore predicted to have significant functional potential. Moreover, rs192894852 was also expected to create a novel high-affinity binding site for hsa-miR-4648, indicating a potential gain-of-function regulatory effect. These results are in line with extensive genomic studies demonstrating that variation in miRNA binding sites can affect or generate regulatory interactions resulting in changes in gene expression [20]. Together, these findings suggest that the genetic variability of the ESR2 3 ′ UTR may contribute to disease phenotypes through miRNA-dependent regulation.
Our study has several therapeutic implications. Patients with disruptive ESR2 nsSNPs may not be sensitive to SERMs or SERDs, which require the functional ERβ1. This may explain resistance to tamoxifen and fulvestrant in some ERβ1-postive tumors. The mutation status of ESR2 could potentially serve as a biomarker for patient selection for ERβ1-targeting agonists such as LY500307, DPN, and prinaberel, although their efficacy in mutation-positive tumors is untested.
5. Conclusions
In conclusion, this in silico study offers a detailed structural and functional analysis of high-risk pathogenic nsSNPs of ESR2, which may influence the function of ERβ1 at both the structural and regulatory levels. By combining predictive approaches—such as structural modeling, protein stability tools, oncogenicity scoring algorithms, and assessments of post-transcriptional regulation—we identified several deleterious variants that could destabilize ERβ1, modify its interactions with co-regulators, and disrupt key transcriptional and signaling pathways. Mutations in critical regions, such as the DBD and LBD, along with non-coding SNPs in the 3′ UTR, indicate complex mechanisms of functional impairment. However, this study is limited to in silico predictions and needs further validation through experimental and clinical research. Future studies should focus on functional testing, include additional cancer subtypes, and utilize integrated omics approaches to fully understand the role of changes in ERβ1 during carcinogenesis and treatment resistance.
Supplementary Materials
The following supporting information can be downloaded at the website of this paper posted on Preprints.org.
Author Contributions
Conceptualization, H.A.-N.; methodology, H.A.-N., Z.A.-S., L.A.-A., M.A.-M. and R.A.-J..; software, H.A.-N., Z.A.-S., L.A.-A., M.A.-M. and R.A.-J.; validation, H.A.-N., Z.A.-S., L.A.-A., M.A.-M. and R.A.-J.; formal analysis, H.A.-N., Z.A.-S., L.A.-A., M.A.-M. and R.A.-J.; investigation, H.A.-N.; resources, H.A.-N.; data curation, H.A.-N.; writing—original draft preparation, H.A.-N.; writing—review and editing, H.A.-N.; visualization, H.A.-N.; supervision, H.A.-N.; project administration, H.A.-N.; funding acquisition, H.A.-N. All authors have read and agreed to the published version of the manuscript.
Funding
This research received no external funding.
Institutional Review Board Statement
Not applicable.
Informed Consent Statement
Not applicable.
Data Availability Statement
Data are contained within the article and Supplementary Materials.
Acknowledgment
This scientific paper is derived from a research grant funded by Taibah University, Madinah, Kingdom of Saudi Arabia.
Conflicts of Interest
The authors declare no conflicts of interest.
References
- Jia, M.; Dahlman-Wright, K.; Gustafsson, J.-Å. Estrogen receptor alpha and beta in health and disease. Best Practice & Research Clinical Endocrinology & Metabolism 2015, 29, 557–568. [Google Scholar] [CrossRef] [PubMed]
- Chen, P.; Li, B.; Ou-Yang, L. Role of estrogen receptors in health and disease. Frontiers in endocrinology, vol. 13, p. 83 9005, 2022. [Google Scholar] [CrossRef]
- Tremblay, G.B.; et al. Cloning, Chromosomal Localization, and Functional Analysis of the Murine Estrogen Receptor β. Molecular Endocrinology 1997, 11, 353–365. [Google Scholar] [CrossRef]
- Kuiper, G.G.; Enmark, E.; Pelto-Huikko, M.; Nilsson, S.; Gustafsson, J.A. Cloning of a novel receptor expressed in rat prostate and ovary. Proceedings of the National Academy of Sciences of the United States of America 1996, 93, 5925–5930. [Google Scholar] [CrossRef] [PubMed]
- Mal, R.; et al. Estrogen Receptor Beta (ERβ): A Ligand Activated Tumor Suppressor. Frontiers in oncology, vol. 10, p. 58 7386, 2020. [Google Scholar] [CrossRef]
- Mosselman, S.; Polman, J.; Dijkema, R. ER beta: identification and characterization of a novel human estrogen receptor.. FEBS letters, vol. 392 1, pp. 49–53, 1996, [Online]. Available: https://consensus.app/papers/er-beta-identification-and-characterization-of-a-novel-mosselman-polman/3682336104b955a8947a580c985bee6a/.
- Tremblay, G.; et al. Cloning, chromosomal localization, and functional analysis of the murine estrogen receptor beta. Molecular endocrinology, 1997; 3, 353–365. [Google Scholar] [CrossRef]
- Leung, Y.; Mak, P.; Hassan, S.; Ho, S. Estrogen receptor (ER)-beta isoforms: a key to understanding ER-beta signaling. Proceedings of the National Academy of Sciences of the United States of America 2006, 103, 13162–13167. [Google Scholar] [CrossRef]
- Cheng, X.; Cole, R.; Zaia, J.; Hart, G. Alternative O-glycosylation/O-phosphorylation of the murine estrogen receptor beta. Biochemistry 2000, 39, 11609–11620. [Google Scholar] [CrossRef]
- Mak, H.Y.; Hoare, S.; Henttu, P.M.; Parker, M.G. Molecular determinants of the estrogen receptor-coactivator interface. Molecular and cellular biology 1999, 19, 3895–3903. [Google Scholar] [CrossRef]
- Björnström, L.; Sjöberg, M. Mutations in the Estrogen Receptor DNA-binding Domain Discriminate between the Classical Mechanism of Action and Cross-talk with Stat5b and Activating Protein 1 (AP-1)*. Journal of Biological Chemistry 2002, 277, 48479–48483. [Google Scholar] [CrossRef]
- Dai, Z.-J.; et al. Current evidence on the relationship between rs1256049 polymorphism in estrogen receptor-β gene and cancer risk. International journal of clinical and experimental medicine 2014, 7, 5031–5040. [Google Scholar] [PubMed]
- Gallegos-Arreola, M.P.; et al. ESR2 gene variants (rs1256049, rs4986938, and rs1256030) and their association with breast cancer risk. PeerJ, vol. 10, p. e1 3379, 2022. [Google Scholar] [CrossRef]
- Chang, X.; Wang, H.; Yang, Z.; Wang, Y.; Li, J.; Han, Z. ESR2 polymorphisms on prostate cancer risk: A systematic review and meta-analysis. Medicine, vol. 102, no. 23, 2023, [Online]. Available: https://journals.lww.com/md-journal/fulltext/2023/06090/esr2_polymorphisms_on_prostate_cancer_risk__a.54.aspx.
- Feng, Y.; et al. Genetic polymorphisms in Pakistani women with polycystic ovary syndrome. Gene 2019, 710, 316–323. [Google Scholar] [CrossRef]
- Peña-Martínez, E.G.; Rodríguez-Martínez, J.A. Decoding Non-coding Variants: Recent Approaches to Studying Their Role in Gene Regulation and Human Diseases. Frontiers in bioscience (Scholar edition) 2024, 16, 4. [Google Scholar] [CrossRef]
- Philips, S.; et al. Functional characterization of a genetic polymorphism in the promoter of the ESR2 gene. Hormones & cancer, 2012; 43, 37–43. [Google Scholar] [CrossRef]
- Treeck, O.; et al. Polymorphisms in the promoter region of ESR2 gene and breast cancer susceptibility. The Journal of Steroid Biochemistry and Molecular Biology 2009, 114, 207–211. [Google Scholar] [CrossRef]
- Tchatchou, S.; et al. A variant affecting a putative miRNA target site in estrogen receptor (ESR) 1 is associated with breast cancer risk in premenopausal women. Carcinogenesis, 2009; 30, 59–64. [Google Scholar] [CrossRef]
- Kumar, P.; Traurig, M.; Baier, L.J. Identification and functional validation of genetic variants in potential miRNA target sites of established BMI genes. International Journal of Obesity 2020, 44, 1191–1195. [Google Scholar] [CrossRef]
- Wu, H.; et al. Association of estrogen receptor beta variants and serum levels of estradiol with risk of colorectal cancer: a case control study. BMC Cancer, 2012; 12, 276. [Google Scholar] [CrossRef]
- Song, J.Y.; et al. Genetic variation in ESR2 and estrogen receptor-beta expression in lung tumors. Cancer Epidemiology 2013, 37, 518–522. [Google Scholar] [CrossRef]
- McDuffie, K.; et al. Genetic polymorphisms in the estrogen receptor beta (ESR2) gene and the risk of epithelial ovarian carcinoma. Cancer Causes & Control 2009, 20, 47–55. [Google Scholar] [CrossRef]
- Jiao, X.; et al. Variant Alleles of the ESR1, PPARG, HMGA2, and MTHFR Genes Are Associated With Polycystic Ovary Syndrome Risk in a Chinese Population: A Case-Control Study. Frontiers in endocrinology, 2018; 9, 504. [Google Scholar] [CrossRef]
- Douma, Z.; et al. Association of estrogen receptor gene variants (ESR1 and ESR2) with polycystic ovary syndrome in Tunisia. Gene, vol. 741, p. 14 4560, 2020. [Google Scholar] [CrossRef] [PubMed]
- Muccee, F.; et al. Exploring the association of ESR1 and ESR2 gene SNPs with polycystic ovary syndrome in human females: a comprehensive association study. Journal of Ovarian Research 2024, 17, 27. [Google Scholar] [CrossRef]
- Merid, S.K.; Goranskaya, D.; Alexeyenko, A. Distinguishing between driver and passenger mutations in individual cancer genomes by network enrichment analysis. BMC bioinformatics 2014, 15, 308. [Google Scholar] [CrossRef] [PubMed]
- Sinkala, M. Mutational landscape of cancer-driver genes across human cancers. Scientific Reports 2023, 13, 12742. [Google Scholar] [CrossRef] [PubMed]
- Wodarz, D.; Newell, A.C.; Komarova, N.L. Passenger mutations can accelerate tumour suppressor gene inactivation in cancer evolution. Journal of the Royal Society, Interface, 2018; 15. [Google Scholar] [CrossRef]
- Hunt, S.E.; et al. Ensembl variation resources. Database, 2018; 2018, bay119. [Google Scholar] [CrossRef]
- Bendl, J.; et al. PredictSNP: Robust and Accurate Consensus Classifier for Prediction of Disease-Related Mutations. PLOS Computational Biology 2014, 10, 1–11. [Google Scholar] [CrossRef]
- Apweiler, R.; et al. The InterPro database, an integrated documentation resource for protein families, domains and functional sites. Nucleic acids research 2001, 29, 37–40. [Google Scholar] [CrossRef]
- Hunter, S.; et al. InterPro in 2011: new developments in the family and domain prediction database. Nucleic acids research 2012, 40, D306–12. [Google Scholar] [CrossRef]
- Capriotti, E.; Fariselli, P.; Casadio, R. I-Mutant2.0: predicting stability changes upon mutation from the protein sequence or structure. Nucleic acids research, 2005; 33, W306-10. [Google Scholar] [CrossRef]
- Cheng, J.; Randall, A.; Baldi, P. Prediction of protein stability changes for single-site mutations using support vector machines. Proteins: Structure, Function, and Bioinformatics 2006, 62, 1125–1132. [Google Scholar] [CrossRef]
- Pejaver, V.; et al. MutPred2: inferring the molecular and phenotypic impact of amino acid variants.” 2017. [CrossRef]
- Rogers, M.F.; Shihab, H.A.; Gaunt, T.R.; Campbell, C. CScape: a tool for predicting oncogenic single-point mutations in the cancer genome. Scientific Reports 2017, 7, 11597. [Google Scholar] [CrossRef]
- Rogers, M.F.; Gaunt, T.R.; Campbell, C. CScape-somatic: distinguishing driver and passenger point mutations in the cancer genome. Bioinformatics (Oxford, England) 2020, 36, 3637–3644. [Google Scholar] [CrossRef]
- Szklarczyk, D.; et al. STRING v11: protein-protein association networks with increased coverage, supporting functional discovery in genome-wide experimental datasets. Nucleic acids research, 2019; 47, D607–D613. [Google Scholar] [CrossRef]
- Szklarczyk, D.; et al. The STRING database in 2023: protein-protein association networks and functional enrichment analyses for any sequenced genome of interest. Nucleic acids research, 2023; 51, D638–D646. [Google Scholar] [CrossRef]
- Boyle, A.P.; et al. Annotation of functional variation in personal genomes using RegulomeDB. Genome research 2012, 22, 1790–1797. [Google Scholar] [CrossRef]
- Bhattacharya, A.; Ziebarth, J.D.; Cui, Y. PolymiRTS Database 3.0: linking polymorphisms in microRNAs and their target sites with human diseases and biological pathways. Nucleic acids research, 2014; 42, D86–91. [Google Scholar] [CrossRef]
- Roberts, M.L.; et al. A Novel Point Mutation in the DNA-Binding Domain (DBD) of the Human Glucocorticoid Receptor Causes Primary Generalized Glucocorticoid Resistance by Disrupting the Hydrophobic Structure of its DBD. The Journal of Clinical Endocrinology & Metabolism 2013, 98, E790–E795. [Google Scholar] [CrossRef]
- Qiu, H.; et al. Impact of cysteine variants on the structure, activity, and stability of recombinant human α-galactosidase A. Protein science : a publication of the Protein Society 2015, 24, 1401–1411. [Google Scholar] [CrossRef] [PubMed]
- Jacob, J.; Duclohier, H.; Cafiso, D.S. The role of proline and glycine in determining the backbone flexibility of a channel-forming peptide. Biophysical journal 1999, 76, 1367–1376. [Google Scholar] [CrossRef]
- Sun, S.; Poudel, P.; Alexov, E.; Li, L. Electrostatics in Computational Biophysics and Its Implications for Disease Effects. International Journal of Molecular Sciences, 2022; 23. [Google Scholar] [CrossRef]
- Friedman, R. Computational studies of protein–drug binding affinity changes upon mutations in the drug target. WIREs Computational Molecular Science 2022, 12, e1563. [Google Scholar] [CrossRef]
- Harrod, A.; et al. Genome engineering for estrogen receptor mutations reveals differential responses to anti-estrogens and new prognostic gene signatures for breast cancer. Oncogene 2022, 41, 4905–4915. [Google Scholar] [CrossRef]
- Dong, H.; Mukaiyama, A.; Tadokoro, T.; Koga, Y.; Takano, K.; Kanaya, S. Hydrophobic Effect on the Stability and Folding of a Hyperthermophilic Protein. Journal of Molecular Biology 2008, 378, 264–272. [Google Scholar] [CrossRef] [PubMed]
- Ray, K.; Hauschild, B.C.; Steinbach, P.J.; Goldsmith, P.K.; Hauache, O.; Spiegel, A.M. Identification of the Cysteine Residues in the Amino-terminal Extracellular Domain of the Human Ca2+ Receptor Critical for Dimerization: IMPLICATIONS FOR FUNCTION OF MONOMERIC Ca2+RECEPTOR*. Journal of Biological Chemistry 1999, 274, 27642–27650. [Google Scholar] [CrossRef]
- Strott, C.A. Sulfonation and Molecular Action. Endocrine Reviews 2002, 23, 703–732. [Google Scholar] [CrossRef] [PubMed]
Figure 1.
In Silico Analysis Pipeline for ERβ1 Coding and Non-Coding nsSNPs. The schematic illustrates the comprehensive bioinformatics pipeline employed to analyze both coding and non-coding nsSNPs in the ERβ1 gene. The pipeline is divided into three major components: Functional Analysis, Structural Analysis, and Cancer Susceptibility Assessment, applied specifically to coding nsSNPs, while Regulatory Impact Assessment is applied to non-coding variants (5′ and 3′ UTRs).
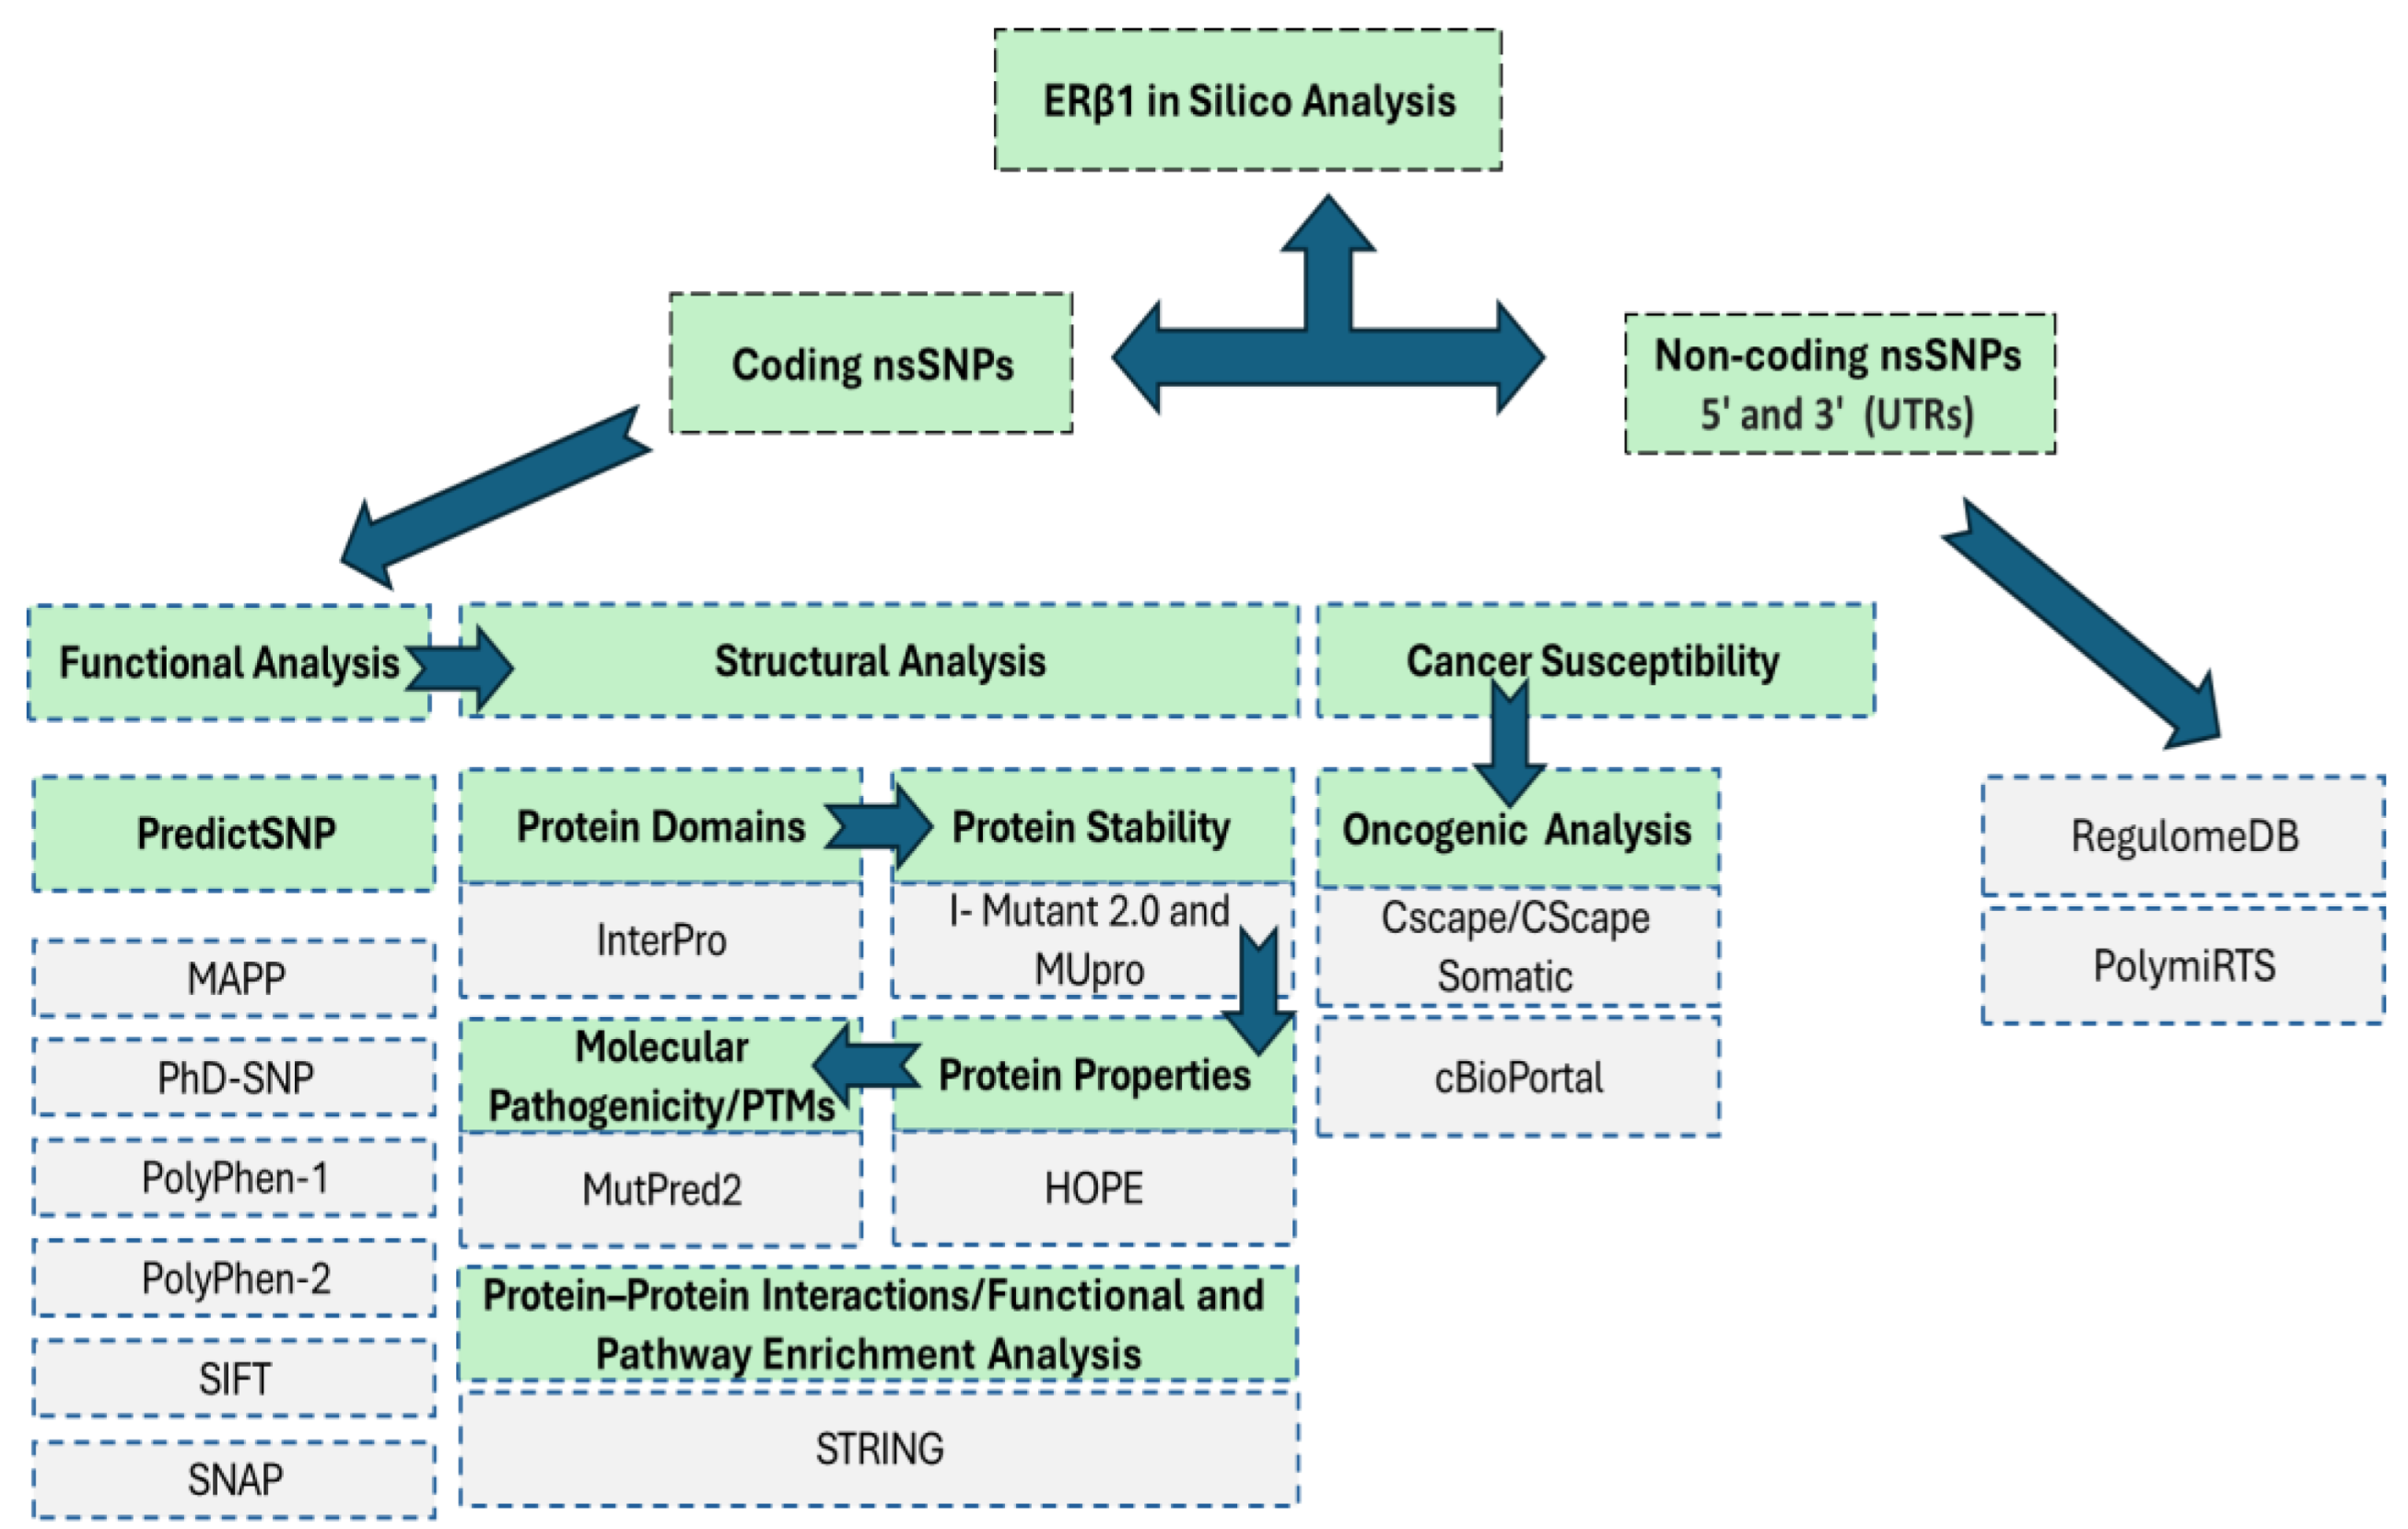
Figure 2.
Domain architecture of the human ERβ1 protein. The schematic illustrates the three major functional domains of ERβ as predicted by InterPro analysis: (1) The N-terminal domain (residues 1–125) containing the ligand-independent activation function 1 (AF-1) region; (2) The central DNA-binding domain (DBD; residues 146–217) with two zinc finger (ZF) motifs (green boxes) essential for specific DNA recognition; and (3) The C-terminal ligand-binding domain (LBD; residues 264–498) harboring the hormone-binding pocket and activation function 2 (AF-2) interface.

Figure 3.
Schematic Representation of ERβ1Protein Structure and Location of Oncogenic Driver Pathogenic nsSNPs. This figure illustrates the domain architecture of the ERβ1protein, including the N-terminal A/B transactivation domain (ligand-independent activity), the central C DNA-binding domain (DBD, target gene recognition), the D hinge region (flexibility, nuclear localization), the E ligand-binding domain (LBD, hormone binding, dimerization), and the C-terminal F domain (transcriptional modulation). Pathogenic nsSNPs identified as potential oncogenic drivers are marked within their corresponding domains.
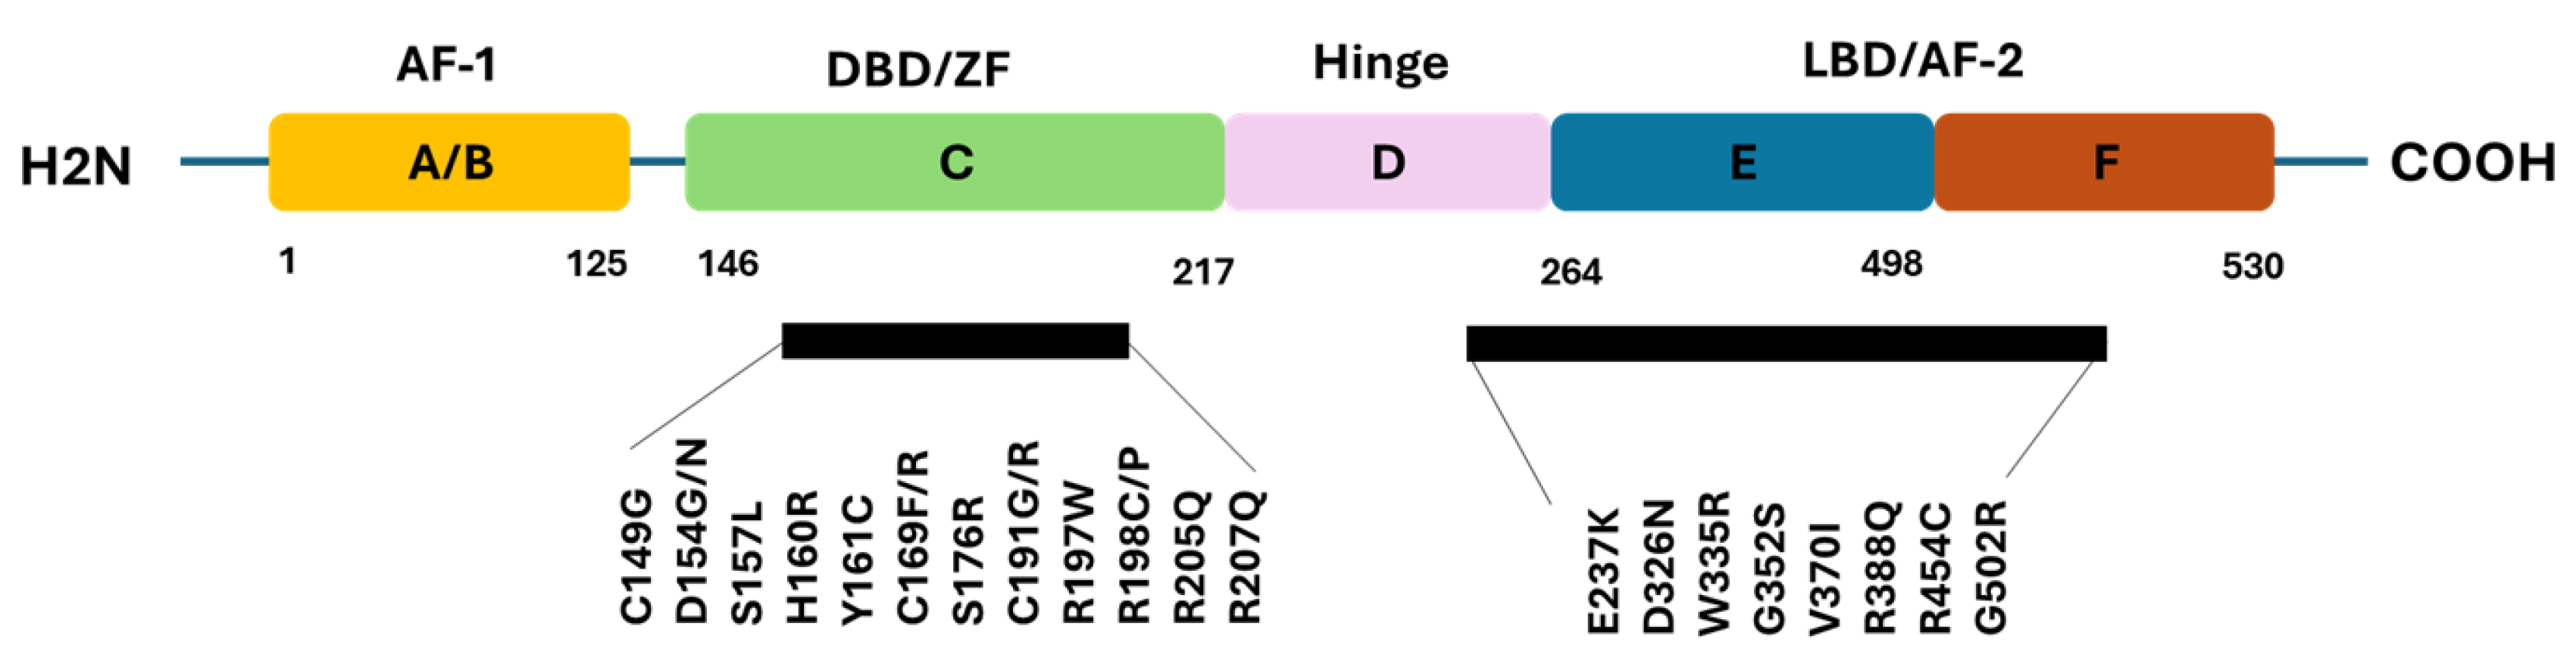
Figure 4.
Gene Ontology (GO) Enrichment Analysis of ESR2-Related Biological Processes. This figure shows the results of GO term enrichment analysis for biological processes linked to ESR2 and its protein interaction partners. The analysis indicates significant enrichment (FDR ≤ 0.001) for several hormone-related pathways and developmental processes, including: Intracellular receptor signaling pathway (FDR = 4.0 × 10⁻⁷), Cellular response to hormone stimulus (FDR = 3.0 × 10⁻9), Mammary gland morphogenesis (FDR = 4.0 × 10⁻⁶), Intracellular steroid hormone receptor signaling pathway (FDR = 5.0 × 10⁻⁵), and Branching involved in mammary gland duct morphogenesis (FDR = 5.0 × 10⁻⁵). Visual details: The x-axis shows fold enrichment values (1.8–2.8), the y-axis lists the enriched biological processes, circle size reflects the number of related genes (2–9 genes), and color intensity indicates statistical significance, with darker colors denoting lower FDR values.
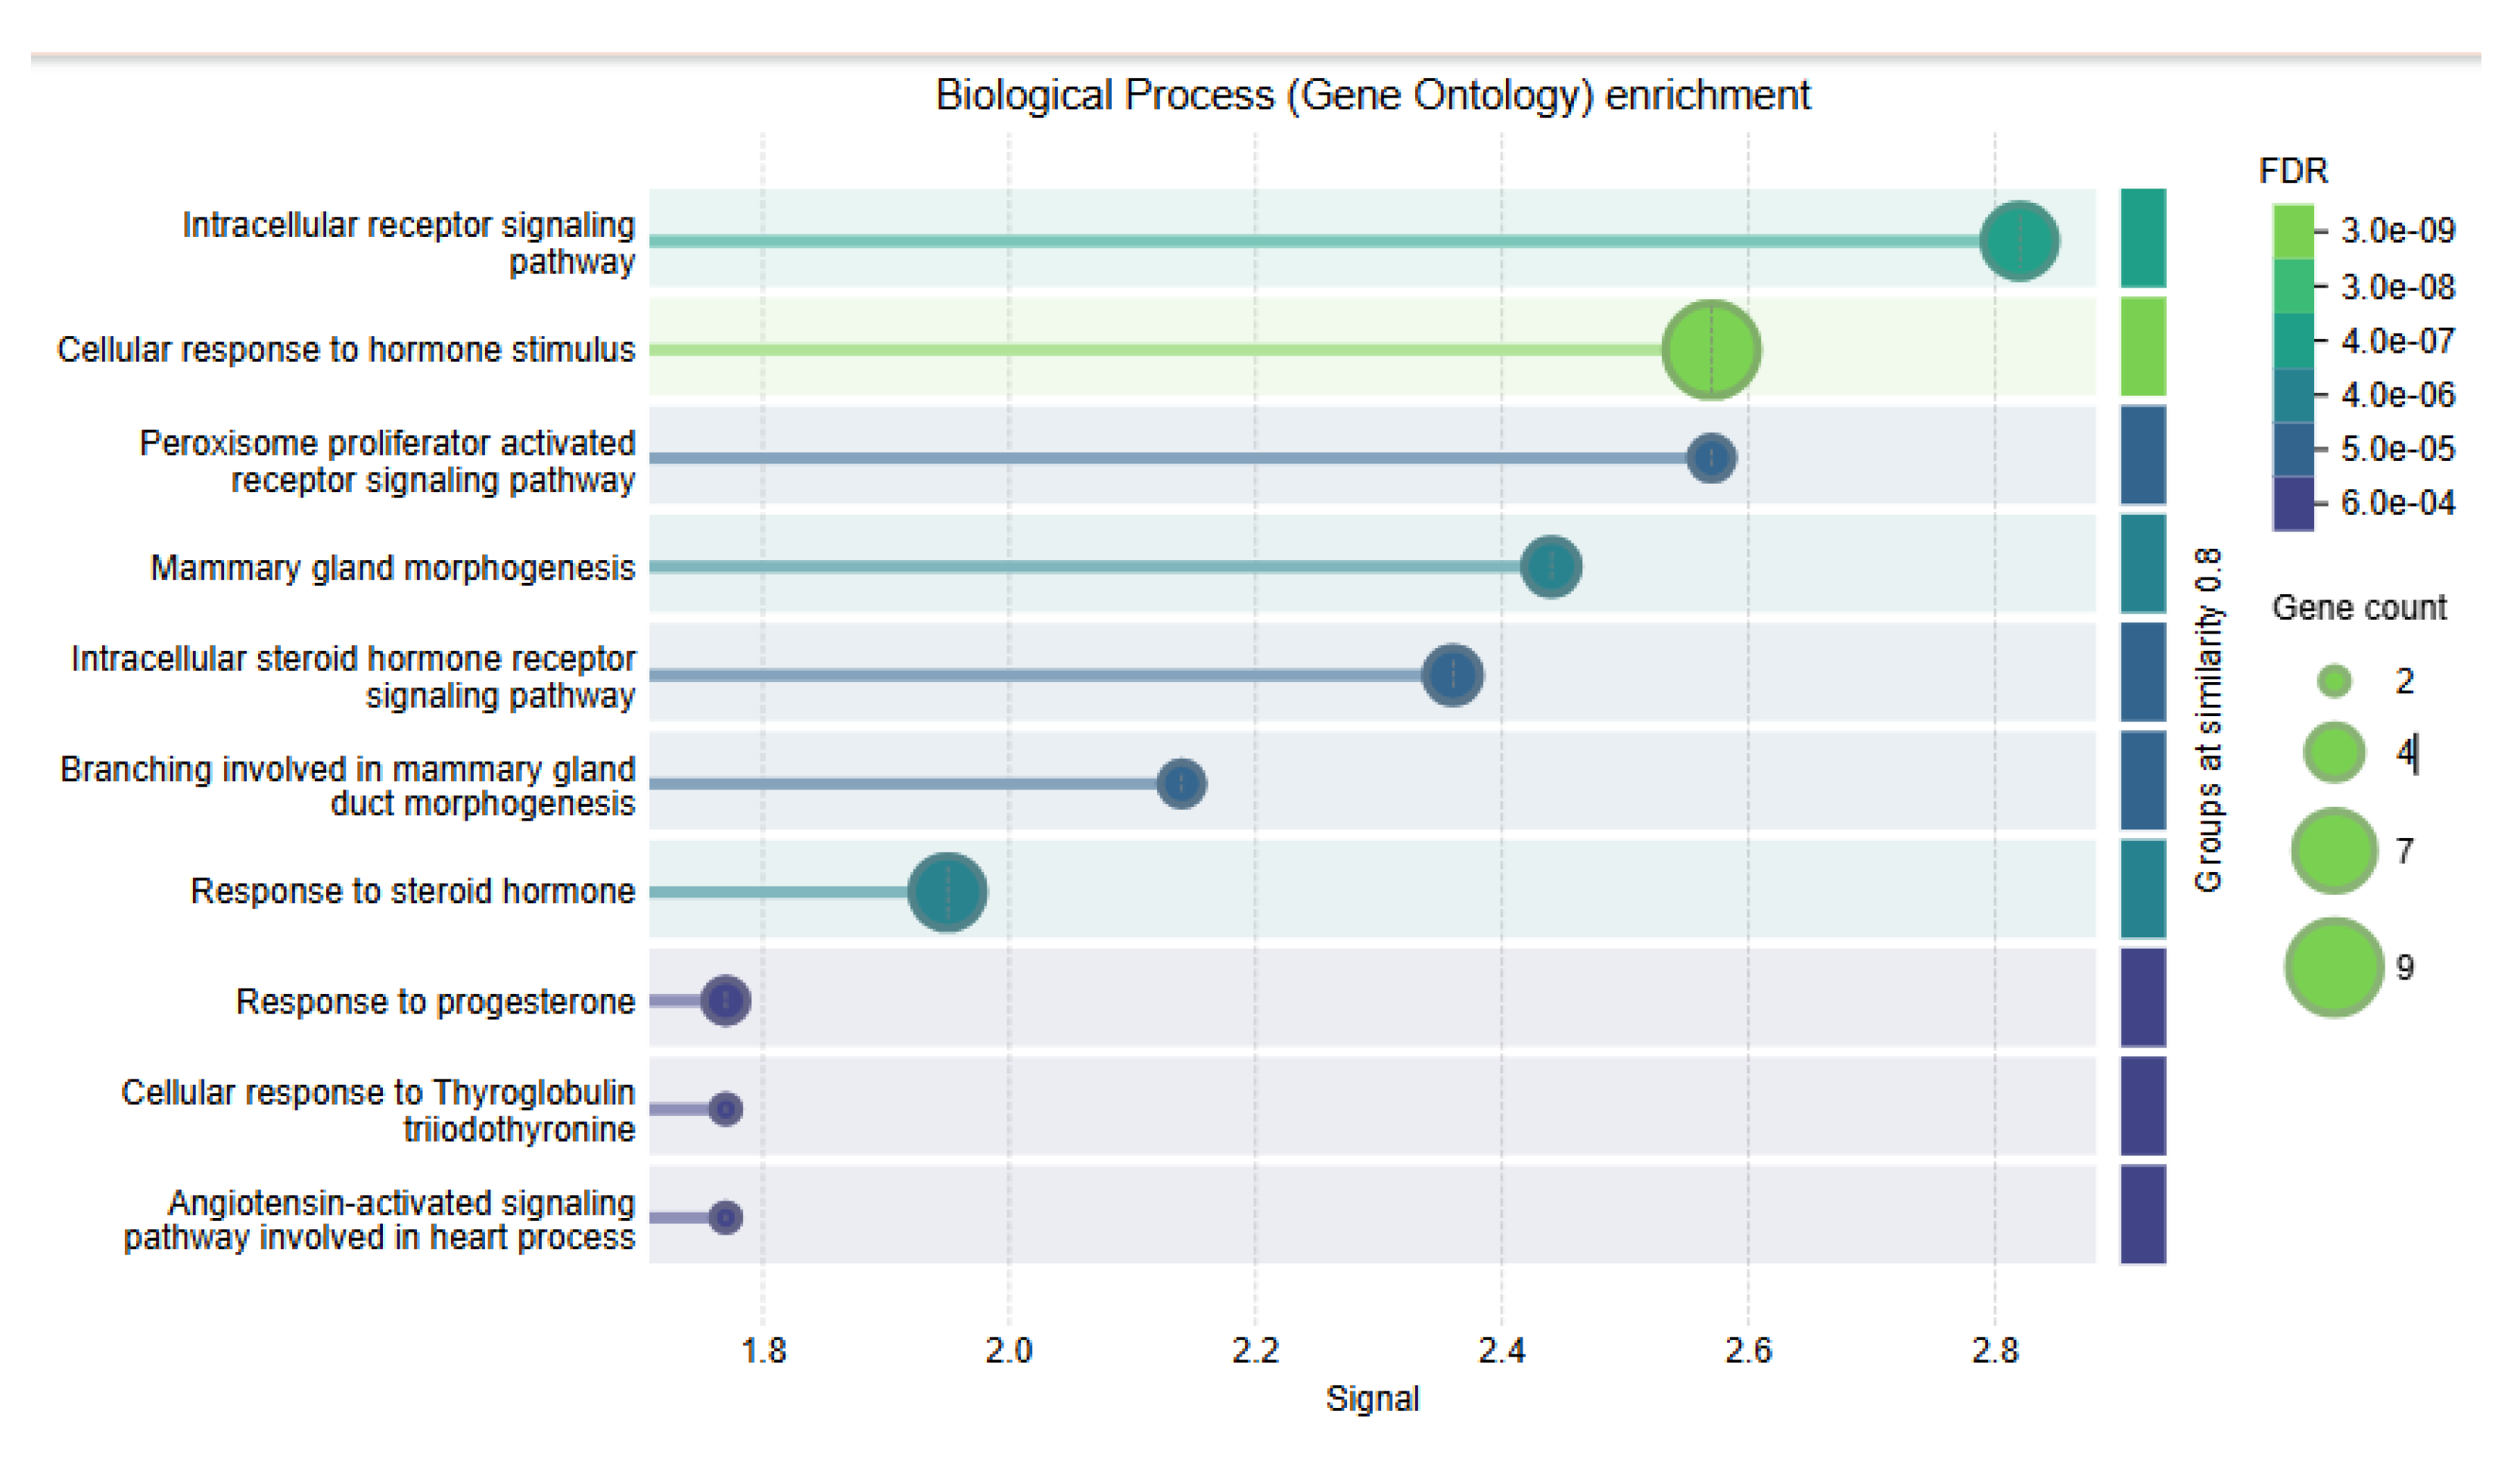
Figure 5.
KEGG Pathway Enrichment Analysis of ESR2-Associated Signaling Pathways. This figure displays KEGG pathway enrichment for ESR2 and its partners, highlighting key cancer and hormone-related pathways: Endocrine resistance (FDR = 1.0 × 10⁻¹⁴), Estrogen signaling (FDR = 1.0 × 10⁻¹⁴), Breast cancer (FDR = 1.0 × 10⁻¹⁰), Thyr oid hormone signaling (FDR = 1.0 × 10⁻¹2), and Pathways in cancer (FDR = 1.0 × 10⁻3). The visualization shows: x-axis for enrichment strength (1-6), y-axis for KEGG pathways, circle size for gene count (3-8), and color gradient indicating significance (darker equals more significant).
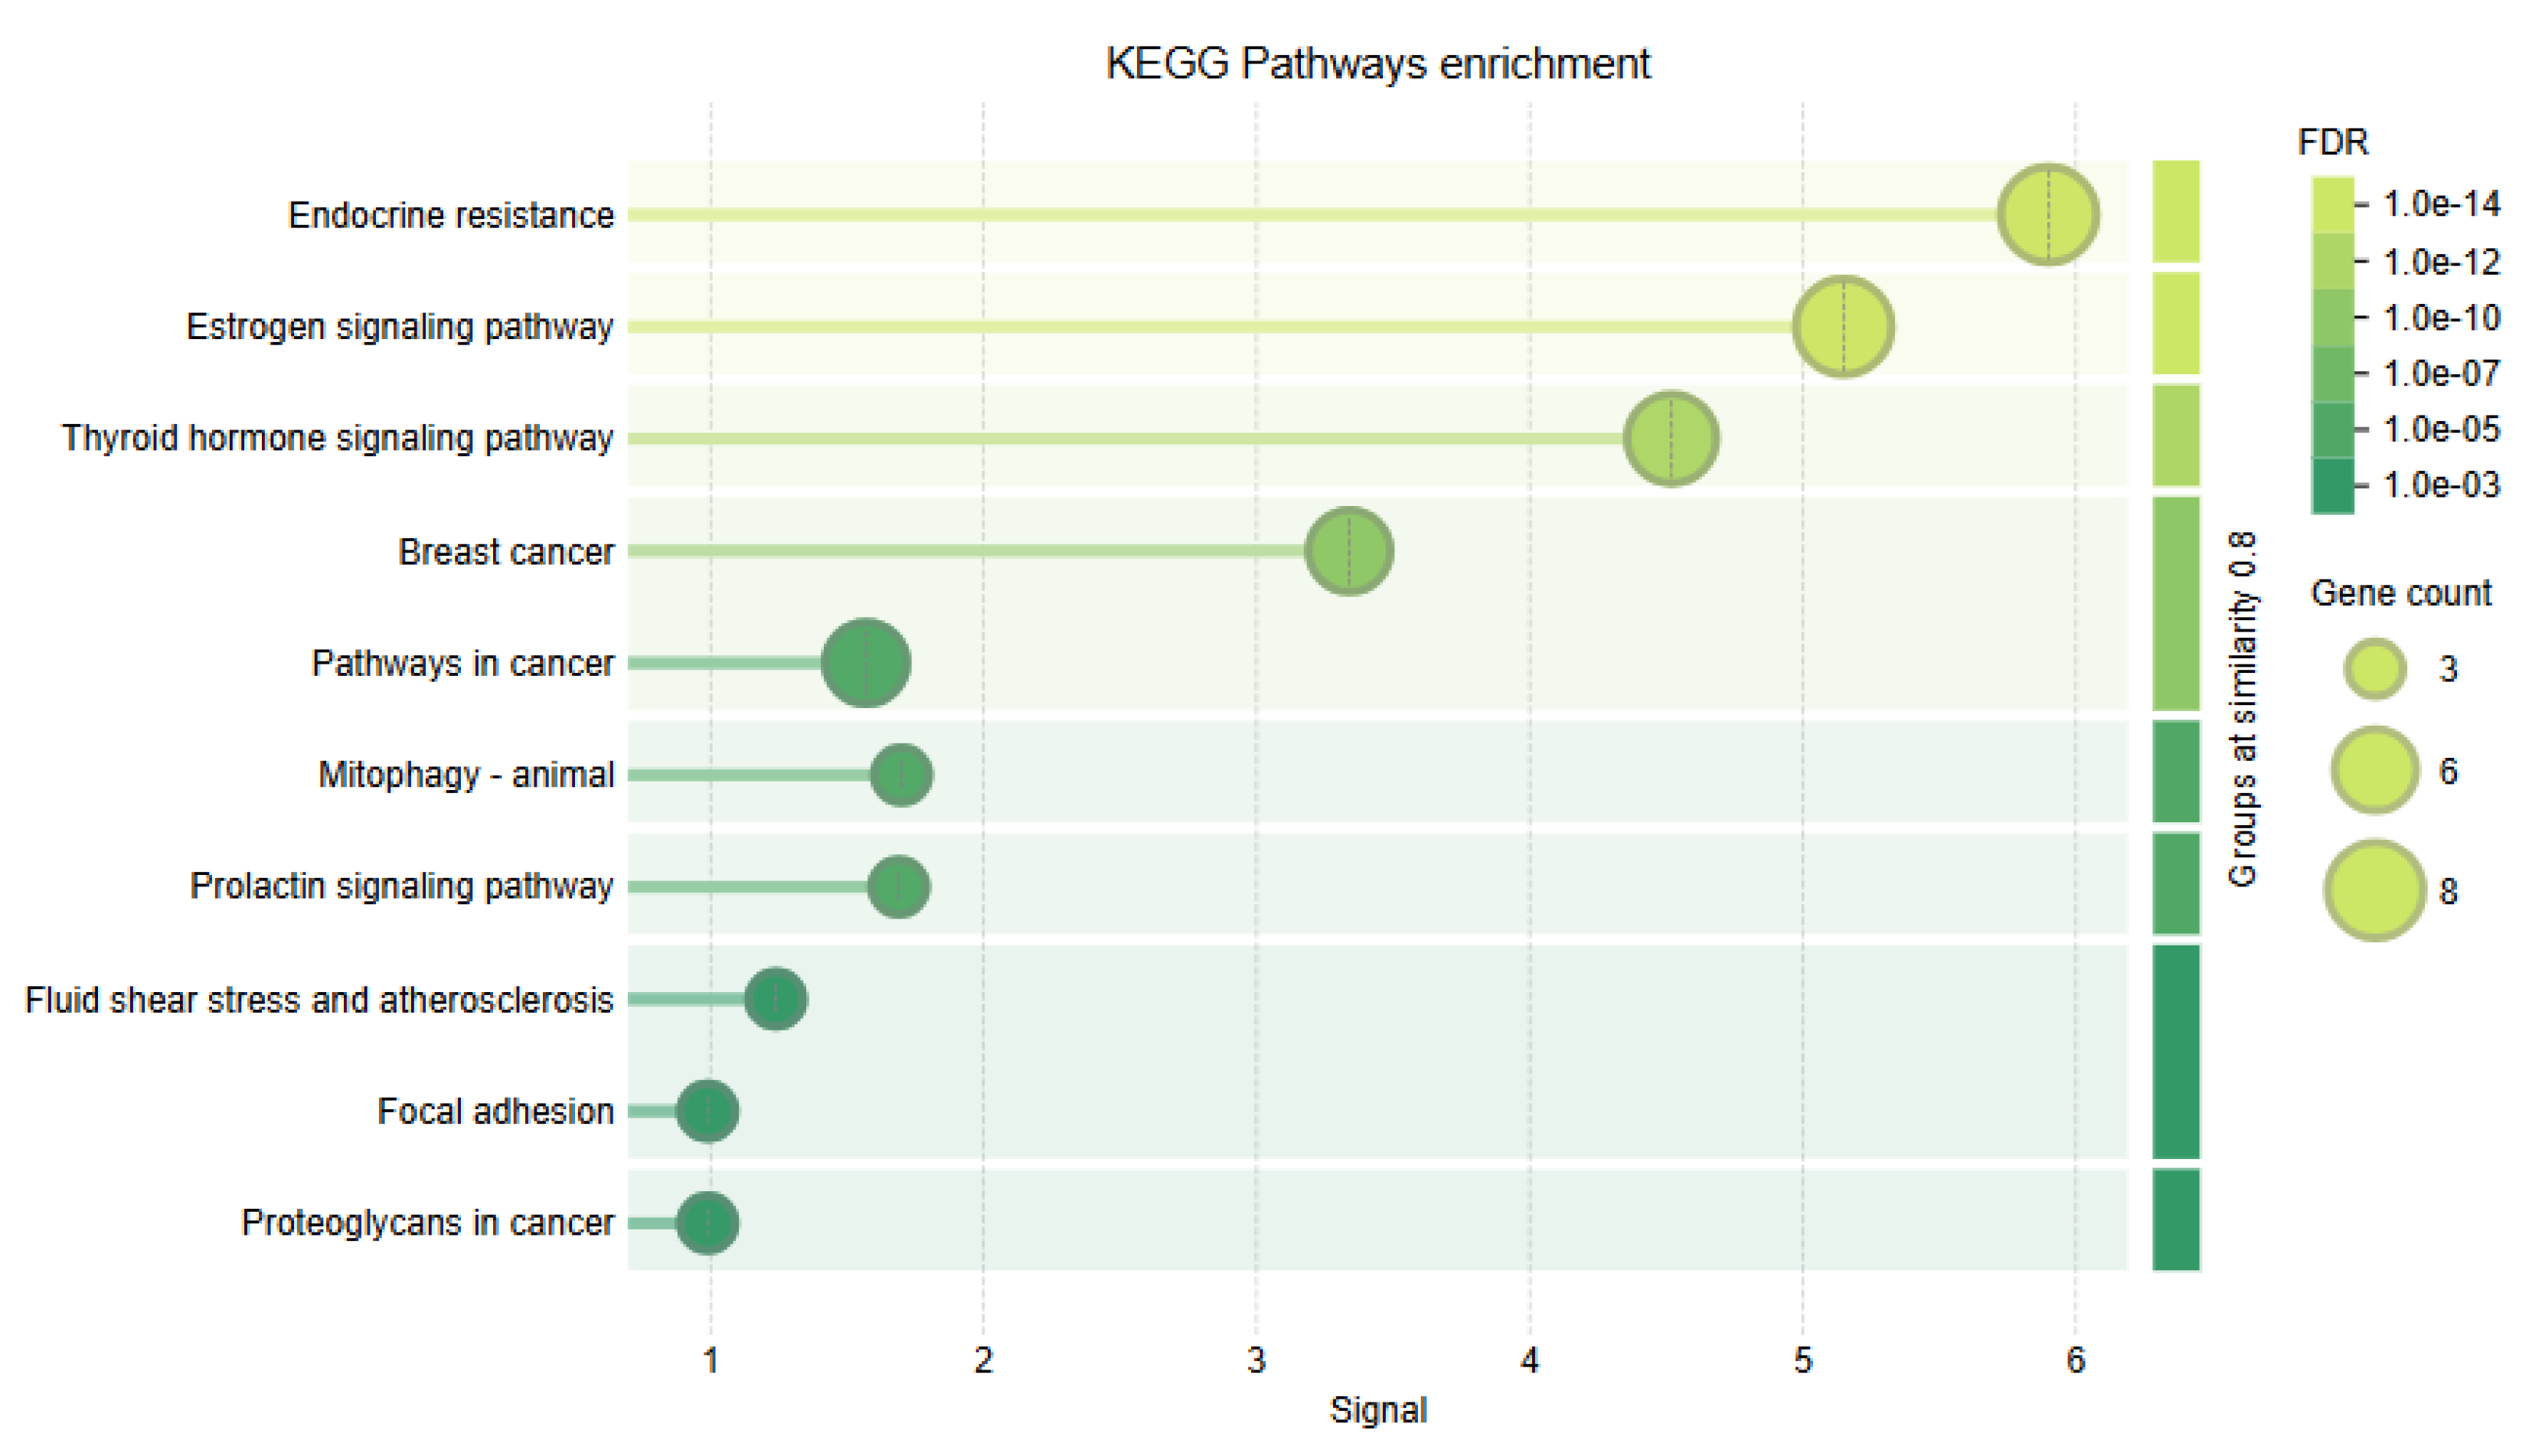
Table 1.
In silico prediction of the functional impact of nsSNPs within the ESR2 gene. This table summarizes the predicted effects of amino acid substitutions caused by nsSNPs, as assessed by multiple computational tools. Each SNP is identified by its rsID and corresponding amino acid (AA) change. PredictSNP represents a consensus prediction from multiple tools, while the MAPP, PhD-SNP, SIFT, and SNAP column aggregates the outputs of four individual predictors. PolyPhen-1 and PolyPhen-2 indicate structural and functional impact predictions.
| nsSNP rsID | AA change | PredictSNP | MAPP, PhD-SNP, SIFT, SNAP | PolyPhan-1 and 2 |
|---|---|---|---|---|
| rs1241458487 | P44L | Deleterious | Deleterious | Damaging |
| rs147382781 | R93C | Deleterious | Deleterious | Damaging |
| rs911726841 | P106R | Deleterious | Deleterious | Damaging |
| rs141516067 | S112L | Deleterious | Deleterious | Damaging |
| rs774742997 | A134T | Deleterious | Deleterious | Damaging |
| rs1351313879 | C149G | Deleterious | Deleterious | Damaging |
| rs1353654623 | C152Y | Deleterious | Deleterious | Damaging |
| rs775445438 | D154G | Deleterious | Deleterious | Damaging |
| rs760612953 | D154N | Deleterious | Deleterious | Damaging |
| rs1472743418 | A156T | Deleterious | Deleterious | Damaging |
| rs1016270637 | S157L | Deleterious | Deleterious | Damaging |
| rs1411758930 | H160R | Deleterious | Deleterious | Damaging |
| rs770224156 | Y161C | Deleterious | Deleterious | Damaging |
| rs1261390478 | G162R | Deleterious | Deleterious | Damaging |
| rs141760704 | S165L | Deleterious | Deleterious | Damaging |
| rs1273276574 | C169F | Deleterious | Deleterious | Damaging |
| rs1029338063 | C169R | Deleterious | Deleterious | Damaging |
| rs1457342604 | S176R | Deleterious | Deleterious | Damaging |
| rs1367633095 | N189Y | Deleterious | Deleterious | Damaging |
| rs766405281 | C191G | Deleterious | Deleterious | Damaging |
| rs766405281 | C191R | Deleterious | Deleterious | Damaging |
| rs766405281 | C191S | Deleterious | Deleterious | Damaging |
| rs1305200621 | C191Y | Deleterious | Deleterious | Damaging |
| rs773394073 | I193N | Deleterious | Deleterious | Damaging |
| rs145278854 | D194N | Deleterious | Deleterious | Damaging |
| rs760053106 | R197W | Deleterious | Deleterious | Damaging |
| rs768839285 | R198C | Deleterious | Deleterious | Damaging |
| rs1489920793 | R198P | Deleterious | Deleterious | Damaging |
| rs748841139 | R205Q | Deleterious | Deleterious | Damaging |
| rs371856990 | R207W | Deleterious | Deleterious | Damaging |
| rs368924653 | R207Q | Deleterious | Deleterious | Damaging |
| rs909370443 | K208M | Deleterious | Deleterious | Damaging |
| rs556956556 | E211K | Deleterious | Deleterious | Damaging |
| rs1410117865 | M214V | Deleterious | Deleterious | Damaging |
| rs1290256152 | M214I | Deleterious | Deleterious | Damaging |
| rs1190163038 | R220Q | Deleterious | Deleterious | Damaging |
| rs1307959271 | R227C | Deleterious | Deleterious | Damaging |
| rs755401425 | D236Y | Deleterious | Deleterious | Damaging |
| rs766843910 | E237K | Deleterious | Deleterious | Damaging |
| rs576722274 | K244E | Deleterious | Deleterious | Damaging |
| rs1220163606 | R247K | Deleterious | Deleterious | Damaging |
| rs543025691 | A252T | Deleterious | Deleterious | Damaging |
| rs1199203068 | R256W | Deleterious | Deleterious | Damaging |
| rs768870975 | P277Q | Deleterious | Deleterious | Damaging |
| rs1436572414 | P277S | Deleterious | Deleterious | Damaging |
| rs1488031774 | T290I | Deleterious | Deleterious | Damaging |
| rs747036560 | D303N | Deleterious | Deleterious | Damaging |
| rs539389612 | K304T | Deleterious | Deleterious | Damaging |
| rs550448628 | W312C | Deleterious | Deleterious | Damaging |
| rs138920605 | P317T | Deleterious | Deleterious | Damaging |
| rs2229618 | L322V | Deleterious | Deleterious | Damaging |
| rs905821436 | D326N | Deleterious | Deleterious | Damaging |
| rs145661652 | R329Q | Deleterious | Deleterious | Damaging |
| rs1276302781 | L330H | Deleterious | Deleterious | Damaging |
| rs149090049 | W335R | Deleterious | Deleterious | Damaging |
| rs755668062 | L339P | Deleterious | Deleterious | Damaging |
| rs755668062 | L339Q | Deleterious | Deleterious | Damaging |
| rs553390407 | G342E | Deleterious | Deleterious | Damaging |
| rs553390407 | G342V | Deleterious | Deleterious | Damaging |
| rs1194417609 | W345C | Deleterious | Deleterious | Damaging |
| rs200264592 | R346C | Deleterious | Deleterious | Damaging |
| rs1339881550 | R346H | Deleterious | Deleterious | Damaging |
| rs368060197 | G352S | Deleterious | Deleterious | Damaging |
| rs1294597204 | A357V | Deleterious | Deleterious | Damaging |
| rs141474553 | R364S | Deleterious | Deleterious | Damaging |
| rs745947456 | V370I | Deleterious | Deleterious | Damaging |
| rs1249242790 | L380P | Deleterious | Deleterious | Damaging |
| rs112017626 | L381P | Deleterious | Deleterious | Damaging |
| rs1010629502 | R386G | Deleterious | Deleterious | Damaging |
| rs764756707 | R388Q | Deleterious | Deleterious | Damaging |
| rs764756707 | R388P | Deleterious | Deleterious | Damaging |
| rs1012693115 | Y397H | Deleterious | Deleterious | Damaging |
| rs1197276001 | L398R | Deleterious | Deleterious | Damaging |
| rs1432744457 | M403R | Deleterious | Deleterious | Damaging |
| rs111471356 | L406R | Deleterious | Deleterious | Damaging |
| rs778031158 | N407Y | Deleterious | Deleterious | Damaging |
| rs78255744 | S408F | Deleterious | Deleterious | Damaging |
| rs2229618 | L413V | Deleterious | Deleterious | Damaging |
| rs1217623435 | L426R | Deleterious | Deleterious | Damaging |
| rs755668062 | L430P | Deleterious | Deleterious | Damaging |
| rs768924970 | R454C | Deleterious | Deleterious | Damaging |
| rs775944471 | L455P | Deleterious | Deleterious | Damaging |
| rs375446581 | L462P | Deleterious | Deleterious | Damaging |
| rs767658683 | E474G | Deleterious | Deleterious | Damaging |
| rs1451169980 | V485A | Deleterious | Deleterious | Damaging |
| rs528840784 | R501C | Deleterious | Deleterious | Damaging |
| rs766524153 | G502R | Deleterious | Deleterious | Damaging |
| rs565210086 | P514L | Deleterious | Deleterious | Damaging |
| rs757686092 | S529F | Deleterious | Deleterious | Damaging |
| rs757686092 | S529F | Deleterious | Deleterious | Damaging |
Table 4.
Predicted oncogenic impact of somatic missense nsSNPs assessed by CScape-somatic (v1.0) and CScape (v2.0) algorithms.
Table 4.
Predicted oncogenic impact of somatic missense nsSNPs assessed by CScape-somatic (v1.0) and CScape (v2.0) algorithms.
| CScape | CScape-somatic | ||||||||
|---|---|---|---|---|---|---|---|---|---|
| Variant ID | AA changes | Input, assembly | Coding scores | Message | Coding Score | Message | GenomeAD | CBioPortal | Cancer Type |
| AF | AF | ||||||||
| rs1351313879 | C149G | 14,64746789,A,C | 0.929542 | Oncogenic (high conf.) | 0.620587 | Driver | |||
| rs1353654623 | C152Y | 14,64746779,C,T | 0.925819 | Oncogenic (high conf.) | 0.356178 | Passenger | 1.487E-05 | ||
| rs775445438 | D154G | 14,64746773,T,C | 0.92916 | Oncogenic (high conf.) | 0.724278 | Driver | 6.20E-07 | ||
| rs760612953 | D154N | 14,64746774,C,T | 0.962646 | Oncogenic (high conf.) | 0.827846 | Driver | 8.674E-06 | ||
| rs1016270637 | S157L | 14,64746764,G,A | 0.963144 | Oncogenic (high conf.) | 0.815778 | Driver | 1.859E-06 | ||
| rs1411758930 | H160R | 14,64746755,T,C | 0.939813 | Oncogenic (high conf.) | 0.604905 | Driver | 2.478E-06 | ||
| rs770224156 | Y161C | 14,64746752,T,C | 0.926715 | Oncogenic (high conf.) | 0.62281 | Driver | 4.956E-06 | ||
| rs1261390478 | G162R | 14,64746750,C,T | 0.932607 | Oncogenic (high conf.) | 0.364078 | Passenger | 4.956E-06 | ||
| rs1273276574 | C169F | 14,64746728,C,A | 0.95865 | Oncogenic (high conf.) | 0.619302 | Driver | 2.478E-06 | ||
| rs1029338063 | C169R | 14,64746729,A,G | 0.919354 | Oncogenic (high conf.) | 0.630163 | Driver | 2.478E-06 | ||
| rs1457342604 | S176R | 14,64746708,T,G | 0.942129 | Oncogenic (high conf.) | 0.521914 | Driver | 1.24E-06 | ||
| rs1367633095 | N189Y | 14,64735600,T,A | 0.906308 | Oncogenic (high conf.) | 0.301533 | passenger | 1.24E-06 | ||
| rs766405281 | C191G | 14,64735594,A,C | 0.965581 | Oncogenic (high conf.) | 0.765388 | Driver | 1.24E-06 | ||
| rs766405281 | C191R | 14,64735594,A,G | 0.913891 | Oncogenic (high conf.) | 0.548061 | Driver | 6.20E-07 | ||
| rs766405281 | C191S | 14,64735594,A,T | 0.910363 | Oncogenic (high conf.) | 0.473874 | Passenger | 6.20E-07 | ||
| rs369253565 | C191Y | 14,64735593,C,T | 0.930841 | Oncogenic (high conf.) | 0.410529 | Passenger | 6.20E-07 | ||
| rs760053106 | R197W | 14,64735576,G,A | 0.756852 | Oncogenic | 0.685594 | Driver | 8.056E-06 | 0.33/0.37 | Colon Adenocarcinoma/ Papillary/ Stomach Adenocarcinoma |
| rs768839285 | R198C | 14,64735573,G,A | 0.923613 | Oncogenic (high conf.) | 0.744457 | Driver | 9.295E-06 | ||
| rs1489920793 | R198P | 14,64735572,C,G | 0.974356 | Oncogenic (high conf.) | 0.847731 | Driver | 6.20E-07 | ||
| rs748841139 | R205Q | 14,64735551,C,T | 0.973985 | Oncogenic (high conf.) | 0.746492 | Driver | 8.675E-06 | ||
| rs368924653 | R207Q | 14,64735545,G,T | 0.643141 | oncogenic | 0.7 | Driver | 4.091E-05 | 0.29 | Stomach Adenocarcinoma |
| rs766843910 | E237K | 14,64727410,T,C | 0.595541 | oncogenic | 0.534785 | Driver | 8.305E-06 | ||
| rs747036560 | D303N | 14,64727212,G.T | 0.745124 | oncogenic | 0.45 | Passenger | 3.916E-06 | 0.23 | Chromophobe Renal Cell Carcinoma |
| rs138920605 | P317T | 14,64727170,G,T | 0.950698 | Oncogenic (high conf.) | 0.155234 | Passenger | 1.248E-05 | ||
| rs905821436 | D326N | 14,64724059,C,T | 0.59872 | Oncogenic | 0.735066 | Driver | 5.579E-06 | 0.23 | Breast Invasive Ductal Carcinoma |
| rs1276302781 | L330H | 14,64724046,A,T | 0.946816 | Oncogenic (high conf.) | 0.41106 | Passenger | - | ||
| rs149090049 | W335R | 14,64724032,A,G | 0.917757 | Oncogenic (high conf.) | 0.534854 | Driver | 2.479E-06 | ||
| rs553390407 | G342V | 14,64724010,C,A | 0.941398 | Oncogenic (high conf.) | 0.355589 | Passenger | 6.20E-07 | ||
| rs368060197 | G352S | 14,64723981,C,T | 0.552654 | oncogenic | 0.667455 | Driver | 4.832E-05 | 0.38 | Uterine Endometrioid Carcinoma |
| rs141474553 | R364S | 14,64716397,C,A | 0.909262 | Oncogenic (high conf.) | 0.220505 | Passenger | 1.869E-06 | ||
| rs745947456 | V370I | 14,64716381,C,T | 0.628998 | oncogenic | 0.854778 | Driver | 1.054E-05 | 0.04 | Renal Clear Cell Carcinoma |
| rs764756707 | R388Q | 14,64716326,A,T | 0.536837 | oncogenic | 0.857166 | Driver | 4.276E-05 | 0.13 | Lung Squamous Cell Carcinoma |
| rs778031158 | N407Y | 14,64716270,T,A | 0.926747 | Oncogenic (high conf.) | 0.263806 | Passenger | - | ||
| rs768924970 | R454C | 14,64701734,G,A | 0.921404 | Oncogenic (high conf.) | 0.676257 | Driver | 6.815E-06 | ||
| rs766524153 | G502R | 14,64699944,T,C | 0.604477 | oncogenic | 0.577366 | Driver | 1.549E-05 | 0.34 | Rectal Adenocarcinoma |
Table 7.
RegulomeDB annotation of ESR2 3′UTR variants and predicted regulatory potential. This table summarizes variants located in the 3′ untranslated region (3 ′ UTR) of the ESR2 gene, as analyzed by RegulomeDB v2.0. Each entry includes the chromosomal position, dbSNP identifier, functional rank, and regulatory score (ranging from 0 to 1).
| Chromosome location | dbSNP IDs | Rank | Score |
|---|---|---|---|
| chr14:64233097..64233098 | rs4986938 | 1b | 1 |
| chr14:64233107..64233108 | rs989397691 | 2b | 0.94115 |
| chr14:64234904..64234905 | rs1023533876 | 2b | 0.88523 |
| chr14:64233105..64233106 | rs772987842 | 2b | 0.88523 |
| chr14:64234928..64234929 | rs200359377 | 2b | 0.8662 |
| chr14:64233116..64233117 | rs1418402420 | 2b | 0.84289 |
| chr14:64234924..64234925 | rs778636549 | 2b | 0.84289 |
| chr14:64233128..64233129 | rs374618716 | 2b | 0.8368 |
| chr14:64234946..64234947 | rs1221900232 | 2b | 0.8288 |
| chr14:64233121..64233122 | rs1300652813 | 2b | 0.82541 |
| chr14:64234923..64234924 | rs370541364 | 2b | 0.79882 |
| chr14:64233101..64233102 | rs1306618171 | 2b | 0.7614 |
| chr14:64234898..64234899 | rs767381562 | 2b | 0.7614 |
| chr14:64234925..64234926 | rs57659495 | 2b | 0.7614 |
| chr14:64234927..64234928 | rs757989022 | 2b | 0.7614 |
| chr14:64233127..64233128 | rs1414551434 | 2b | 0.76026 |
| chr14:64233127..64233128 | rs1414551434 | 2b | 0.76026 |
| chr14:64234934..64234935 | rs1487252486 | 2b | 0.7516 |
| chr14:64234945..64234946 | rs986361217 | 2b | 0.7516 |
| chr14:64233122..64233123 | rs915165791 | 2b | 0.75124 |
| chr14:64234936..64234937 | rs1477356325 | 2b | 0.74417 |
| chr14:64234933..64234934 | rs768095347 | 2b | 0.73193 |
| chr14:64234929..64234930 | rs563871991 | 2b | 0.69075 |
| chr14:64234905..64234906 | rs909213490 | 2b | 0.67136 |
| chr14:64234940..64234941 | rs1444732684 | 2b | 0.61749 |
| chr14:64234893..64234894 | rs969459185 | 2b | 0.61652 |
| chr14:64234893..64234894 | rs969459185 | 2b | 0.61652 |
| chr14:64234892..64234893 | rs756997470 | 2b | 0.51348 |
| chr14:64233123..64233124 | rs762341251 | 2b | 0.49614 |
| chr14:64234891..64234892 | rs1320955636 | 2b | 0.40513 |
| chr14:64234937..64234938 | rs1369678323 | 2b | 0.35835 |
| chr14:64233098..64233099 | rs769561814 | 2b | 0.34744 |
| chr14:64084854..64084855 | rs113851861 | 1f | 0.22271 |
| chr14:64234943..64234944 | rs778324793 | 2b | 0.01267 |
Table 8.
Polymorphic miRNA target sites in ESR2 identified by polymiRTS analysis. Listed are genomic coordinates (GRCh38), dbSNP IDs, variant types, ancestral/alternate alleles, affected miRNAs, conservation classes (1-7, higher=more conserved), miRNA binding sequences (lowercase=seed region), functional classes (D=disruptive, C=constructive, N=neutral, O=other), experimental support (Y/N), and context+ score changes (negative values indicate reduced binding affinity). Highlighted variants show particularly strong predicted effects on miRNA regulation.
| Location | dbSNP ID | Variant | Wobble | Ancestral | Allele | miR ID | Conservation | miRSite | Function | Exp | context+ | |
|---|---|---|---|---|---|---|---|---|---|---|---|---|
| type | base pair | Allele | Class | Support | score change | |||||||
| 64693801 | rs139004885 | SNP | Y | A | A | hsa-miR-1185-5p | 3 | atgccTATCCTCt | D | N | -0.16 | |
| hsa-miR-3679-5p | 3 | atgccTATCCTCt | D | N | -0.188 | |||||||
| hsa-miR-5191 | 2 | atgCCTATCCtct | D | N | -0.229 | |||||||
| G | hsa-miR-5004-5p | 3 | atgccTGTCCTCt | C | N | -0.211 | ||||||
| 64693871 | rs1255998 | SNP | N | C | C | hsa-miR-1207-5p | 1 | gctgtgCCTGCCA | N | N | -0.163 | |
| hsa-miR-4269 | 1 | gctGTGCCTGcca | N | N | -0.181 | |||||||
| hsa-miR-4736 | 1 | gctgtgCCTGCCA | N | N | -0.176 | |||||||
| hsa-miR-4763-3p | 1 | gctgtgCCTGCCA | N | N | -0.159 | |||||||
| hsa-miR-5582-5p | 1 | gcTGTGCCTgcca | N | N | -0.093 | |||||||
| hsa-miR-6715b-5p | 1 | gctGTGCCTGcca | N | N | -0.181 | |||||||
| hsa-miR-7150 | 1 | gctgtgCCTGCCA | N | N | -0.241 | |||||||
| G | hsa-miR-449b-3p | 1 | gcTGTGGCTgcca | C | N | -0.125 | ||||||
| hsa-miR-4691-3p | 1 | gctGTGGCTGcca | C | N | -0.211 | |||||||
| hsa-miR-885-3p | 1 | gctgtgGCTGCCA | C | N | -0.196 | |||||||
| 64693912 | rs58262369 | SNP | Y | G | G | hsa-miR-3191-5p | 4 | ttggCAGAGAAgg | D | N | -0.047 | |
| hsa-miR-6728-3p | 5 | ttgGCAGAGAagg | D | N | -0.11 | |||||||
| hsa-miR-942-5p | 4 | ttggcAGAGAAGg | D | N | -0.011 | |||||||
| A | hsa-miR-1248 | 3 | ttggcaAAGAAGG | C | N | -0.12 | ||||||
| hsa-miR-6844 | 4 | ttggCAAAGAAgg | C | N | 0.005 | |||||||
| 64694082 | rs8018687 | SNP | Y | A | A | hsa-miR-5004-3p | 2 | cAATCCAAcaatt | D | N | -0.109 | |
| 64694146 | rs114629727 | SNP | Y | A | A | hsa-miR-130b-5p | 1 | aaaGAAAGAGtta | N | N | -0.207 | |
| hsa-miR-618 | 1 | aaagaaAGAGTTA | N | N | -0.112 | |||||||
| G | hsa-miR-1237-3p | 1 | aaAGAAGGAgtta | C | N | -0.106 | ||||||
| hsa-miR-1248 | 1 | aAAGAAGGAgtta | C | N | -0.303 | |||||||
| hsa-miR-4764-3p | 1 | aaagaaGGAGTTA | C | N | -0.255 | |||||||
| hsa-miR-6868-3p | 1 | aaAGAAGGAgtta | C | N | -0.205 | |||||||
| 64694158 | rs28440970 | SNP | Y | A | A | hsa-miR-4282 | 2 | aaaaatAATTTTA | D | N | 0.071 | |
| hsa-miR-944 | 1 | aaaAATAATTtta | N | N | -0.067 | |||||||
| G | hsa-miR-1250-3p | 1 | aAAAATGAtttta | C | N | 0.023 | ||||||
| hsa-miR-153-5p | 1 | AAAAATGAtttta | C | N | -0.058 | |||||||
| hsa-miR-4668-3p | 2 | aaaaatGATTTTA | C | N | -0.008 | |||||||
| 64694170 | rs142219923 | SNP | N | C | C | hsa-miR-1246 | 5 | gtAATCCATgaaa | D | N | -0.157 | |
| hsa-miR-490-5p | 6 | gtaATCCATGAaa | D | N | -0.332 | |||||||
| 64694195 | rs928554 | SNP | Y | A | G | hsa-miR-4738-3p | 1 | acttCAGTTTCcc | C | N | -0.09 | |
| A | hsa-miR-3616-5p | 1 | ACTTCAAtttccc | N | N | -0.132 | ||||||
| hsa-miR-573 | 1 | ACTTCAAtttccc | N | N | -0.131 | |||||||
| 64694215 | rs201485281 | SNP | N | T | T | hsa-miR-5591-3p | 6 | aaatctTGGGTAA | D | N | -0.135 | |
| C | hsa-miR-4740-3p | 2 | aaaTCTCGGGtaa | C | N | -0.317 | ||||||
| 64694234 | rs202224619 | SNP | N | G | G | hsa-miR-4717-5p | 2 | aactcgGTGGCCT | D | N | -0.21 | |
| 64694235 | rs74604027 | SNP | Y | G | ||||||||
| A | hsa-miR-181a-2-3p | 2 | caacTCAGTGGcc | C | N | -0.183 | ||||||
| hsa-miR-219a-1-3p | 3 | CAACTCAgtggcc | C | N | -0.145 | |||||||
| hsa-miR-4252 | 2 | caactCAGTGGCc | C | N | -0.219 | |||||||
| hsa-miR-4682 | 3 | cAACTCAGtggcc | C | N | -0.11 | |||||||
| hsa-miR-571 | 3 | CAACTCAgtggcc | C | N | -0.082 | |||||||
| 64694264 | rs141329819 | SNP | N | C | C | hsa-miR-181a-3p | 1 | aagcaaCGATGGA | N | N | -0.173 | |
| T | hsa-miR-4317 | 1 | aaGCAATGAtgga | C | N | -0.086 | ||||||
| hsa-miR-6884-3p | 1 | aagcaaTGATGGA | C | N | -0.069 | |||||||
| 64694308 | rs146994281 | SNP | N | C | C | hsa-miR-3659 | 1 | AACACTCAcctca | N | N | -0.278 | |
| hsa-miR-4658 | 1 | aACACTCAcctca | N | N | -0.16 | |||||||
| hsa-miR-574-5p | 1 | aACACTCAcctca | N | N | -0.091 | |||||||
| hsa-miR-6134 | 2 | aacactCACCTCA | D | N | -0.119 | |||||||
| hsa-miR-6790-5p | 1 | aACACTCAcctca | N | N | -0.17 | |||||||
| hsa-miR-7854-3p | 2 | aacacTCACCTCA | D | N | -0.336 | |||||||
| A | hsa-miR-3591-5p | 1 | aACACTAAcctca | C | N | -0.119 | ||||||
| hsa-miR-377-5p | 2 | aacactAACCTCA | C | N | -0.101 | |||||||
| hsa-miR-4255 | 2 | AACACTAacctca | C | N | -0.057 | |||||||
| hsa-miR-6086 | 2 | aacactAACCTCA | C | N | -0.098 | |||||||
| hsa-miR-655-5p | 2 | aacacTAACCTCA | C | N | -0.316 | |||||||
| 64694323 | rs138379290 | SNP | Y | G | G | hsa-miR-1245b-5p | 4 | agaaAAGGCCTct | D | N | -0.233 | |
| hsa-miR-3142 | 4 | agaaAAGGCCTct | D | N | -0.233 | |||||||
| hsa-miR-627-3p | 4 | AGAAAAGgcctct | D | N | 0.062 | |||||||
| A | hsa-miR-3119 | 3 | agaAAAAGCCtct | C | N | -0.103 | ||||||
| hsa-miR-3188 | 4 | agaaaAAGCCTCt | C | N | -0.212 | |||||||
| 64694347 | rs192894852 | SNP | Y | G | G | hsa-miR-4708-5p | 1 | tgtcccGCATCTC | N | N | -0.124 | |
| A - |
hsa-miR-1233-5p | 1 | tgTCCCACAtctc | C | N | -0.153 | ||||||
| hsa-miR-1302 | 1 | TGTCCCAcatctc | C | N | -0.221 | |||||||
| hsa-miR-299-3p | 1 | tgtCCCACATctc | C | N | -0.223 | |||||||
| hsa-miR-4298 | 1 | TGTCCCAcatctc | C | N | -0.221 | |||||||
| hsa-miR-4648 | 1 | tGTCCCACAtctc | C | N | -0.472 | |||||||
| hsa-miR-4654 | 1 | tgTCCCACAtctc | C | N | -0.172 | |||||||
| hsa-miR-4769-5p | 1 | tgTCCCACAtctc | C | N | -0.178 | |||||||
| hsa-miR-576-3p | 1 | tgtccCACATCTc | C | N | -0.103 | |||||||
| hsa-miR-6778-5p | 1 | tgTCCCACAtctc | C | N | -0.156 | |||||||
| 64694416 | rs35874406 | INDEL | N | - | ||||||||
| A | hsa-miR-129-5p | 1 | CAAAAAAttgacat | O | N | 0.043 | ||||||
| 64694496 | rs184960071 | SNP | N | G | G | hsa-miR-6794-3p | 4 | ctttGAGTGAAag | D | N | -0.121 | |
| hsa-miR-888-5p | 3 | cTTTGAGTgaaag | D | N | -0.088 | |||||||
| C | hsa-miR-30a-3p | 4 | ctttgACTGAAAg | C | N | -0.029 | ||||||
| hsa-miR-30d-3p | 4 | ctttgACTGAAAg | C | N | -0.029 | |||||||
| hsa-miR-30e-3p | 4 | ctttgACTGAAAg | C | N | -0.029 | |||||||
| hsa-miR-4704-3p | 7 | cttTGACTGAaag | C | N | -0.126 | |||||||
| 64694521 | rs1152581 | SNP | N | G | G | hsa-miR-1323 | 3 | aaaagAGTTTTGg | D | N | -0.054 | |
| hsa-miR-548o-3p | 3 | aaaagAGTTTTGg | D | N | -0.082 | |||||||
| T | hsa-miR-548c-3p | 2 | aaaaGATTTTTgg | C | N | -0.027 |
Publisher’s Note: The statements, opinions and data contained in all publications are solely those of the individual author(s) and contributor(s) and not of MDPI and/or the editor(s). MDPI and/or the editor(s) disclaim responsibility for any injury to people or property resulting from any ideas, methods, instructions or products referred to in the content. |
© 2025 by the authors. Licensee MDPI, Basel, Switzerland. This article is an open access article distributed under the terms and conditions of the Creative Commons Attribution (CC BY) license (http://creativecommons.org/licenses/by/4.0/).
Copyright: This open access article is published under a Creative Commons CC BY 4.0 license, which permit the free download, distribution, and reuse, provided that the author and preprint are cited in any reuse.


