
Submitted:
01 August 2025
Posted:
04 August 2025
You are already at the latest version
Abstract
A novel nanocomposite of gold nanoparticles (AuNPs) and thiophosphate derivative of metal-boron cluster complex (metallacarborane), [8,8'-μ-O2P(O)SH-3,3'-Co(1,2-C2B9H10)2]HDBU was developed. The metallacarborane functionalized AuNPs were characterized by UV-vis, DLS, ELS, and ESI-MS techniques. The mass-spectrometry studies unanimously confirmed metallacarborane attachment to the surface of AuNPs. Fluorescent properties of the combined nanosystem based on the metallacarborane functionalized AuNPs and bovine serum albumin (BSA) have shown more effective protein binding to functionalized than non-functionalized AuNPs. Functionalizing of AuNPs with compound 1 appears to improve the nanoparticles activity against HSV-1 in cells after long-term infection for the higher virus concentration in post-treatment mode.
Keywords:
boron
; metallacarboranes
; gold nanoparticles
; self-assembly
; nanocomposite
; BSA binding
; antiviral activity
1. Introduction
Inorganic nanoparticles (NPs), including noble metal nanoparticles, have a variety of applications in medicine, including imaging, drug delivery, cancer therapy [1,2], and inhibiting virus proliferation [3,4]. They are also used as platforms promoting cellular delivery and uptake of boron-rich compounds such as metallacarboranes for boron neutron capture therapy (BNCT) applications [5]. The strategies for functionalizing the surface of metal nanoparticles with metallacarboranes [6] and carboranes [7,8] through thiol bonding to gold (AuNPs) and silver nanoparticles were developed. Herein, we propose another method for the attachment of metallacarborane to the AuNPs based on the high affinity of sulfur for gold using a phosphorothioate group instead of the thiol function. This approach was chosen by analogy to the commonly used method of attaching phosphorothioate DNA-oligonucleotide to AuNPs [9,10,11]. As a model metallacarborane ligand a thiophosphate derivative of bis(1,2-dicarbollido)-3-cobalt(1-)ate [8,8'-μ-O2P(O)SH-3,3'-Co(1,2-C2B9H10)2]HDBU (1) was used. This study aimed to increase the affinity of AuNPs to proteins, which may be important for therapeutic applications of AuNPs [1,[1,2[]. Recently published observations of more effective binding of metallacarborane–insulin conjugates to human serum albumin (HSA) further support the proposed concept [12]. Additionally, an original observation of the high affinity of metallacarboranes to proteins [13,14] rationalizes the use of metallacarboranes for this purpose.
2. Materials and Methods
2.1. Materials
3-Cobalt bis(1,2-dicarbollide) cesium salt was purchased from Katchem (Rež n/Prague, Czech Republic), sulfuric acid 95-97% EMSURE was from Merck KGaA (Darmstadt, Germany), imidazole, anhydrous triethylamine, tetrahydrofuran, and methanol were purchased from Sigma-Aldrich (Steinheim, Germany), phosphorus trichloride was bought from Acros Organics (New Jersey, USA), 1,8-diazabicyklo(5.4.0)undek-7-en (DBU) was bought from Fluka Chemie AG (Buchs, Switzerland). Gold(III) chloride trihydrate (HAuCl4·3H2O), sodium citrate tribasic dihydrate, Na3C6H5O7·2H2O, and albumin from bovine serum fraction V were from Sigma-Aldrich (St. Louis, MO, USA). Deionized water of 18.2 MΩ-cm from Milli-Q® Integral 5 Water Purification System, Millipore SAS (Molsheim, France) was used for preparation of solutions and colloids.
Cells and viruses. Vero cells (ATCC CCL-81; American Type Culture Collection, Manassas, VA, USA) derived from monkey kidney normal epithelial cells were grown in Eagle’s minimum essential medium (EMEM; Sigma-Aldrich Co. Ltd., Ayrshire, UK) supplemented with 10% inactivated heat-fetal calf serum (FBS), 2 mM L-glutamine, 100 units/mL penicillin G, 100 μg/mL streptomycin, and amphotericin 50 μg/mL (Sigma-Aldrich Co.). The cells were incubated in a growth medium at 37°C in a humidified atmosphere containing 5% CO2 . Human herpes simplex virus type 1 (HSV-1), strain MacIntyre (ATCC VR-539), was used in reduction assays. The virus was propagated and titrated in Vero cells in EMEM supplemented with 2% FBS, L-glutamine, and antibiotics.
Nanoparticles used in cytotoxicity and antiviral activity studies. Two types of colloidal gold nanoparticles (AuNPs) in sodium citrate water solution were used: unfunctionalized, washed AuNPs with a mean diameter of 12 nm and functionalized with compound 1, washed AuNPs+1 with a mean diameter of 12 nm. Both AuNPs and AuNPs+1 were resuspended in EMEM and used at two concentrations, 0.3 μg/mL and 5.9 μg/mL. A detailed description of the preparation of both types of nanoparticles can be found in the Method section below.
2.2. Methods
Synthesis of O,O-[3-cobalt bis(1,2-dicarbollide) phosphorothioate [8,8'-μ-O2P(O)SH-3,3'-[Co(1,2-C2B9H10)2]HDBU (1) was performed as described [15].
Preparation of AuNPs colloids. The AuNPs colloids were synthesized via chemical reduction of Au(III) in tetrachlorauric acid (HAuCl4) with trisodium citrate (NaCit, Na3C6H5O7) in aqueous solutions according to the Turkevich method [16,17]. A trifold molar excess of NaCit to HAuCl4 was used for the preparation of AuNPs colloid with a gold concentration CAu = 3.00 × 10⁻⁴ M. Stock solution of 1.25 × 10⁻¹ M HAuCl4 was prepared by dissolving 1 g (2.54 × 10⁻³ mol) of HAuCl4 in 20.31 mL of deionized water and stock solution of 1.00 × 10⁻² M NaCit was prepared by dissolving 0.147 g (5.00 × 10⁻⁴ mol) of NaCit in 50 mL of deionized water. Then, 0.06 mL of 1.25 × 10⁻¹ M HAuCl4 was put into 25 mL of boiling solution of NaCitr pH 7.5, obtained by dilution of 2.25 mL of 1 × 10⁻² M NaCit stock solution with deionized water to 25 mL, yielding a final concentration of HAuCl4 CHAuCl4 = 3.00 × 10⁻⁴ M and of NaCit 9.00 × 10⁻⁴ M in the reaction mixture. Next, the whole was stirred while boiling for 5 min, then allowed to cool at room temperature, yielding AuNPs colloid with CAu = 3.00 × 10⁻⁴ M in 9.00 × 10⁻⁴ M NaCit.
Functionalization of AuNPs with 3-cobalt bis(1,2-dicarbollide) thiophosphate (1). AuNPs colloid was functionalized with 3-cobalt bis(1,2-dicarbollide) thiophosphate (1) by addition of 0.10 mL aqueous solution of 1 (0.25 mg/mL, 4.26 × 10⁻⁴ M) to prepared as above 1.90 mL of AuNPs colloid (CAu = 3.00 × 10⁻⁴ M, NaCit 9.00 × 10⁻⁴ M) at ambient temperature, so the concentration of both components in studied samples were C1 = 2.13 × 10⁻⁵ M, CAu = 2.85 × 10⁻⁴ M and NaCit was 8.55 × 10⁻⁴ M, respectively. The molecular mass of compound 1 (MW = 586) obtained according to the procedure described in [15] was taken as the mass of its salt with 1,8-diazabicyclo(5.4.0)undec-7-ene (DBU). AuNPs colloid treated in this way with 1 was kept at ambient temperature for 1 h, then was used for the UV-vis absorption spectroscopy measurements. The Dynamic Light Scattering (DLS) and Electrophoretic Light Scattering (ELS) studies were performed 3 hours after the AuNPs+1 conjugate preparation.
Preparation of samples for Electrospray Ionization Mass Spectrometry (ESI-MS) measurements. The colloid of AuNPs treated with 1 (AuNPs+1) for ESI-MS measurements was prepared as described above, but on a larger scale of total volume 100 mL, obtaining AuNPs+1 colloid at CAu = 2.85 × 10⁻⁴ M in 8.55 × 10⁻⁴ M NaCit. The resultant AuNPs+1 colloid was centrifuged for 20 minutes at 12000 rpm using a Sigma 3-18K centrifuge (Newtown, Wem, Shropshire, UK). Then, the supernatant was removed from the pellet of AuNPs+1. The pellet was resuspended in 2.00 mL of 9.00 × 10⁻⁴ M NaCit solution, then vortexed and centrifuged. The procedure of AuNPs+1 washing was repeated three times. The sample of untreated AuNPs used as a control was prepared in the same way.
For the ESI-MS measurements, the metallacarborane thiophosphate 1 attached to the surface of AuNPs was released into solution using sodium borohydride (NaBH4) as a reducer of gold surface ions [18]. Briefly, a 0.20 mL of freshly prepared solution of NaBH4 in deionized water (2.00 mg/mL, 5.26 × 10⁻² M) was added to the washed functionalized or untreated AuNPs preparations obtained from 100 mL of the colloid as described above and resuspended in 0.20 mL of 3 × 10⁻⁵ M NaCit solution resulting in final CAu = 0.15 M gold concentration and molar ratio Au : NaBH4 = 2.85 : 1. After 1 h at room temperature the whole was centrifuged for 20 minutes at 12000 rpm then the supernatant filtered through PVDF 0.22 μm filters and analyzed by mass spectrometry.
Preparation of samples for fluorescence studies. Samples of washed treated with 1 or untreated AuNPs for the study of BSA binding were prepared as described above for the ESI-MS measurements (up to the release step of 1 from the AuNPs surface). The optical density (OD) of resultant colloids of washed and resuspended nanoparticles was adjusted to the initial value of ODAuNPs = 0.98 and ODAuNPs-1 = 1.05. The BSA solution was prepared freshly by dissolving the lyophilized powder of BSA in deionized water to a concentration of 2.00 mg/mL. A series of experiments was carried out using different ratios of BSA and AuNPs+1 conjugates. Typically, AuNPs interacted with BSA by addition of 0.01-0.025 mL aqueous solution of BSA (2.00 mg/mL) to 2.00 mL of AuNPs or AuNPs-1 colloids with CAu concentrations ranging from 3.00 × 10⁻⁵ M to 3.00 × 10⁻⁴ M that corresponded to CAuNPs/AuNPs-1 from 2.12 × 10⁻¹⁰ M to 2.12 × 10⁻⁹ M (Figure 7). The molar concentration of nanoparticles was calculated taking into account the average size of nanoparticles justified in section on the coverage of the surface of AuNPs with 8,8'-O,O-[cobalt bis(1,2-dicarbollide)]phosphorothioate (1), taking the rounded value of particles’ diameter d = 15 nm based on mean value of nanoparticle radius by number in Table 1, Table 2 and Table 3 r = 7.3 nm, and resulting number of gold atoms equal to 141300 per one nanoparticle. The AuNPs+1 dilutions were prepared by the addition of proper aliquots of AuNPs+1 stock colloid of CAu = 3 × 10⁻⁴ M concentration in 9.00 × 10⁻⁴ M sodium citrate solution at ambient temperature. Control samples of individual solutions of BSA, AuNPs colloid, and AuNPs+1 were prepared in the same way. The samples were prepared 24 h before the fluorescence measurements and stored at 4°C. The binding constants, Kb values, were calculated from a double logarithmic plot (Figure 7B) of the Stern-Volmer equation.
BSA binding Fluorescence spectroscopy. The emission spectra of BSA in the presence of untreated AuNPs colloids and treated with compound 1 were recorded using a Cary Eclipse fluorescence spectrophotometer (Varian Cary Eclipse, Mulgrave, Australia) in the region of 295-490 nm and the excitation wavelength λex = 270 nm in 1 cm quartz cells.
UV-vis spectroscopy. The UV-vis absorption spectra of untreated and treated with compound 1 AuNPs colloids, prepared 24 h before the measurements and stored at room temperature, were recorded in the wavelength range 200 – 800 nm using a spectrophotometer Jasco V-750 (Jasco Int., Easton, MD, USA) in 1 cm quartz cells. Data were analyzed by Spectra Analysis module in the Jasco Spectra Manager software.
Dynamic light scattering (DLS) and Electrophoretic light scattering (ELS) of AuNPs and AuNPs+1. The AuNPs treated with 1 (CAu = 2.85 × 10⁻⁴ M, C1 = 2.13 × 10⁻⁵ M) hydrodynamic size and zeta potential distributions were studied by a laser correlation spectrometer Zetasizer Nano-ZS (Malvern Panalytical Ltd., Malvern, UK) by dynamic light scattering (DLS) and electrophoretic light scattering (ELS) methods, respectively. The registration and statistical processing of the scattered laser light intensity measured at an angle of 173° from the colloids were performed three times during 180 s at 25°C in disposable folded capillary cells. The untreated AuNPs samples (CAu = 2.85 × 10⁻⁴ M) used as control were measured the same way.
Mass spectrometry. Electrospray ionization (ESI) mass spectra were recorded on Agilent 6546 LC/Q-TOF (Santa Clara, Kalifornia, United States). The ionization was achieved by ESI in positive ion mode (ESI+) and negative ion mode (ESI–). The capillary voltage was set to 4 kV. The source temperature was 300 °C, and the desolvation temperature was 350 °C. Nitrogen was used as a desolvation gas (11 L/min, purity >99%) from a nitrogen generator PEAK Scientific (Inchinnan, Great Britain).
Calculation of the coating of the surface of AuNPs with 3-cobalt bis(1,2-dicarbollide) thiophosphate (1). Mathematical (geometrical) modeling and statistical description methods were used to describe the final spatial structure of the AuNPs+1 nanoparticles. A gold nanoparticle was considered as a flat spherical object, whereas the spatial structure and sizes of 1 were adapted as previously described [19]. The problem was considered as a packing problem, “Circles Packing” and “Ellipses Packing” models were applied to choose the better fitting to the experimental data. Geometrical parameters of the nanoparticles were defined using the descriptive statistical methods based on the DLS data.
Cytotoxicity assay. The cytotoxic activities of untreated AuNPs and AuNPs treated with compound 1, AuNPs+1, were examined against the Vero cell line using the 3-(4,5-dimethylthiazol-2-yl)-2,5-diphenyltetrazolium bromide (MTT) assay as described previously [20]. Vero cells monolayers were grown in 96-well microtiter plates (2 × 10⁴ cells/well), and following 24 h incubation at 37 °C and 5% CO2 atmosphere, were treated with different concentrations of AuNPs or replaced with fresh medium (untreated controls). The cells were maintained for 48 h at 37 °C in 5% CO2, and the cell viability was then measured. The cytotoxic concentration (CC50) was defined as the concentration required to reduce the cell number by 50% compared to untreated controls. The cell variability was evaluated as the mean value density resulting from five mock-treated cell controls. The CC50 was calculated by linear regression analysis of the dose-response curves obtained from the data.
Virus titration. Plaque assay performed by the method of Reed–Muench [21] represents the gold standard in determining viral concentrations for infectious lytic virions. Vero cells grown in 24-well plates were inoculated with HSV-1 as described previously [21]. After 48 h incubation, the cells were fixed with methanol and stained with 0.05% methylene blue (Sigma-Aldrich). The HSV-1 plaques were counted under a microscope. Antiviral activity was expressed as the compound concentration required to reduce the number of viral plaques to 50% of the control (virus-infected but untreated). For cytopathic effect (CPE), inhibitory assays were carried out in confluent Vero cell monolayers (2 × 10⁴ cells/well) growing in 96-well plates. After 48 h of incubation, the number of viable cells was determined by the MTT method. The Reed–Muench method was used to calculate the median tissue culture infectious dose (TCID50). Antiviral activity was expressed as IC50 (50% inhibitory concentration), the concentration required to reduce virus-induced cytopathicity by 50% compared to the untreated control. Each sample was examined in triplicate.
Virus pre-treatment assay. AuNPs and AuNPs+1 were evaluated for their ability to inhibit the replication of HSV-1. The virus was used at a multiplicity of infection (MOI) of 1 and 2 plaque-forming units (PFU) per 1000 cells (MOI = 0.001 and 0.002, respectively). To study the influence of the gold nanoparticles treated and untreated with compound 1 on viral attachment to the host cells, the virions were pre-treated with AuNPs or AuNPs+1 before infection of Vero cells as described previously [20]. The HSV-1 suspension was treated at room temperature with AuNPs or AuNPs+1 at concentrations of 0.295 μg/mL or 5.9 μg/mL for 0 h, 1 h, and 4 h, and then the mixture was added to the cell monolayers at an MOI of 0.001 or 0.002. The T0 time point (0 h) means that the virus-nanoparticle mixture was added to the Vero cell monolayers immediately after mixing. After the infection, the plates were placed at room temperature for 1 hour for the virus absorption. Then the virus inoculum was removed from the cell monolayers, the cells were washed three times with PBS, and replaced with medium containing tested nanoparticles at 0.295 μg/mL or 5.9 μg/mL concentration. The cells were incubated for 48 h at 37 °C in 5% CO2, and then treated with MTT for CPE estimation. Untreated virus controls, citrate controls, and uninfected untreated cell controls were included in all assays. The supernatants after 48 h of incubation were collected, stored at −20 °C, and titrated in Vero cells. The antiviral activities of AUNPs and AuiNPs+1 were determined as the 50% inhibitory concentrations (IC50) calculated as the concentrations required to reduce virus-induced cytopathicity by 50% compared to the untreated control. Tenfold dilutions of supernatants were utilized to inoculate Vero cel monolayers in 96-well plates, and infected cells were maintained in culture for 48 h at 37 ◦C in 5% CO2 [20]. Each sample was examined in triplicate.
Virus post-treatment assay. Vero cells were first infected with HSV-1 at a concentration of MOI = 0.001 or 0.002. After 1 h of adsorption at room temperature, the virus inoculum was removed, and the cells were washed three times with PBS to remove the unattached virus [20]. Three different time points were studied: 0 h, 2 h, and 24 h post-infection (p.i.). The T0 time point means that AuNPs or AuNPs+1 were added to Vero cell cultures immediately after adsorption. The supernatants were harvested at 2 days p.i., when CPE was detected in the Vero cell cultures and titrated by plaque and MTT assays in Vero cells. The plates were incubated for 48 h at 37°C in 5% CO2, and the absorption of the samples with MTT was measured as described above.
Statistical analysis. The Wilcoxon signed-rank test was performed for comparisons of viral titers between groups. The mean and standard deviation (SD) were analyzed with scripts in Python. The data were obtained from three independent experiments. A p-value less than 0.05 was considered statistically significant.
3. Results and Discussion
Synthesis of 8,8’-O,O-[cobalt bis(1,2-dicarbollide)]phosphorothioate, [8,8'-μ-O2P(O)SH-3,3'-[Co(1,2-C2B9H10)2]HDBU (1) was performed in three steps as previously described [15]. Briefly, first the cesium salt of metallacarborane complex, 3-cobalt bis(1,2-dicarbollide) was treated with concentrated sulfuric acid to form it’s B(8,8’)-dihydroxy-derivative [22]. This was subsequently treated with freshly prepared tri(1H-imidazol-1-yl)phosphine to form (1H-imidazol-1yl)phosphoramidite of 8,8’-dihydroxy-3-cobalt bis(1,2-dicarbollide), which was hydrolyzed in situ into the corresponding H-phosphonate [8,8'-μ-O2P(O)H-3,3'-Co(1,2-C2B9H10)2]HNEt3. The H-phosphonate was transformed into thiophosphate using an elementary sulfur in the presence of a strong organic base, DBU, providing thiophosphoric acid bridged between boron atoms at positions 8 and 8' of 3-cobalt bis(1,2-dicarbollide) [8,8'-μ-O2P(O)SH-3,3'-[Co(1,2-C2B9H10)2]HDBU (1). The pKa value for the thiophosphate group of compound 1 was found to be 2.04 ± 0.06. The measurements were performed on the Pion SiriusT3 instrument (Pion Inc. Ltd., Forest Row, UK) using the spectrometric technique (details not shown).
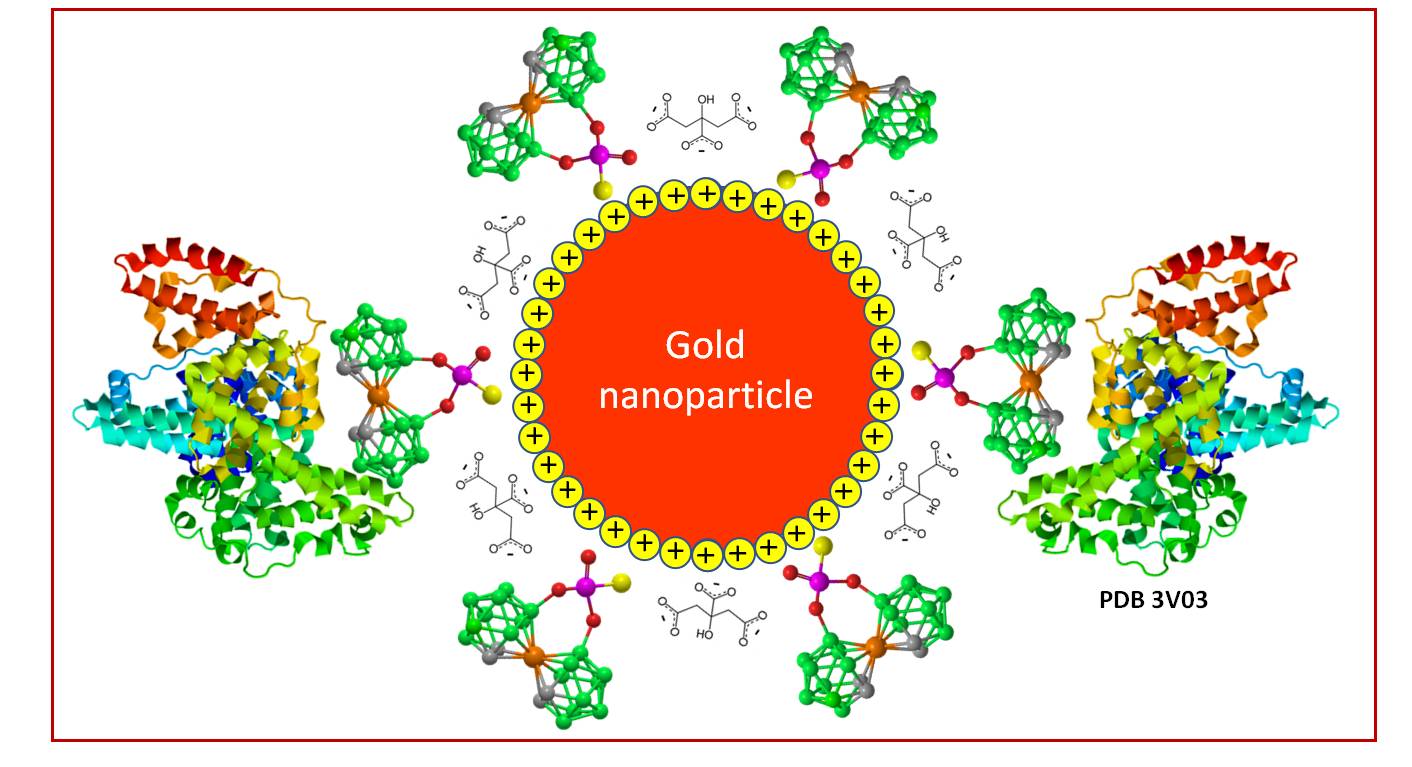
The preparation of AuNPs modified with 1 includes two main stages: 1) synthesis of AuNPs and 2) AuNPs functionalization with 1 (Figure 1). In the first stage, sodium citrate was chosen as a reducing agent of Au(III) ions [16,17] for the preparation of gold nanoparticle colloid. According to the literature data [17,23,24,25], the mechanism of particle formation in the sodium citrate/HAuCl4 system occurs through several stages: a) formation of nanoclusters less than 5 nm, b) formation of the network of nanoclusters forming gold nanowires, c) fragmentation of nanowires, and d) subsequent formation of individual AuNPs. These processes largely depend on the number of citrate carboxylate groups participating simultaneously in the reduction of metal ions, their binding to the surface of the resulting AuNPs, and the formation of a charge on their surface that stabilizes the nanoparticles due to electrostatic repulsion.
In the second stage, the AuNPs colloid (CAu = 3.00 × 10⁻⁴ M, CNaCitr = 6.00 × 10⁻⁴ M or 9.00 × 10⁻⁴ M) was treated with modifying component 1. Based on the obtained experimental data, the water was used as a solvent for preparation of 1 stock solution (0.25 mg/mL, 4.26 ×10⁻⁴ M) to avoid the aggregation of AuNPs, which occurred when organic solvents such as ethanol or DMSO were used as solvents for preparation of solutions of compound 1.
Optical properties. The detailed analysis of UV-Vis spectra of AuNPs and their functionalized conjugate AuNPs+1 allowed us to identify changes that are specific to the binding of the modifier 1 to the AuNPs. The main change concerns the characteristic of the localized surface plasmon resonance (LSPR) band of gold nanoparticles as a result of the binding of functionalizing agent 1 to AuNPs. Firstly, the position of the band maximum in spectra measured in citrate solution (CNaCitr = 9.00 × 10⁻⁴ M) is red-shifted from λ max = 520 nm for untreated AuNPs to λmax = 524 nm for AuNPs+1. Secondly, the intensity of the band maximum for AuNPs+1 increased by approximately 7% compared to untreated AuNPs (Figure 2A).
The changes in the intensity of the LSPR band were non-additive compared to the sum of the absorption of the control solution of 1 and the AuNPs colloid. Attached for comparison are the spectra of 1 at the same concentrations as used in the AuNPs functionalization process, showing additivity in the region of characteristic maximum for metallocarborane absorption at λ max = 320 nm and complete transparency of 1 in the broad region beyond 400 nm, including the region of LSPR band maximum for gold. The adsorption process of 1 on the surface of AuNPs depends on the concentration of 1, which is illustrated by the concentration dependence shown in Figure 2B.
As expected, the functionalization process, which involves the exchange of citrate molecules on the surface of AuNPs due to the formation of a stronger Au-S bond between the thiophosphate residue of 1 and the gold of the nanoparticle surface (Figure 1), may promote the aggregation of AuNPs.
This process is illustrated by a broadening of the LSPR band upon increasing the concentration of 1 in the AuNPs colloid (Figure 2C). A possible cause of this phenomenon is the known tendency of metallacarboranes to self-assembly as a result of the formation of dihydrogen bonds between metallacarborane molecules [26,27]. However, based on the data obtained from DLS and ELS measurements shown below, it seems that despite this, the colloids of AuNPs-1 were more stable compared to the untreated AuNPs.
The AuNPs and AuNPs-1 zeta potential distribution. The data on zeta potentials of untreated and treated with 1 AuNPs colloids are shown in Figure 3. In general, the negative surface charge of AuNPs treated with 1 was slightly increased compared to untreated AuNPs, with the average values of -42 mV and -37 mV, respectively, which is consistent with the above-mentioned increased stability of colloids of functionalized AuNPs+1 preparations. At the same time, the zeta potential distribution of studied nanoparticles became less homogeneous upon centrifugation and subsequent resuspension of the AuNPs+1 pellet.
The AuNPs and AuNPs+1 size distribution. There are no obvious changes in the size of AuNPs upon functionalisation with 1 according to DLS data (Figure 4). According to the distribution of nanoparticles by size (percentage of particles by quantity), the average size of the nanoparticles ranges from 10 nm to 16 nm, with a predominant population at 12 nm. According to the intensity basis, these values are 12-27 nm and 17 nm, respectively. Functionalized AuNPs were more stable compared to untreated, as the average size of particles in centrifuged and then resuspended systems remained generally unchanged (Figure 4C, dashed) compared to the increased size of untreated AuNPs due to aggregation (Figure 4B, dashed).
The coverage of the surface of AuNPs with 8,8’-O,O-[cobalt bis(1,2-dicarbollide)]phosphorothioate (1). For the estimation of surface coverage of AuNPs with 1, the structure of cobalt bis(1,2-dicarbollide, a metallacarborane core of 1, was adapted from [19] and is shown in Figure 5. It is supposed that the 2D projection is two crossed circles with a radius of 0.3 nm. For the theoretical calculations of coverage, different models were applied. Packing of flat shapes on some flat or curved surface is a mathematical and physical problem, which has been solved for various shapes and surfaces [28-30]. Two models were proposed here, as shown in Figure 5.
In the framework of the "Circles packing” model, it is assumed that there is a circle, which is inscribed around the 2D-projection of the molecule (excircle), and the surface of the sphere (nanoparticle) is close-packed by these excircles. Clare and Kepert showed that the packing density for the optimal packing of circles on the sphere ranges from 0.84 to nearly 0.90 [31]. The second model, "Ellipses packing," described the 2D projection of the molecule as an ellipse. Consequently, we need to find an ellipse inscribed around the 2D projection, and then pack these ellipses on the surface of the nanoparticle. For dense ellipse packing, the packing density is in the range from 0.74 to 0.80 [32]. Hence, the number of molecules per one nanoparticle is evaluated as follows:
where is the area of the surface of the nanoparticle; is the packing density (we use both the lowest and the highest values of the range); and is the area of the shape escribed around the 2D projection of the molecule, for circles packing with diameter, and for ellipse packing with and .
For the calculation of the radius of the nanoparticle, six approaches were used, which are shown in Table 1. Both the modal and mean value of nanoparticle size were taken into consideration. The modal value is the value that is most frequently observed in DLS measurements. This means that the nanoparticles size is set to the one with the highest probability based on DLS signal intensity distribution. In this case, the surface area is calculated as. Mean value of the NP radius is calculated as the sum of products of values of radius on their relative frequencies, and the surface area then. Mean value (averaged) of the NP surface area is calculated similarly, but for square radii. Results of calculations are presented in Table 1.
The experimental number of molecules 1 attached to one nanoparticle can be evaluated based on the intensity of 1 band in the absorption spectra of the supernatant of treated AuNPs colloid (Figure S1). Taking into account the concentration of 1, C1 = 2.13 × 10⁻⁵ M (the concentration of saturation according to Figure 2B, C), and the quantity of adsorbed molecules, , the experimental number of molecules per nanoparticle is:
where is Avogadro number, and is the concentration of nanoparticles (numbers per liter), which may be calculated as follows:
where CAu = 2.85 × 10⁻⁴ M is molar concentration of gold, MAu = 197 × 10-3 kg/mol is molar mass of gold, ρAu = 19.3 × 10⁻³ kg/m3 is density of gold, is the volume of one nanoparticle. As the difference in results using different approaches for calculating the surface area of a nanoparticle may differ by 2 orders of magnitude, we also evaluated the experimental value of adsorbed molecules using 6 approaches: for mode and mean values of radius, and for mean volume of a nanoparticle. Results are presented in Table 2.
The surface roughness seems not to be high enough to influence the results [33]. To compare theoretical and experimental results, it may be useful to calculate instead. In this case, we calculate the ratio of the experimental value of the number of molecules attached to one nanoparticle to the theoretical value of the number of molecules needed for the full coverage of one nanoparticle. In this case, the ratio is proportional to the radius of the nanoparticle itself, and close to DLS measurements by number, and seems to be a better option to use due to the greater convergence of experimental estimates and theoretical values.
The results of these calculations are presented in Table 3. Since the values for the ellipse packing fall within the middle range of values in Table 1, and the actual type of packing is unknown, we chose to use a theoretical average value from the theory of ellipse packing for our estimations.
Comparing the experimental results and theoretical evaluations, the following conclusion can be made. At low concentrations of compound 1 its molecules fully cover the surface of the nanoparticle in one layer. But for higher concentrations of modifier 1 the shell is formed in two layers of molecules, which is possible due to the tendency of 1 itself for self-assembling [26,27].
The ESI-MS measurements. The mass spectrometry was used to test the binding of 3-cobalt bis(1,2-dicarbollide) thiophosphate (1) to a gold surface and the subsequent functionalization of AuNPs. The samples of AuNPs functionalized with 1 for mass spectrometry measurements were prepared by carefully washing several times with deionized water. The detachment of 1 from the gold surface of AuNPs was achieved via reducing the gold ions Au(+1) with sodium borohydride [18]. Untreated AuNPs used as a control were processed the same way. For a detailed procedure, please see the experimental.
As shown in Figure 6, the mass spectrum of the analyte obtained from functionalized AuNPs recorded in negative mode unambiguously shows a diagnostic signal corresponding to a singly and doubly ionized modifier molecule 1 at 434.2066 m/z and 216.5998 m/z. Isotopic distribution within the molecular ion due to the natural abundance of 10B and 11B in natural elemental boron is characteristic of boron clusters (Figure 6, inset). The presence of 216.5998 m/z ion is most probably an unprotonated double-charged 3-cobalt bis(1,2-dicarbollide) thiophosphate anion.
Binding of gold nanoparticle modified with compound 1 to BSA. The binding of BSA to AuNPs treated with 1 was estimated and compared to the BSA interaction with non-modified AuNPs. According to the literature, binding constants (Kb) and the stoichiometric ratio (n) of the components are usually estimated by analyzing the fluorescence emission of the protein in the 300-500 nm region.
Results obtained by other authors demonstrate that BSA exhibits strong and consistent binding affinity to AuNPs under different particle sizes and pH conditions, and linear Stern-Volmer plots suggest that dynamic quenching is the dominant mechanism. For example, the Ao and colleagues [34] determined such parameters for the interaction of BSA with AuNPs (d = 26 nm) as Kb = 1.19 ×10¹⁰ М-1 and n = 1.46 at pH 7.4, respectively. As reported by Wangoo et al., the value of the binding constant for the BSA/AuNPs system was Kb = 3.16×10¹¹ M−1 at pH 7.0 (d = 40 nm) [35]. In both cases, the Stern-Volmer plot was linear, which indicates a single type of quenching mechanism, most likely dynamic quenching. According to the data shown by Iosin et al. for spherical AuNPs (d = 18 nm) obtained via the citrate method, the binding constant and stoichiometric ratio were Kb = 2.34 × 10¹¹ M-1 and n = 1.37, respectively [36].
The order of magnitude of the binding constant for the interaction of BSA with metallacarboranes alone is on the order of 105–106 M-1 [13]. Therefore, in the studied systems, a difference is expected between BSA attachment to the surface of untreated AuNPs and AuNPs coated with compound 1 – specifically, additional protein binding is likely to occur in the case of AuNPs-1 due to inherent interaction with the metallacarborane.
Upon interaction with BSA, the position of the LSPR band maximum in the absorption spectra of gold shifted from 520 to 522 nm for untreated AuNPs and from 524 to 526 nm for the 1-containing system, as shown for washed nanoparticles (Figure S3A). Also, such interaction is accompanied by a slight but consistent increase in LSPR band intensity (Figure S3B).
The aqueous solution of BSA exhibits a fluorescent signal in the range of 300-500 nm with an emission maximum at λem = 347 nm. It is known that AuNPs act as efficient energy acceptors in the process of fluorescence resonance energy transfer (FRET), and such a property was used for the detection of various analytes, in particular thiol-containing biomolecules [37-39]. Our results demonstrated that the BSA fluorescence is quenched upon the interaction with untreated AuNPs and AuNPs treated with compound 1. The intensity of the emission band of BSA at its maximum was decreased with increasing gold concentration (Figure 7A).
The double-logarithmic plots of BSA fluorescence spectra after the addition of nanoparticles (Figure 7B) allow estimation of the binding constants (Kb) for both systems, on linear regression analysis of the plots (Supplementary Material, S3).
The Kb value calculated for AuNPs/BSA and AuNPs-1-BSA system, 2.84×10⁹ M-1 and 3.13×10⁹ M-1, respectively, indicated the BSA binding affinity to both types of nanoparticles, with higher binding observed for AuNPs treated with compound 1. The increased BSA affinity for AuNPs functionalized with 1 may have a significant effect on the biological activity of this novel type of gold nanoparticles in comparison with untreated AuNPs. To define the difference in action of prepared nanosystems, a set of biological tests for the investigation of cytotoxicity and antiviral activity [3] was also performed.
Cytotoxic activity of AuNPs and AuNPs+1. In the performed studies, no cytotoxicity of the tested nanoparticles, AuNPs neither AuNPs+1, was observed within the tested concentration range. On the contrary, their significant stimulating effect on Vero cell proliferation was observed. Suprasingly, the viability of Vero cells cultured with AuNPs or AuNPs+1 was almost two-fold higher in comparison to the viability of untreated cells (p = 0.01).
Figure 8.
Cytotoxicity of gold nanoparticles AuNPs and AUNPs+1, NaCit stabilizer used, and compound 1. Number of viable Vero cells in comparison to the untreated cell control, NaCit, and compound 1 after incubation for 48 h. The nanoparticles were studied at two different dilutions: 5.9 µg/mL and 0.295 µg/mL. Blue: control of the cell line used as a reference point; orange: cell viability after adding the solution with 5.9 μg/ml of the substance / NPs; green: cell viability after adding the solution with 0.295 μg/ml of the substance / NPs. Numbers above the bar are equal to the mean value of the cell concentration compared to the control in percent. The cell viability was measured using an MTT assay. The data are shown as means ± SD of three independent experiments.
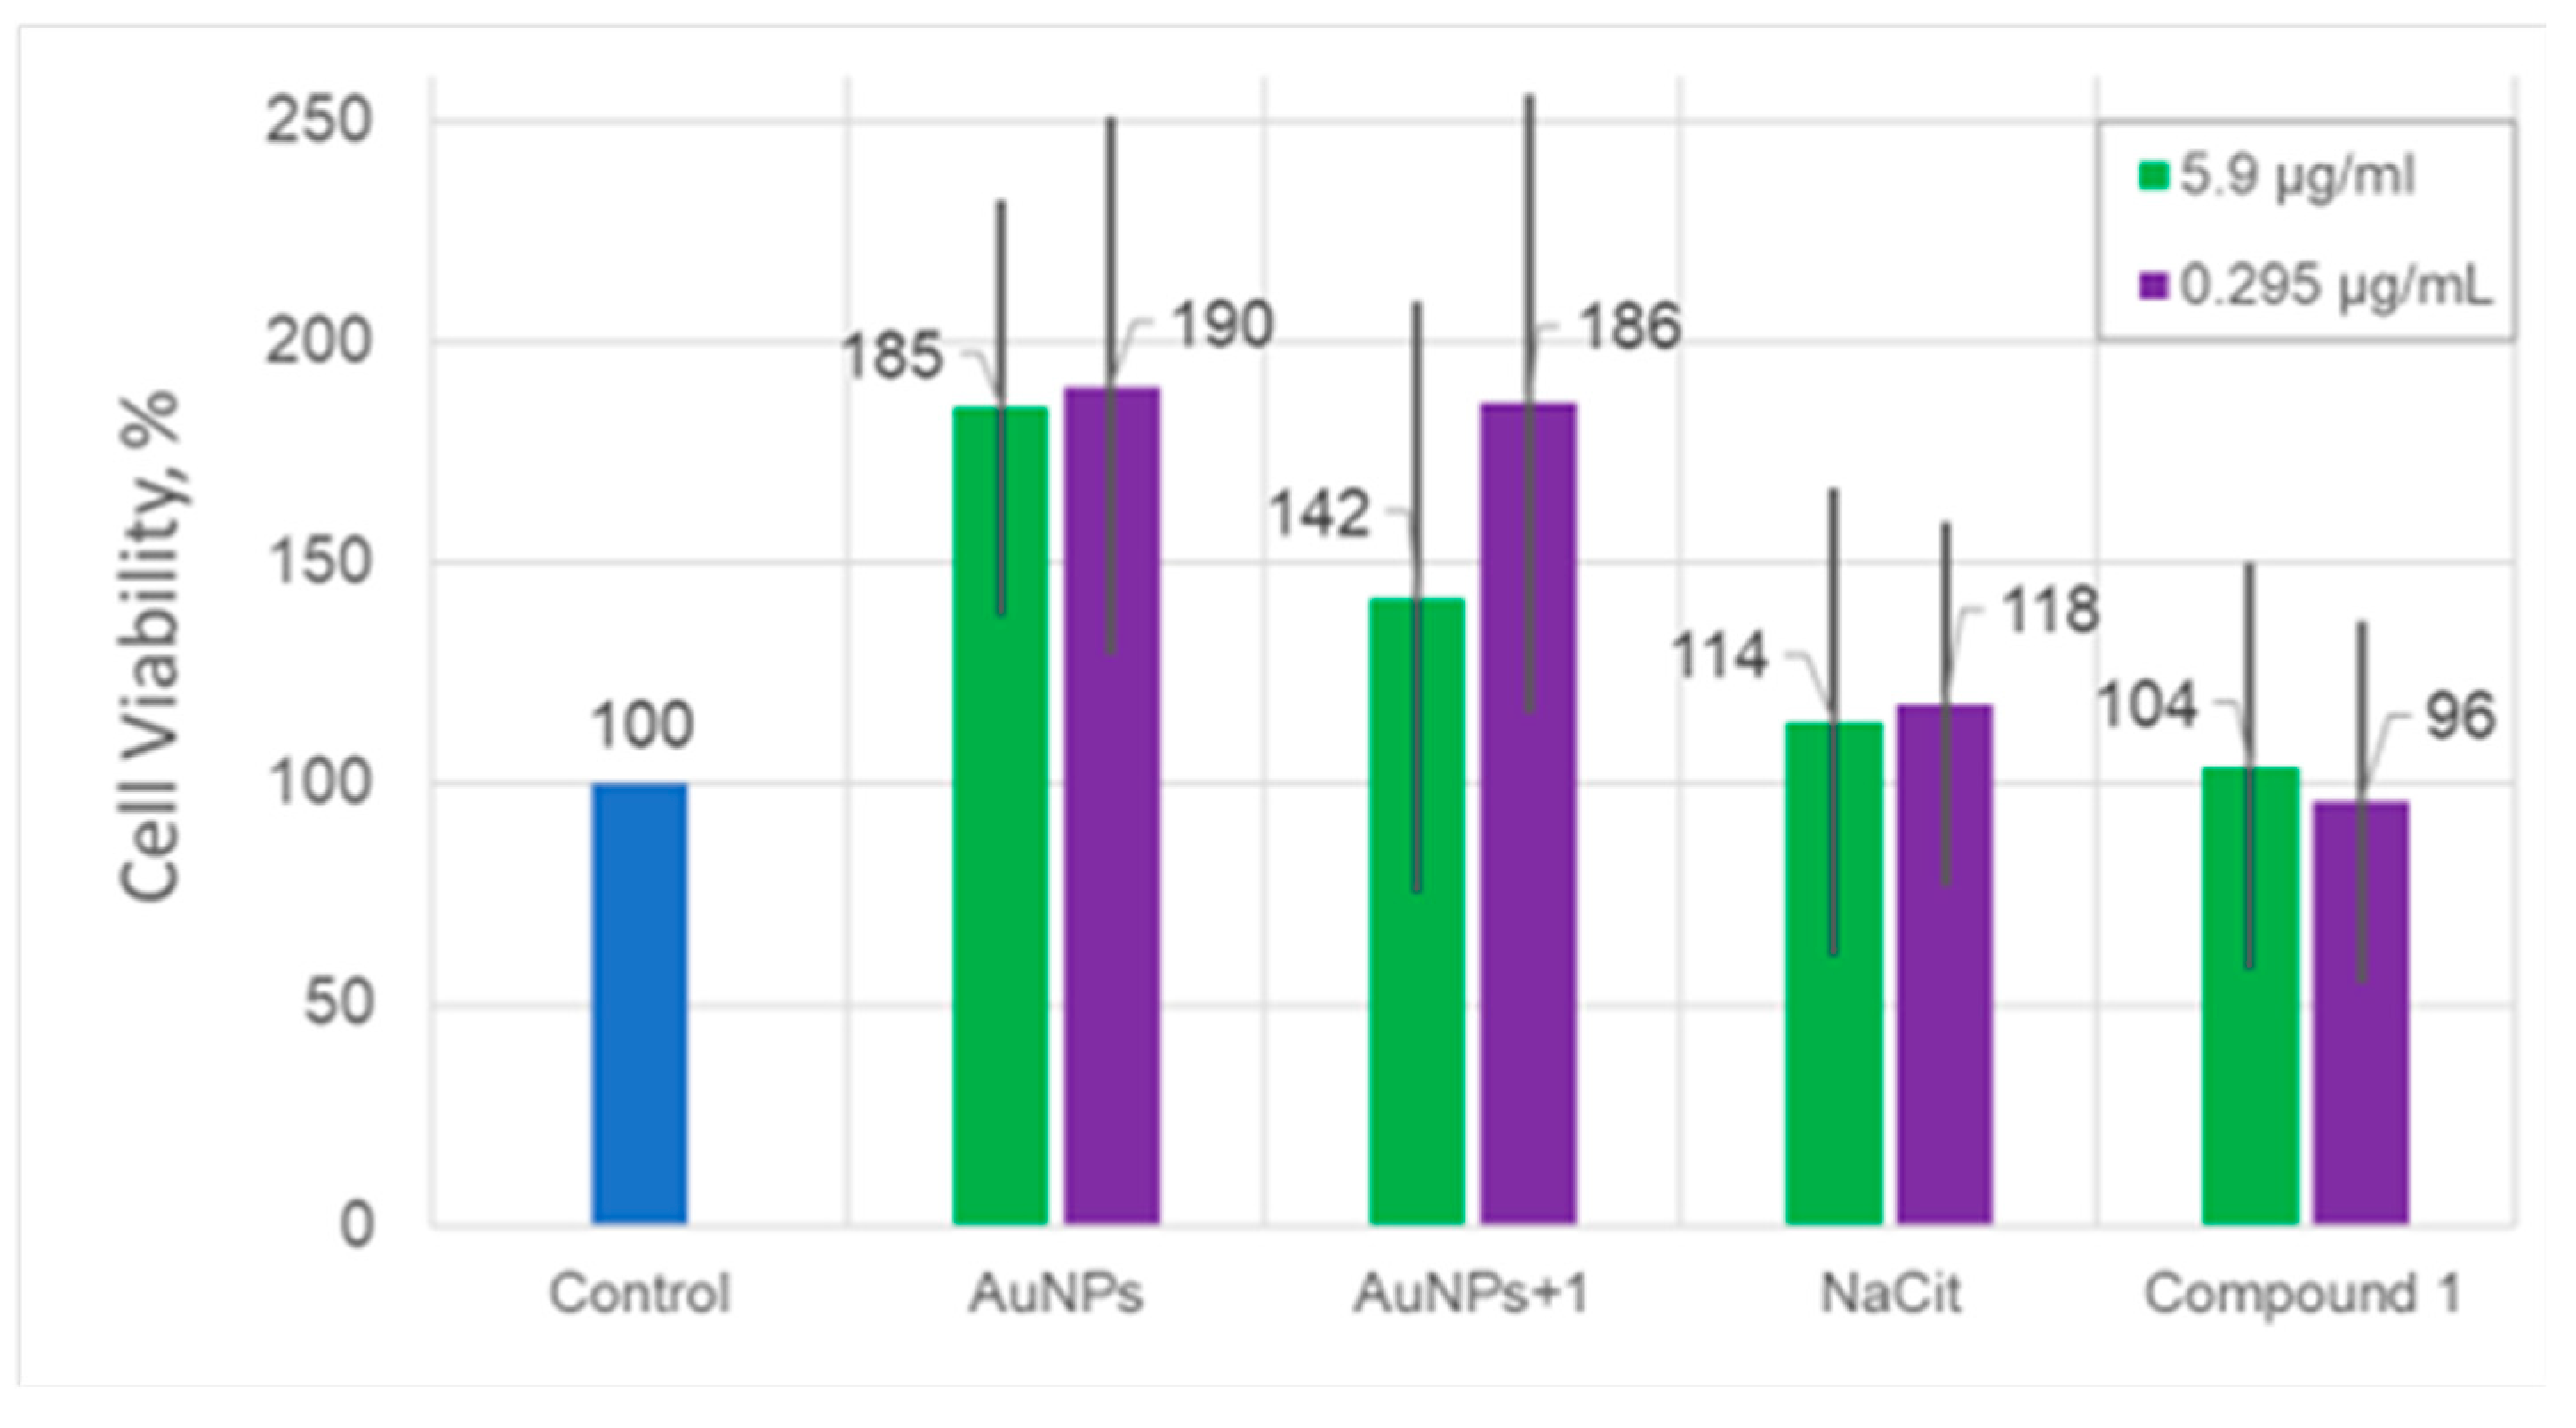
Washed nanoparticles, both AuNPs and AuNPs+1 stimulate the growth of Vero cells in a concentration-dependent manner. It should be noted that the absorbance of light by the medium with AuNPs or AuNPs+1 itself was subtracted from the absorbance of the cells with EMEM and AuNPs. Hence, we can be sure that these results reflect a proper number of cells. Moreover, NaCit and compound 1 demonstrated no effect on the viability of Vero cells (p < 0.05). The promotion of cell proliferation by AuNPs has already been shown for MC3T3-E1 preosteoblastic cells derived from mouse calvaria [40,41]. It was stated that the size and concentration of nanoparticles are the key factors for this phenomenon [40]. Moreover, the nonlinear, and more importantly, nonmonotonic dependence of the proliferation effect from the concentration of AuNPs was observed.
Antiviral activity. To assess the effect of AuNPs and AUNPs+1 on the inhibition of HSV-1 replication, pre-treatment and post-treatment assays were used. The dose-dependent efficiency of AuNPs or AuNPs+1 on viral titers released into cell-free culture supernatant was observed. Both AuNPs types demonstrated antiviral activity, but at different rates as well in pre-treatment as post-treatment assays. The highest antiviral activity in the pre-treatment assay was observed for 0 hours. We hypothesize that AuNPs may disturb the virus attachment to the cellular receptors and prevent entry to the cell or fusion with its membrane [21]. Interestingly, at low concentration, the antiviral action of AuNPs+1 after 24 hours post-treatment was higher than that for AuNPs (0.3 μg/mL), independent of the viral load. The respective cell viability was 38% for AuNPs+1 vs. 28% for AuNPs (MOI = 0.001), and 34% for AuNPs+1 vs. 19% for AuNPs (MOI = 0.002 ) (Figure 9A–D). Similarly, after 2-hour post-treatment with low concentration, AuNPs+1 showed higher antiviral activity than AuNPs (78% for AuNPs+1 vs. 60% for AuNPs in lower MOI, and 94% for AuNPs+1 vs. 74% for AuNPs in higher MOI conditions, Figure 9A–D). Functionalizing of AuNPs with compound 1 appears to enhance the nanoparticles' antiviral activity against HSV-1 in Vero cells after long-term infection.
4. Conclusions
The experimental conditions were developed and optimized for the preparation of novel nanocomposites based on AuNPs and 8,8’-O,O-[cobalt bis(1,2-dicarbollide)]phosphorothioate (1), stable according to zeta potential values observed via ELS measurements. Based on theoretical calculations and UV-Vis data the coverage of AuNPs surface was estimated as self-assembled two layers of modifier. Among other indirect methods, the mass-spectrometry allowed to prove the binding of metallacarborane to gold surface by fixing the diagnostic signal of ionized anion of boron clusters with intristic isotopic distribution for modified AuNPs.
The interaction between BSA protein and colloidal gold nanoparticles, untreated and treated with metallacarborane 1, was described by differences in characteristics of LSPR band of AuNPs in absorption spectra and different trends in emission quenching of BSA induced by metallacarborane in fluorescence spectra. According to the calculated values of binding constant in case of AuNPs treated with 1 Kb was higher than for untreated AuNPs, indicating more effective interaction of BSA in the presence of metallacarborane modified AuNPs. Both AuNPs types demonstrated antiviral activity, but at different rates. The antiviral action of AuNPs+1 after 24 hours in post-treatment mode was higher than that for AuNPs. It appears that functionalizing of the gold nanoparticle with compound 1 may increase the ability of AuNPs to protect cells after long-term infection.
Supplementary Materials
The following supporting information can be downloaded at the website of this paper posted on Preprints.org.
Acknowledgments
Funding by National Science Centre in Poland, grant No. 015/16/W/ST5/00413; the authors are grateful to P. Guga of Centre of Molecular and Macromolecular Studies PAS for the assistance in the fluorescence measurements. Iu.M. and N.R. are grateful for Polish Academy of Sciences for the financial and overall support of internship visits at Laboratory of Medicinal Chemistry and Laboratory of Virology of the Institute of Medical Biology of Polish Academy of Sciences in a period of 2022. The electrospray ionization (ESI) mass spectra were recorded on Agilent 6546 LC/Q-TOF, and the pKa measurement for compound 1 were performed on the Pion SiriusT3 instrument (Pion Inc. Ltd., Forest Row, UK) at the National Library of Chemical Compounds (NLCC) established within the project POL-OPENSCREEN financed by the Ministry of Science and Higher Education (decision no. DIR/WK/2018/06 of October 24, 2018).
References
- Hornos Carneiro, M. F.; Barbosa, F. Gold nanoparticles: A critical review of therapeutic applications and toxicological aspects. J. Toxicol. Environ. Health Part B 2016, 19, 129–148. [Google Scholar] [CrossRef]
- Sibuyi, N. R. S.; Moabelo, K. L.; Fadaka, A. O.; Meyer, S.; Onani, M. O.; Madiehe, A. M.; Meyer, M. Multifunctional gold nanoparticles for improved diagnostic and therapeutic applications: A review. Nanoscale Res. Lett. 2021, 16, 174. [Google Scholar] [CrossRef]
- Paradowska, E.; Studzińska, M.; Jabłońska, A.; Lozovski, V.; Rusinchuk, N.; Mukha, I.; Vitiuk, N.; Leśnikowski, Z. J. Antiviral effect of nonfunctionalized gold nanoparticles against herpes simplex virus type-1 (HSV-1) and possible contribution of near-field interaction mechanism. Molecules 2021, 26, 5960. [Google Scholar] [CrossRef]
- Teimouri, H.; Taheri, S.; Saidabad, F. E.; Nakazato, G.; Maghsoud, Y.; Babaei, A. New insights into gold nanoparticles in virology: A review of their applications in the prevention, detection, and treatment of viral infections. Biomed. Pharmacother. 2025, 183, 117844. [Google Scholar] [CrossRef]
- Gozzi, M.; Schwarze, B.; Hey-Hawkins, E. Preparing (metalla)carboranes for nanomedicine. ChemMedChem 2021, 16, 1533–1565. [Google Scholar] [CrossRef]
- Pulagam, K. R.; Gona, K. B.; Gómez-Vallejo, V.; Meijer, J.; Zilberfain, C.; Estrela-Lopis, I.; Baz, Z.; Cossío, U.; Llop, J. Gold nanoparticles as boron carriers for boron neutron capture therapy: Synthesis, radiolabelling and in vivo evaluation. Molecules 2019, 24, 3609. [Google Scholar] [CrossRef]
- Baše, T.; Bastl, Z.; Havránek, V.; Lang, K.; Bould, J.; Londesborough, M. G. S.; Macháček, J.; Plešek, J. Carborane–thiol–silver interactions. A comparative study of the molecular protection of silver surfaces. Surf. Coat. Technol. 2010, 204, 2639–2646. [Google Scholar] [CrossRef]
- Baše, T.; Bastl, Z.; Plzák, Z.; Grygar, T.; Plešek, J.; Carr, M. J.; Malina, V.; Šubrt, J.; Boháček, J.; Večerníková, E.; Kříž, O. Carboranethiol-modified gold surfaces. A study and comparison of modified cluster and flat surfaces. Langmuir 2005, 21, 7776–7785. [Google Scholar] [CrossRef] [PubMed]
- Kim, J.-Y.; Lee, D. H.; Kim, S. J.; Jang, D.-J. Preferentially linear connection of gold nanoparticles in derivatization with phosphorothioate oligonucleotides. J. Colloid Interface Sci. 2008, 326, 387–391. [Google Scholar] [CrossRef] [PubMed]
- Zhou, W.; Wang, F.; Ding, J.; Liu, J. Tandem phosphorothioate modifications for DNA adsorption strength and polarity control on gold nanoparticles. ACS Appl. Mater. Interfaces 2014, 6, 14795–14800. [Google Scholar] [CrossRef]
- Hu, S.; Huang, P.-J. J.; Wang, J.; Liu, J. Phosphorothioate DNA mediated sequence-insensitive etching and ripening of silver nanoparticles. Front. Chem. 2019, 7, 198. [Google Scholar] [CrossRef]
- Cebula, J.; Fink, K.; Goldeman, W.; Filip-Psurska, B.; Gos, M.; Leśnikowski, Z. J.; Boratyński, J.; Goszczyński, T. M. An alternative strategy for albumin binding in therapeutics. Proof-of-concept synthesis of metallacarborane–insulin conjugates. ChemRxiv 2025, 1–36. [Google Scholar] [CrossRef]
- Goszczyński, T. M.; Fink, K.; Kowalski, K.; Leśnikowski, Z. J.; Boratyński, J. Interactions of boron clusters and their derivatives with serum albumin. Sci. Rep. 2017, 7, 9800. [Google Scholar] [CrossRef]
- Fuentes, I.; Pujols, J.; Viñas, C.; Ventura, S.; Teixidor, F. Dual binding mode of metallacarborane produces a robust shield on proteins. Chem. – Eur. J. 2019, 25, 12820–12829. [Google Scholar] [CrossRef] [PubMed]
- Śmiałkowski, K.; Sardo, C.; Leśnikowski, Z. J. Metallacarborane synthons for molecular construction—oligofunctionalization of cobalt bis(1,2-dicarbollide) on boron and carbon atoms with extendable ligands. Molecules 2023, 28, 4118. [Google Scholar] [CrossRef] [PubMed]
- Turkevich, J.; Stevenson, P. C.; Hillier, J. A Study of the nucleation and growth processes in the synthesis of colloidal gold. Discuss. Faraday Soc. 1951, 11, 55. [Google Scholar] [CrossRef]
- Kimling, J.; Maier, M.; Okenve, B.; Kotaidis, V.; Ballot, H.; Plech, A. Turkevich method for gold nanoparticle synthesis revisited. J. Phys. Chem. B 2006, 110, 15700–15707. [Google Scholar] [CrossRef]
- Barman, G.; Maiti, S.; Konar Laha, J. Trichloroacetic acid assisted synthesis of gold nanoparticles and its application in detection and estimation of pesticide. J. Anal. Sci. Technol. 2013, 4, 3. [Google Scholar] [CrossRef]
- Bauduin, P.; Prevost, S.; Farràs, P.; Teixidor, F.; Diat, O.; Zemb, T. A theta-shaped amphiphilic cobaltabisdicarbollide anion: Transition from monolayer vesicles to micelles. Angew. Chem. Int. Ed. 2011, 50, 5298–5300. [Google Scholar] [CrossRef]
- Paradowska, E.; Studzińska, M.; Jabłońska, A.; Lozovski, V.; Rusinchuk, N.; Mukha, I.; Vitiuk, N.; Leśnikowski, Z.J. Antiviral Effect of Nonfunctionalized Gold Nanoparticles against Herpes Simplex Virus Type-1 (HSV-1) and Possible Contribution of Near-Field Interaction Mechanism. Molecules 2021, 26, 5960. [Google Scholar] [CrossRef]
- Reed, L.J.; Muench, H. A simple method of estimating fifty per cent endpoints. Am. J. Epid. 1938, 27, 493–497. [Google Scholar] [CrossRef]
- Plešek, J.; Grüner, B.; Báča, J.; Fusek, J.; Cı́sařová, I. Syntheses of the B(8)-hydroxy- and B(8,8′)-dihydroxy-derivatives of the bis(1,2-dicarbollido)-3-cobalt(1-)ate ion by its reductive acetoxylation and hydroxylation: Molecular structure of [8,8′-μ-CH3C(O)2<(1,2-C2B9 H10)2-3-Co]0 zwitterion determined by X-ray diffraction analysis. J. Organomet. Chem. 2002, 649, 181–190. [Google Scholar] [CrossRef]
- Ji, X.; Song, X.; Li, J.; Bai, Y.; Yang, W.; Peng, X. Size control of gold nanocrystals in citrate reduction: The third role of citrate. J. Am. Chem. Soc. 2007, 129, 13939–13948. [Google Scholar] [CrossRef]
- Polte, J.; Ahner, T. T.; Delissen, F.; Sokolov, S.; Emmerling, F.; Thünemann, A. F.; Kraehnert, R. Mechanism of gold nanoparticle formation in the classical citrate synthesis method derived from coupled in situ XANES and SAXS evaluation. J. Am. Chem. Soc. 2010, 132, 1296–1301. [Google Scholar] [CrossRef] [PubMed]
- Pong, B.-K.; Elim, H. I.; Chong, J.-X.; Ji, W.; Trout, B. L.; Lee, J.-Y. New insights on the nanoparticle growth mechanism in the citrate reduction of gold(III) salt: Formation of the Au nanowire intermediate and its nonlinear optical properties. J. Phys. Chem. C 2007, 111, 6281–6287. [Google Scholar] [CrossRef]
- Viñas, C.; Tarrés, M.; González-Cardoso, P.; Farràs, P.; Bauduin, P.; Teixidor, F. Surfactant behaviour of metallacarboranes. A study based on the electrolysis of water. Dalton Trans. 2014, 43, 5062–5068. [Google Scholar] [CrossRef] [PubMed]
- Fernandez-Alvarez, R.; Ďorďovič, V.; Uchman, M.; Matějíček, P. Amphiphiles without head-and-tail design: Nanostructures based on the self-assembly of anionic boron cluster compounds. Langmuir 2018, 34, 3541–3554. [Google Scholar] [CrossRef]
- Jodrey, W. S.; Tory, E. M. Simulation of random packing of spheres. SIMULATION 1979, 32, 1–12. [Google Scholar] [CrossRef]
- Gnidovec, A.; Božič, A.; Čopar, S. Dense packings of geodesic hard ellipses on a sphere. Soft Matter 2022, 18, 7670–7678. [Google Scholar] [CrossRef]
- Torquato, S.; Jiao, Y. Organizing principles for dense packings of nonspherical hard particles: Not all shapes are created equal. Phys. Rev. E 2012, 86, 011102. [Google Scholar] [CrossRef]
- Clare, B. W.; Kepert, D. L. The optimal packing of circles on a sphere. J. Math. Chem. 1991, 6, 325–349. [Google Scholar] [CrossRef]
- Ilin, D. N.; Bernacki, M. A new algorithm for dense ellipse packing and polygonal structures generation in context of FEM or DEM. MATEC Web Conf. 2016, 80, 02004. [Google Scholar] [CrossRef]
- Razouk, A.; Sahlaoui, M.; Eddahri, S.; Agouriane, E.; Sajieddine, M. Monte carlo investigation of magnetization in small ferromagnetic heisenberg nanoparticles. J. Supercond. Nov. Magn. 2017, 30, 425–430. [Google Scholar] [CrossRef]
- Ao, L.; Gao, F.; Pan, B.; Cui, D.; Gu, H. Interaction between gold nanoparticles and bovine serum albumin or sheep antirabbit immunoglobulin G. Chin. J. Chem. 2006, 24, 253–256. [Google Scholar] [CrossRef]
- Wangoo, N.; Suri, C. R.; Shekhawat, G. Interaction of gold nanoparticles with protein: A spectroscopic study to monitor protein conformational changes. Appl. Phys. Lett. 2008, 92, 133104. [Google Scholar] [CrossRef]
- Iosin, M.; Toderas, F.; Baldeck, P. L.; Astilean, S. Study of protein–gold nanoparticle conjugates by fluorescence and surface-enhanced raman scattering. J. Mol. Struct. 2009, 924–926, 196–200. [Google Scholar] [CrossRef]
- Zhou, B.; Chen, Y.-T.; Zhen, X.-L.; Lou, L.; Wang, Y.-S.; Suo, Q.-L. Fluorescent resonance energy transfer of organic fluorescent dyes with gold nanoparticles and their analytical application. Gold Bull. 2018, 51, 145–151. [Google Scholar] [CrossRef]
- Xu, J.; Yu, H.; Hu, Y.; Chen, M.; Shao, S. A gold nanoparticle-based fluorescence sensor for high sensitive and selective detection of thiols in living cells. Biosens. Bioelectron. 2016, 75, 1–7. [Google Scholar] [CrossRef]
- Lo, S.-H.; Wu, M.-C.; Wu, S.-P. A turn-on fluorescent sensor for cysteine based on BODIPY functionalized Au nanoparticles and its application in living cell imaging. Sens. Actuators B Chem. 2015, 221, 1366–1371. [Google Scholar] [CrossRef]
- Yao, Y.; Shi, X.; Chen, F. The effect of gold nanoparticles on the proliferation and differentiation of murine osteoblast: a study of MC3T3-E1 cells in vitro. J. Nanosci. Nanotechnol. 2014, 14, 4851–4857. [Google Scholar] [CrossRef]
- Liu, D.D.; Zhang, T.C.; Yi, C.Q.; Yang, M.S. The effects of gold nanoparticles on the proliferation, differentiation, and mineralization function of MC3T3-E1 cells in vitro. Chem. Biol. 2010, 1013–1019. [Google Scholar] [CrossRef]
Figure 1.
Idealized image of a gold nanoparticle modified with 8,8’-O,O-[cobalt bis(1,2-dicarbollide)]phosphorothioate (1).
Figure 1.
Idealized image of a gold nanoparticle modified with 8,8’-O,O-[cobalt bis(1,2-dicarbollide)]phosphorothioate (1).
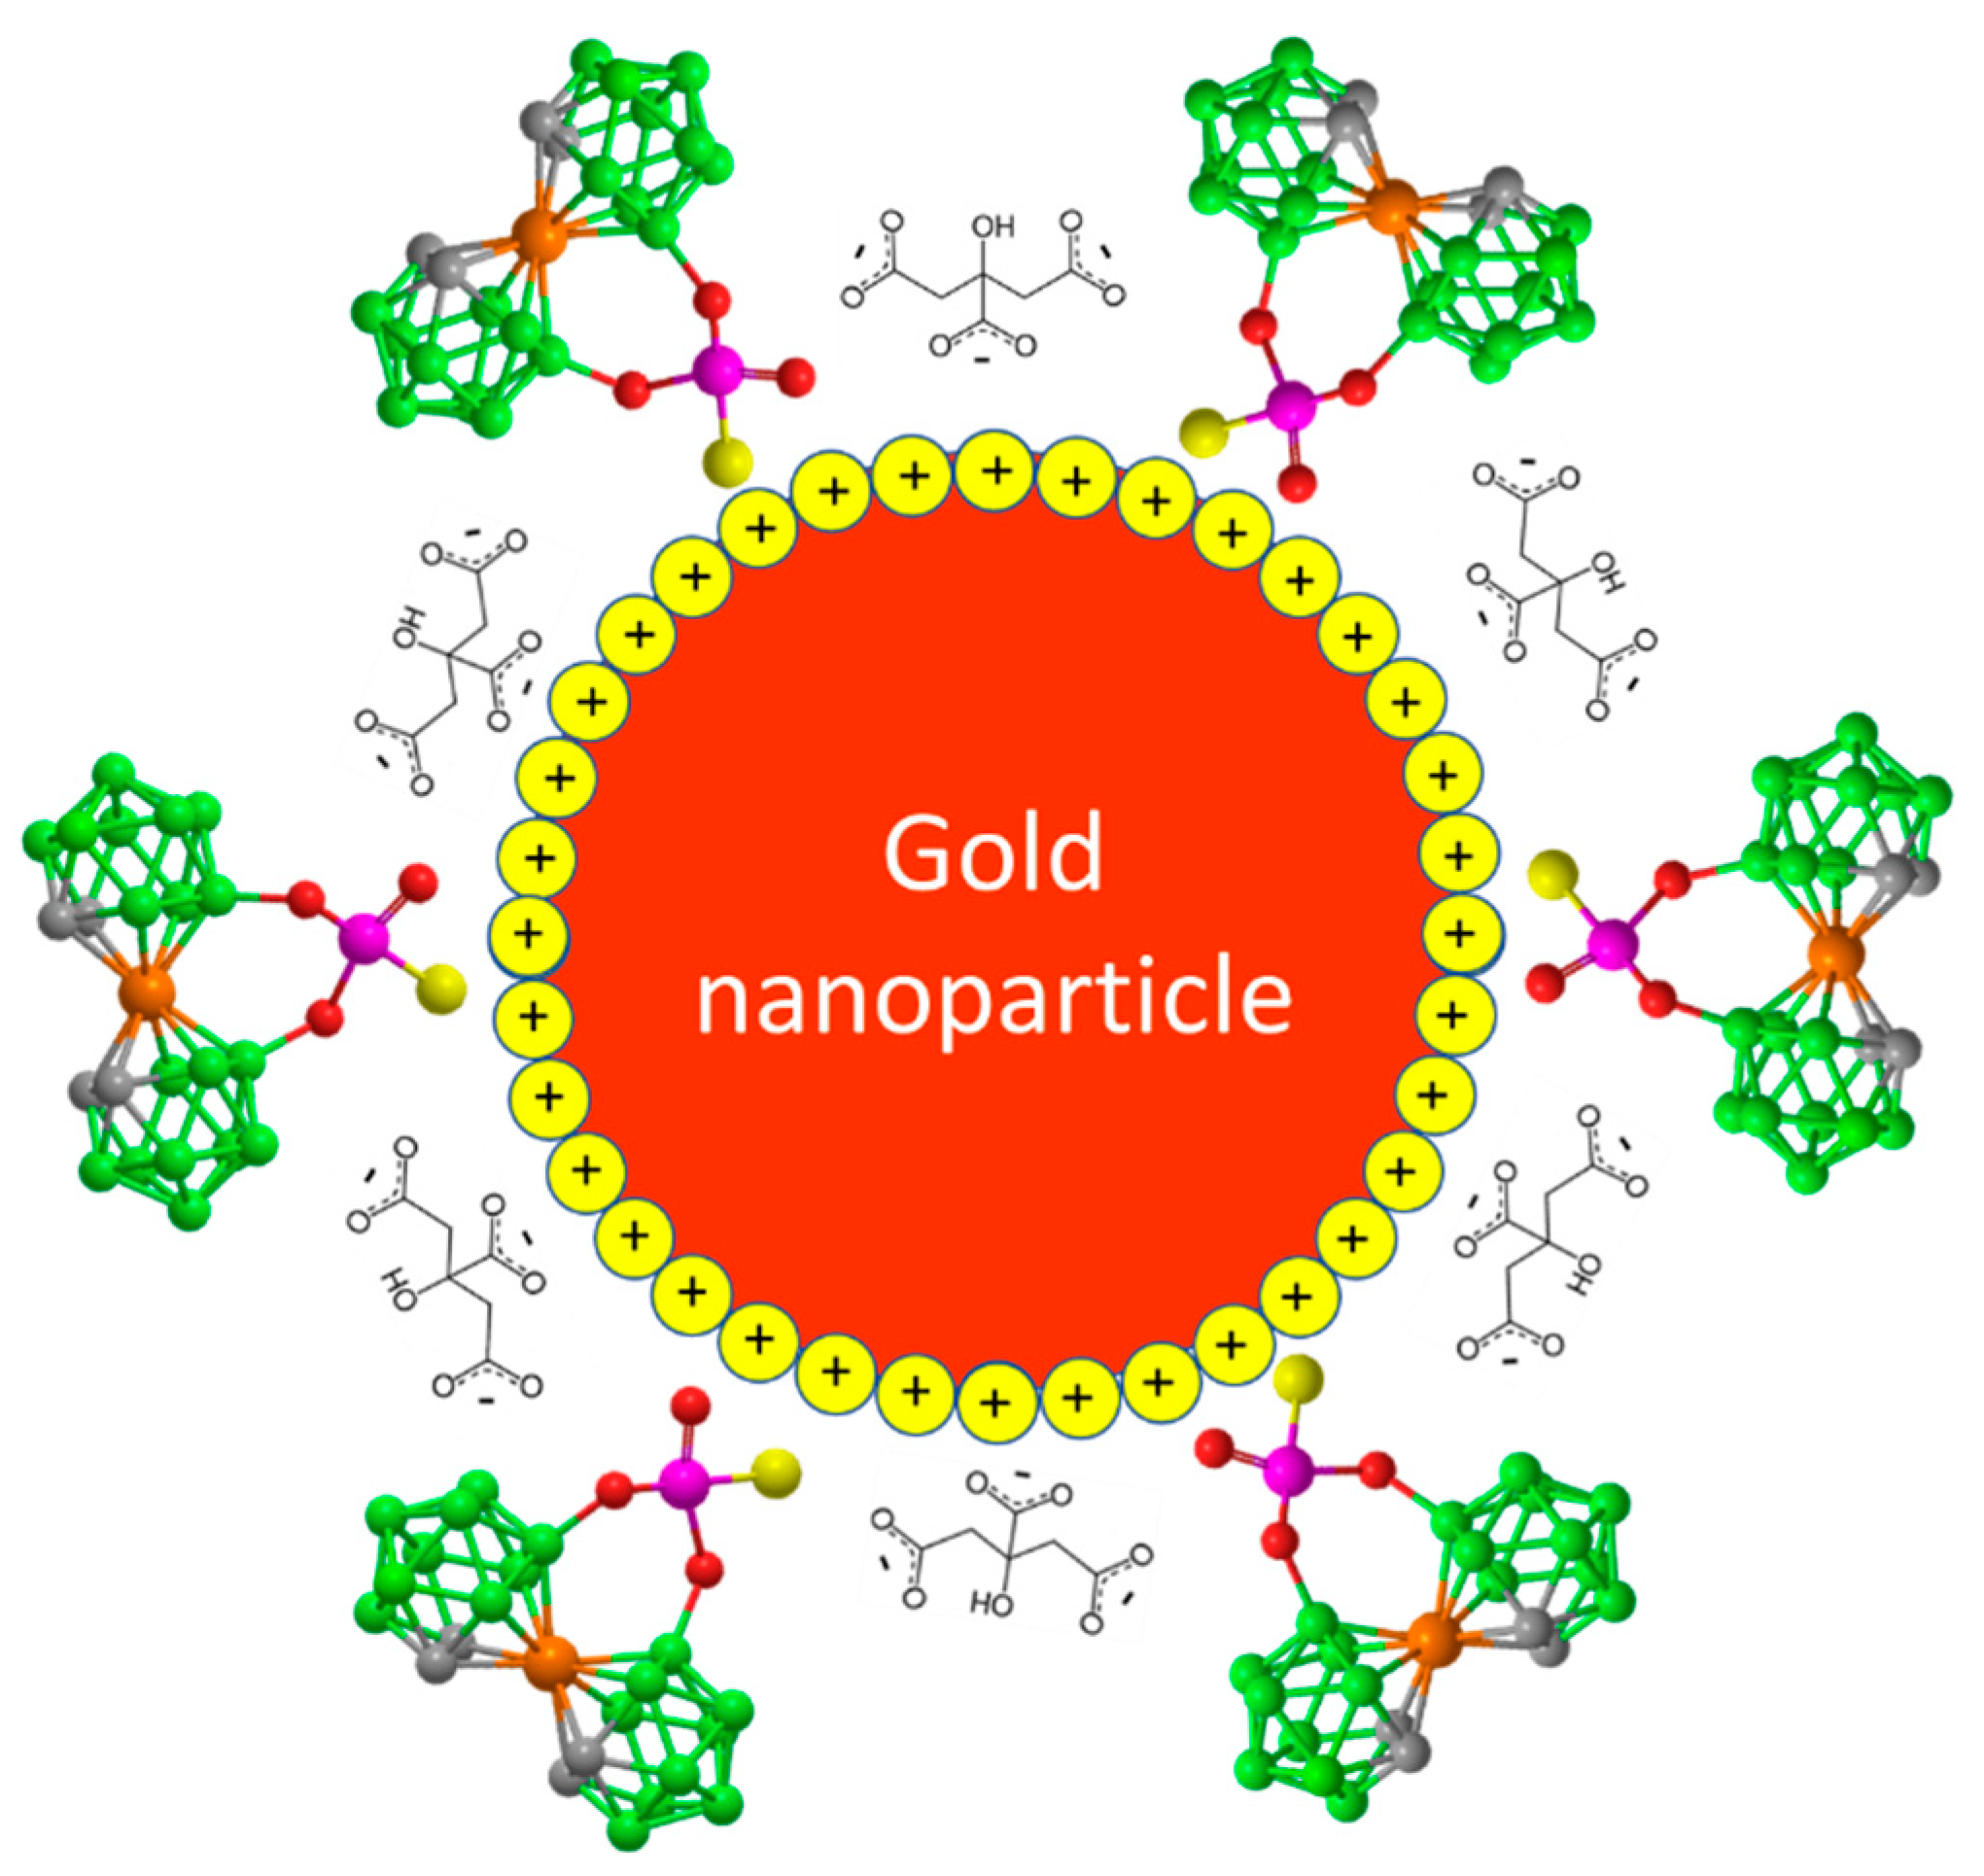
Figure 2.
Optical properties of AuNPs treated with compound 1. A) UV-Vis absorption spectra of untreated AuNPs colloid (dashed line) and AuNPs treated with 1 (solid lines) at the same molar concentration of gold (CAu = 2.85 × 10⁻⁴ M) and different concentrations of the functionalizing agent 1: C1 = 0.53 × 10⁻⁵ M, 0.0031 mg/mL (1); 1.07 × 10⁻⁵ M, 0.0063 mg/mL (2); 1.60 × 10⁻⁵ M (3), 0.0094 mg/mL; 2.13 × 10⁻⁵ M, 0.0125 mg/mL (4). The spectra of 1 at concentrations used are shown for comparison. B) The effect of concentration of 1 on the intensity of the LSPR band maximum, and C) the halfwidth (HW) of the LSPR band.
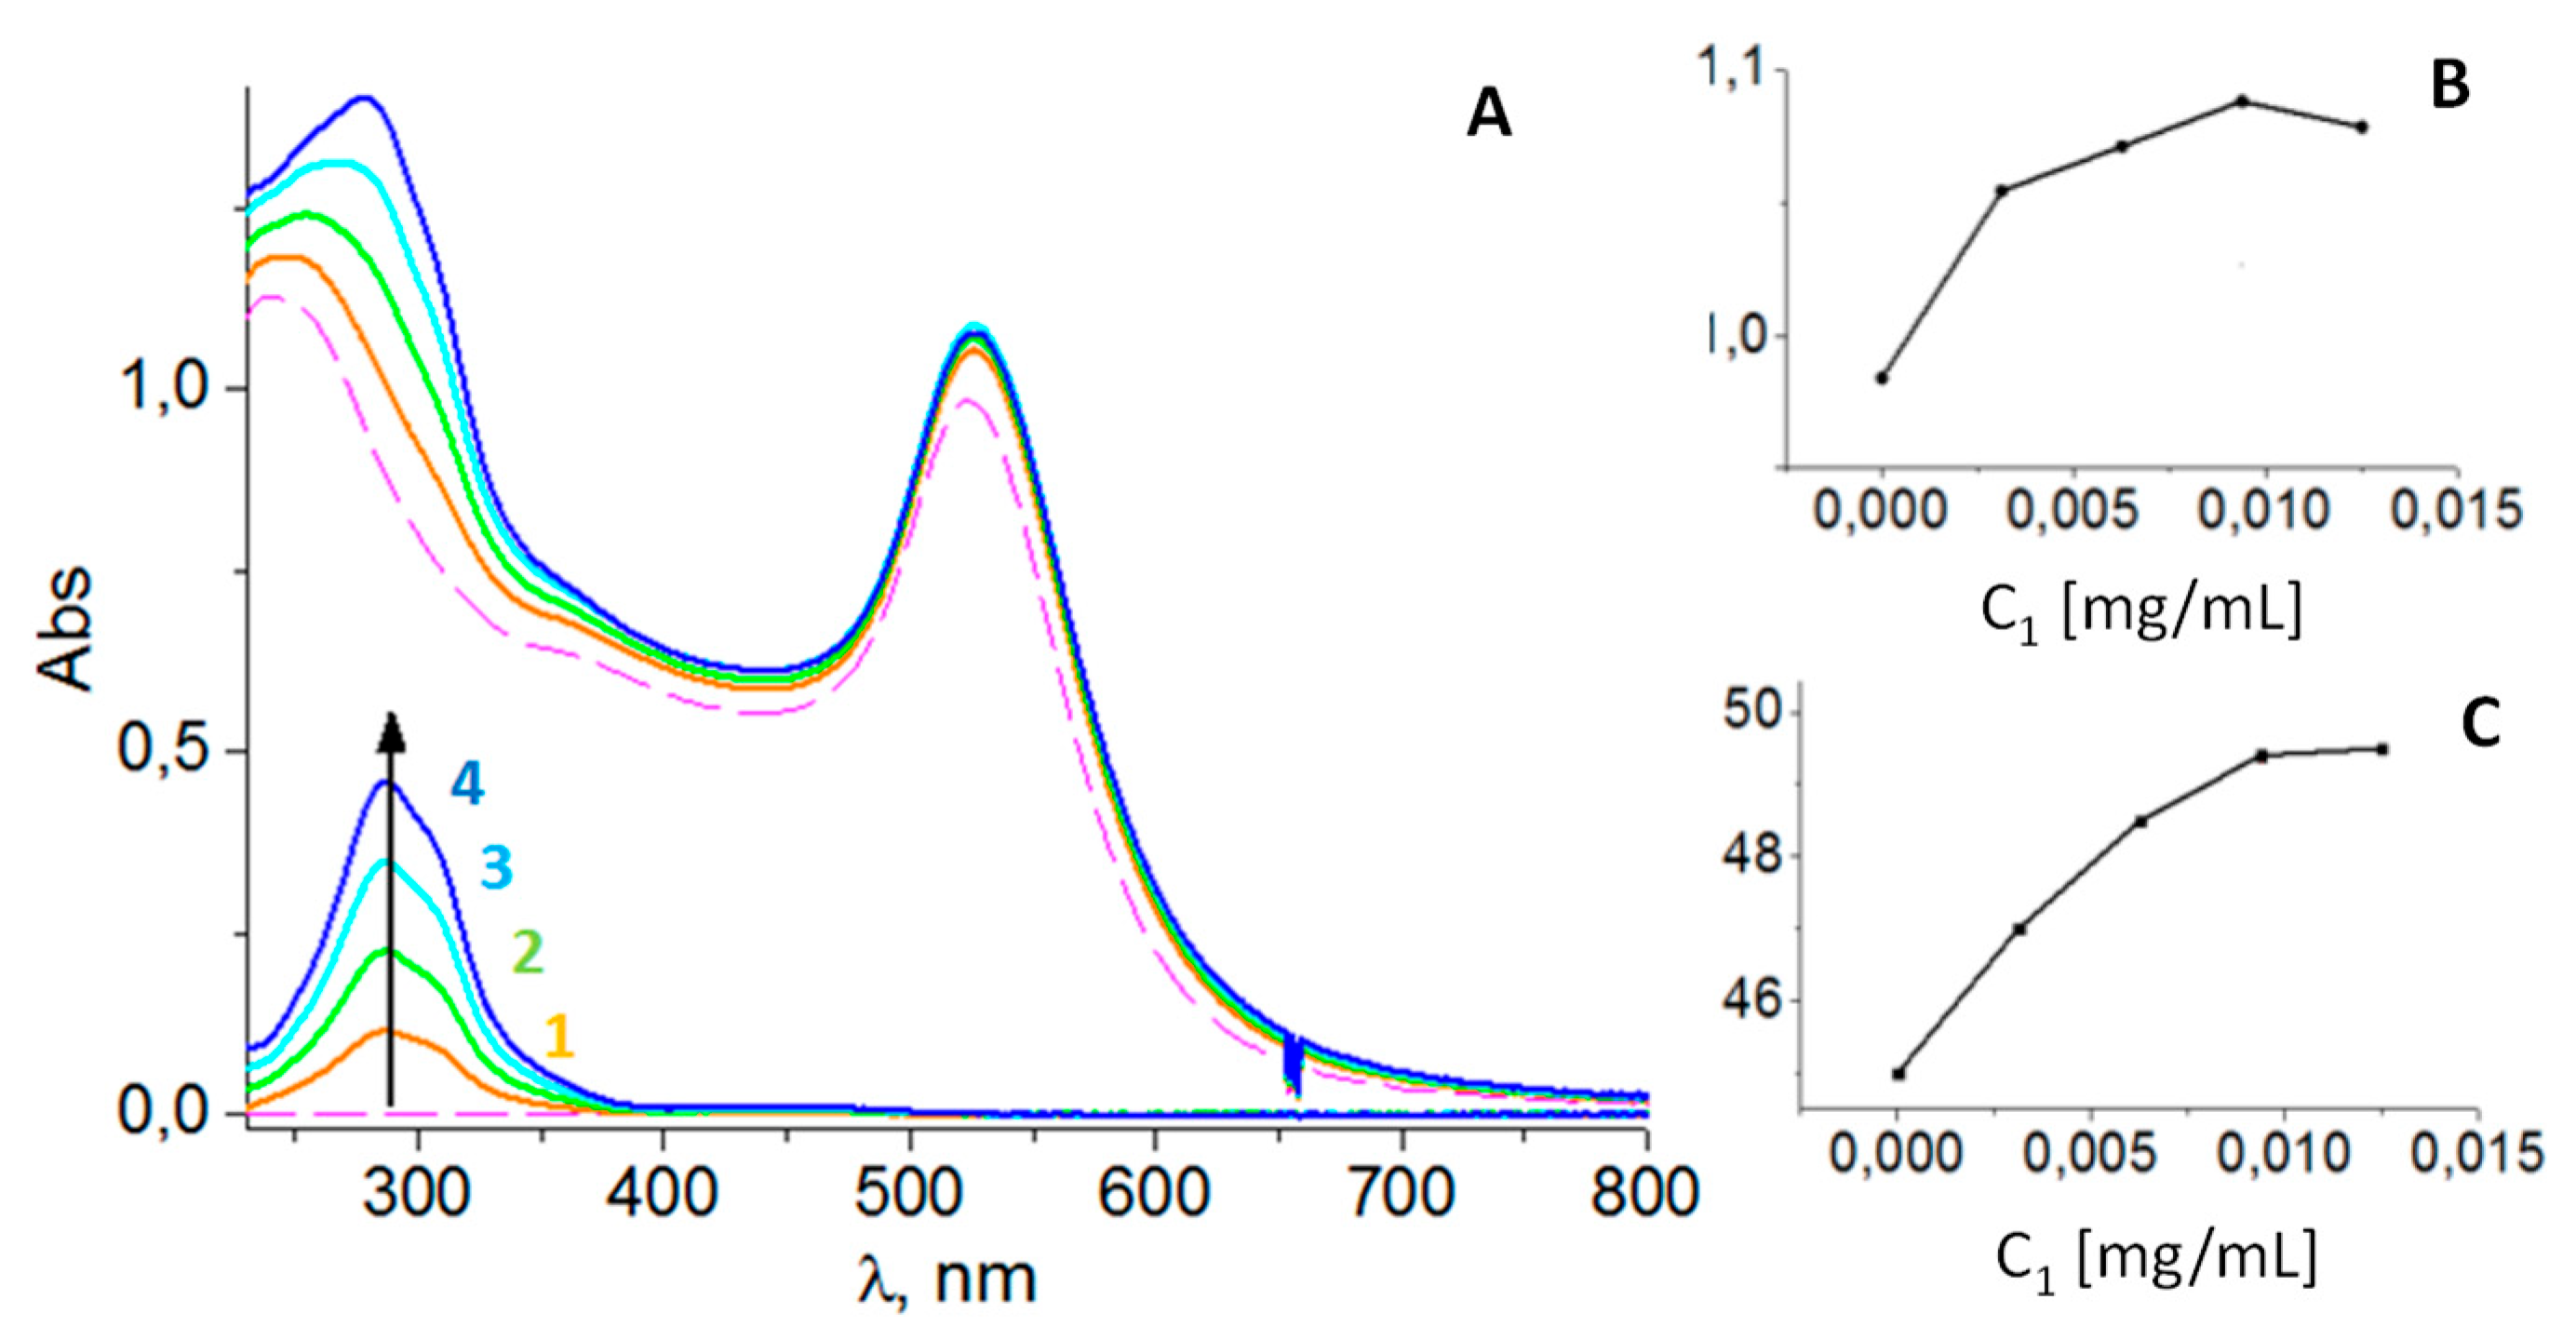
Figure 3.
Averaged zeta potential values of untreated AuNPs (red), CAu = 2.85 × 10⁻⁴ M, and treated AuNPs with 1 (blue), CAu = 2.85 × 10⁻⁴ M, C1 = 2.13 × 10⁻⁵ M, for original colloids (light red and light blue bars) and centrifuged, resuspendent systems (dark red and dark blue bars).
Figure 3.
Averaged zeta potential values of untreated AuNPs (red), CAu = 2.85 × 10⁻⁴ M, and treated AuNPs with 1 (blue), CAu = 2.85 × 10⁻⁴ M, C1 = 2.13 × 10⁻⁵ M, for original colloids (light red and light blue bars) and centrifuged, resuspendent systems (dark red and dark blue bars).
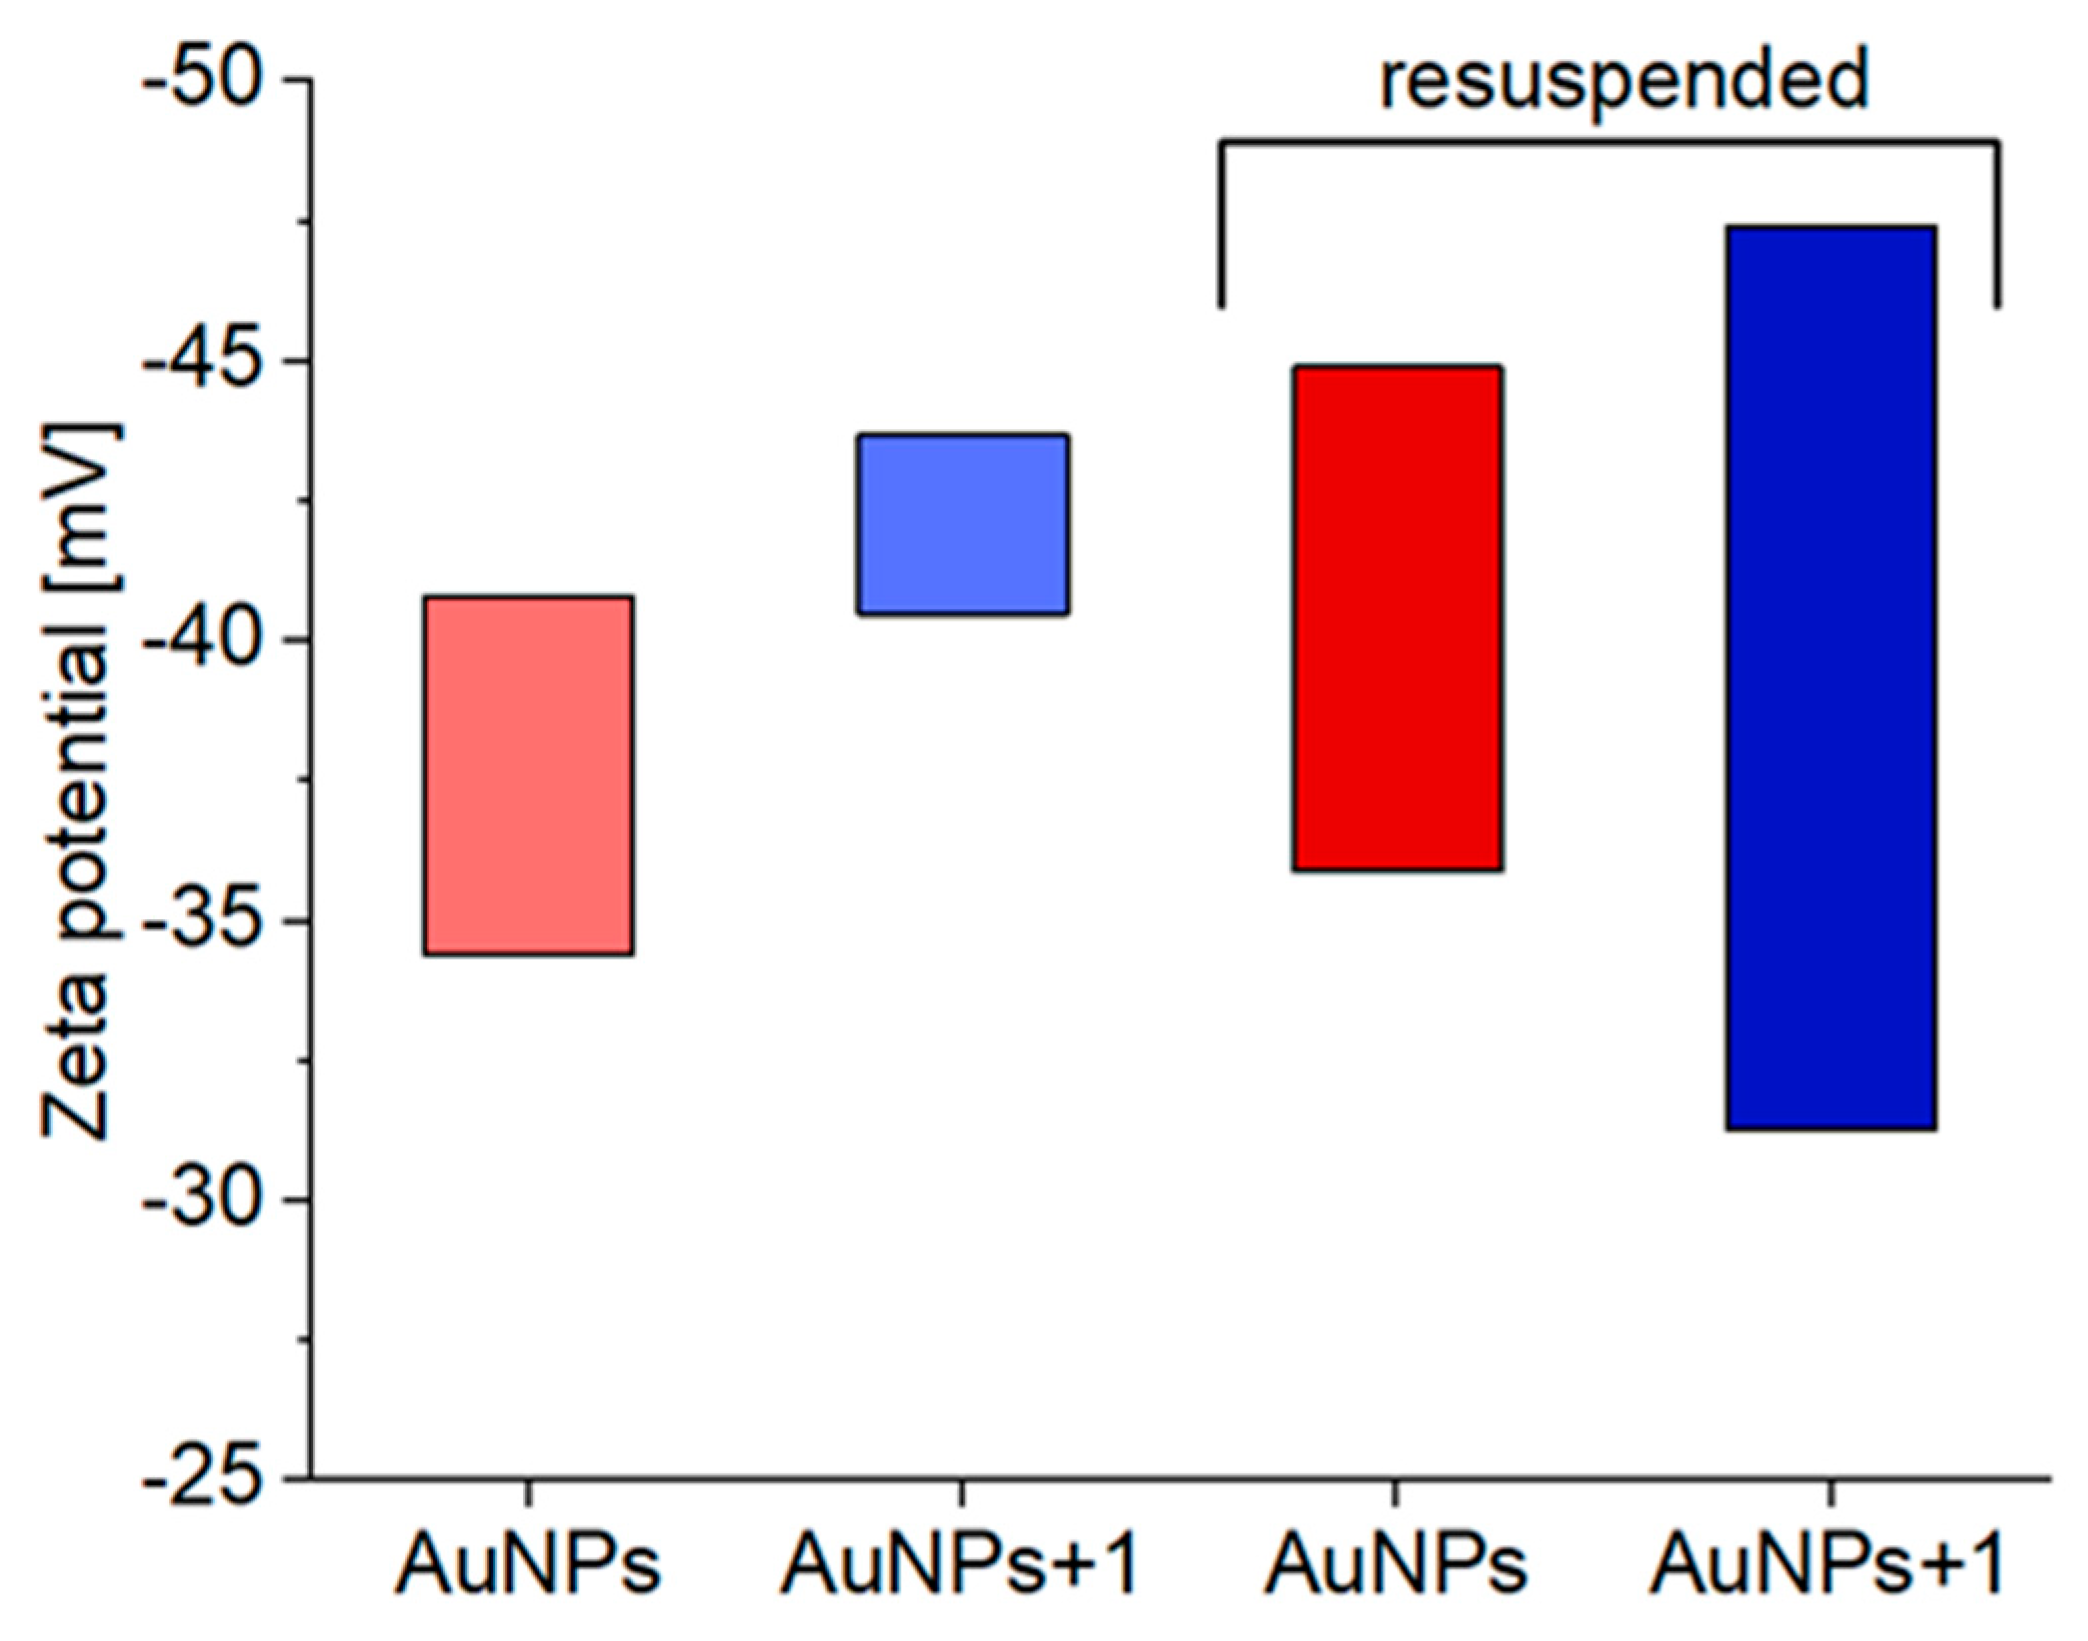
Figure 4.
The distribution of nanoparticles by size according to DLS data in untreated AuNPs colloid at CAu = 2.85 x 10⁻⁴ M (red) and the same AuNPs colloid treated with 1 at C1 = 2.13 x 10⁻⁵ M (blue) represented by number basis (percentage of particles by quantity) (A) and by intensity basis (percentage of particles by scattered light) (B, C). Solid lines indicate the size distribution of nanoparticles in colloids in statu nascendi, before centrifugation, and dashed lines indicate centrifuged and resuspended systems.
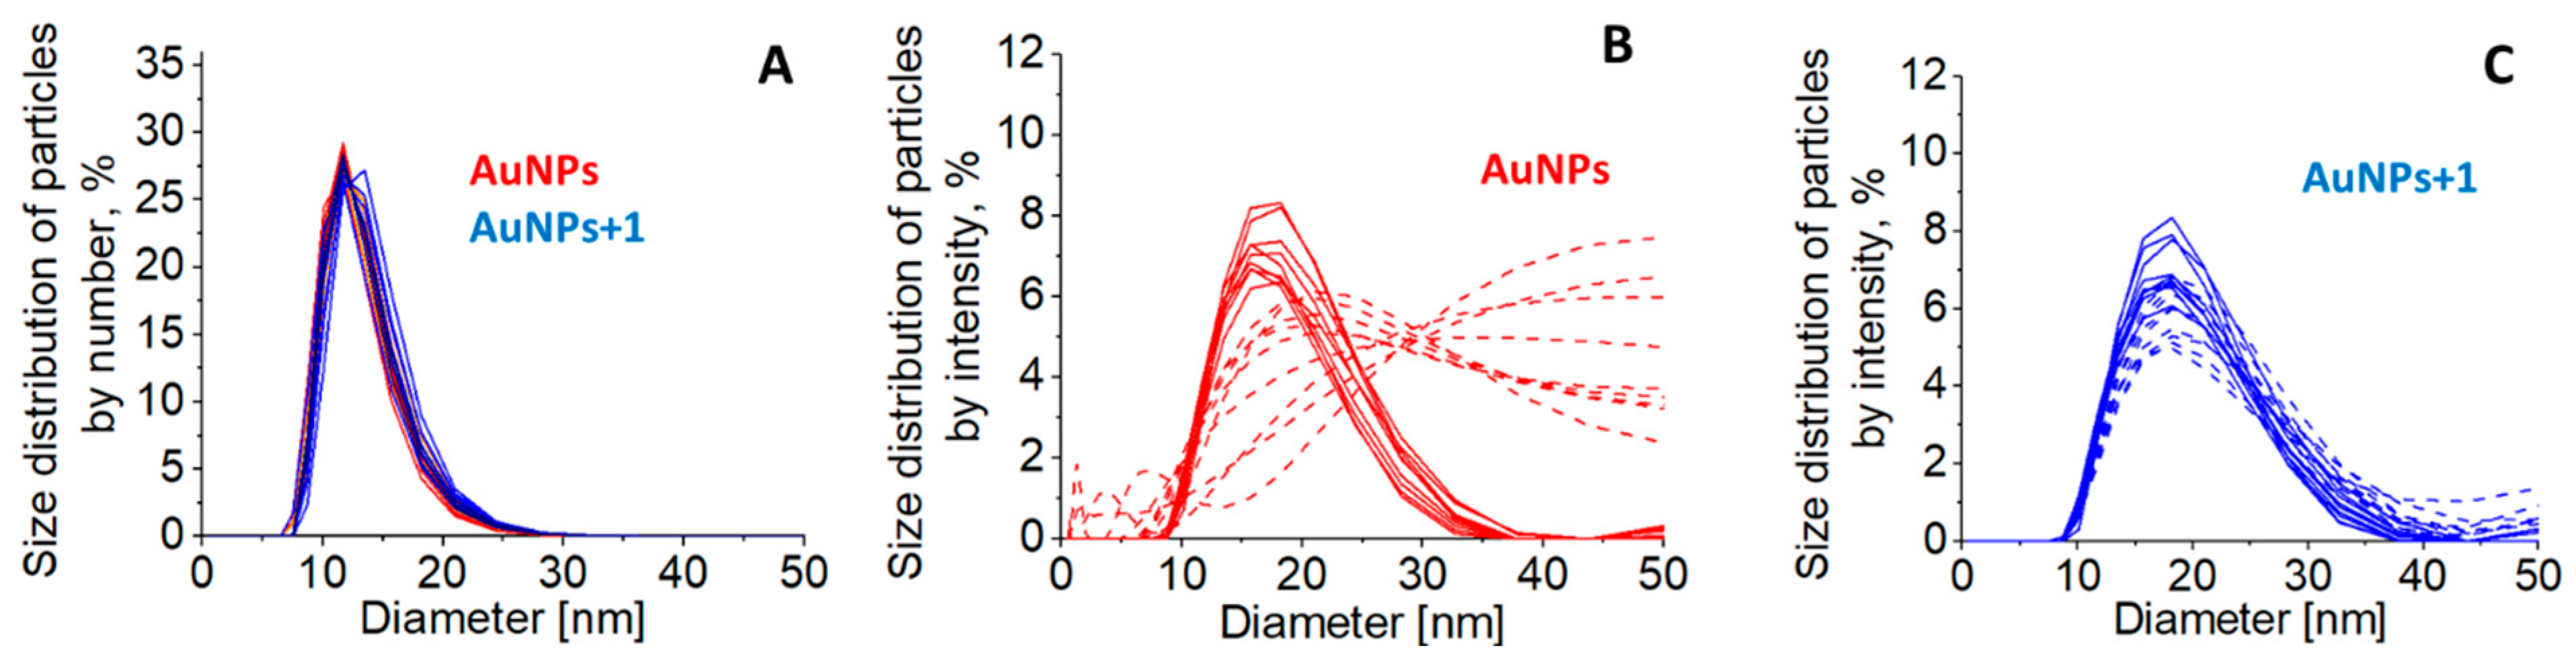
Figure 5.
Two shape projections of compound 1 were adopted for the calculation of AuNPs surface coverage by compound 1: A) circular projection and B) an elliptical projection.
Figure 5.
Two shape projections of compound 1 were adopted for the calculation of AuNPs surface coverage by compound 1: A) circular projection and B) an elliptical projection.
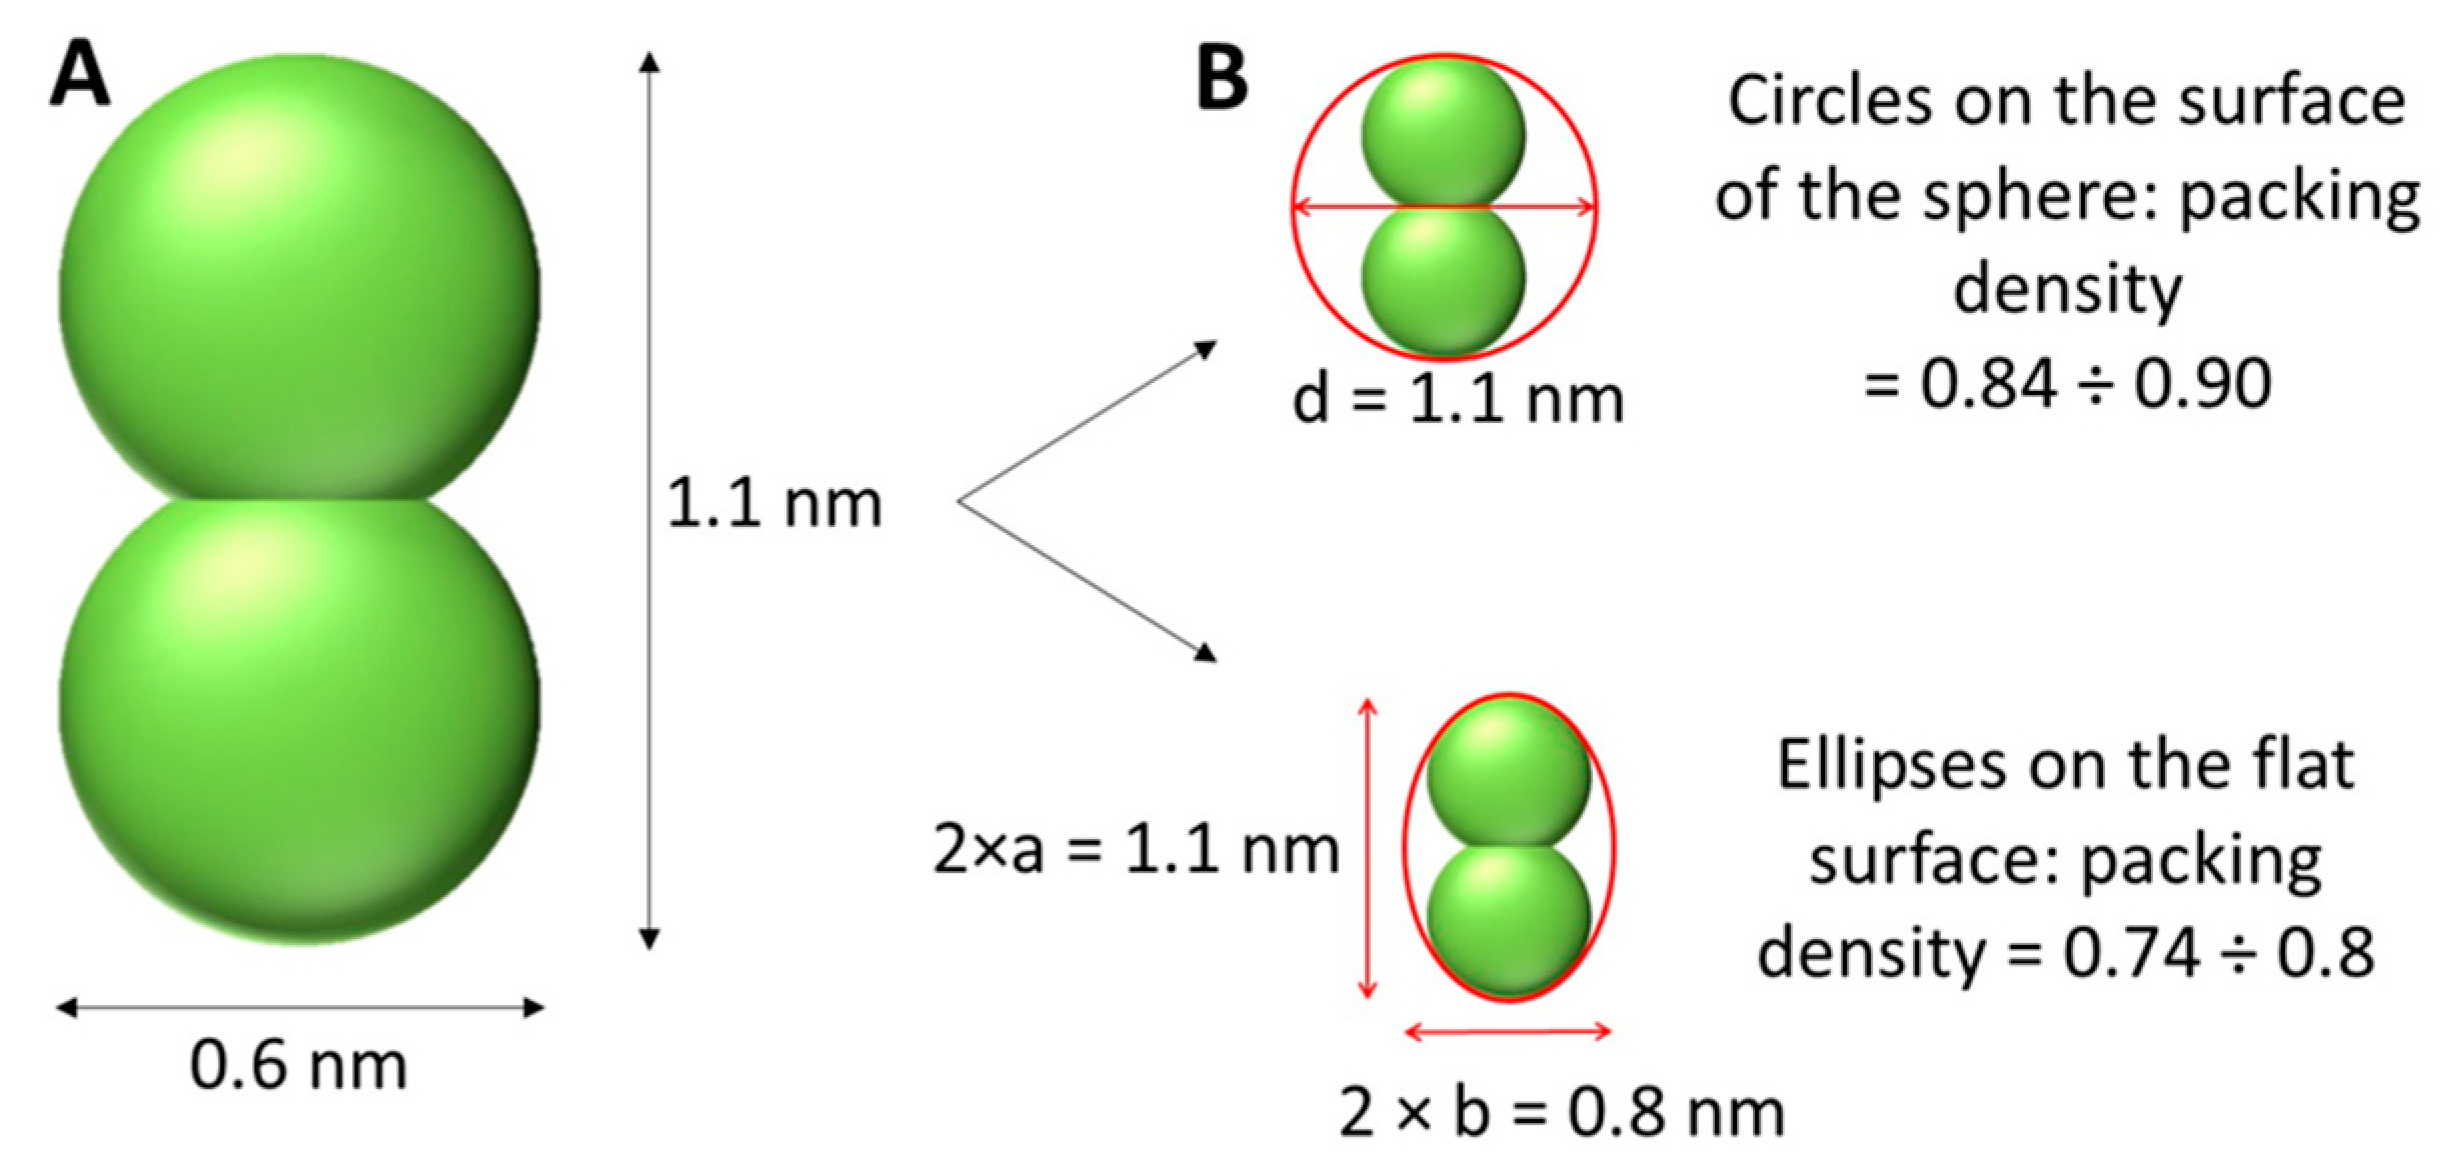
Figure 6.
ESI-mass spectra of analite derived from functionalized AuNPs with 1 recorded in negative mode. The inset shows the characteristic isotopic distribution within the molecular ion of 1.
Figure 6.
ESI-mass spectra of analite derived from functionalized AuNPs with 1 recorded in negative mode. The inset shows the characteristic isotopic distribution within the molecular ion of 1.
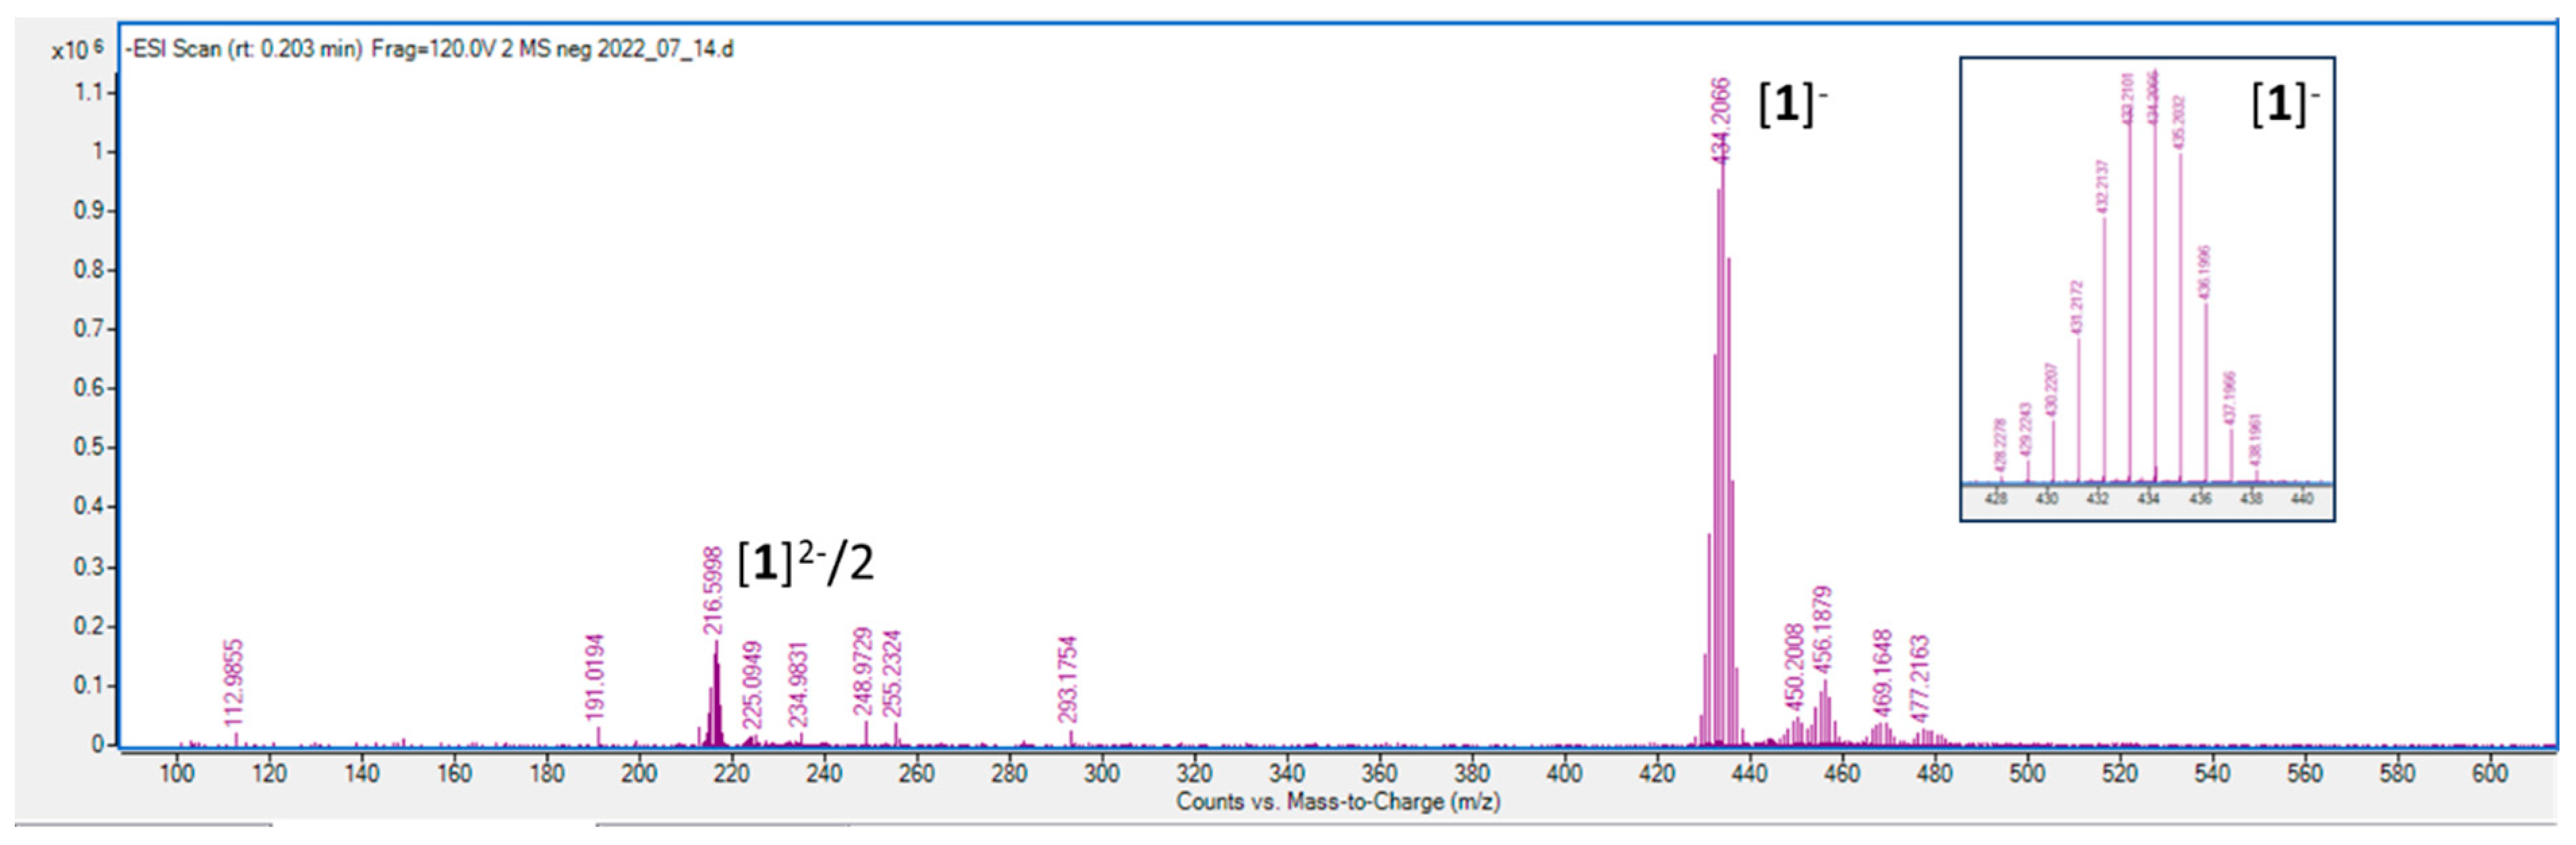
Figure 7.
Fluorescence properties of AuNPs/BSA systems: (A) A typical dependence of BSA fluorescence intensity (F) on nanoparticles concentration (expressed as molar Au concentration, CAu), and (B) double-logarithmic plots of BSA fluorescence spectra after the addition of untreated AuNPs (red) and AuNPs treated with compound 1 (blue). The concentrations of Au and BSA were, respectively, CAu = 3.00 x 10⁻⁵, 6.00 x 10⁻⁵, 9.00 x 10⁻⁵, 1.20 x 10⁻⁴, 1.50 x 10⁻⁴ M, and BSA concentrationCBSA = 0.01 mg/mL. Fluorescence intensity was measured at emission wavelength λem = 347 nm and excitation at λex = 270 nm and expressed in relative units.
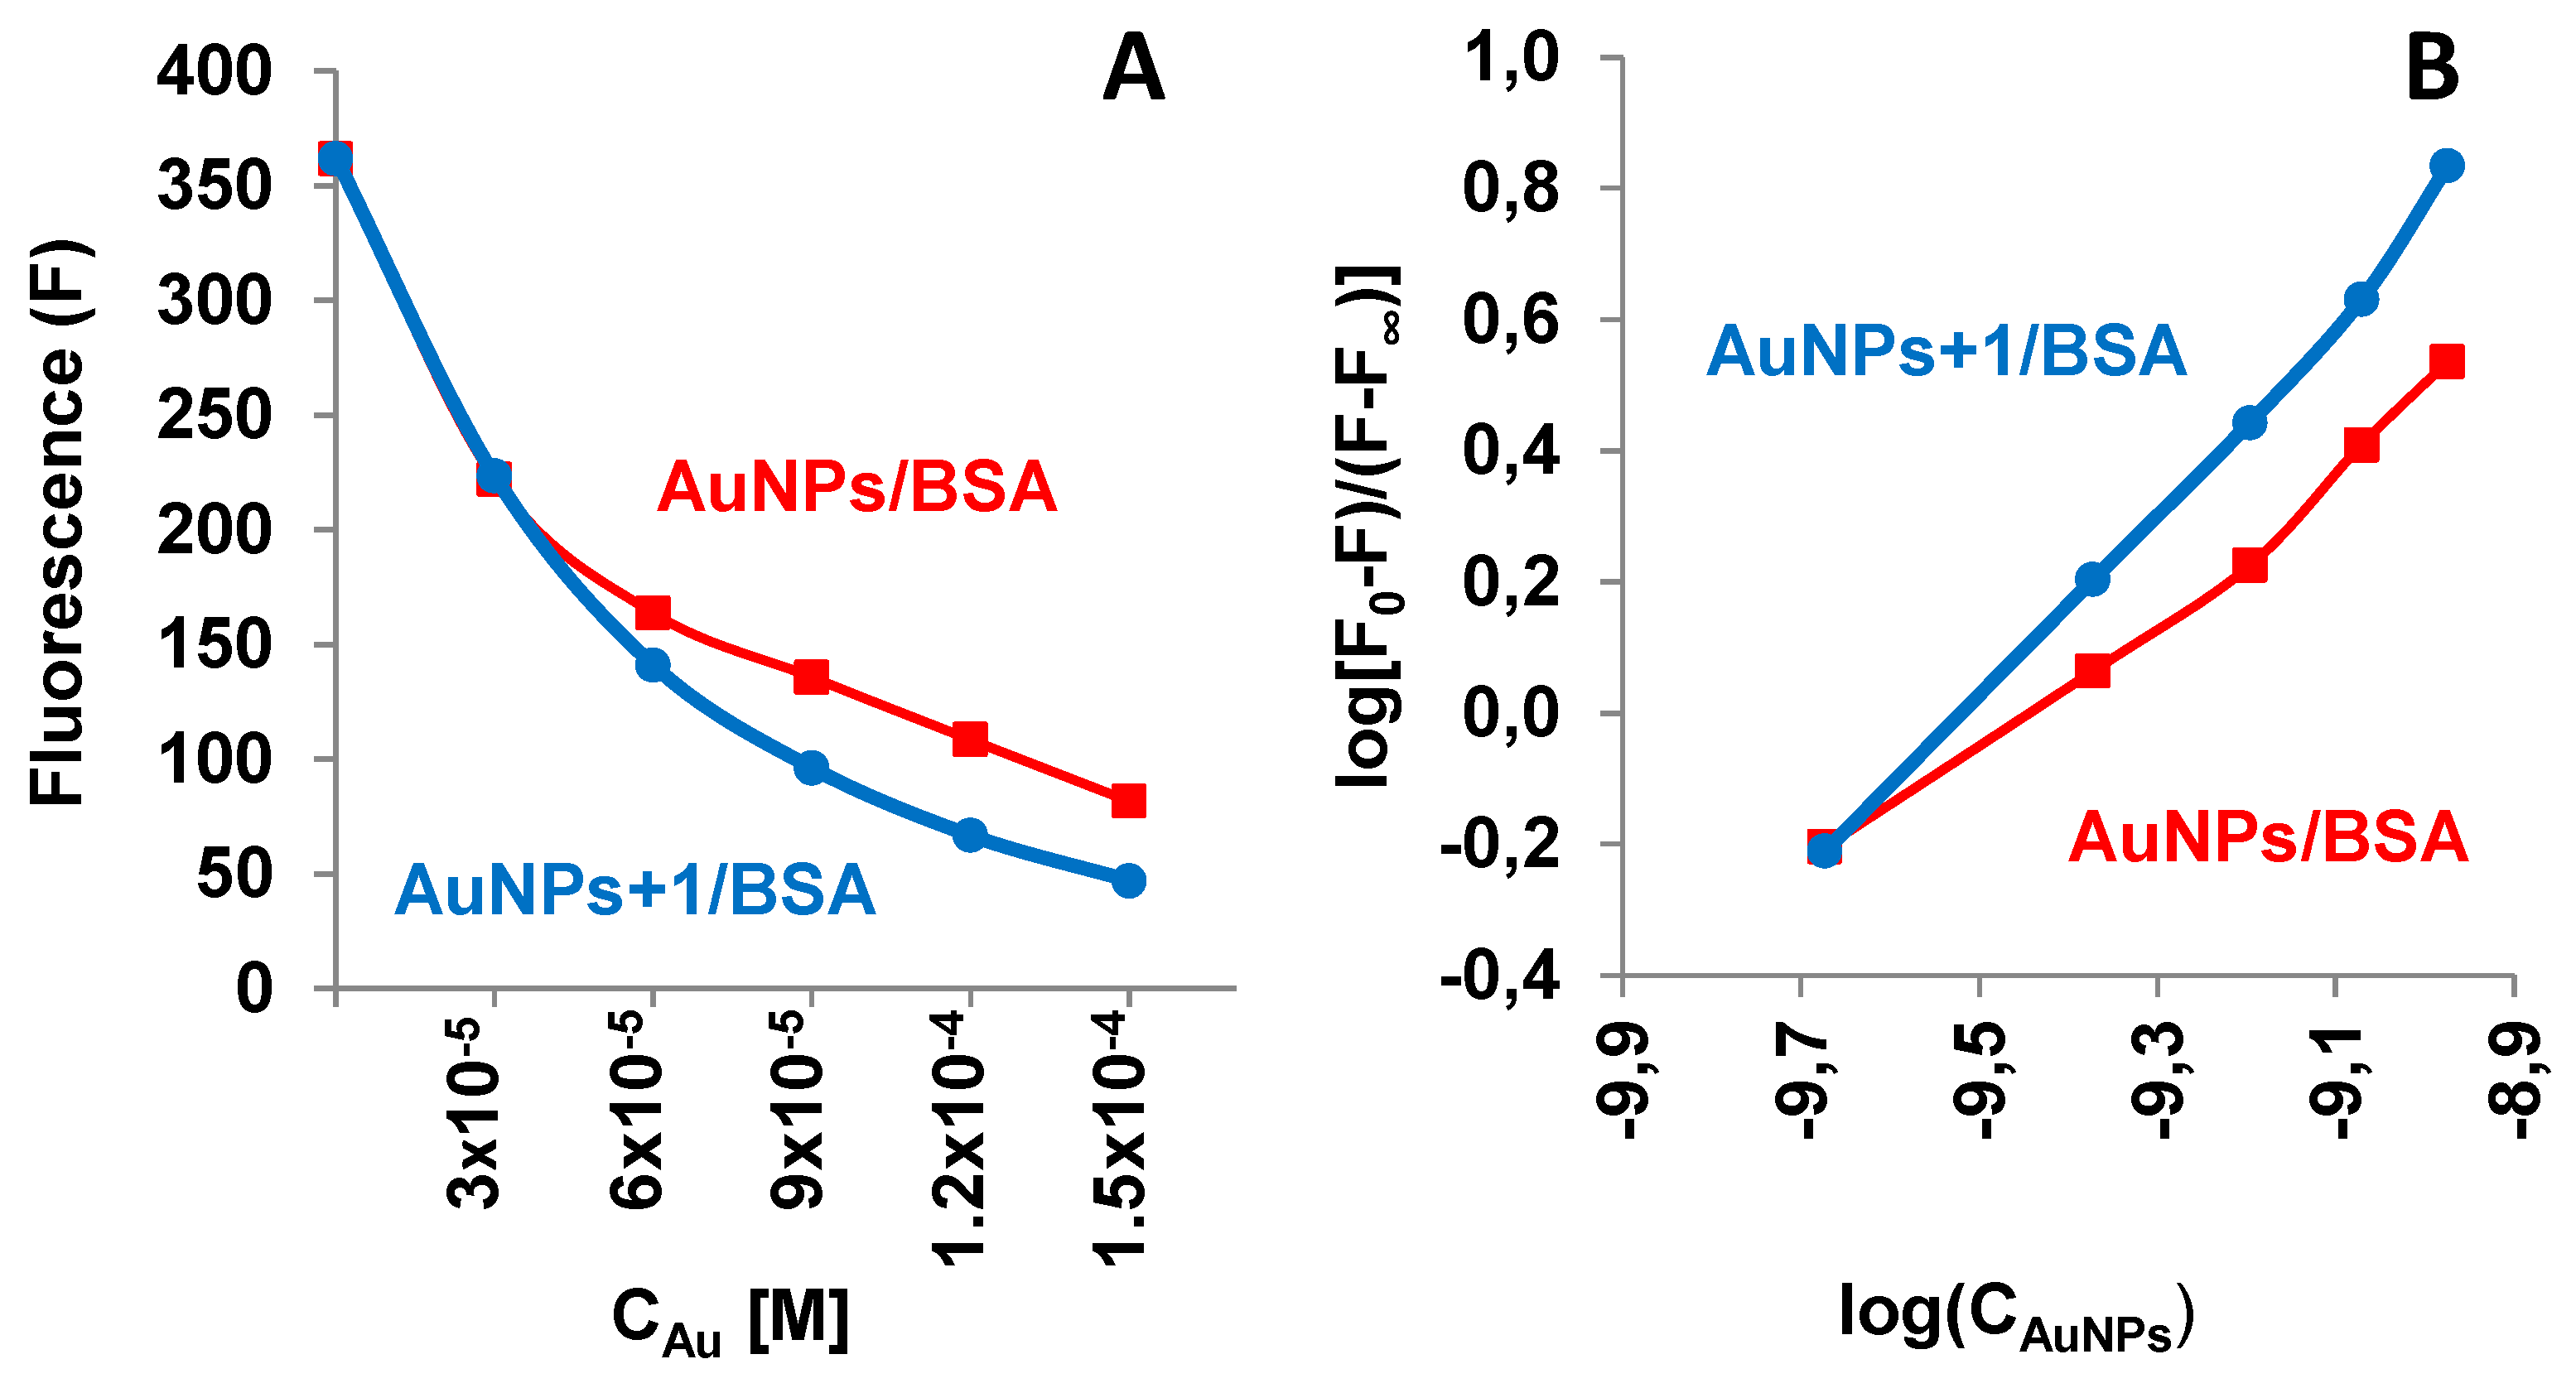
Figure 9.
Antiviral activities of gold nanoparticles: Vero cells infected with HSV-1 MOI = 0.001 (A) or MOI = 0.002 (B) treated with AuNPs; cells infected with HSV-1 MOI = 0.001 (C) or MOI = 0.002 (D) treated with AuNPs +1. In the pre-treatment assay, Vero cell monolayers were infected with HSV-1 pre-treated with gold nanoparticles, then the cell culture was additionally treated with nanoparticles at different times. In the post-treatment assay, the cells were infected with HSV-1 and then treated with gold particles. Two gold nanoparticle concentrations, 5.9 µg/mL and 0.295 µg/mL, as well as two multiplicity of infection (MOI) were used. Blue: cell control, used as a reference; orange: virus control, cells infected with virus; green: results of experiments using the 5.9 μg/ml NPs solution; violet: results of experiments using the 0.295 μg/ml NPs solution. Numbers above the bar are equal to the mean value of the cell concentration compared to the cell control in percent. The cell viability was measured using an MTT assay. The data are shown as means ± SD of three independent experiments.
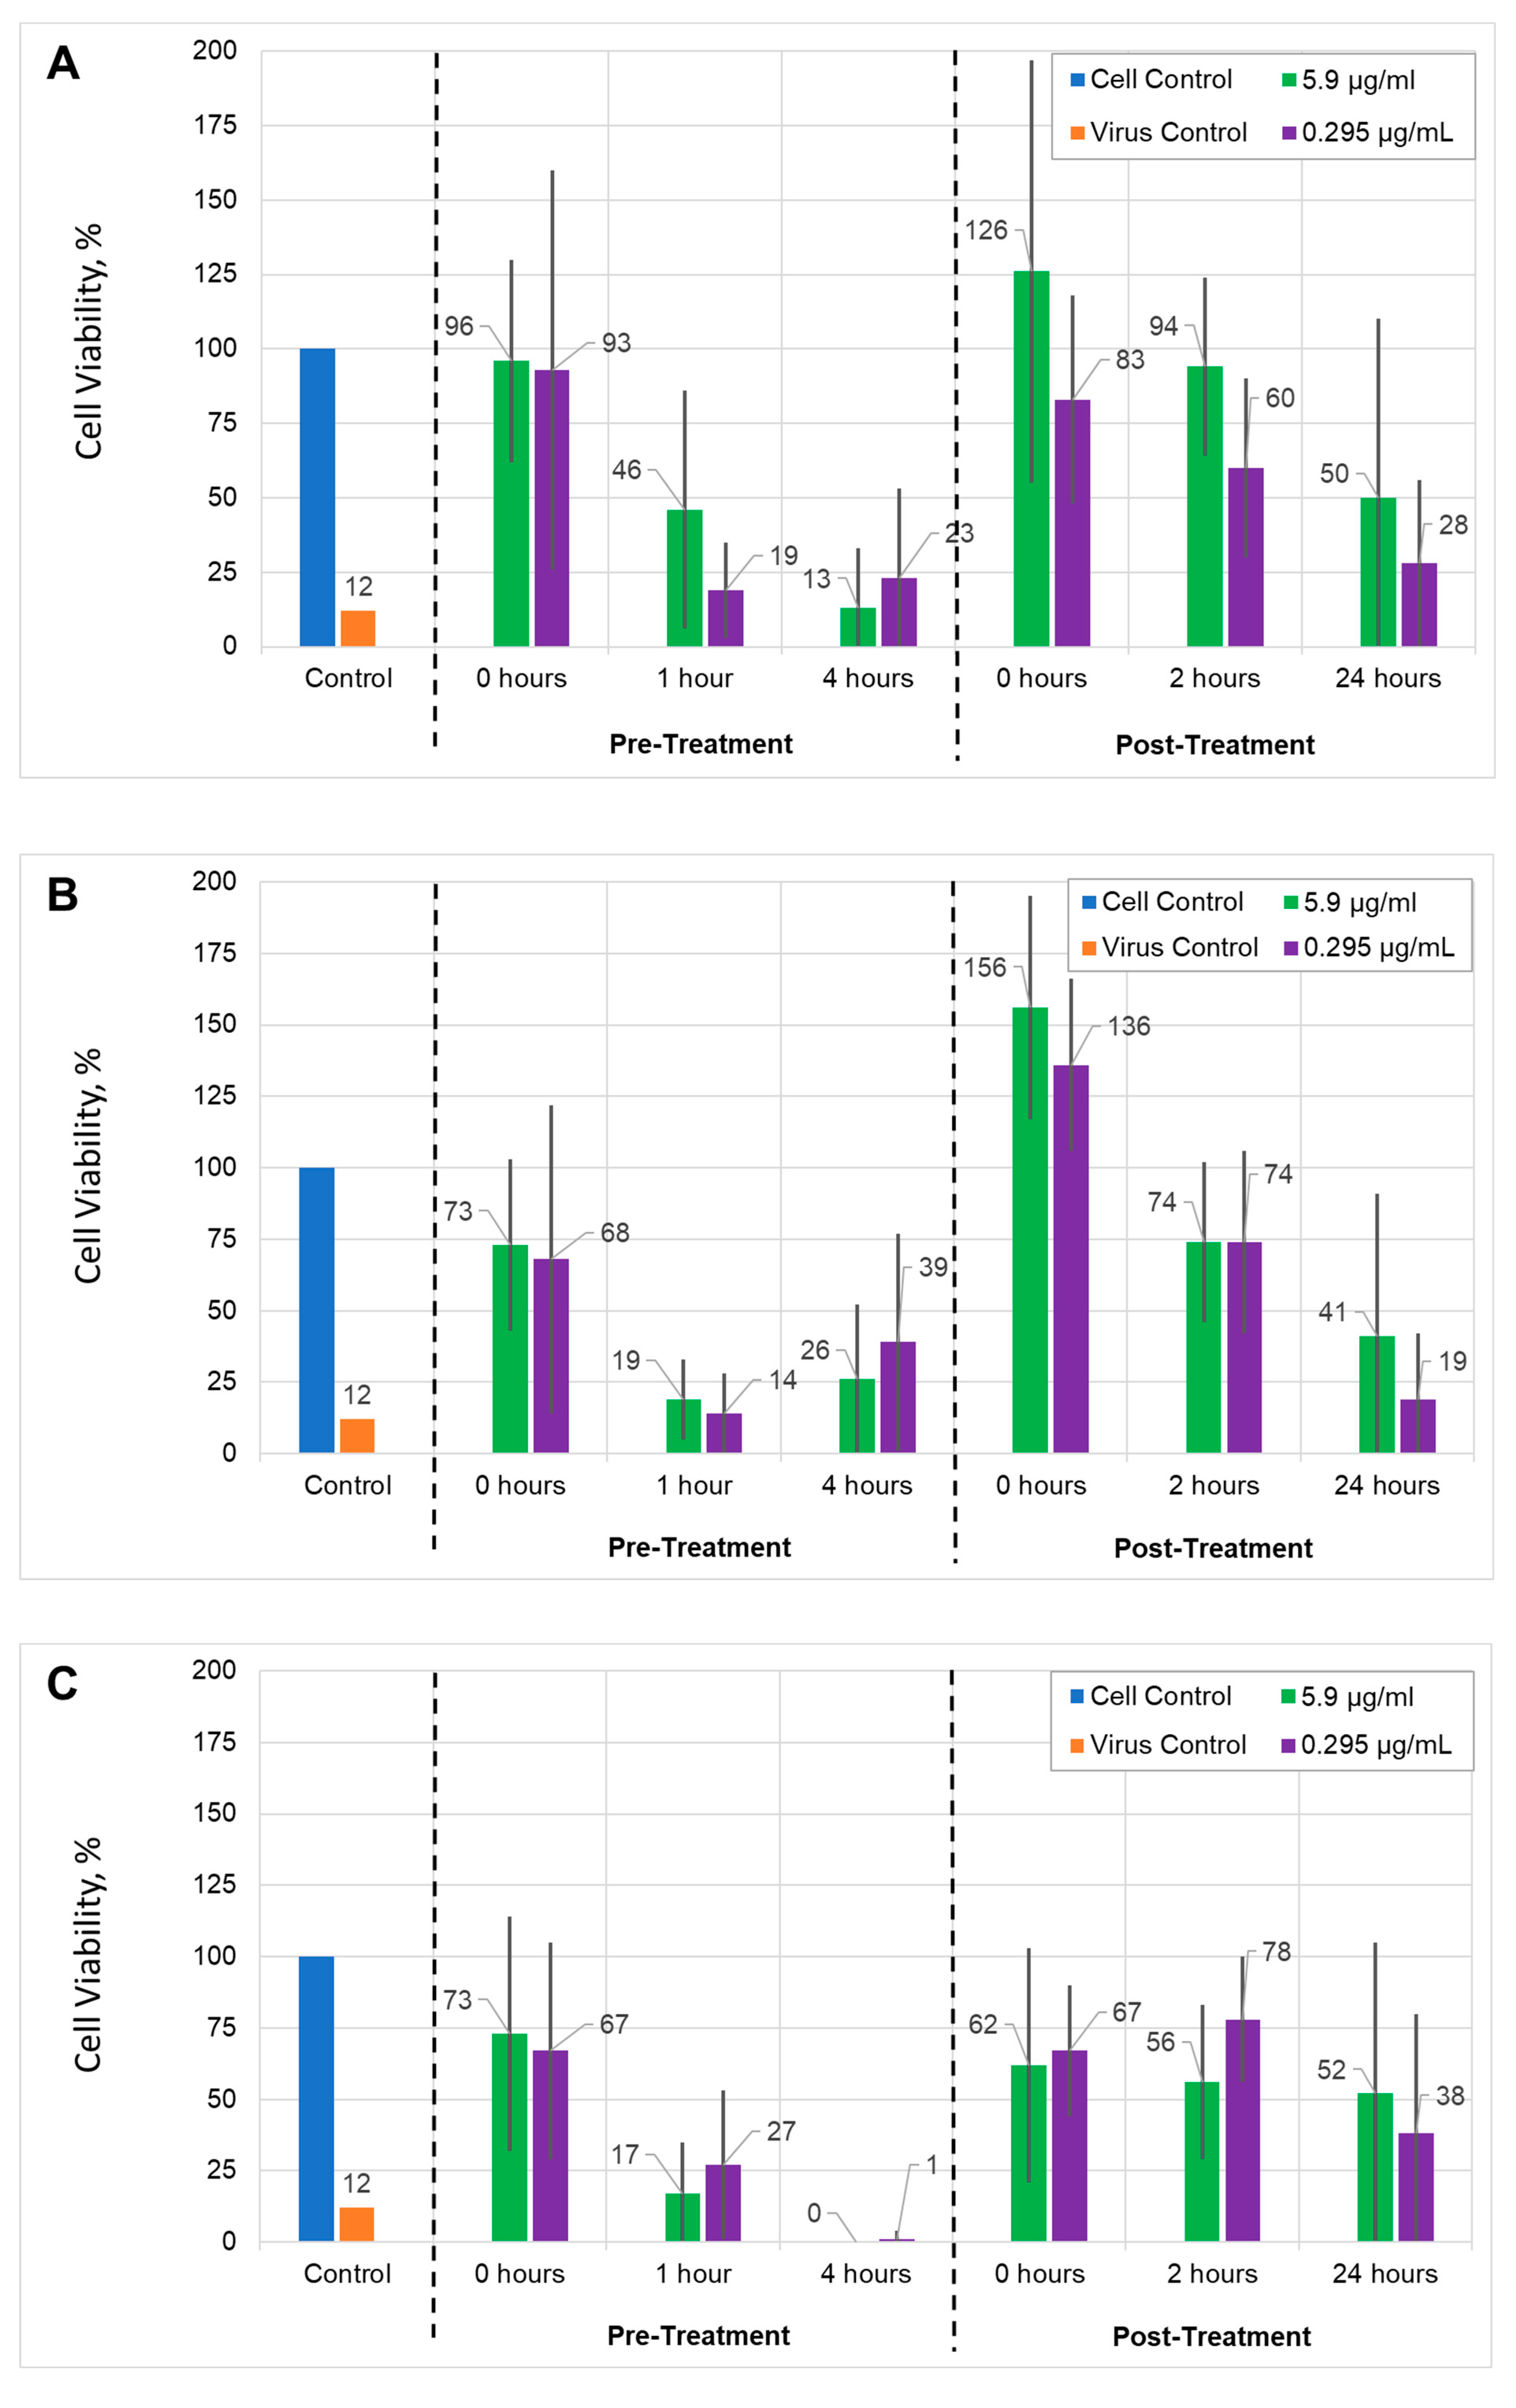
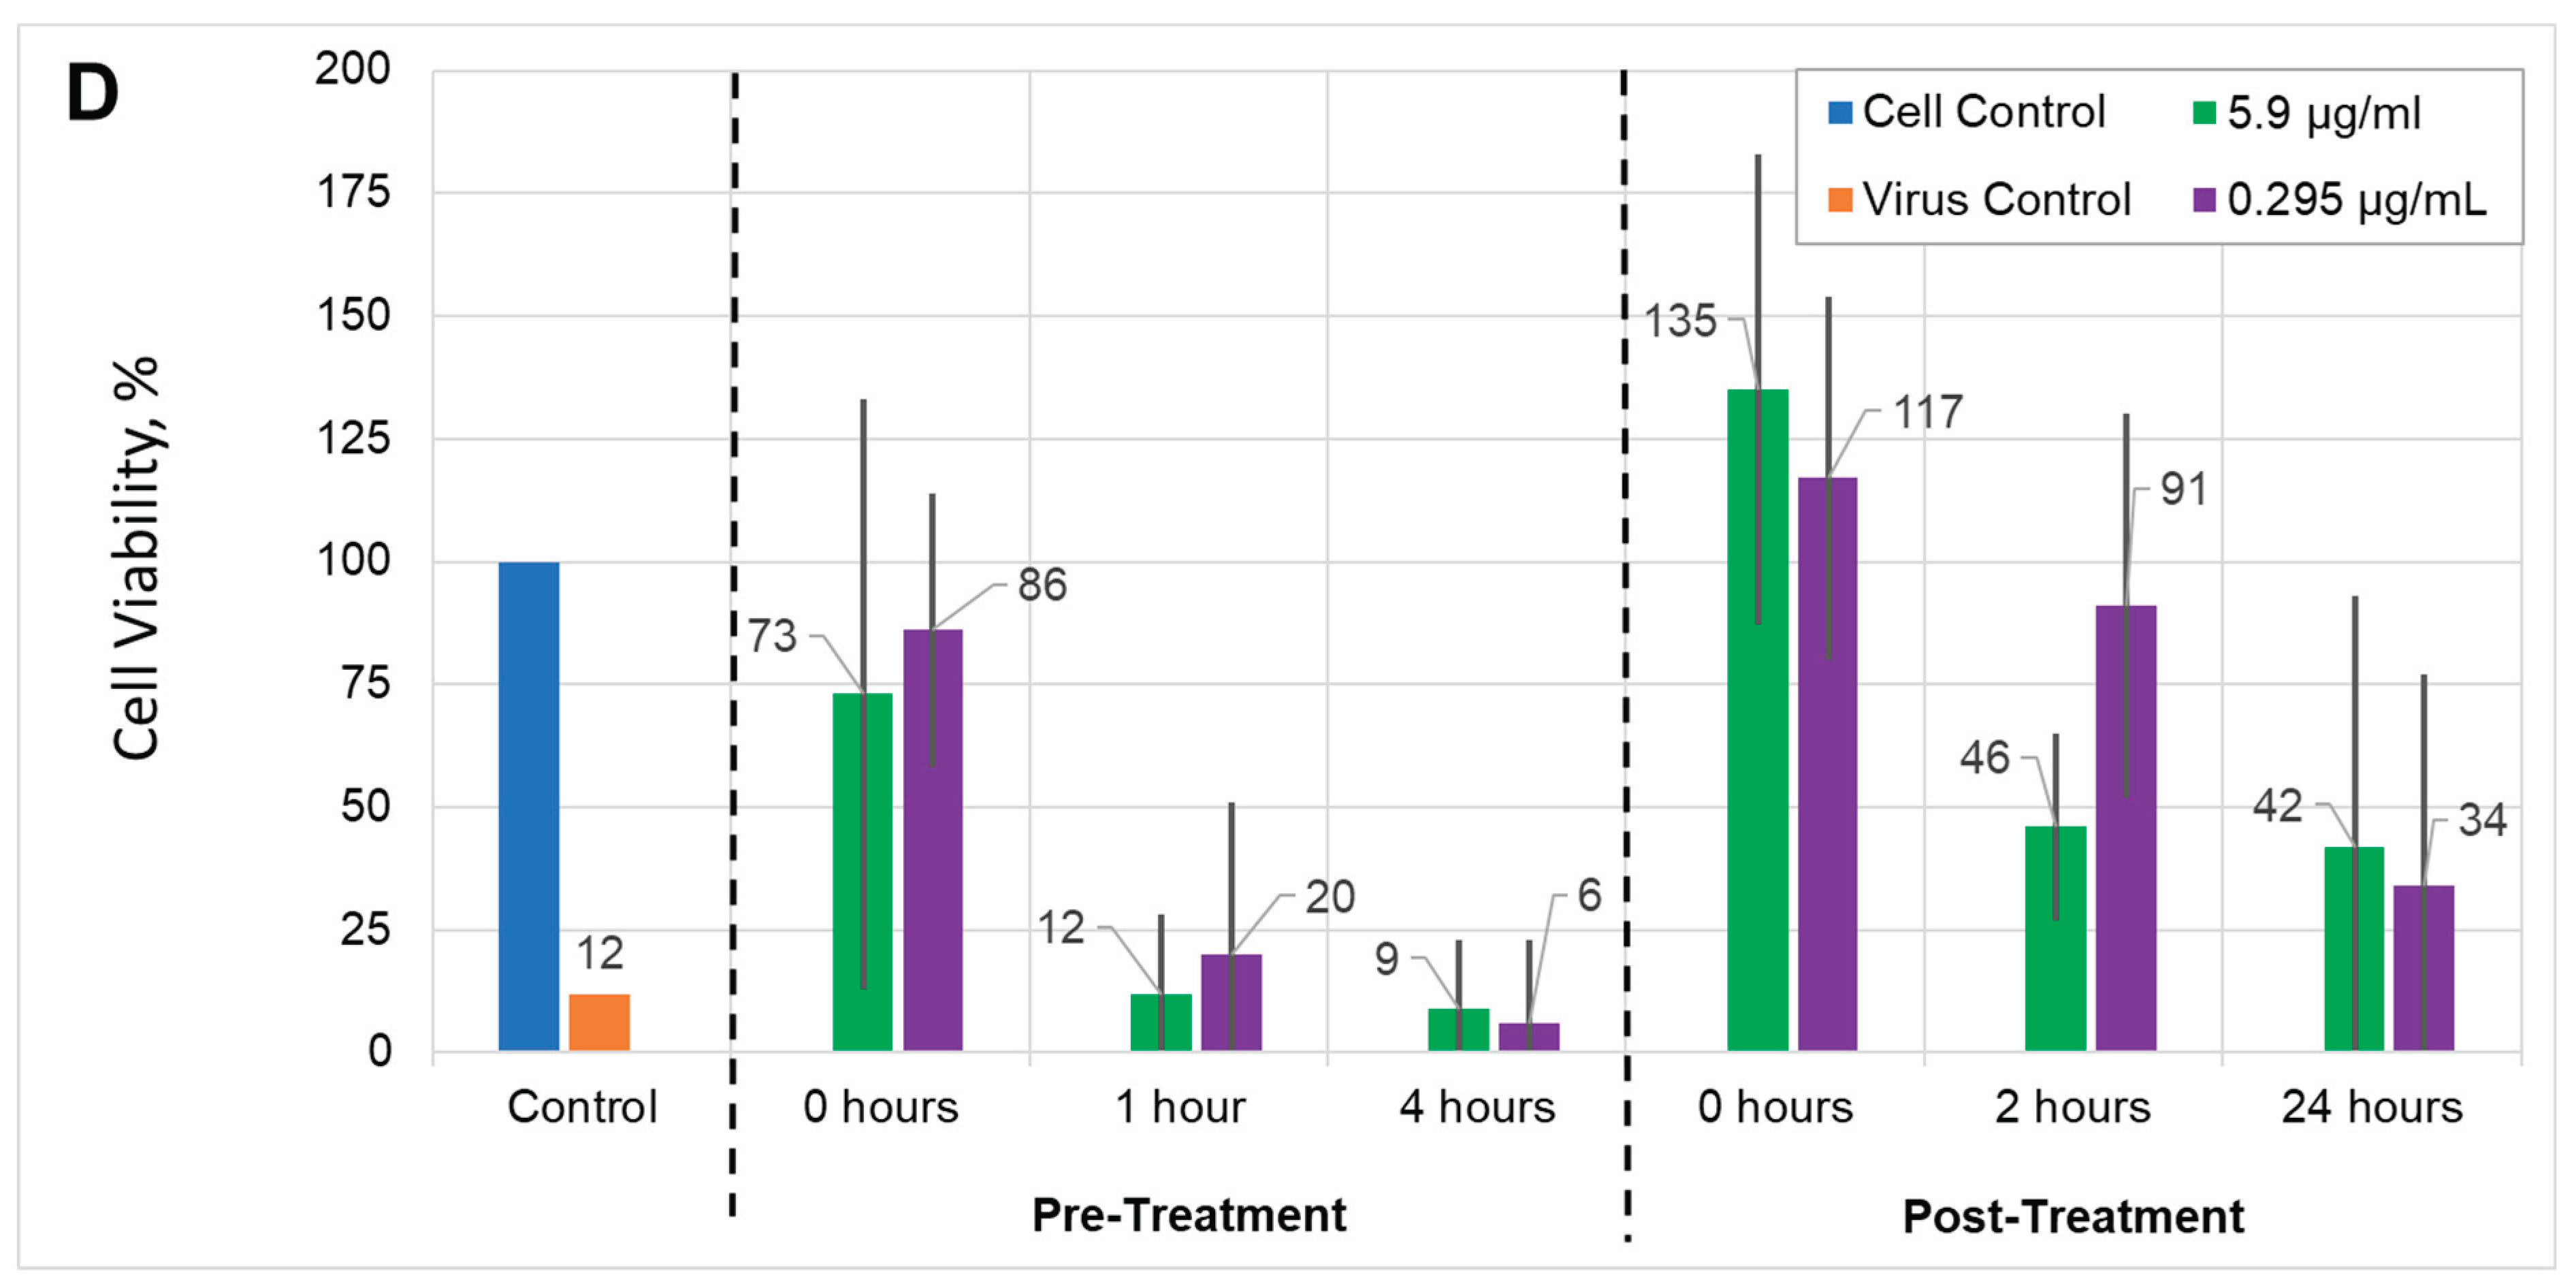

Table 1.
Calculated number of 8,8’-O,O-[cobalt bis(1,2-dicarbollide)]phosphorothioate (1) molecules per one nanoparticle, assuming full coverage of the NP surface by 1 (saturation state).
Table 1.
Calculated number of 8,8’-O,O-[cobalt bis(1,2-dicarbollide)]phosphorothioate (1) molecules per one nanoparticle, assuming full coverage of the NP surface by 1 (saturation state).
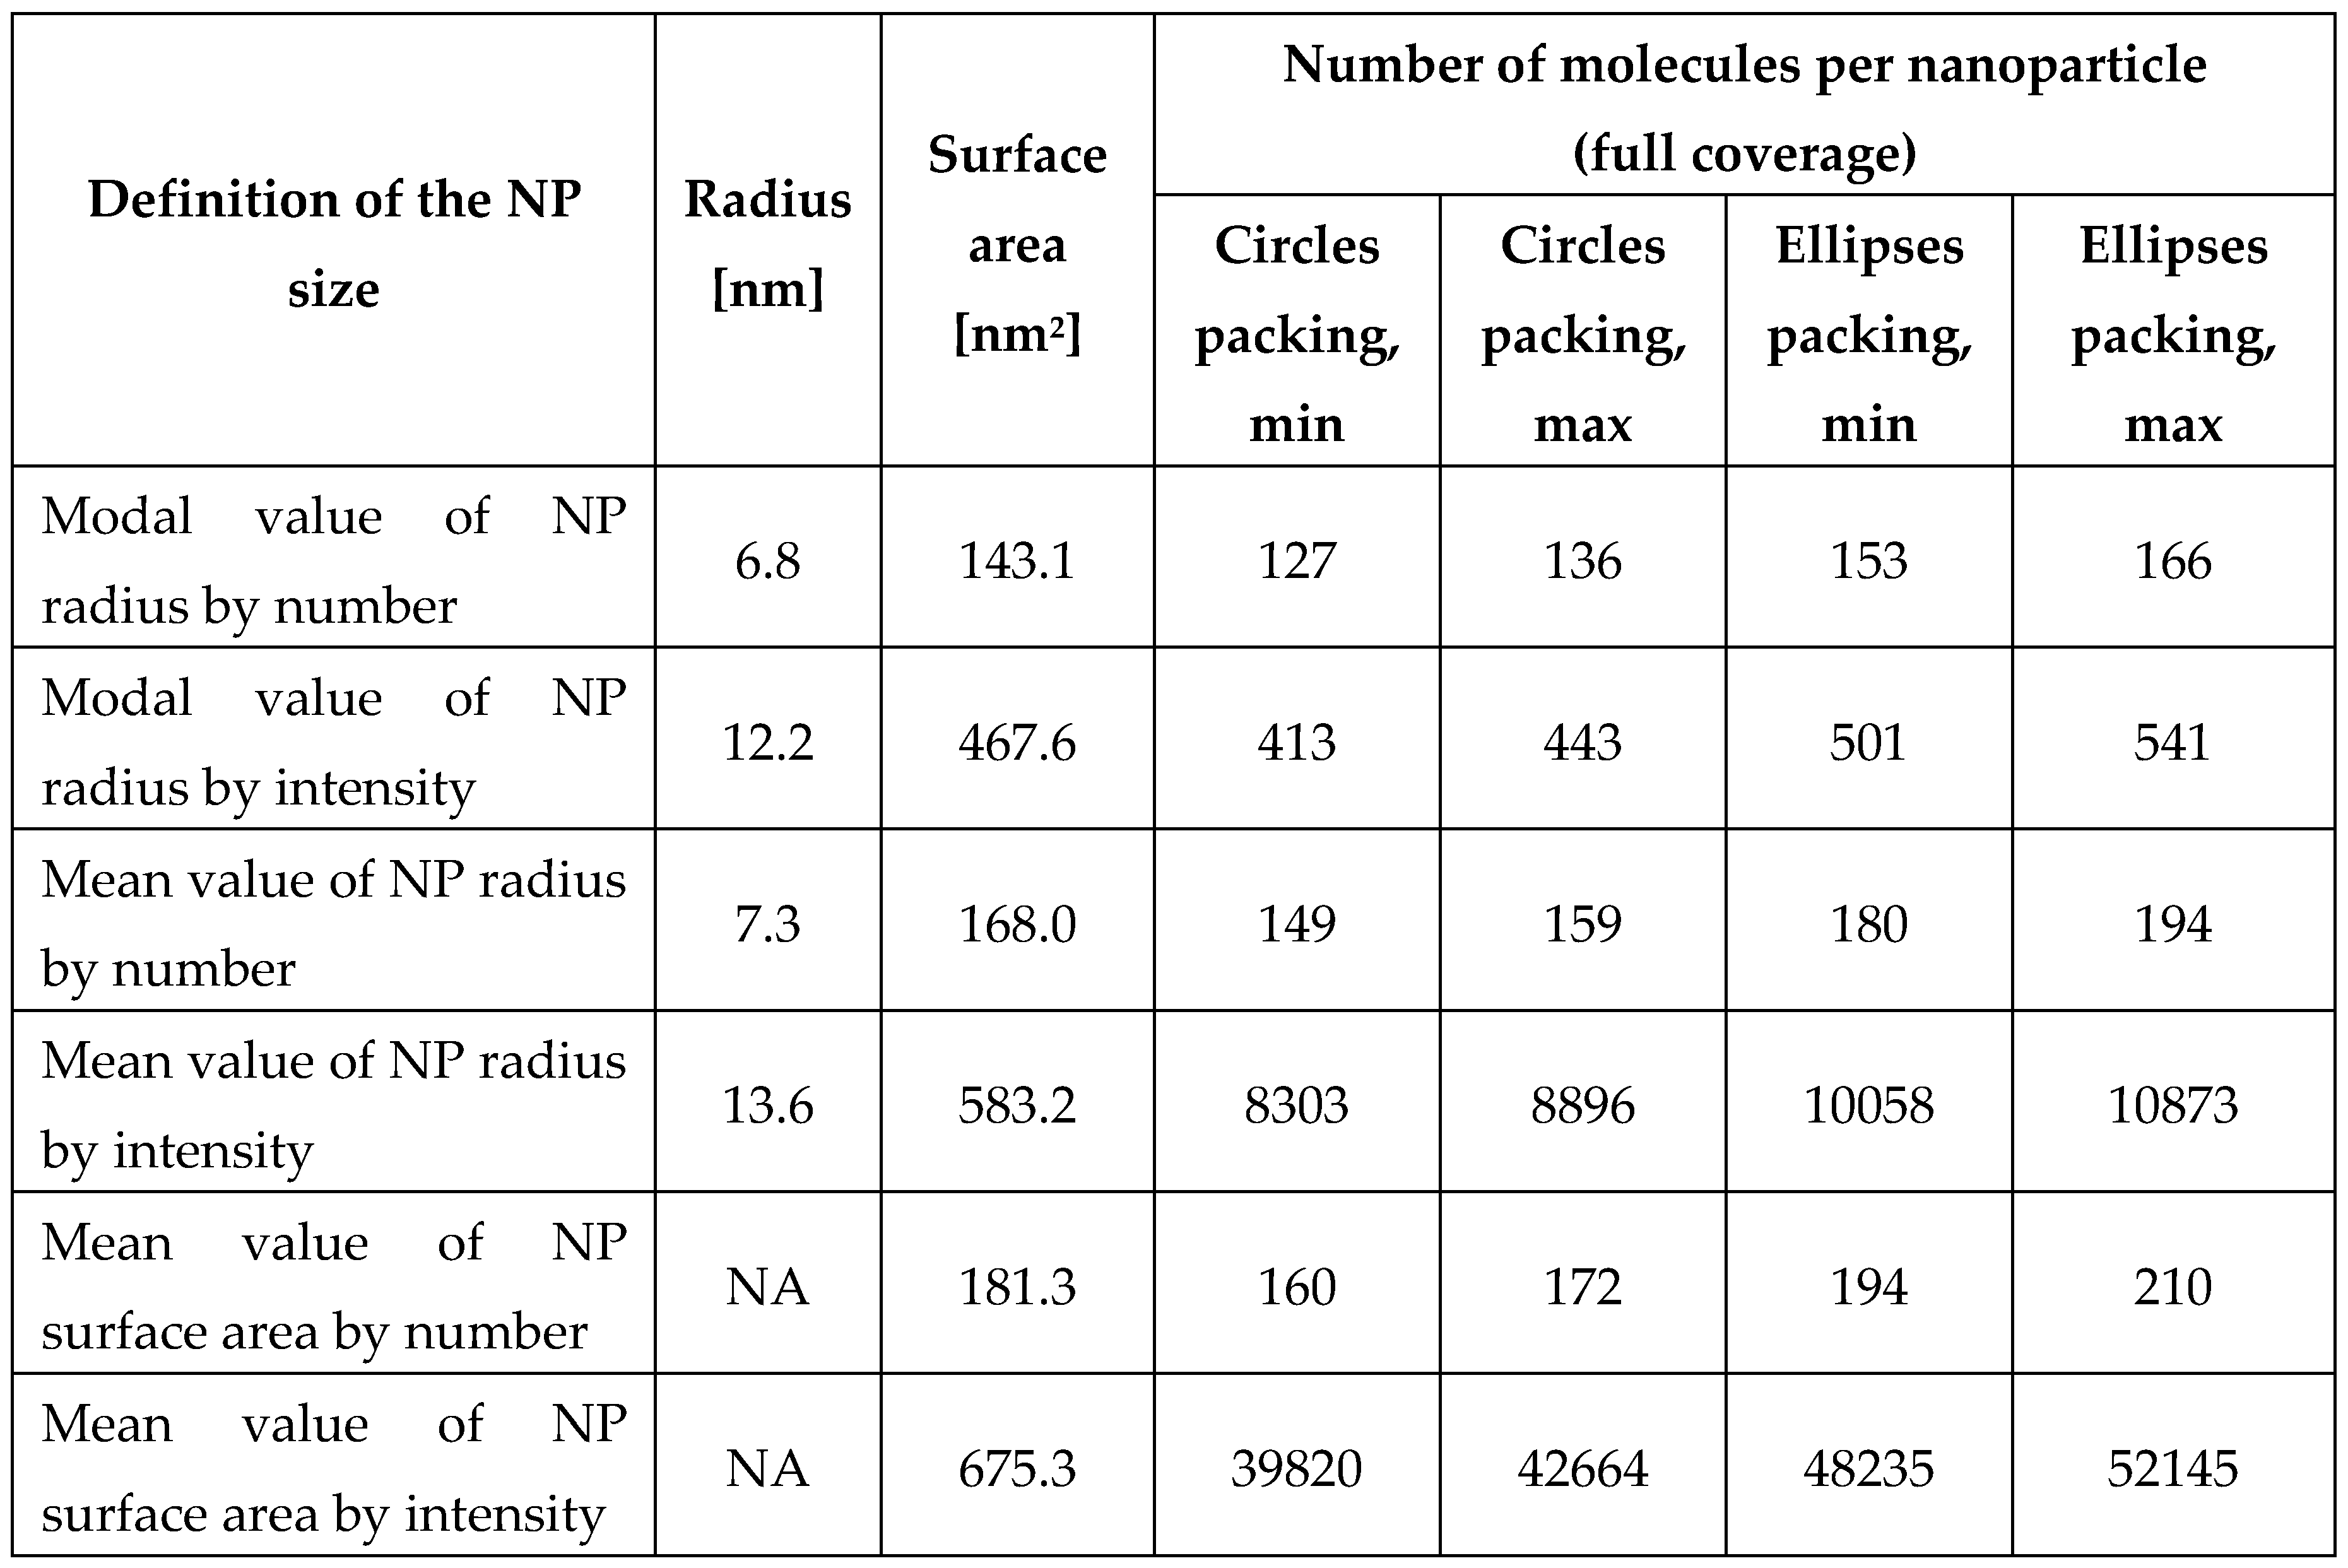
NP = nanoparticle, NA = not applicable.
Table 2.
Evaluation of number of molecules per nanoparticles based on experimental results for C1 = 2.13 × 10⁻⁵ M concentration of 8,8’-O,O-[cobalt bis(1,2-dicarbollide)]-phosphorothioate (1).
Table 2.
Evaluation of number of molecules per nanoparticles based on experimental results for C1 = 2.13 × 10⁻⁵ M concentration of 8,8’-O,O-[cobalt bis(1,2-dicarbollide)]-phosphorothioate (1).
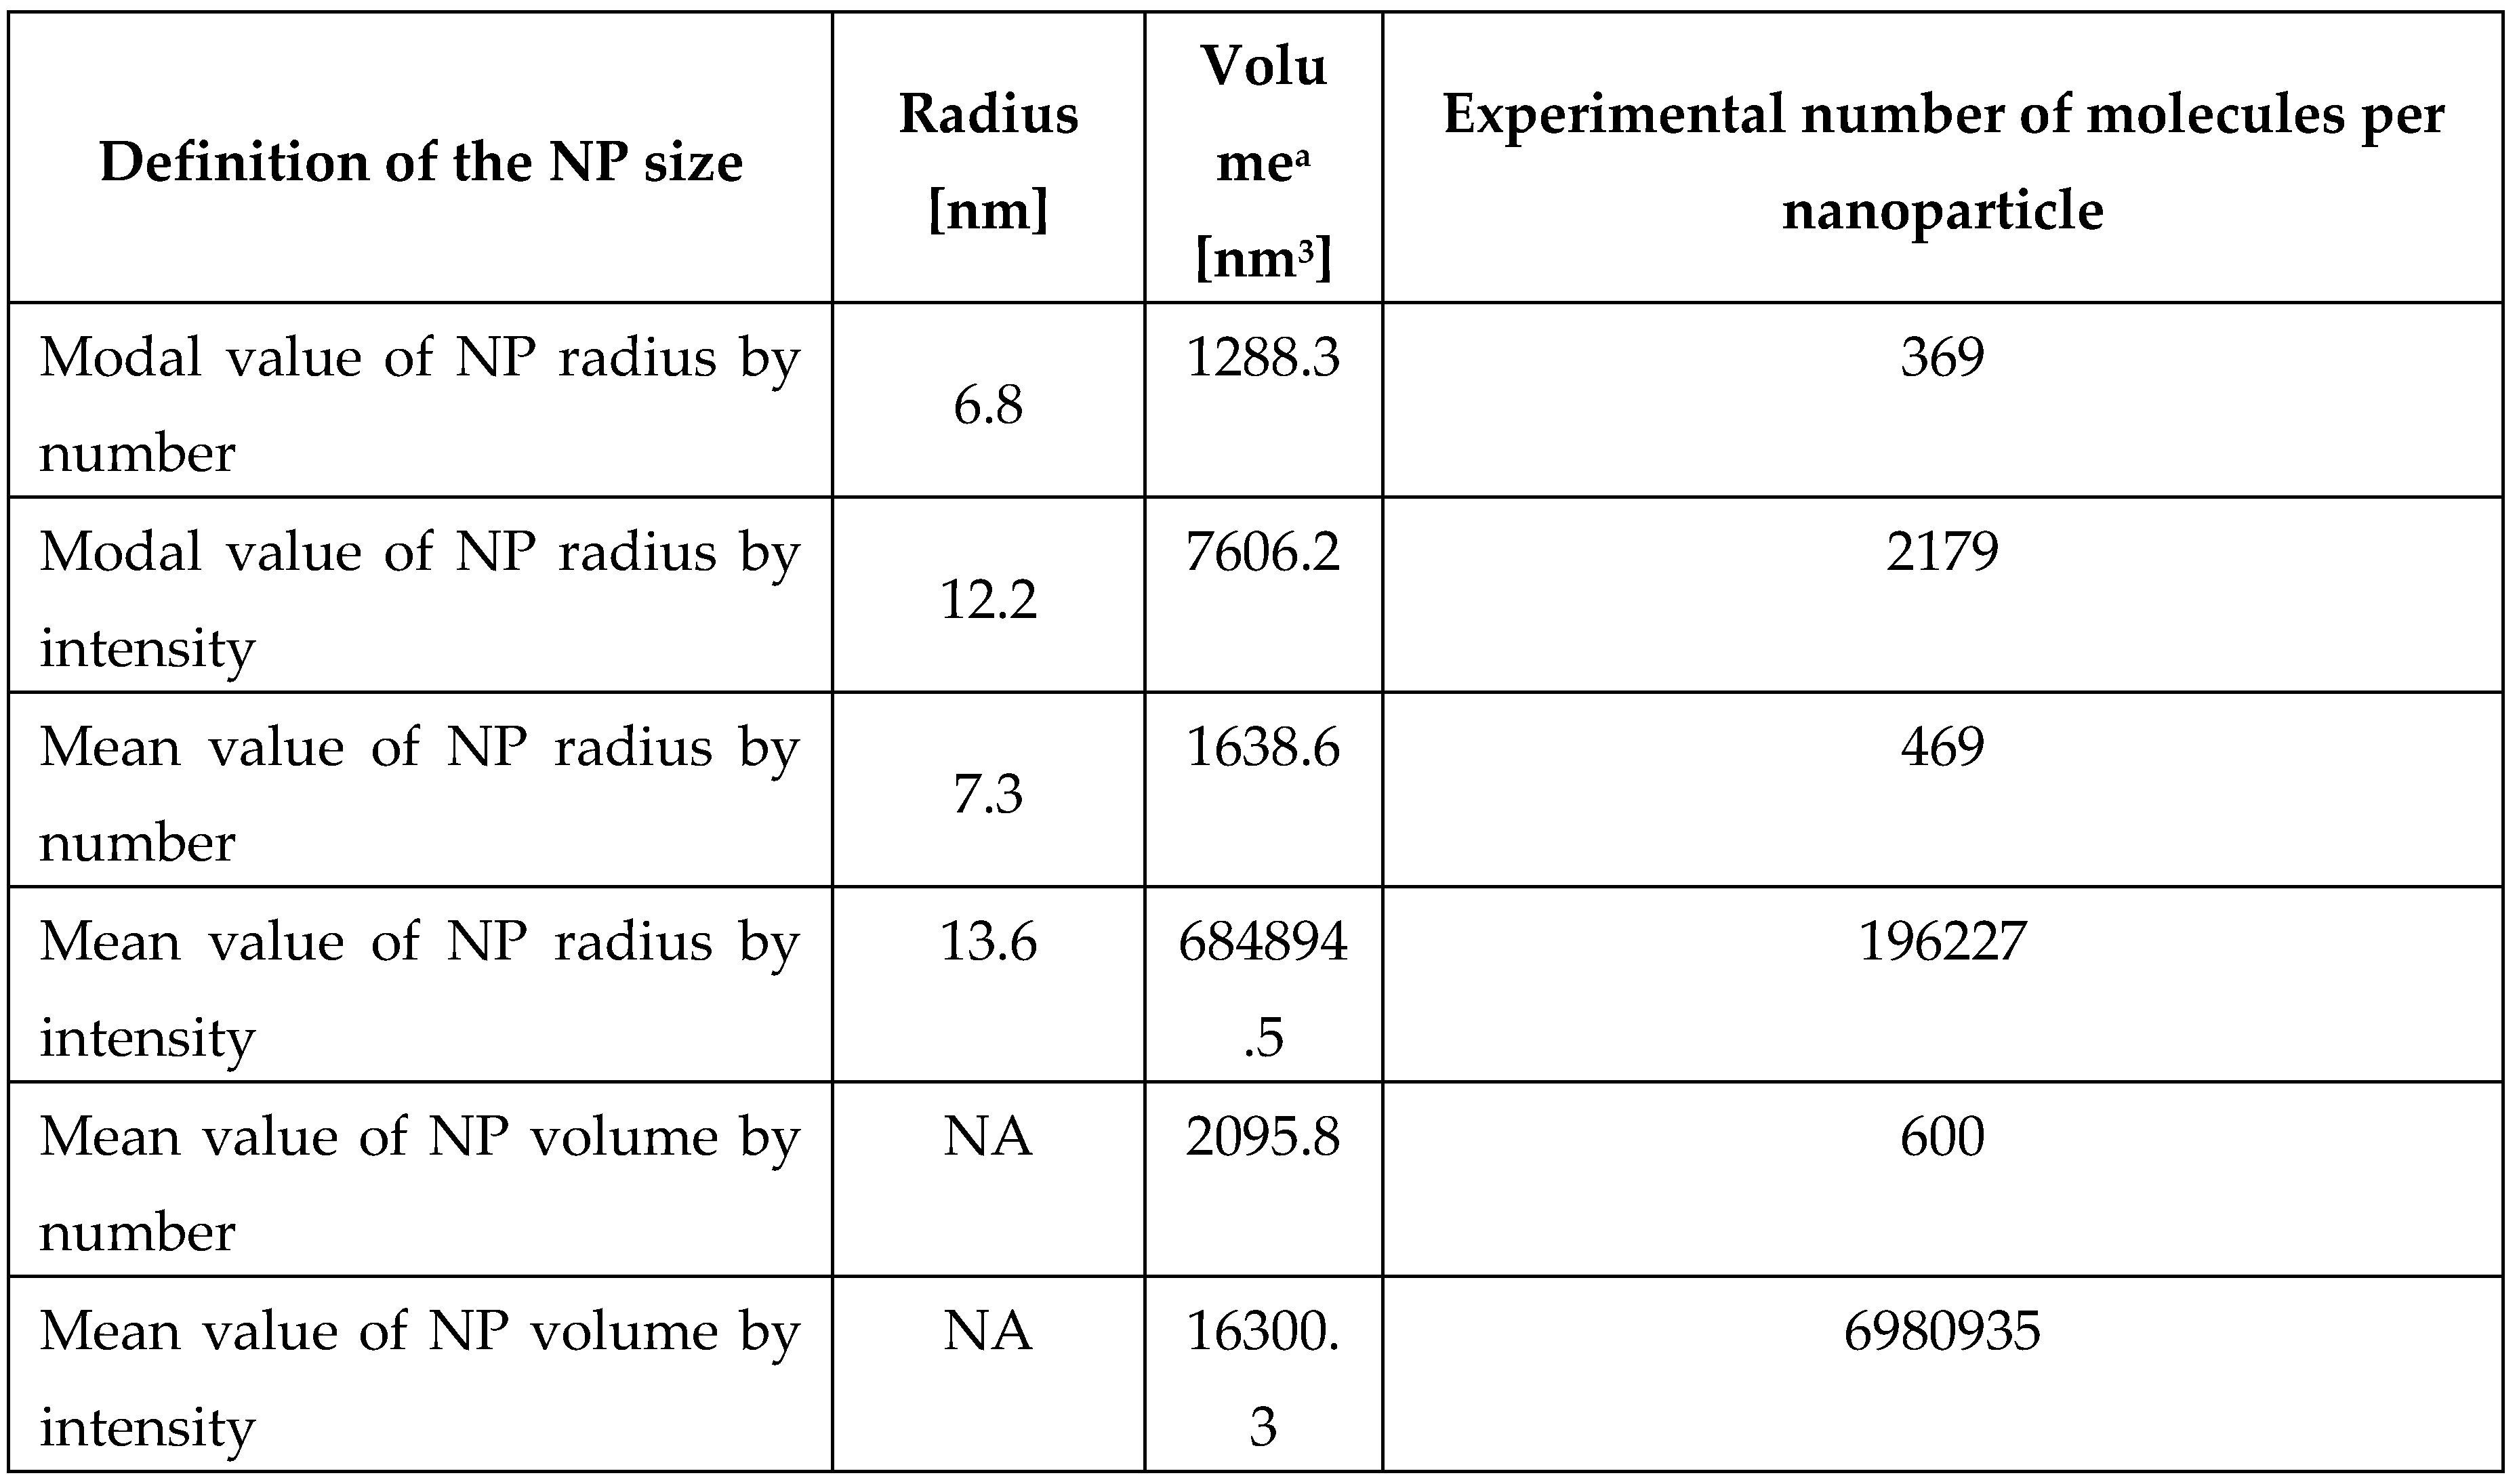
Table 3.
Ratio of experimental value of number of molecules attached to one nanoparticle to theoretical value of number of molecules needed for the full coverage of one nanoparticle for different concentrations of 8,8’-O,O-[cobalt bis(1,2-dicarbollide)]phosphorothioate (1).
Table 3.
Ratio of experimental value of number of molecules attached to one nanoparticle to theoretical value of number of molecules needed for the full coverage of one nanoparticle for different concentrations of 8,8’-O,O-[cobalt bis(1,2-dicarbollide)]phosphorothioate (1).
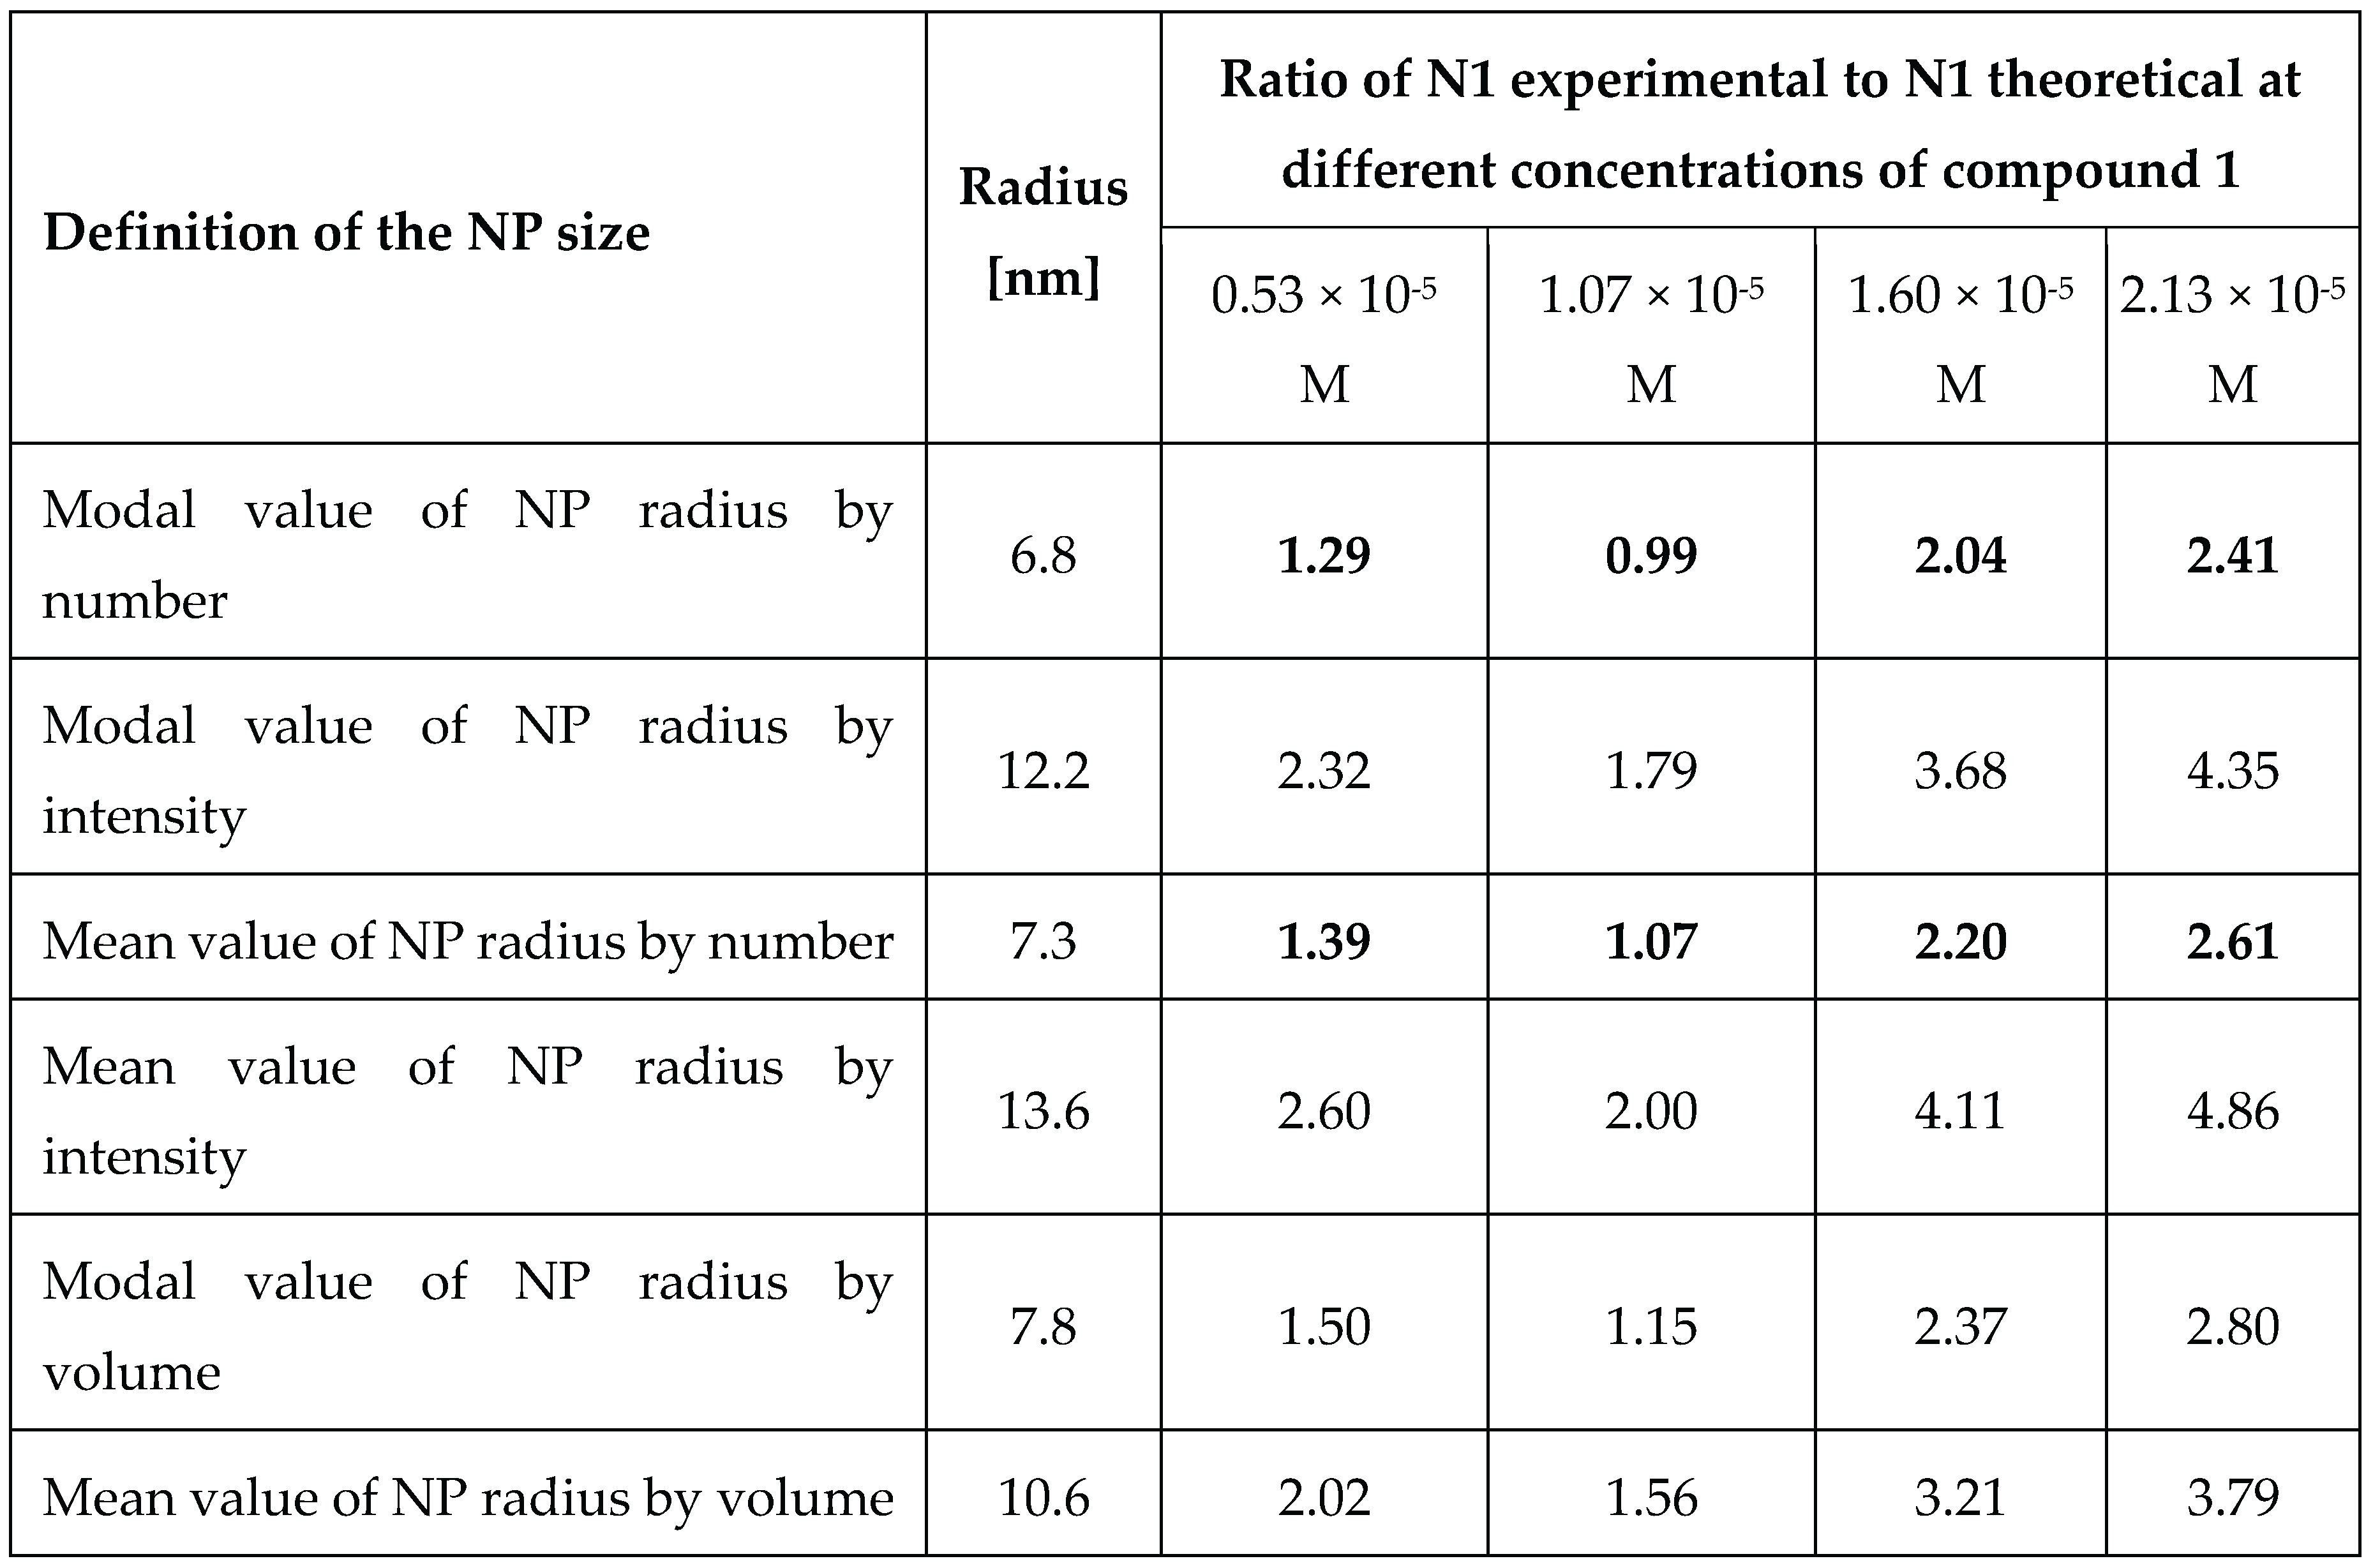
NP = nanoparticle, NA = not applicable; N1 = number of molecules 1 per one nanoparticle. C1 = 0.53 × 10⁻⁵ M = 0.0031 mg/mL (1); 1.07 × 10⁻⁵ M = 0.0063 mg/mL (2); 1.60 × 10⁻⁵ M (3) = 0.0094 mg/mL; 2.13 × 10⁻⁵ M = 0.0125 mg/mL (4).
Disclaimer/Publisher’s Note: The statements, opinions and data contained in all publications are solely those of the individual author(s) and contributor(s) and not of MDPI and/or the editor(s). MDPI and/or the editor(s) disclaim responsibility for any injury to people or property resulting from any ideas, methods, instructions or products referred to in the content. |
© 2025 by the authors. Licensee MDPI, Basel, Switzerland. This article is an open access article distributed under the terms and conditions of the Creative Commons Attribution (CC BY) license (http://creativecommons.org/licenses/by/4.0/).
Copyright: This open access article is published under a Creative Commons CC BY 4.0 license, which permit the free download, distribution, and reuse, provided that the author and preprint are cited in any reuse.


