
Submitted:
02 August 2025
Posted:
04 August 2025
You are already at the latest version
Abstract
Organic phase change materials (PCMs) are a useful and increasingly popular choice for thermal energy storage applications such as solar energy and building envelope thermal barriers. These outdoor conditions greatly affect the performance of PCM envelopes. This project studies the effect of different parameters on energy transfer through the cavity. These parameters are PCM material, heat flux gain (solar radiation), and time-period (day hours). One parameter was changed at a time while others kept the same. This model was simulated numerically using ANSYS FLUENT software. It was found that linoleic acid provides the highest right side surface heat flux meaning it provides the lowest thermal resistance. On the other hand, Tricosane found to provide the lowest right side surface heat flux, meaning it provides the highest thermal resistance. Also, higher heat flux gain from the left side results in higher surface heat flux on the right side. For longer days (q < 1), the PCM was in liquid form for longer time, which means less conduction while for shorter days (q > 1), the PCM was in solid form for longer time.
Keywords:
Phase Changing Material (PCM)
; thermal energy storage
; numerical simulation
; heat transfer
; solar energy
1. Introduction
Organic PCMs are a suitable medium for storing thermal energy. Types of phase change materials include simple alkene chains like Heneicosane, C21H44, and unsaturated fatty acids like Oleic Acid, C18H34O2. These materials have been proposed as viable energy storage mechanisms through the large enthalpy of fusion and convenient temperature associated with their solid-liquid phase transition [1,2].
The importance of thermal energy storage (TES) lies in the ability to balance energy supply and demand during heating and cooling periods. This is beneficial to energy savings as well as to environmental as renewable energy sources could be utilized reducing reliance on fossil fuels. Nowadays, many TES technologies are available commercially for water and air systems [3]. Some advantages of TES are efficiency increase, energy savings, better economy, and environmental friendliness [4]. Also, PCM is transportable and allows small volumes to store large amounts of energy resulting in low-cost storage [5].
Types of PCMs include popular organic PCMs, which are most common for cooling systems because of their ability to store large amounts of energy. On the other hand, inorganic PCMs have better thermal conductivity compared to organic PCMs [6]. Several criteria govern selection of the appropriate PCM type such as amount of heat of fusion, melting temperatures, solidification or melting temperature range, crystallization, and application [7].
There are several applications for PCMs. One application of PCMs lies in their ability to store solar energy during the day through melting and release the stored energy during the night through solidification [8,9,10,11,12,13,14]. A second application involves using phase change materials for building envelope thermal barriers [15,16,17,18,19,20,21,22,23], where PCMs store heat during the day that is then used to heat the house during the night. This application would be most viable in desert locations due to warm days and cold nights. A third application involves the passive cooling of portable electronics where paraffin wax can cycle between melting and solidification to handle the intermittent thermal loads of mobile devices [24,25,26].
Researchers have worked on several PCM applications. Electronic devices are becoming more popular with new smart technologies evolving. PCMs can improve the device performance by cooling down electronic circuits which will save energy consumption as well [27,28]. Researchers also tackled solar energy sector utilizing PCMs in technologies such as solar thermal collectors and photovoltaic (PV) systems. This integration is useful as solar energy is abundantly available during morning time while it’s unavailable during nighttime. Extra energy in daytime could be stored to be used during nighttime [29,30]. Another important sector is thermal barriers, which could significantly reduce cooling or heating loads in buildings leading to essential economic savings [31,32].
Researchers have employed PCM technology in traditional building bricks to increase their thermal performance and reduce energy consumption. There are two different approaches to integrate PCM in building bricks: direct and indirect methods. Examples of direct method are mixing, immersing, and filling while indirect method examples are macro- encapsulation, micro-encapsulation, and form-stabilization. Mahdaoui et. al. [33] studied hollow bricks to improve their thermal performance. They conducted a numerical analysis for 12 types of hollow bricks impregnated with PCM material. Their results showed better stabilization of the building inner wall temperature. Hawes et. al. [34], on the other hand, stated that PCM impregnation with concrete could increase the walls thermal storage capacity up to 130%. On the other hand, many PCM types are unsuitable for impregnation with concrete. Therefore, they studied three different types of PCM: butyl stearate, dodecanol and polyethylene glycol 600. They found that all three were compatible with autoclaved concrete block. Memon [35] has tested different methods to determine chemical compatibility and thermal properties of the PCM. He concluded that integration of PCM in buildings requires careful choice of a PCM type depending on applications and thermo-physical properties. Zhu et. al. [36] studied classification and applications of Shape-stabilized phase change materials (SSPCMs) used in building envelope. He found that both numerical and experimental research work reduce energy demands.
Although phase change materials have a high enthalpy of fusion, they have relatively low thermal conductivity. Paraffin can have a thermal conductivity as low as 0.2 W/m K [37] which is 3-4 orders of magnitude smaller than common metals. This low thermal conductivity can influence the performance of phase change material applications, since heat becomes localized within certain parts of the PCM.
The effectiveness of phase change materials is largely dependent upon their thermal penetration [1]. The thermal penetration of a material can be quantified by the thermal diffusivity , which is expressed as a function of thermal conductivity , mass density , and mass-based heat capacity , as in equation 1:
Even though there is plenty of work done on PCMs and their different applications, there is still more work needed to study and explore. Work on building thermal barriers exposed to solar energy application is still under consideration for more development and improvement. There is a need to study many parameters and their effect on the performance on PCM building envelope.
This project studies PCM in a 2-D square enclosure exposed to solar heat flux on one side and convection heat transfer on the other side. The value and time exposure of the solar heat flux on the one side represents the exposure to solar energy over a full 24 hours of day and nighttime. The effects of three parameters were studied: PCM material, solar heat flux gain from left side and daytime time-period τq. Heat flux and average temperature on the right-side wall were plotted and examined.
2. Mathematical Model
2.1. Physical Model and Simulation Methodology
The mathematical model in hand is a 2-dimensional quadratic enclosure confined space with a thin wall filled with Heneicosane PCM, Figure 1. This problem is a transient problem that studies the melting and solidification of the PCM material throughout a whole day of operation. The enclosure is exposed to heat flux gain from left side that represents sunlight while it is exposed to convection heat transfer on right side with a temperature T∞ = 308 oC and heat transfer coefficient ho = 5 W/m2.K. Top and bottom boundaries are insulated. The heat flux gain from left side is expressed in such a way to consider variable heat flux during an entire day. Equation 2 is used to express the variable heat flux sinusoidal behavior on the left side during an entire day. The value depends on constant heat flux gain qo = 200 W/m2, and time-period τq = 86400 s-1.
Dimensions of the enclosure are taken as 8.89 cm in width and 6.35 cm in height. This is done to match an experimental setup done by Gau and Viskanta [38]. Heneicosane properties are given in Table 1 by O’conner [39]. The density model was used as Boussinesq model to represent the melting and solidification process in the simulation. The gravitational force was taken into consideration to simulate the buoyant forces in the model.
FLUENT was used to model the described above case and solve for the temperature profile and wall heat fluxes. The governing equations 3 - 6 were solved by a pressure-based solver setting implicit formulation using PISO algorithm for pressure-velocity coupling scheme, PRESTO as the discretization method for pressure and a second order upwind discretization for both momentum and energy evaluations [40].
2.2. Grid Test
The grid test was done for a 2-dimensional model. Three different grid systems were tested for accuracy, Figure 2. Each time the edge intervals of the grid were doubled. The three grid systems had 50 x 50 cells, 100 x 100 cells and 200 x 200 cells. The case was run for 17280 time-steps with 5 seconds considered for each time-step. That is equivalent for one full day. A second day was run as well to avoid initial condition effects. The average surface temperature on the right side was monitored and printed each time step. This parameter was taken as a measure for grid independence. Total heat transfer flux over a full day and the thermal system efficiency were calculated, equation 7 – 9.
Symbol is denoted for the total heat flow flux on right side of the system per second and symbol is denoted for the total heat flux rate on left side of the system per second. Errors were calculated by comparing the resulting ones of each grid system to those of 200 x 200 grid system. Table 2 shows the resulting errors for the first and second day. Cell independence was assumed to be accomplished when the errors of temperatures were less than 0.25%. It was decided to consider the 100 x 100 cells grid model. We now try to select the appropriate time-step.
2.3. Time Step Selection
Time step test was done using 100 x 100 grid system chosen from grid test. Three different time steps were used: 10 seconds, 5 seconds and 3 seconds. The average surface temperature on the right side was monitored. This parameter was taken as a measure for time step independence. The case was run for several time-steps equivalent to one full day, as done in the grid test. A second day was run as well to avoid initial condition effects. The results were printed every 30 seconds so that comparison can be made at the same time of the day. Two parameters were printed and calculated: right side average surface temperature and efficiency. Table 3 shows the resulting errors. Errors were calculated by comparing the results to those of 3 second time-step. Time step independence was assumed to be accomplished when the errors of temperatures were less than 0.5%. It was decided to consider the time step of 5 seconds for this study.
2.4. Initial Condition Effect
Now we know the grid system and the time-step needed for this case. We now want to eliminate the effect of the initial condition by running the case for several days. This is to know when we would have similar results for each day. This was on geometry of 1 cm x 1 cm. Later all cases were done for 2 days only with 8.89 cm x 6.35 cm. The case was run with a 100 x 100 grid system and 5 second time-step for 69120 steps. This is equivalent to 4 days. The average surface temperature and heat transfer flux on the right side were monitored for efficiency and error calculation. The 3 parameters considered for error calculations are: right side average surface temperature, right side heat transfer flux during one full day, and the system efficiency for one day (equation 10).
Symbol Qout,s is denoted for the total heat flow rate leaves the system during a full day and symbol Qin,s is denoted for the total heat flow rate enters the system during a full day. Figure 3 shows the right-side average surface temperature on the right side along 4 different days. Only the first day has different initial condition than the other days. Errors were calculated by comparing the result to those of the fourth day. Table 4 shows the resulting errors. Time independence was assumed to be accomplished when the errors of temperatures were less than 0.5%. It was decided that the 2nd day is sufficient to eliminate the initial condition effect for this study.
2.5. Numerical Model Validation
Our model is now to be validated by comparison to existing experimental results from the literature, Gau and Viskanta [38]. They studied melting and solidification of pure metal experimentally on a vertical wall. They used a rectangular test cell with 8.89 cm in height, 6.35 cm in width, and 3.81 cm in depth. The front and back walls were insulated with air gaps. The horizontal temperature distribution in the central region along the top wall, center line, and bottom wall were measured with 69 nested thermocouples. The PCM material used was Gallium with 99.6 % purity. Gallium is highly anisotropic. In our numerical model we used a close-to-average constant thermal conductivity for Gallium. Table 5 shows properties for Gallium were used in our model [39]. They used pour-out method and probing method to examine and measure the solid-liquid interface.
Figure 4 shows a good agreement between our numerical work and the experimental work up to 10 minutes. The difference between the numerical and experimental work could be due to many reasons, one of which using approximated isotropic thermal conductivity.
3. Results and Discussion
Three parameters were studied: PCM material, heat flux gain from left side and time-period τq. Heat flux and average temperature on the right side were plotted and examined.
Figure 5 shows the right-side surface heat flux over a full day for different PCM materials. It is obvious that linoleic acid provides the highest right side surface heat flux while Tricosane provides the lowest. This could be explained by linoleic acid having the lowest melting temperature and 2nd lowest heat diffusion ΔHf (in kJ/kg) while Tricosane having 2nd highest melting temperature and highest heat diffusion ΔHf (in kJ/kg). The heat transfer during the cooling period is taken as absolute value. This is done to have correct efficiency calculations, and it is carried out for the right-side surface heat flux throughout the rest of this paper.
Figure 6 shows the right-side average surface temperature over a full day for different PCM materials. Each PCM material has its own melting temperature and cases were run at initial and ambient temperatures 4 oC below its melting temperature. Liquidus and solidus temperatures are chosen to be 0.5 oC about the melting temperature. Properties of all PCM material used in this section are given in Table 6 [39]. Viscosity and thermal expansion are taken as 0.008 kg/m.s and 0.0005 K-1 respectively for all PCM materials. The heating of liquid and cooling of solid can be seen easily with melting and solidification in between. The slight edge shown at the start of 2nd day is because it is starting at the heating solid catching up from previous day
Figure 7 shows the right-side surface heat flux over a full day for different heat flux gain from the left side. It is easily concluded that higher heat flux gain from the left side results in higher surface heat flux on the right side. The increase rate of right-side surface heat flux is almost proportional to those of heat flux gain from the left side
Figure 8 shows the right-side average surface temperature over a full day for different heat flux gain from left side. It could be easily seen that higher heat flux gain from the left side results in higher liquid temperatures and lower solid temperatures as heating and cooling spans. It also could be seen that the melting and solidification time laps shorten as the heat flux gain from left side increase. Note that the heat flux gain from left side qo chosen to provide adequate melting and solidification process for Heneicosane properties and conditions of original case
Figure 9 and Figure 10 show the right-side surface heat flux and average surface temperature over a full day for different daytime hours, respectively. Longer daytime will expose the left side of the enclosure for longer time to the heat flux gain from the left side causing change in melting and solidifying durations. A piecewise sinusoidal function was implemented to model different daytime hours during a full day, equation 11. In case of longer days (τq < 1) the PCM was in liquid form for longer time but in solid form for shorter time. In this case the PCM material stays in solid form towards the end of the day, which means that the next day will start while it is in solid form with low temperature. In case of shorter days (τq > 1) the PCM was in liquid form for shorter time but in solid form for longer time. In this case it starts to liquidize again towards the end of the day.
where qo = 200 W/m2 and h = daytime hours.
4. Conclusions
A 2-D numerical study was conducted on a PCM square enclosure containing Heneicosane and other different PCM materials. The enclosure was exposed to solar radiation on one side (left) and indoor convection condition on the other side (right). The grid test was done for a 2-dimensional model and 100 x 100 cells resulted errors of temperatures less than 0.25%. Time step test was done, and 5 seconds time step resulted in errors of temperatures less than 0.5%. Eliminating the initial condition effect was done by running the case for four days. The second day showed errors in temperatures of less than 0.5%. The model finally was validated by comparison to existing experimental results from the literature. This project studied different PCM materials, different heat flux gain and different daytime hours. Linoleic acid provided the highest right side surface heat flux while Tricosane provided the lowest. Higher heat flux gain from the left side resulted in an increase of the surface heat flux on the right side. For longer days (τq < 1), the PCM was in liquid form for longer time but in solid form for shorter time. For shorter days (τq > 1), the PCM was in liquid form for shorter time but in solid form for longer time.
Acknowledgments
I would like to acknowledge King Abdulaziz University for providing time and support, Villanova University for providing the necessary tools to finish this project, and the effort made by Dr. Aaron Wemhoff for supervising my visit to Villanova University.
Conflicts of Interest
The authors declare no conflict of interest.
Nomenclature
| Cp | thermal capacity |
| ho | convective heat transfer coefficient |
| k | thermal conductivity |
| P | pressure |
| q | left side heat flux gain – variable over a full day |
| qo | left side heat flux gain - constant |
| ql’’ | left side heat transfer flux |
| qr’’ | right side heat transfer flux |
| Ql | left side total heat transfer flux |
| Qr | right side total heat transfer flux |
| Qout | total heat flow rate leave the system during a full day |
| Qin | total heat flow rate enter the system during a full day |
| T∞ | outdoor temperature |
| T | temperature |
| u | x-component velocity |
| v | y-component velocity |
| x | axial direction |
| y | vertical direction |
| Greek symbols | |
| Thermal diffusivity | |
| β | thermal coefficient of expansion |
| ηth | thermal efficiency |
| µ | dynamic viscosity |
| ρ | density |
| τq | time period |
References
- O’Connor WE, Warzoha R, Weigand R, Fleischer AS, Wemhoff AP. Thermal property prediction and measurement of organic phase change materials in the liquid phase near the melting point. Applied energy. 2014 Nov 1;132:496-506. [CrossRef]
- O’Connor WE, Wemhoff AP. Quantification of phase change material energy storage capability using multiphysics simulations. In International Electronic Packaging Technical Conference and Exhibition 2015 Jul 6 (Vol. 56888, p. V001T09A065). American Society of Mechanical Engineers. [CrossRef]
- European Association for Storage of Energy. Available online: https://ease-storage.eu/wp-content/uploads/2023/09/2023.09.26-Thermal-Energy-Storage_for-distribution.pdf (accessed on 3rd July 2025).
- Sarbu I, Sebarchievici C. A comprehensive review of thermal energy storage. Sustainability. 2018 Jan 14;10(1):191. [CrossRef]
- Tay NH, Liu M, Belusko M, Bruno F. Review on transportable phase change material in thermal energy storage systems. Renewable and Sustainable Energy Reviews. 2017 Aug 1;75:264-77. [CrossRef]
- Tehrmtest Instruments. Available online: https://thermtest.com/phase-change-material-pcm#:~:text=There%20are%203%20types%20of,paraffin%20compounds%20or%20fatty%20acids%20 (accessed on 3rd July 2025).
- PCM Products. Available online: https://www.pcmproducts.net/Phase-Change-Material-Solutions.htm (accessed on 3rd July 2025).
- Jian-you L. Numerical and experimental investigation for heat transfer in triplex concentric tube with phase change material for thermal energy storage. Solar Energy. 2008 Nov 1;82(11):977-85. [CrossRef]
- Veerappan M, Kalaiselvam S, Iniyan S, Goic R. Phase change characteristic study of spherical PCMs in solar energy storage. Solar energy. 2009 Aug 1;83(8):1245-52. [CrossRef]
- Hoshi A, Mills DR, Bittar A, Saitoh TS. Screening of high melting point phase change materials (PCM) in solar thermal concentrating technology based on CLFR. Solar Energy. 2005 Sep 1;79(3):332-9. [CrossRef]
- Trp A. An experimental and numerical investigation of heat transfer during technical grade paraffin melting and solidification in a shell-and-tube latent thermal energy storage unit. Solar energy. 2005 Dec 1;79(6):648-60. [CrossRef]
- Medina MA, King JB, Zhang M. On the heat transfer rate reduction of structural insulated panels (SIPs) outfitted with phase change materials (PCMs). Energy. 2008 Apr 1;33(4):667-78. [CrossRef]
- Kenisarin M, Mahkamov K. Solar energy storage using phase change materials. Renewable and sustainable energy reviews. 2007 Dec 1;11(9):1913-65. [CrossRef]
- Wang Y, Tang B, Zhang S. Organic, cross-linking, and shape-stabilized solar thermal energy storage materials: A reversible phase transition driven by broadband visible light. Applied energy. 2014 Jan 1;113:59-66. [CrossRef]
- Neeper DA. Thermal dynamics of wallboard with latent heat storage. Solar energy. 2000 Jan 1;68(5):393-403. [CrossRef]
- Zhou G, Zhang Y, Zhang Q, Lin K, Di H. Performance of a hybrid heating system with thermal storage using shape-stabilized phase-change material plates. Applied Energy. 2007 Oct 1;84(10):1068-77. [CrossRef]
- Athienitis AK, Liu C, Hawes D, Banu D, Feldman D. Investigation of the thermal performance of a passive solar test-room with wall latent heat storage. Building and environment. 1997 Sep 1;32(5):405-10. [CrossRef]
- Zhu N, Ma Z, Wang S. Dynamic characteristics and energy performance of buildings using phase change materials: A review. Energy Conversion and Management. 2009 Dec 1;50(12):3169-81. [CrossRef]
- Diaconu BM, Cruceru M. Novel concept of composite phase change material wall system for year-round thermal energy savings. Energy and buildings. 2010 Oct 1;42(10):1759-72. [CrossRef]
- Cabeza LF, Castellón C, Nogués M, Medrano M, Leppers R, Zubillaga O. Use of microencapsulated PCM in concrete walls for energy savings. Energy and buildings. 2007 Feb 1;39(2):113-9. [CrossRef]
- Castellón C, Medrano M, Roca J, Cabeza LF, Navarro ME, Fernández AI, Lázaro A, Zalba B. Effect of microencapsulated phase change material in sandwich panels. Renewable Energy. 2010 Oct 1;35(10):2370-4. [CrossRef]
- Eddhahak-Ouni A, Drissi S, Colin J, Neji J, Care S. Experimental and multi-scale analysis of the thermal properties of Portland cement concretes embedded with microencapsulated Phase Change Materials (PCMs). Applied Thermal Engineering. 2014 Mar 1;64(1-2):32-9. [CrossRef]
- Li M, Wu Z, Tan J. Heat storage properties of the cement mortar incorporated with composite phase change material. Applied Energy. 2013 Mar 1;103:393-9. [CrossRef]
- Weinstein RD, Kopec TC, Fleischer AS, D’Addio E, Bessel CA. The experimental exploration of embedding phase change materials with graphite nanofibers for the thermal management of electronics. J. Heat Transfer. Apr 2008, 130(4): 042405 (8 pages). [CrossRef]
- Garimella SV, Fleischer AS, Murthy JY, Keshavarzi A, Prasher R, Patel C, Bhavnani SH, Venkatasubramanian R, Mahajan R, Joshi Y, Sammakia B. Thermal challenges in next-generation electronic systems. IEEE Transactions on Components and Packaging Technologies. 2008 Nov 25;31(4):801-15. [CrossRef]
- Garimella SV. Advances in mesoscale thermal management technologies for microelectronics. Microelectronics Journal. 2006 Nov 1;37(11):1165-85. [CrossRef]
- Bianco V, De Rosa M, Vafai K. Phase-change materials for thermal management of electronic devices. Applied Thermal Engineering. 2022 Sep 1;214:118839. [CrossRef]
- Kandasamy R, Wang XQ, Mujumdar AS. Application of phase change materials in thermal management of electronics. Applied Thermal Engineering. 2007 Dec 1;27(17-18):2822-32. [CrossRef]
- Sikiru S, Oladosu TL, Amosa TI, Kolawole SY, Soleimani H. Recent advances and impact of phase change materials on solar energy: A comprehensive review. Journal of Energy Storage. 2022 Sep 1;53:105200. [CrossRef]
- Javadi FS, Metselaar HS, Ganesan PJ. Performance improvement of solar thermal systems integrated with phase change materials (PCM), a review. Solar Energy. 2020 Aug 1;206:330-52. [CrossRef]
- Ismail KA, Lino FA, Machado PL, Teggar M, Arıcı M, Alves TA, Teles MP. New potential applications of phase change materials: A review. Journal of Energy Storage. 2022 Sep 1;53:105202. [CrossRef]
- Faraj K, Khaled M, Faraj J, Hachem F, Castelain C. Phase change material thermal energy storage systems for cooling applications in buildings: A review. Renewable and Sustainable Energy Reviews. 2020 Mar 1;119:109579. [CrossRef]
- Mahdaoui M, Hamdaoui S, Ait Msaad A, Kousksou T, El Rhafiki T, Jamil A, Ahachad M. Building bricks with phase change material (PCM): Thermal performances. Construction and Building Materials. 2021 Feb 1;269:121315. [CrossRef]
- Hawes DW, Banu D, Feldman D. Latent heat storage in concrete. Solar energy materials. 1989 Nov 1;19(3-5):335-48. [CrossRef]
- Memon SA. Phase change materials integrated in building walls: A state of the art review. Renewable and sustainable energy reviews. 2014 Mar 1;31:870-906. [CrossRef]
- Zhu N, Li S, Hu P, Wei S, Deng R, Lei F. A review on applications of shape-stabilized phase change materials embedded in building enclosure in recent ten years. Sustainable Cities and Society. 2018 Nov 1;43:251-64. [CrossRef]
- Warzoha RJ, Weigand RM, Fleischer AS. Temperature-dependent thermal properties of a paraffin phase change material embedded with herringbone style graphite nanofibers. Applied Energy. 2015 Jan 1;137:716-25. [CrossRef]
- Gau C, Viskanta RC. Melting and solidification of a pure metal on a vertical wall. J. Heat Transfer. Feb 1986, 108(1): 174-181 (8 pages). [CrossRef]
- O’Connor WE. Predictions of phase change material thermal efficiency using multiscale analysis. Master’s thesis, Villanova University, 2015.
- White FM, Majdalani J. Viscous fluid flow, Vol. 3; McGraw-Hill: New York, USA, 2006; pp. 433-434.
- Nikitin ED, Pavlov PA, Bessonova NV. Critical constants of n-alkanes with from 17 to 24 carbon atoms. The Journal of Chemical Thermodynamics. 1994 Feb 1;26(2):177-82. [CrossRef]
- CAMEO Chemicals. Database of Hazardous Materials. In: National Oceanic and Atmospheric Administration, editor.2013.
- National Institutes of Health. PubChem. PubChem2013.
- Weast RC, Graselli JG. CRC Handbook of Data on Organic Compounds. 2nd ed. Boca Raton, FL: CRC Press, Inc. 1989.
- LookChem. LookChem. In: LookChem.com, editor.2013.
- Domalski ES, Hearing ED. Heat capacities and entropies of organic compounds in the condensed phase. Volume III. Journal of Physical and Chemical Reference Data. 1996;25:1-525.
- Jalal IM, Zografi G, Rakshit AK, Gunstone FD. Thermal analysis of fatty acids. Chemistry and Physics of Lipids. 1982 Dec 1;31(4):395-404. [CrossRef]
- Grodzka PG. Study of phase-change materials for a thermal control system. Huntsville, Ala: Lockheed Missiles & Space Company. 1970.
Figure 1.
Schematic drawing for the model.
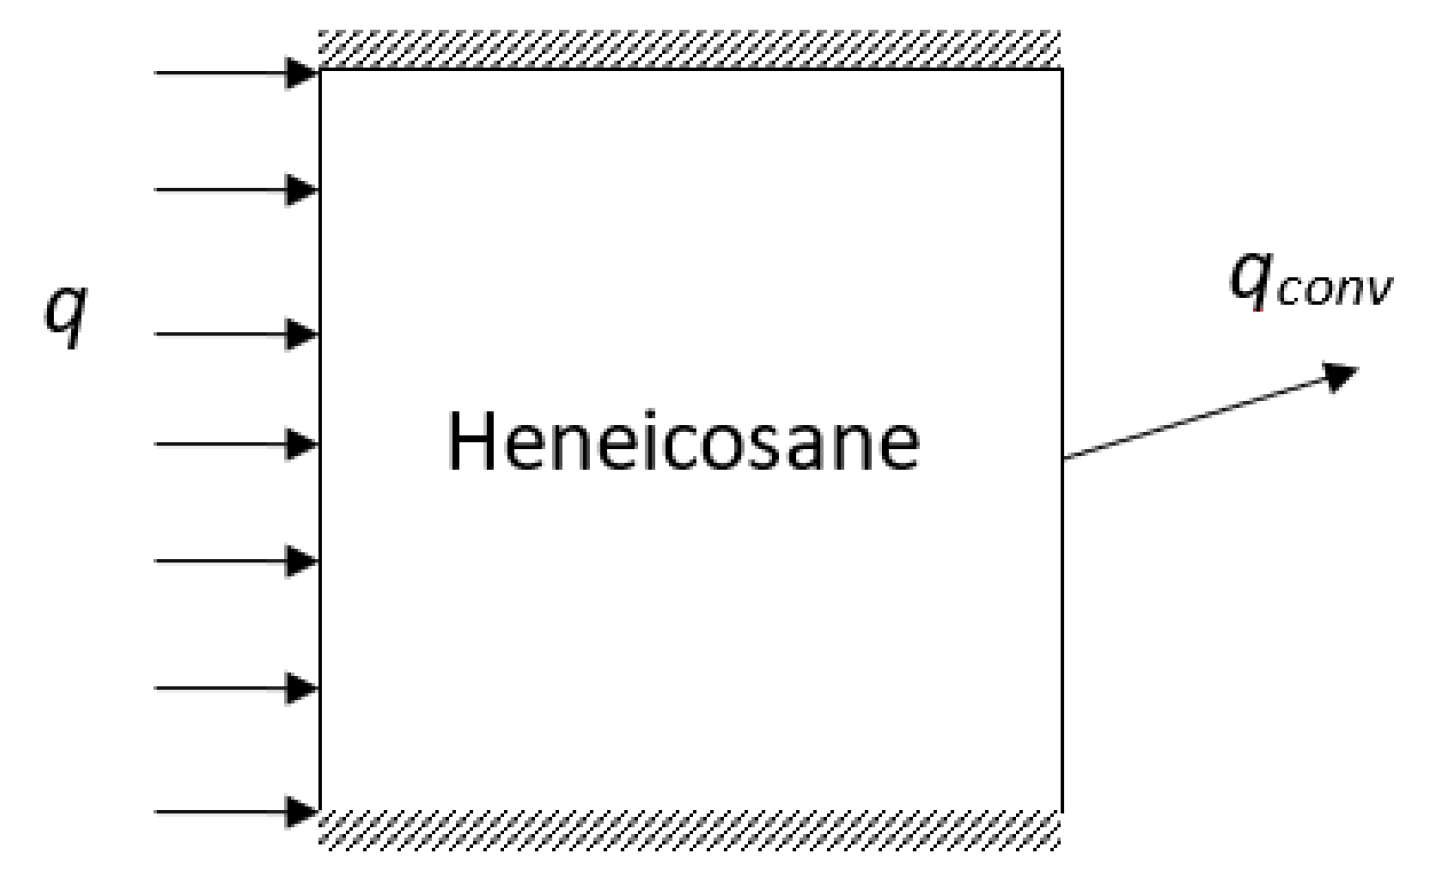
Figure 2.
Grid test for 3 different mesh systems for comparison.
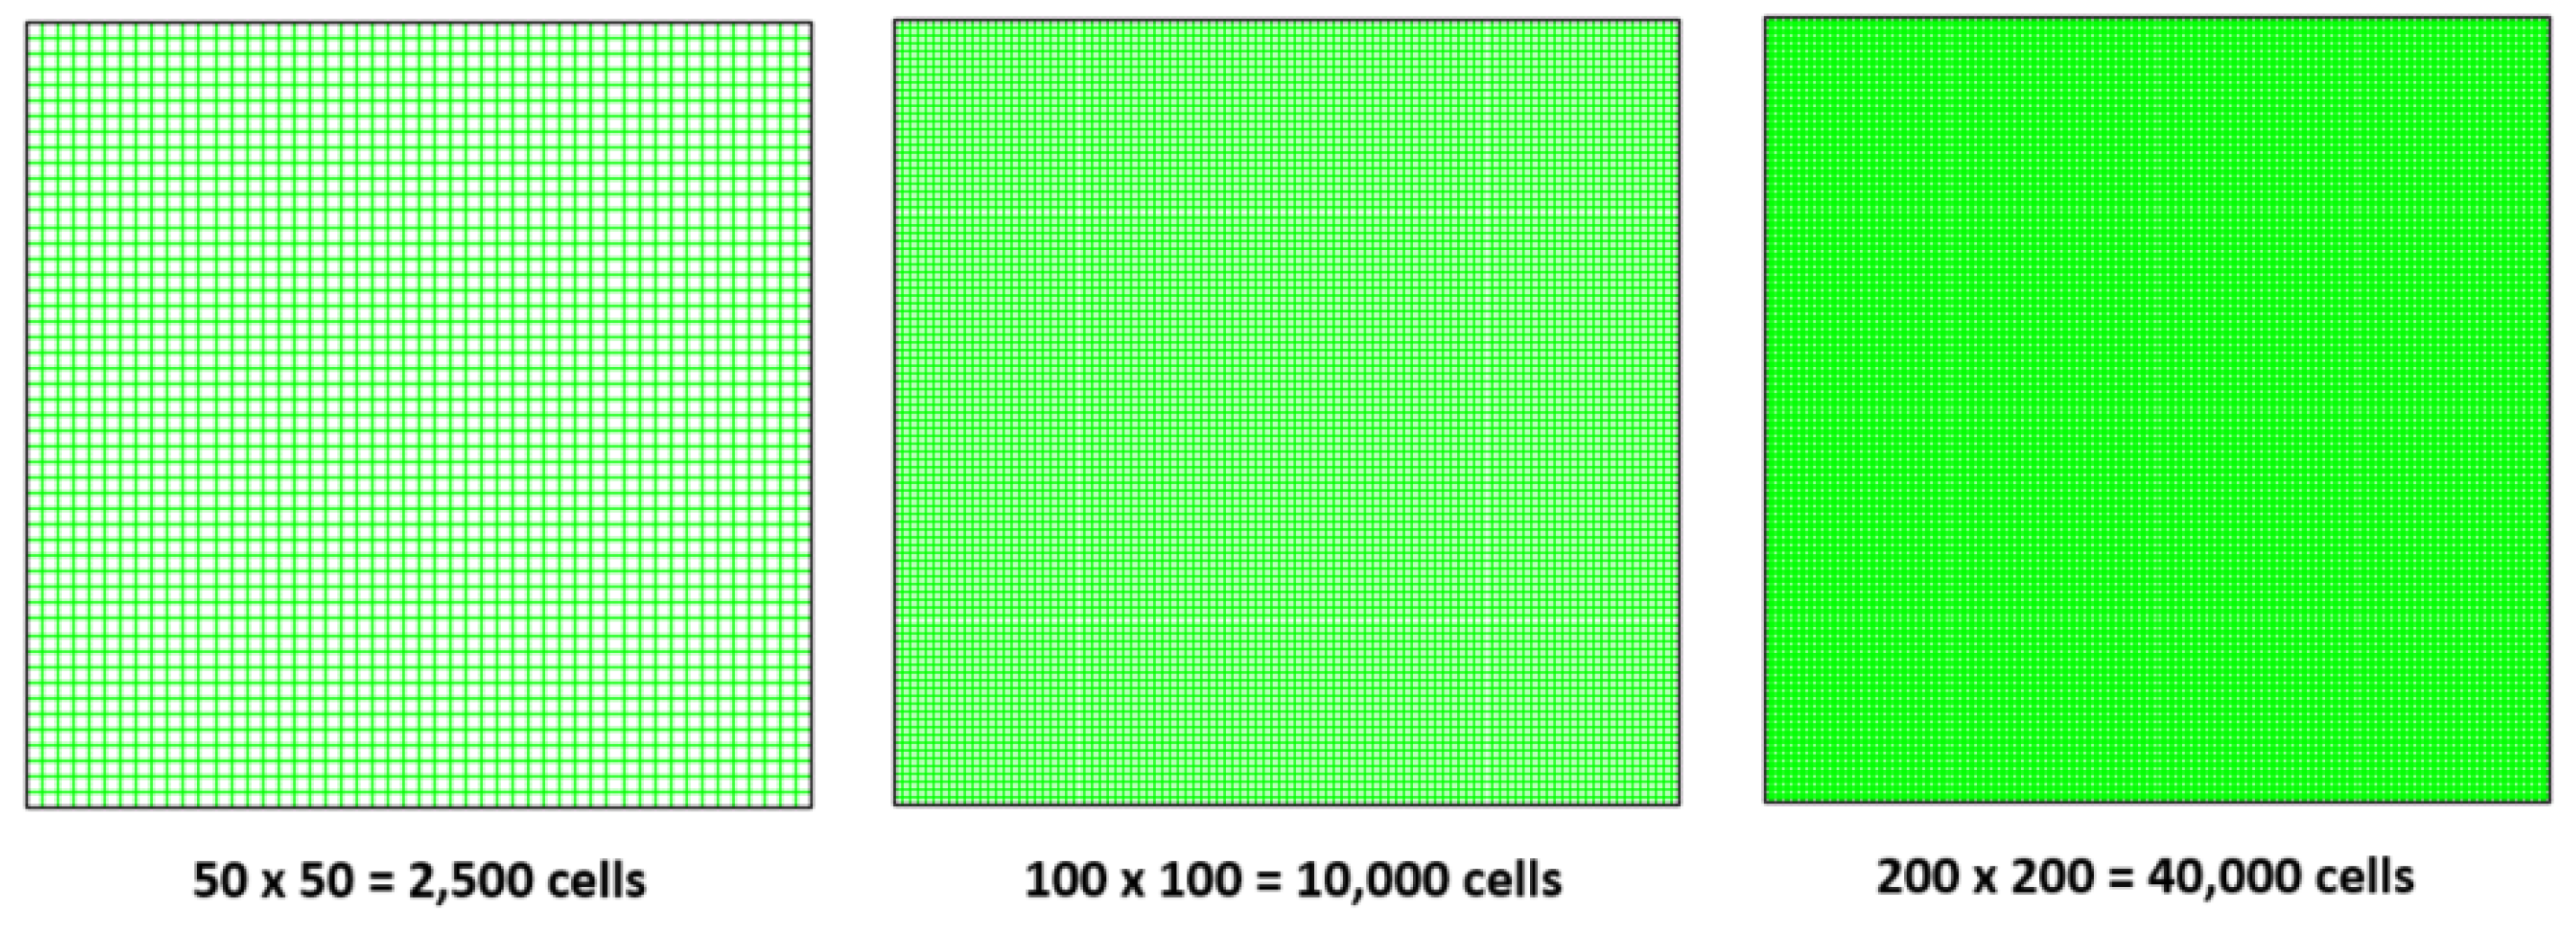
Figure 3.
Average temperature on the right-hand side over a full day for 4 days.
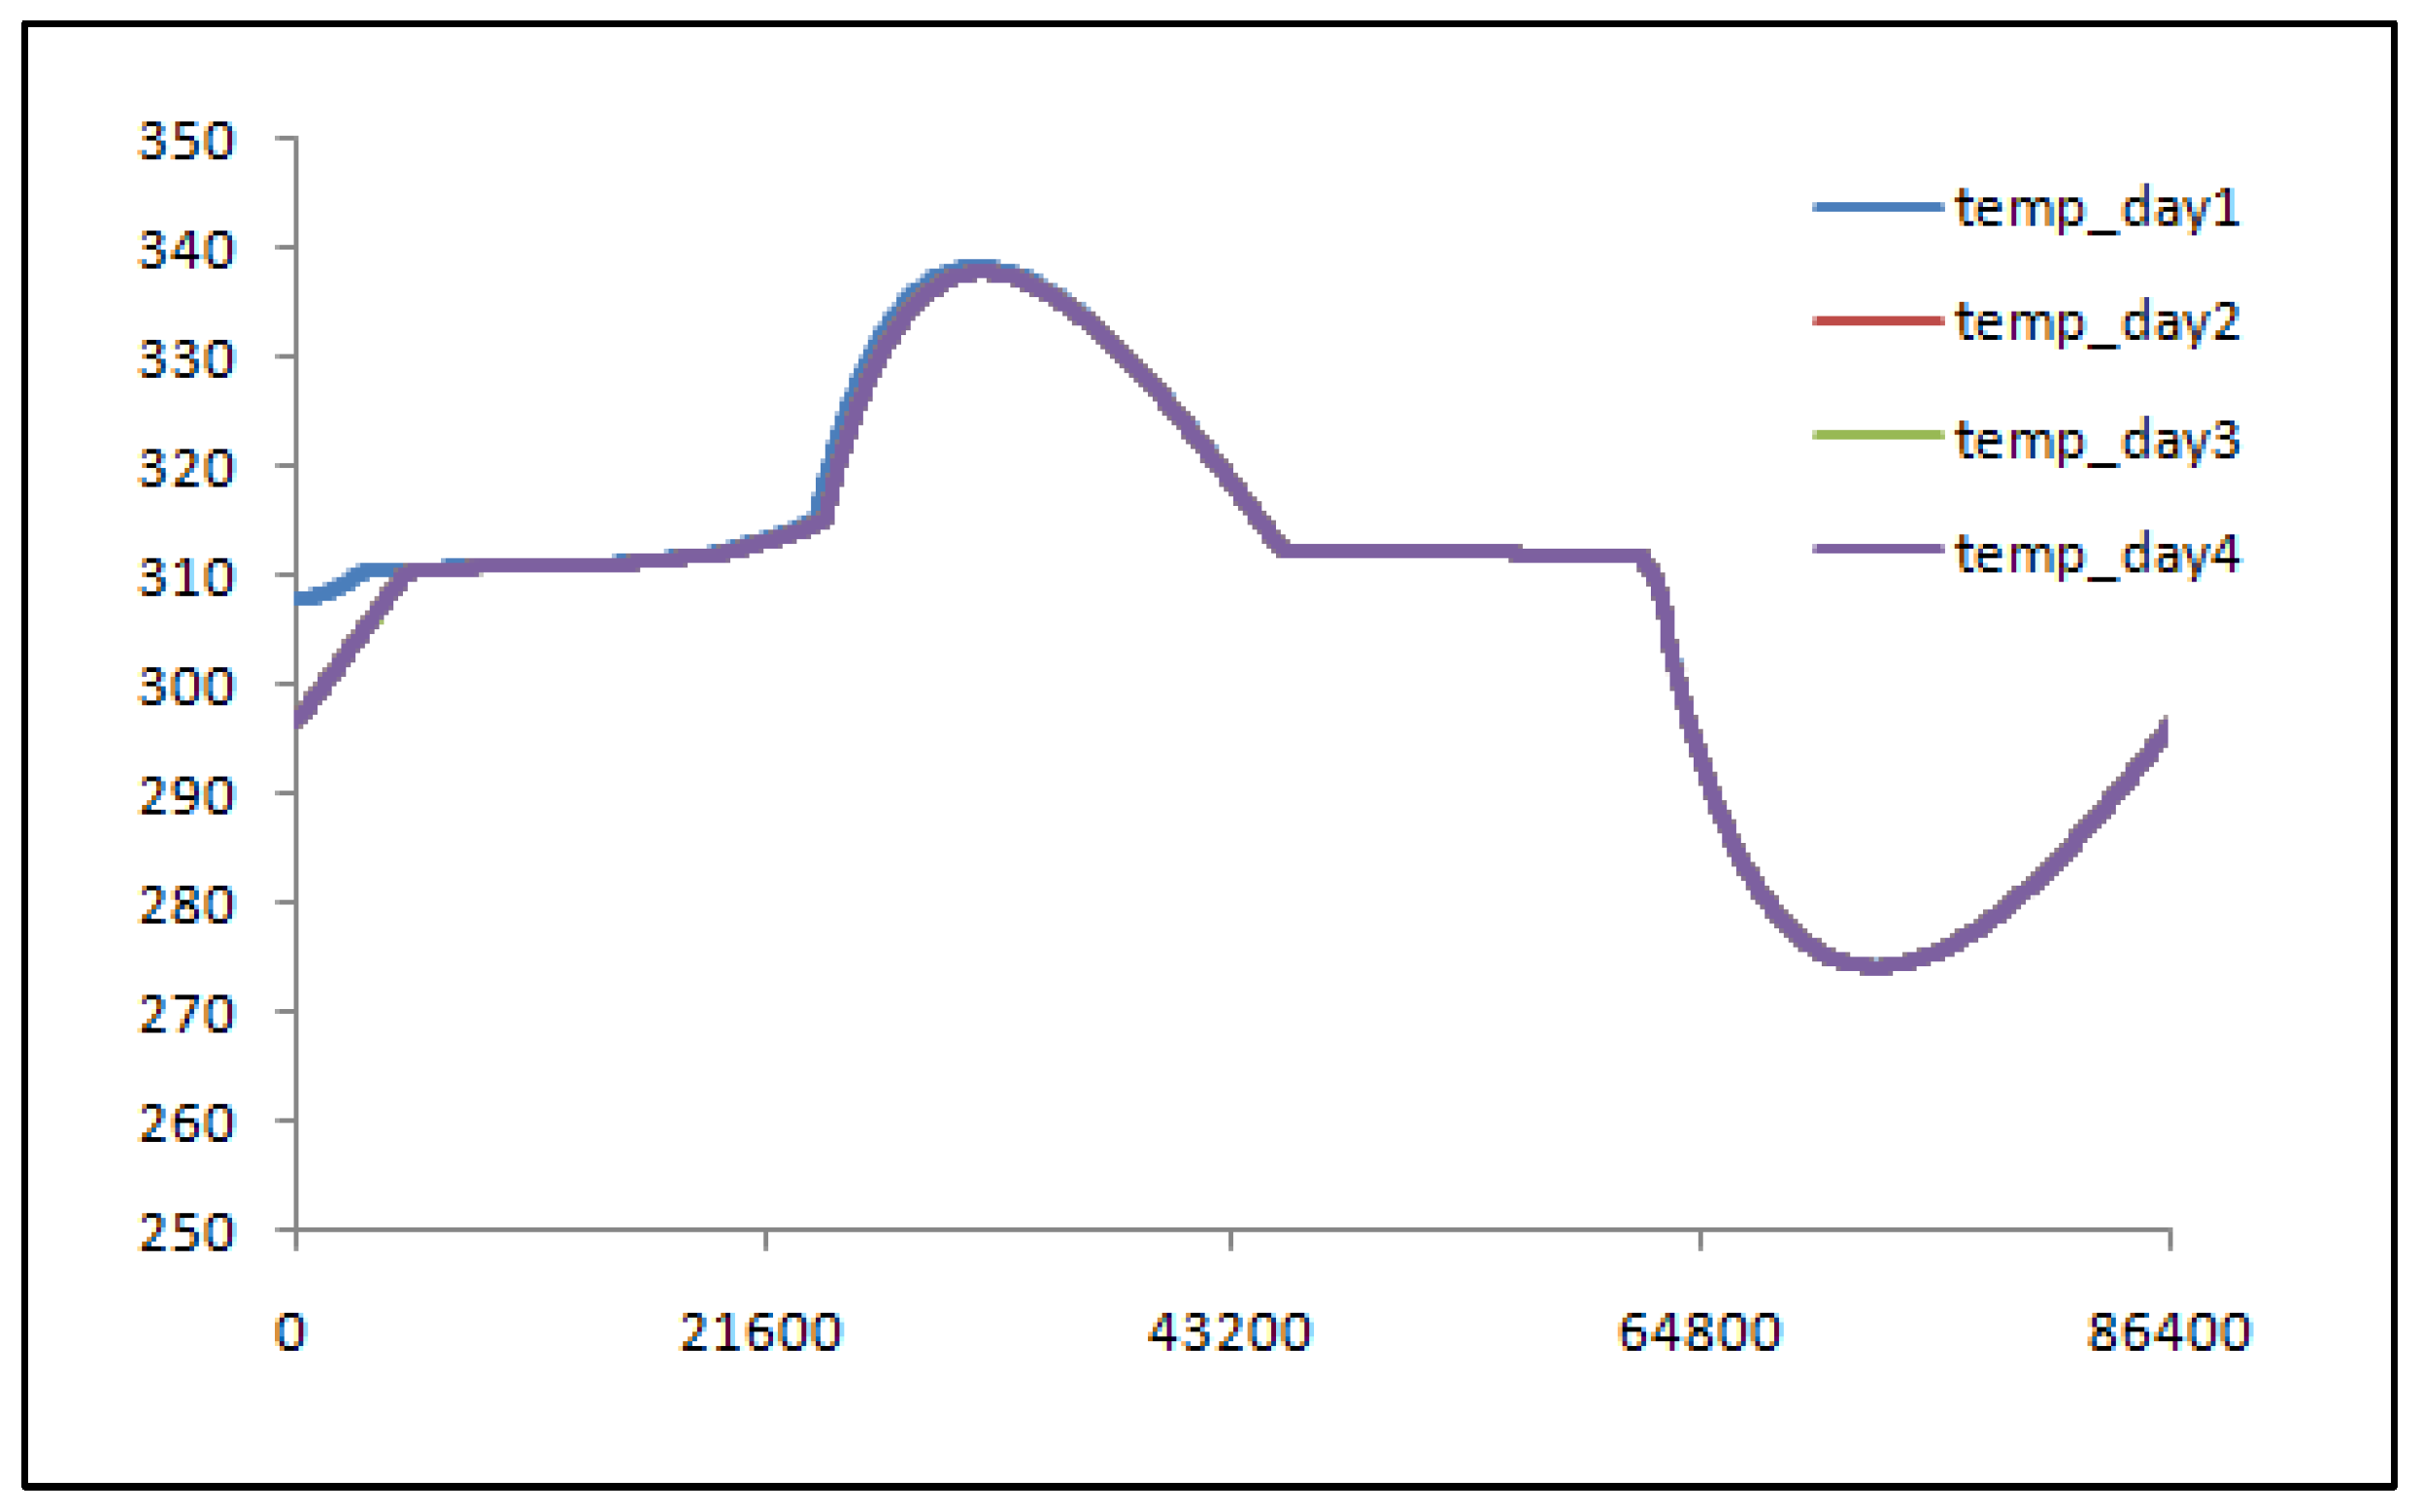
Figure 4.
Comparison between experimental and numerical results.
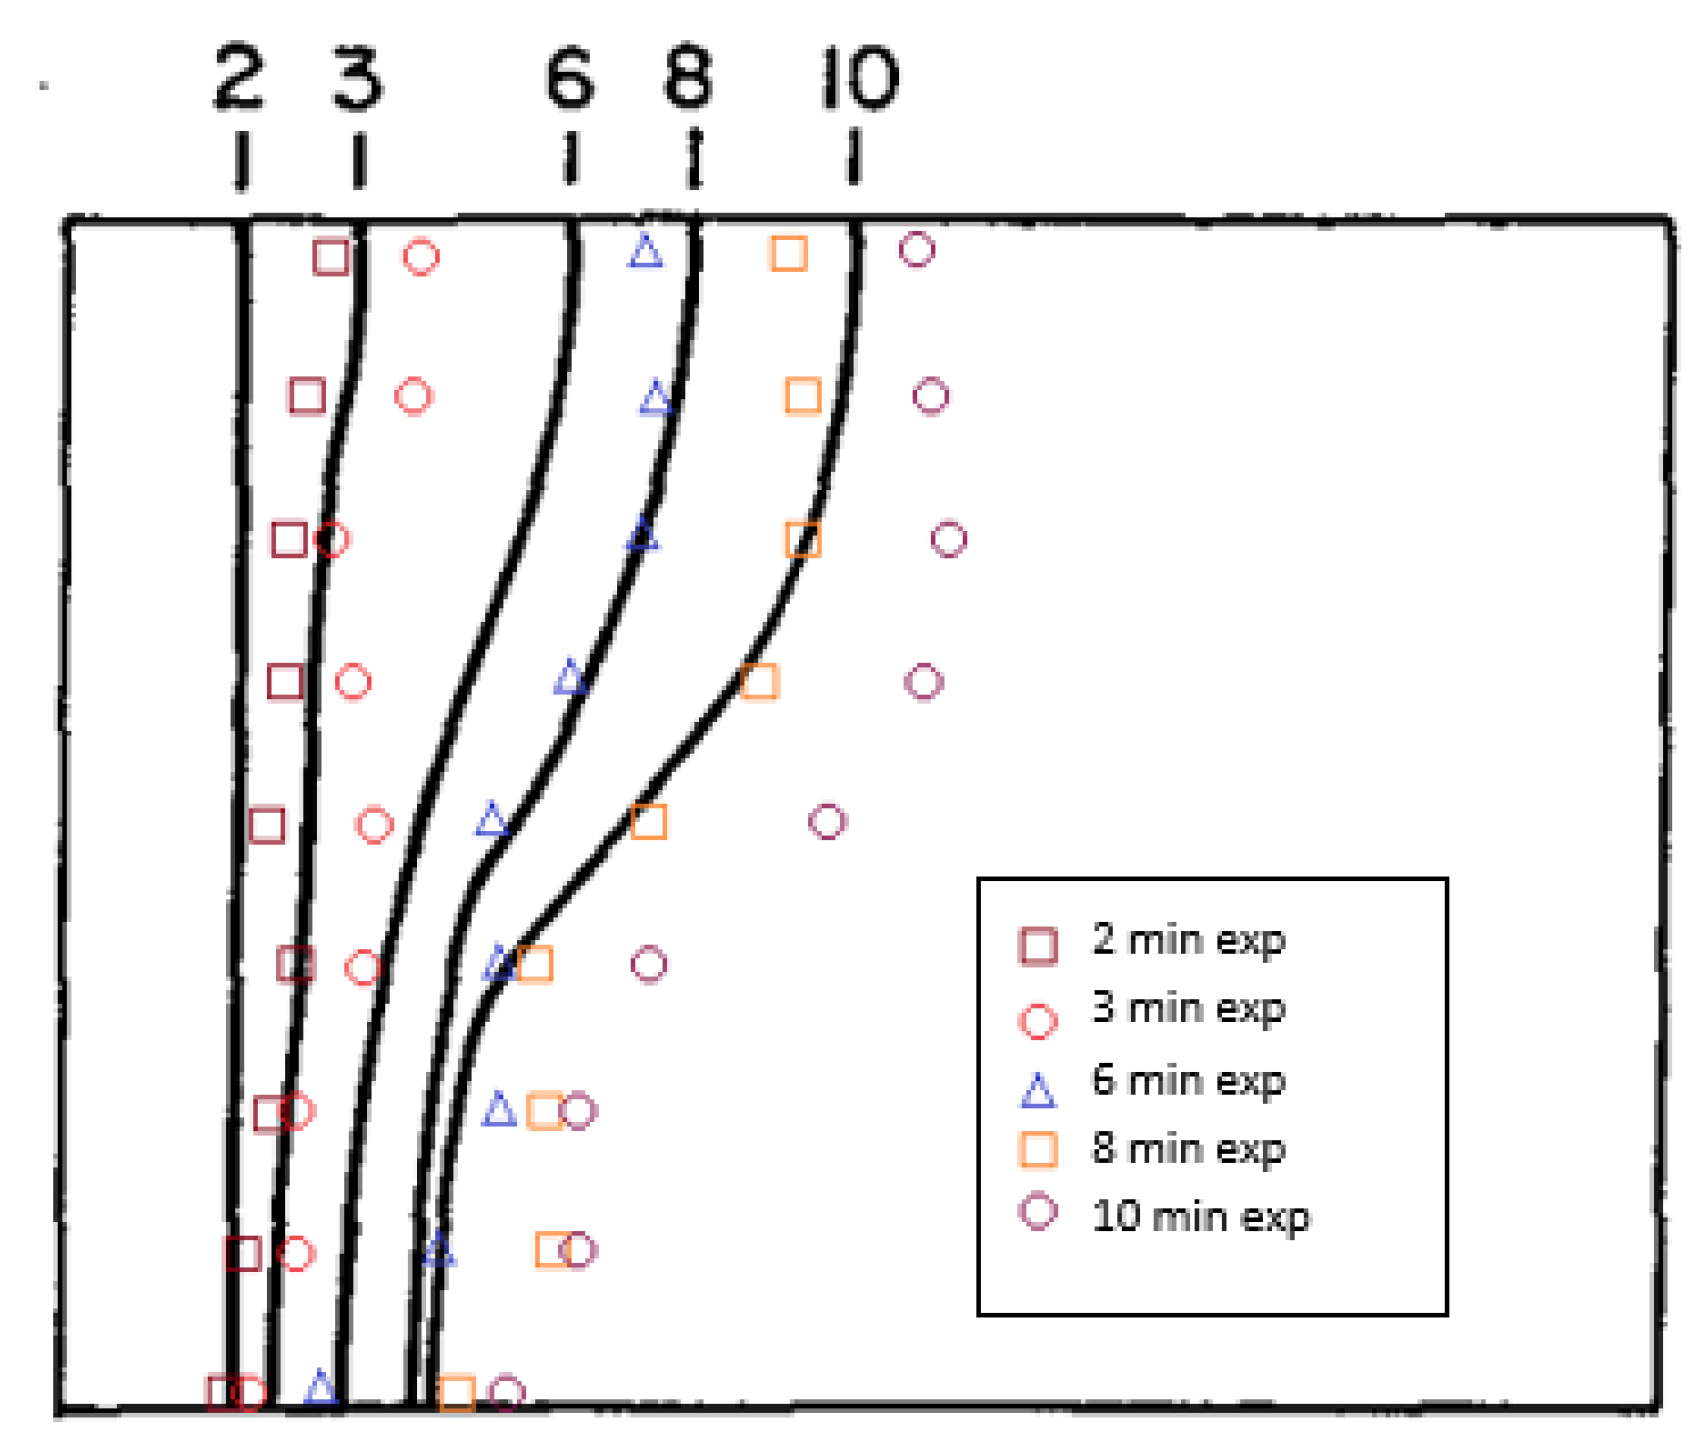
Figure 5.
Effect of PCM material on the right-side surface heat flux.
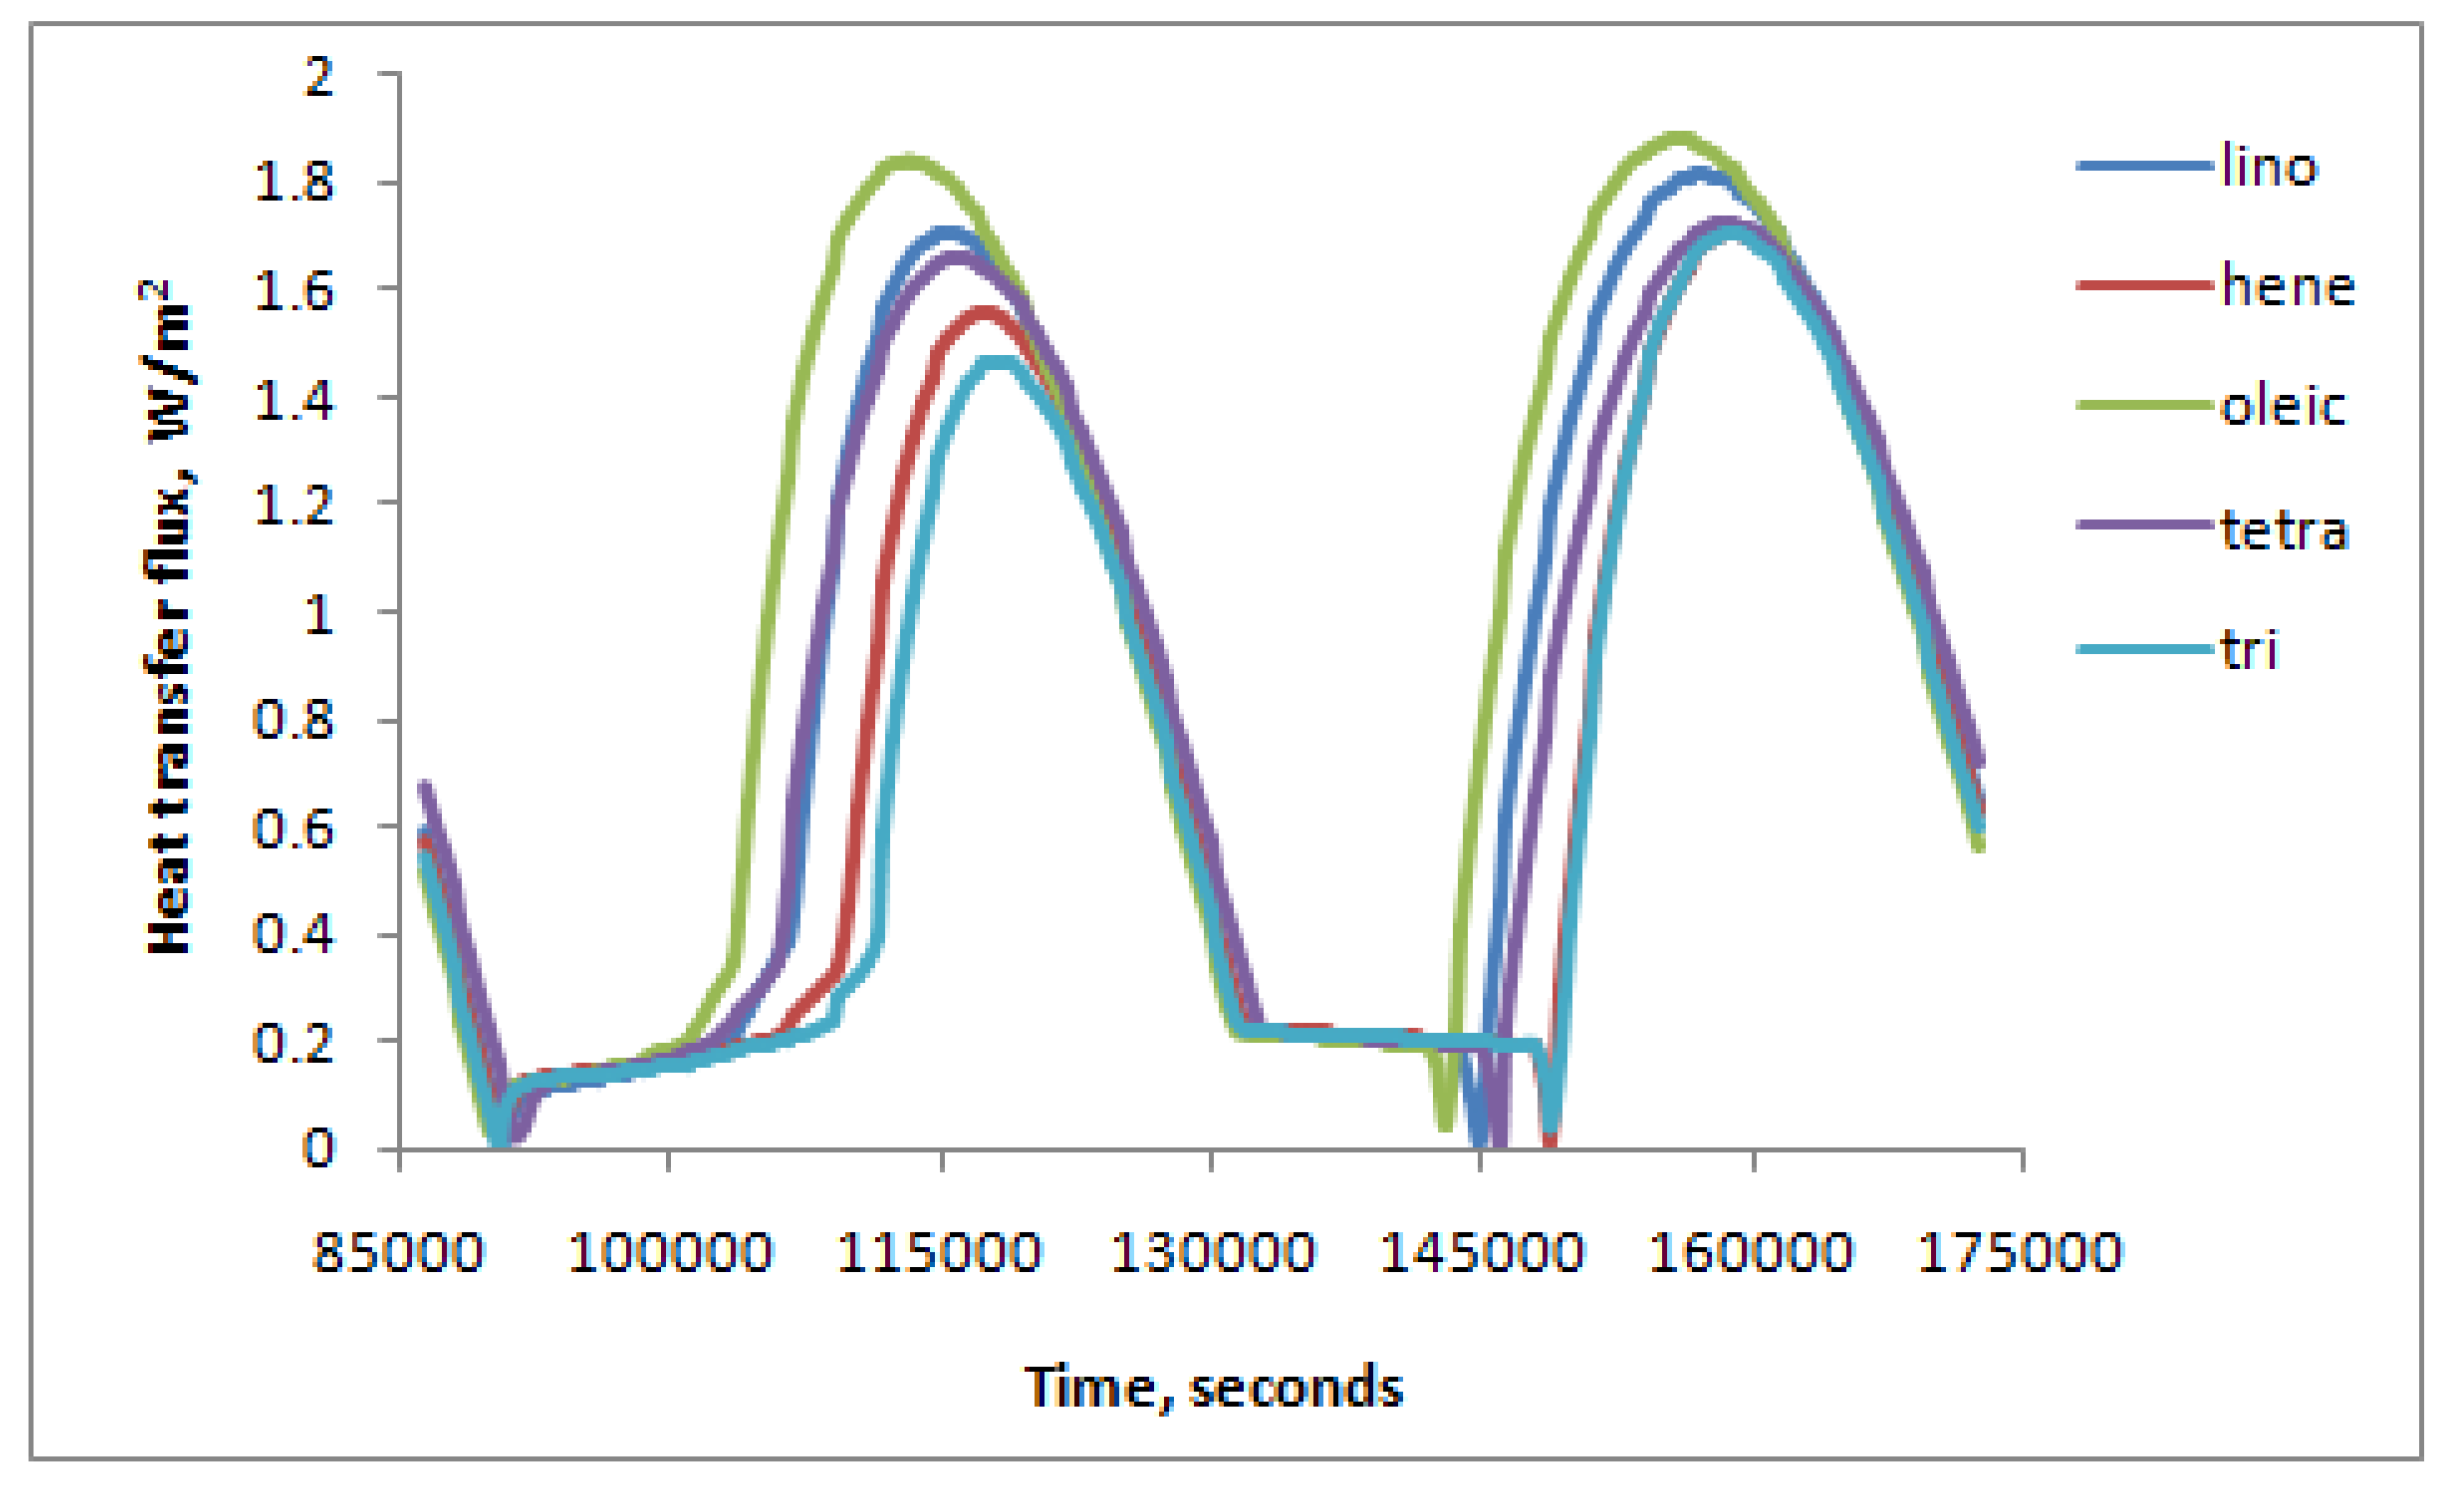
Figure 6.
Effect of PCM material on the right-side average surface temperature.
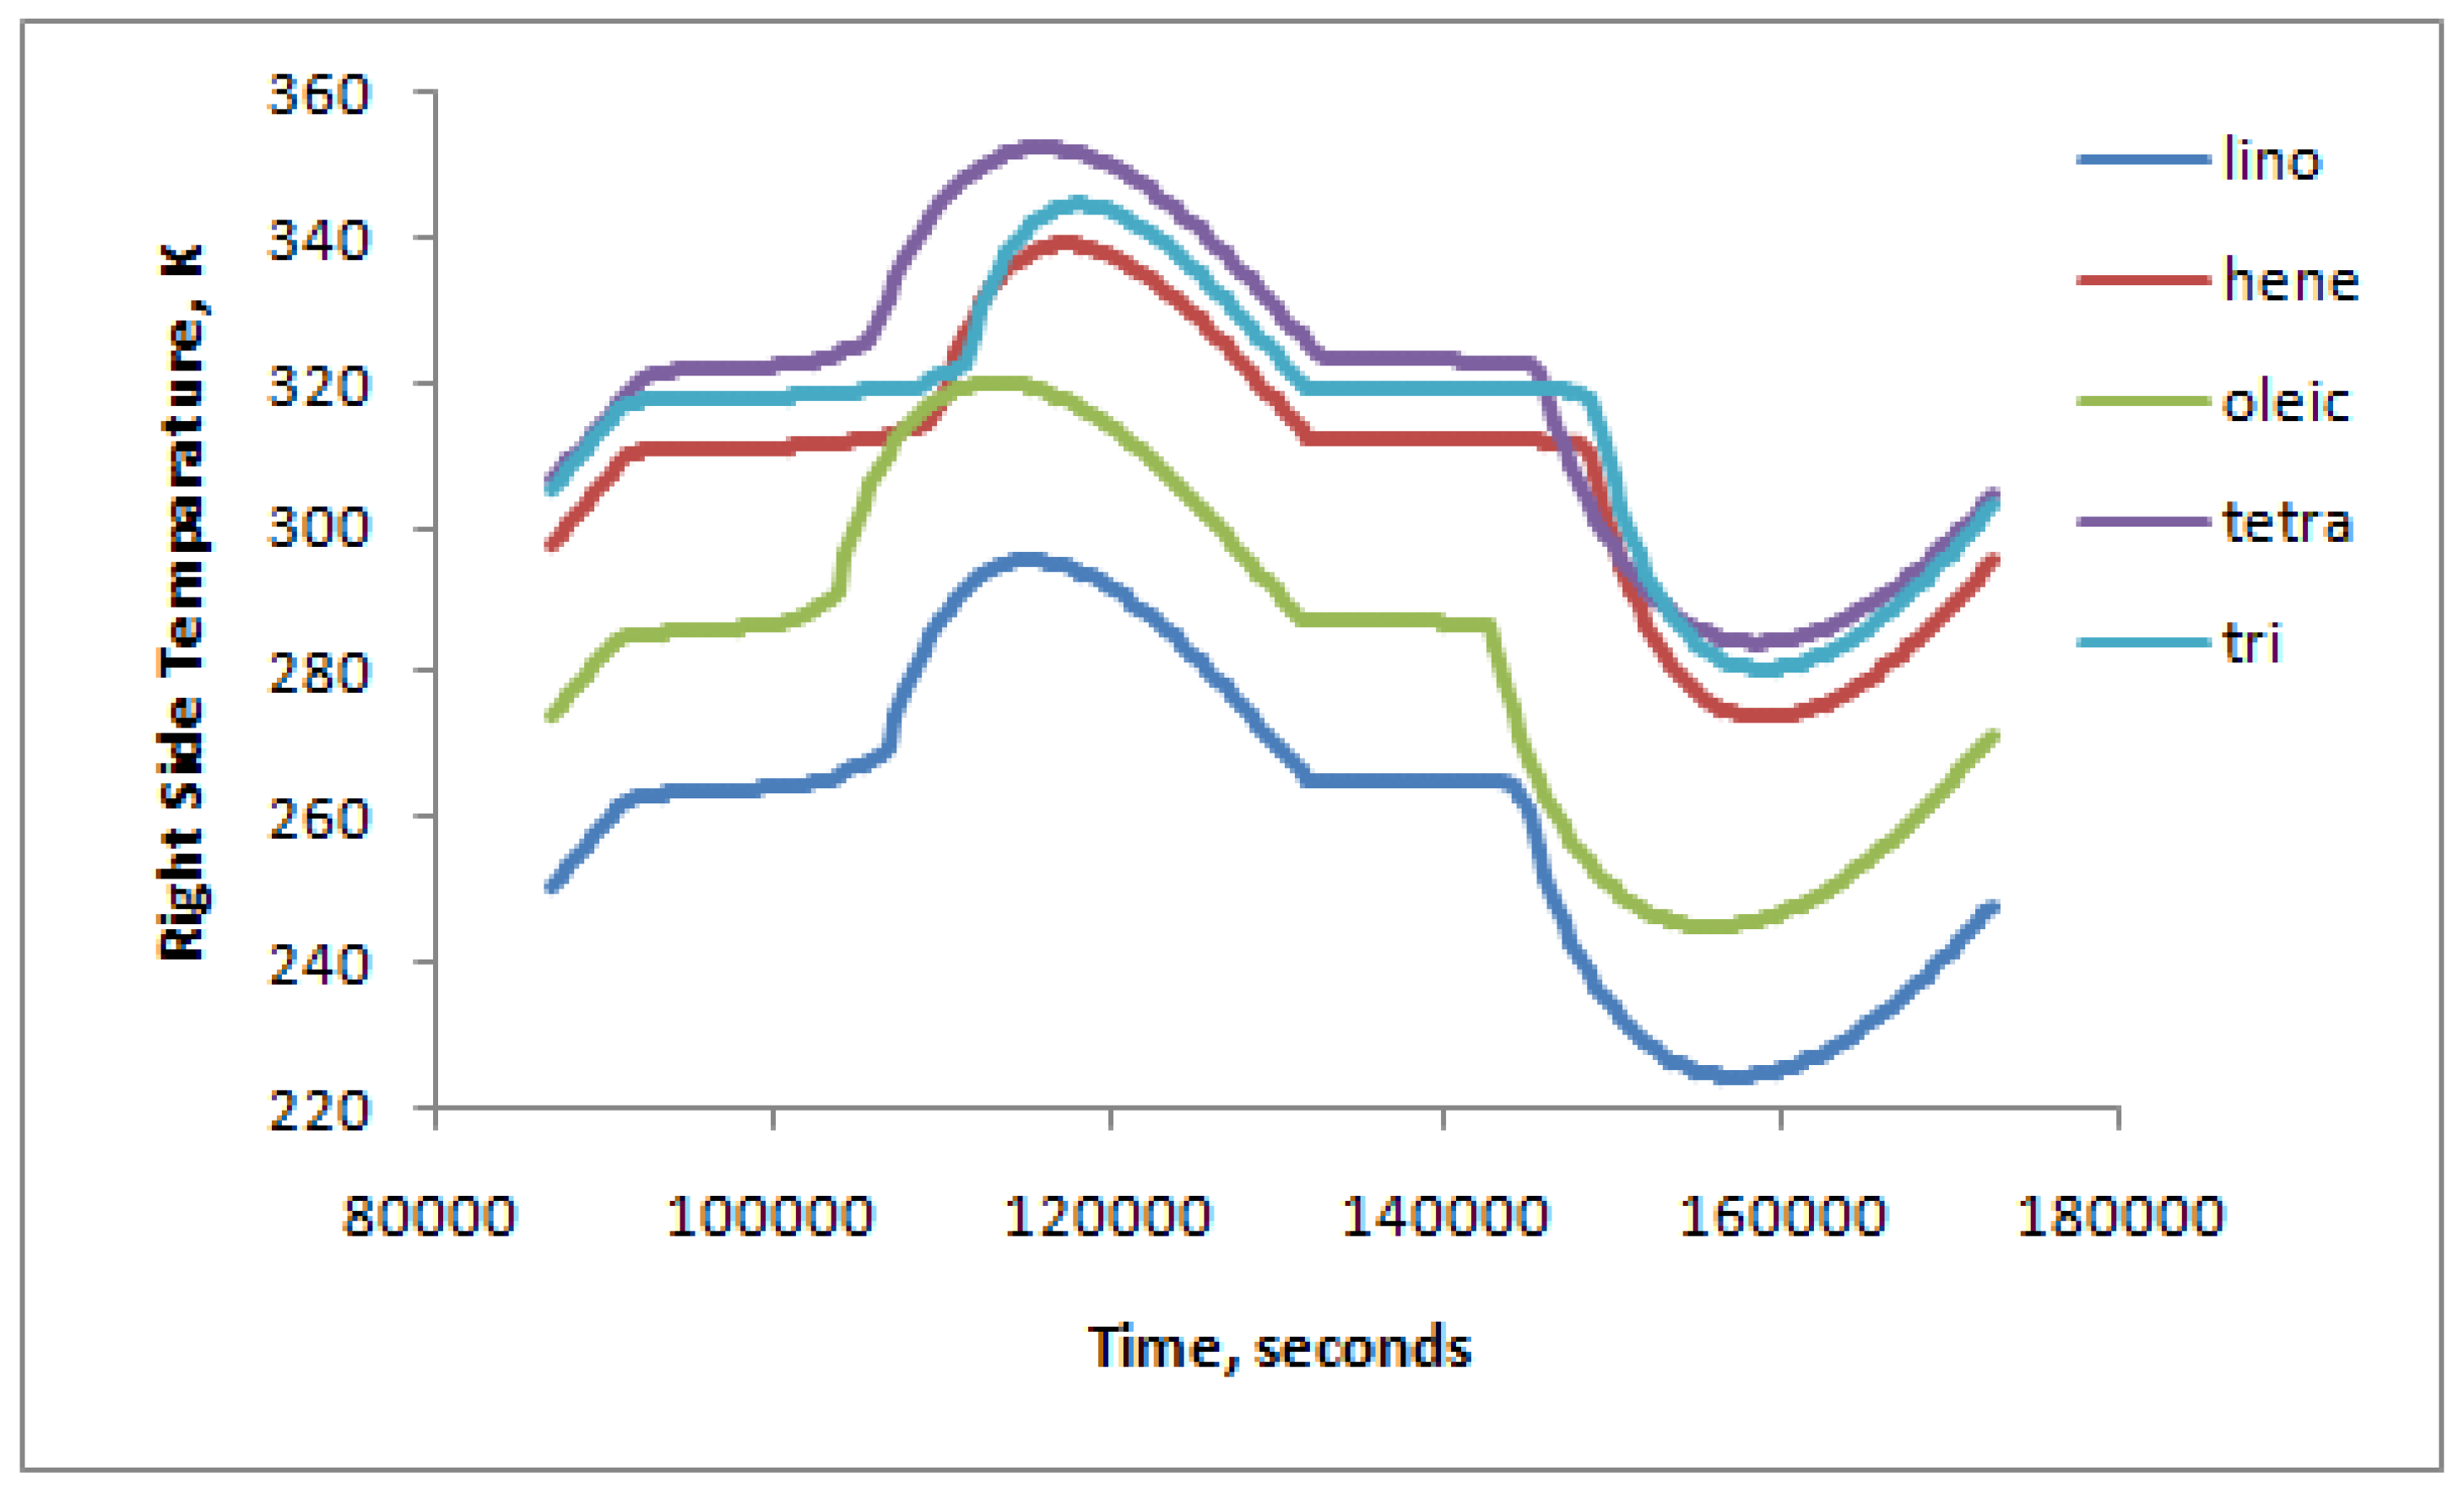
Figure 7.
Effect of heat flux gain from the left side on the right-side heat transfer flux.
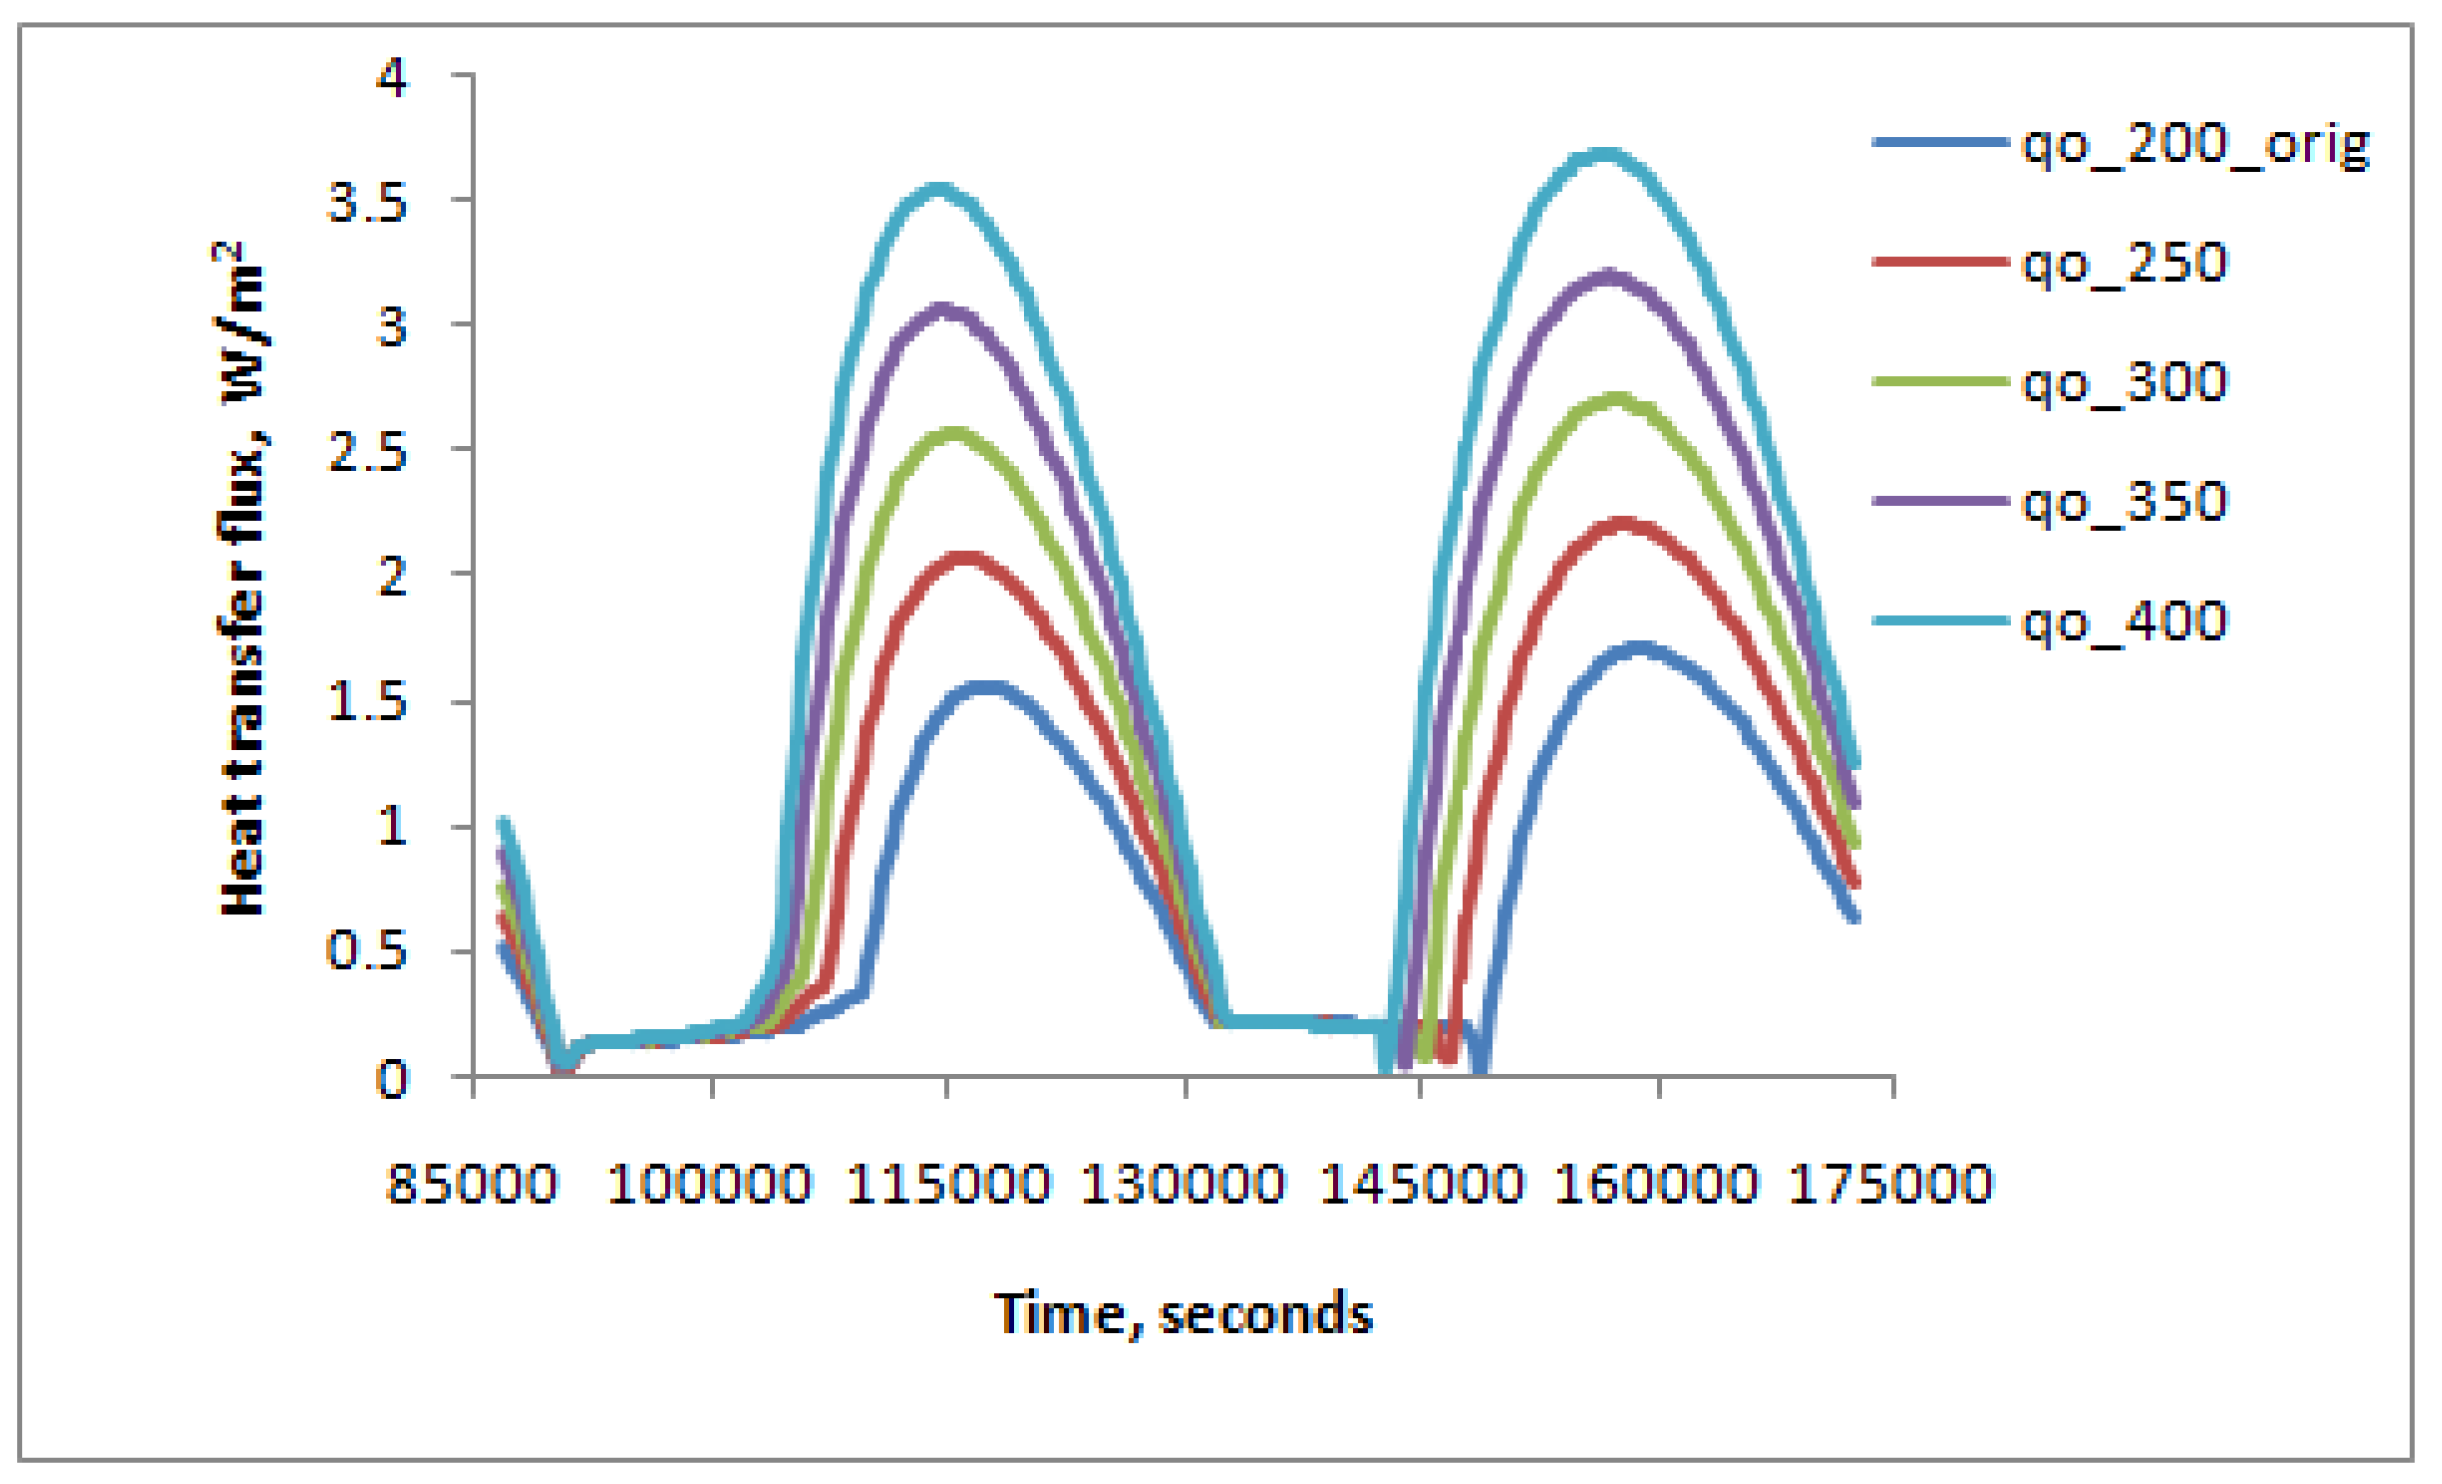
Figure 8.
Effect of heat flux gain from the left side on the right-side average surface temperature.
Figure 8.
Effect of heat flux gain from the left side on the right-side average surface temperature.
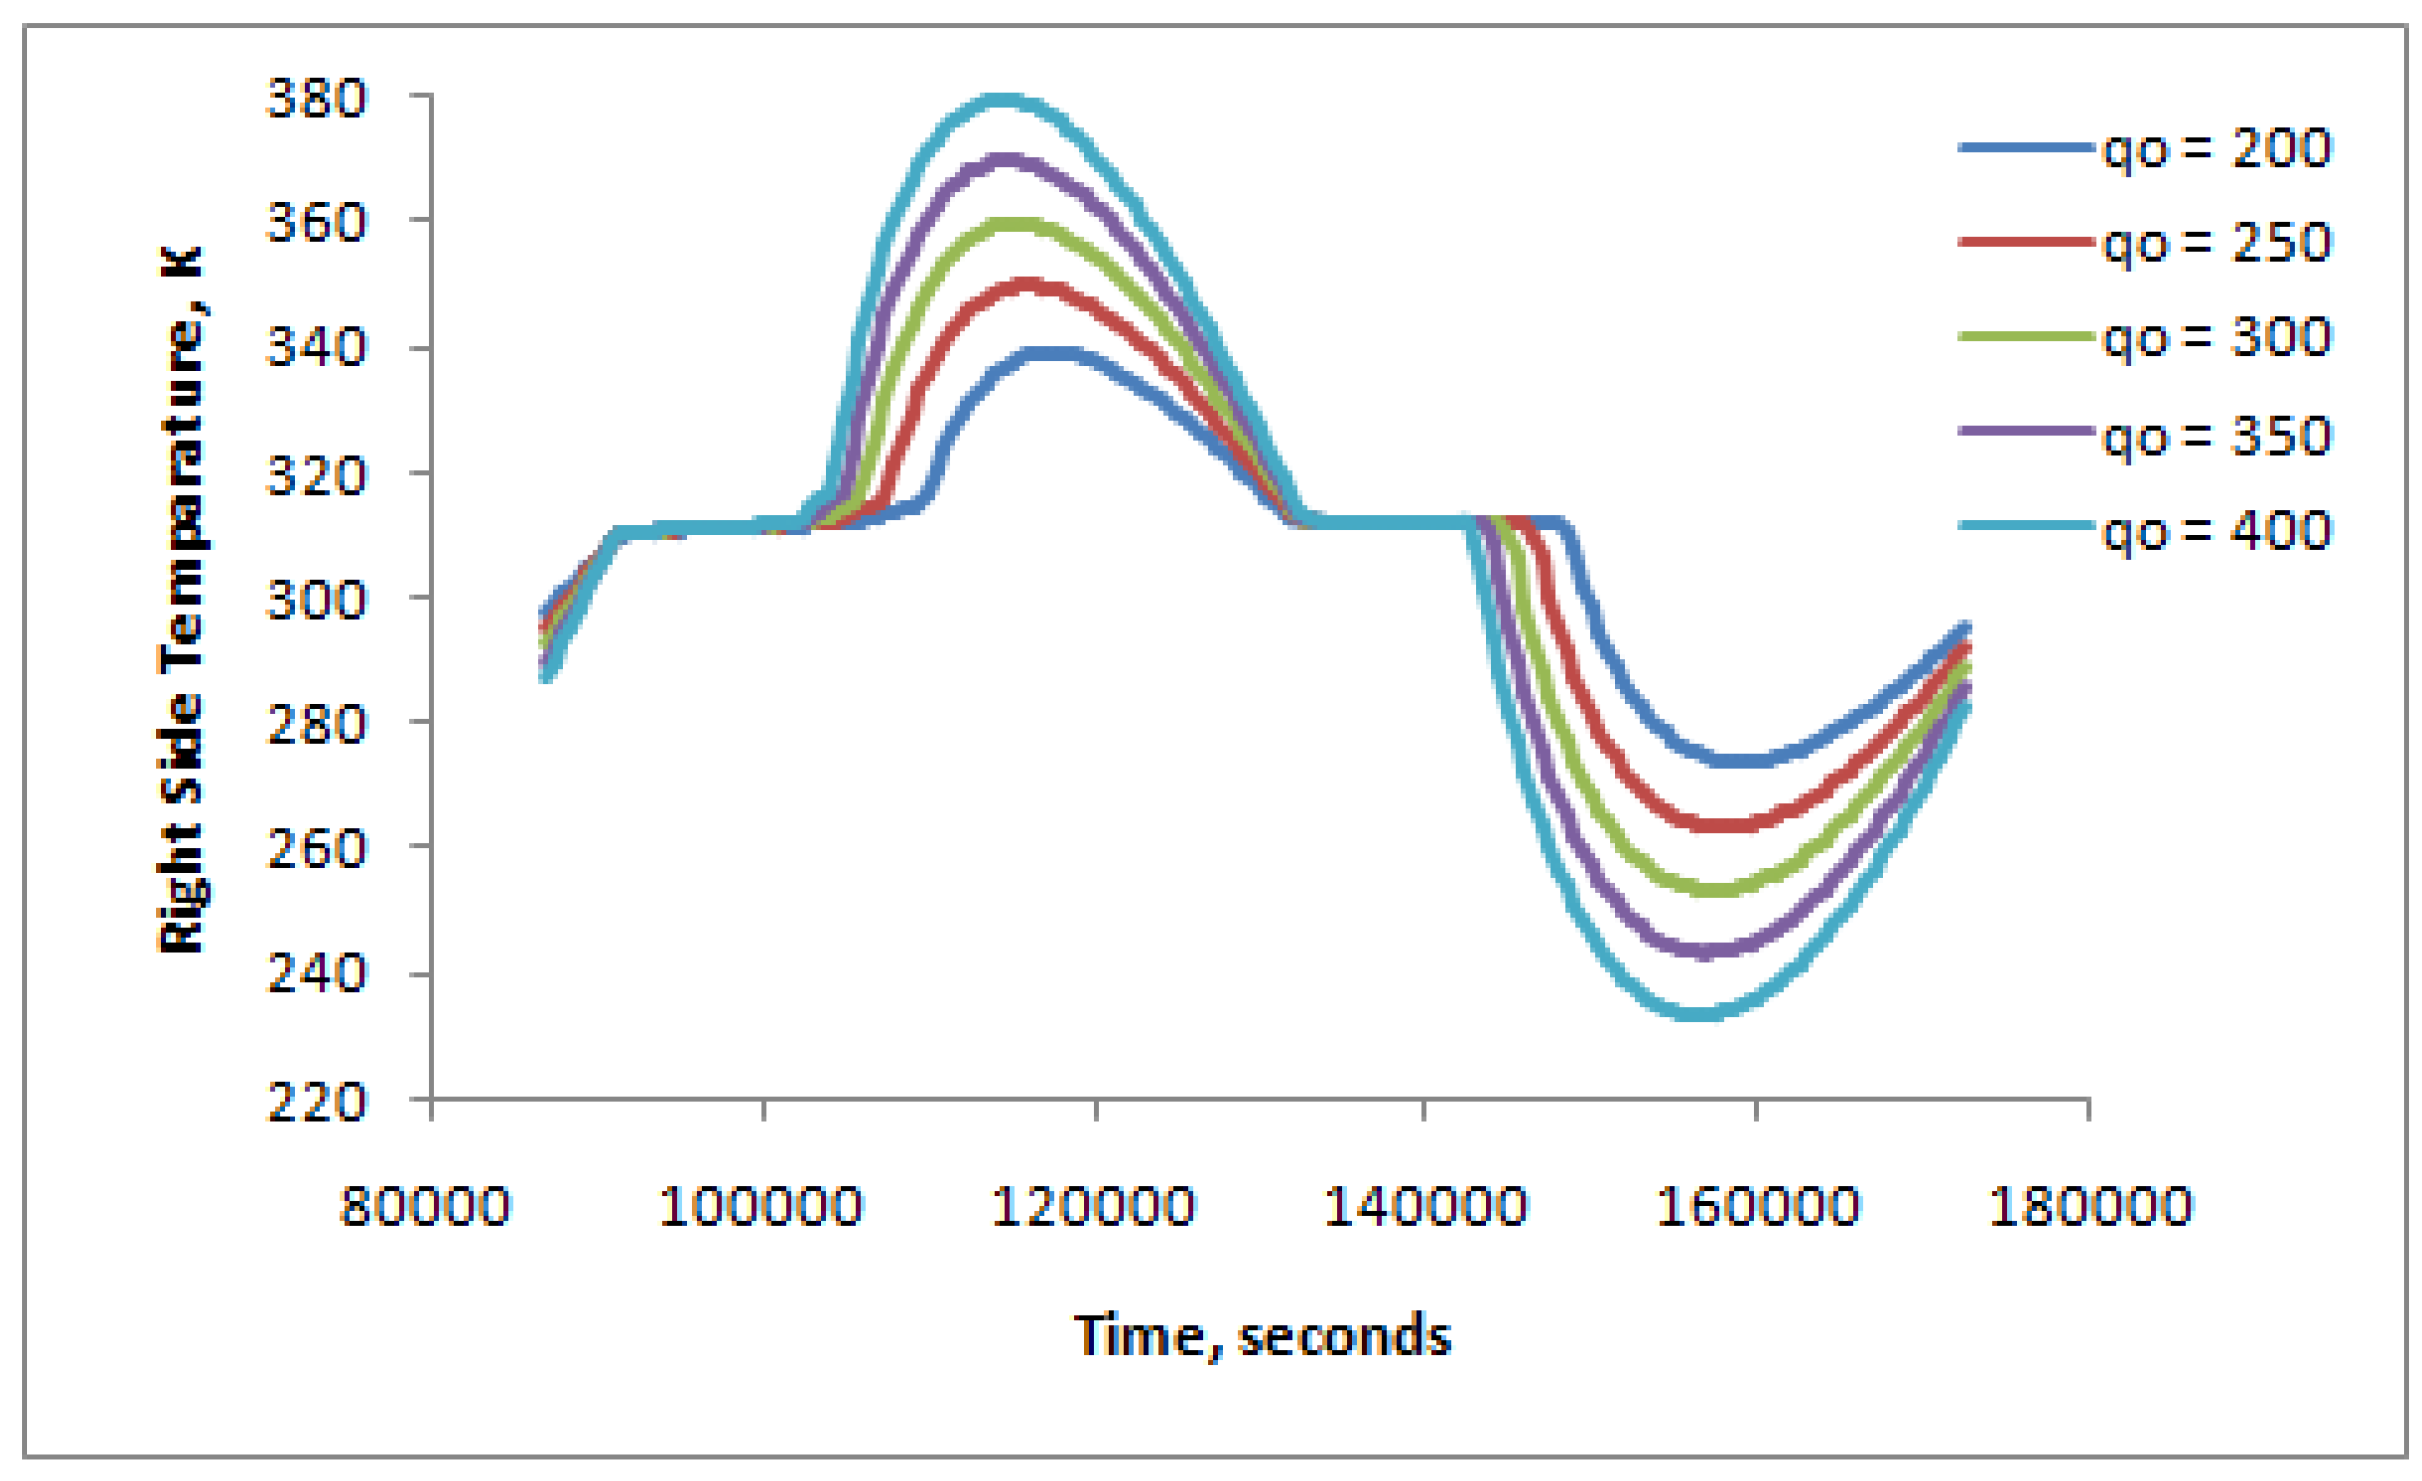
Figure 9.
Effect of daytime hours on the right-side surface heat flux over a full day.
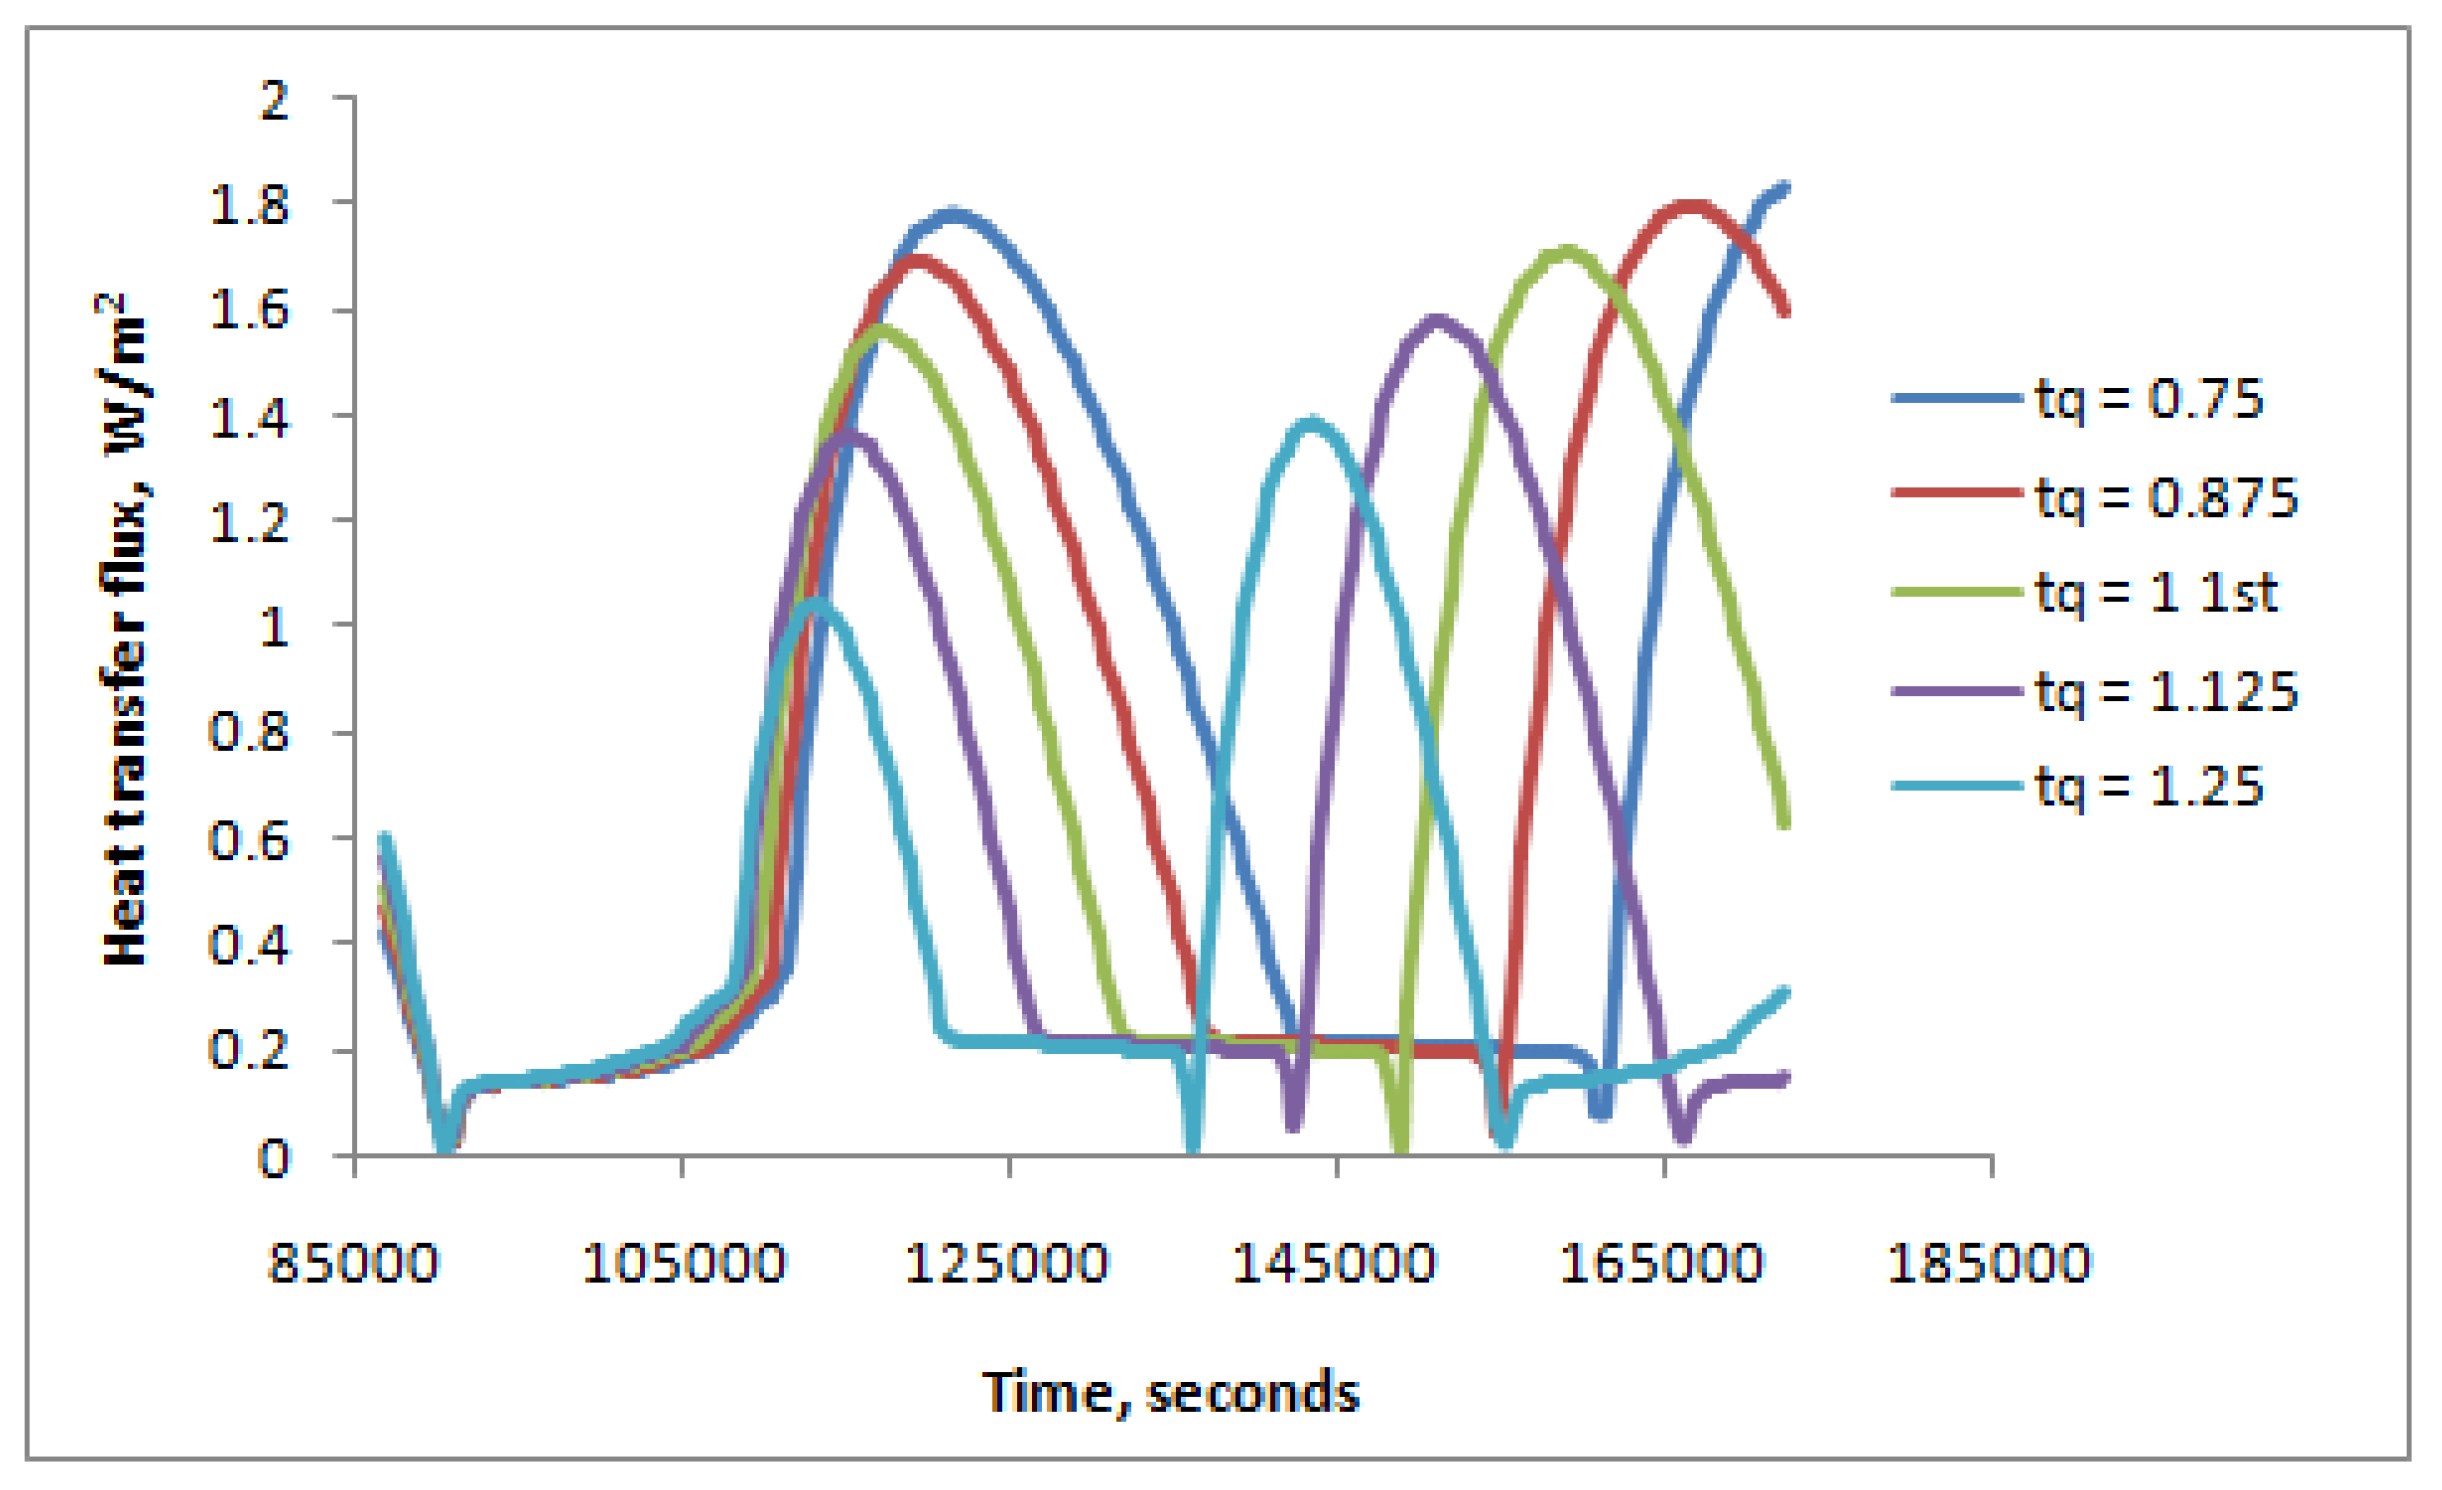
Figure 10.
Effect of daytime hours on the right-side average surface temperature over a full day.
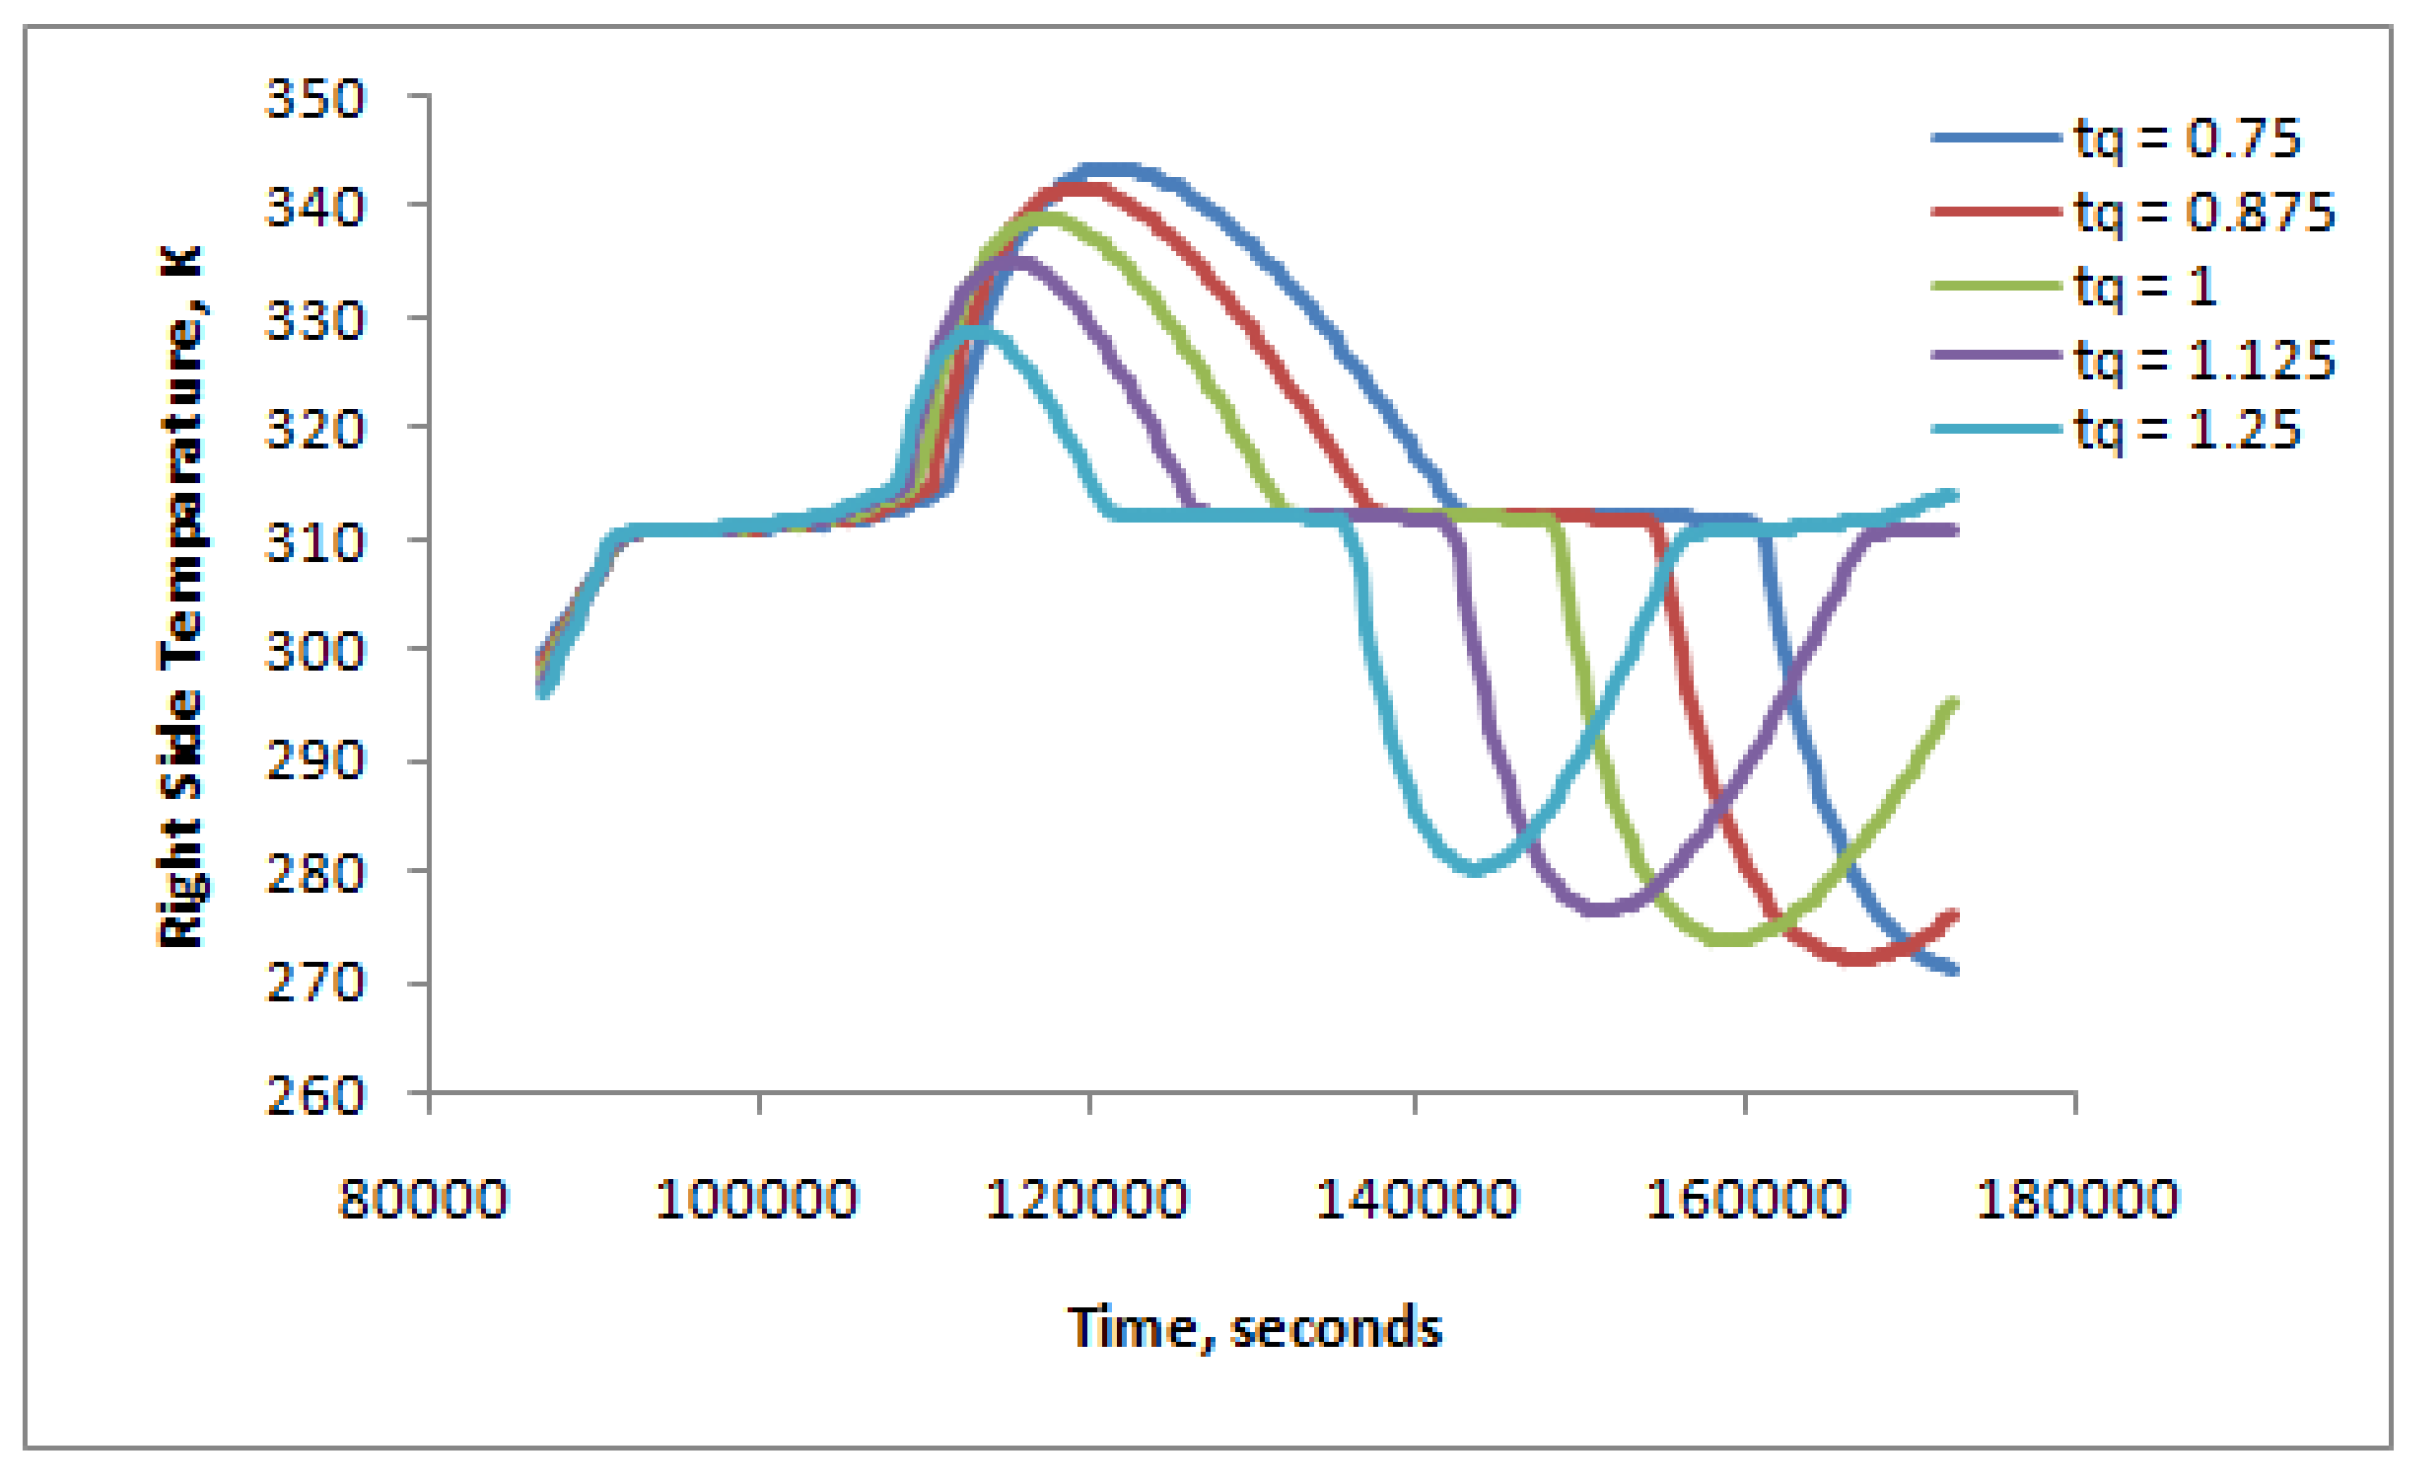

Table 1.
Heneicosane thermophysical properties.
| Property | Symbol | Value | Units |
|---|---|---|---|
| Density | ρ | 772 | kg/m3 |
| Thermal Capacity | Cp | 2,390 | J/kg.K |
| Thermal Conductivity | k | 0.145 | W/m.K |
| Dynamic Viscosity | µ | 0.008 | kg/m.s |
| thermal coefficient of expansion | β | 0.0005 | K-1 |
| Melting Heat | ΔHf | 295,000 | J/kg |
| Solidus Temperature | 311.5 | K | |
| Liquidus Temperature | 312.5 | K |
Table 2.
Error for average temperature and efficiency parameters at the right side at different grid systems.
Table 2.
Error for average temperature and efficiency parameters at the right side at different grid systems.
| First day run | Second day run | |||
| Average parameters on right side along edge | 50x50 | 100x100 | 50x50 | 100x100 |
| Temperature, Average Error % compared to 200x200 | 0.4684 % | 0.2473 % | 0.4877 % | 0.2490 % |
| Efficiency, Average Error % compared to 200x200 | 0.04651 % | 0.02765 % | 0.05795 % | 0.03083 % |
Table 3.
Error for average temperature and efficiency parameters at the right side using different time steps.
Table 3.
Error for average temperature and efficiency parameters at the right side using different time steps.
| First day run | Second day run | |||
| Average parameters on right side along edge | 10 seconds | 5 seconds | 10 seconds | 5 seconds |
| Temperature, Average Error % compared to 3 seconds | 0.3235 % | 0.04177 % | 0.3388 % | 0.05028 % |
| efficiency, Average Error % compared to 3 seconds | 0.04130 % | 0.005230 % | 0.04372 % | 0.006251 % |
Table 4.
Error for average temperature and efficiency parameters at the right side for several days of operation.
Table 4.
Error for average temperature and efficiency parameters at the right side for several days of operation.
| Error compared to 4th day results | |||
|---|---|---|---|
| Average parameters on right hand side along edge |
First day | Second day | Third day |
| Temperature, Average Error % compared to 4th day |
0.1763 % | 0.01080 % | 0.001704 % |
| Heat transfer rate, Average Error % compared to 4th day |
26.58 % | 0.1007 % | 0.003386 % |
| Efficiency, Average Error % compared to 4th day |
0.0009194 % | 0.00006136 % | 0.00000181 % |
Table 5.
Gallium thermophysical properties.
| Property | Symbol | Value | Units |
|---|---|---|---|
| Liquid density, ρ | ρ | 6093 | Kg/m3 |
| Mass-based heat capacity, Cp | Cp | 381.5 | J/kg.K |
| Thermal conductivity, k | k | 32.0 | W/m.K |
| Dynamic viscosity, μ | μ | 1.81e-3 | Pa.s |
| Thermal coefficient of expansion, β | β | 1.2e-4 | K-1 |
| Latent heat of fusion, ΔHf | ΔHf | 80.16 | kJ/kg |
| Melting temperature, Tm | 302.93 | K |
| PCM material | Tm (K) | ρ (kg/m3) | Cp (kJ/kg.K) | K (W/m.K) | ΔHf (kJ/kg) |
| Heneicosane | 312 | 772 | 2.39 | 0.145 | 295 |
| Tricosane | 319 | 778 | 2.18 | 0.124 | 303 |
| Tetracosane | 323 | 774 | 2.92 | 0.137 | 208 |
| Oleic Acid | 287 | 871 | 1.74 | 0.103 | 140 |
| Linoleic Acid | 265 | 902 | 1.92 | 0.087 | 170 |
Disclaimer/Publisher’s Note: The statements, opinions and data contained in all publications are solely those of the individual author(s) and contributor(s) and not of MDPI and/or the editor(s). MDPI and/or the editor(s) disclaim responsibility for any injury to people or property resulting from any ideas, methods, instructions or products referred to in the content. |
© 2025 by the author. Licensee MDPI, Basel, Switzerland. This article is an open access article distributed under the terms and conditions of the Creative Commons Attribution (CC BY) license (http://creativecommons.org/licenses/by/4.0/).
Copyright: This open access article is published under a Creative Commons CC BY 4.0 license, which permit the free download, distribution, and reuse, provided that the author and preprint are cited in any reuse.


