Submitted:
02 August 2025
Posted:
04 August 2025
You are already at the latest version
Abstract
Pancreatic ductal adenocarcinoma (PDAC) is an aggressive malignancy characterized by poor prognosis and limited response to gemcitabine, the standard first-line chemotherapy. One major contributor to chemoresistance is autophagy, a process frequently upregulated in PDAC. In this study, we examined the ability of type I interferons (IFNα2b and IFNβ1a) to modulate autophagy and disturb tumor cell resistance to gemcitabine. PDAC cells were treated with increasing concentrations of IFNα2b or IFNβ1a, and cell proliferation was assessed by [³H]-thymidine incorporation. Apoptosis was evaluated by TUNEL staining following treatments with interferons and/or gemcitabine. Autophagy was analyzed by Western blot for LC3B and by quantifying autophagic flux using mCher-ry-EGFP-LC3B-transfected cells in the presence or absence of lysosomal inhibitors. We found that IFNα2b promoted autophagic flux and decreased gemcitabine-induced apop-tosis, indicating a cytoprotective role. In contrast, IFNβ1a inhibited autophagosome for-mation and significantly enhanced apoptosis in gemcitabine-treated cells. Our findings highlight the contrasting roles of IFNα2b and IFNβ1a in autophagy regulation and sug-gest that IFNβ1a, by inhibiting protective autophagy, may sensitize PDAC cells to chemo-therapy. This positions IFNβ1a as a promising adjuvant to overcome chemoresistance in PDAC treatment.
Keywords:
autophagy
; pancreatic cancer
; chemoresistance
; gemcitabine
; IFNα2b
; IFNβ1a
1. Introduction
Pancreatic ductal adenocarcinoma (PDAC) is one of the leading causes of cancer-related death [1]. The prognosis of patients with pancreatic cancer is particularly poor even after curative resection. Tumor recurrence occurs in more than half of patients, and the estimated 5-year survival rate is not greater than 20% [2,3]. The standard chemotherapeutic agent used in pancreatic cancer therapy is gemcitabine (2′-2′-difluorodeoxycytidine), a cell cycle-specific inhibitor that alters DNA synthesis and ribonucleotide reductase activity [4]. Fewer than 20% of patients respond to gemcitabine, suggesting that its efficacy remains unsatisfactory [5].
Type I interferons have been extensively studied for their antiviral properties [6], but in the past decade, they have gained importance owing to their immunomodulatory and antitumoral functions [7]. The type I IFN family consists of IFN-α, IFN-β, IFN-ε, IFN-κ, IFN-ω, and IFN-τ. However, IFN-α and IFN-β are the most studied [8]. All of these proteins bind to the type I IFN receptor complex (IFNR), which is composed of two chains (IFNAR-1 and IFNAR-2), and activate several signaling pathways. Most of the effects of IFN-I are accomplished through activation of the JAK/STAT pathway [9,10,11]. However, evidence indicates that IFN-I activates other signaling cascades, such as the p38 mitogen-activated protein kinase (MAPK) pathway [12], the phosphatidylinositol 3-kinase (PI3K)-AKT pathway [13], and the mammalian target of rapamycin complex 1 (mTORC1) and mTORC2 signaling cascades [14,15]. It has been proven that IFNα2b has antitumor properties when combined with other chemotherapeutic agents for treating PDAC and other malignant neoplasms [16,17,18]. The clinical effect of IFNα-based adjuvant chemoradiotherapy for patients with resectable PDAC has increased the 5-year survival rate to 55% [19]. The clinical improvement in patients with PDAC after treatment with IFNβ remains undefined. However, a growth inhibitory effect of IFN-β was observed in vitro when this cytokine was combined with gemcitabine. Similar to the effects of the combination of IFNα2b and gemcitabine, the combination of IFNβ and gemcitabine has been shown to exert a cytostatic effect but fails to induce cell death [20].
Autophagy is a highly conserved process that degrades intracellular material, such as organelles and misfolded proteins, through the lysosomal pathway [21]. There are three types of autophagy: microautophagy, chaperone-mediated autophagy, and macroautophagy (hereafter referred to as autophagy) [22]. In most cells, low basal levels of autophagy are critical for maintaining cellular homeostasis, defense against intracellular pathogens, and class II MHC antigen presentation [23]. The level of autophagy increases under various stress conditions, including starvation, genomic and endoplasmic reticulum stress, and hypoxia. The effects of autophagy on pancreatic carcinogenesis and progression differ depending on the stage and context. In the early stage, autophagy hinders the development of preneoplastic lesions, whereas in the progression stage, autophagy promotes tumor growth. This dual role of autophagy makes it a complex therapeutic target [24,25,26]. Pancreatic tumors and cancer cell lines exhibit elevated levels of autophagy under basal conditions, as evidenced by increased expression of LC3B (a membrane-associated marker for all stages of autophagy) and an increased number of autophagosomes per cell [4,27]. Therefore, autophagy is a survival mechanism when a pancreatic tumor is already established [22]. Substantial evidence has demonstrated that cancer chemotherapeutic agents as well as radiation can promote a cytoprotective form of autophagy in tumor cells. This cytoprotective effect becomes evident after the exposure of cells to pharmacologic autophagy inhibitors, such as chloroquine, bafilomycin, 3-methyladenine, or ammonium chloride, or through the genetic silencing or knockdown of autophagy-associated genes, such as Beclin, Atg 5, 7, or 12. These approaches increase tumor cell sensitivity to autophagy-inducing stimuli, usually via the activation of apoptosis [4,28,29].
mTORC1 is a key regulator of autophagy, which connects nutrient availability with cell growth and proliferation. The activity of mTORC1 is regulated through different signaling pathways, including the PI3K‒AKT axis, which type I and type II IFNs can modulate [13]. IFNs can induce Akt activity in different cell types [30,31]. Some studies have suggested that Akt exerts a negative regulatory effect on the induction of responses to IFN by interfering with IFN-dependent apoptosis [32] and/or promoting cell survival [33]. Nevertheless, the functional significance of this pathway and its downstream effectors in IFN signaling remain poorly understood. To date, the ability of IFN-I to induce autophagy in pancreatic cancer cells and the biological consequences of this response have not been elucidated.
Autophagy plays a crucial role in cell survival and tumor progression in PDAC. The inhibition of autophagy could sensitize malignancies to therapy only in those cases in which therapy-induced autophagy has a cytoprotective effect, such as PDAC [34]. We previously determined, both in vitro and in vivo, that the inhibition of autophagy is crucial for improving the treatment of MIAPaCa-2 and PANC-1 cells with gemcitabine. The results presented in the present work demonstrate that IFNα2b protects cells from the proapoptotic effect of gemcitabine by inducing autophagy, which explains why the combined therapy of IFNα2b plus gemcitabine inhibits cell proliferation but fails to induce cell death. Interestingly, IFNβ1a inhibited autophagy in PDAC, favoring gemcitabine-induced apoptosis. Therefore, combined treatment with IFNβ1a plus gemcitabine could be a potentially effective therapy for pancreatic cancer. Given the importance of autophagy as a survival mechanism in PDAC [4], the capacity of type I IFNs to regulate this process is of substantial clinical relevance.
2. Results
This section may be divided by subheadings. It should provide a concise and precise description of the experimental results, their interpretation, as well as the experimental conclusions that can be drawn.
2.1. IFNα2b and IFNβ1a Decrease the Proliferation of MIAPaCa-2 and PANC-1 cells
IFN-I is associated with beneficial effects against tumors, principally because of its ability to inhibit proliferation, induce apoptosis, and modulate the tumor microenvironment. In this context, the antitumor effects of IFNα2b have been widely studied over the past decade. However, little is known about the effects produced by IFNβ. We first investigated the cytostatic effect of both IFNs on MIAPaCa-2 and PANC-1 cells. The results showed that the inhibition of proliferation was time- and dose-dependent but incomplete. The cytostatic effect was partial, even at very high doses. For that reason, the IC25 was calculated, and it was impossible to obtain the IC50 for all the conditions tested (Figure 1, table S1). The results revealed no differences between the IC25s obtained for both IFNs at 24 h. However, the IC25 for IFNα2b was 2.01-fold greater than the IC25 for IFNβ1a after 48 h of treatment in MIAPaCa-2 cells (Figure 1A). In the case of PANC-1 cells (Figure 1B), this value increased 4.88-fold, suggesting that IFNβ1a is more efficient at inhibiting cell proliferation at this time. Interestingly, the results observed after 72 h of treatment were less effective than those observed at 48 h, suggesting that a population of cells is refractory to IFNs and continues to proliferate.
2.2. IFNβ1a Sensitizes Cells to Gemcitabine, but IFNα2b Renders Them More Resistant
Considering that pancreatic tumors are highly resistant to gemcitabine and that type I IFNs have antiproliferative effects on pancreatic cancer cells, we investigated the response of MIAPaCa-2 and PANC-1 cells to combined treatment with IFNα2b or IFNβ1a and gemcitabine.
First, we evaluated the cytostatic effect of each combination. The results obtained were somewhat different between the two cell lines. In the case of MIAPaCa-2 (Figure 2A) cells, the IC25 of IFNα2b was 4.94-fold lower than the IC25 of gemcitabine at 48 h and 1.17-fold greater at 72 h. Similarly, the IC25 of IFNβ1a was 7.67-fold lower than the IC25 of gemcitabine at 48 h and 2.25-fold lower at 72 h. These results suggest that, in general, the combination of both IFN-I and gemcitabine is more effective in inhibiting MIAPaCa-2 cell proliferation. In contrast, none of the combinations of IFN-I with gemcitabine inhibited the proliferation of PANC-1 cells (Figure 2B) more efficiently than did gemcitabine alone (Table S2A).
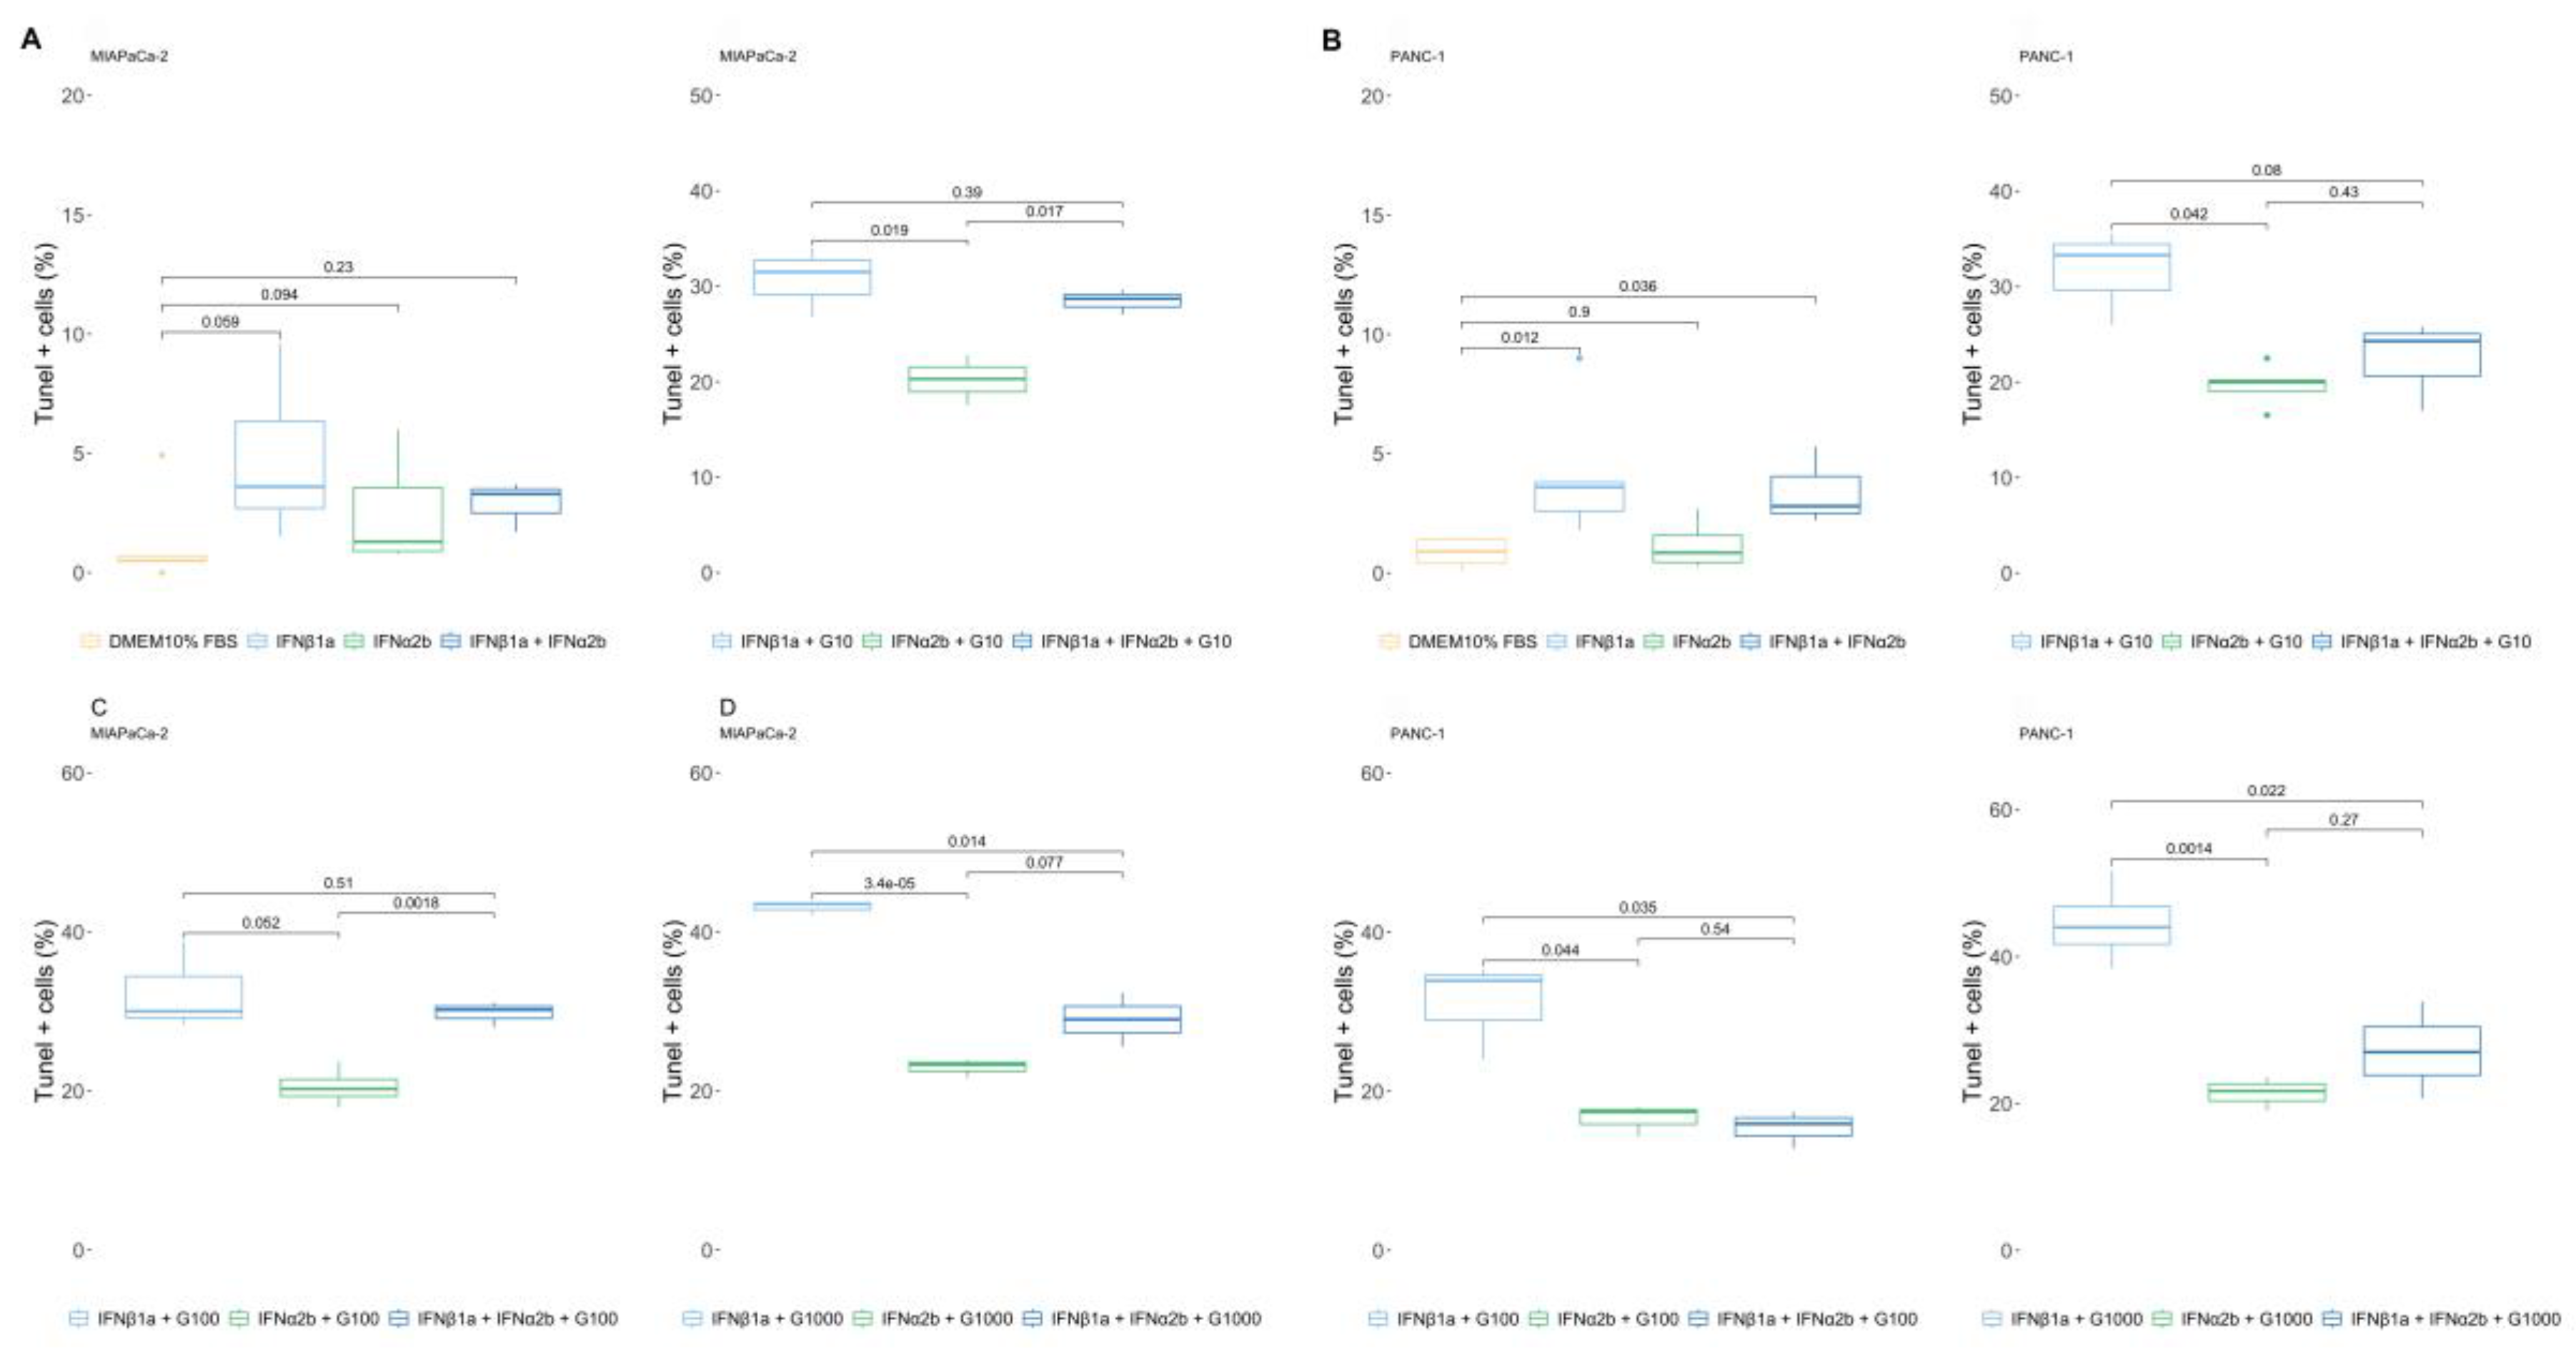
Next, we investigated whether combining IFNα2b and IFNβ1a with gemcitabine could trigger different percentages of cell death than gemcitabine alone. Surprisingly, opposite responses were observed for both IFN-Is. Cell viability was greater when the cells were treated with IFNα2b + gemcitabine than when they were treated with gemcitabine alone. Moreover, the combination of IFNβ1a + gemcitabine was more lethal. The LC25 of IFNα2b + gemcitabine was 7.24-fold greater, and the LC25 of IFNβ1a + gemcitabine was 3.24-fold lower than the LC25 of gemcitabine in MIAPaCa-2 cells (Figure 2C-I). Moreover, in PANC-1 (Figure 2 C-II) cells, the differences were greater, with an LC25 of IFNα2b + gemcitabine of 209.40-fold higher and an LC25 of IFNβ1a + gemcitabine of 3.75-fold lower than the LC25 of gemcitabine.
The maximum values of dead cells obtained also differed depending on each treatment. Gemcitabine induced 34.17±3.75% of the MIAPaCa-2 TUNEL+ cells, whereas 22.95±1.17% and 43.10±0.87% of the MIAPaCa-2 TUNEL+ cells were induced by the combination of IFNα2b and IFNβ1a, respectively. Similarly, gemcitabine induced 31.32±5.33% of PANC-1 TUNEL+ cells, and the combination of IFNα2b and IFNβ1a triggered 22.85±3.40% and 44.52±5.55%, respectively (Table S2B).
Moreover, the presence of IFNα2b reduced the lethal effect of 1000 µg/ml of gemcitabine to the values observed at a dose of 10 µg/ml in both cell lines, whereas the presence of IFNβ1a increased the lethal effect at the lower doses tested, 10 µg/ml, to similar values obtained at a dose of 1000 µg/ml, supporting the hypothesis that IFNβ1a sensitizes cells to chemotherapy, whereas IFNα2b increases their resistance (Figure 2C).
2.3. IFNα2b and IFNβ1a Have Opposite Effects on the Induction of Autophagy Flux
To explore the reason behind the opposing effects observed between the two type-I IFNs, we questioned whether autophagy could be involved. To that end, we conducted a series of assays to determine whether type-I IFNs were able to modulate autophagy flux. First, LC3-II levels were determined in the presence of IFNs and/or vincristine (VCR), a microtubule network inhibitor that blocks transport to lysosomes. VCR is expected to inhibit the degradation of autophagosomes [35]. For this purpose, the cells were exposed to 1000 IU/ml IFNα2b or IFNβ1a for 24 h and/or 10 µM VCR for the last 6 h. Compared with no treatment, VCR inhibited the degradation of LC3-II associated with autolysosome activity, resulting in the accumulation of LC3-II in cells treated with IFNα2b (Figure 3A). Importantly, in IFNα2b-treated cells, the changes in LC3-II levels were greater in the presence of VCR than those in cells treated with VCR alone, suggesting that IFNα2b stimulates autophagic flux. In contrast, the levels of LC3-II in cells treated with IFNβ1a + VCR were lower than those in cells treated with VCR alone, indicating that IFNβ1a inhibited the formation of autophagosomes.
To confirm these results, we transfected cells with the plasmid pBABE-puro-mCherry-EGFP-LC3B (Addgene #22418), which expresses a chimeric LC3 with GFP (green) and mCherry (red). Since GFP is sensitive to autolysosomal acidity and loses fluorescence, while mCherry remains stable, vesicles emitting both colors appear yellow and correspond to autophagosomes. Those emitting only red correspond to autolysosomes (Figure 3B). To this end, the cells were cultured in the presence of IFNα2b or IFNβ 1000 IU/ml and/or 25 µM chloroquine (CQ), a proton pump inhibitor, for 24 h. Photographs were subsequently taken, and the percentage of overlap between red and green fluorescence was analyzed via FIJI software. A greater percentage of cells exhibiting color overlap presented a reduction in autophagic flux or inhibition of autophagosome degradation. In contrast, cells with predominantly red vesicles presented increased autophagic flux and/or enhanced degradation.
As shown in Figure 3C, IFNα2b decreased the overlap area between both colors, resulting in cells with a higher content of red vesicles (autolysosomes) in both cell lines.
Additionally, combining IFNα2b with CQ yielded lower overlap values than those observed with CQ treatment alone. The decrease in the number of yellow vesicles (early autophagosomes) suggests that IFNα2b enhances autophagic flux, a finding that is consistent with the analysis of LC3-II by western blot (Figure 3A). Conversely, IFNβ1a did not result in changes in the overlap area compared with the basal condition or in combination with CQ compared with CQ treatment alone (Figure 3C). These results, in accordance with the analysis of LC3 levels by western blot, suggest that IFNβ1a does not alter autophagic flux but inhibits autophagosome synthesis.
2.4. 3-MA Rescues the IFNα2b-Mediated Resistance of Pancreatic Cancer Cells to Gemcitabine, and IFNα2b Rescues IFNβ1a-Mediated Sensitization
Previously, we reported that autophagy is one of the mechanisms responsible for chemotherapy failure and that inhibiting this process with 3-MA sensitized MIAPaCa-2 and PANC-1 cells to gemcitabine [4]. To corroborate whether the differences observed in the assessment of cell death caused by the combination of IFNα2b or IFNβ1a and gemcitabine were due to the modulation of autophagy, rescue assays were performed. First, we evaluated whether the resistance to cell death observed by treatment with IFNα2b + gemcitabine could be reversed by preincubation with 3-MA, an autophagy inhibitor. For that, 10 mM 3-MA was added to the cultures 1 h before IFNα2b + gemcitabine was added. For all doses of gemcitabine tested, the reversion of IFNα2b-induced resistance was complete in MIAPaCa-2 cells (Figure 4A). A similar study performed with PANC-1 cells showed somewhat different results (Figure 4B). The resistance induced by IFNα2b was not reversed when IFNα2b was combined with 10 µg/ml gemcitabine; the reversal was partial when IFNα2b was combined with 100 µg/ml gemcitabine and complete when IFNα2b was combined with 1000 µg/ml gemcitabine.
Next, we evaluated whether the ability of IFNβ1a sensitization to gemcitabine-induced cell death could be prevented by the presence of an inducer of the autophagy process, such as IFNα2b. For that, IFNα2b was added to the cell cultures 1 h before the addition of IFNβ1a + gemcitabine. It was not possible to prevent the sensitizing effect of IFNβ1a when it was combined with 10 µg/ml or 100 µg/ml gemcitabine in MIAPaCa-2 cells, but this effect was prevented entirely when it was combined with 1000 µg/ml gemcitabine (Figure 5 A). The results were more convincing in the PANC-1 line, where the presence of IFNα2a completely prevented IFNβ1a-induced sensitization to gemcitabine-induced cell death (Figure 5B).
3. Discussion
The present study focused on the antitumor effect of type-I IFNs on pancreatic cancer cells. Several reports have shown that IFNs fail to generate antineoplastic responses. The effects of type-I IFNs on tumor cells depend strongly on the type of tumor and the cell involved. For example, in patients with chronic hepatitis C, IFN-β exerts a stronger antitumor effect than does IFNα2b in the early stages of hepatocellular carcinoma (HCC); however, IFNα2b has been shown to induce apoptosis more efficiently in HCC cell lines [36,37,38]. In addition, Murata et al. reported that IFN-β has a greater antiproliferative effect than does IFNα2b on several HCC cell lines and induces cell cycle alterations, such as arrest and apoptosis [39].
The most studied cytokine is IFNα, which, when combined with other drugs, such as 5-fluorouracil, cisplatin, retinoic acid, or leucovorin, has been shown to increase the clinical efficacy of treatment for pancreatic cancer [17,19,40,41,42,43]. Iwahashi et al. demonstrated the in vitro antiproliferative effect of a combination of valproic acid with gemcitabine and pegylated IFNα2b on pancreatic cell lines; however, the capacity of this combined therapy to induce cell death has not been tested [44]. Literature data on the effects of IFNβ on pancreatic tumor cells and treatment outcomes in patients with pancreatic cancer are even scarcer. However, a growth-inhibitory effect of IFNβ combined with gemcitabine has been observed in vitro [20]. Considering that the gold standard treatment for pancreatic cancer is gemcitabine and that an effective therapy achieves tumor cell death, we evaluated the antitumor effect of a combination therapy of type-I IFNs and gemcitabine. Consistent with the literature, our results show that the combination of both IFN-I and gemcitabine is more effective at inhibiting MIAPaCa-2 cell proliferation but not PANC-1 growth, possibly because of the greater resistance profile of this cell line. Interesting results were obtained when the induction of cell death was evaluated. Several mechanisms contribute to gemcitabine resistance [45]. We showed that the levels of apoptosis resulting from combined therapy with IFNα2b and gemcitabine were lower than those resulting from treatment with gemcitabine alone, suggesting that IFNα2b protected cells from death. The opposite effect was observed with the combination of IFNβ1a and gemcitabine. In this case, the percentages of apoptotic cells were greater than those obtained by treatment with gemcitabine alone.
We previously reported that gemcitabine failed to induce cell death and enhance autophagy [4]. Therefore, in this work, we assessed whether the modulation of autophagy by type-I IFNs was related to the failure/success of gemcitabine to induce an effective antineoplastic response. Our results demonstrated that IFNα2b stimulates autophagy flux, whereas IFNβ1a inhibits autophagosome synthesis. The induction of autophagy in tumor cells caused by IFNα2b has also been reported for other types of tumors. Jun Zhao et al. reported that IFNα2b induces autophagy in hepatocellular carcinoma cells by activating the Beclin-1 pathway [46]. Schmeisser et al. demonstrated that IFNα2c induces autophagy in certain cell lines, including Daudi B, HeLa S3, MDA-MB-231, T98G, and A549 cells. In these cell lines, the induction of autophagy correlated with the inhibition of mTORC1 activity [7]. In the same study, the authors reported that IFNβ could induce autophagy but only in Daudi B cells. Ambjørn et al. recently reported that IFNβ induced autophagy and thus promoted the survival of MCF-7 breast cancer cells [47]. Similarly, Yubin Li et al. reported that IFNβ induces the formation of autophagosomes in a human glioma cell line and that this cytokine inhibits cell growth through caspase-dependent activation of apoptosis. Interestingly, they also demonstrated that the suppression of autophagy significantly enhanced growth inhibition and IFNβ-induced apoptosis, whereas the inhibition of caspase-dependent cell apoptosis impaired IFNβ-induced autophagy [48]. An interesting work was recently published by Amber Blaauboer and collaborators [49], in which they reported a chemosensitizing effect of IFN-β when combined with gemcitabine in vitro, ex vivo, and in vivo. These authors associated this effect with the upregulation of genes involved in the intracellular uptake of gemcitabine by IFNβ. This seems to be one of the reasons why IFNβ sensitized BxPC-3 and CFPAC-1 cells but not PANC-1 cells to gemcitabine, which is a more resistant cell line. We also observed a sensitizing effect of IFNβ1a to gemcitabine in MIAPaCa-2 and PANC-1 cells, but this effect was due to the modulation of autophagy.
We present for the first time that IFNβ1a inhibits autophagy in pancreatic cancer cell lines. Therefore, to confirm this finding and to correctly associate this event with chemosensitization, we performed rescue assays. We demonstrated that the resistance induced by IFNα2b could be reversed by preincubation with 3-MA, an autophagy inhibitor. For all doses of gemcitabine tested, the reversion of IFNα2b-induced resistance was complete in MIAPaCa-2 cells. However, the ability of 3-MA to reverse the resistance induced by IFNα2b seems to depend on the gemcitabine dose tested. The reversion is greater when higher doses of gemcitabine are used. We also demonstrated that the sensitizing effect of IFNβ1a can be prevented by preincubation with an autophagy inducer, such as IFNα2b. In this case, the results also depended on the dose of gemcitabine. The prevention of the sensitizing effect is more significant when higher doses of gemcitabine are tested. More studies are needed to understand the reasons for these observations thoroughly. Nevertheless, the partial or complete response in the rescue of resistance and sensitization in tumor cells may depend on the integration of the signaling pathways induced by each particular treatment, as well as the ability of the cells to tolerate stress and recover their “defense” mechanisms, which vary according to the dose of gemcitabine used.
In summary, PDAC is characterized by the critical role of autophagy in cell survival and tumor progression. We previously reported that the inhibition of autophagy is crucial for the effects of gemcitabine both in vivo and in vitro. In this work, we demonstrated for the first time that IFNβ1a promotes gemcitabine-mediated apoptosis through the inhibition of autophagy, whereas IFNα2b protects pancreatic cancer cells from the proapoptotic effects of gemcitabine by inducing autophagy. These findings open the possibility of repositioning IFNβ1a as a sensitizing agent to chemotherapy in pancreatic cancer, especially in combination with gemcitabine in resistant tumors. Future studies will assess whether this dual role on autophagy and apoptosis translates into clinical benefit.
4. Materials and Methods
4.1. Materials
IFNα2b and IFNβ1a were obtained from BioSidus (Buenos Aires, Argentina). 4’,6-Diamidino-2-phenylindole dihydrochloride (DAPI) and 3-MA were purchased from Sigma‒Aldrich (St. Louis, MO, USA). Gemcitabine was kindly provided by Richmond (Buenos Aires, Argentina). Vincristine (VCR) was obtained from Filaxis (Buenos Aires, Argentina), and DMEM, penicillin, and streptomycin were purchased from Invitrogen (Invitrogen Argentina S.A., Buenos Aires, Argentina). Fetal bovine serum (FBS) was purchased from Internegocios S. A. (Buenos Aires, Argentina). pBABE-puro mCherry-EGFP-LC3B was a gift from Jayanta Debnath (Addgene plasmid #22418; http://n2t.net/addgene:22418; RRID: Addgene 22418).
4.2. Cell Culure and Viability
MIAPaCa-2 (clone CRL-1420) and PANC-1 (clone CRL-1469) cells were obtained from the American Type Culture Collection (ATCC). The cells were cultured in DMEM containing 10% heat-inactivated FBS, 2 mM L-glutamine, 20 mM HEPES buffer, 100 IU/ml penicillin, and 150 µg/ml streptomycin at 37°C in a humidified incubator with 5% CO2 and tested for Mycoplasma every three months via PCR (Abcam cat# ab289834). Cells at fewer than 20 passages were used for the experiments described. Cell viability was determined by trypan blue exclusion.
4.3. Assessment of Cell Proliferation
The sensitivity of the cell line to increasing doses of either IFNα2b or IFNβ1a (10–10000 IU/ml) was determined by culturing 5×10⁴ cells/ml at 37°C in a 5% CO2 atmosphere for 24, 48 and 72 h. The cells were pulsed with 1 μCi [3H]TdR (DuPont/NEN Products, Boston, MA, USA) for 18 h. Cultures were performed in 96-well flat microtiter plates. After incubation, the cells were harvested via a semiautomatic method. The incorporated [3H]TdR was measured in a liquid scintillation beta counter (Beckman/PerkinElmer, Waltham, MA, USA). The results were calculated from the mean counts per minute (cpm) of [3H]TdR incorporated in triplicate cultures. The percentage of cell proliferation was calculated as follows:
The untreated cells used as the basal control represented 100% proliferation. The cell viability at the beginning of the experiment was greater than 90%, as assessed by Trypan blue exclusion. Each experiment was carried out at least three times, and similar results were obtained.
4.4. Apoptotic Assessment
Terminal deoxynucleotidyl transferase-mediated dUTP nick end labeling (TUNEL) was carried out. Briefly, the cells were incubated alone in DMEM containing 10% FBS with IFN-I and/or gemcitabine for 72 h. The cells were resuspended and washed once with ice-cold phosphate-buffered saline (PBS) and fixed in 4% buffered paraformaldehyde. The TUNEL assay was carried out via the DeadEnd Fluorometric TUNEL System Kit (Promega Corporation, Madison, WI, USA) following the manufacturer’s recommendations. Images from triplicate samples were automatically obtained with an EVOS M7000 Microscope (Thermo Fisher Scientific) at 200X magnification. Images were processed with FIJI (ImageJ2) software. A minimum of 2000 cells were counted for each condition. Cells with pyknotic nuclei and dark green fluorescence staining were scored as positive. The cells were stained with DAPI as a counterstain. The percentage of TUNEL-positive cells was calculated as follows:
4.5. Total Protein Extracts
The cells (1x10⁷) were lysed with hypotonic buffer (20 mM Tris pH 8.0, 150 mM NaCl, 100 mM NaF, 10% glycerol, 2% Nonidet P-40) and the protease inhibitor cocktail P8340 from Sigma‒Aldrich for 30 min at 4°C, followed by centrifugation at 13,000×g for 30 min. The extracts were then stored at −86°C until use. The protein concentration was determined via the Bradford method.
4.6. Western Blot
Equal amounts of protein were loaded into each sample, separated by SDS‒PAGE, and transferred onto PVDF membranes (GE Healthcare, Little Chalfon, UK). The membranes were blocked with 3% nonfat dry milk in TBS overnight at 4°C. The membranes were then incubated with antibodies against LC3-B (Cat #2775, Cell Signaling Technology, Danvers, MA, USA) and β-actin (H-196, cat sc-7210, Santa Cruz Biotechnology, Inc., Dallas, TX, USA) overnight at 4°C. Horseradish peroxidase-labeled anti-rabbit (sc-2030) and anti-goat (sc-2033) secondary antibodies were obtained from Santa Cruz (Dallas, Texas, USA), added at a ratio of 1:8,000, and incubated for 1.5 h at 37°C. Immunoblots were analyzed via a chemiluminescent detection system (Western blotting luminol reagent, Santa Cruz Biotechnology, Inc.). Autoradiography images were obtained with a digital camera (Olympus D-510 Zoom; Olympus Corporation, Tokyo, Japan) and subjected to densitometry analysis with Image Scion software.
4.7. Autophagy Flux Assay
Autophagy flux was evaluated by western blot and fluorescence microscopy by transfecting cells with the plasmid pBABE-puro-mCherry-EGFP-LC3B (Addgene #22418), which expresses chimeric LC3 with GFP (green) and mCherry (red). For the first strategy, cells were cultured with 1000 IU/ml IFNα2b or IFNβ1a for 24 h and/or 10 µM VCR, a microtubule network inhibitor that blocks transport to lysosomes, for the last 6 h. Protein extracts were obtained as detailed in the corresponding section. For the second strategy, seventy-five percent confluent MiaPaCa-2 and PANC-1 cells were transfected with pBABE-puro-mCherry-EGFP-LC3B (Addgene plasmid #22418) via the TransIntro PL (TransGen Biotech) according to the manufacturer’s instructions. The transfected cells were incubated for 24 h in DMEM supplemented with 10% FBS in 24-well plates and then treated with 1000 UI/ml IFNα2b or IFNβ1a and/or 25 µM CQ. Photographs were taken with an EVOS M700 microscope and analyzed with FIJI software (ImageJ2).
4.8. Statistical Analysis
To analyze the dose‒response curves, we performed nonlinear regression via the log‒logistic function in the drc R package [50]. A four-parameter model estimates two parameters, the EC50 and the Hill coefficient, while the maximum value (max_value) and minimum value (min_value) are set to 100% and the minimum experimental value, respectively. Finally, we use these estimated and set parameters to calculate the fitted survival or viability values for each concentration (Cc) value with the following equation:
IC25 and LC25 refer to the “quarter-maximal inhibitory or lethal concentrations” for each drug against the biological processes or functions tested (such as cell proliferation and cell death) and were calculated via the following equation:
The medians of the quantitative variables were compared across different groups via the Mann‒Whitney test and the ggpubr R package.
Supplementary Materials
The following supporting information can be downloaded at the website of this paper posted on Preprints.org, Table S1: Effects of IFNα2b and IFNβ1a on cell proliferation; Table S2: Effects of IFNα2b and IFNβ1a on the cellular response to gemcitabine.
Author Contributions
LEB, SAB, MAP and DLP performed most of the experiments. SLL performed the cell death experiments and edited the manuscript. MML, MAP, DHG, MNG and EA contributed to the design of the study and edited and supervised the manuscript. MML, SLL and DLP analyzed the data and wrote the manuscript. EA and DLP contributed to funding acquisition. All the authors contributed to the work and have read and approved the final manuscript.
Funding
The work was funded with grants from the University of Buenos Aires #20020220400220BA; and the National Agency for Science and Technology Promotion (ANPCyT) PICT-2019-00736, PICT-2021-0051 and PICTO-2021-0018.
Data Availability Statement
The datasets used and/or analyzed during the current study are available from the corresponding author on reasonable request.
Conflicts of Interest
The authors declare no conflicts of interest.
Abbreviations
The following abbreviations are used in this manuscript:
| 3-MA | 3-methyladenine |
| [³H]TdR | tritiated thymidine |
| AKT | Protein Kinase B |
| ATCC | American Type Culture Collection |
| CQ | chloroquine |
| DAPI | 4′,6-diamidino-2-phenylindole dihydrochloride |
| DMEM | Dulbecco’s Modified Eagle Medium |
| EC50 | half maximal effective concentration |
| EGFP | enhanced green fluorescent protein |
| FBS | fetal bovine serum |
| HCC | hepatocellular carcinoma |
| HEPES | 4-(2-hydroxyethyl)-1-piperazineethanesulfonic acid |
| IC25 / IC50 | inhibitory concentration 25% / 50% |
| IFN-I | type I interferons |
| IFNα2b | interferon alpha 2b |
| IFNβ1a | interferon beta 1a |
| IFNAR-1 / IFNAR-2 | interferon alpha/beta receptor subunit 1 / 2 |
| JAK/STAT | Janus kinase / Signal Transducer and Activator of Transcription |
| LC25 | lethal concentration 25% |
| LC3B / LC3-II | microtubule-associated protein 1A/1B-light chain 3 isoform B / lipidated form (II) |
| MAPK | mitogen-activated protein kinase |
| MHC | major histocompatibility complex |
| mTORC1 / mTORC2 | mechanistic target of rapamycin complex 1 / 2 |
| PBS | phosphate-buffered saline |
| PDAC | pancreatic ductal adenocarcinoma |
| PI3K | phosphatidylinositol 3-kinase |
| PVDF | polyvinylidene difluoride |
| R | R statistical software |
| RFP | red fluorescent protein |
| SD | standard deviation |
| TBS | Tris-buffered saline |
| TUNEL | terminal deoxynucleotidyl transferase dUTP nick end labelin |
| VCR | vincristine |
References
- B. M. Wiczer and G. Thomas, “Phospholipase D and mTORC1: Nutrients Are What Bring Them Together,” Sci. Signal., vol. 5, no. 217, pp. pe13–pe13, 2012. [CrossRef]
- J. P. Neoptolemos et al., “A Randomized Trial of Chemoradiotherapy and Chemotherapy after Resection of Pancreatic Cancer,” N. Engl. J. Med., vol. 350, no. 12, pp. 1200–1210, 2004. [CrossRef]
- M. Hidalgo, “Pancreatic Cancer,” N. Engl. J. Med., vol. 21, no. 6, pp. 1605–1618, 2010. [CrossRef]
- D. L. Papademetrio et al., “Interplay between autophagy and apoptosis in pancreatic tumors in response to gemcitabine,” Target. Oncol., vol. 9, no. 2, pp. 123–134, 2014. [CrossRef]
- H. A. Burris et al., “Improvements in survival and clinical benefit with gemcitabine as first-line therapy for patients with advanced pancreas cancer: a randomized trial.,” J. Clin. Oncol., vol. 15, no. 6, pp. 2403–13, 1997. [CrossRef]
- S. Pestka, J. A. Langer, K. C. Zoon, and C. E. Samuel, “Interferons and their actions.,” Annu. Rev. Biochem., vol. 56, pp. 727–77, 1987. [CrossRef]
- H. Schmeisser et al., “Type I interferons induce autophagy in certain human cancer cell lines,” Autophagy, vol. 9, no. 5, pp. 683–696, 2013. [CrossRef]
- E. C. Borden et al., “Interferons at age 50: past, current and future impact on biomedicine,” Nat. Rev. Drug Discov., vol. 6, no. 12, pp. 975–990, 2007. [CrossRef]
- L. C. Platanias, “Mechanisms of type-I- and type-II-interferon-mediated signalling,” Nat. Rev. Immunol., vol. 5, no. 5, pp. 375–386, 2005. [CrossRef]
- G. R. Stark and J. E. Darnell, “The JAK-STAT pathway at twenty,” Immunity, vol. 36, no. 4, pp. 503–514, Apr. 2012. [CrossRef]
- L. B. Ivashkiv and L. T. Donlin, “Regulation of type I interferon responses,” Nat. Rev. Immunol., vol. 14, no. 1, pp. 36–49, Jan. 2014. [CrossRef]
- Y. Li et al., “Role of p38alpha Map kinase in Type I interferon signaling.,” J. Biol. Chem., vol. 279, no. 2, pp. 970–979, 2004. [CrossRef]
- S. Kaur, E. Katsoulidis, and L. C. Platanias, “Akt and mRNA translation by interferons,” Cell Cycle, vol. 7, no. 14, pp. 2112–2116, 2008. [CrossRef]
- S. Kaur et al., “Regulatory effects of mTORC2 complexes in type I IFN signaling and in the generation of IFN responses.,” Proc. Natl. Acad. Sci. U. S. A., vol. 109, no. 20, pp. 7723–8, 2012. [CrossRef]
- B. Kroczynska, S. Kaur, and L. C. Platanias, “Growth suppressive cytokines and the AKT/mTOR pathway,” Cytokine, vol. 48, no. 1–2, pp. 138–143, 2009. [CrossRef]
- H. Nagano et al., “Interferon-alpha and 5-fluorouracil combination therapy after palliative hepatic resection in patients with advanced hepatocellular carcinoma, portal venous tumor thrombus in the major trunk, and multiple nodules,” Cancer, vol. 110, no. 11, pp. 2493–2501, 2007. [CrossRef]
- H. Bernhard et al., “Treatment of advanced pancreatic cancer with 5-fluorouracil, folinic acid and interferon alpha-2A: results of a phase II trial,” Br J Cancer, vol. 71, no. 1, pp. 102–105, 1995.
- B. Chauffert et al., “Phase III trial comparing intensive induction chemoradiotherapy (60 Gy, infusional 5-FU and intermittent cisplatin) followed by maintenance gemcitabine with gemcitabine alone for locally advanced unresectable pancreatic cancer. Definitive results of the 2,” Ann. Oncol., vol. 19, no. 9, pp. 1592–1599, 2008. [CrossRef]
- V. J. Picozzi, R. A. Kozarek, and L. W. Traverso, “Interferon-based adjuvant chemoradiation therapy after pancreaticoduodenectomy for pancreatic adenocarcinoma,” in American Journal of Surgery, 2003, vol. 185, no. 5, pp. 476–480. [CrossRef]
- Y. Tomimaru et al., “Synergistic antitumor effect of interferon-ss with gemcitabine in interferon-alpha-non-responsive pancreatic cancer cells,” Int J Oncol, vol. 38, no. 5, pp. 1237–1243, 2011. [CrossRef]
- N. Mizushima, T. Yoshimori, and Y. Ohsumi, “The Role of Atg Proteins in Autophagosome Formation,” Annu. Rev. Cell Dev. Biol., no. 27, pp. 107–32, 2011. [CrossRef]
- Y. Chen and D. J. Klionsky, “The regulation of autophagy – unanswered questions,” J Cell Sci., vol. 124, no. 124(Pt 2), pp. 161–70, 2011. [CrossRef]
- D. Schmid and C. Münz, “Innate and Adaptive Immunity through Autophagy,” Immunity, vol. 27, no. 1, pp. 11–21, 2007. [CrossRef]
- M. New and S. Tooze, “The Role of Autophagy in Pancreatic Cancer-Recent Advances,” Biology (Basel)., vol. 9, no. 1, p. 7, Dec. 2019. [CrossRef]
- K. Görgülü et al., “The Role of Autophagy in Pancreatic Cancer: From Bench to the Dark Bedside,” Cells, vol. 9, no. 4, Apr. 2020. [CrossRef]
- M. Piffoux, E. Eriau, and P. A. Cassier, “Autophagy as a therapeutic target in pancreatic cancer,” Br. J. Cancer, vol. 124, no. 2, pp. 333–344, Jan. 2021. [CrossRef]
- C. H. Eng et al., “Macroautophagy is dispensable for growth of KRAS mutant tumors and chloroquine efficacy,” Proc. Natl. Acad. Sci. U. S. A., vol. 113, no. 1, pp. 182–187, Jan. 2016. [CrossRef]
- K. Degenhardt et al., “Autophagy promotes tumor cell survival and restricts necrosis, inflammation, and tumorigenesis,” Cancer Cell, vol. 10, no. 1, pp. 51–64, 2006. [CrossRef]
- Criollo et al., “IKK connects autophagy to major stress pathways,” Autophagy, vol. 6, no. 1, pp. 189–191, 2010. [CrossRef]
- N. Hay, “The Akt-mTOR tango and its relevance to cancer,” Cancer Cell, vol. 8, no. 3, pp. 179–83, 2005. [CrossRef]
- T. Panaretakis, L. Hjortsberg, K. P. Tamm, A. C. Bjorklund, B. Joseph, and D. Grander, “IFN{alpha} Induces Nucleus-independent Apoptosis by Activating ERK1/2 and JNK Downstream of PI3K and mTOR,” Mol Biol Cell, vol. 46, no. 8, 2007, [Online]. Available: http://www.ncbi.nlm.nih.gov/entrez/query.fcgi?cmd=Retrieve&db=PubMed&dopt=Citation&list_uids=17942603.
- S. F. Lei H, Furlong PJ, Ra JH, Mullins D, Cantor R, Fraker DL, “AKT activation and response to interferon-beta in human cancer cells.,” Cancer Biol Ther., vol. 4, no. 7, pp. 709–715, 2005.
- C. H. Yang, A. Murti, S. R. Pfeffer, J. G. Kim, D. B. Donner, and L. M. Pfeffer, “Interferon alpha /beta promotes cell survival by activating nuclear factor kappa B through phosphatidylinositol 3-kinase and Akt,” J Biol Chem, vol. 276, no. 17, pp. 13756–61, 2001. [CrossRef]
- D. A. Gewirtz, “The four faces of autophagy: Implications for cancer therapy,” Cancer Res., vol. 74, no. 3, pp. 647–651, 2014. [CrossRef]
- V. Cavaliere, T. Lombardo, S. N. Costantino, L. Kornblihtt, E. M. Alvarez, and G. A. Blanco, “Synergism of arsenic trioxide and MG132 in Raji cells attained by targeting BNIP3, autophagy, and mitochondria with low doses of valproic acid and vincristine,” Eur. J. Cancer, vol. 50, no. 18, pp. 3243–3261, 2014. [CrossRef]
- H. Yano et al., “Interferon alfa receptor expression and growth inhibition by interferon alfa in human liver cancer cell lines,” Hepatology, vol. 29, no. 6, pp. 1708–1717, 1999. [CrossRef]
- D. Murphy, K. M. Detjen, M. Welzel, B. Wiedenmann, and S. Rosewicz, “Interferon-alpha delays S-phase progression in human hepatocellular carcinoma cells via inhibition of specific cyclin-dependent kinases.,” Hepatology, vol. 33, no. 2, pp. 346–56, 2001. [CrossRef]
- H. Yano et al., “Growth inhibitory effects of pegylated IFN alpha-2b on human liver cancer cells in vitro and in vivo.,” Liver Int., vol. 26, no. 8, pp. 964–75, 2006. [CrossRef]
- M. Murata, S. Nabeshima, K. Kikuchi, K. Yamaji, N. Furusyo, and J. Hayashi, “A comparison of the antitumor effects of interferon-alpha and beta on human hepatocellular carcinoma cell lines.,” Cytokine, vol. 33, no. 3, pp. 121–8, 2006,. [CrossRef]
- J. R. Sporn, A. C. J. R. Sporn, A. C. Buzaid, D. Slater, N. Cohen, and B. R. Greenberg, “Treatment of advanced pancreatic adenocarcinoma with 5-FU, leucovorin, interferon-alpha-2b, and cisplatin,” Am J Clin Oncol, vol. 20, no. 1, pp. 81–83, 1997.
- F. H. Brembeck et al., “A phase II pilot trial of 13-cis retinoic acid and interferon-alpha in patients with advanced pancreatic carcinoma.,” Cancer, vol. 83, no. 11, pp. 2317–23, 1998.
- H. P. Knaebel et al., “Phase III trial of postoperative cisplatin, interferon alpha-2b, and 5-FU combined with external radiation treatment versus 5-FU alone for patients with resected panreatic adenocarcinoma - CapRI: Study protocol [ISRCTN62866759],” BMC Cancer, vol. 5, 2005. [CrossRef]
- D. J. T. Wagener, J. A. Wils, T. C. Kok, A. Planting, M. L. Couvreur, and B. Baron, “Results of a randomised phase II study of cisplatin plus 5-fluorouracil versus cisplatin plus 5-fluorouracil with alpha-interferon in metastatic pancreatic cancer: an EORTC gastrointestinal tract cancer group trial.,” Eur. J. Cancer, vol. 38, no. 5, pp. 648–653, 2002.
- S. Iwahashi et al., “Histone deacetylase inhibitor augments anti-tumor effect of gemcitabine and pegylated interferon-α on pancreatic cancer cells,” Int J clin Oncol, vol. 16, no. 6, pp. 671–8, 2011. [CrossRef]
- M. Ashrafizadeh, K. Luo, W. Zhang, A. Reza Aref, and X. Zhang, “Acquired and intrinsic gemcitabine resistance in pancreatic cancer therapy: Environmental factors, molecular profile and drug/nanotherapeutic approaches,” Environ. Res., vol. 240, p. 117443, Jan. 2024. [CrossRef]
- J. Zhao et al., “Interferon-alpha-2b induces autophagy in hepatocellular carcinoma cells through Beclin1 pathway.,” Cancer Biol. Med., vol. 11, no. 1, pp. 64–8, 2014. [CrossRef]
- M. Ambjørn, Y. M. Ambjørn, Y. Liu, M. Lees, and M. Jäättelä, “in MCF-7 breast cancer cells counteracts its proapoptotic function,” no. March, pp. 287–302, 2013.
- Y. Li et al., “Suppression of autophagy enhanced growth inhibition and apoptosis of interferon-beta in human glioma cells,” Mol Neurobiol, vol. 47, no. 3, pp. 1000–1010, 2013. [CrossRef]
- Blaauboer, K. Sideras, C. H. J. van Eijck, and L. J. Hofland, “Type I interferons in pancreatic cancer and development of new therapeutic approaches,” Crit. Rev. Oncol. Hematol., vol. 159, Mar. 2021. [CrossRef]
- Ritz, F. Baty, J. C. Streibig, and D. Gerhard, “Dose-Response Analysis Using R,” PLoS One, vol. 10, no. 12, p. e0146021, Dec. 2015. [CrossRef]
Figure 1.
Effects of IFNα2b and IFNβ1a on cell proliferation. Cell proliferation of MIAPaCa-2 (A) and PANC-1 (B) was determined by [3H]TdR incorporation after 24, 48 and 72 h of treatment. The results are expressed as the percentage of [3H]TdR incorporation in relation to the vehicle control, as described in the “Materials and methods” section. The dose‒response curves are shown for the MIAPaCa-2 and PANC-1 cell lines, along with their IC25 values. In all the graphs, each dot represents the mean ± SD of at least 3 independent experiments.
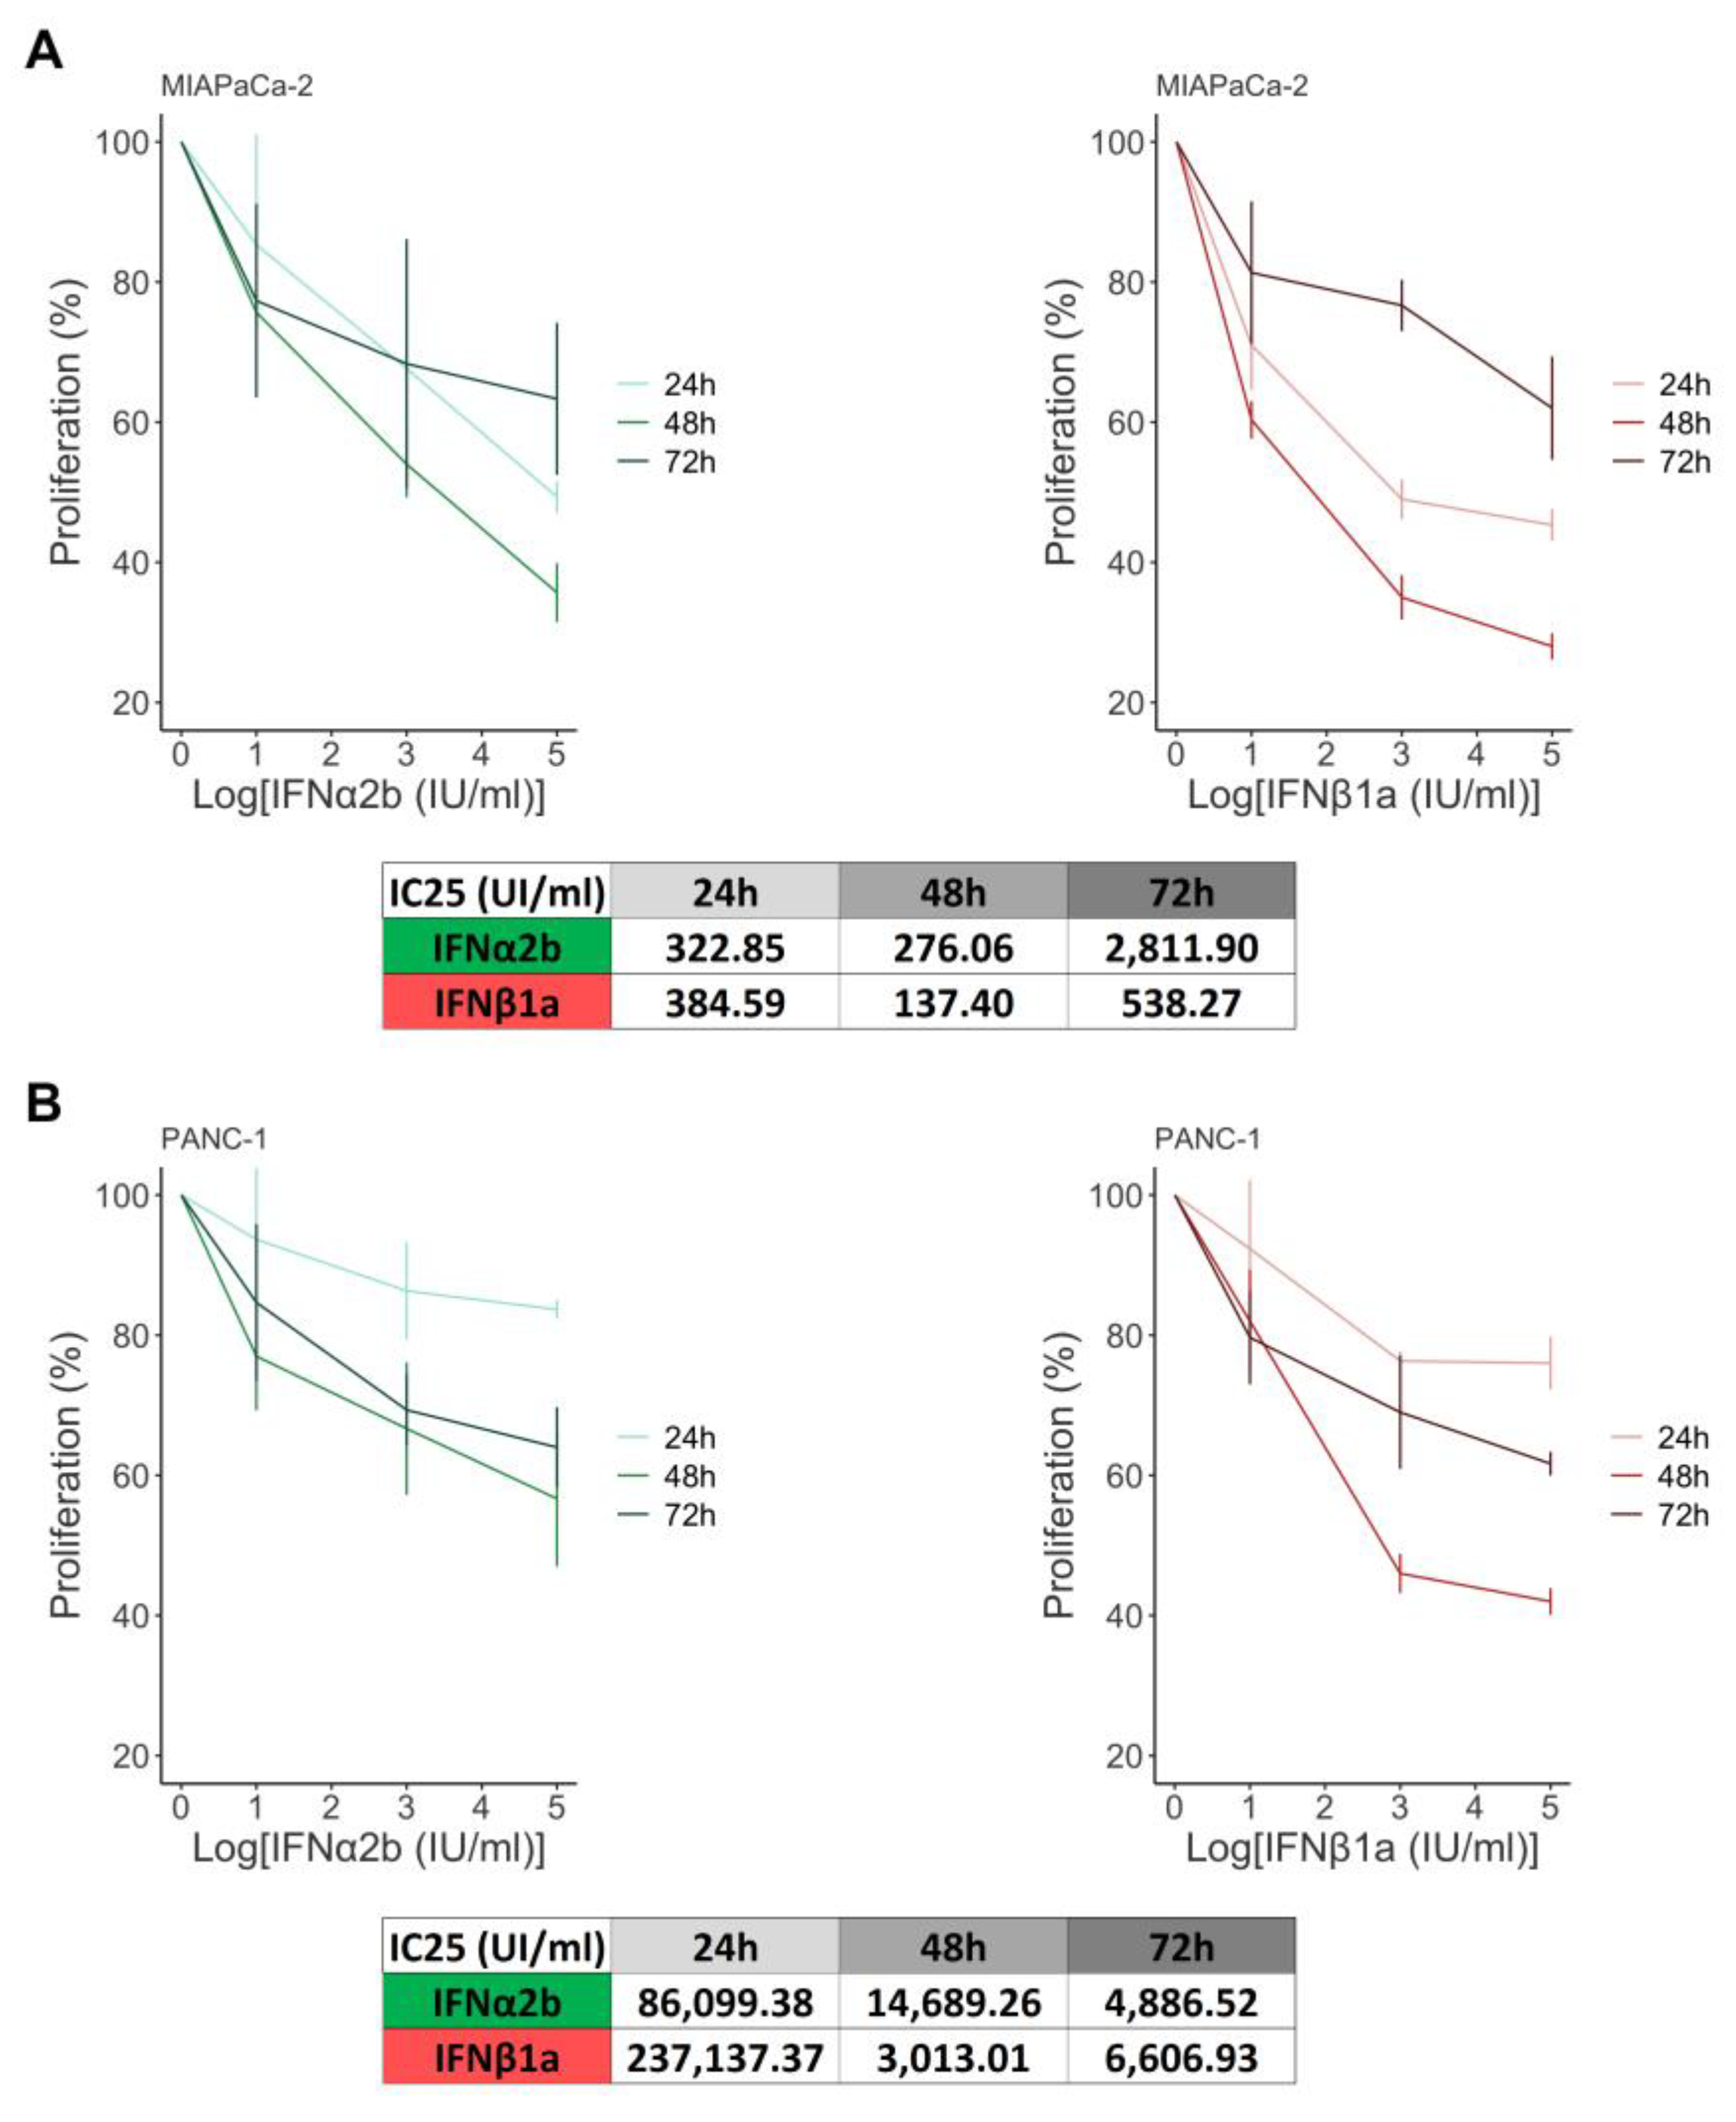
Figure 2.
Effects of IFNα2b and IFNβ1a on the cellular response to gemcitabine. (A) Cell proliferation was determined by [3H]TdR incorporation after 48 and 72 h of treatment. The results are expressed as the percentage of [3H]TdR incorporation in relation to the vehicle control, as described in the “Materials and methods” section. The dose‒response curves are shown for the MIAPaCa-2 and PANC-1 cell lines, along with their IC25 values. (B) Viability was evaluated via a TUNEL assay, and the results were calculated as (100% TUNEL-positive cells). The dose‒response curves are shown for the MIAPaCa-2 and PANC-1 cell lines, along with their LC25 values. (C) Comparison of gemcitabine-induced cell death in the presence or absence of IFNs. The results are expressed as the percentage of TUNEL+ cells in relation to the vehicle control, as described in the “Materials and methods” section. Box plots showing the different doses of gemcitabine with or without IFNα2b or IFNβ1a in MIAPaCa-2 and PANC-1 cells. In all the graphs, each dot represents the mean ± SD of at least 3 independent experiments.
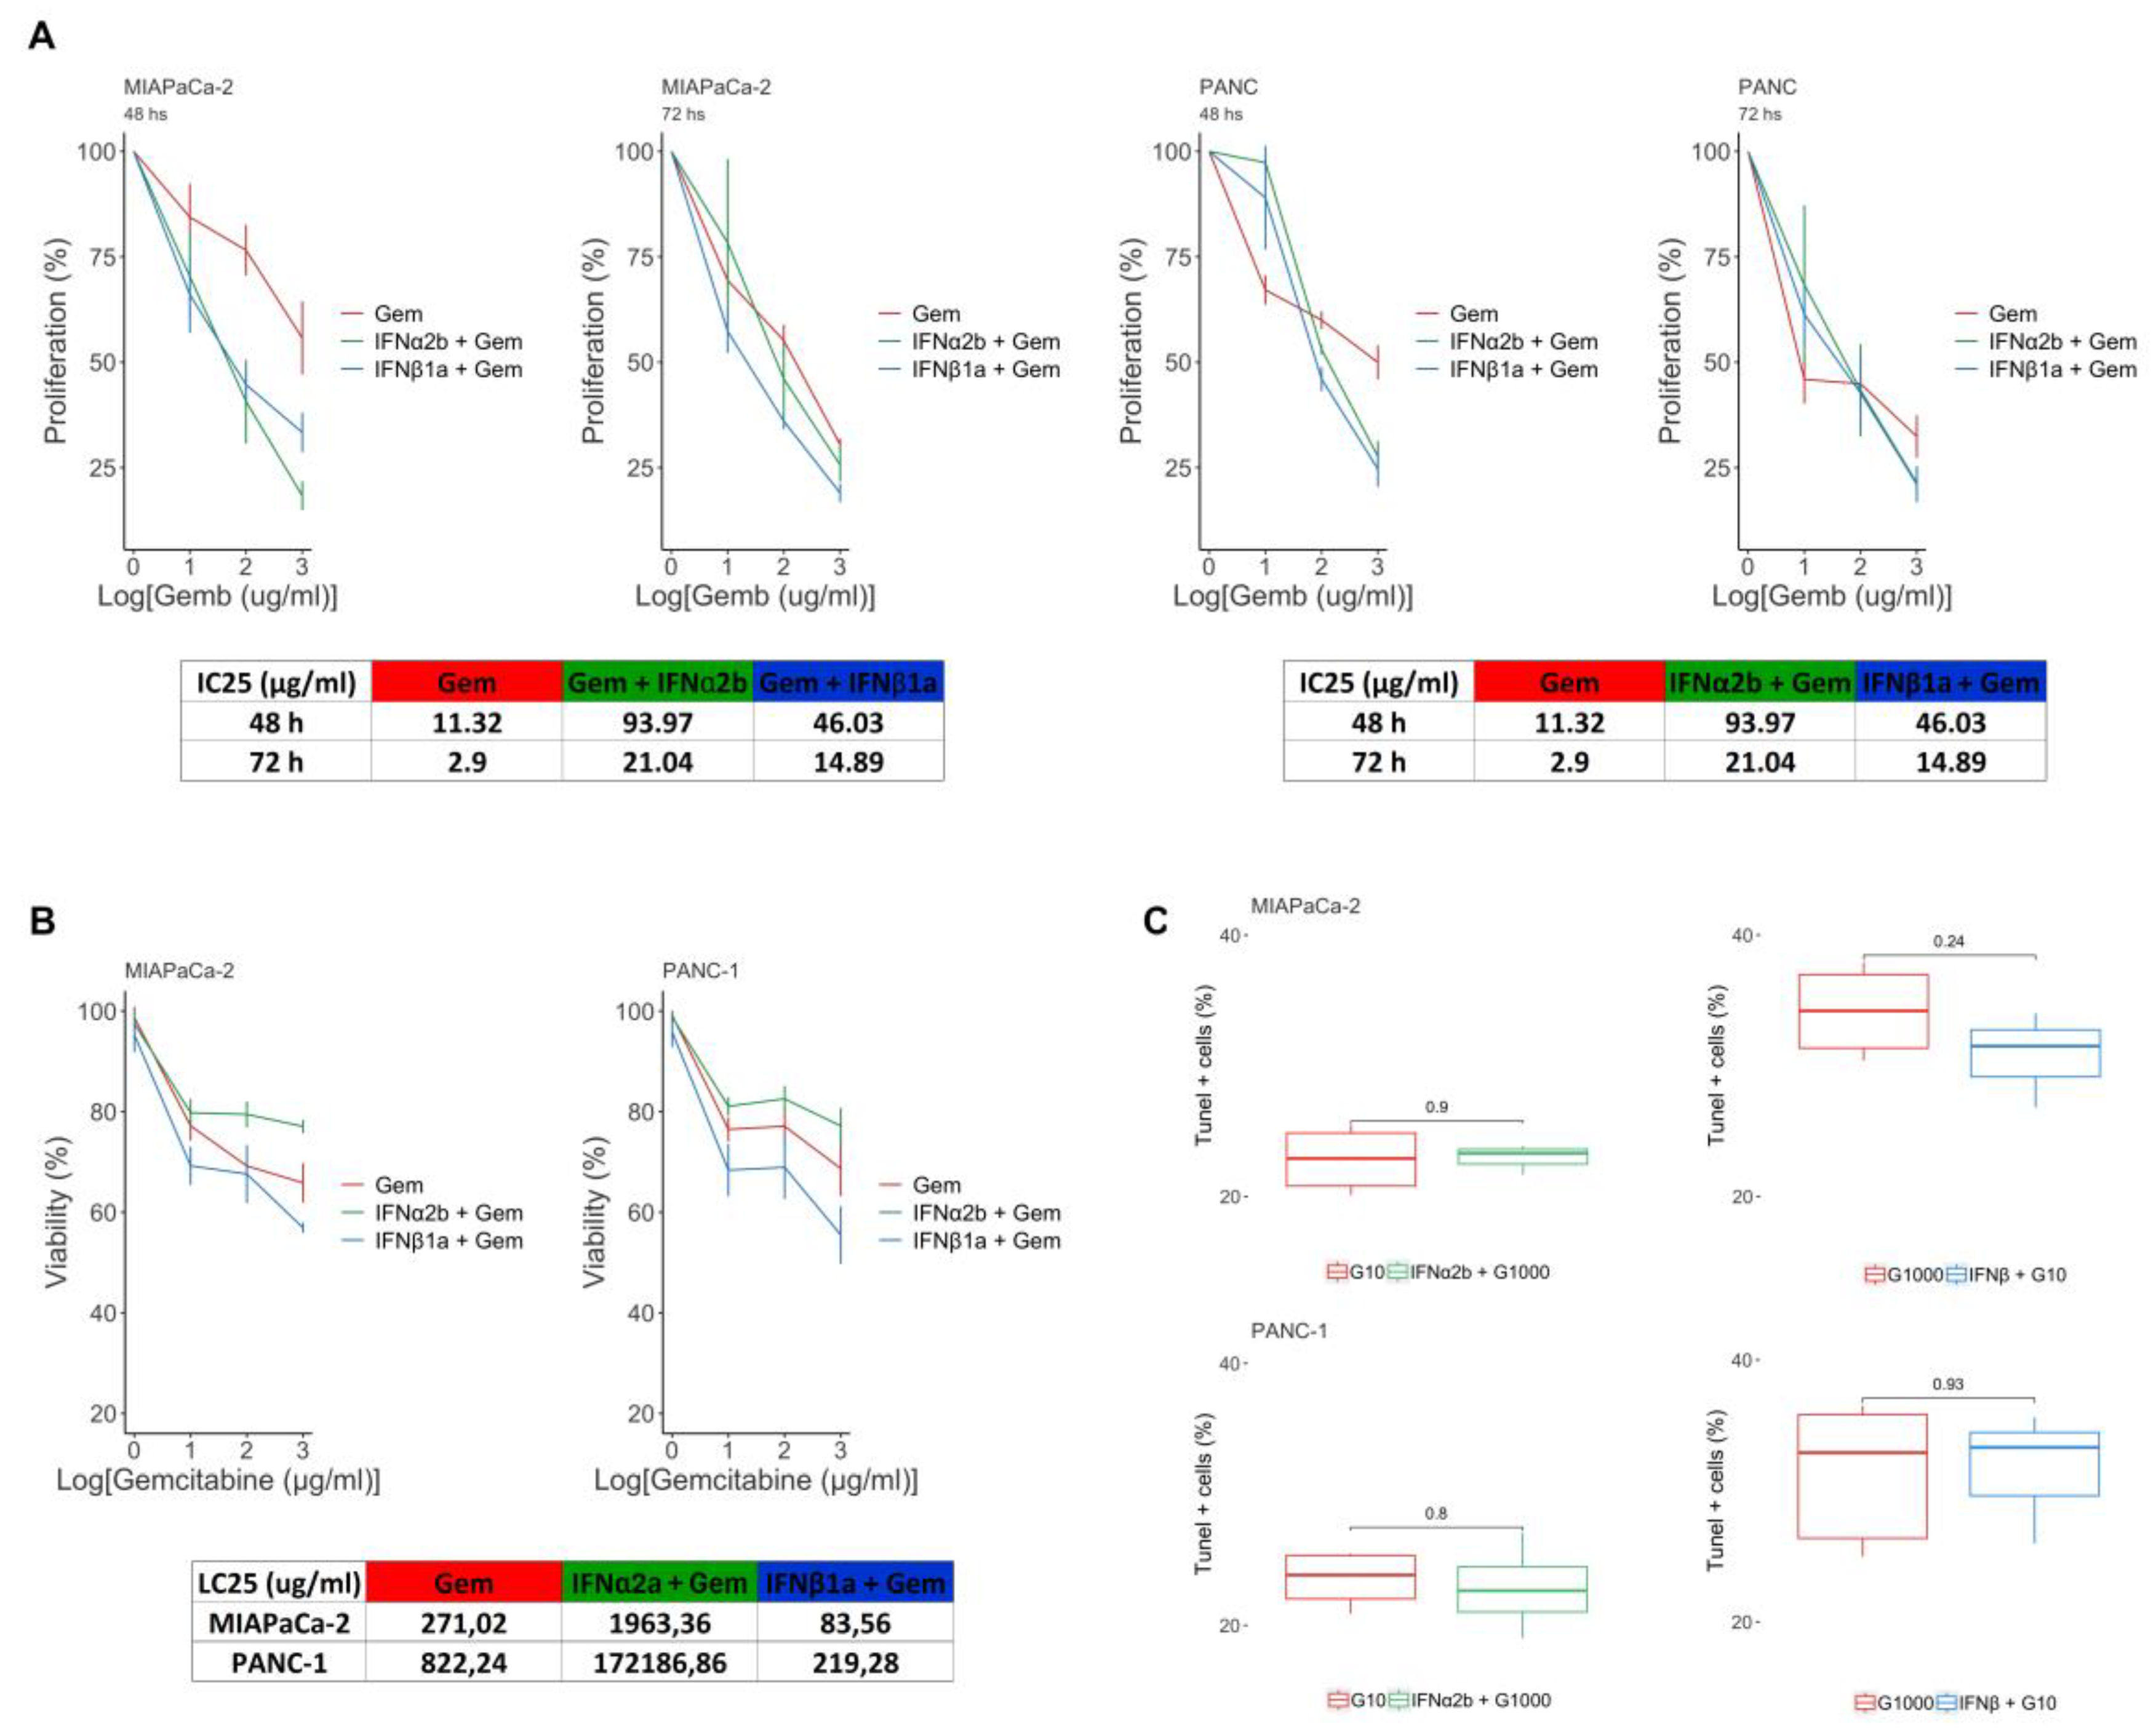
Figure 3.
Modulation of autophagy flux by type I IFNs. Endogenous LC3-II levels were evaluated by western blotting under basal conditions of culture and after treatment with IFNα2b/IFNβ1a and/or VCR in MIAPaCa-2 and PANC-1 (A) cells. The bars show the densitometric indices ± SDs of 3 independent experiments. Statistical comparison vs basal condition is indicated with asterisks (*), and vs VCR with hash symbols (#) */#p<0.05; **p<0.01; ####p<0.0001. (B) Representative images of MIAPaCa-2 and PANC-1 cells transfected with the pBABE-puro-mCherry-EGFP-LC3B plasmid. The cells were cultured in the presence of 1000 UI/ml IFNα2b or IFNβ1a and/or 25 µM chloroquine (CQ) for 24 hours. Images were obtained at 400x magnification. (C) Graphs of the MIAPaCa-2 and PANC-1 cell lines showing the RFP/GFP overlap area of the different treatments expressed as a percentage.
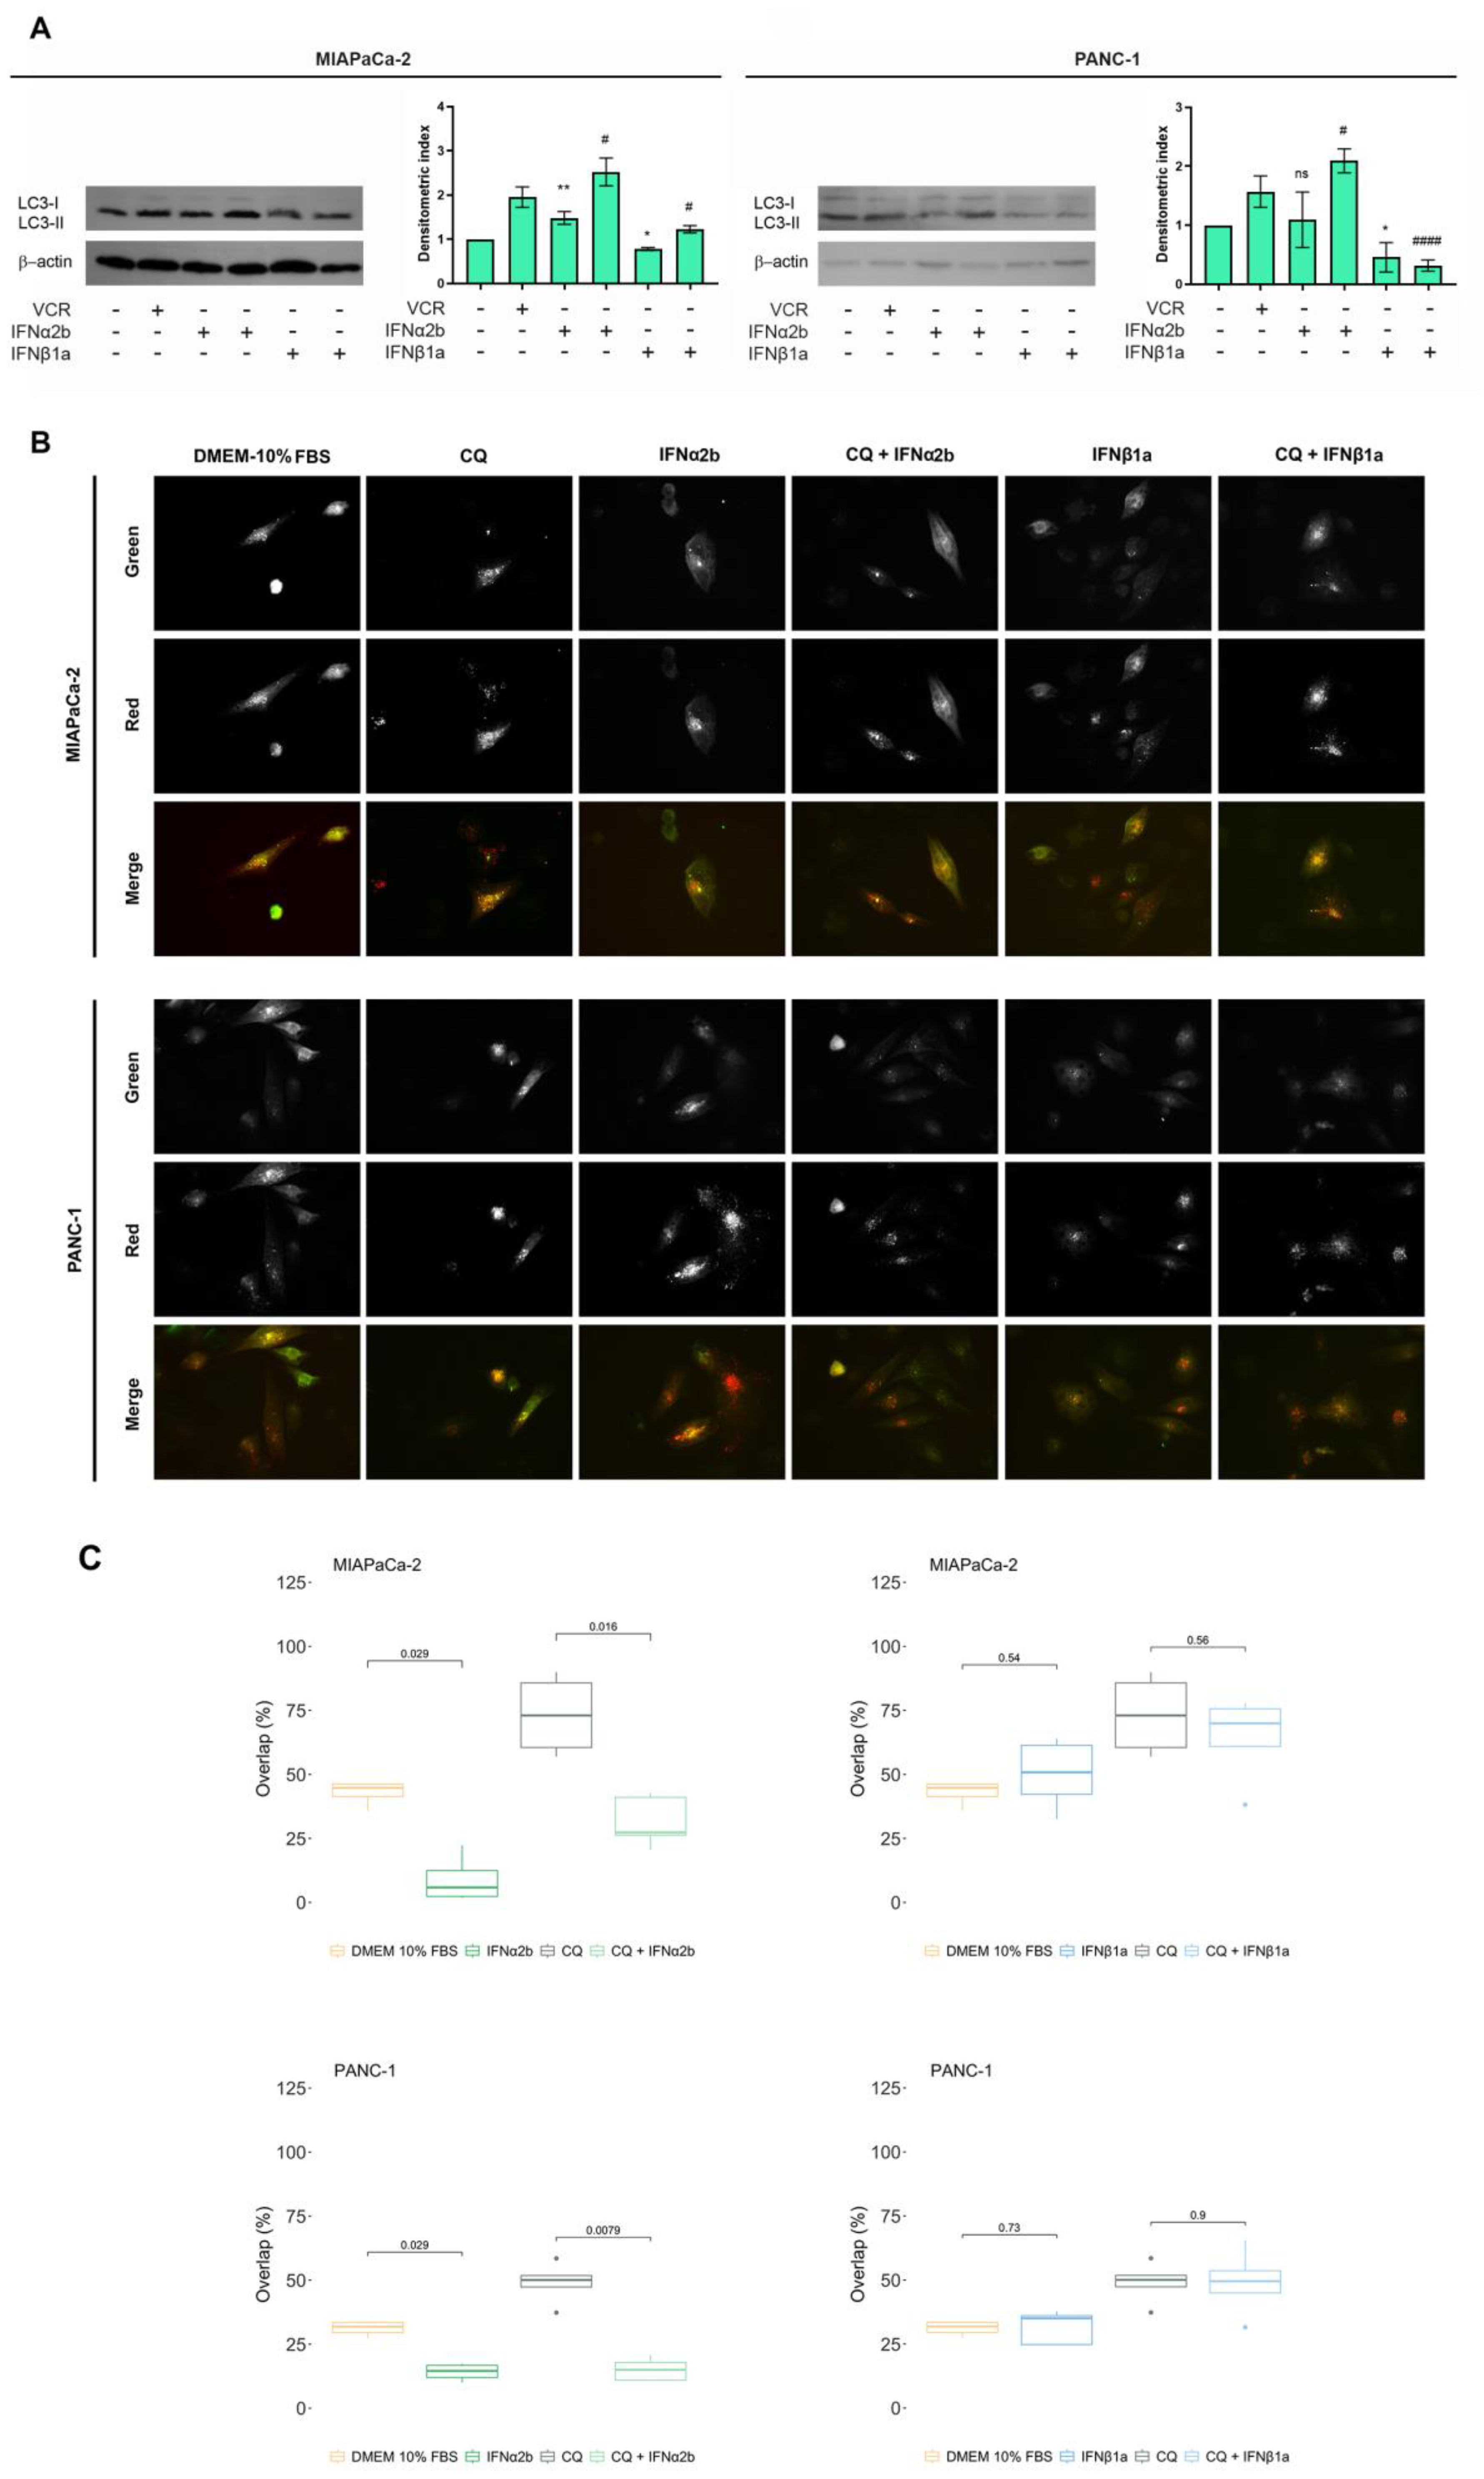
Figure 4.
Rescue of resistance to IFNα2b + gemcitabine-induced cell death by 3-MA. Cell death was evaluated via the TUNEL assay, and the results were calculated as described in the “Materials and Methods”. Box plots showing percentages of cell death obtained for MIAPaCa-2 (A) and PANC-1 (B) cells. In all the graphs, each dot represents the mean ± SD of at least 3 independent experiments.
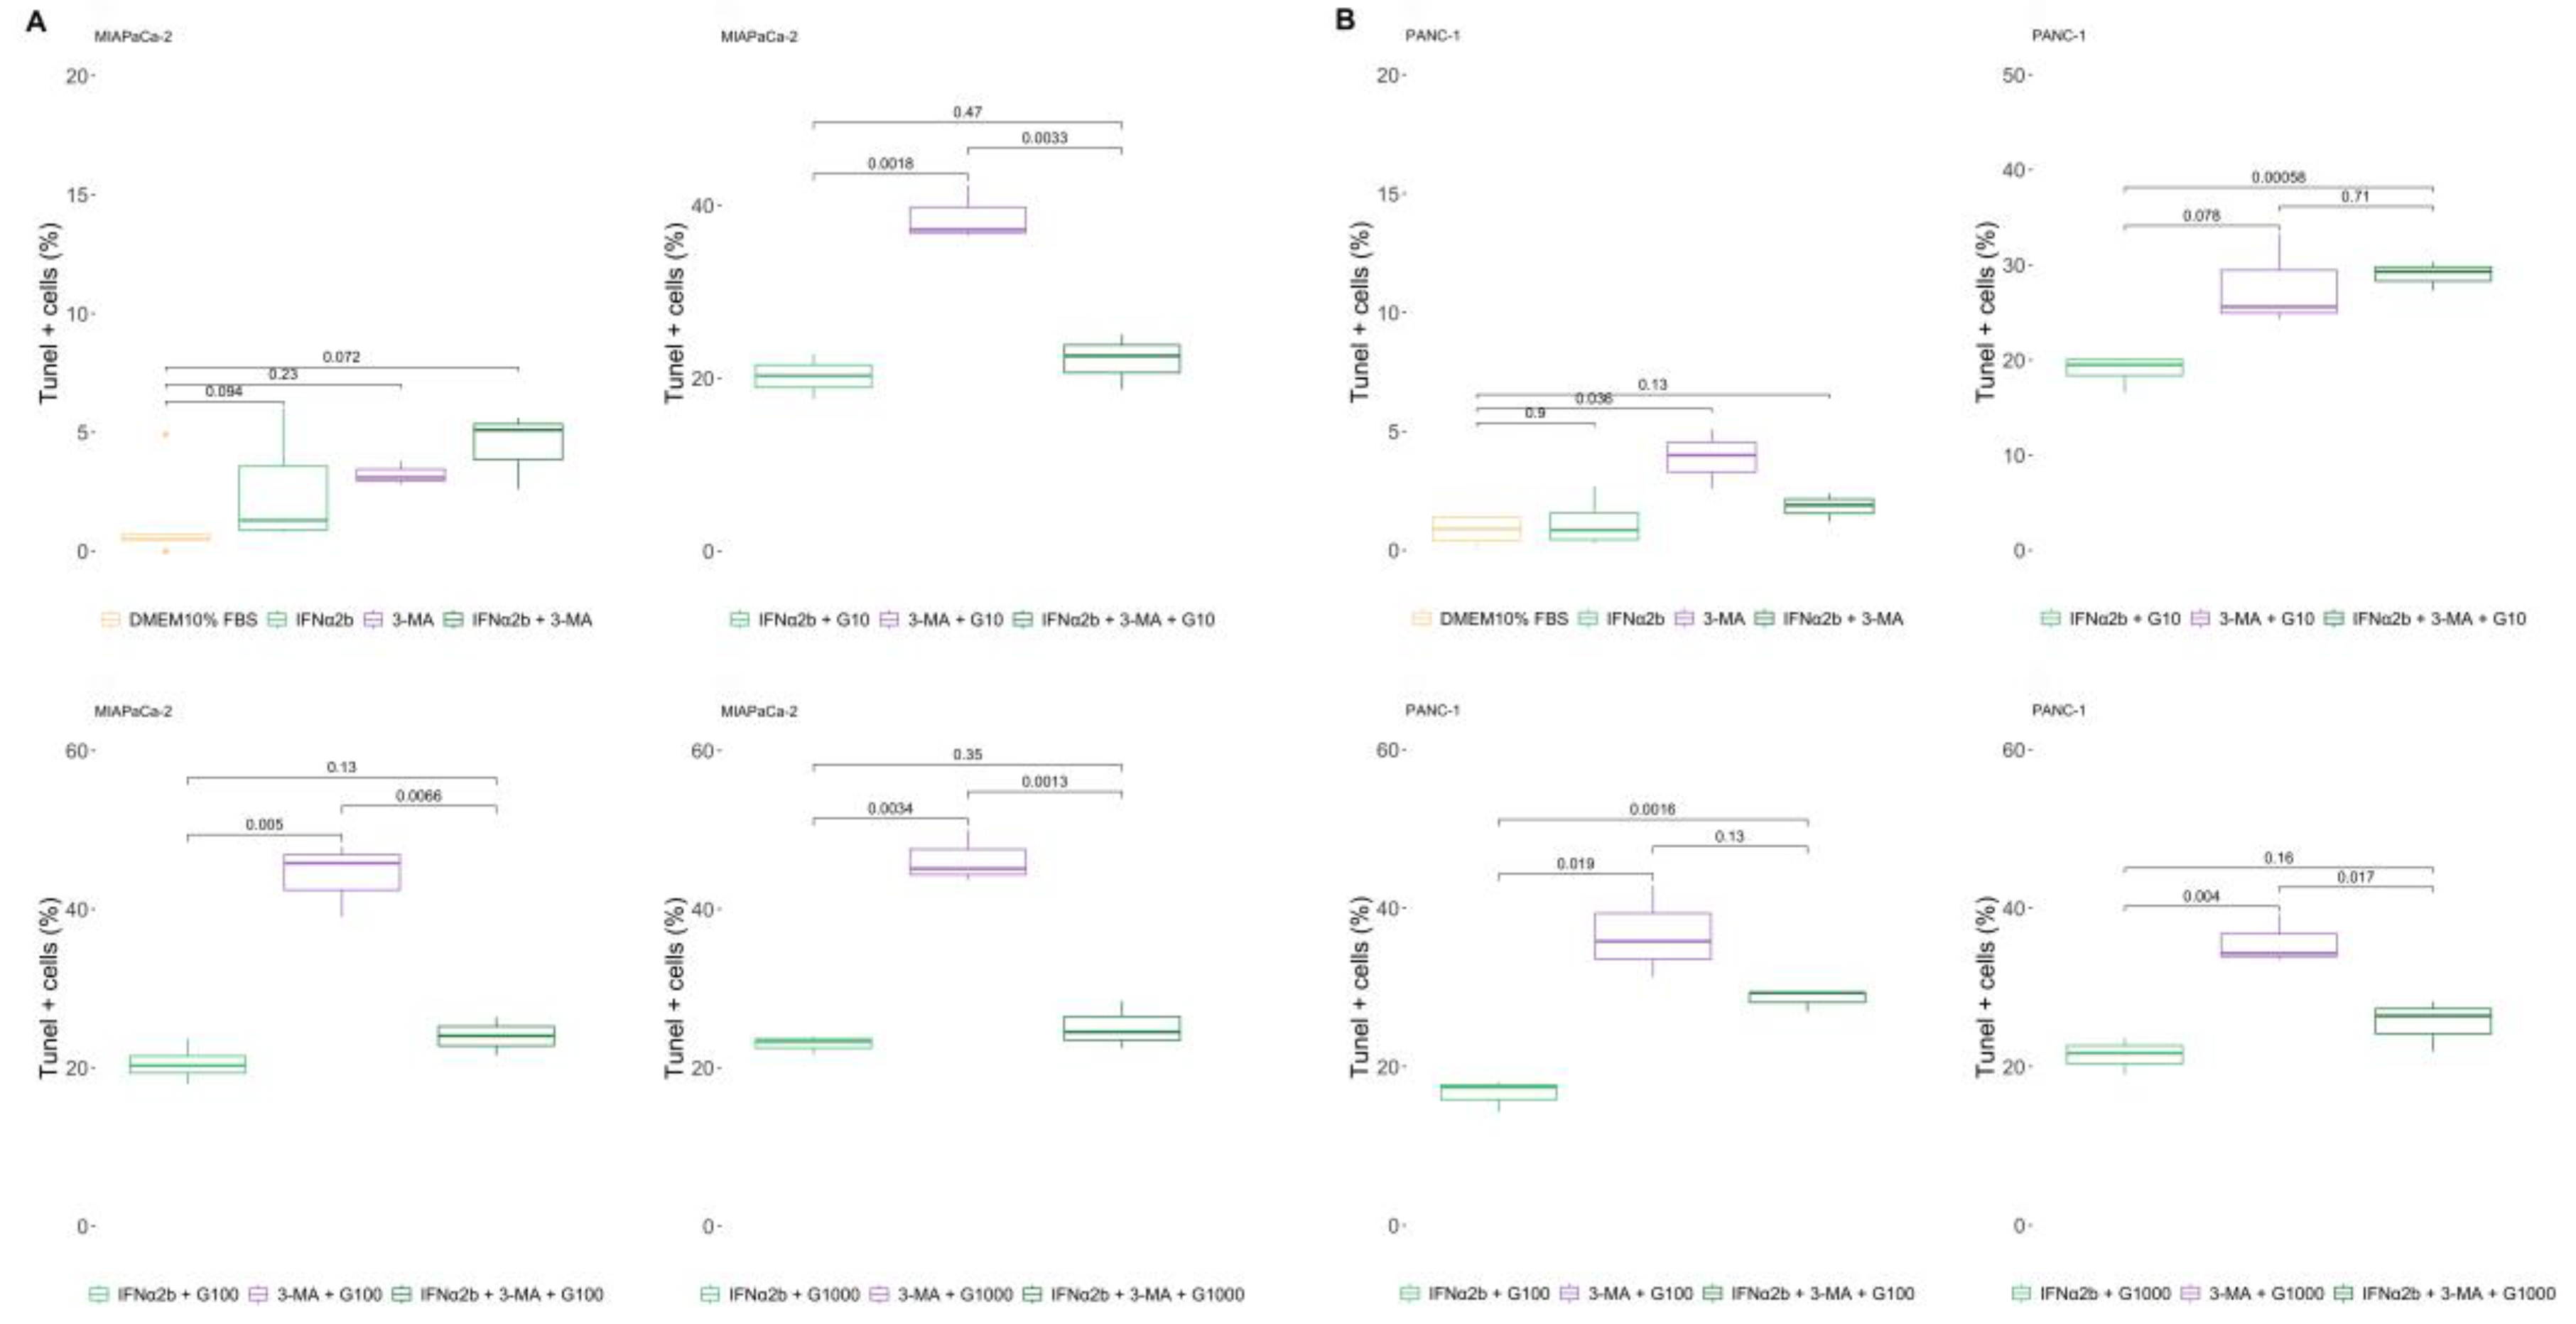
Figure 5.
IFNα2b prevents sensitization to gemcitabine induced by IFNβ1a. Cell death was evaluated via the TUNEL assay, and the results were calculated as described in the “Materials and Methods”. Box plots showing percentages of cell death obtained for MIAPaCa-2 (A) and PANC-1 (B) cells. In all the graphs, each dot represents the mean ± SD of at least 3 independent experiments.
Disclaimer/Publisher’s Note: The statements, opinions and data contained in all publications are solely those of the individual author(s) and contributor(s) and not of MDPI and/or the editor(s). MDPI and/or the editor(s) disclaim responsibility for any injury to people or property resulting from any ideas, methods, instructions or products referred to in the content. |
© 2025 by the authors. Licensee MDPI, Basel, Switzerland. This article is an open access article distributed under the terms and conditions of the Creative Commons Attribution (CC BY) license (http://creativecommons.org/licenses/by/4.0/).
Copyright: This open access article is published under a Creative Commons CC BY 4.0 license, which permit the free download, distribution, and reuse, provided that the author and preprint are cited in any reuse.


