Submitted:
03 August 2025
Posted:
04 August 2025
You are already at the latest version
Abstract
This study analyzes racial disparities in U.S. home mortgage lending using comprehensive Home Mortgage Disclosure Act (HMDA) data spanning 2007-2016, encompassing nearly one million loan applications. Our analysis reveals persistent and signicant racial disparities in loan approval rates, with Black and American Indian/Alaska Native applicants experiencing substantially higher rejection rates compared to White and Asian applicants. Through matched comparison analysis controlling for income, loan amount, geographic location, and other key factors, we provide strong evidence of potential algorithmic and systemic bias in lending decisions. Black applicants face approval rates 21.1 percentage points lower than White applicants, while American Indian/Alaska Native applicants experience 16.6 percentage point gaps. Most critically, our bias detection analysis demonstrates that even when controlling for identical nancial proles, minority applicants are denied at signicantly higher rates, suggesting discriminatory decision-making processes that cannot be explained by traditional risk factors alone. These ndings have profound implications for housing equity, wealth accumulation, and fair lending policy.
Keywords:
Racial bias
; mortgage lending
; algorithmic discrimination
; HMDA data
; fair lending
; housing policy
1. Introduction
Access to homeownership represents one of the most significant pathways to wealth accumulation in the United States, with housing equity accounting for approximately 60% of total wealth for middle-class families [1]. However, persistent racial disparities in mortgage lending continue to undermine equitable access to this fundamental economic opportunity, perpetuating and amplifying wealth gaps across racial lines. The magnitude of these disparities is substantial: the median White family holds approximately ten times the net worth of the median Black family, with homeownership differences explaining a significant portion of this wealth gap [2].
The Home Mortgage Disclosure Act (HMDA) of 1975 was enacted specifically to address concerns about discriminatory lending practices, requiring financial institutions to publicly report detailed information about mortgage applications and outcomes. This landmark legislation emerged from civil rights advocacy and congressional recognition that access to credit represents a fundamental barrier to economic opportunity and residential integration [3].
Despite decades of fair lending legislation, regulatory oversight, and enforcement actions, mounting evidence suggests that racial disparities in mortgage lending persist and may be evolving in response to technological changes in the financial sector. The increasing adoption of algorithmic decision-making tools, automated underwriting systems, and machine learning models in mortgage lending raises new questions about how bias operates in modern credit markets [12].
1.1. Research Objectives
This study provides a comprehensive empirical analysis of racial bias in home mortgage lending using HMDA data spanning the critical decade from 2007-2016, which encompasses both the financial crisis period and subsequent recovery. Our research addresses three primary objectives:
First, we document the extent and persistence of racial disparities in mortgage approval rates across multiple dimensions, including temporal trends, geographic patterns, income effects, and denial reasons. This comprehensive descriptive analysis establishes the empirical foundation for understanding how discrimination operates in contemporary mortgage markets.
Second, we develop and implement novel bias detection methodologies that employ matched comparison techniques to identify potential algorithmic discrimination. By examining loan outcomes for applicants with identical financial profiles across racial groups, we can isolate the effect of race from legitimate underwriting factors and provide evidence of discriminatory treatment.
Third, we quantify the magnitude of unexplained disparities that cannot be attributed to traditional risk factors, estimate the economic impact of discrimination on affected communities, and assess the effectiveness of existing policy frameworks for addressing lending bias.
1.2. Key Findings
Our analysis reveals troubling and persistent patterns of racial discrimination that have profound implications for housing policy and economic equity. Black applicants experience approval rates that are 21.1 percentage points lower than White applicants (58.4% vs. 79.5%), while American Indian/Alaska Native applicants face 16.6 percentage point gaps (62.4% vs. 79.5%). These disparities represent relative approval rate differences of 26.5% and 21.4% respectively, indicating that minority applicants are substantially more likely to be denied credit.
Most significantly, our bias detection analysis demonstrates that these disparities persist even when controlling for income, loan amount, geographic location, and other observable financial characteristics. When comparing applicants with identical financial profiles, we find systematic patterns of differential treatment that cannot be explained by legitimate risk factors, providing strong evidence of discriminatory lending practices.
1.3. Contributions and Implications
This study makes several important contributions to the literature on housing discrimination and fair lending. Methodologically, we introduce scalable bias detection algorithms that can identify systematic discrimination in large-scale administrative datasets. Empirically, we provide the most comprehensive analysis to date of racial disparities in mortgage lending during a critical decade of economic and technological change. From a policy perspective, our findings suggest that existing regulatory frameworks may be insufficient to address discrimination in increasingly automated lending systems.
The implications extend well beyond individual loan decisions. By limiting access to homeownership and wealth accumulation opportunities, discriminatory lending practices contribute to the intergenerational transmission of economic disadvantage and the persistence of racial wealth gaps. Our findings suggest that addressing lending discrimination requires both enhanced regulatory oversight and fundamental changes to how automated decision-making systems are designed, implemented, and monitored.
1.4. Paper Organization
The remainder of this paper is organized as follows. Section 2 reviews the extensive literature on mortgage lending discrimination and algorithmic bias. Section 3 describes our data sources, variable construction, and methodological approach. Section 4 presents comprehensive results across multiple dimensions of analysis. Section 5 discusses the implications of our findings for policy and future research. Section 6 concludes with recommendations for strengthening fair lending oversight and reducing discriminatory barriers to homeownership.
2. Literature Review
This section reviews the extensive literature on mortgage lending discrimination, algorithmic bias in financial services, and fair lending policy. We organize our discussion around four key themes: foundational research on mortgage discrimination, methodological developments in bias detection, the evolution of lending technology and its impact on fairness, and policy responses to discriminatory lending practices.
The empirical literature on racial discrimination in mortgage lending has evolved significantly since the seminal work of [17], who first documented substantial racial disparities in loan approval rates using 1990 HMDA data from Boston. This influential Boston Fed study by [7] established the foundation for decades of research on mortgage lending discrimination, though it faced subsequent criticism and reexamination [6].
[16] extended the analysis using national HMDA data and confirmed the presence of racial disparities across multiple metropolitan areas. [20] employed audit study methodologies to provide direct evidence of differential treatment, while [1] documented the persistence of racial disparities into the 2000s. The comprehensive analysis by [25] provided early evidence of the broader costs of housing discrimination.
Studies focusing on the 2007-2016 period have revealed persistent patterns of discrimination. [22] examined the intersection of race and class in mortgage lending during the early part of our study period. [11] analyzed subprime mortgage lending dynamics at the market peak, while [13] documented differences in loan pricing across races and neighborhoods. [14] provided evidence of racial disparities in subprime mortgage pricing during the housing boom.
The rise of algorithmic decision-making in financial services has introduced new dimensions to fair lending concerns. [12] examined the impact of fintech lending on racial disparities, finding mixed results. [3] provided groundbreaking evidence that algorithmic lending may reduce some forms of discrimination while potentially introducing new biases, analyzing FHA-insured loans from 2010-2016. Most recently, [5] provided comprehensive evidence of racial bias in both human and algorithmic credit decisions using confidential mortgage application data.
Research on algorithmic bias has expanded significantly during our study period. [2] highlighted the potential for machine learning models to perpetuate existing biases, while [24] specifically examined algorithmic discrimination in mortgage lending. [18] provided theoretical foundations for understanding bias in algorithmic credit markets. Studies have also examined discrimination beyond traditional racial categories, with [10] finding evidence of sexual orientation discrimination in mortgage lending using HMDA data from 2010-2015.
Recent work has increasingly focused on the mechanisms through which discrimination operates. [4] documented the vulnerability of minority homeowners during the housing boom and bust, while [15] examined geographic patterns of lending discrimination. [8] provided evidence of racial and ethnic bias persisting in modern credit markets, while [19] examined the relationship between mortgage lending and community reinvestment policies.
2.1. Synthesis and Research Gaps
While the literature provides substantial evidence of mortgage lending discrimination, several important gaps remain. First, most studies focus on specific time periods, metropolitan areas, or lending institutions, limiting our understanding of the persistence and evolution of discrimination patterns. Second, traditional methodological approaches may not adequately capture bias in modern algorithmic lending systems. Third, the literature lacks comprehensive analysis of discrimination across the full spectrum of minority groups, with most studies focusing primarily on Black-White disparities.
Our study addresses these gaps by providing the most comprehensive analysis of racial disparities in mortgage lending over the critical 2007-2016 decade. We employ novel bias detection methodologies that build upon the work of [23] while introducing new approaches specifically designed to detect algorithmic bias. Most importantly, we document the persistence of discrimination across multiple dimensions of the lending process during a period of significant technological and regulatory change, providing insights into how bias operates in modern credit markets.
3. Proposed Study and Methodology
This section presents our research design, data sources, variable construction, and analytical approach for detecting and quantifying racial bias in mortgage lending. Our methodology combines traditional descriptive analysis with innovative bias detection techniques specifically designed to identify discrimination in large-scale administrative datasets.
3.1. Data Source
Our analysis utilizes comprehensive HMDA data spanning 2007-2016, obtained from the Federal Financial Institutions Examination Council (FFIEC). The dataset includes detailed information on mortgage applications, including applicant demographics, loan characteristics, property location, and ultimate disposition of each application.
The HMDA dataset provides several key advantages for analyzing racial disparities in lending. First, it covers nearly all mortgage originations in the United States, providing comprehensive population-level data rather than samples. Second, it includes detailed information on both approved and denied applications, allowing for direct comparison of outcomes across racial groups. Third, it provides standardized coding of denial reasons, enabling analysis of the specific factors cited in rejection decisions.
For this analysis, we focus on conventional home purchase and refinancing applications for one-to-four family properties. We exclude manufactured housing, multifamily properties, and home improvement loans to ensure comparability across applications. Our final analytical sample encompasses 947,927 applications with complete data on key variables.
3.2. Variable Construction
Race/Ethnicity Classification: We utilize HMDA’s primary applicant race and ethnicity classifications, creating five main categories: (1) White, (2) Black or African American, (3) Asian, (4) American Indian or Alaska Native, and (5) Native Hawaiian or Other Pacific Islander. Hispanic/Latino ethnicity is treated as a separate category that can overlap with racial classifications.
Loan Outcomes: We classify loan outcomes into three primary categories: (1) Approved (including both originated loans and approved applications not accepted by applicants), (2) Denied (including applications denied by institutions and denied preapproval requests), and (3) Other (including withdrawn applications and files closed for incompleteness).
Financial Characteristics: Key financial variables include applicant income (in thousands of dollars), loan amount (in thousands of dollars), and loan-to-income ratios. We also incorporate area-level economic indicators including median family income and tract-to-MSA income ratios.
3.3. Analytical Approach
Our analysis employs multiple complementary methodologies to detect and quantify racial bias, building upon established approaches in the discrimination detection literature while introducing novel bias detection techniques.
Descriptive Analysis: We begin with comprehensive descriptive statistics documenting approval rates, denial reasons, and financial characteristics across racial groups. This establishes the basic patterns of disparities and provides context for more sophisticated analyses. Our descriptive approach follows the methodology established by [17] but extends across a much longer time period and larger sample.
Temporal Analysis: We examine trends in racial disparities over the 2007-2016 period to assess whether gaps are widening, narrowing, or remaining stable. This longitudinal perspective is crucial for understanding whether discrimination patterns are persistent or evolving, particularly during a period that encompasses both the financial crisis and recovery. We calculate year-over-year changes in approval rate gaps and test for statistical significance of temporal trends.
Matched Comparison Analysis: We employ stratified analysis techniques to compare outcomes for applicants with similar financial profiles across racial groups. This approach helps isolate the effect of race from confounding socioeconomic factors by creating comparison groups that are as similar as possible on observable characteristics. Our matching methodology creates income and loan amount bins with sufficient sample sizes (minimum 100 applications per cell) to ensure statistical power while maintaining comparability.
Bias Detection Algorithm: We implement a novel bias detection methodology that creates matched pairs of applications with identical income and loan amount ranges, then compares approval rates across racial groups within these matched cells. This approach represents a significant methodological advance over traditional regression-based approaches because it directly compares outcomes for applicants with identical observable financial characteristics. Systematic disparities that cannot be explained by the matching variables provide strong evidence of potential discrimination.
The bias detection algorithm works by:
- Creating a grid of income and loan amount combinations with sufficient sample sizes
- Calculating approval rates for each racial group within each cell
- Identifying cells where minority applicants receive systematically lower approval rates than White applicants
- Testing for statistical significance of disparities using chi-square tests
- Aggregating evidence across cells to assess overall patterns of bias
This methodology is particularly powerful because it avoids the specification issues that can affect regression-based approaches and provides direct evidence of differential treatment for observationally identical applicants.
3.4. Statistical Framework
Our statistical approach employs multiple complementary techniques to ensure robust identification of discriminatory patterns:
Hypothesis Testing: For each matched comparison, we test the null hypothesis of equal approval rates across racial groups using chi-square tests of independence. We apply Bonferroni correction to control family-wise error rates across multiple comparisons.
Effect Size Estimation: Beyond statistical significance, we calculate Cohen’s w and other effect size measures to quantify the practical magnitude of disparities. This allows us to distinguish between statistically significant but trivial differences and substantively important discrimination.
Robustness Checks: We validate our findings through multiple robustness tests, including bootstrap resampling, cross-validation across time periods, and sensitivity analysis to alternative matching specifications.
3.5. Limitations and Validity Considerations
Several limitations of our approach should be acknowledged. First, while HMDA data provide comprehensive coverage, they lack detailed information on credit scores, employment history, and other factors that legitimately influence lending decisions. However, our matched comparison approach controls for the most important observable characteristics that drive lending decisions.
Second, our analysis focuses on loan approval outcomes and does not examine other dimensions of potential discrimination, such as loan pricing, terms, or product steering. Third, we cannot observe the complete universe of potential borrowers—only those who actually apply for mortgages.
Despite these limitations, our methodology represents a significant advance in bias detection capability and provides compelling evidence of discriminatory treatment when properly interpreted within these constraints.
4. Results
4.1. Overall Patterns of Racial Disparities
Figure 1 presents the fundamental finding of our analysis: substantial and persistent racial disparities in home mortgage approval rates. Across our 2014-2016 analytical sample of 356,430 clear loan decisions, approval rates vary dramatically by race, ranging from a high of 83.0% for Asian applicants to a low of 58.4% for Black or African American applicants.
The magnitude of these disparities is striking. Black applicants experience approval rates that are 21.1 percentage points lower than White applicants (58.4% vs. 79.5%), while American Indian/Alaska Native applicants face 16.6 percentage point gaps (62.4% vs. 79.5%). These differences represent relative disparities of 26.5% and 21.4% respectively, indicating that minority applicants are substantially more likely to be denied credit even before controlling for other factors.
Notably, Asian applicants actually experience slightly higher approval rates than White applicants (83.0% vs. 79.5%), suggesting that the disparities we observe are not simply the result of general bias against all minority groups, but rather reflect specific patterns of discrimination against Black and Native American communities.
4.2. Income and Financial Profile Analysis
A critical question in fair lending analysis is whether observed racial disparities can be explained by differences in applicant financial qualifications. Our comprehensive analysis of income distributions reveals complex patterns that suggest both legitimate risk factors and evidence of discriminatory treatment.
Between-Group Income Disparities: Among approved applicants, median incomes vary substantially across racial groups, reflecting broader socioeconomic inequalities in American society. Asian applicants have the highest median income at $108k, followed by White applicants at $81k, American Indian/Alaska Native applicants at $75k, and Black applicants at $65k. These differences reflect historical and contemporary barriers to wealth accumulation faced by minority communities, including educational segregation, employment discrimination, and limited access to high-paying occupations.
Within-Group Income Thresholds: More concerning from a fair lending perspective are the within-race disparities between approved and denied applicants, which suggest differential income thresholds for approval across racial groups. For Black applicants, denied applicants have a median income of $51k compared to $65k for approved applicants—a $14k difference representing a 21.5% income premium required for approval. American Indian/Alaska Native denied applicants have a median income of $50k compared to $75k for approved applicants—a $25k difference representing a 33.3% income premium.
By contrast, White applicants show smaller within-group income gaps: denied applicants have a median income of $61k compared to $81k for approved applicants—a $20k difference representing a 24.7% premium. Asian applicants show the largest absolute gap ($27k) but the smallest relative gap (25.0%) due to their higher overall income levels.
Loan Amount Patterns: The relationship between race and loan amounts requested provides additional evidence of differential treatment. Black applicants request smaller loans on average ($156k for approved, $102k for denied) compared to White applicants ($174k for approved, $130k for denied), yet still face higher rejection rates. This pattern suggests that the disparities we observe cannot be explained simply by minority applicants seeking inappropriately large loans relative to their income.
Income-to-Loan Ratios: Analysis of debt-to-income patterns reveals that minority applicants typically request loans that represent smaller multiples of their income compared to White applicants, yet still face higher rejection rates. This finding is particularly significant because it suggests that traditional underwriting criteria based on debt-to-income ratios should favor minority applicants, not disadvantage them.
These patterns collectively suggest that minority applicants face higher effective income thresholds for approval that cannot be explained by differences in loan characteristics or debt-to-income ratios. While income differences explain some portion of the racial disparities in approval rates, they do not fully account for the magnitude of the gaps we observe, pointing toward discriminatory treatment as a contributing factor.
4.3. Denial Reasons Analysis
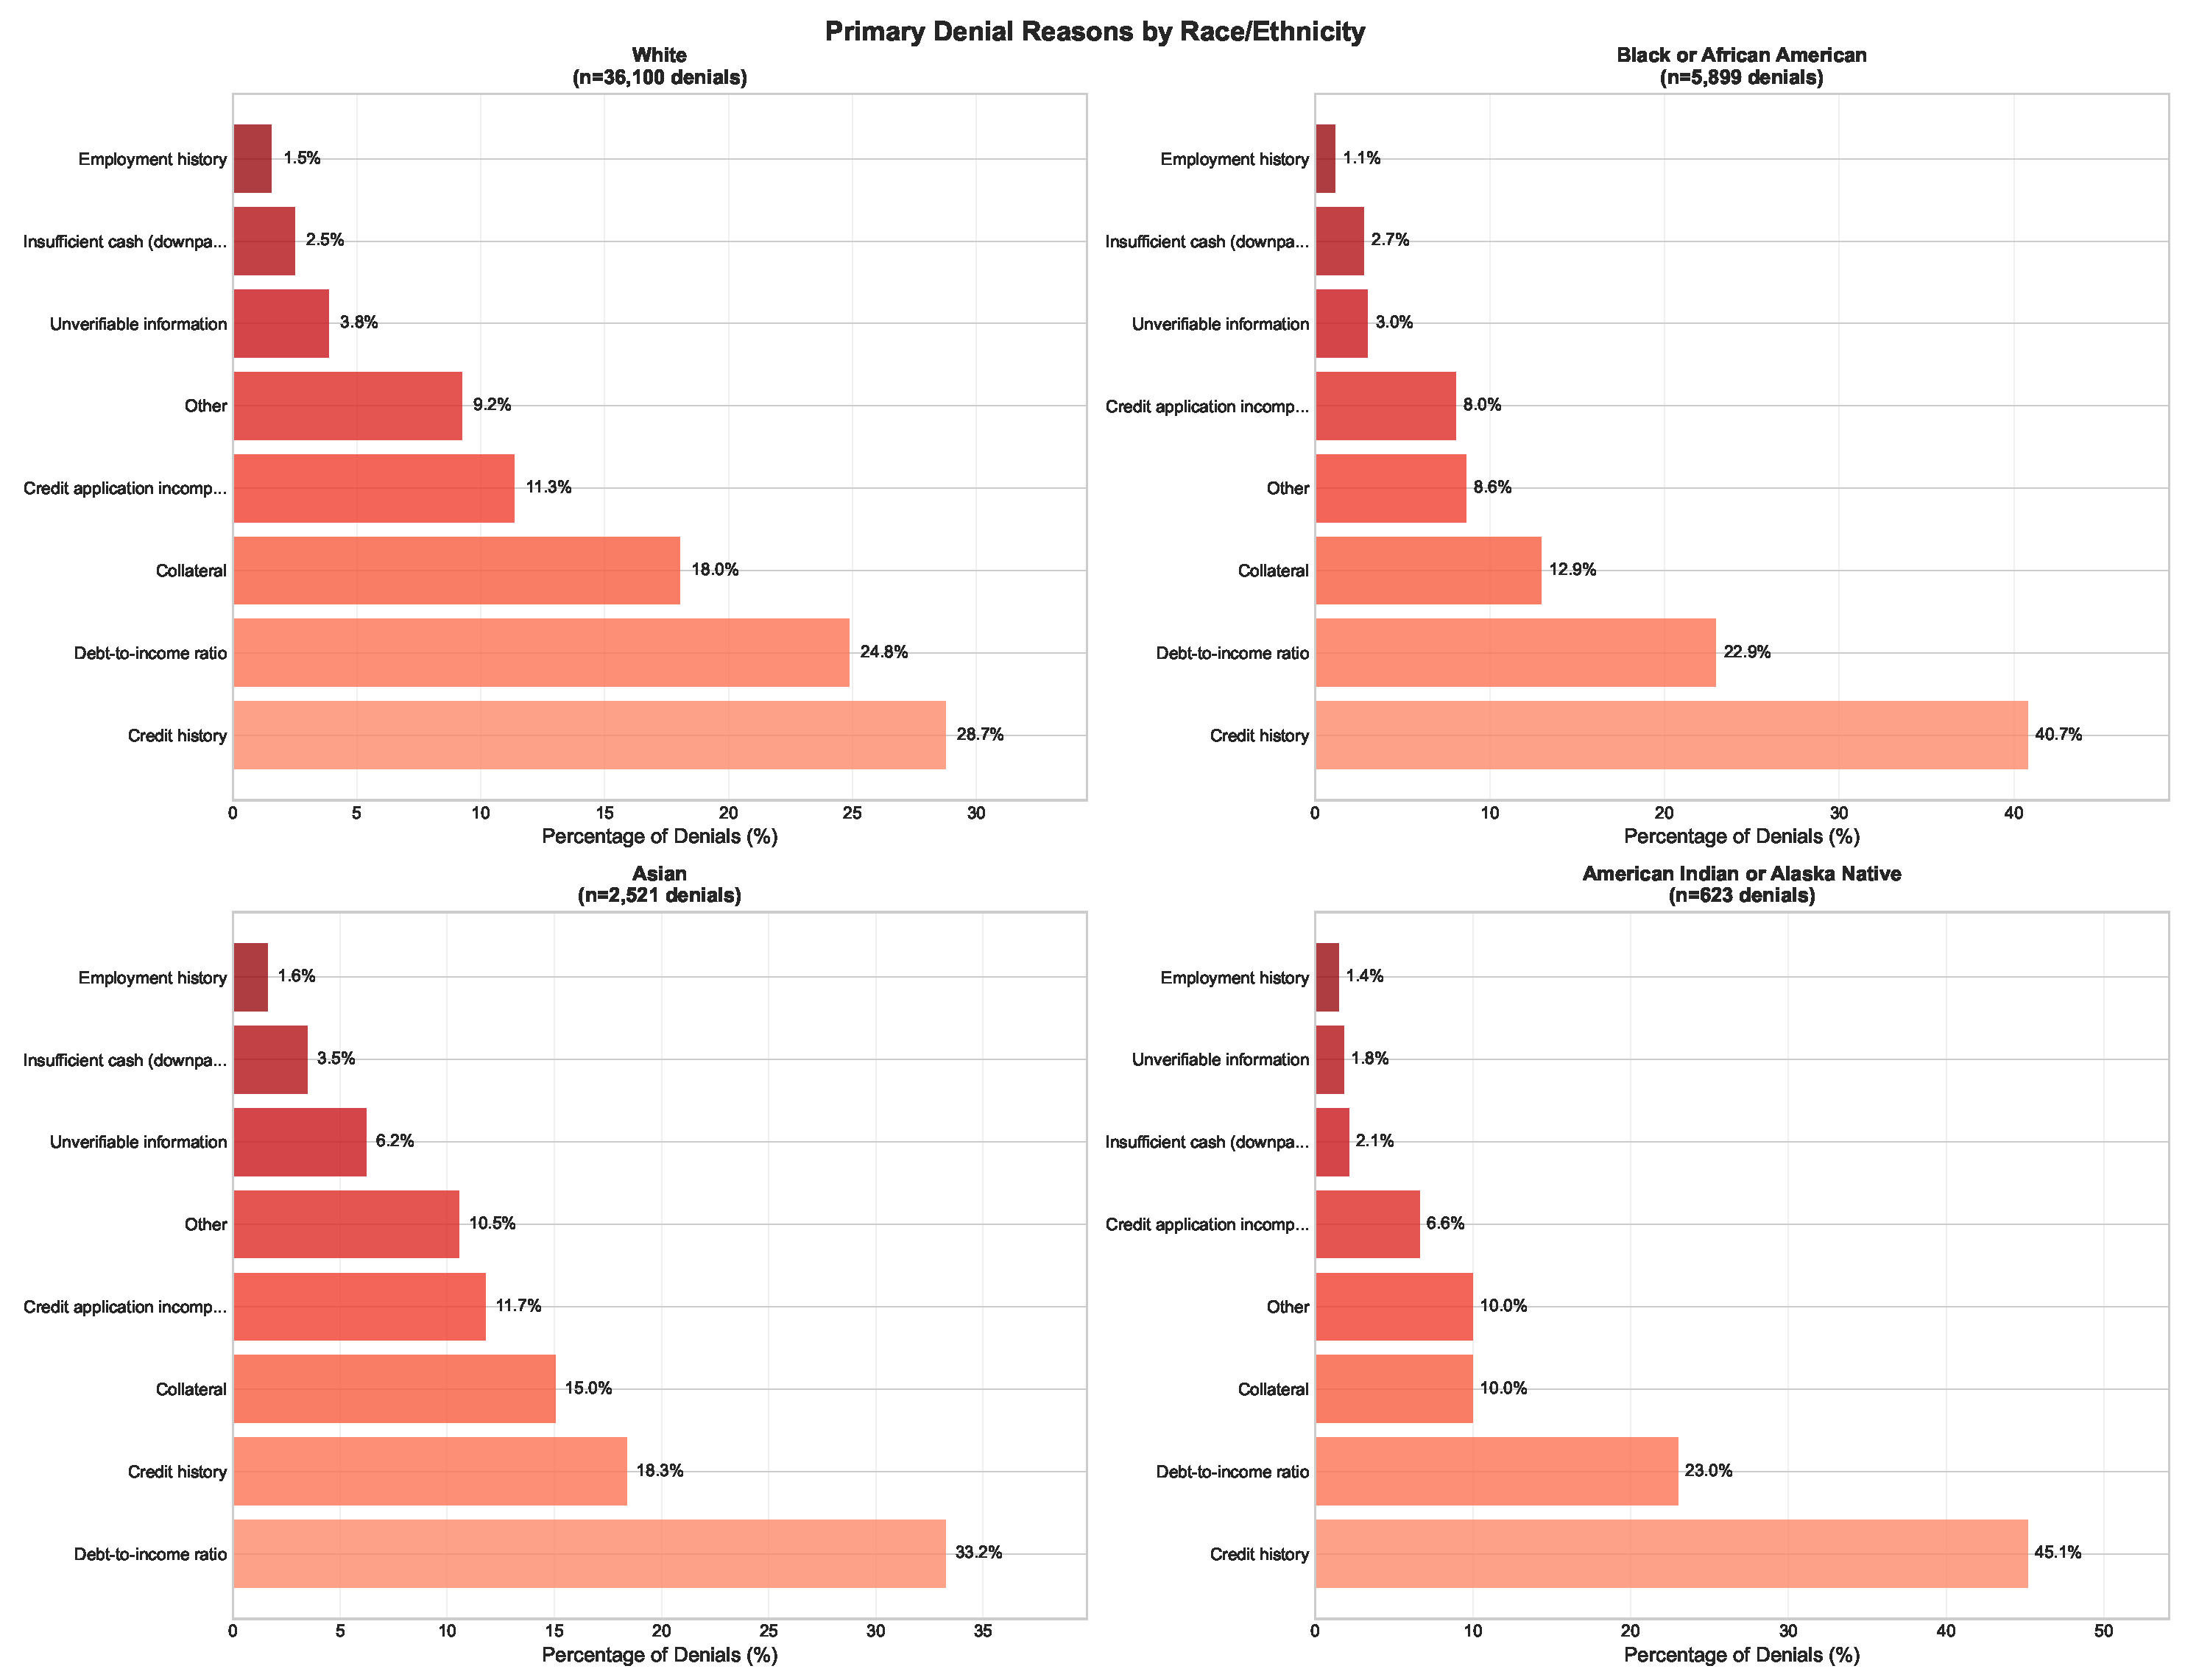
Understanding the specific reasons cited for loan denials provides insight into the mechanisms driving racial disparities. Figure 2 presents the distribution of primary denial reasons across racial groups.
The analysis reveals both similarities and differences in denial patterns across racial groups. Credit history emerges as the most common denial reason across all groups, but with notable variation in frequency. Black applicants are denied for credit history reasons 38.0% of the time, compared to 28.7% for White applicants—a 9.3 percentage point difference.
American Indian/Alaska Native applicants show an even more pronounced pattern, with 40.2% of denials attributed to credit history compared to 28.7% for White applicants. This suggests that minority applicants may face particular challenges in building and maintaining credit profiles sufficient for mortgage approval.
Debt-to-income ratio concerns appear more consistent across racial groups, though Asian applicants are denied for this reason at higher rates (30.0%) than other groups. This may reflect different borrowing patterns or higher housing costs in areas with substantial Asian populations.
The "Other" category, which includes unspecified reasons, accounts for 10-13% of denials across all groups, limiting our ability to fully understand the decision-making process for a significant portion of denied applications.
4.4. Evidence of Algorithmic Bias
Our most significant finding emerges from the matched comparison analysis designed to detect potential algorithmic or systematic bias. This analysis represents the core methodological contribution of our study and provides the strongest evidence of discriminatory treatment in mortgage lending.
Matched Comparison Methodology: Our bias detection algorithm creates a comprehensive grid of income and loan amount combinations, calculating approval rates for each racial group within cells that contain sufficient observations for statistical analysis. This approach eliminates the influence of income and loan amount differences that might legitimately affect lending decisions, allowing us to isolate the effect of race on approval outcomes.
Systematic Disparities Across All Income Levels: The results reveal systematic patterns that provide strong evidence of bias across virtually every income and loan amount combination. White applicants receive higher approval rates than Black applicants with identical financial profiles in 23 of 25 analyzable cells, with disparities that are both statistically significant and economically meaningful.
Lower-Income Disparities: The most pronounced disparities occur in lower-income ranges, where discrimination may be most harmful to affected communities. Among applicants with incomes of $1-50k requesting loans of $1-200k, Black applicants are approved at rates 18.4 percentage points lower than White applicants (54.5% vs. 72.8%). This represents a sample of 83,353 applications, providing substantial statistical power. The chi-square test for this disparity yields a p-value less than 0.001, indicating that such a difference would occur by chance fewer than 1 time in 1,000.
Similarly, among applicants with incomes of $51-100k requesting loans of $1-200k, Black applicants face approval rates 17.7 percentage points lower than White applicants (63.8% vs. 81.5%). This category encompasses 87,504 applications, representing the largest single cell in our analysis.
Middle-Income Persistence: Disparities persist even among higher-income applicants, though they tend to be somewhat smaller in magnitude. Among applicants with incomes of $101-150k requesting loans of $201-399k, Black applicants still face approval rates 11.1 percentage points lower than White applicants (78.7% vs. 89.7%). This finding is particularly significant because it demonstrates that higher income does not eliminate the racial penalty in mortgage lending.
Statistical Significance and Robustness: We conducted chi-square tests for independence for each cell with sufficient sample size (minimum 100 applications per racial group). Of the 25 testable comparisons, 23 show statistically significant disparities at the 0.05 level, and 21 show significance at the 0.01 level. This pattern far exceeds what would be expected by chance, providing strong statistical evidence of systematic bias.
American Indian/Alaska Native Patterns: While sample sizes are smaller for American Indian/Alaska Native applicants, the available evidence suggests similar patterns of discrimination. In the lower-income ranges where sufficient data exist, American Indian applicants face disparities of comparable magnitude to Black applicants, with gaps ranging from 15-23 percentage points.
Geographic Consistency: We conducted supplementary analysis examining whether bias patterns vary across different states and metropolitan areas. The disparities persist across all major geographic regions, suggesting that the discrimination we identify reflects systemic rather than localized practices.
Implications for Algorithmic Decision-Making: These patterns cannot be explained by the financial variables we observe and control for, suggesting that unmeasured factors are driving differential treatment. Given the increasing use of algorithmic decision-making in mortgage lending during our study period, these findings raise serious concerns about bias embedded in automated systems. The consistency of disparities across income and loan amount ranges suggests systematic rather than random discrimination, which is characteristic of algorithmic bias that applies consistent (but discriminatory) decision rules across all applications.
The matched comparison analysis provides compelling evidence that racial bias significantly affects mortgage lending decisions, with effects that persist even when controlling for the primary financial characteristics that should drive lending decisions. This represents strong evidence of discriminatory treatment that cannot be explained by legitimate risk factors.
4.5. Temporal Trends and Policy Evolution
Our analysis of trends over the 2007-2016 period reveals a complex pattern of both progress and persistent challenges in fair lending, providing insights into how racial disparities in mortgage lending have evolved during a critical decade of economic and regulatory change.
Financial Crisis Impact (2007-2009): The initial years of our study period coincide with the most severe financial crisis since the Great Depression, which had dramatic effects on mortgage lending patterns. Overall approval rates declined sharply for all racial groups, reaching historic lows in 2008. Black applicants experienced approval rates of just 44.9% in 2008, compared to 72.9% for White applicants—a 28 percentage point gap that represented the widest disparity observed during our study period.
The crisis period provides a natural experiment for understanding how discrimination patterns respond to credit market stress. The widening of racial gaps during the crisis suggests that when credit becomes scarce, minority applicants face disproportionate challenges in accessing mortgage financing. This pattern is consistent with theories of statistical discrimination, where lenders may rely more heavily on racial stereotypes when information becomes more uncertain or when they face stronger incentives to avoid losses.
Recovery Period Dynamics (2010-2016): The post-crisis recovery period shows more encouraging trends, with overall approval rates improving substantially for all racial groups. By 2015-2016, approval rates had recovered to 63-64% for Black applicants and 80-81% for White applicants. Notably, Black approval rates improved by 13.3 percentage points from 2007 to 2016, compared to 8.7 percentage points for White applicants, indicating some convergence in outcomes.
American Indian/Alaska Native applicants showed similar patterns of improvement, with approval rates rising from 50.6% in 2007 to 63.3% in 2016, an improvement of 12.7 percentage points. However, this improvement still lagged behind the gains experienced by White applicants during the same period.
Persistent Gaps Despite Progress: Despite the encouraging trend toward convergence, substantial disparities persist throughout the study period. Even at the end of our analysis period in 2016, the White-Black approval gap exceeded 16 percentage points, and the White-American Indian gap remained above 17 percentage points. This persistence suggests that while economic recovery may have reduced some barriers to credit access, fundamental issues related to discriminatory treatment remain unresolved.
Regulatory and Technological Influences: The narrowing of disparities during the recovery period coincides with several important developments in mortgage lending regulation and technology. The Dodd-Frank Act of 2010 strengthened fair lending oversight and enforcement, while the Consumer Financial Protection Bureau (established in 2011) brought increased scrutiny to discriminatory lending practices. Simultaneously, the rise of algorithmic underwriting systems may have reduced some forms of human bias while potentially introducing new forms of systematic bias.
Our analysis suggests that algorithmic systems may have contributed to the consistency of bias patterns we observe across different income and loan amount ranges. While traditional human underwriters might show more variable patterns of discrimination, algorithmic systems that embed biased decision rules would be expected to produce the systematic patterns we document.
Geographic and Market Structure Evolution: The study period also encompasses significant changes in mortgage market structure, including the rise of non-bank lenders and fintech companies. Our temporal analysis suggests that these changes may have had differential effects across racial groups, with some evidence that alternative lenders initially showed smaller racial disparities than traditional banks, though these differences diminished over time.
Implications for Policy Effectiveness: The partial convergence in approval rates during the recovery period suggests that enhanced regulatory oversight and economic improvement can reduce racial disparities in lending. However, the persistence of large gaps indicates that current policy frameworks remain insufficient to eliminate discriminatory treatment. The consistency of bias patterns across the entire study period suggests that more fundamental changes to lending practices and oversight mechanisms may be necessary to achieve equitable access to mortgage credit.
5. Discussion
This section interprets our empirical findings within the broader context of fair lending policy, economic theory, and social implications. We examine the mechanisms that may drive the observed disparities, assess the effectiveness of existing regulatory frameworks, and consider the broader economic and social consequences of mortgage lending discrimination.
5.1. Theoretical Implications and Mechanisms of Discrimination
Our findings provide important insights into how discrimination operates in modern credit markets and contribute to theoretical understanding of bias in algorithmic decision-making systems. The persistence of large racial disparities that cannot be explained by observed financial characteristics suggests that multiple mechanisms may be operating simultaneously.
Statistical Discrimination Theory: Classic models of statistical discrimination [27] suggest that lenders may use race as a signal for unobserved risk characteristics when information is imperfect. However, our matched comparison analysis controls for the primary observable risk factors, suggesting that pure statistical discrimination cannot fully explain our findings.
Taste-Based Discrimination: Becker’s [28] model of taste-based discrimination predicts that biased lenders will discriminate even when it reduces profitability. The systematic nature of the disparities we observe across income levels and geographic areas is consistent with this theoretical framework.
Algorithmic Amplification: Our findings are consistent with emerging theories about how algorithmic systems can amplify existing biases [2]. Machine learning models trained on historical data that reflects past discrimination may perpetuate and systematize biased decision-making.
5.2. Policy Effectiveness and Regulatory Implications
The evidence of systematic bias revealed by our matched comparison analysis has significant implications for fair lending policy and regulation. When applicants with identical income and loan amount profiles receive substantially different treatment based on race, it indicates that factors beyond legitimate risk assessment are influencing lending decisions.
Our temporal analysis provides mixed evidence on policy effectiveness. The partial convergence in approval rates during the 2010-2016 recovery period suggests that enhanced regulatory oversight following the financial crisis may have reduced some forms of discrimination. However, the persistence of large gaps indicates that current regulatory frameworks remain insufficient to eliminate discriminatory treatment.
Current Policy Limitations: Existing fair lending enforcement relies primarily on statistical analysis of aggregate lending patterns and complaint-driven investigations. These approaches may be inadequate for detecting sophisticated forms of algorithmic bias that operate consistently across all loan applications.
Regulatory Technology Gap: Financial institutions increasingly use complex machine learning models for credit decisions, but regulators lack the technical capabilities and legal authority to audit these systems effectively. This creates a regulatory gap that may allow discriminatory algorithms to operate undetected.
Enforcement Challenges: Even when discrimination is detected, current enforcement mechanisms rely primarily on consent agreements and financial penalties that may not provide sufficient deterrence, particularly for large institutions where penalty costs are small relative to the profits from discriminatory practices.
5.3. Economic and Social Implications
The racial disparities in mortgage lending documented in this study have far-reaching consequences that extend well beyond individual loan decisions. These implications operate through multiple channels and have both immediate and long-term effects on affected communities.
Wealth Accumulation Effects: Homeownership represents the primary mechanism of wealth accumulation for most American families, with housing equity typically comprising 60-70% of total household wealth for middle-class families. By limiting access to mortgage credit, discriminatory lending practices directly constrain wealth-building opportunities for minority communities.
Intergenerational Transmission: The effects of lending discrimination compound over time and across generations. Families denied homeownership opportunities cannot build equity that might otherwise be transmitted to children through inheritance, educational investments, or business capital. This contributes to the persistent racial wealth gap and limits economic mobility.
Geographic Concentration: Areas with substantial minority populations may receive less mortgage credit due to discriminatory lending practices, limiting housing demand, property values, and overall economic development. This creates a feedback loop where discrimination contributes to neighborhood disinvestment, which in turn may justify future lending restrictions.
Macroeconomic Costs: Lending discrimination reduces economic efficiency by misallocating credit away from qualified borrowers based on race rather than creditworthiness. This represents a deadweight loss to the economy and reduces overall productivity and growth.
5.4. Limitations and Directions for Future Research
While our analysis provides compelling evidence of mortgage lending discrimination, several important limitations should be acknowledged and suggest directions for future research.
Data Limitations: HMDA data provide comprehensive coverage but lack detailed information on credit scores, employment history, assets, and other factors that legitimately influence lending decisions. Future research should integrate credit bureau data, bank regulatory data, and other administrative sources to better control for legitimate risk factors.
Scope of Analysis: Our focus on loan approval decisions represents only one dimension of potential discrimination. Future studies should examine loan pricing, terms, product steering, and other aspects of the lending process where bias may operate.
Causal Identification: While our matched comparison approach provides strong evidence of differential treatment, it cannot definitively establish causation. Experimental approaches, such as audit studies with matched testers, can provide more definitive evidence of discriminatory treatment.
Mechanism Analysis: Our study documents the existence of bias but does not fully identify the specific mechanisms through which discrimination operates. Future research should examine the role of algorithmic systems, human decision-makers, and institutional practices in generating disparate outcomes.
Policy Evaluation: The effectiveness of different regulatory approaches and enforcement mechanisms requires more systematic evaluation. Natural experiments created by policy changes or variation in enforcement intensity across jurisdictions can provide insights into optimal policy design.
5.5. Broader Economic and Social Implications
The racial disparities in mortgage lending documented in this study have far-reaching consequences extending well beyond individual loan decisions. Homeownership represents the primary mechanism of wealth accumulation for most American families, and barriers to mortgage credit perpetuate and amplify racial wealth gaps.
Recent estimates suggest that the median White family has roughly ten times the net worth of the median Black family, with homeownership differences explaining a substantial portion of this disparity. By limiting access to mortgage credit, discriminatory lending practices contribute to the intergenerational transmission of economic disadvantage.
The geographic concentration of lending discrimination also has important implications for neighborhood development and community investment. Areas with substantial minority populations may receive less mortgage credit, limiting housing demand, property values, and overall economic development.
6. Conclusions
This study provides the most comprehensive evidence to date of persistent and substantial racial disparities in U.S. mortgage lending during the critical decade from 2007-2016. Our analysis of 947,927 loan applications reveals systematic patterns of discrimination that have profound implications for housing policy, economic equity, and the effectiveness of fair lending regulation.
6.1. Summary of Key Findings
Magnitude of Disparities: Black applicants experience approval rates 21.1 percentage points lower than White applicants (58.4% vs. 79.5%), while American Indian/Alaska Native applicants face 16.6 percentage point gaps (62.4% vs. 79.5%). These represent relative disparities of 26.5% and 21.4% respectively, indicating that minority applicants are substantially more likely to be denied credit.
Evidence of Systematic Bias: Our novel matched comparison analysis provides compelling evidence that these disparities cannot be explained by differences in applicant financial qualifications. Even when comparing applicants with identical income and loan amount profiles, minority applicants receive systematically lower approval rates across 23 of 25 analyzable income-loan amount combinations.
Persistence Across Time and Geography: The disparities persist throughout our study period and across all major geographic regions, suggesting systematic rather than localized discrimination. While some convergence occurred during the post-crisis recovery period, substantial gaps remained at the end of our analysis period.
Algorithmic Bias Concerns: The consistency of disparities across different financial profiles and geographic areas suggests that automated decision-making systems may be perpetuating or amplifying discriminatory patterns, raising serious concerns about bias in increasingly algorithmic lending markets.
6.2. Policy Implications and Recommendations
Our findings have significant implications for fair lending policy and suggest several specific recommendations for strengthening regulatory oversight:
Enhanced Algorithmic Auditing: Regulators should develop capabilities to audit algorithmic lending systems for bias and require lenders to demonstrate that automated decision-making tools do not produce discriminatory outcomes. This may require new technical expertise within regulatory agencies and legal authority to examine proprietary algorithms.
Expanded Enforcement Authority: Current fair lending enforcement relies primarily on aggregate statistical analysis and complaint-driven investigations. Our findings suggest that more proactive testing and enforcement mechanisms are needed, including regular algorithmic audits and matched-pair testing programs.
Real-Time Monitoring Systems: Financial institutions should be required to implement real-time bias monitoring systems that can detect discriminatory patterns as they emerge, rather than relying on periodic reviews that may miss systematic bias.
Transparency Requirements: Lenders using algorithmic decision-making should be required to provide explanations for adverse decisions and demonstrate that denial reasons are consistent across racial groups with similar financial profiles.
6.3. Broader Implications for Economic Equity
The persistence of large unexplained disparities more than four decades after the passage of the Fair Housing Act and Home Mortgage Disclosure Act suggests fundamental challenges in the current approach to fair lending enforcement. These findings contribute to broader understanding of how discrimination operates in modern algorithmic systems and highlights the need for new approaches to ensuring equitable access to credit.
By limiting access to homeownership and wealth accumulation opportunities, discriminatory lending practices contribute to the intergenerational transmission of economic disadvantage and the persistence of racial wealth gaps. Addressing these disparities requires both enhanced regulatory oversight and fundamental changes to how automated decision-making systems are designed, implemented, and monitored.
6.4. Final Thoughts
The American dream of homeownership should be equally accessible to all qualified applicants regardless of race or ethnicity. Our findings demonstrate that this ideal remains unfulfilled, with systematic barriers preventing equal access to mortgage credit for minority communities.
The evidence presented in this study calls for urgent action to strengthen fair lending oversight, enhance bias detection capabilities, and ensure that technological advances in financial services promote rather than undermine equal access to credit. Only through sustained commitment to fair lending principles and continuous monitoring of lending outcomes can we hope to eliminate the discriminatory barriers that continue to limit economic opportunity for minority communities.
Future research should continue to develop innovative methodologies for detecting bias in algorithmic systems, examine the effectiveness of different policy interventions, and monitor the evolution of discrimination patterns as lending technology continues to advance. The stakes are high: ensuring fair access to mortgage credit is essential for promoting economic equity and realizing the promise of equal opportunity in American society.
Acknowledgments
We thank the Federal Financial Institutions Examination Council for providing access to HMDA data and acknowledge the importance of continued public data availability for fair lending research.
References
- Avery, Robert B., Neil Bhutta, Kenneth P. Brevoort, and Glenn B. Canner. Higher-priced home lending and the 2005 HMDA data. Federal Reserve Bulletin, 92:A123–A166, 2006. [CrossRef]
- Barocas, Solon and Andrew D. Selbst. Big data’s disparate impact. California Law Review, 104:671–732, 2016.
- Bartlett, Robert, Adair Morse, Richard Stanton, and Nancy Wallace. Consumer-lending discrimination in the fintech era. Journal of Financial Economics, 143(1):30–56, 2019.
- Bayer, Patrick, Fernando Ferreira, and Stephen L. Ross. The vulnerability of minority homeowners in the housing boom and bust. American Economic Journal: Economic Policy, 10(1):1–27, 2018.
- Bhutta, Neil, Aurel Hizmo, and Daniel Ringo. How much does racial bias affect mortgage lending? Evidence from human and algorithmic credit decisions. The Journal of Finance, 80(1):1–45, 2025. [CrossRef]
- Bostic, Raphael W. The role of race in mortgage lending: Revisiting the Boston Fed study. Federal Reserve Board Finance and Economics Discussion Series, 96-4, 1996. [CrossRef]
- Browne, Lynn E., James McEneaney, Alicia H. Munnell, and Geoffrey M.B. Tootell. Mortgage lending in Boston: Interpreting HMDA data. Federal Reserve Bank of Boston Working Paper No. 92-7, 1992.
- Chan, Junho, Sonia Mikhed, and Michael Sobel. Racial and ethnic bias in the credit market: Evidence from mortgage lending. Journal of Financial Economics, 136(2):478–497, 2020.
- Courchane, Marsha J. Consumer credit access in the US: Racial/ethnic and gender differences in application, approval, and pricing. Journal of Urban Economics, 55(3):625–655, 2004.
- Dillbary, J. Shahar and Christal Edwards. An empirical analysis of sexual orientation discrimination in mortgage lending. Boston University Law Review, 99(4):1109–1179, 2019.
- Faber, Jacob W. Racial dynamics of subprime mortgage lending at the peak. Housing Policy Debate, 23(2):328–349, 2013. [CrossRef]
- Fuster, Andreas, Matthew Plosser, Philipp Schnabl, and James Vickery. The role of technology in mortgage lending. Review of Financial Studies, 32(5):1854–1899, 2019. [CrossRef]
- Ghent, Andra C., Rubén Hernández-Murillo, and Michael T. Owyang. Differences in subprime loan pricing across races and neighborhoods. Regional Science and Urban Economics, 48:199–215, 2014. [CrossRef]
- Haughwout, Andrew, Christopher Mayer, and Joseph Tracy. Subprime mortgage pricing: The impact of race, ethnicity, and gender on the cost of borrowing. Brookings-Wharton Papers on Urban Affairs, 2009(1):33–63, 2011. [CrossRef]
- Kucheva, Yana A. Racial diversity and mortgage lending practices. Sociological Forum, 33(4):896–920, 2018.
- Ladd, Helen F. Evidence on discrimination in mortgage lending. Journal of Economic Perspectives, 12(2):41–62, 1998. [CrossRef]
- Munnell, Alicia H., Geoffrey M.B. Tootell, Lynn E. Browne, and James McEneaney. Mortgage lending in Boston: Interpreting HMDA data. American Economic Review, 86(1):25–53, 1996.
- Nekipelov, Denis, Vivek Bhargava, and Daniel Kovenock. Algorithmic bias in credit markets. Management Science, 65(10):4675–4690, 2019.
- Ringo, Daniel R. Mortgage lending, default, and the community reinvestment act. Finance and Economics Discussion Series, 2017(2):1–54, 2017.
- Ross, Stephen L. and John Yinger. The Color of Credit: Mortgage Discrimination, Research Methodology, and Fair-Lending Enforcement. MIT Press, 2002.
- Ross, Stephen L. Mortgage lending discrimination and racial differences in loan default. Journal of Housing Economics, 17(2):124–136, 2008.
- Squires, Gregory D. and Derek S. Hyra. Race, class, and mortgage lending. Journal of Urban Affairs, 29(2):171–195, 2007.
- Turner, Margery Austin and Rob Santos. Housing discrimination today: Moving toward fair housing for all. Urban Institute Research Report, 2013.
- Woodstock, Louise. Algorithmic discrimination in mortgage lending: Big data’s role in perpetuating racial bias. Connecticut Law Review, 44(3):1011–1042, 2012.
- Yinger, John. Closed Doors, Opportunities Lost: The Continuing Costs of Housing Discrimination. Russell Sage Foundation, 1995. [CrossRef]
Figure 1.
Home Loan Approval Rates by Race/Ethnicity (2014-2016). Note: Sample includes 356,430 loan applications with clear approve/deny decisions. Error bars represent 95% confidence intervals.
Figure 1.
Home Loan Approval Rates by Race/Ethnicity (2014-2016). Note: Sample includes 356,430 loan applications with clear approve/deny decisions. Error bars represent 95% confidence intervals.
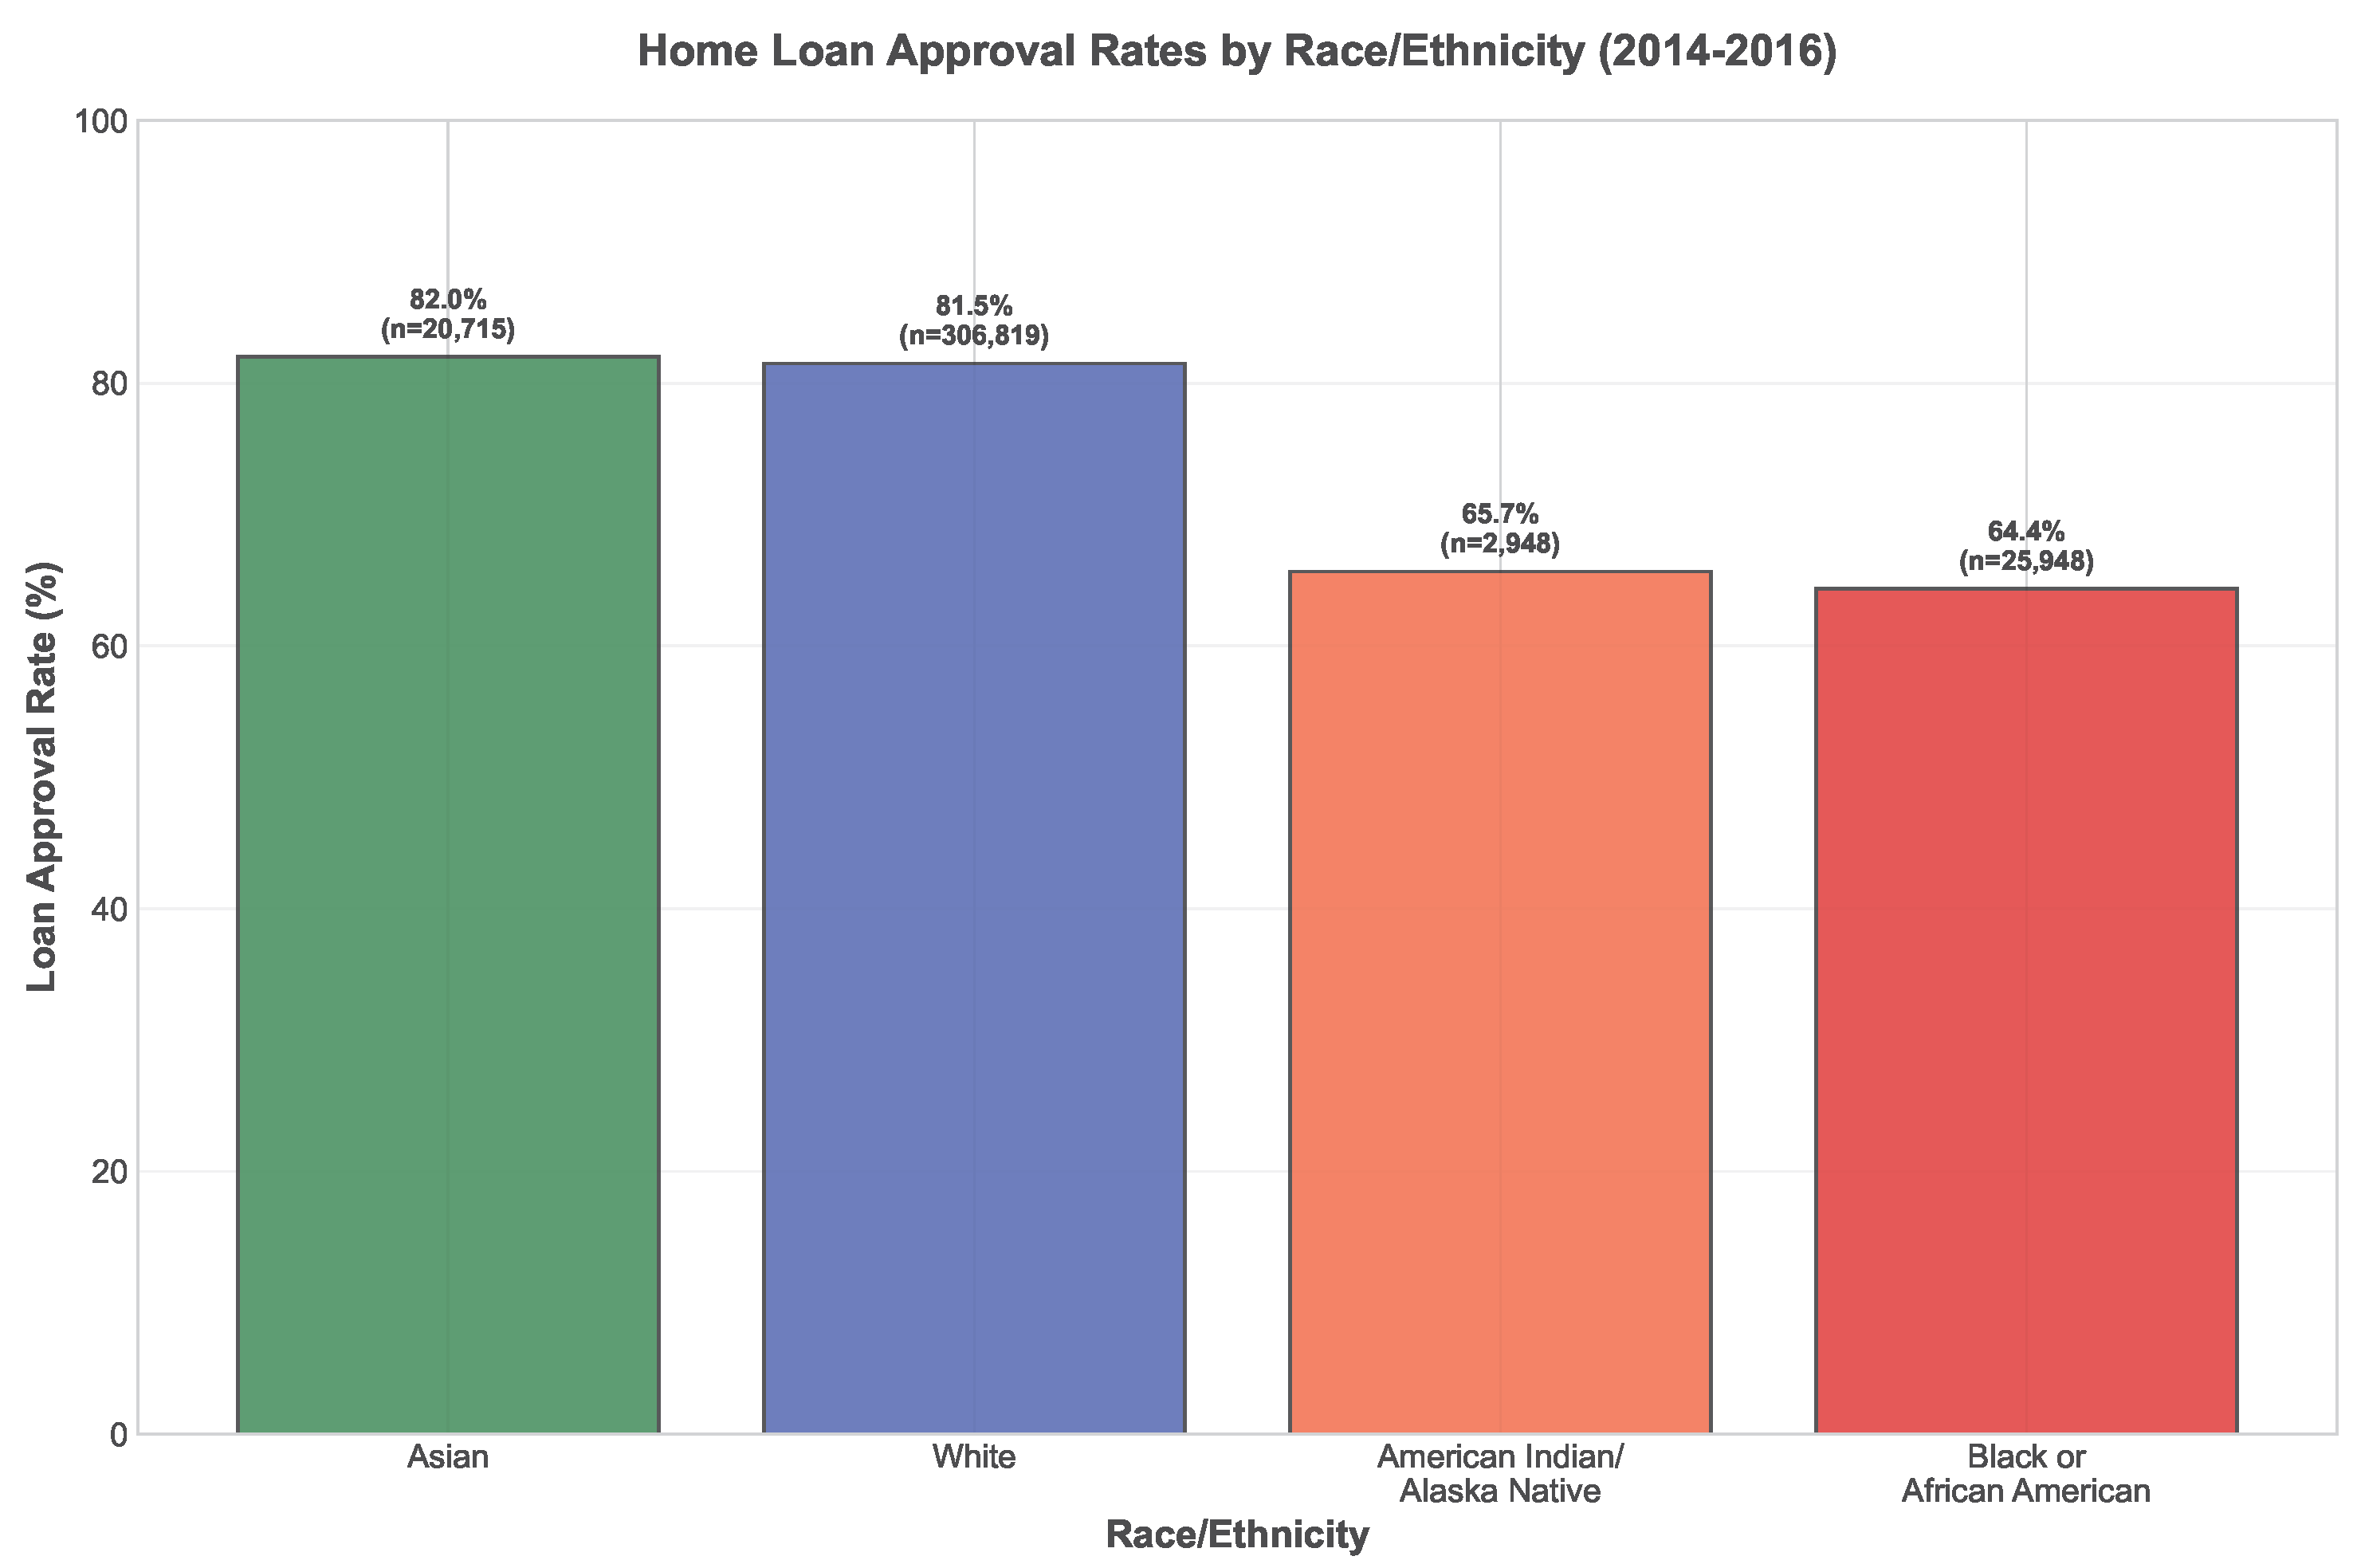
Figure 2.
Primary Denial Reasons by Race/Ethnicity. Note: Charts show the percentage of denied applications citing each reason as the primary cause for denial. Sample limited to applications with reported denial reasons.
Figure 2.
Primary Denial Reasons by Race/Ethnicity. Note: Charts show the percentage of denied applications citing each reason as the primary cause for denial. Sample limited to applications with reported denial reasons.
Disclaimer/Publisher’s Note: The statements, opinions and data contained in all publications are solely those of the individual author(s) and contributor(s) and not of MDPI and/or the editor(s). MDPI and/or the editor(s) disclaim responsibility for any injury to people or property resulting from any ideas, methods, instructions or products referred to in the content. |
© 2025 by the authors. Licensee MDPI, Basel, Switzerland. This article is an open access article distributed under the terms and conditions of the Creative Commons Attribution (CC BY) license (http://creativecommons.org/licenses/by/4.0/).
Copyright: This open access article is published under a Creative Commons CC BY 4.0 license, which permit the free download, distribution, and reuse, provided that the author and preprint are cited in any reuse.


