
Submitted:
22 July 2025
Posted:
23 July 2025
You are already at the latest version
Abstract
Since the 2008 housing crisis, institutional investors have increasingly acquired single-family homes across U.S. metropolitan regions, converting them into rental properties. This rise of In-stitutional Single-Family Rentals (ISFRs) has reshaped suburban housing markets, particularly in areas undergoing demographic change. Focusing on the greater Nashville region—where insti-tutional landlords have acquired over 13,000 homes since 2010—this study investigates the spatial distribution of ISFRs and their associations with African American population shifts. Using American Community Survey data, county property records, and transaction data from major ISFR operators, we apply spatial analysis and multivariate regression modeling to assess neigh-borhood-level dynamics. Results indicate that ISFR clusters are concentrated in areas with sig-nificant African American population growth. Regression analyses show a positive association between ISFR density and African American population increase, along with correlations to lower household income and larger household size. African American renters are disproportionately concentrated in ISFR-heavy neighborhoods, pointing to constrained homeownership opportuni-ties. By framing these patterns within urban sustainability’s social equity dimension, this research highlights how ISFR proliferation, as a form of housing financialization, challenges equitable homeownership and community stability. These findings call for policies fostering socially sus-tainable housing systems to support economic viability, social justice, and community resilience in urban regions.
Keywords:
Institutional Single-Family Rental (ISFR)
; African American communities
; housing
; social equity
; financialization
; urban sustainability
; Nashville
1. Introduction
The post-2008 U.S. housing landscape has experienced a fundamental shift, marked by the rise of institutional investment in single-family residential (SFR) properties. This transformation was catalyzed by large-scale foreclosures during the financial crisis, which enabled institutional investors to acquire thousands of single-family homes and convert them into rental properties [1]. While this shift has national significance, its implications are particularly pronounced for African American households, who have historically faced systemic barriers to wealth accumulation and homeownership. In Nashville, Tennessee, where institutional investors have acquired over 13,000 single-family homes since 2010, the resulting competition in the housing market may disproportionately impact African American households seeking affordable homeownership opportunities [2,3].
This study investigates the spatial relationships of ISFRs and demographic shifts within the African American community in the greater Nashville region. By focusing on neighborhoods with high ISFR densities, this research examined whether African American households—many of whom are relocating to suburban areas in pursuit of affordability—are increasingly concentrated in communities dominated by corporate landlords. This process may reflect deeper racialized housing inequities, as institutional investors leverage financial and technological resources to acquire properties, potentially sidelining middle-income African American households in the competition for homeownership [4].
Findings from this study demonstrate a positive association between the neighborhoods that experience high number of ISFR presence and the ones registering a high influx of African Americans. We found a higher percentage of rentership among African Americans in neighborhoods with high number of ISFRs—suggesting institutional investors are targeting the African American community for rentership. These findings signal a structural shift away from homeownership pathways for African American families in Nashville.
Framed within the social equity pillar of urban sustainability, this study highlights the intersection of race, financial investment practices, and access to affordable housing. In doing so, it seeks to inform equitable housing policies capable of mitigating the displacement and wealth erosion risks facing African American households in rapidly transforming urban regions.
2. Background
Institutional Single-Family Rentals (ISFRs)
The growth of Institutional Single-Family Rentals (ISFRs) represents a significant structural change in U.S. housing markets since the 2008 foreclosure crisis. ISFRs are single-family homes owned by institutional investors such as private equity firms, real estate investment trusts (REITs), and large corporate landlords. Unlike traditional small-scale landlords, these entities operate portfolios of hundreds or thousands of properties acquired primarily as financial assets [5]. Following the 2008–2009 crisis, the volume of foreclosures provided institutional investors with unprecedented access to distressed housing stock, which they converted into rental units [6]. While Gould Ellen and Goodman [7] estimate that institutional investors currently control just over 3 percent of the national single-family rental stock, their presence is concentrated in select metropolitan markets, where their influence is substantial.
The existing literature has focused on mapping investor ownership and quantifying holdings in growth regions, such as Atlanta, Phoenix, Nashville, and Charlotte [8,9,10]. Studies highlight the operational strategies of these firms, including rapid acquisition cycles and rent-setting technologies, which allow them to outcompete traditional buyers [11]. However, identifying ISFR portfolios remains methodologically challenging. Shelton and Seymour [12] demonstrate that institutional firms commonly use complex ownership structures, such as layered LLCs and subsidiary brands, to obscure the scale of their holdings. For example, three mega-investors operating in Atlanta collectively own over 19,000 single-family homes held under approximately 190 different corporate names.
What is an institutional single-family investor? The Urban Institute developed a typology defining institutional investors as firms holding at least one hundred single-family properties [13]. Their research identified 32 “mega-investors” operating across 33 markets. These large-scale entities often target suburban markets undergoing population growth and housing affordability transitions—characteristics that make regions like Nashville particularly lucrative to institutional investors. Despite this growing body of research, few studies address how this spatial expansion intersects with neighborhood demographic change, particularly concerning African American households.
Financialization of Single-Family Rentals
The proliferation of ISFRs is situated within the broader phenomenon of housing financialization, wherein real estate is managed as a financial asset rather than as a site of residence or community stability [14]. Financialization of housing refers to investment strategies that prioritize exchange value over use value, leading to residential properties being incorporated into investment portfolios and subject to profit-driven decision-making [15]. While this trend has historically affected multi-family rental markets and commercial real estate, the post-2008 period has seen the extension of financialization to single-family homes, enabled by technological advances and new investment models [16,17].
Major firms involved in the ISFR sector, such as AMH, Blackstone and Pretium Partners (Progress Residential), utilize algorithmic acquisition strategies and centralized property management systems to maximize return on investment. Progress Residential—a dominant operator in the Nashville market—controls over $57 billion in assets. Blackstone, one of the world’s largest investment firms, holds assets exceeding $1.1 trillion. These firms leverage technological platforms to facilitate rapid acquisition and streamline rent collection, tenant screening, and property maintenance [18]. In this context, local housing markets are increasingly defined by the capital strategies of global investment firms, raising questions about long-term affordability and competition for single-family housing.
The literature identifies financialization as a mechanism that intensifies market pressures in neighborhoods undergoing demographic transition. While prior studies emphasize the financial strategies underlying corporate housing acquisition [19], few directly link financialization processes to localized changes in housing access for historically marginalized populations. This gap is particularly relevant to understanding ISFR expansion in racially segregated metropolitan areas such as Nashville, where the commodification of single-family housing intersects with long-standing racial inequities in homeownership and wealth accumulation.
Race, Demographic Change, and Institutional Investors
The role of institutional investors in reshaping housing opportunities for African American households is a growing concern within urban housing research. Several studies have documented the disproportionate presence of institutional landlords in majority Black neighborhoods or in neighborhoods with significant non-white populations. In Memphis, Tennessee, Harrison et al. [20] find that large institutional investors concentrate acquisitions in neighborhoods with high shares of African American and Hispanic residents, particularly focusing on lower-cost, newer properties. Similarly, An [21] demonstrates that institutional investor expansion in Atlanta corresponds with declining African American homeownership rates, an effect not attributed to small-scale landlords.
Other studies corroborate these patterns. Abood [22], analyzing financialization processes in Los Angeles, identifies middle-income African American neighborhoods as particularly vulnerable to corporate acquisition, leading to displacement from traditional homeownership pathways. However, not all research frames ISFR expansion solely as exclusionary. Ihlanfeldt and Yang [23] argue that the growth of single-family rentals may provide suburban access to minority renters who were previously excluded from such neighborhoods. Khaleel and Hanlon [24] similarly report that ISFRs can expand suburban rental access to nonwhite populations, although this access tends to be limited to middle-income households rather than those in lower-income brackets.
Despite these findings, there is a notable absence of spatially focused analyses assessing the relationship between ISFR proliferation and African American tenancy patterns. Existing studies largely quantify aggregate ownership trends or demographic characteristics, but do not examine whether areas experiencing significant ISFR growth concurrently witness increased concentrations of African American renters or shifts in housing tenure for this population.
To address these gaps, in this research, associations between ISFRs and African Americans were explored focusing on the Nashville region. Four questions are addressed in this research: i) What is the spatial distribution pattern of ISFRs in the Nashville region? ii) What is the spatial distribution pattern of African Americans in the region? iii) Are there spatial relationships between high presence of ISFRs and African Americans? and iv) How does housing tenure differ between African Americans and Whites relative to different levels of ISFR presence across neighborhoods?
3. The Study Area—Greater Nashville Region
The study was conducted in seven major counties surrounding Nashville, TN - Davidson, Rutherford, Williamson, Maury, Wilson, Sumner, and Montgomery counties (Figure 1). Except for Montgomery County, all other counties are part of the Nashville Metropolitan Statistical Area (MSA). These counties were selected for the study due to rapid population growth, and their strong interconnectedness in economic activities, transportation infrastructure, and regional planning initiatives. In addition, the counties have experienced substantial real estate inflation, which encourages people to rent over buying houses. Each county has also experienced increases in the presence and market share of ISFRs.
The Nashville metropolitan region has experienced substantial demographic change and real estate transformation over the past three decades, profoundly affecting housing accessibility, particularly for African American households. Davidson County, the region’s core, grew by nearly 200,000 residents between 1990 and 2021, reaching a population of over 700,000. While the African American population grew steadily, the non-Hispanic White population declined until 2010, followed by modest growth. Gentrification has reshaped urban neighborhoods, especially east and northeast of downtown, contributing to declining homeownership rates—from 60% in 2010 to 57% in 2021—and rising displacement. Median household income for African Americans ($49,137) remains significantly lower than that of Whites ($77,293). Rapid home price appreciation, from under $200,000 pre-2015 to over $430,000 by 2023, pushed the home price-to-income ratio from 3.2 to nearly 6.0. Since 2010, institutional investors have acquired over 3,000 single-family homes in suburban areas, reshaping the region’s housing market.
Rutherford County, southeast of Davidson, offers newer housing stock and relatively affordable prices. Between 2010 and 2021, the population increased by 85,000, with African Americans comprising 15% by 2021. ISFRs acquired roughly 5,800 homes, capitalizing on foreclosures and post-recession recovery. Despite gains in education, African Americans earn only 74% of White household income, and the price-to-income ratio increased to 4.7 by 2023, reflecting tighter housing affordability.
Williamson County, Tennessee’s wealthiest, remains largely insulated from institutional investment due to high land costs, low density zoning, and elevated home prices (median over $800,000 in 2023). While cities like Franklin and Spring Hill saw limited ISFR activity post-2008 crisis, the county’s high homeownership rate (84%) and strong median income ($116,492) continue to limit investor access. African Americans represent only 4% of the population, and while incomes are generally high, affordability remains an issue due to extreme price growth and zoning barriers.
Wilson County’s population more than doubled from 1990 to 2021, with African American residents increasing by over 2,500 since 2010. Educational attainment has improved, yet homeownership remains unequal—55% for African Americans vs. 79% for Whites. Home prices surged to $456,000 in 2023, with a home price-to-income ratio of 5.4, underscoring growing affordability gaps and potential investor interest.
Sumner County also experienced strong population growth, adding over 5,000 African American residents between 2010 and 2021. While educational and income disparities have narrowed, significant homeownership gaps persist—76.5% for Whites versus 43.4% for African Americans—and investors now hold over 1,100 properties.
Maury County’s affordability has attracted both middle-income buyers and ISFRs, who own about 700 properties. Despite educational gains, African American households earn just 65% of their White counterparts. Home prices rose from under $250,000 in 2021 to nearly $360,000 by 2023, increasing barriers to ownership.
Montgomery County, though outside the official metropolitan boundary, has absorbed migration from Nashville. With a 32% population increase since 2010, African Americans comprise 19% of the population. ISFR activity surged, growing from fewer than 20 properties in 2017 to over 550 by 2023, drawn by modest prices and demand from displaced urban households.
4. Methods
A quantitative approach was adopted in this study to investigate spatial distributions of ISFRs and to determine their associations with African American communities in the Nashville region.
The data in this research originate from multiple sources, including the U.S. Census Bureau’s American Community Survey (ACS) 5-year estimates, county property appraisal records, and publicly available transaction data from major ISFR operators such as American Homes 4 Rent, Progress Residential, Amherst/CPI, and Tricon. Socioeconomic variables were extracted from ACS data for the years 2010 and 2020, while information on ISFRs used in this study extends through 2022.The spatial analysis was performed in ArcGIS Pro 3.2 and quantitative models were developed in SPSS statistical software.
The Analysis was performed at the census tract (CT) level, since CTs are considered ideal for representing neighborhoods. CT-level information on homeownership, income, racial composition, education, and housing tenure was available from ACS. However, the ISFR data was collected at an individual level, which were geocoded, and then, aggregated at the CT-level.
Analysis performed in this research was divided into three stages: i) spatial distribution of ISFRs and African Americans; ii) Associations of ISFRs and African Americans; and iii) housing tenure differences in ISFR dense areas.
In the first stage, spatial distribution patterns of ISFRs and African Americans were evaluated. ISFR density of each CT was first determined. The density was calculated by the number of ISFRs present in each CT relative to the average of the number of ISFRs present in the county to which the CT belonged. CTs with values equal or above “1” indicated higher than average ISFR density and CTs with values below “0.5” indicated lower than average ISFR density. CTs with in-between values register moderate ISFR density.
Similarly, the spatial distribution pattern of African Americans was investigated by evaluating changes/gains in the African American population between 2010 and 2020 in a CT relative to the average for the percentage of change in African Americans in the county to which the CT belonged. A CT with a value of “1” and above indicates a high gain of African Americans, and values below “0.5” suggests a low gain. Any value between “0.5” and “1” indicates a moderate level of gain in African Americans.
In the second stage, we investigated the relationship between the ISFR density and demographic changes visually and through statistical modelling. First, plausible associations between African Americans and ISFRs was determined by investigating spatial overlaps between CTs with high ISFR density and CTs registering a high increase in African Americans. To statistically confirm the relationship, we developed multivariate regression models. Models were developed for all seven counties collectively, and separately for each county to evaluate county-specific variations in the relationships. ISFR density of CTs was the dependent variable in the models, and the independent variables included percentage changes in African American population, percentage changes in non-Hispanic White population, median household income, and average household size.
Finally, in the third stage, differences in housing tenure patterns between African American households and White households were evaluated using a T-test. The significance of the differences in the ownership and rentership rates between Whites and African Americans in the high and low ISFR density CTs were determined. Higher rentership of African Americans in the high ISFR density CTs compared to the Whites could indicate higher capitalization of ISFRs on the minority community.
5. Results and Discussion
5.1. Spatial Distribution of ISFRs
The total number of ISFRs and their average density by county is presented in Table 1. Rutherford County (5,738), followed by Davidson (3,081) and Sumner (1,105) counties, contain the largest share of ISFRs in the greater Nashville region. Rutherford County, with 36 ISFR per square mile also ranks the highest in ISFR density among all counties. The number is low (between 4 to 7 ISFRs per square mile) for other counties. Maury, Montgomery, and Davidson counties had the lowest ISFR density in 2023.
The small population size of Maury and Montgomery counties explains the low ISFR density in these counties. However, Davidson County, the most populated county in Nashville, registering a low ISFR density is surprising. The low ISFR density in Davidson County has two potential reasons. One, the rapid escalation of housing values in Davidson County relative to the MSA is not the most favorable climate for ISFR investments. Two, ISFRs typically target homes 20 years old or less to reduce rehabilitation costs. The suburban fringe has a much higher concentration of newer suburbs than Davidson County. Also, Davidson has experienced the lowest population growth (about 10%) between 2010 and 2020, compared to other counties in the Nashville region, including Williamson (37%), Rutherford (29%), Sumner (20%), and Wilson (28%).
Table 2 when studied together with Table 1 reveals that more than half of the total ISFRs emerged between 2019 and 2020, indicating an exponential growth. Table 2 summarizes the number of ISFRs added per year from 2012 to 2022 by county. In Rutherford County, 71 percent of the total ISFRs emerged between 2019 and 2022, while the numbers for Davidson and Maury counties were 78 and 81 percent, respectively. The rest of the counties experienced more than 50 percent growth between 2019 and 2022.
The spatial distribution of high ISFR density CTs in the Greater Nashville Region, presented in Figure 2, reveals interesting patterns. The map shows a CT’s level of ISFR density relative to the average ISFR density for the county to which the CT belongs.
In the Nashville region, high ISFR density CTs emerged along the I-24 corridor, extending from Davidson to Rutherford County maintaining a spatial contiguity. In Davidson County, such CTs mostly appeared in Hermitage, Madison, and Antioch areas. Murfreesboro, La Vergne, and Smyrna contained majority of the high SFR density CTs in the Rutherford County. The high ISFR density CTs clustered in Mt. Juliet along the I-40 corridor in Wilson County. In Sumner County, Hendersonville, and parts of Goodlettsville, witnessed omnipresence of the high-density traces. High ISFR density CTs in Williamson and Maury counties clustered in Thompson Station, Spring Hill, and parts of Columbia. Not surprisingly, Clarksville—the major city in Montgomery County—contained the highest number of high ISFR density CTs.
Overall, the spatial distribution pattern indicates possibilities of further intensification and expansion of ISFRs in those areas where they are currently clustered. CTs that registered high density are often surrounded by moderate density CTs (values between 0.5 and 1). Future growth of ISFRs is expected in the surrounding the areas where high ISFR density CTs are present. The phenomenon is because institutional investors rely on economies of scale. Locations where a cluster of ISFRs exist provides an ideal location to expand investments.
5.2. African American Population Trends
Table 3 shows the composition of African Americans in the selected counties and their CTs. Not surprisingly, African Americans had the highest representation in Davidson County (24 percent) in 2020, followed by Montgomery (20 percent), Maury (19 percent), and Rutherford (16 percent) counties. However, in terms of growth, Rutherford County registered the highest percentage growth (85.18 percent) in the African American population between 2010 and 2020, followed by Sumner (59.35 percent) and Wilson (51.75 percent) counties. Davidson County has the highest number of African Americans as a whole, but it experienced the smallest African American population growth rate of the largest counties. The phenomenon indicates suburbanization and an exit of African Americans from Davidson to peripheral counties.
Figure 3 further illustrates the suburbanization of African Americans. It shows the level of gain in African Americans between 2010 and 2020 for a CT, relative to the average gain in African Americans for the county to which the CT belongs. A CT with a value of “1” and above indicates a high gain of African Americans, and values below “0.5” suggests a low gain. Any value between “0.5” and “1” indicates a moderate level of gain in African Americans.
The high gain CTs in Davidson County are located in Antioch, Hermitage, Forest Hill, Bellevue, and less populated areas northwest of Nashville such as Joelton. These areas are the peripheral suburbs, away from Nashville downtown. The high gain CTs further expanded to the adjacent counties, including Sumner, Wilson, Rutherford, and Williamson, maintaining a spatial contiguity, along I-65, I-40, and I-24 corridors. Columbia and Mt. Pleasant of Maury County, and Clarksville in Montgomery County, although did not maintain a spatial contiguity, registered the omnipresence of high gain CTs in the city, manifesting a high growth of African Americans.
Overall, the growth of high gain CTs from traditional clusters of African Americans in the Davidson County to the peripheries emphatically points towards the growing suburbanization trends among African Americans in the Greater Nashville Region. While gentrification and consequent displacement of African Americans has catalyzed population growth to distant suburbs, regional decentralization has opened up suburbs to nonwhites. The changing settlement pattern of African Americans has potentially attracted institutional investors to capitalize on middle income households fleeing urban communities.
5.3. Association between African Americans and ISFRs
The analysis of the relationship between the growth of ISFRs and African Americans indicates several positive associations. A spatial analysis where the spatial overlap between the CTs registering high ISFR density and the CTs that experienced high gain in African American was evaluated.
Table 4 data shows that more than half of the high ISFR density CTs in Davidson County overlapped with the CTs that experienced a high gain in African Americans between 2010 and 2020. These tracts mostly appeared in the eastern part of the county, in areas like Hermitage, Donelson and Antioch (Figure 4). The overlap was much higher in Williamson, Wilson, Montgomery, and Maury Counties. In Williamson County, three of four CTs were found have high ISFR density and African American population gain clustered in Thompson Station and Spring Hill (Figure 4). About half of the high ISFR density CTs in Wilson County overlapped with CTs experiencing high African American gain, appearing in Mt. Juliet and Lebanon. In Montgomery County, about 70 percent of the high ISFR density CTs overlapped with high African American CTs, which mostly clustered in Clarksville. Only three CTs in Maury were found to have high ISFR density, and two of them overlapped with the CTs that experienced high African American gain (Table 4 and Figure 4). Although Rutherford County experienced a substantial growth of African Americans, the overlap between high density ISFR CTs and the CTs experiencing high gain in African Americans was only 30 percent, clustering around the county seat of Murfreesboro (Figure 4). Regardless, the data show that the Nashville region has experienced an overall higher concentration of ISFRs in areas that have experienced a high growth of African Americans, indicating a positive association.
To further verify the findings regarding association, and assess the strength of the relationship, a regression analysis was performed. The dependent variable of the regression model was the concentration of ISFRs of the CTs, and the independent variables include change in the percentages of African Americans, Whites, median household income, and household size. We performed the analysis for all counties together, and for individual counties. Table 5 summarizes the results.
Data from Table 5 show a strong positive association between African American population growth and ISFRs. Results from the regression analysis performed on all counties together shows a statistically significant positive association between ISFR density and the change in African Americans, and a negative association with the change in White population. The analysis also demonstrated a significantly positive association with household size and a significantly negative association with income. Thus, the regional regression model shows that ISFR density significantly increased in areas that had higher growth of African Americans, lower income growth, and larger family size.
The relationships between ISFR density and African American population growth prevailed in all counties, but the magnitude of the relationships varied. For example, a statistically significant positive association between ISFRs and African Americans was found in Davidson, Rutherford, and Montgomery counties. The relationship was positive but not statistically significant in in Maury, Sumner, Williamson, and Wilson Counties. Similarly, a positive association of household size and a negative association of median household income with ISFR density was found in all counties except for Maury and Wilson. This finding is consistent with the business model of ISFRs—they market to middle class households with large families seeking a suburban lifestyle and perceived higher quality schools.
However, it is noteworthy that no statistically significant association was detected between ISFR density and changes in white population gain between 2010 and 2020. The negative association between ISFR density and White gain of CTs points to fact that the increase in ISFR density mostly materialized in those areas that had lower increase in White populations.
A negative relationship between median household income and ISFR density was found. The negative relationship indicates that ISFR density has increased in those areas that registered relatively lower median household income. This relationship was statistically significant in Rutherford, Sumner, Williamson, and for all counties when studied together. While not the purpose of this study, these data suggest higher income whites are fleeing the rapidly transforming ISFR communities.
5.4. Housing Tenure Among African Americans and Whites in High ISFR Density Areas
Results from the analysis performed earlier suggests that the ISFRs appear in high density areas that have witnessed high rates of African American population growth. However, it does not confirm whether African Americans are disproportionately renting houses from ISFRs. Therefore, differences in housing tenure between African Americans and Whites in high ISFR density areas were statistically investigated to verify whether tracts with high African American population growth have higher rentership rates. Higher rentership in a ISFR dense CT suggests a higher chance of renting from an ISFR. A T-test has been performed to assess differences in housing tenure among White and African American households between high ISFR density and low ISFR density CTs. Results from the comparison of means using a T-test are in Table 6.
Data suggests that Black rentership is significantly high and White rentership is significantly low in the high ISFR density census tracts (CTs) compared to the low ISFR density CTs. When all counties were considered, White rentership was 9 percent lower in high ISFR density CTs compared to the low ISFR density CTs. Conversely, Black rentership was 9 percent higher in high ISFR density CTs relative to their counterparts. In Davidson County, White rentership was 12 percent lower and Black rentership was 9 percent higher in high ISFR density areas. Similar patterns were observed in Rutherford and Montgomery counties, although the relationship was not statistically significant in Maury, Sumner, Williamson, and Wilson counties. In terms of ownership, Black ownership rates were significantly higher in high ISFR density CTs compared to the low ISFR density CTs. The opposite was true for White ownership. When all counties were considered, White ownership in high ISFR density areas was 5.53 percent lower compared to the low ISFR density areas, while Black ownership was 9.33 percent higher in high ISFR density areas compared to their counterparts. This pattern repeated in Davidson, Rutherford, and Montgomery counties.
Findings from the regression analysis and comparison of housing tenure among high and low ISFR density areas together suggest that institutional investors are capitalizing on Black rentership, particularly on those that are lower income (relative to the county) and have larger families.
6. Conclusion
This study examined the spatial distribution pattern of ISFRs in the Nashville region, the association between areas with high ISFR concentrations and the growth of the African American population, and the differences in housing tenure between African Americans and Whites across neighborhoods characterized by varying levels of ISFR presence.
By investigating seven counties in the Nashville region, the analysis revealed that the bulk of ISFR investments were located in Rutherford County and southeastern Davidson County, particularly along the I-24 corridor. In certain census tracts, institutional investors owned more than 30 percent of housing units, which aligns with the business models of institutional investors that typically seek newer homes in middle-class neighborhoods characterized by quality public school districts. Significantly, regions with elevated ISFR density corresponded with neighborhoods that have witnessed notable growth in African American populations, especially in Davidson, Rutherford, and Montgomery counties.
The socio-economic data indicated that the median income of African American households was lower than White households. Despite this disparity, educational attainment among African Americans is on the rise, signaling the emergence of a growing middle class. The increased density of ISFRs corresponds with neighborhoods that have median incomes below the county average coupled with higher-than-average household sizes. It is important to keep in mind that high density ISFR CTs have grown in neighborhoods with relatively lower-income African Americans who have larger families. This does not mean that African Americans in these suburban enclaves are low-income. On the contrary, ISFRs target middle- to upper-income households of all races. The point is that these communities have been attractive to African American households that are seeking suburban lifestyles. In the suburban context, the African American median household income lags White median household income. Furthermore, African American renters are disproportionately represented in these densely populated ISFR areas, suggesting that institutional investors are capitalizing on their demographic shifts and financial circumstances.
The overlap of high ISFR growth areas with neighborhoods that show significant gains in African American populations indicates a troubling trend wherein ISFRs could be exacerbating existing inequities in the Nashville region. As African Americans migrate to neighborhoods that typically have lower homeownership rates and higher rental rates, they risk entering a cycle of long-term renting instead of homeownership. Homeownership remains a critical vehicle for wealth accumulation and is the dominant form of intergenerational wealth for African Americans; when families delay or deny opportunities for ownership, they forfeit potential investments and generational wealth as evidenced by the tenfold disparity in financial assets between African Americans and White Americans.
While homeownership competition is rising due to ISFRs and individual households competing for scarce affordable housing, our analysis did not specifically identify any instances of overt discrimination against African Americans by institutional investors. This would require interviews with renters and a separate type of analysis. Most interactions between prospective renters and SFR companies are digital, with race not a primary factor in rental applications. However, the implications of this research suggest a shift in wealth accumulation from potential homeowners to global investors, perpetuating existing systemic inequalities.
A limitation of this study is the absence of comprehensive demographic and socio-economic data on ISFR renters, preventing the investigation of individual-level associations. Future research should prioritize gathering detailed information on ISFR renters to validate whether these investments disproportionately target or attract African American populations.
In conclusion, this study provides foundational insights into the spatial dynamics of ISFR proliferation and its relationship with African American population transition in the Nashville MSA. Importantly, the findings underscore a pressing need to incorporate the sustainability dimension into housing policy discussions, particularly given the interconnected nature of economic viability, social equity, and environmental responsibility. The rise of ISFRs challenges not only local housing markets but also broader principles of sustainable urban development. As institutional investors capitalize on communities with high rentership and lower homeownership, organized strategies must emerge to ensure equitable access to housing and promote long-term sustainable development that encourages homeownership, community stability, and wealth creation. ISFRs argue that their business model provides new levers of suburban access to nonwhite households. Our data does not disprove this claim, but it begs the question of access without fiscal equity. Addressing these issues through a sustainability framework becomes paramount to understand whether financialization of housing exacerbates socio-economic inequalities or fosters resilient urban environments that can support diverse, equitable communities.
Author Contributions
Conceptualization, R.H. and K.C.; methodology, R.H.; data curation, R.H. and K.C.; formal analysis, R.H.; investigation, R.H.; resources, RH and K.C.; writing—original draft preparation, R.H. and K.C.; writing—review and editing, R.H. and K.C.; visualization, R.H.; supervision, R.H.; project administration, R.H. All authors have read and agreed to the published version of the manuscript.
Data Availability Statement
The data used in this research are open to public for free. The socioeconomic data can be downloaded from the United States Census Bureau website: https://www.census.gov/data/datasets.html. Data on institutional single family rental can be retrieved from publicly available property transaction records.
Conflicts of Interest
The authors declare no conflicts of interest.
References
- D’Lima, W.; Schultz, P. Buy-to-rent investors and the market for single-family homes. J. Real Estate Finance Econ. 2020, 64, 116–152. [Google Scholar] [CrossRef]
- Tanrıvermiş, H. Possible impacts of COVID-19 outbreak on real estate sector and possible changes to adopt: A situation analysis and general assessment on Turkish perspective. J. Urban Manag. 2020, 9, 263–269. [Google Scholar] [CrossRef]
- Bełej, M.; Figurska, M. 3D modeling of discontinuity in the spatial distribution of apartment prices using Voronoi diagrams. Remote Sens. 2020, 12, 229. [Google Scholar] [CrossRef]
- Froufe, M.M.; Chinelli, C.K.; Guedes, A.L.A.; Haddad, A.N.; Hammad, A.W.A.; Soares, C.A.P. Smart buildings: Systems and drivers. Buildings 2020, 10, 153. [Google Scholar] [CrossRef]
- Ullah, F.; Sepasgozar, S.M.E.; Wang, C. A systematic review of smart real estate technology: Drivers of, and barriers to, the use of digital disruptive technologies and online platforms. Sustainability 2018, 10, 3142. [Google Scholar] [CrossRef]
- Gould Ellen, I.; Goodman, L. Single-family rentals: Trends and policy recommendations. The Hamilton Project, Brookings. 2023. Available online: https://www.brookings.edu/wp-content/uploads/2023/11/20231102_THP_SingleFamilyRentals_OnePager.pdf (accessed on 11 June 2025).
- Seymour, E.; Shelton, T.; Sherman, S.A.; Akers, J. The metropolitan and neighborhood geographies of REIT- and private equity–owned single-family rentals. J. Urban Aff. 2023, 45, 1–25. [Google Scholar] [CrossRef]
- Immergluck, D. Renting the dream: The rise of single-family rentership in the Sunbelt metropolis. Hous. Policy Debate 2018, 28, 814–829. [Google Scholar] [CrossRef]
- Chilton, K.; Silverman, R.M.; Chaudhry, R.; Wang, C. The impact of single-family rental REITs on regional housing markets: A case study of Nashville, TN. Societies 2018, 8, 93. [Google Scholar] [CrossRef]
- Simonton, D.; Liebson, R. Investor-owned rentals reshape suburban markets. UNC Urban Inst. 2021. Available online: https://ui.unc.edu/ (accessed on 11 June 2025).
- Colburn, G.; Walter, R.J.; Pfeiffer, D. Capitalizing on collapse: An analysis of institutional single-family rental investors. Urban Aff. Rev. 2021, 57, 1590–1625. [Google Scholar] [CrossRef]
- Shelton, T.; Seymour, E. Horizontal holdings: Untangling the networks of corporate landlords. Ann. Am. Assoc. Geogr. 2024, 114, 1–13. [Google Scholar] [CrossRef]
- Aalbers, M. The Financialization of Housing: A Political Economy Approach; Routledge: London, UK, 2016. [Google Scholar]
- Hicks, R.; Stephens, M. Housing, the welfare state and poverty: On the financialization of housing and the dependent variable problem. Hous. Theory Soc. 2022, 40, 78–95. [Google Scholar] [CrossRef]
- Fields, D. Unwilling subjects of financialization. Int. J. Urban Reg. Res. 2017, 41, 588–603. [Google Scholar] [CrossRef]
- Byrne, M.; Norris, M. Housing market financialization, neoliberalism and everyday retrenchment of social housing. Environ. Plan. A Econ. Space 2022, 54, 182–198. [Google Scholar] [CrossRef]
- Nethercote, M. The techno-politics of rental housing financialization: Real estate service companies and technocratic expertise in Australia’s build to rent market. Econ. Geogr. 2022, 99, 191–219. [Google Scholar] [CrossRef]
- Aalbers, M.B.; Rolnik, R.; Krijnen, M. The financialization of housing in capitalism’s peripheries. Hous. Policy Debate 2020, 30, 481–485. [Google Scholar] [CrossRef]
- Harrison, A.; Immergluck, D.; Walker, J. Single-family rental (SFR) investor types, property conditions, and implications for urban neighbourhoods: Evidence from Memphis, Tennessee. Hous. Stud. 2024, 1–21. [Google Scholar] [CrossRef]
- An, B.Y. The influence of institutional single-family rental investors on homeownership: Who gets targeted and pushed out of the local market? J. Plan. Educ. Res. 2023, 0(0). [CrossRef]
- Abood, M. Securitizing Suburbia: The Financialization of Single-Family Rental Housing and the Need to Redefine Risk. Master’s Thesis, Massachusetts Institute of Technology, Cambridge, MA, USA, 2017. Available online: https://dspace.mit.edu/handle/1721.1/111349 (accessed on 11 June 2025).
- Ihlanfeldt, K.; Yang, C.F. Single-family rentals and neighborhood racial integration. J. Hous. Econ. 2021, 53, 101780. [Google Scholar] [CrossRef]
- Khaleel, S.; Hanlon, B. The rise of single-family rentals and the relationship to opportunity neighbourhoods for low-income families with children. Urban Stud. 2023, 60, 2706–2724. [Google Scholar] [CrossRef]
- Gould Ellen, I.; Goodman, L. Single-family rentals: Trends and policy recommendations. The Hamilton Project, Brookings. 2023. Available online: https://www.brookings.edu/wp-content/uploads/2023/11/20231102_THP_SingleFamilyRentals_OnePager.pdf (accessed on 11 June 2025).
Figure 1.
Greater Nashville Region – The Study Area.
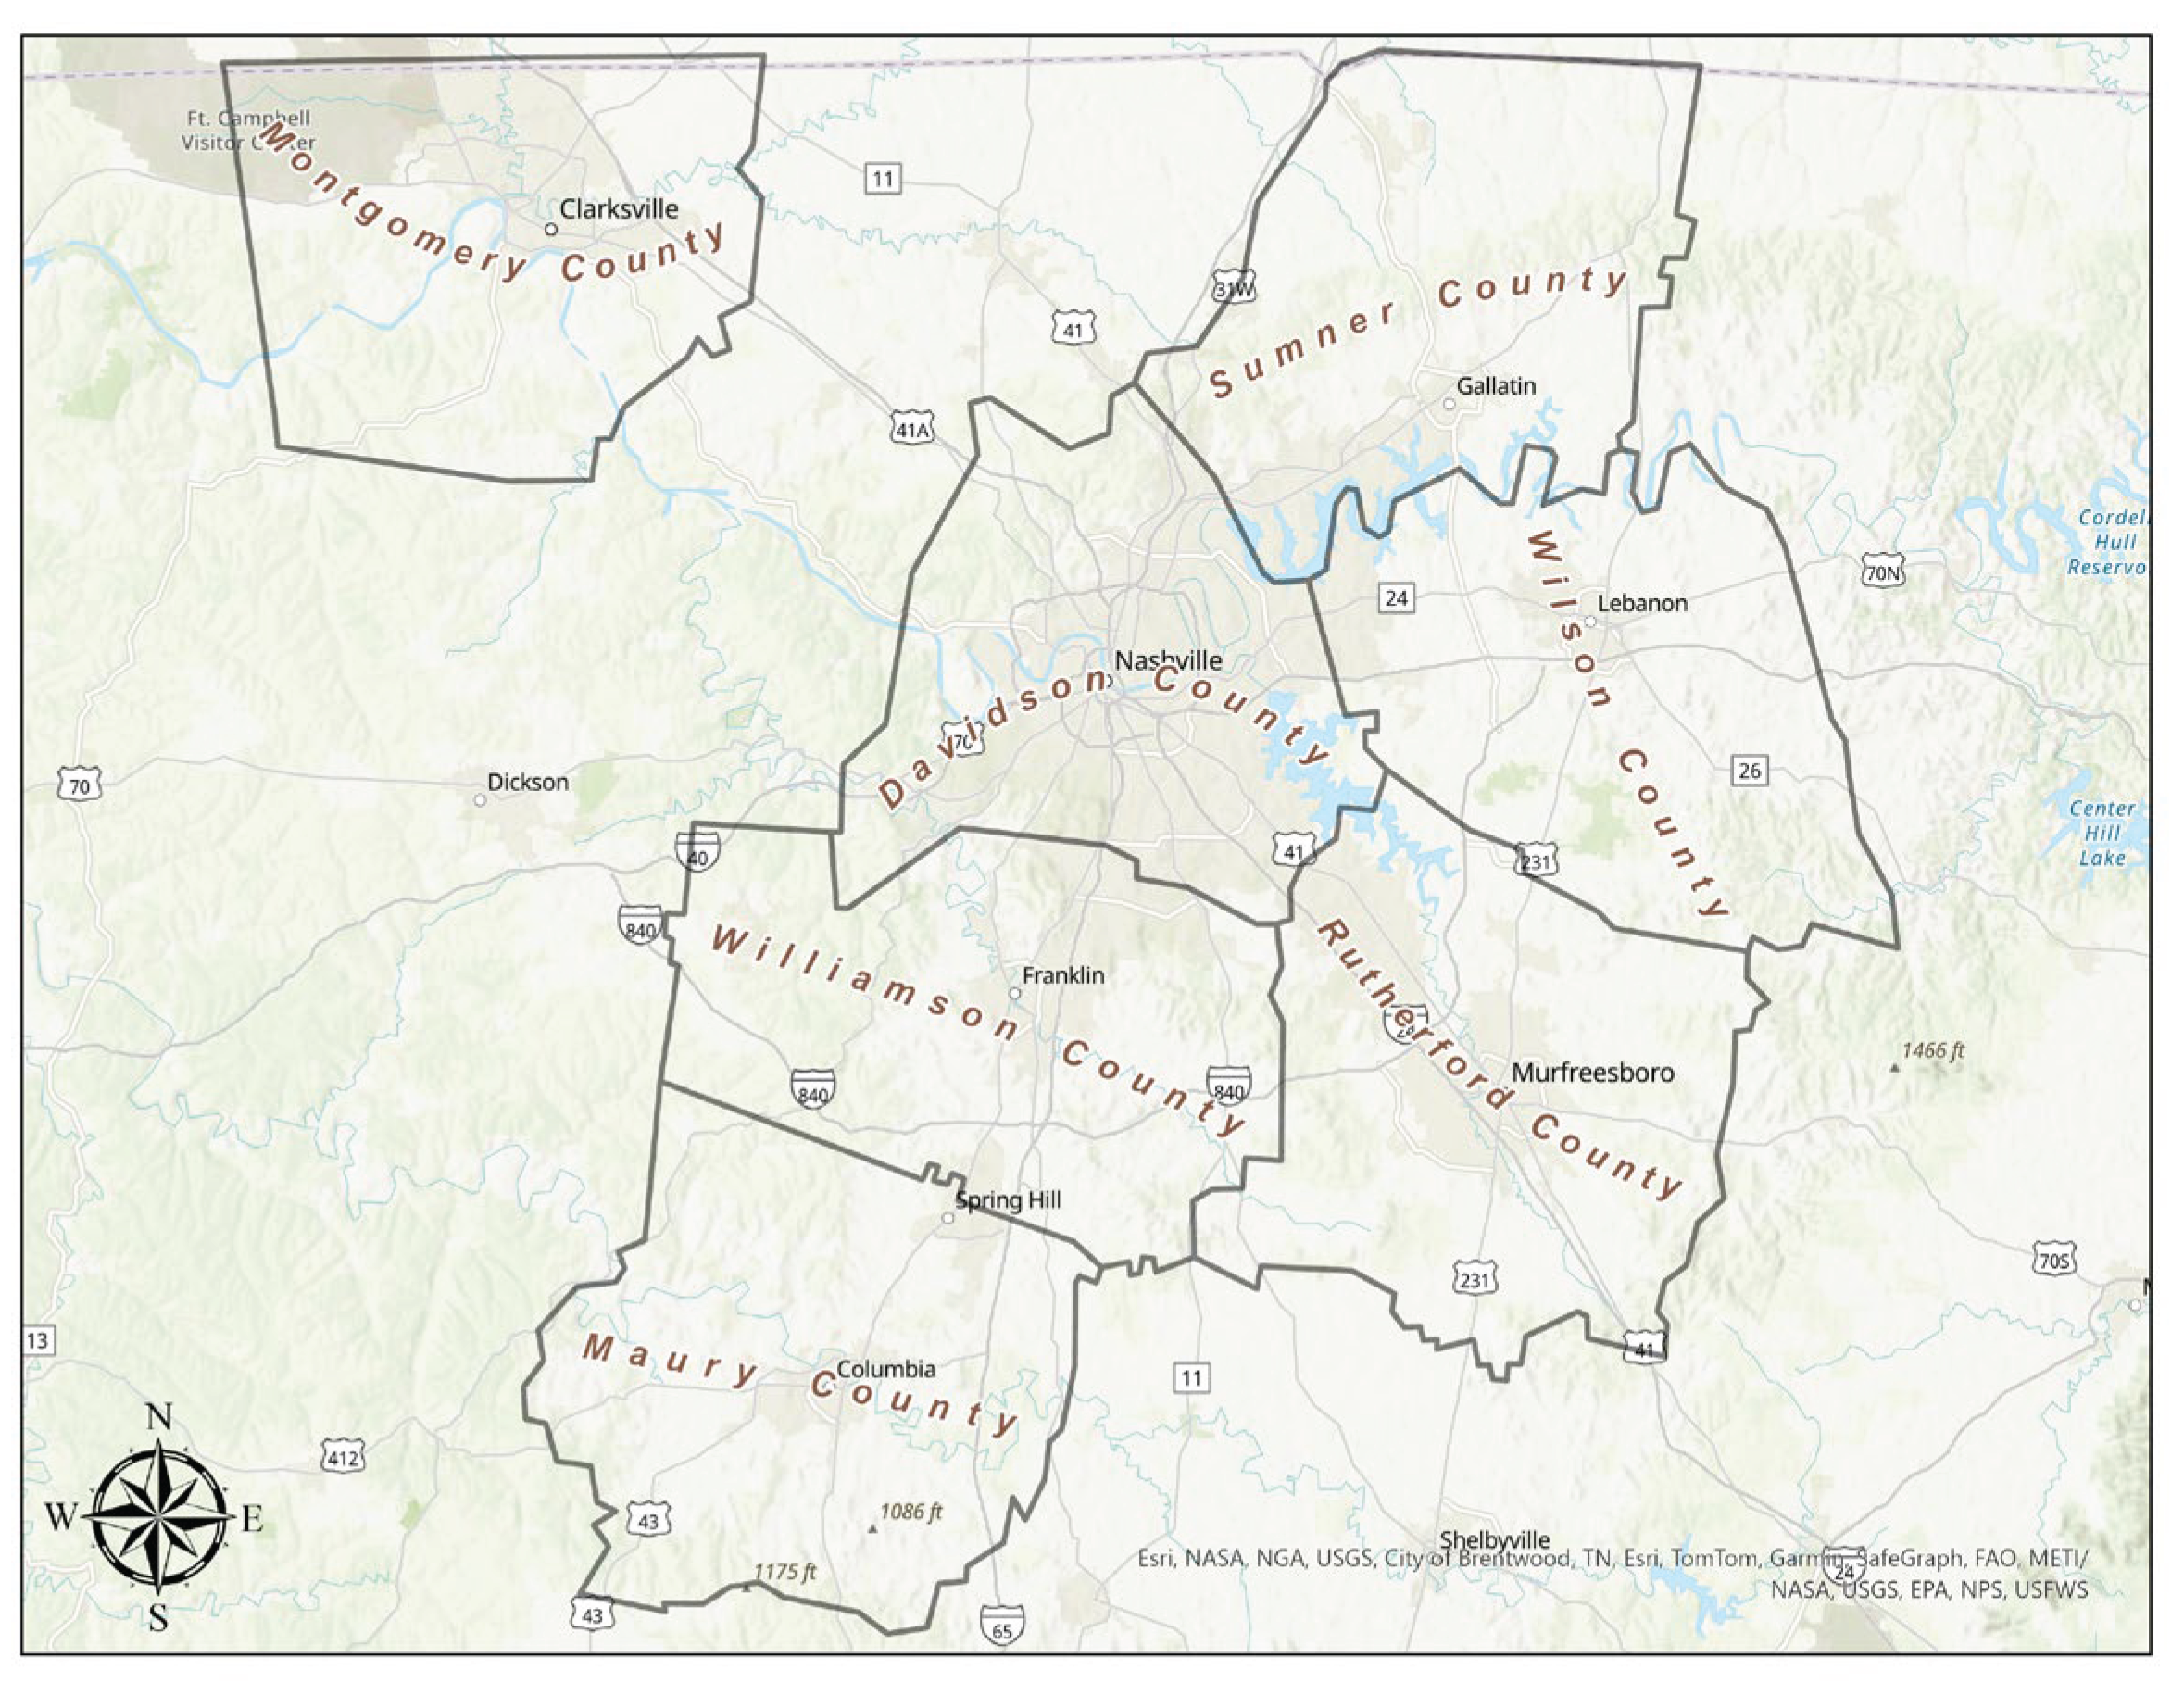
Figure 2.
ISFR Density by County in the Nashville Region.
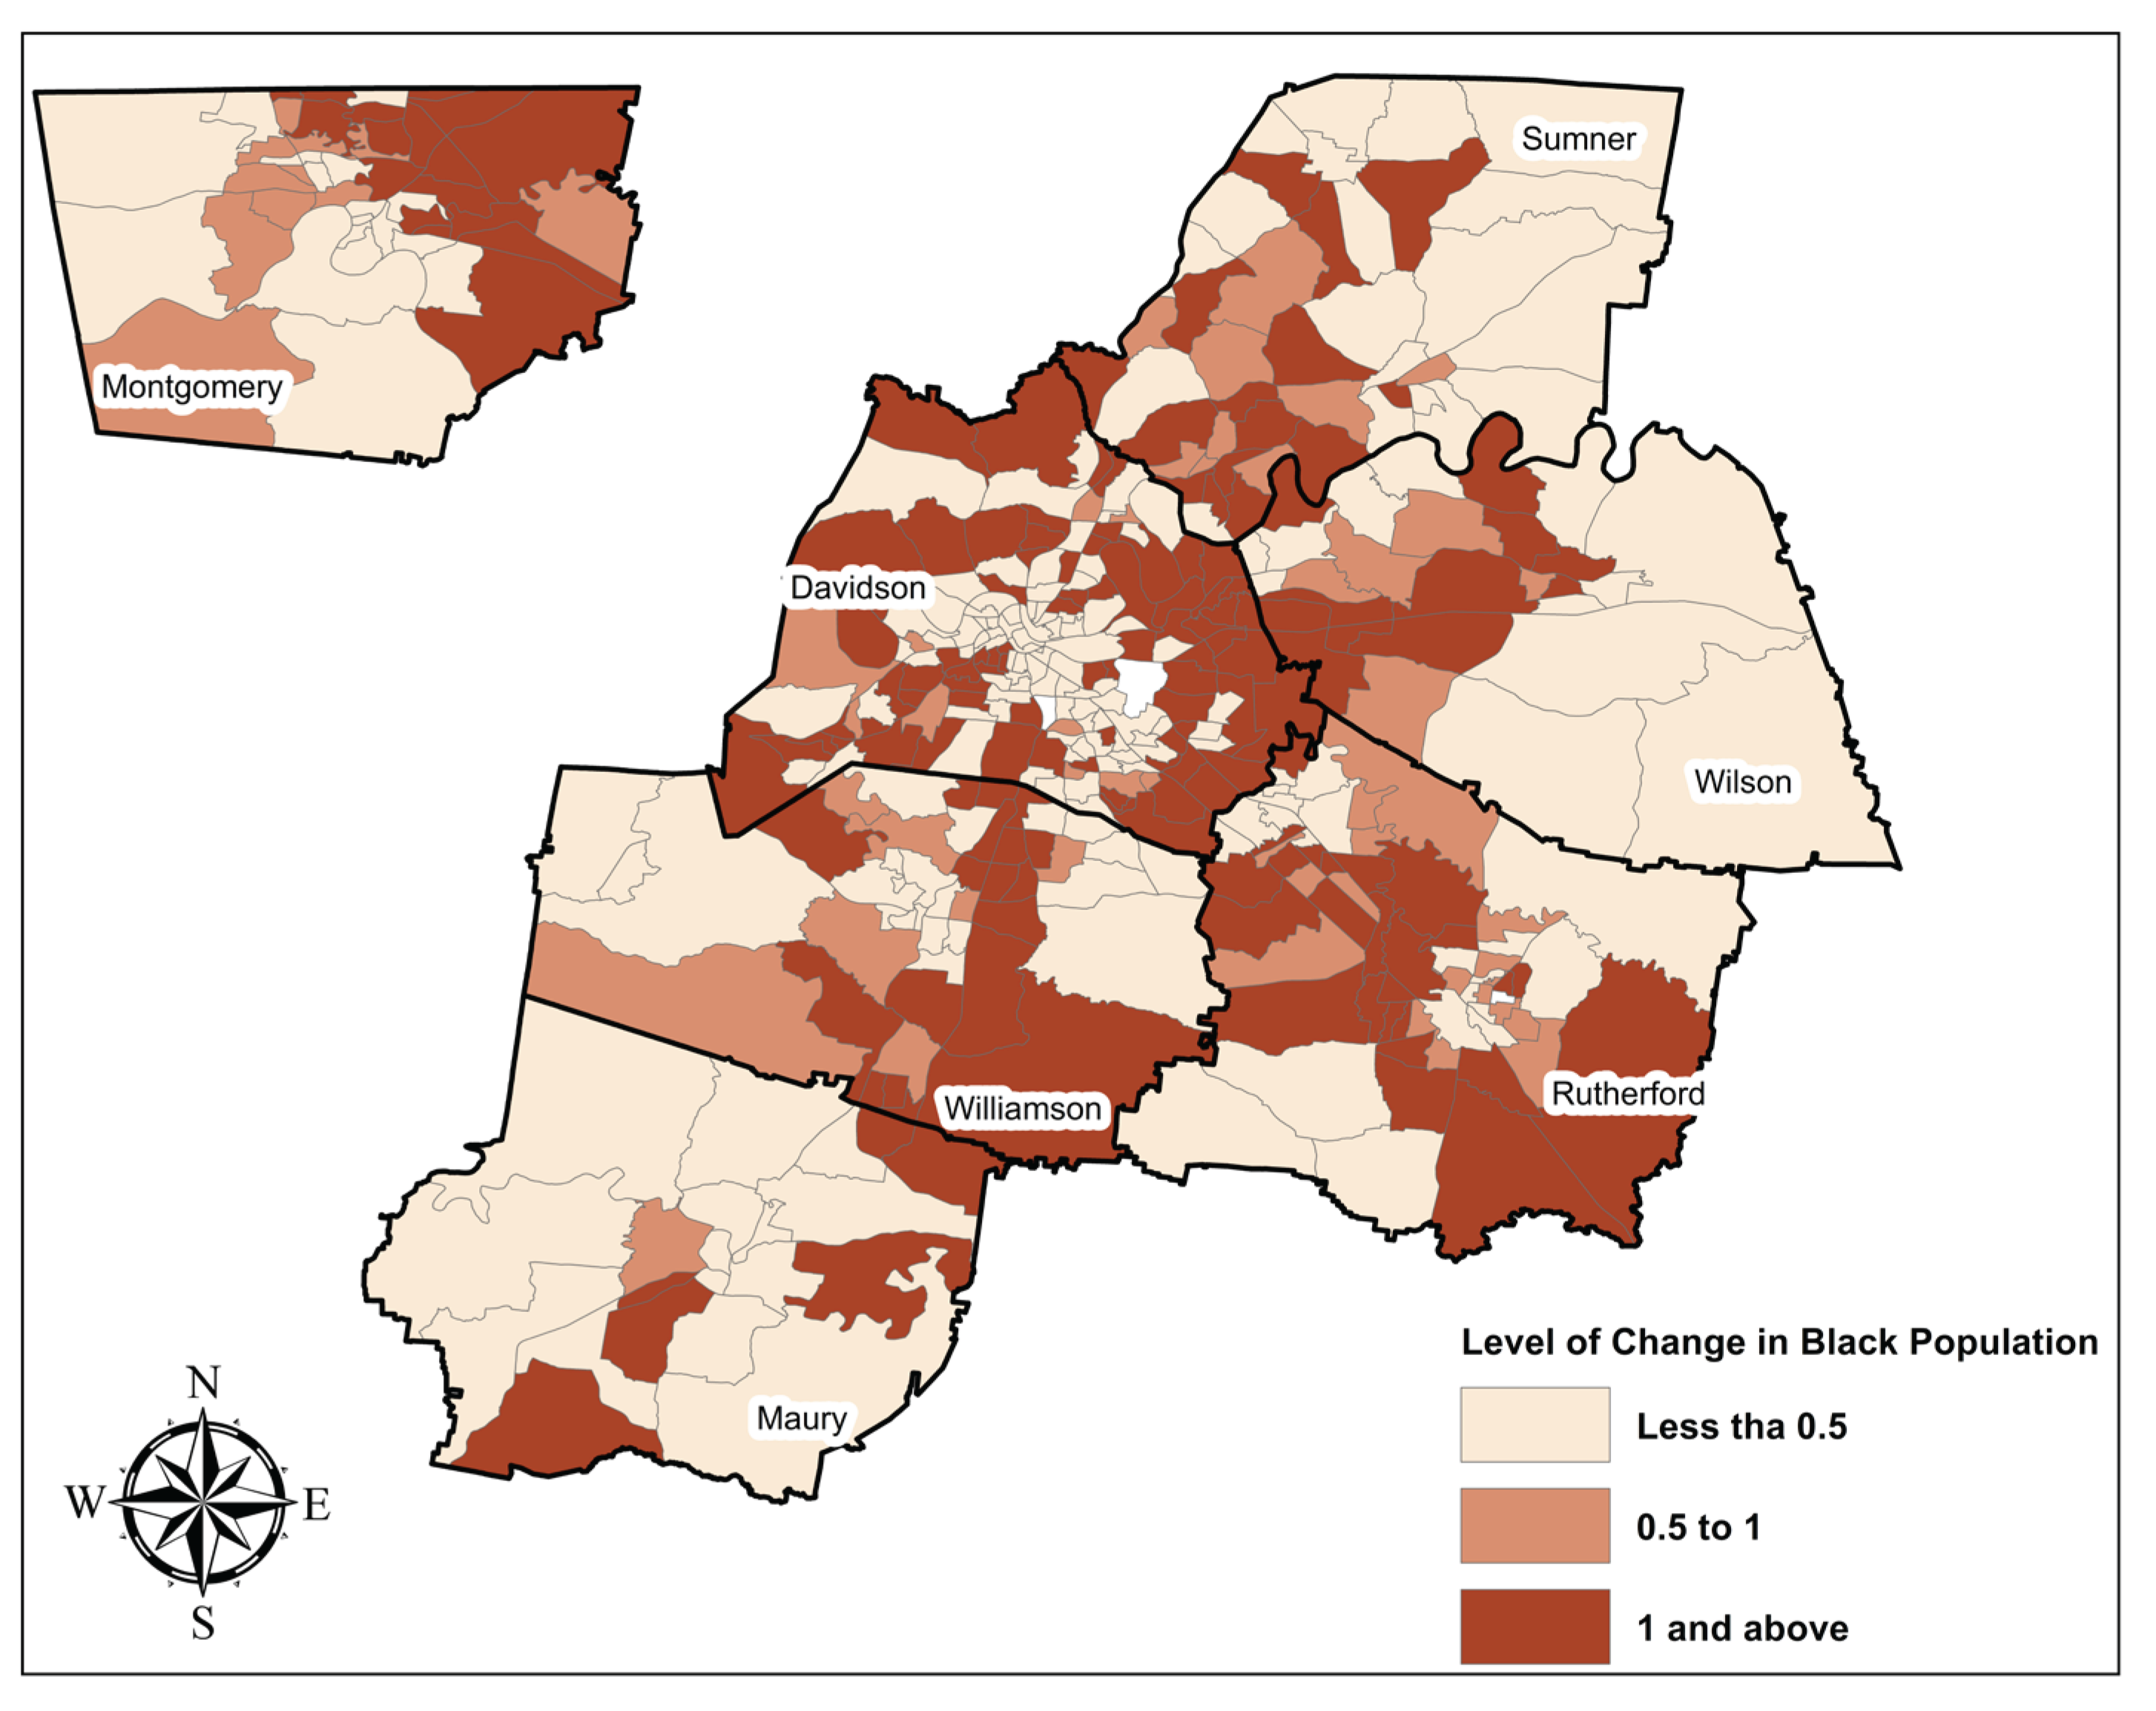
Figure 3.
Changes/Gains in the African American Population between 2010 and 2020.
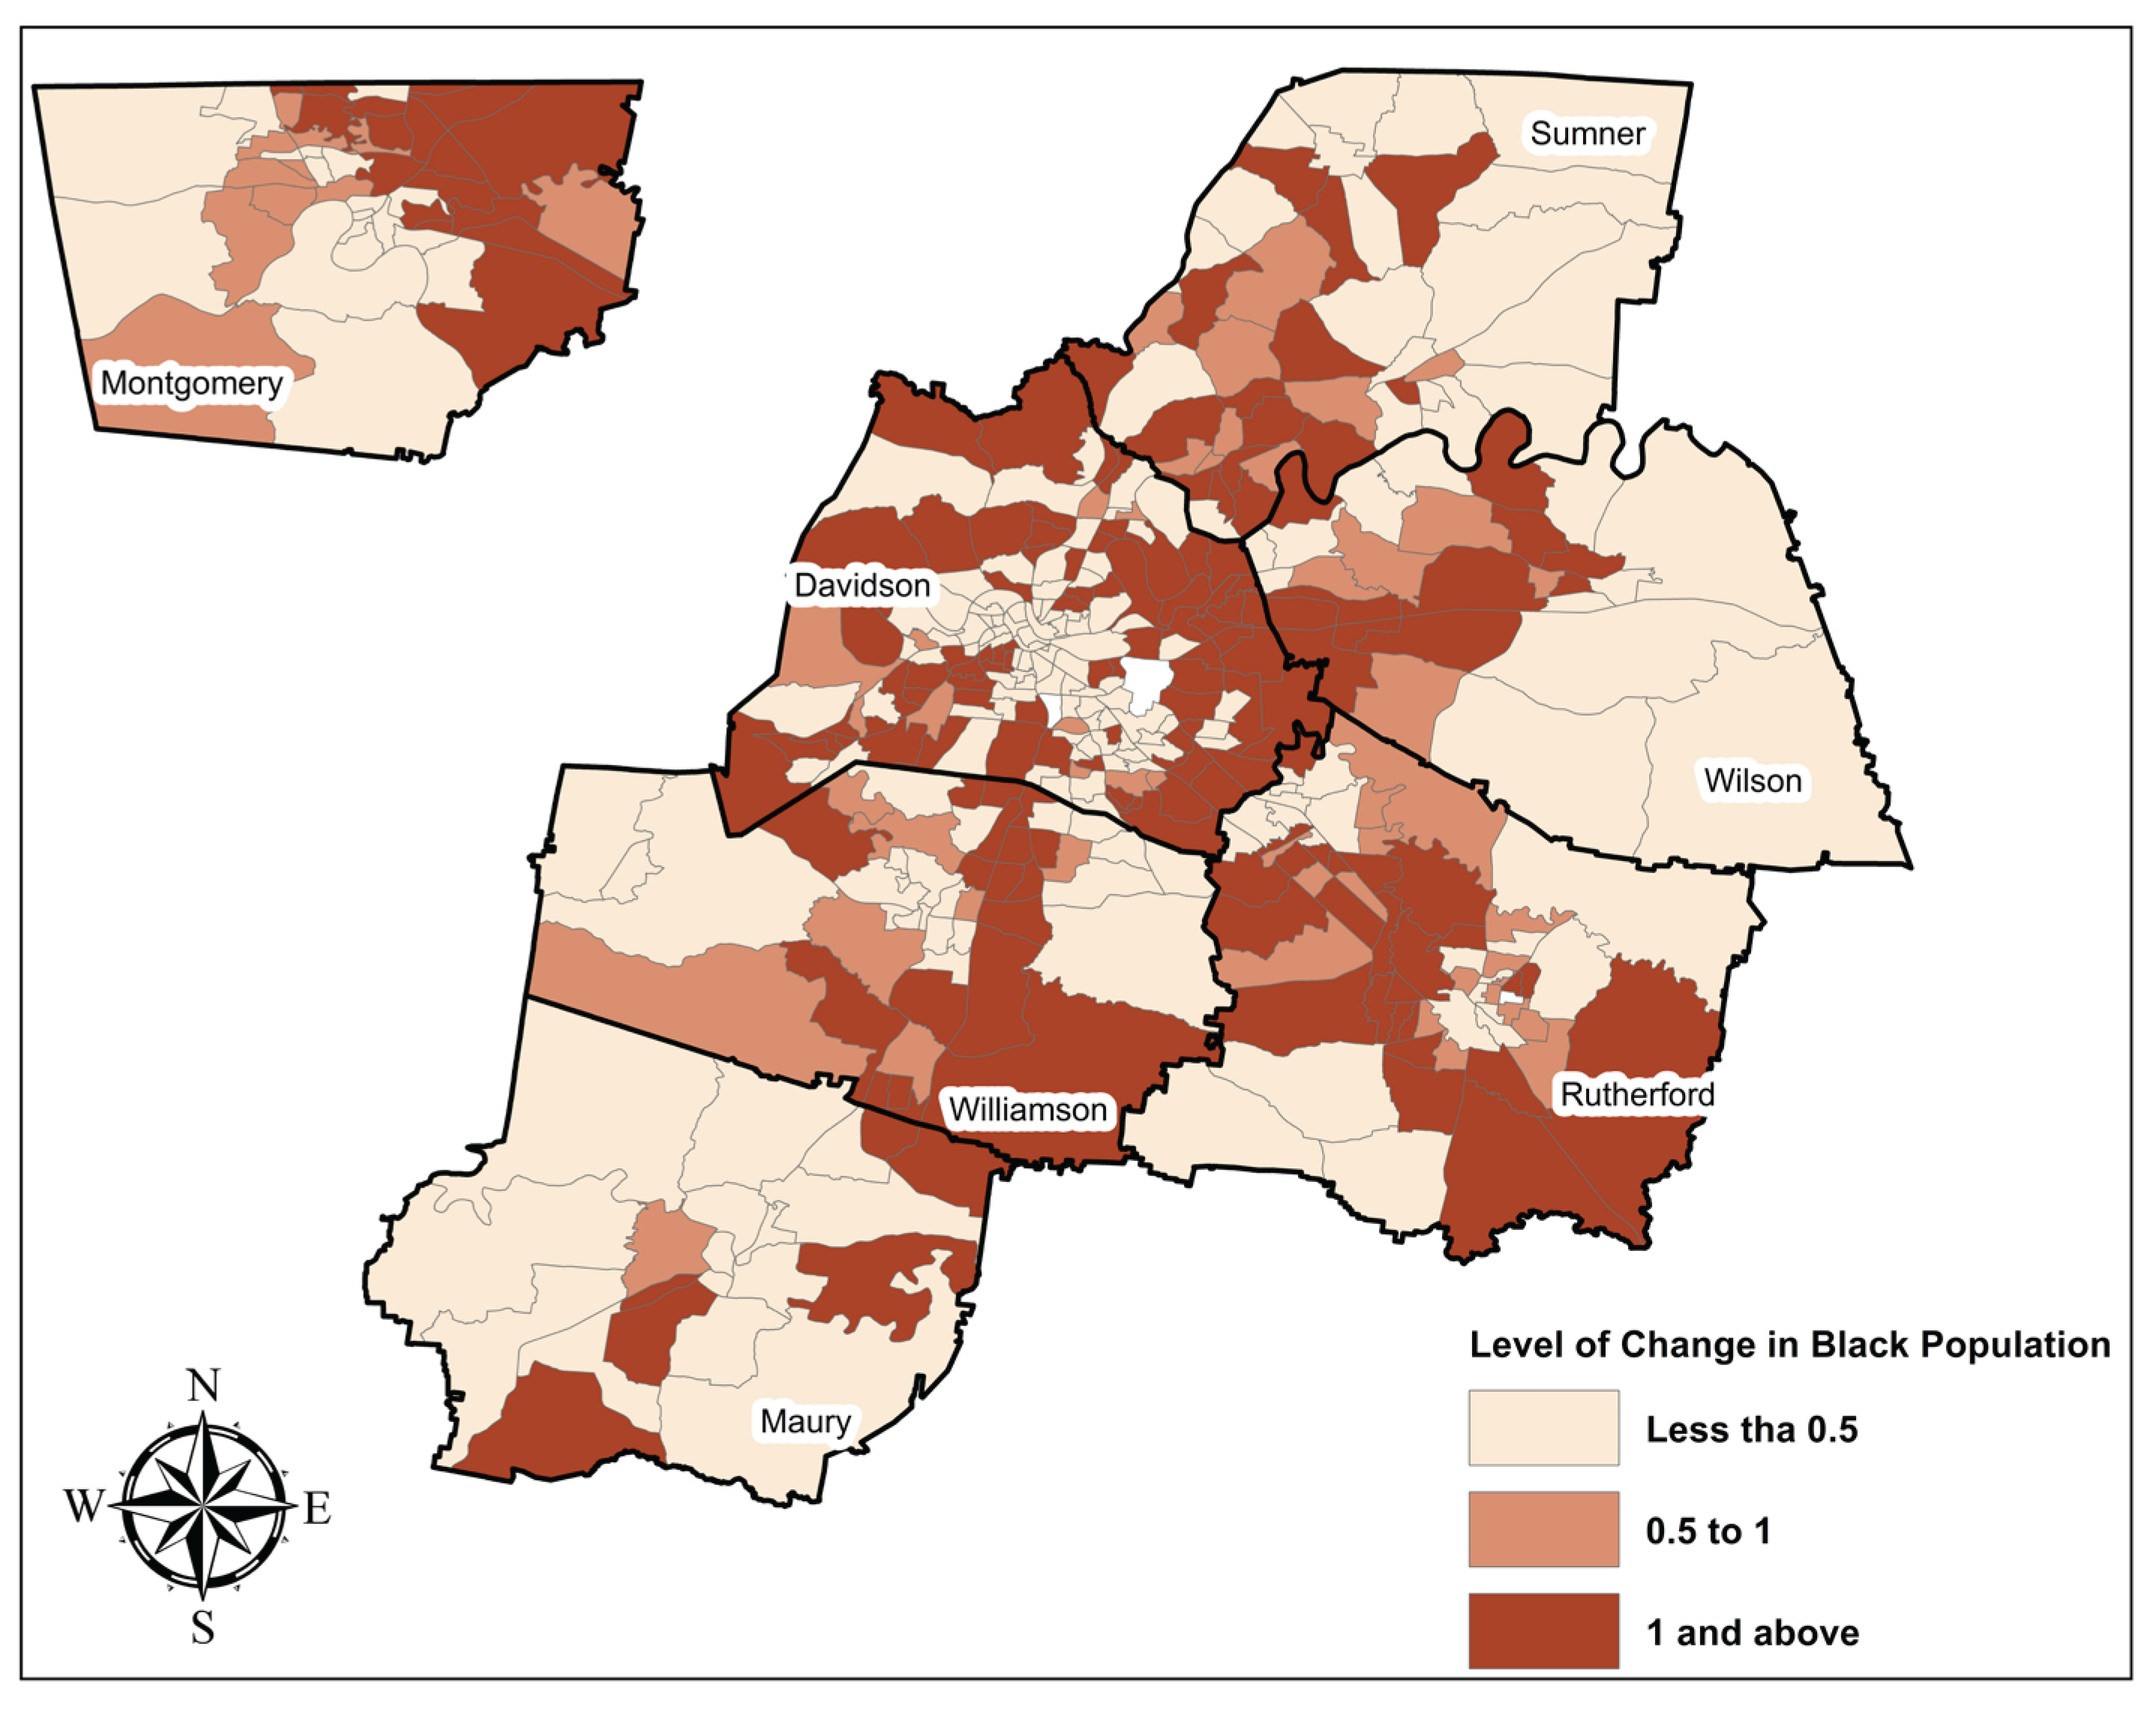
Figure 4.
African American Presence in CTs with High ISFR Density.
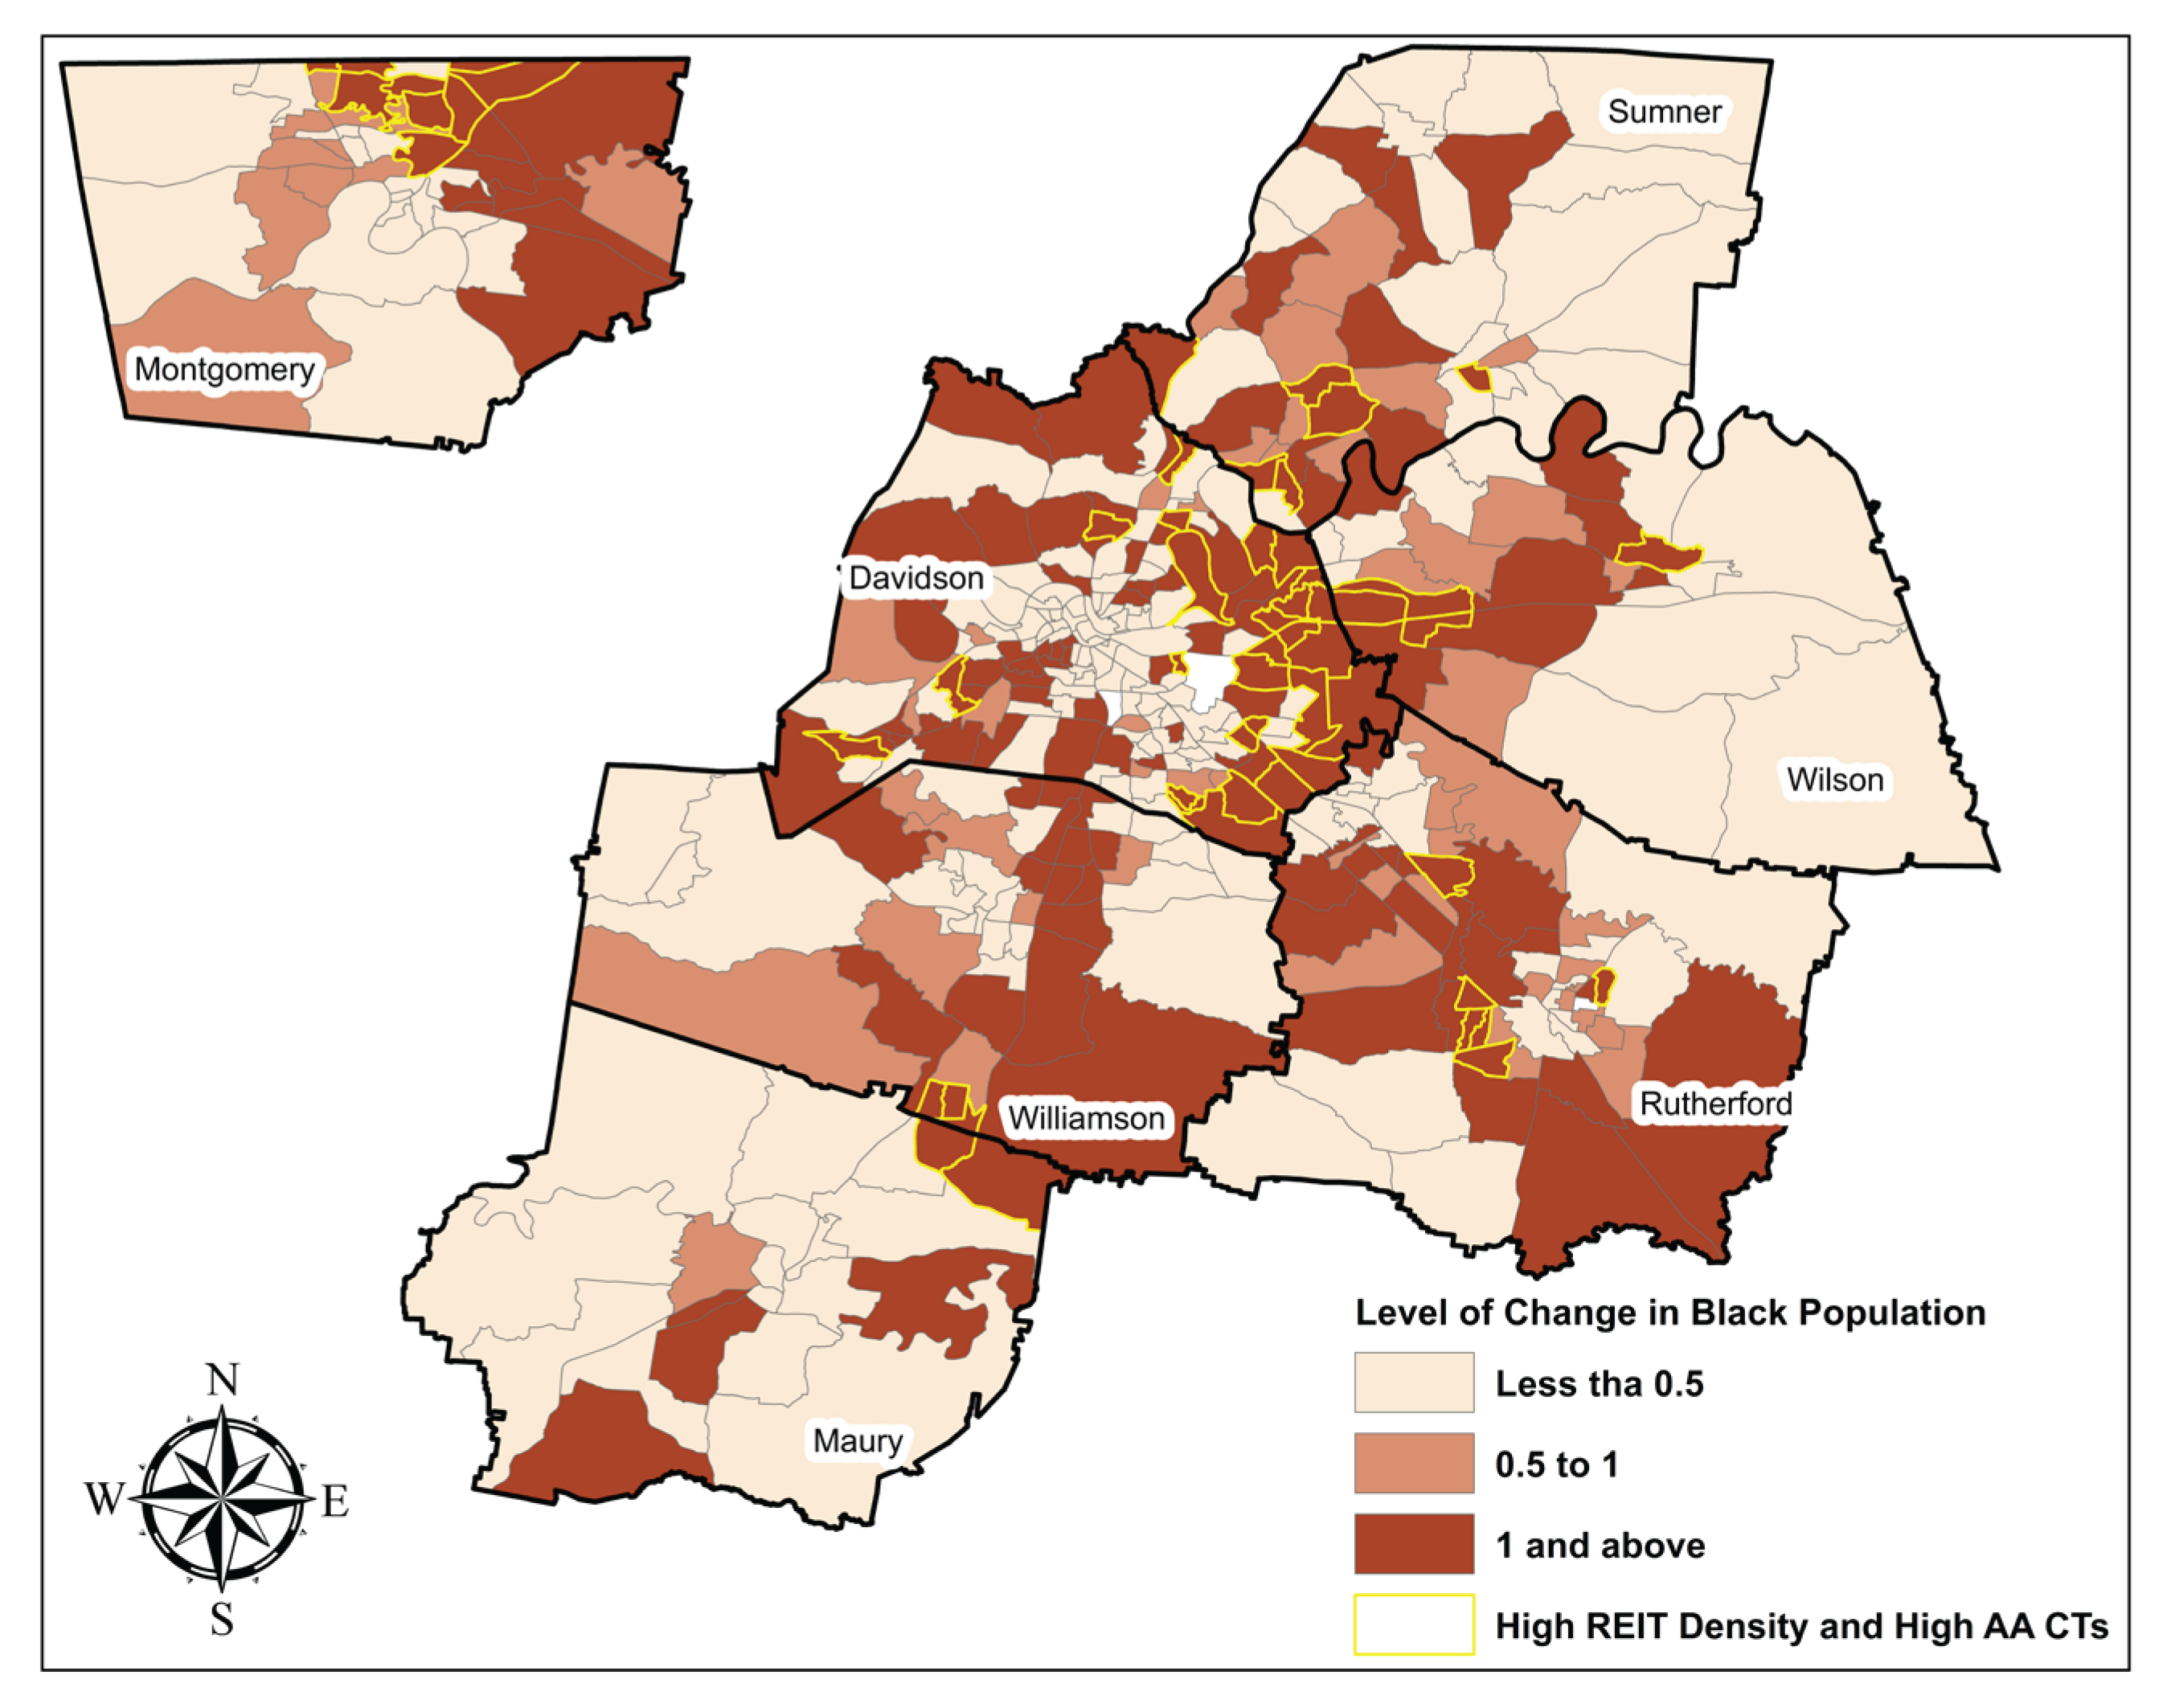

Table 1.
Institutional Single-Family Rentals (ISFRs) by County in Greater Nashville Region.
| County | Number of ISFRs | ISFR Density (per Sq. Mile) |
| Rutherford | 5,738 | 36 |
| Davidson | 3,081 | 7 |
| Williamson | 724 | 6 |
| Sumner | 1,105 | 7 |
| Wilson | 1,009 | 6 |
| Maury | 702 | 4 |
| Montgomery | 556 | 4 |
Table 2.
Yearly Distribution of Institutional SFRs across Counties.
| Institutional SFRs added each year | ||||||
| Year | Rutherford | Davidson | Maury | Sumner | Wilson | Williamson |
| 2012 | 27 | 23 | 2 | 7 | 14 | 15 |
| 2013 | 37 | 4 | 2 | 9 | ||
| 2014 | 144 | 151 | 36 | 61 | 99 | 67 |
| 2015 | 114 | 55 | 8 | 19 | 42 | 35 |
| 2016 | 280 | 58 | 1 | 15 | 18 | 8 |
| 2017 | 243 | 139 | 14 | 44 | 62 | 38 |
| 2018 | 765 | 243 | 66 | 45 | 88 | 92 |
| 2019 | 668 | 568 | 73 | 73 | 59 | 67 |
| 2020 | 1,326 | 647 | 219 | 165 | 142 | 255 |
| 2021 | 971 | 454 | 129 | 210 | 144 | 50 |
| 2022 | 1,131 | 738 | 154 | 279 | 143 | 97 |
| Note: Sale year information for Montgomery County was not available. | ||||||
Table 3.
Average Percentage of Black Population in CTs by County in 2020.
| Counties | Percentage of Black Population in 2020 (Percent) | CTs’ Average for Black Population in 2020 (Percent) | CTs’ Average for Black Population Change (%) between 2010 and 2020 |
| Rutherford | 15.1 | 16 | 85.18 |
| Davidson | 26.9 | 24 | 15.24 |
| Williamson | 4.1 | 3 | 34.85 |
| Sumner | 7.9 | 6 | 59.35 |
| Wilson | 6.9 | 6 | 51.75 |
| Maury | 11.2 | 19 | 3.63 |
| Montgomery | 19.8 | 20 | 39.17 |
| Data Source: United States Census Bureau and Social Explorer | |||
Table 4.
Average Percentage of Black Population in CTs by County in 2020.
| County | Total High ISFR Density CT | CTs with High ISFR Density and High African American Gain | Percentage of High ISFR and Black CTs overlapping with High ISFR Density CTs |
| Davidson | 45 | 25 | 55.56 |
| Maury | 3 | 2 | 66.67 |
| Montgomery | 13 | 9 | 69.23 |
| Rutherford | 20 | 6 | 30.00 |
| Sumner | 15 | 6 | 40.00 |
| Williamson | 4 | 3 | 75.00 |
| Wilson | 8 | 4 | 50.00 |
Table 5.
Regression Analysis investigating associations between CTs level of minority presence and ISFR density.
Table 5.
Regression Analysis investigating associations between CTs level of minority presence and ISFR density.
| All Counties | Davidson | Rutherford | Maury | Montgomery | Sumner | Williamson | Wilson | |
| Std. Coeff | Std. Coeff | Std. Coeff | Std. Coeff | Std. Coeff | Std. Coeff | Std. Coeff | Std. Coeff | |
| Change in African Americans | 0.135* | 0.151* | 0.506* | 0.329 | 0.748* | 0.154 | 0.185 | 0.112 |
| Change in Whites | -0.068 | -0.067 | -0.88 | -0.016 | -0.376 | 0.020 | -0.033 | 0.051 |
| Income | -0.017* | -0.098 | -0.158** | 0.380 | -0.274 | -0.498* | -0.528* | 0.113 |
| Average HH Size | 0.135* | 0.312* | 0.112 | 0.016 | 0.425* | 0.311** | 0.519* | 0.322 |
| N | 419 | 171 | 62 | 20 | 45 | 42 | 45 | 27 |
| R2 | 0.06 | 0.13 | 0.09 | 0.27 | 0.30 | 0.17 | 0.23 | 0.16 |
| Statistically significant at 95% confidence interval **Statistically significant at 90% confidence interval | ||||||||
Table 6.
Mean difference in housing tenure between high and low institutional SFR density CTs.
| All Counties | Davidson | Rutherford | Maury | Montgomery | Sumner | Williamson | Wilson | |
| Mean Diff | Mean Diff | Mean Diff |
Mean Diff | Mean Diff |
Mean Diff | Mean Diff |
Mean Diff | |
| White Owner | -5.53* | -7.04** | -14.57* | -2.53 | -13.29* | -3.48 | -1.81 | -2.67 |
| White Renter | -9.08* | -12.06* | -25.24* | -24.91 | -17.21* | -1.52 | 7.46 | 4.26 |
| Black Owner | 5.57* | 7.58* | 9.12* | 2.23 | 14.06* | 0.46 | 1.96 | 1.34 |
| Black Renter | 9.33* | 9.02* | 22.77* | 14.39 | 15.94* | 0.65 | 4.49 | 4.17 |
Disclaimer/Publisher’s Note: The statements, opinions and data contained in all publications are solely those of the individual author(s) and contributor(s) and not of MDPI and/or the editor(s). MDPI and/or the editor(s) disclaim responsibility for any injury to people or property resulting from any ideas, methods, instructions or products referred to in the content. |
© 2025 by the authors. Licensee MDPI, Basel, Switzerland. This article is an open access article distributed under the terms and conditions of the Creative Commons Attribution (CC BY) license (http://creativecommons.org/licenses/by/4.0/).
Copyright: This open access article is published under a Creative Commons CC BY 4.0 license, which permit the free download, distribution, and reuse, provided that the author and preprint are cited in any reuse.


