
Submitted:
02 August 2025
Posted:
05 August 2025
You are already at the latest version
Abstract
High-Intensity Radiated Fields (HIRF) can cause significant electromagnetic interference (EMI) to aircraft and their onboard systems, posing a threat to flight safety. To enhance the interference immunity of navigation devices, this study establishes a 3D simulation model based on the actual structure of a GNSS receiver and utilizes CST software to analyze the shielding effectiveness (SE) under varying conditions, including frequency, material properties, polarization, incident angle, and aperture configuration. The results show that structural differences, aperture coupling effects, and material characteristics have a significant impact on SE. In particular, strong single-point resonances frequently occur in the 3–10 GHz range, leading to severe SE fluctuations, while shielding performance generally deteriorates above 10 GHz due to reduced structural stability. To validate the simulation results, an anechoic chamber test was conducted, revealing signal faults in the GNSS receiver under high-frequency HIRF conditions, thereby confirming the validity of the simulation and the risk of coupling. Based on these findings, the study proposes optimization strategies including aperture control, resonance suppression, material selection, and multi-polarization/multi-directional protection, providing theoretical and engineering references for electromagnetic compatibility (EMC) design of airborne equipment in HIRF environments.
Keywords:
high-intensity radiated field (HIRF)
; electromagnetic compatibility
; GNSS receiver
; CST simulation
1. Introduction
1.1. Research Background and Significance
High-Intensity Radiated Fields (HIRF) refer to electromagnetic environments with exceptionally high field strength, exceeding the levels typically encountered under standard operating conditions. Characterized by high power, wide frequency spectrum, intense radiation, and irregular field distribution, HIRF poses potential threats to the normal operation of electrical and electronic systems aboard various aircraft [1]. Major sources of HIRF include both military and civil radar systems, airport-based navigation and surveillance equipment, and high-power radio transmitters used for communication or broadcasting purposes. Electromagnetic energy from these sources can penetrate aircraft through apertures, seams, or antennas, interfering with the operation of onboard electronic equipment and, in severe cases, causing system malfunctions or failures [2].
Among all affected onboard systems, Global Navigation Satellite System (GNSS) receivers are particularly vulnerable. These receivers rely on capturing weak satellite signals, which are easily overwhelmed by strong external electromagnetic fields. In an HIRF environment, radiated electromagnetic waves may couple into the internal circuitry via the enclosure or connected cables, leading to signal distortion or complete loss. This can result in degraded positioning accuracy, loss of navigation capability, or even permanent hardware damage. Therefore, improving the shielding effectiveness of device enclosures is critical to ensuring the safe and stable operation of airborne navigation equipment in high-radiation environments. Enhanced electromagnetic shielding can effectively reduce field coupling and mitigate the impact of external radiation sources on onboard systems.
1.2. Overview of HIRF Airworthiness Regulations and Standards
Research on High-Intensity Radiated Fields (HIRF) began relatively early in the United States and Europe, where comprehensive and mature airworthiness certification systems have been established. Since the release of FAA Order N8110.71 “Guidance for Airworthiness Approval of Aircraft Operating in the HIRF Environment” in 1998, the Federal Aviation Administration (FAA) has successively introduced multiple regulations and technical documents addressing HIRF protection. These include FAR 25.1317 [3], Advisory Circular AC 20-158A [4], and Policy Statement PS-ACE-23-10 [5], which collectively define protection requirements and airworthiness compliance methods for aircraft electrical and electronic systems operating under HIRF conditions.
In addition, the Radio Technical Commission for Aeronautics (RTCA) has published DO-160G: Environmental Conditions and Test Procedures for Airborne Equipment [6], with its latest edition released in December 2010. This standard serves as a cornerstone in civil aviation and is widely adopted for environmental testing of airborne electronic equipment. Section 20 of DO-160G specifically addresses radiated susceptibility to electromagnetic energy, providing test methods and severity levels relevant to typical HIRF environments. These standards offer a unified framework for evaluating the electromagnetic immunity performance of onboard equipment, such as GNSS receivers, under complex radiation exposure.
In comparison, China’s development of HIRF-related airworthiness regulations started relatively later but has progressed significantly in recent years. In August 2006, the Civil Aviation Administration of China (CAAC) issued AC-21-1317 “HIRF Protection Requirements for Aircraft” [7]. Subsequently, in November 2011, the official HIRF requirement was incorporated into the Transport Category Airworthiness Regulations CCAR-25-R4 [8] through clause CCAR 25.1317, which aligns closely with standards set by the FAA and EASA. Most recently, in December 2023, CAAC published AC-25-AA-2023-03 [9], providing detailed compliance guidance for CCAR 25.1317, further promoting the alignment of China’s HIRF airworthiness system with international standards.
1.3. Research Status
With the continuous development of fundamental theories related to High-Intensity Radiated Fields (HIRF) and the gradual improvement of international airworthiness standards, the study of electromagnetic immunity of avionics systems under HIRF conditions has become a research focus in the field of electromagnetic compatibility (EMC). In recent years, both domestic and international scholars have conducted extensive theoretical and applied studies on HIRF coupling mechanisms, shielding structure design, and material response characteristics. Among them, enclosure shielding effectiveness, as a crucial means to ensure the stable operation of airborne navigation devices under HIRF exposure, has drawn increasing attention. Utilizing high-fidelity electromagnetic simulation tools, establishing accurate numerical models, and conducting experimental validation to investigate the influence of structural parameters on shielding effectiveness have become key directions in current research.
Kong Shufang et al.[10,11,12,13] conducted a systematic analysis of HIRF-related airworthiness clauses and comprehensively reviewed mainstream HIRF compliance test methods currently adopted internationally. These methods are widely applied at the aircraft, system, and equipment levels, providing vital technical references for the airworthiness certification of avionics systems. Zhang Guangcan [14], based on FAA Advisory Circular AC 20-158, detailed the entire verification process and test requirements for HIRF protection in civil aircraft, although the work primarily focuses on aircraft-level assessment and lacks equipment-level electromagnetic response data. Hu Pingdao [15] proposed the Low-Level Coupling (LLC) test methodology, which includes Low-Level Direct Drive (LLDD), Low-Level Swept Current (LLSC), and Low-Level Swept Field (LLSF) tests. These techniques effectively characterize the sensitivity of systems to HIRF-induced coupling and provide critical data support for the early design stage.
In terms of practical testing, Li Hongxiang [16] conducted radiated susceptibility testing using a 3-meter method in an anechoic chamber for a specific type of unmanned aerial vehicle (UAV), demonstrating the applicability of chamber-based testing in aircraft-level HIRF evaluation. Yuan Hongtao [17] investigated the HIRF response of an airborne radio system installed on a specific helicopter within the 400 MHz–2 GHz range using a reverberation chamber. By modulating the field intensity, typical fault modes and susceptibility thresholds were identified. Chen Jingping et al. [18] performed radiated immunity tests on a small radar system in a reverberation chamber and analyzed its performance degradation under HIRF conditions. Lemaire D et al. [19] studied the low-frequency HIRF transmission function of the Airbus A380, obtained coupling path response curves within the cabin, and proposed a method for extrapolating equivalent test field strengths for equipment-level evaluations.
1.4. Current Challenges and Limitations in HIRF Research
Overall, current research on HIRF predominantly focuses on aircraft-level susceptibility testing, while equipment-level investigations remain relatively limited. Most existing studies emphasize pass/fail criteria, merely assessing whether a device exhibits predefined faults to determine compliance with airworthiness requirements. Although such approaches satisfy basic regulatory standards, they fall short in explaining the underlying interference mechanisms, the detailed electromagnetic response characteristics of onboard systems, and the evolution of shielding effectiveness across frequencies—especially lacking in quantitative assessments targeting specific frequency bands.
Furthermore, targeted optimization strategies in current literature are scarce, making it difficult to offer detailed guidance for structural design and electromagnetic protection at the equipment level. Therefore, conducting simulation- and experiment-based studies on shielding effectiveness tailored to specific frequency ranges, and systematically analyzing the influence of material properties, structural parameters, and coupling paths, is of both theoretical and practical significance.
In this context, the present study focuses on a GNSS receiver enclosure based on actual equipment geometry. By employing numerical electromagnetic simulations, it investigates the effects of different materials, electromagnetic properties, and aperture characteristics on shielding performance. Combined with experimental validation, the goal is to provide feasible design references and theoretical support for improving electromagnetic compatibility (EMC) of airborne equipment operating in HIRF environments.
2. Coupling Mechanisms and Theoretical Foundations
The coupling effects of High-Intensity Radiated Fields (HIRF) fundamentally involve the propagation and interaction of electromagnetic fields in free space or within shielding enclosures. Therefore, a thorough understanding of electromagnetic field theory is essential for analyzing HIRF-induced interference and its effects on onboard systems. This section outlines the theoretical foundations of HIRF coupling, providing the necessary background to support the subsequent simulation analysis and experimental validation.
2.1. Coupling Paths of HIRF Interference
In HIRF environments, electronic equipment is highly susceptible to electromagnetic interference (EMI), which may disrupt normal operation or even lead to complete functional failure. As shown in Figure 2.1, three key elements are required for HIRF-induced interference: a strong external source of radiation, an effective coupling path, and a susceptible victim device.
Figure 1.
Schematic Diagram of HIRF Interference Mechanism.
HIRF sources typically originate from high-power electromagnetic emissions such as radar systems, communication base stations, and broadcast transmitters. The electromagnetic energy from these sources can couple into electronic systems via two primary mechanisms: front-door coupling and back-door coupling.
- Front-door coupling refers to the process in which HIRF energy enters the system through intentional paths such as antennas and cables. The incident electromagnetic wave induces unwanted currents and voltages on these media, which may suppress normal signals or even damage internal components.
- Back-door coupling, in contrast, occurs when HIRF penetrates through unintentional structural openings—such as seams, windows, vents, or doors—and generates internal electromagnetic fields within the aircraft. These internal fields then couple into sensitive electronics through similar mechanisms, potentially disrupting or degrading equipment performance [20].
HIRF energy exhibits different coupling behaviors depending on the frequency band. The HIRF spectrum can generally be divided into three major regions:
- Below 1 MHz: Coupling effects are weak and typically negligible for most aircraft systems, requiring no special mitigation measures.
- 1 MHz to 400 MHz: In this range, aircraft wiring harnesses can act as efficient antennas, making front-door coupling the dominant pathway. Effective cable shielding is particularly critical in this frequency band.
- Above 400 MHz: Front-door coupling effects diminish, and HIRF energy more easily enters systems through structural discontinuities and enclosure apertures. In this high-frequency region, back-door coupling becomes the primary mechanism, and the design of enclosures and shielding becomes a key factor in preventing electromagnetic penetration [21].
As a result, this study primarily focuses on analyzing shielding effectiveness in the HIRF frequency range above 400 MHz, where structural coupling dominates and shielding design plays a crucial role.
2.2. Maxwell’s Equations
Maxwell’s equations are the fundamental mathematical framework for describing electromagnetic fields and the propagation of electromagnetic waves. These four equations collectively define the interactions between electric fields, magnetic fields, electric charges, and electric currents. As the theoretical cornerstone of classical electromagnetics, Maxwell’s equations provide the basis for analyzing wave propagation, radiation, and field interactions in high-intensity radiated field (HIRF) environments.:
In these equations:
- denotes the electric field intensity (V/m2),
- denotes the current density (A/m2),
- denotes the magnetic field intensity (A/m),
- denotes the electric displacement vector (C/m2),
- denotes the electric charge density (C/m3),
- denotes the magnetic flux density (Wb/m2).
Together, Eqs. (1) through (4) form the integral form of Maxwell’s equations, serving as the theoretical basis for all electromagnetic phenomena and determining the fundamental laws governing electromagnetic wave propagation.
2.3. Electromagnetic Shielding Effectiveness
Electromagnetic Shielding Effectiveness (SE) is a critical metric used to evaluate the capability of shielding materials or structures to block the propagation of electromagnetic waves. It describes the effectiveness of materials or structures in reducing external electromagnetic interference (EMI) and preventing leakage of internal electromagnetic radiation. In HIRF environments, electromagnetic shielding effectiveness is especially crucial, particularly for protecting onboard electronic equipment from electromagnetic interference.
Electromagnetic shielding effectiveness refers to the attenuation capability of shielding materials or structures against electromagnetic waves, usually expressed in decibels (dB). It can be calculated as:
Electric Field Shielding Effectiveness:
Magnetic Field Shielding Effectiveness:
Where and represent the electric field strength before and after shielding, respectively; and and represent the magnetic field strength before and after shielding, respectively.
Several factors influence electromagnetic shielding effectiveness, mainly including:
- Material properties: The primary factors affecting shielding effectiveness are the electrical conductivity and magnetic permeability of the material. Both conductivity and permeability have a positive correlation with shielding effectiveness.
- Shielding structure: The structure of the shield, including its thickness, seams and openings, and other structural characteristics, significantly impacts shielding effectiveness. Generally, a thicker shield offers higher effectiveness. Electromagnetic waves can penetrate through seams and openings, reducing the overall shielding performance. Moreover, certain structural features can induce resonances at specific frequencies, causing significant degradation of shielding effectiveness.
- Frequency range: Shielding effectiveness varies with frequency. Between 1 MHz and 400 MHz, cables themselves can act as strong antennas, causing considerable coupling effects. At frequencies above 400 MHz, high-frequency electromagnetic waves are more readily absorbed and reflected by metals and composite materials. Typically, multilayer shielding materials are required to effectively block these waves.
Electromagnetic shielding effectiveness is an important indicator for assessing the efficacy of materials or structures, especially in HIRF environments where it directly relates to the anti-interference capability of onboard equipment. By selecting appropriate materials and optimizing structural design, shielding effectiveness can be significantly improved, thereby reducing the impact of external electromagnetic waves on equipment and ensuring normal system operation.
2.4. Resonance Phenomenon
The resonance phenomenon is a significant factor that can degrade shielding effectiveness in electromagnetic shielding design. When the frequency of an external electromagnetic wave approaches the natural frequency of a shielding structure or material, the system’s response amplitude increases markedly. This leads to enhanced transmission or amplification of electromagnetic waves, causing a substantial reduction in shielding effectiveness.
Every shielding material or structure possesses one or more natural frequencies—referred to as resonant frequencies. In electromagnetic shielding, the geometric shape, dimensions, openings, and gaps of the shielding enclosure have a direct impact on its resonant frequencies. Physical properties such as electrical conductivity and magnetic permeability of the materials also influence the resonance behavior.
For an ideal rectangular resonant cavity made of a perfect conductor, the resonant frequency can be calculated using the following formula:
Where is the resonant frequency of the cavity (Hz), is the speed of light(3*108m/s),,, are the length, width, and height of the cavity(m),,, are positive integers representing the resonance mode numbers.
For a rectangular cavity with a single aperture or slit, the resonant frequency can be adjusted using the following modified formula:
Where is the maximum slit or aperture length in the direction of wave propagation.
When the enclosure of an onboard device contains multiple openings or slits, the resonant frequencies may shift, and multiple resonance peaks may occur due to internal reflections and interference within the cavity. Therefore, in HIRF protection simulation analysis, it is essential to use electromagnetic field simulation software (such as CST) to identify the resonance characteristics of the actual shielding cavity, and to validate the impact of resonance on shielding performance through experimental methods.
The resonance phenomenon directly affects the system’s immunity to interference and its electromagnetic leakage. Different materials and shielding structures exhibit distinct resonance behaviors. Studying these phenomena helps guide the selection of appropriate materials and the design of effective shielding structures. By adjusting parameters such as material thickness, geometry, and aperture size, resonance can be mitigated, thus enhancing shielding performance. In this study, simulation-based analysis of the resonance characteristics of various shielding enclosures is conducted to support design optimization and reduce electromagnetic interference in practical applications.
2.5. Software Selection
CST Studio Suite is a comprehensive electromagnetic simulation tool capable of handling complex electromagnetic problems under High-Intensity Radiated Fields (HIRF). Its powerful simulation capabilities, multi-frequency analysis, and accurate modeling of electromagnetic wave propagation and shielding effectiveness make it an ideal choice for this study.
By using CST, variations in the shielding effectiveness of the onboard navigation equipment enclosure under different conditions can be effectively analyzed. This enables the prediction of shielding performance during the design phase, facilitates design optimization, and enhances the system’s immunity and reliability in high-intensity electromagnetic environments.
3. Simulation Model Construction
3.1. Modeling of the Onboard GNSS Receiver
A GNSS receiver (Global Navigation Satellite System Receiver) is a device used to receive and process signals from global navigation satellite systems. By capturing signals transmitted from satellites, the GNSS receiver determines its position, velocity, and timing information. It serves as a critical component in modern navigation systems.
In this study, a GNSS receiver model was developed in CST Studio Suite based on the physical dimensions and structural data of a specific GNSS receiver. The simulation focuses on investigating the shielding effectiveness of the receiver’s enclosure under various conditions.
Figure 2.
Real GNSS Receiver.
Figure 3.
Simulated Model in CST.
3.2. Simulation Environment Setup
In the simulation, the EMC/EMI Studio module in CST Studio Suite was primarily used. The background material was set to vacuum, and the boundary conditions were defined as Open (add space). The boundary distance was set to 20 times the wavelength, and the boundary reflection level was set to 0.0001 to expand the computational domain and minimize the influence of boundary reflections on the simulation results.
Figure 4.
(a) Boundary Condition Settings; (b) Boundary Reflection Level Configuration.
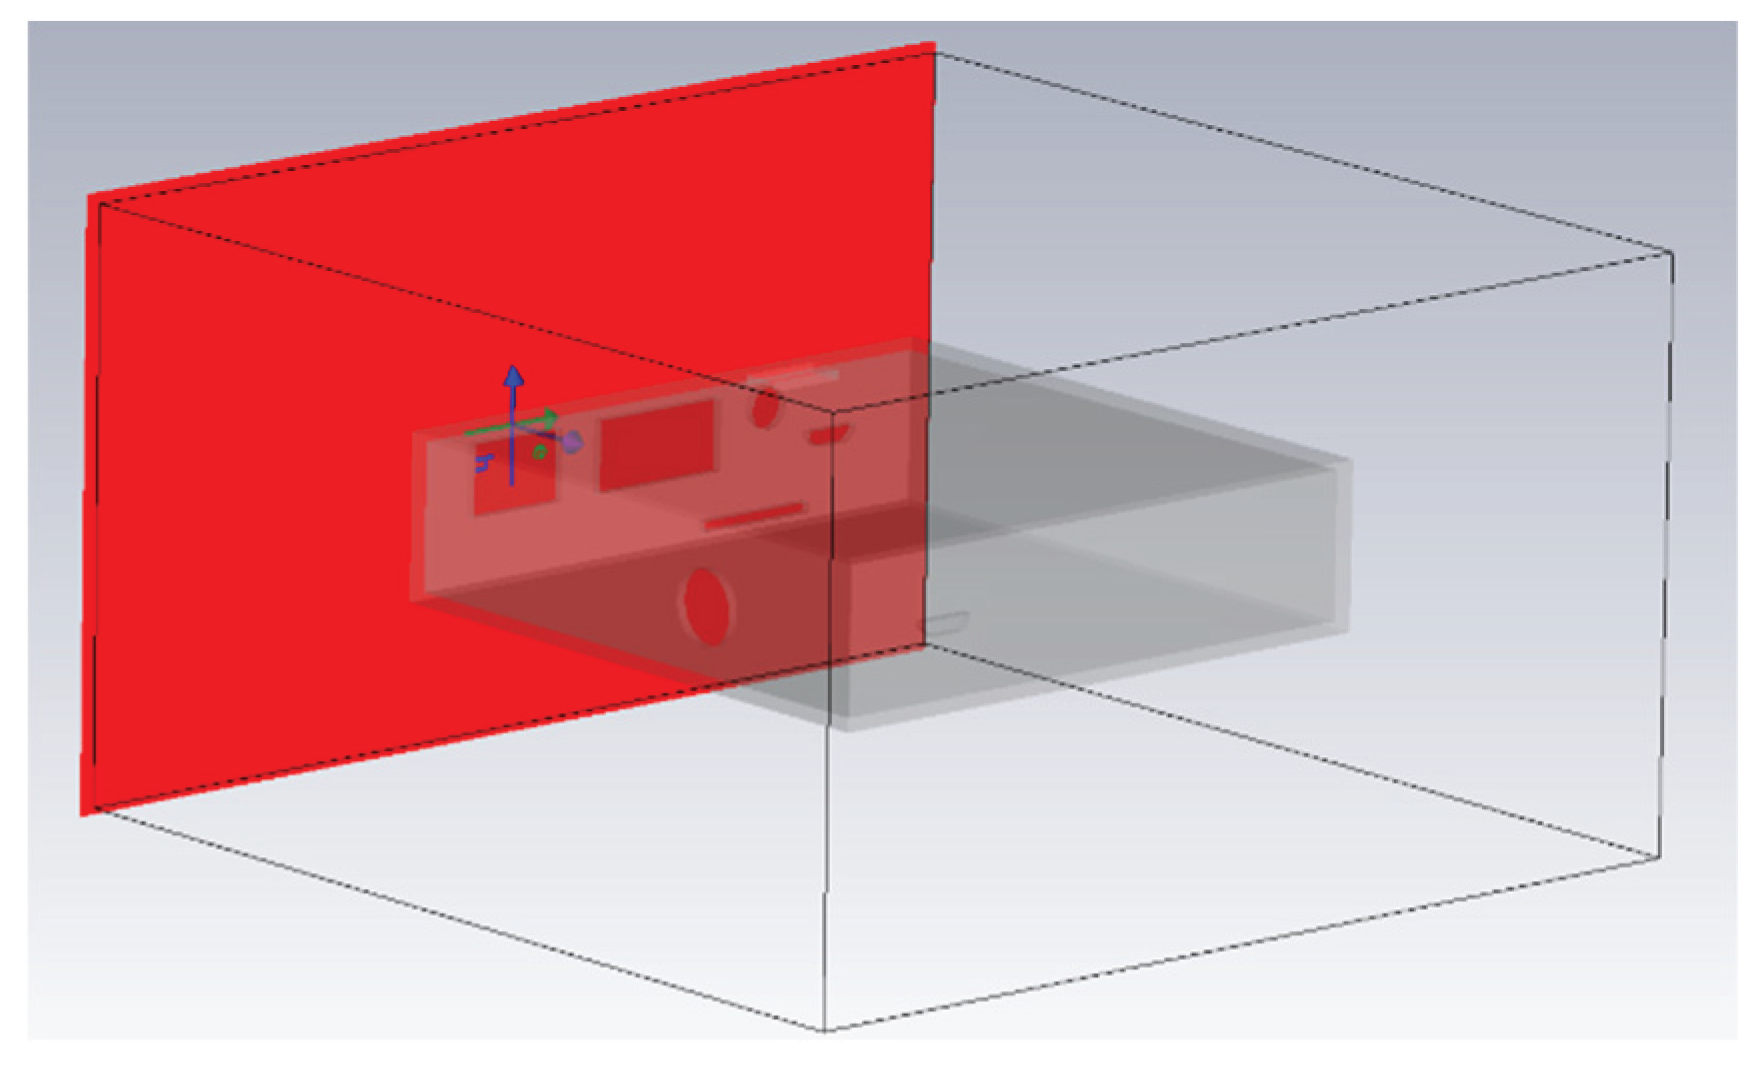
Since the shielding effectiveness of the enclosure is primarily manifested in frequencies above 400 MHz, the simulation frequency range was set from 400 MHz to 18 GHz to improve computational efficiency. A plane wave was used as the excitation source to simulate the HIRF environment, with the field strength set to 200 V/m.
Figure 5.
Illustration of Plane Wave Excitation.
3.3 Monitor and Probe Configuration
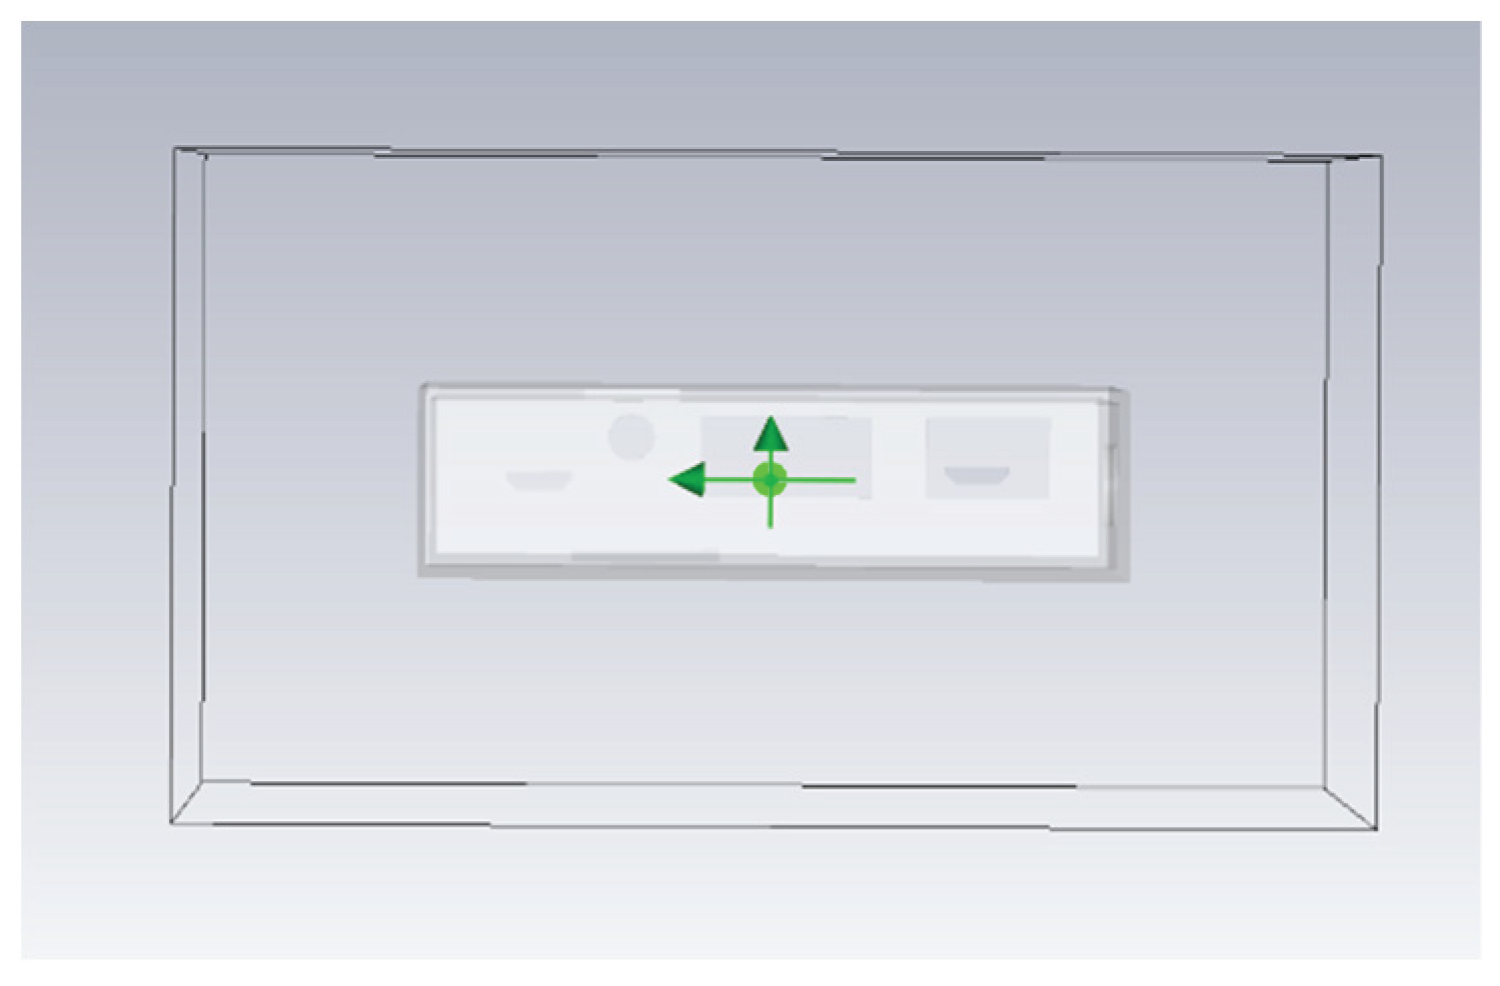
Before initiating the simulation, an electric field probe was placed at the center of the model at coordinates (0, 0, 0). To eliminate the influence of probe position on the simulation results, the same probe location was consistently used throughout all subsequent simulations.
In addition, surface current monitors were configured at various frequencies to observe the distribution of induced currents on the model's surface during the simulation.
Figure 6.
Illustration of Probe Position.
4. Simulation and Results Analysis
4.1. Surface Current Distribution
To gain a deeper understanding of the interaction mechanism between electromagnetic waves and the device enclosure, this section begins by analyzing the surface current distribution at different frequencies.
The distribution characteristics of surface current reflect the coupling strength of external electromagnetic waves to the enclosure as well as the regions where current tends to concentrate. These characteristics serve as important indicators for evaluating shielding effectiveness and identifying potential electromagnetic leakage paths.
Figure 7 illustrates the surface current distribution on the enclosure at different frequencies. In each subfigure, warmer colors indicate higher current intensity. It is evident that frequency has a significant effect on both the pattern and peak values of surface current distribution.
At 400 MHz, the surface current is relatively uniform, with no strong local concentrations. The maximum current intensity is only 1.22 A/m, and the longer wavelength at this frequency does not effectively couple with the enclosure structure. As a result, shielding effectiveness is relatively high, and the risk of electromagnetic leakage is low.
When the frequency increases to 2000 MHz, the maximum current rises to 2.41 A/m, and localized enhancement begins to appear around aperture edges and areas with structural discontinuities. At 5000 MHz, the current intensity further increases to 3.05 A/m.
At 10,000 MHz, the surface current intensity surges to a peak value of 18 A/m, with significant concentration around multiple front-facing apertures. This suggests that the structure may be experiencing resonance or strong coupling at this frequency, leading to localized shielding failure. Similar trends continue at higher frequencies such as 13,000 MHz and 18,000 MHz, where current hotspots remain concentrated near structural openings and slits.
In general, higher surface current density indicates greater electromagnetic coupling into the interior, resulting in poorer shielding effectiveness. Conversely, areas with low current density correspond to better shielding performance. These results suggest that, in high-frequency HIRF environments, the shielding performance of the enclosure is largely constrained by local coupling at structural discontinuities. Therefore, edge designs, current concentration zones, and seam treatments should be prioritized for optimization to enhance overall shielding effectiveness.
4.2. Effect of Polarization Modes
The polarization direction of an electromagnetic wave directly affects its coupling behavior with structural features such as seams and apertures. This section compares the shielding effectiveness of the enclosure under horizontal and vertical polarization, aiming to reveal how polarization influences coupling paths and resonance phenomena.
Figure 8.
Simulation results under different polarization modes.
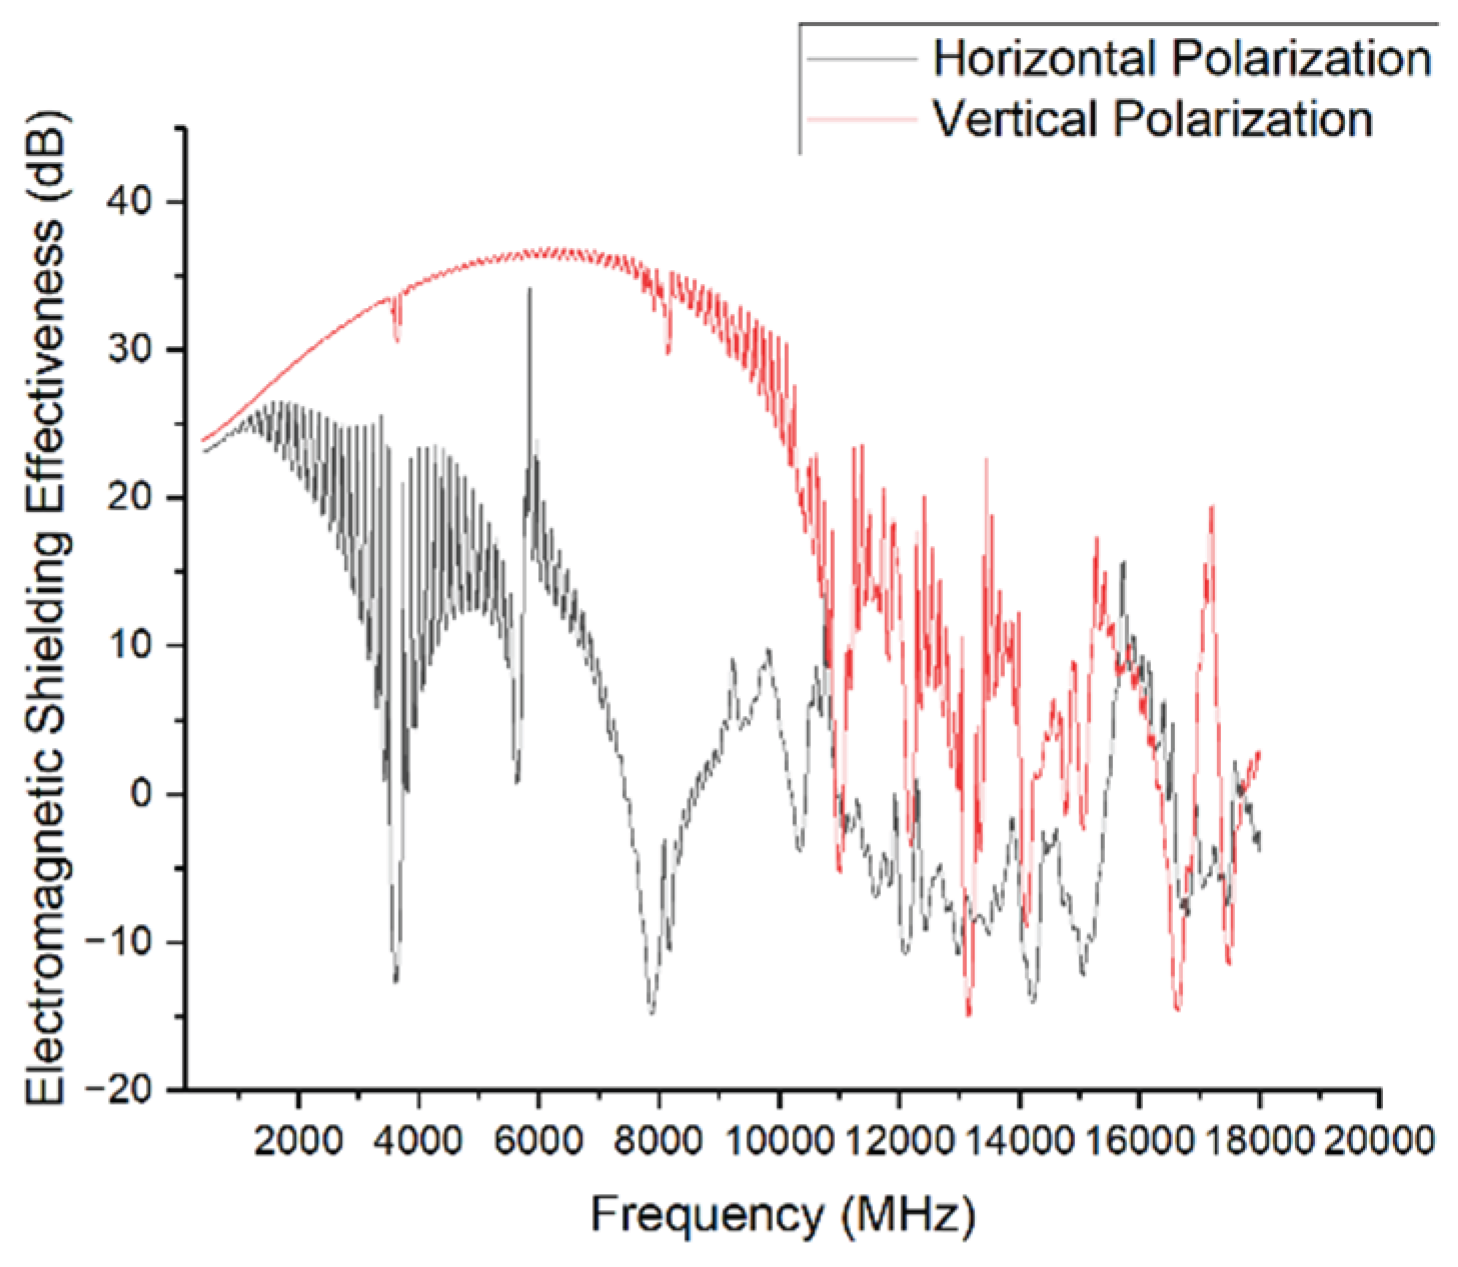
The simulation results show significant differences in shielding effectiveness depending on both frequency and polarization mode.
- In the 1–3 GHz range, the shielding effectiveness remains between 20 and 35 dB for both polarizations, with minimal difference between the two.
- From 3 to 6 GHz, resonant effects begin to emerge under horizontal polarization, notably near 3.6 GHz and 5.7 GHz, where strong coupling between the polarized waves and the enclosure's gaps and openings causes shielding effectiveness to drop sharply below –10 dB. In contrast, vertical polarization maintains a shielding effectiveness of around 30 dB in the same frequency range.
- Within the 6–10 GHz band, the shielding performance under vertical polarization gradually declines, while horizontal polarization briefly recovers but then again exhibits resonance near 8 GHz, causing SE to fall below –10 dB.
- Above 10 GHz, both polarization modes experience strong resonance-induced fluctuations, resulting in a significant drop in shielding effectiveness.
Overall, horizontal polarization leads to faster attenuation and a broader frequency range of shielding failure. Therefore, in order to achieve a more stringent assessment and further explore the shielding behavior under worst-case conditions, horizontal polarization is adopted as the standard excitation mode in subsequent simulations.
4.3. Effect of Incidence Angle
In actual High-Intensity Radiated Fields (HIRF) environments, electromagnetic waves may strike the device surface from arbitrary angles. To investigate the influence of incident angle on shielding effectiveness, this section presents simulation analyses at several typical angles to evaluate their impact on shielding performance.
Figure 9.
Illustration of different incidence angles:(a) 0°; (b) 30°; (c) 45°; (d) 60°.
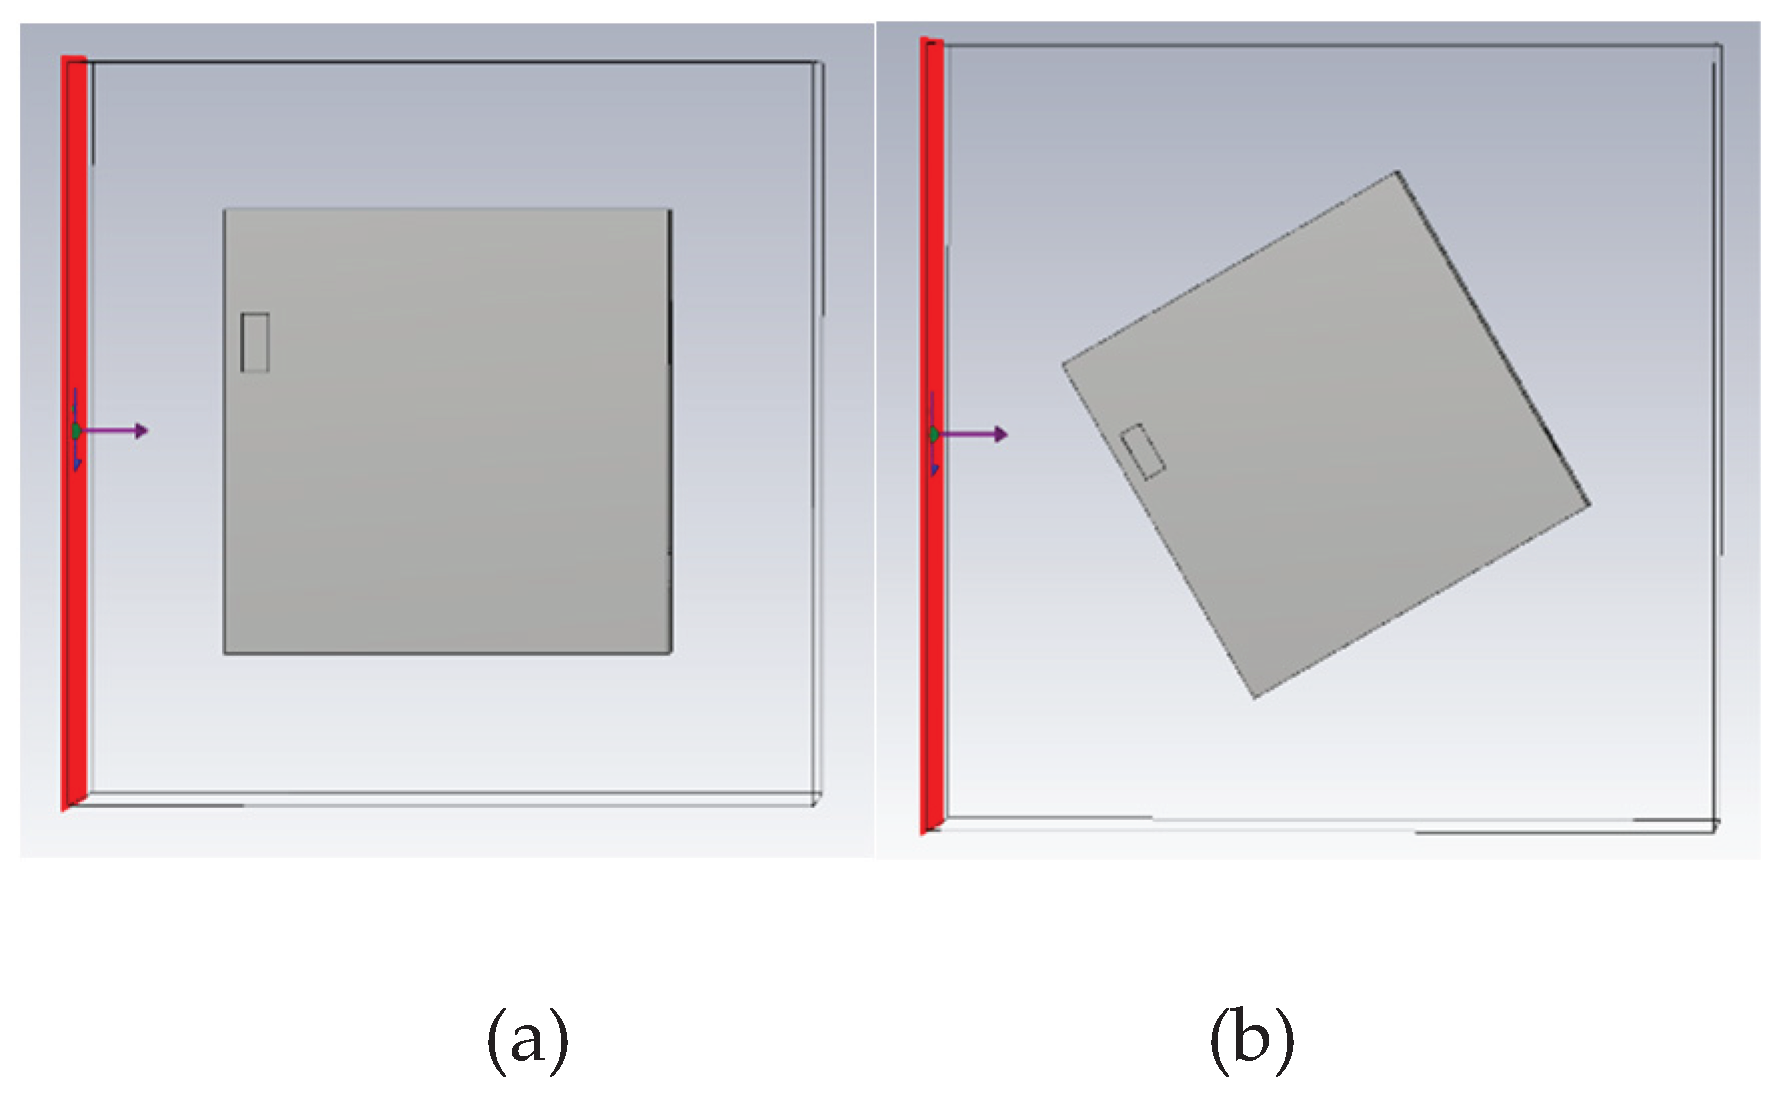
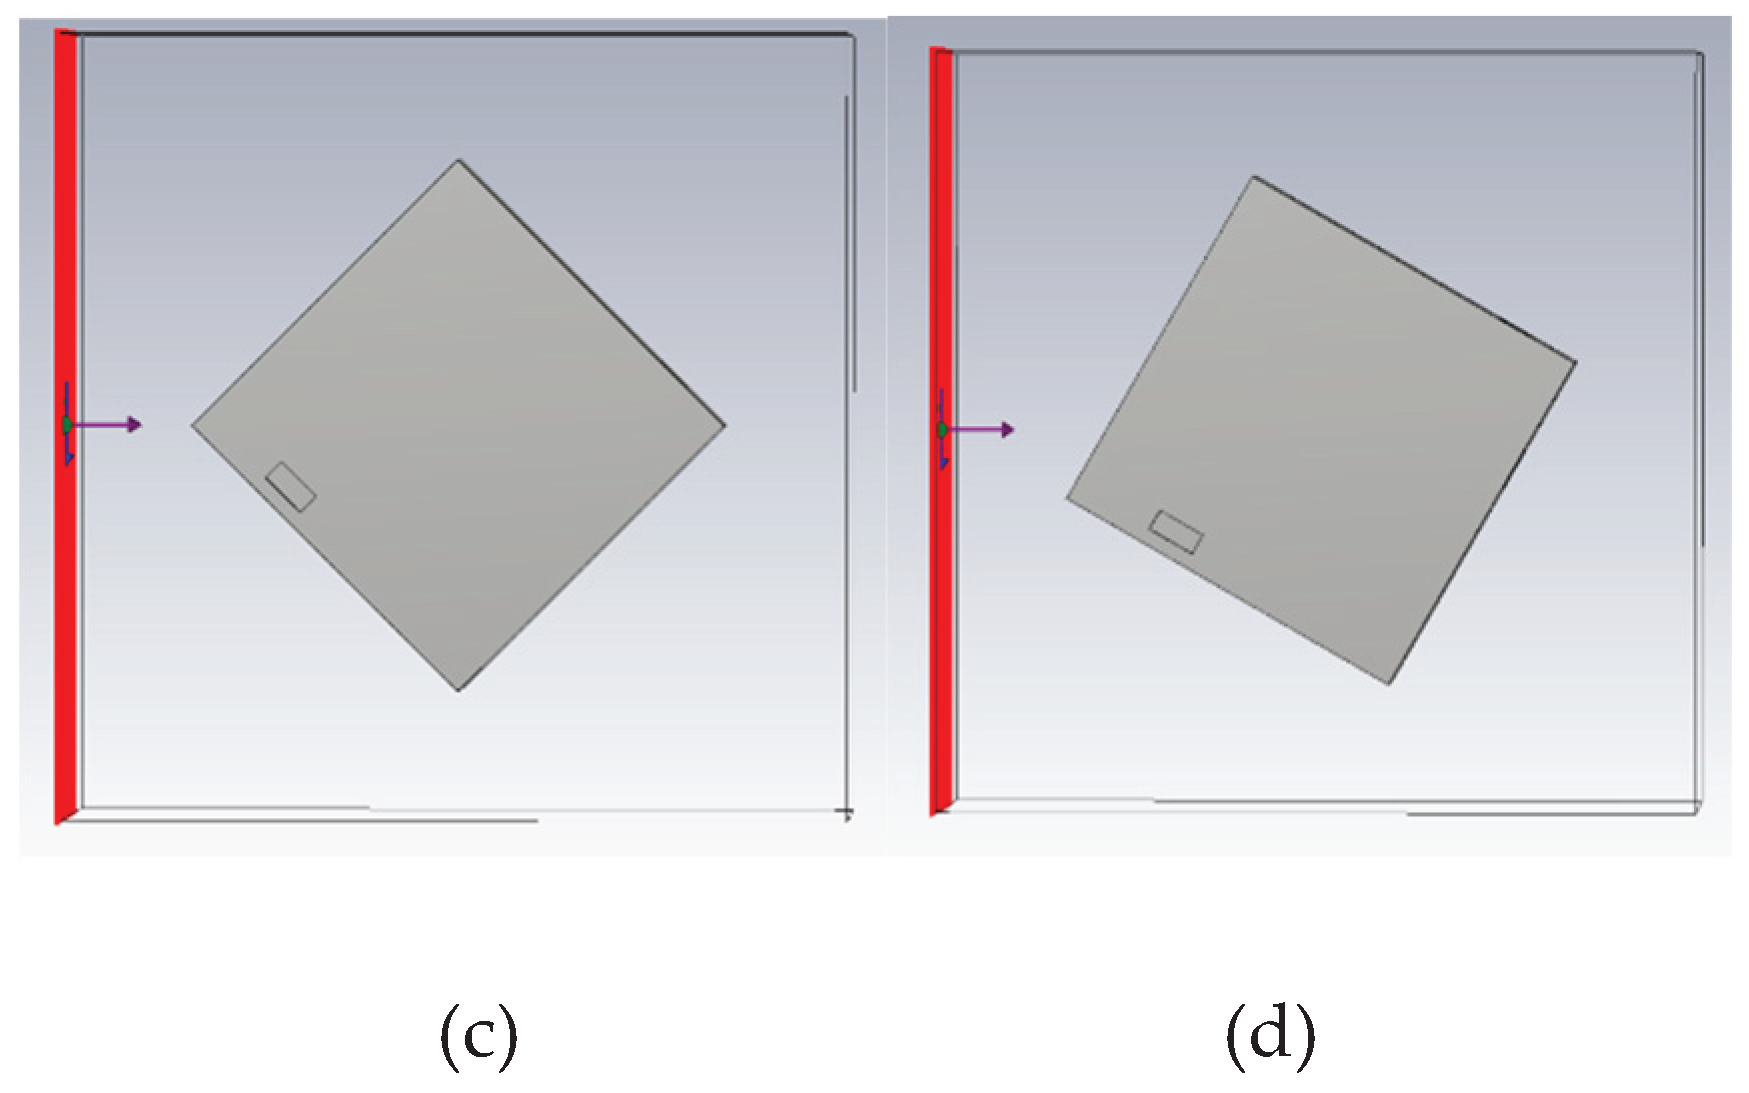
Figure 9.
Simulation results for different incidence angles (full frequency range).
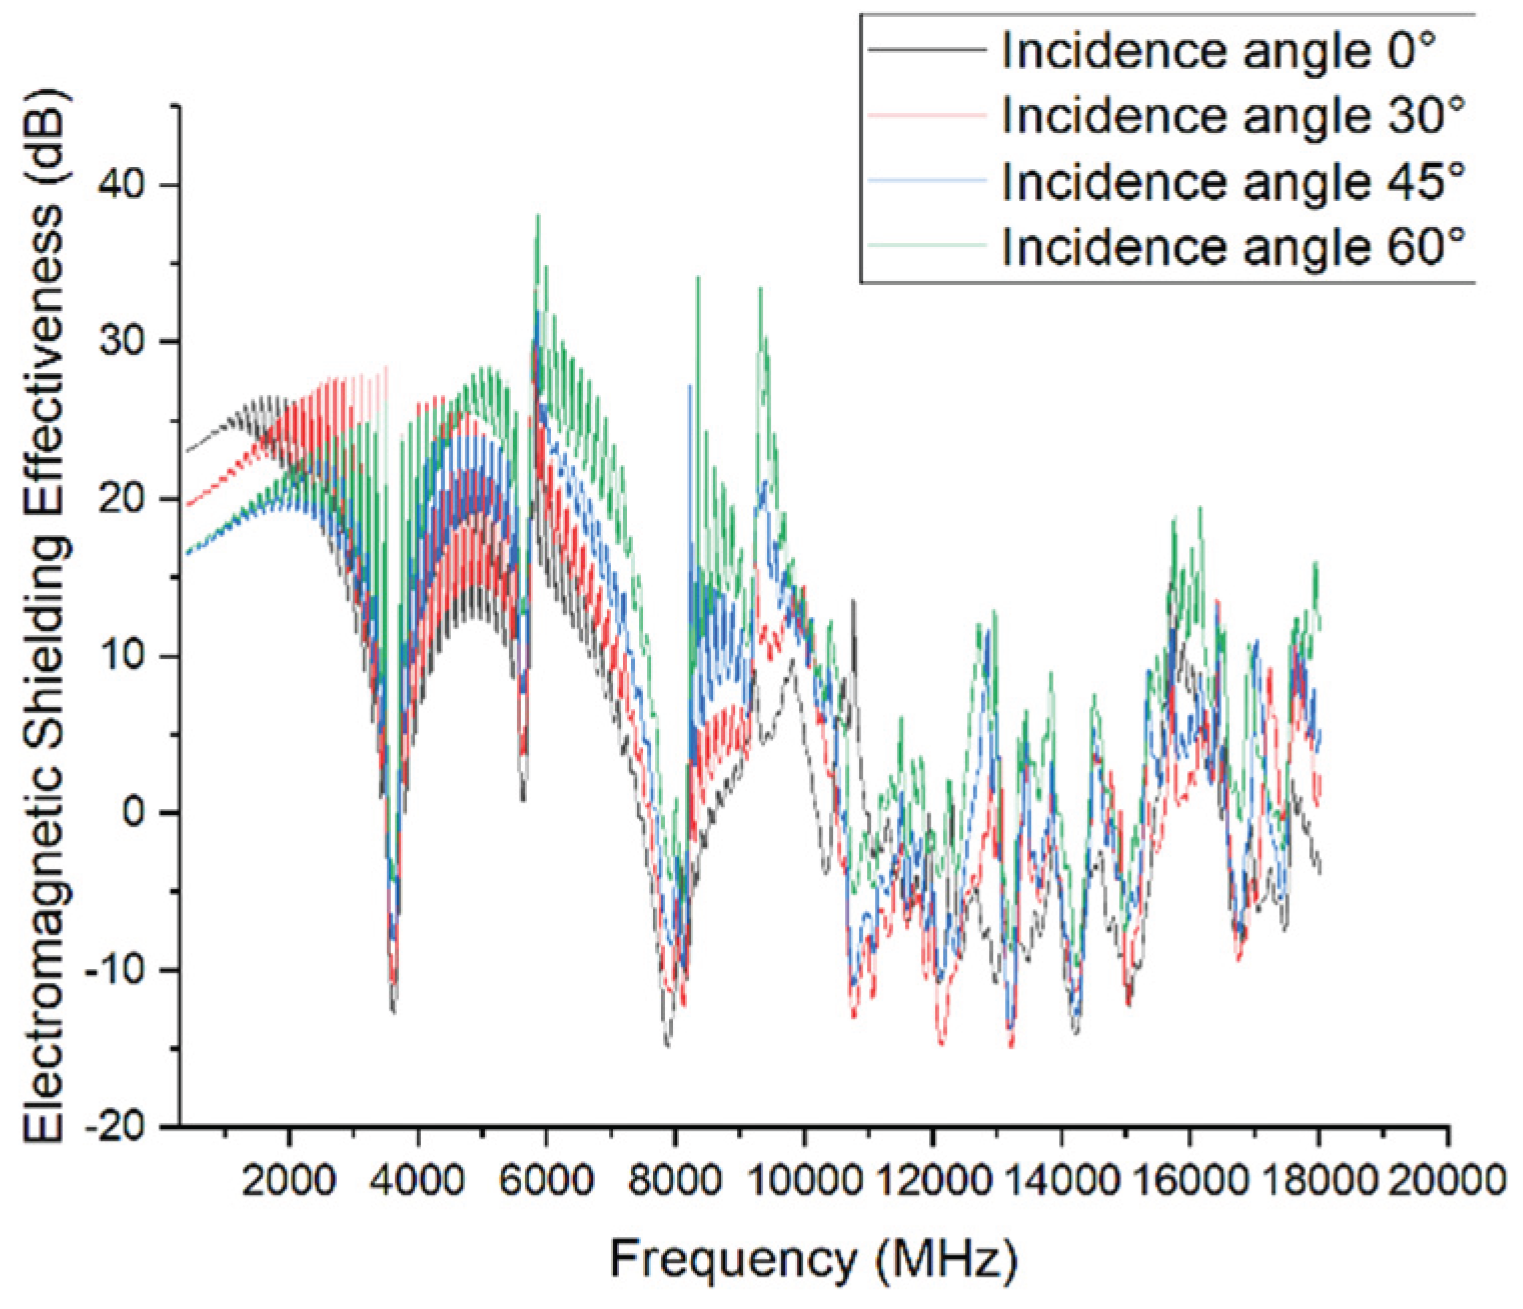
Figure 10.
Simulation results for different incidence angles (low-frequency range).
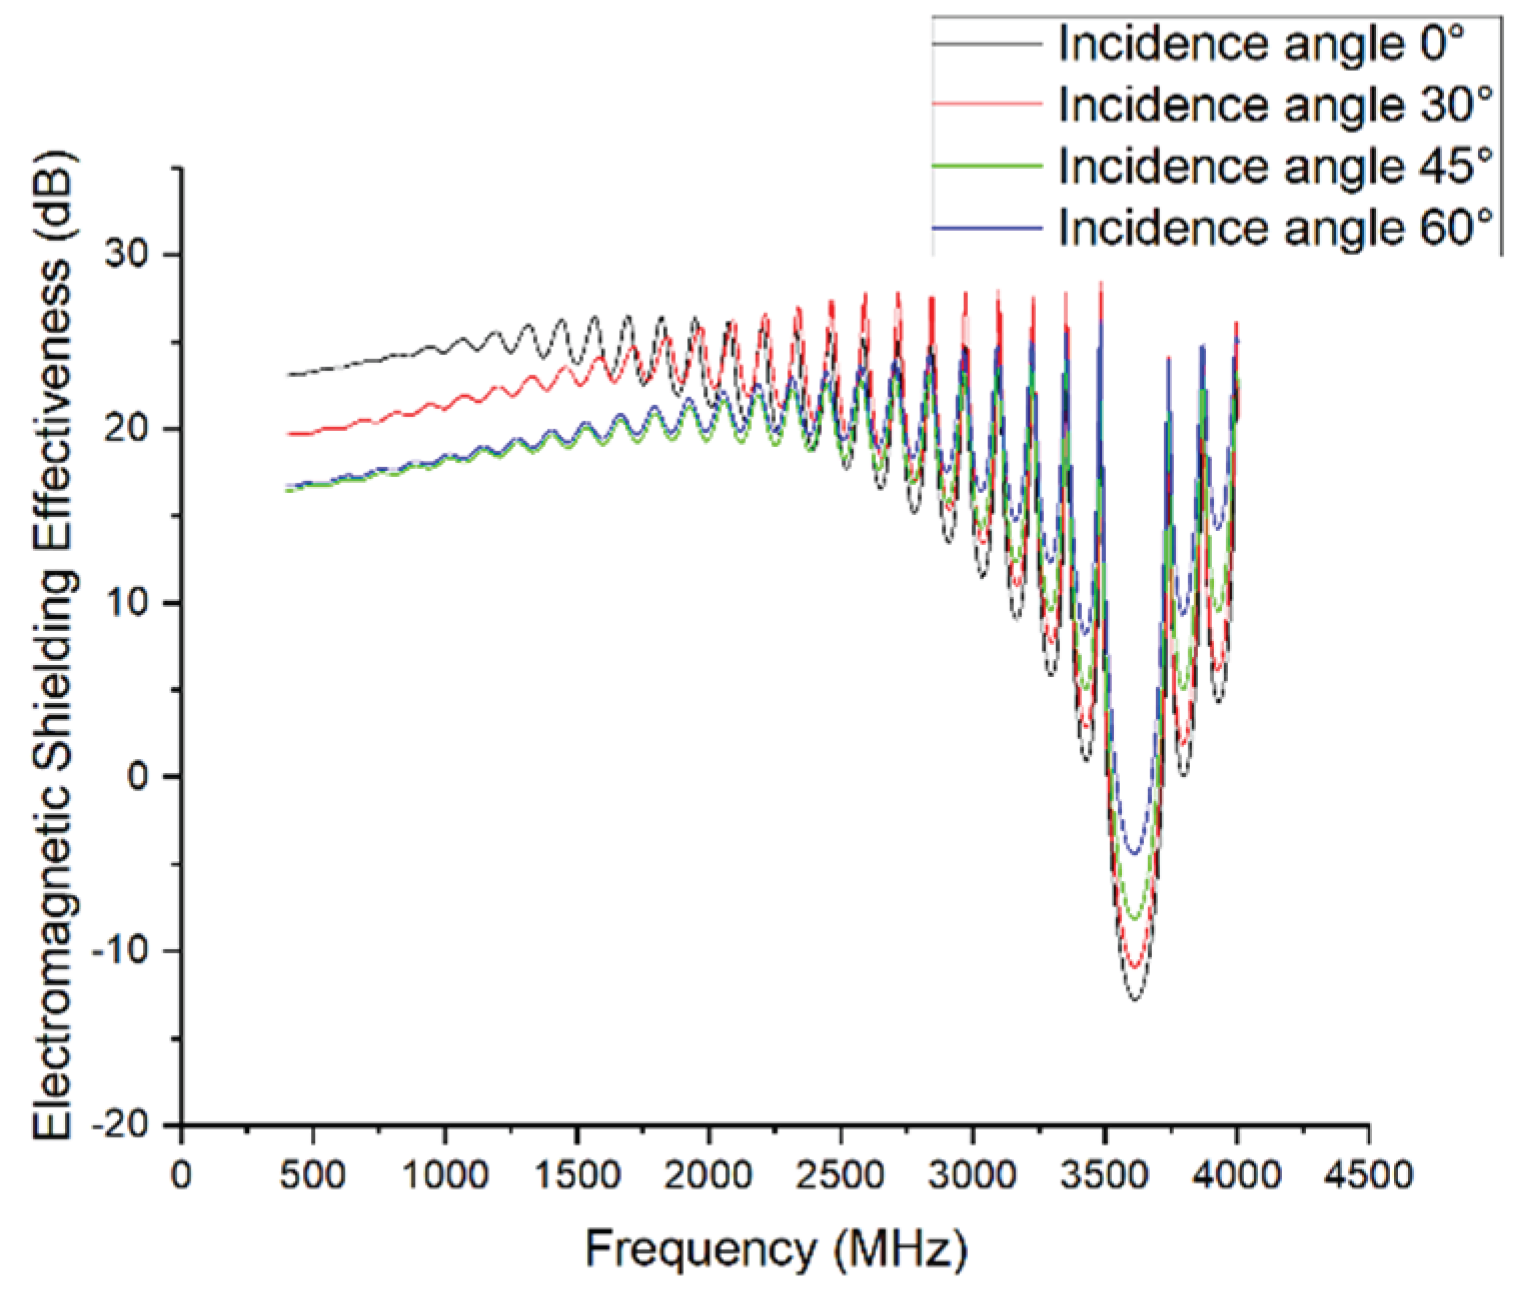
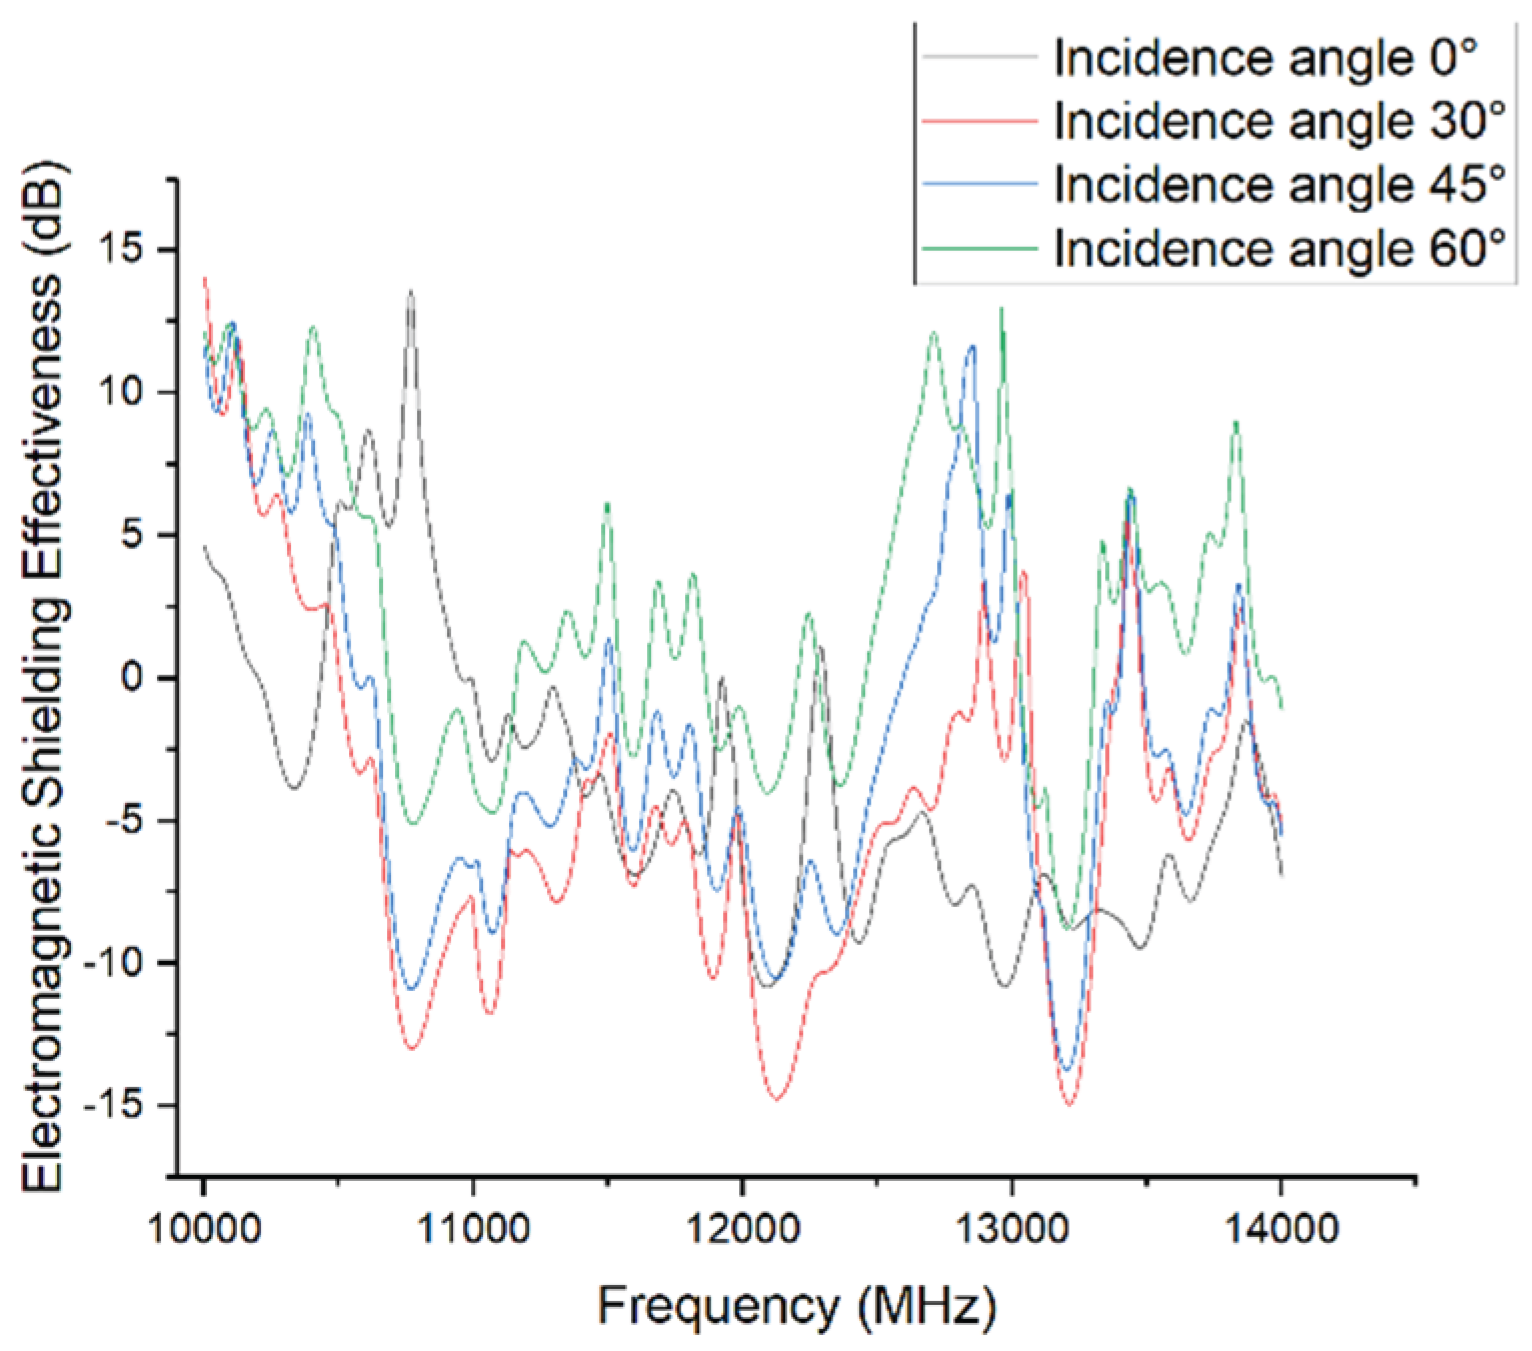
Figure 11.
Simulation results for different incidence angles (high-frequency range).
A comparison of the SE curves at 0°, 30°, 45°, and 60° reveals that the angle sensitivity of shielding effectiveness is most pronounced in the 3–10 GHz range.
Near 3.6 GHz and 8 GHz, clear resonance effects are observed. The shielding effectiveness drops to approximately –10 dB at 0° and 30°, whereas the minima are mitigated to –6 dB and –3 dB at 45° and 60°, respectively. In the 6–8 GHz range, 60° incidence results in a peak SE of nearly 40 dB, which is about 25 dB higher than that of the 0° case, with other angles falling between these extremes.
These results suggest that oblique incidence can weaken the electric field component parallel to enclosure slits, thereby reducing coupling through gaps and apertures.
In contrast, within the 1–3 GHz and above 10 GHz bands, differences among the SE curves become negligible, with variations limited to 2–4 dB. This indicates that the shielding effectiveness is relatively insensitive to incident angle at low frequencies (where the wavelength is much larger than structural features) and at very high frequencies with complex multimode interactions.
In summary, variation in incidence angle mainly affects the resonance bandwidth and peak/valley depth in the mid-frequency range, while its influence on broadband average shielding effectiveness remains limited.
4.4. Effect of Incident Surface
Different surfaces of the enclosure exhibit varying structural features and aperture distributions, resulting in significant differences in their ability to withstand external electromagnetic radiation. This section compares several typical incident surfaces to analyze how surface structure determines shielding effectiveness, thereby providing a reference for future structural optimization.
Figure 12.
Illustration of different incident surfaces: (a) Surface A; (b) Surface B; (c) Surface C; (d) Surface D.
Figure 12.
Illustration of different incident surfaces: (a) Surface A; (b) Surface B; (c) Surface C; (d) Surface D.
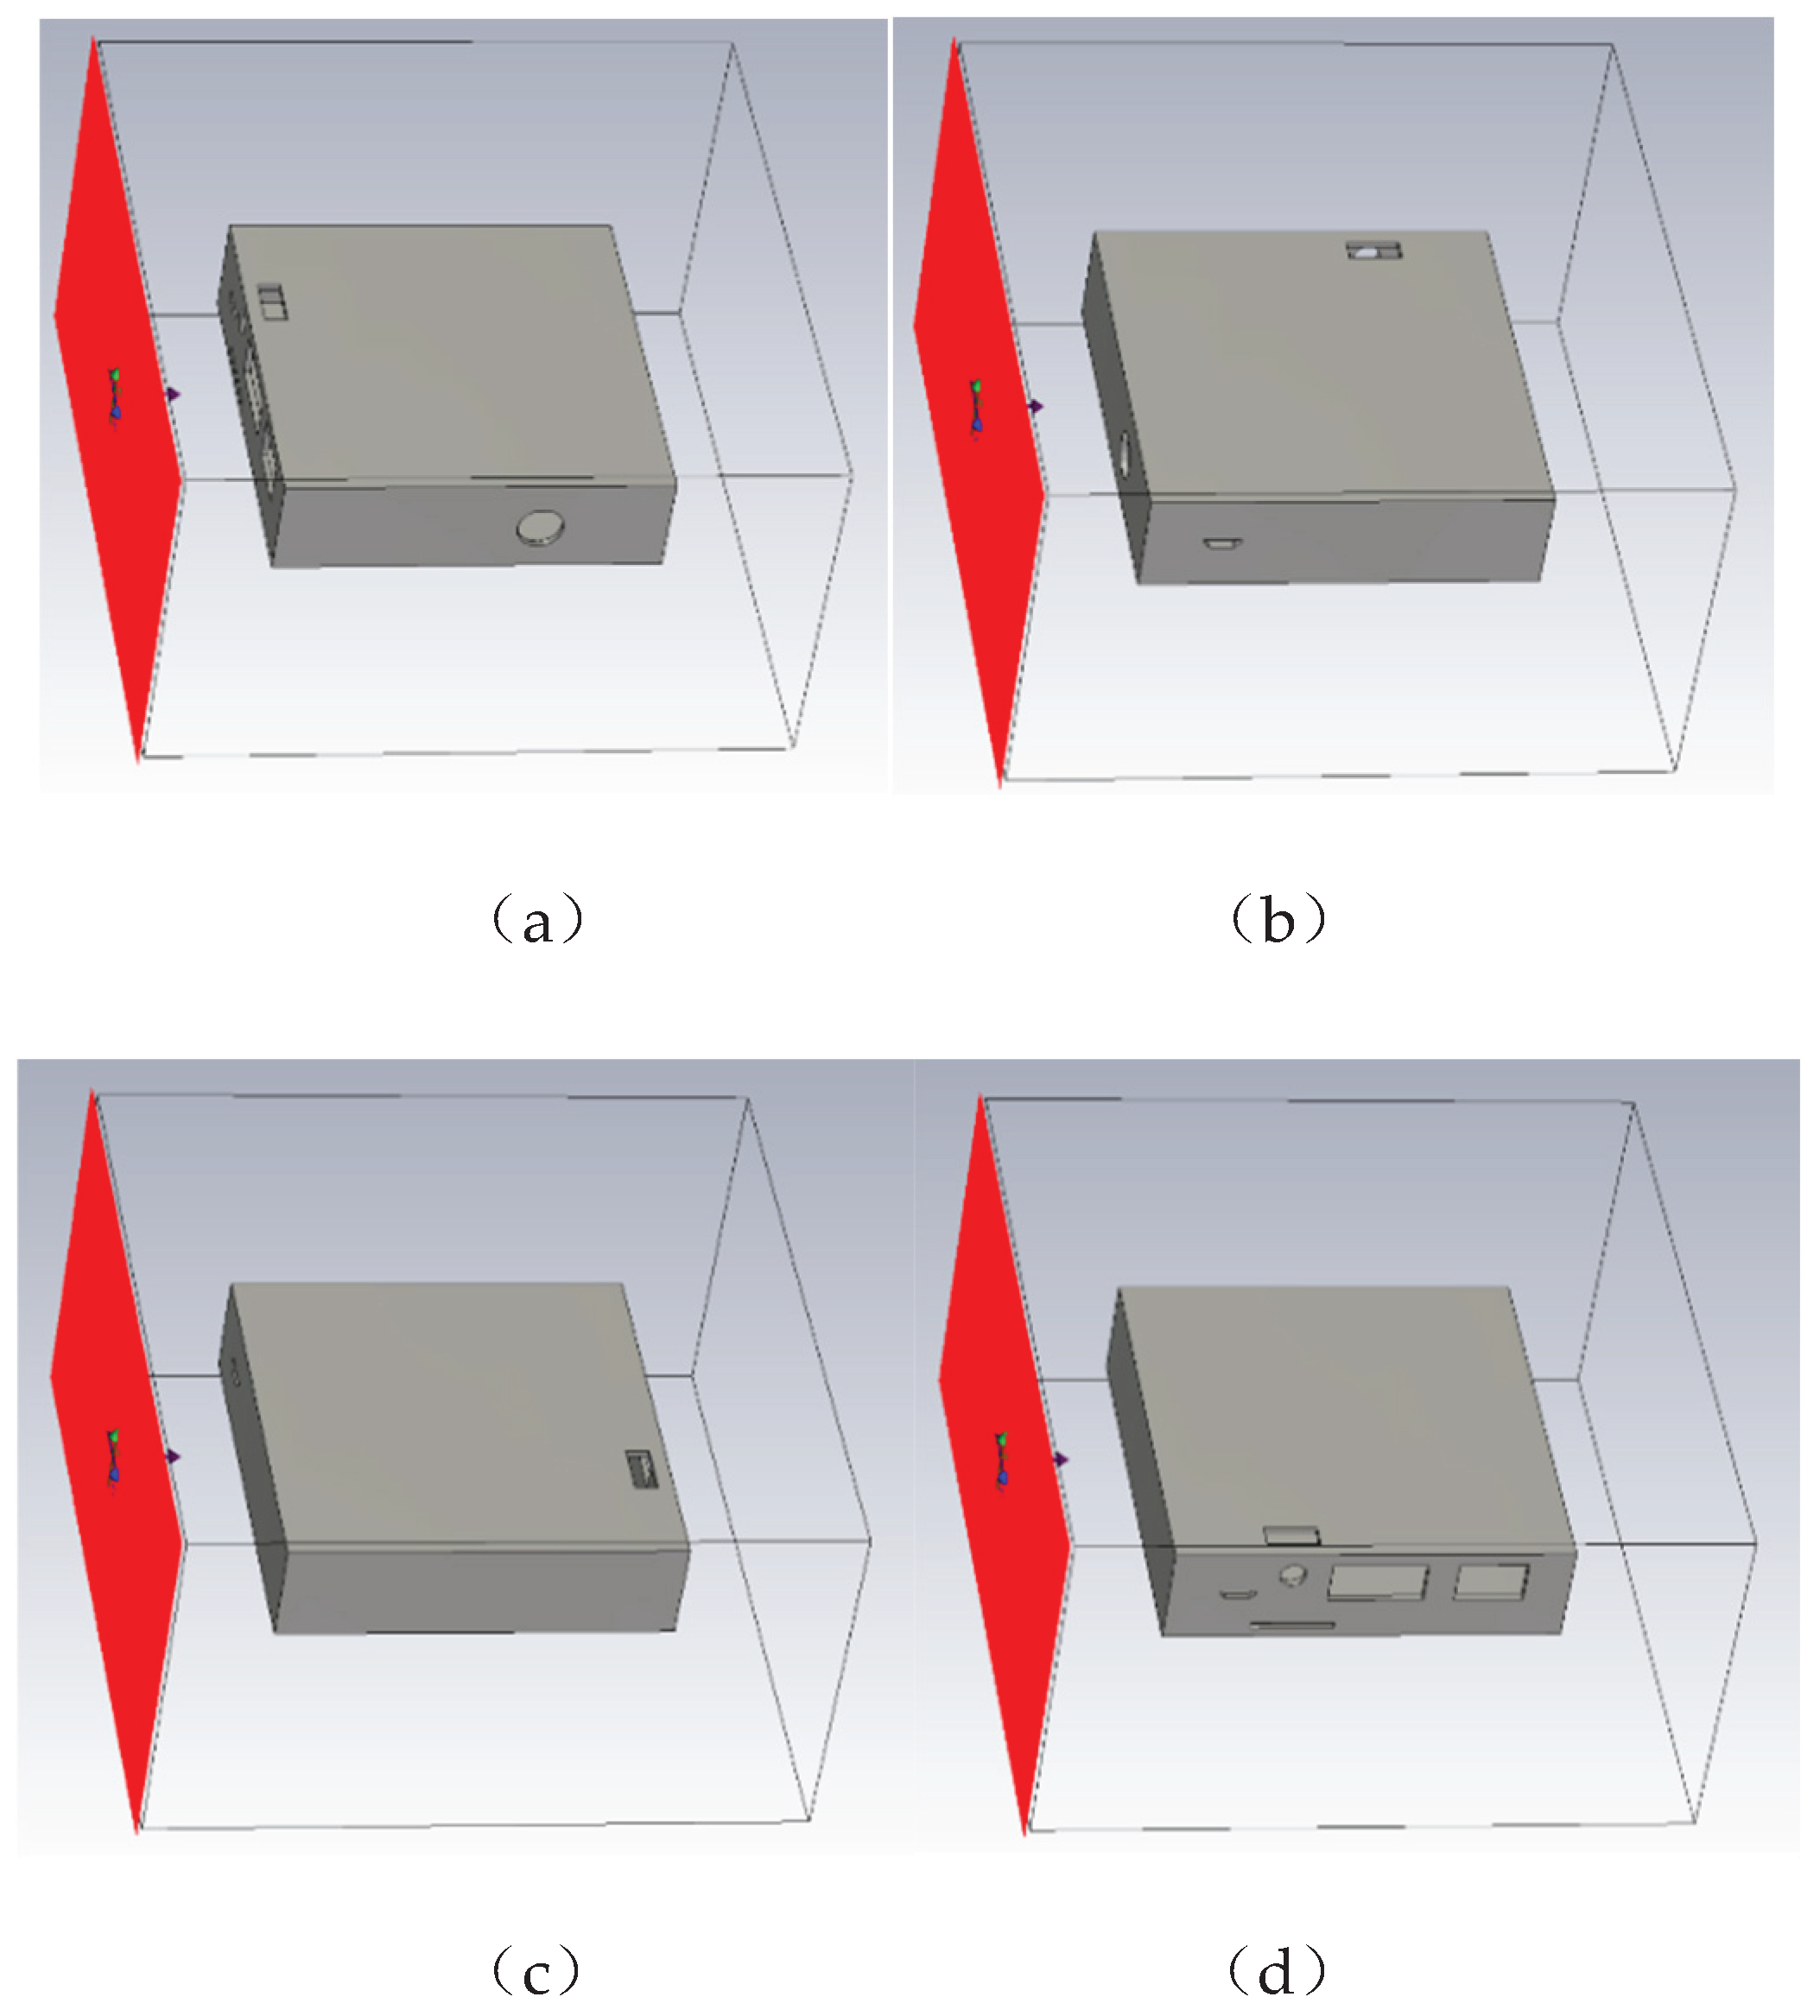
Figure 13.
Simulation results for different incident surfaces (full frequency range).
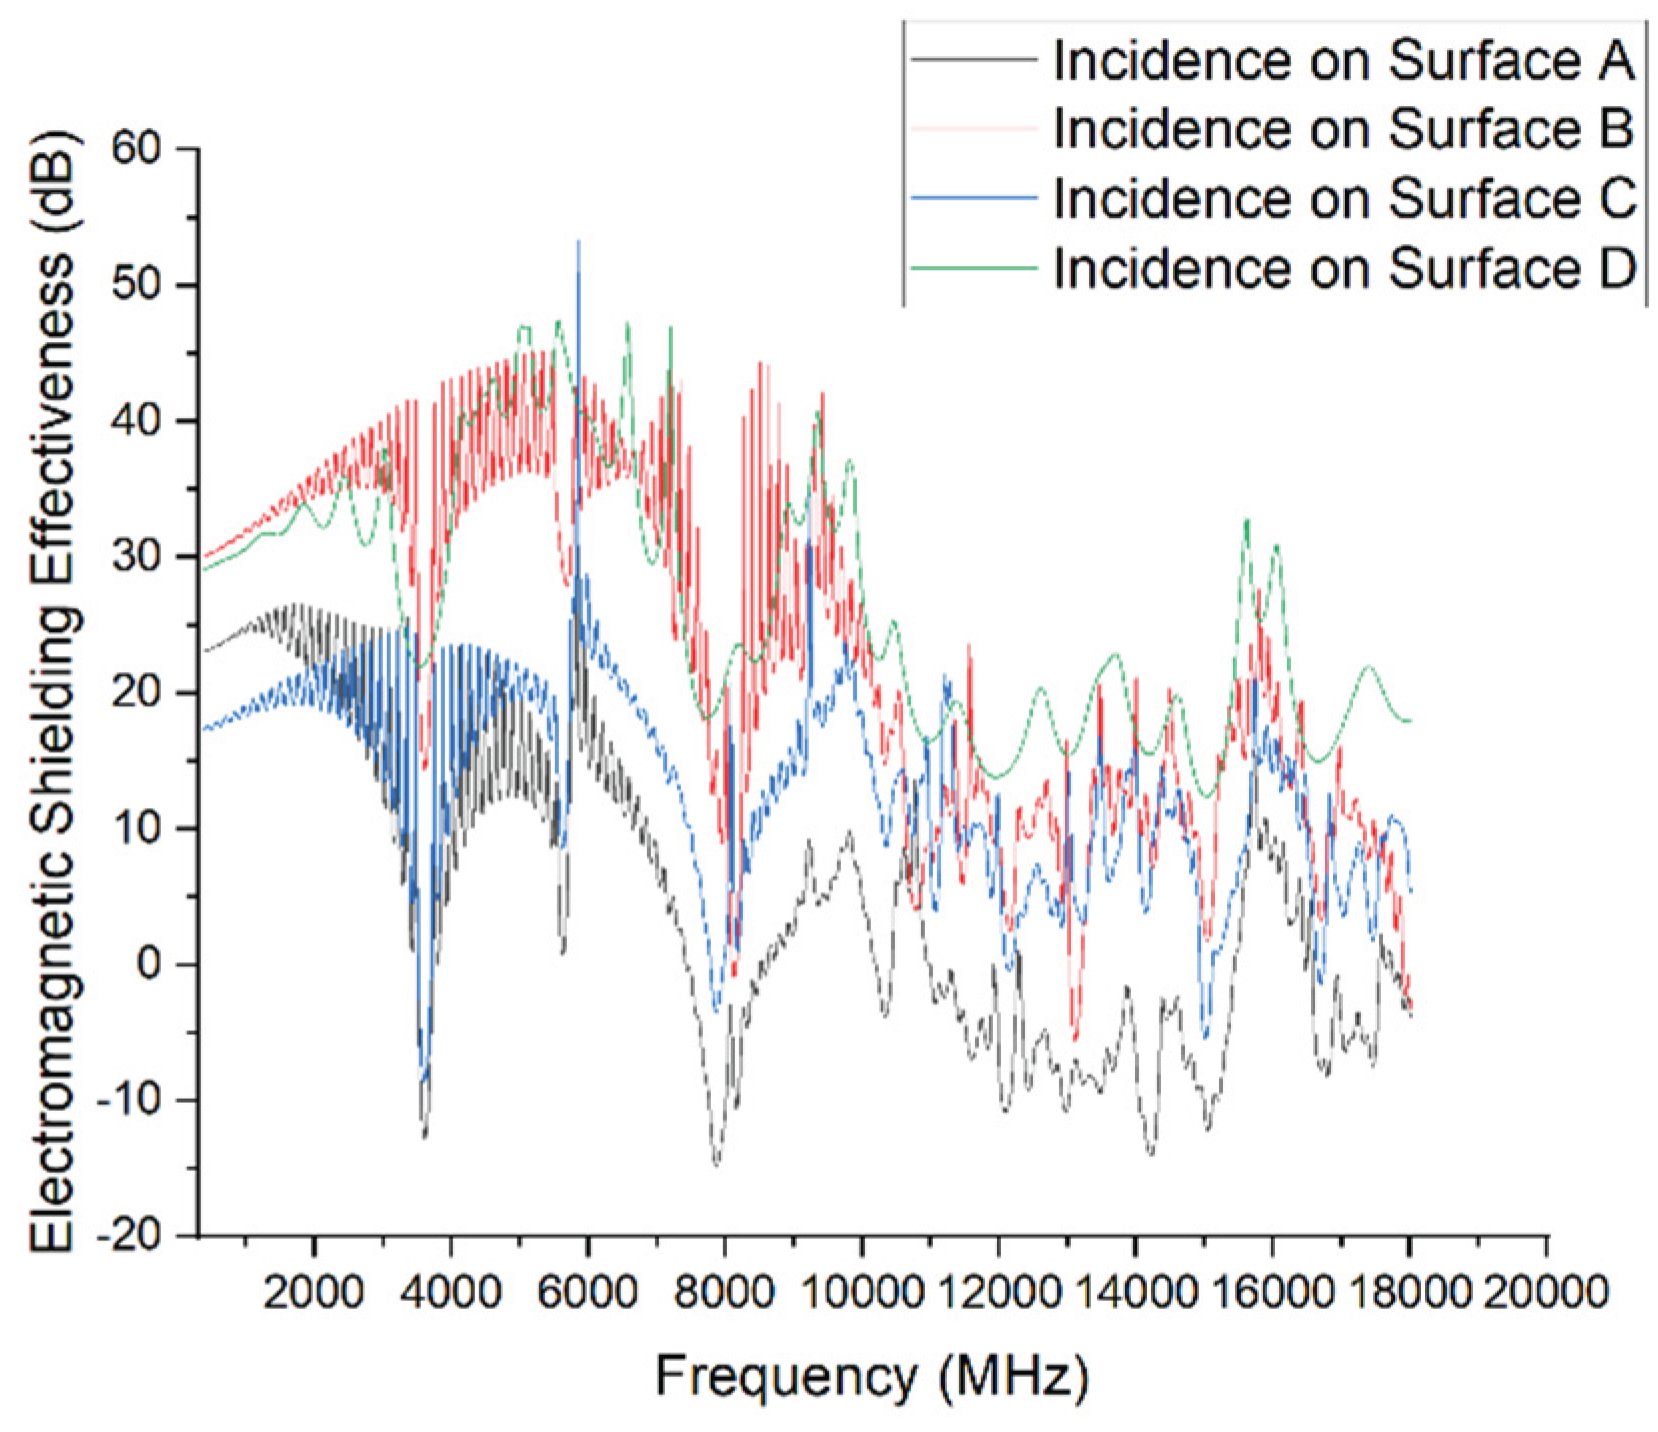
Figure 14.
Simulation results for different incident surfaces (low-frequency range).
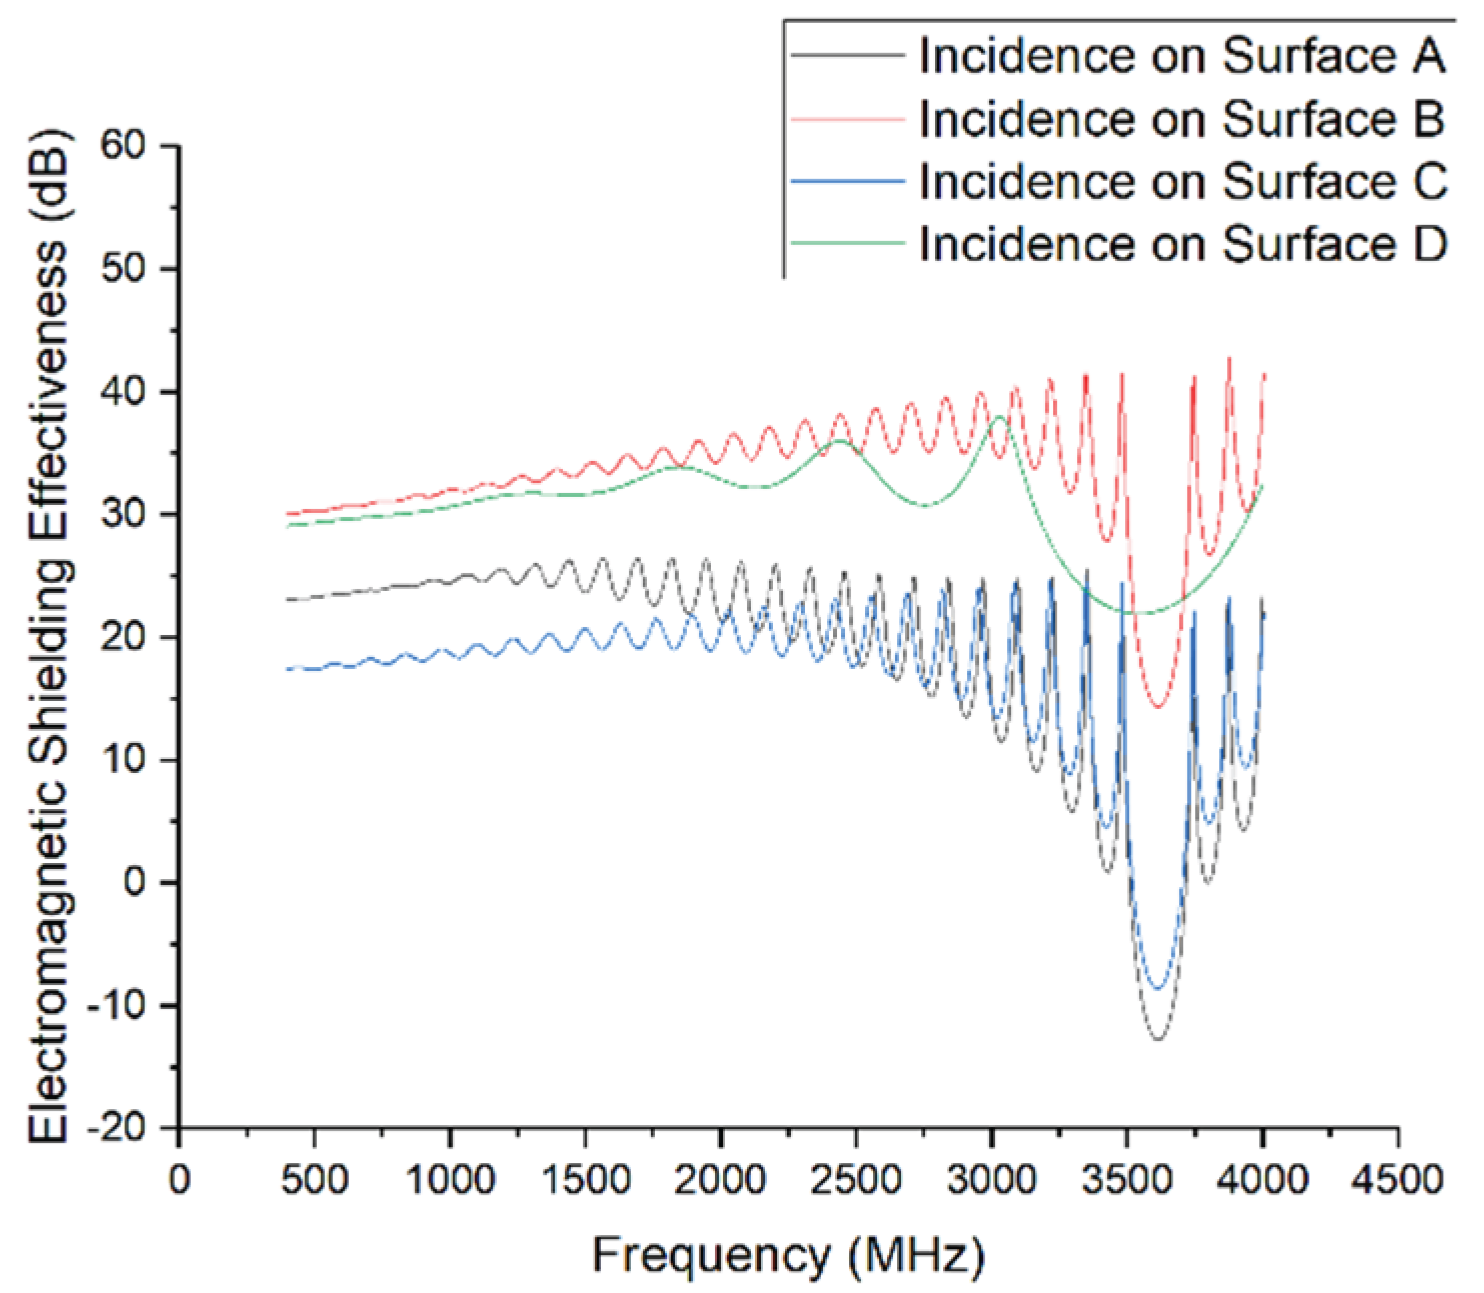
Figure 15.
Simulation results for different incident surfaces (high-frequency range).
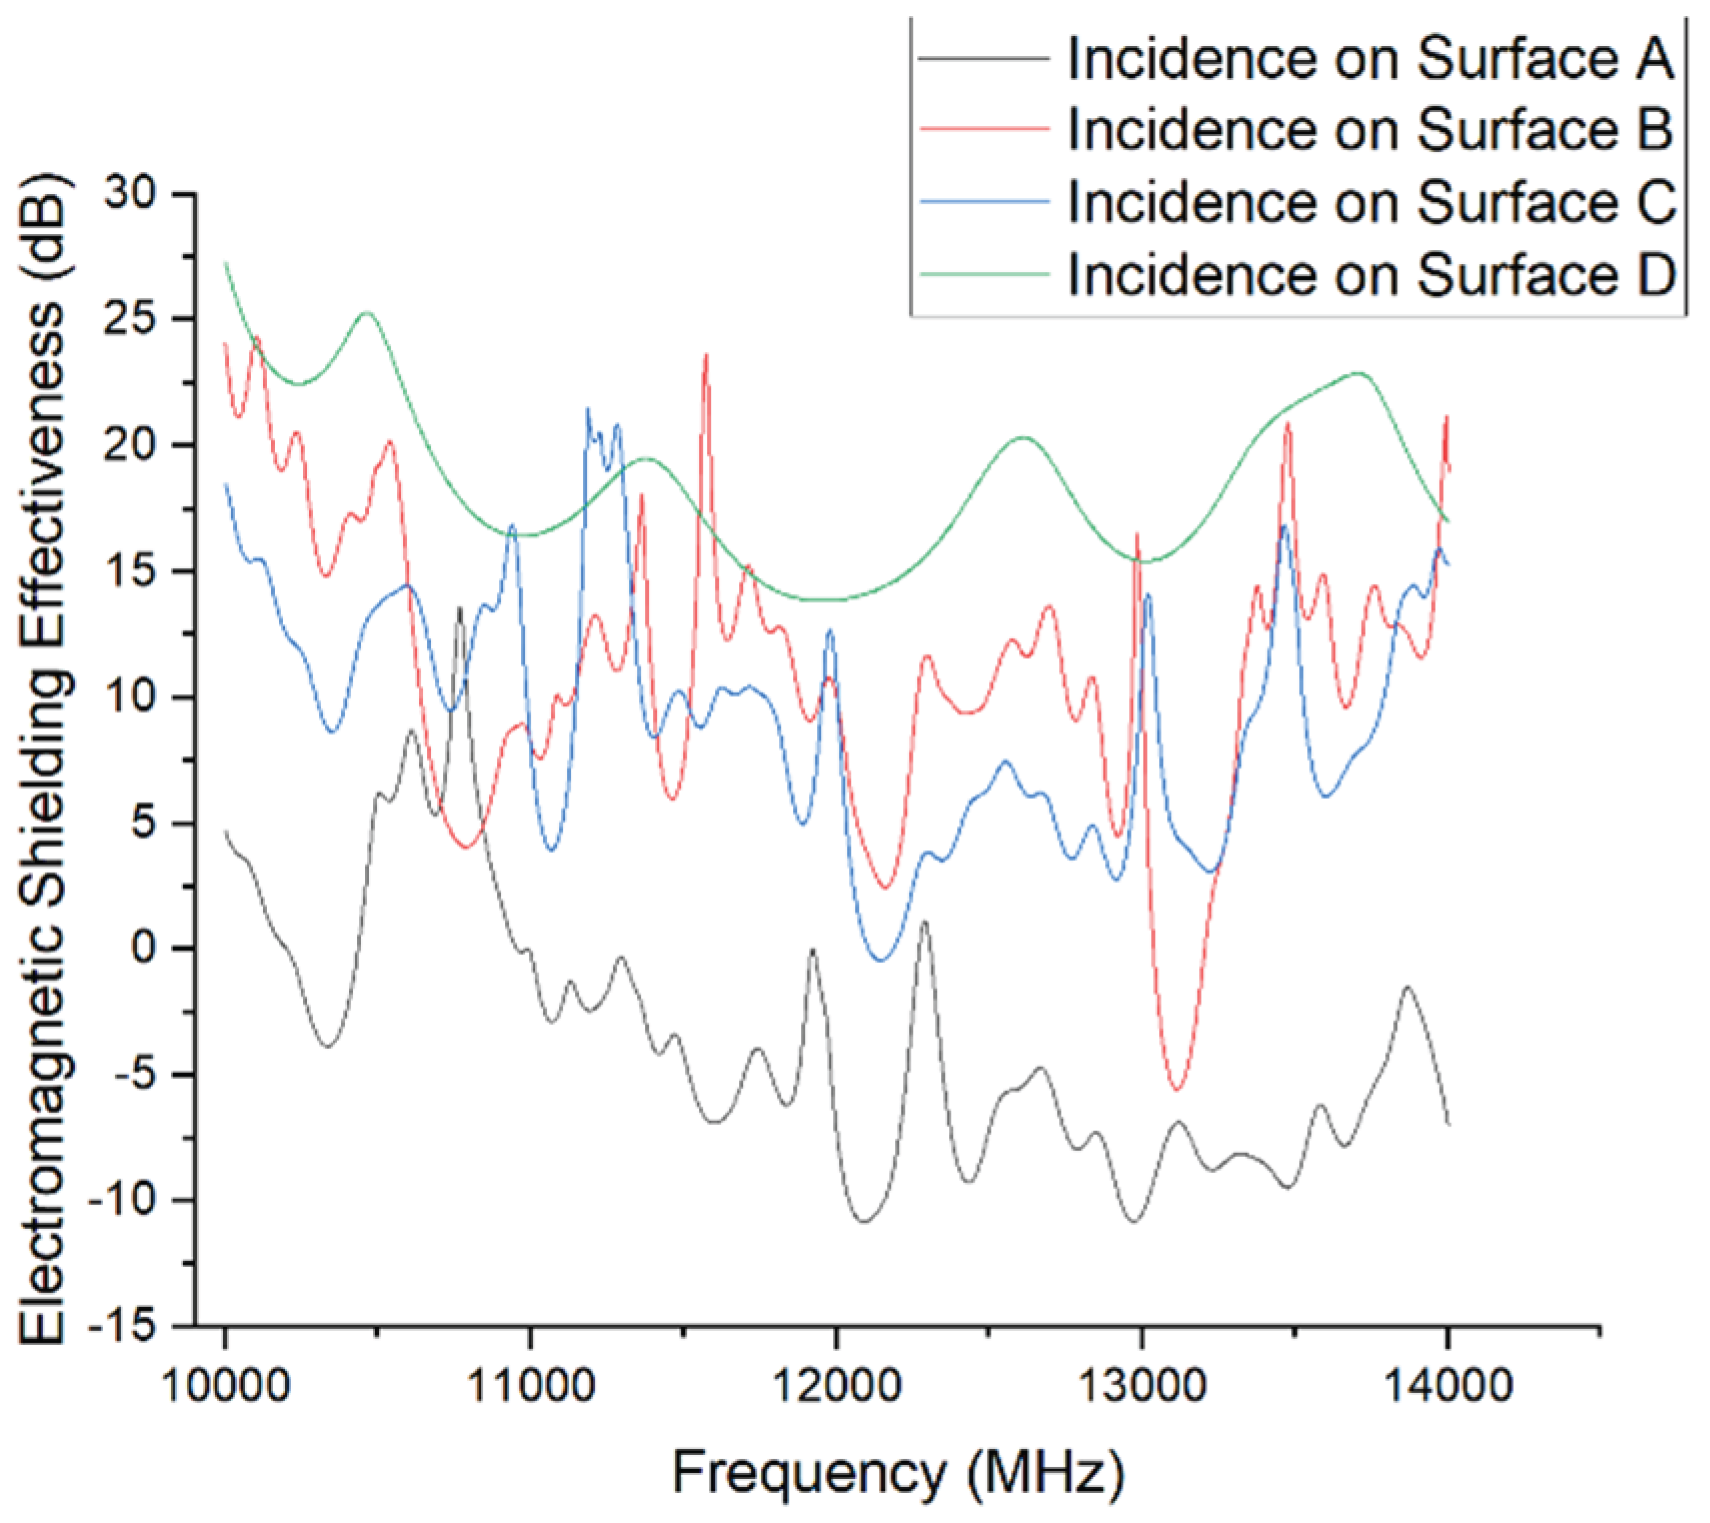
The simulation results indicate that shielding effectiveness varies significantly with the incident surface, especially in the mid-to-high frequency range (3–12 GHz).
Among the cases, Surface A exhibits the worst shielding performance, with pronounced resonances at approximately 3.6 GHz and 7.8 GHz, where SE drops as low as –15 dB. Across the 3–10 GHz range, the SE fluctuates between 0 and 20 dB, consistently lower than that of the other surfaces. This poor performance is closely related to the multiple structural apertures on Surface A, which facilitate electromagnetic coupling into the enclosure through gaps and holes, leading to shielding failure.
In contrast, Surface B performs better, with only a slight SE dip (minimum around 10 dB) in the 5–7 GHz range, and no significant resonance across the rest of the spectrum. Overall, it demonstrates good shielding performance.
Surface C, though containing only one trapezoidal opening, has a relatively long horizontal dimension. Combined with horizontal polarization excitation, this promotes coupling with the electric field, resulting in a notable SE decrease between 4 and 7 GHz, reaching a minimum of approximately 5 dB. Its overall performance is slightly better than that of Surface A.
Surface D delivers the best shielding effectiveness across the entire frequency range, maintaining SE above 30 dB between 3 and 10 GHz, with some frequency points exceeding 40 dB. This highlights that a structurally intact surface without visible gaps or apertures is crucial for stable shielding performance.
In summary, the number and size of apertures are key factors influencing shielding effectiveness. Surfaces with multiple openings (e.g., Surface A) can trigger strong resonant coupling at various frequencies, leading to substantial SE degradation. Conversely, surfaces with no openings (e.g., Surface D) consistently exhibit superior shielding performance across the spectrum.
4.5. Effect of Material Properties
Material properties such as electrical conductivity, magnetic permeability, and dielectric constant are among the core factors influencing electromagnetic shielding effectiveness (SE). This section compares several representative materials, including typical metals and composite materials, through simulation
The electromagnetic shielding performance of a material is primarily determined by its electromagnetic characteristics, including relative permittivity (), relative permeability (), and electrical conductivity (). The parameters used in the simulation for various materials are listed below:

Table 1.
Electromagnetic properties of different materials.
| Material | (s/m) | ||
|---|---|---|---|
| Perfect Electric Conductor (PEC) | 1 | 1 | ∞ |
| Iron | 1 | 5000 | 1e6 |
| Aluminum | 1 | 1 | 3.5e7 |
| Copper | 1 | 1 | 5.8e7 |
| Carbon Fiber | 3 | 1 | 1e4 |
| Stainless Steel | 1 | 600 | 1e6 |
Figure 16.
Simulation results of different materials (full frequency range).
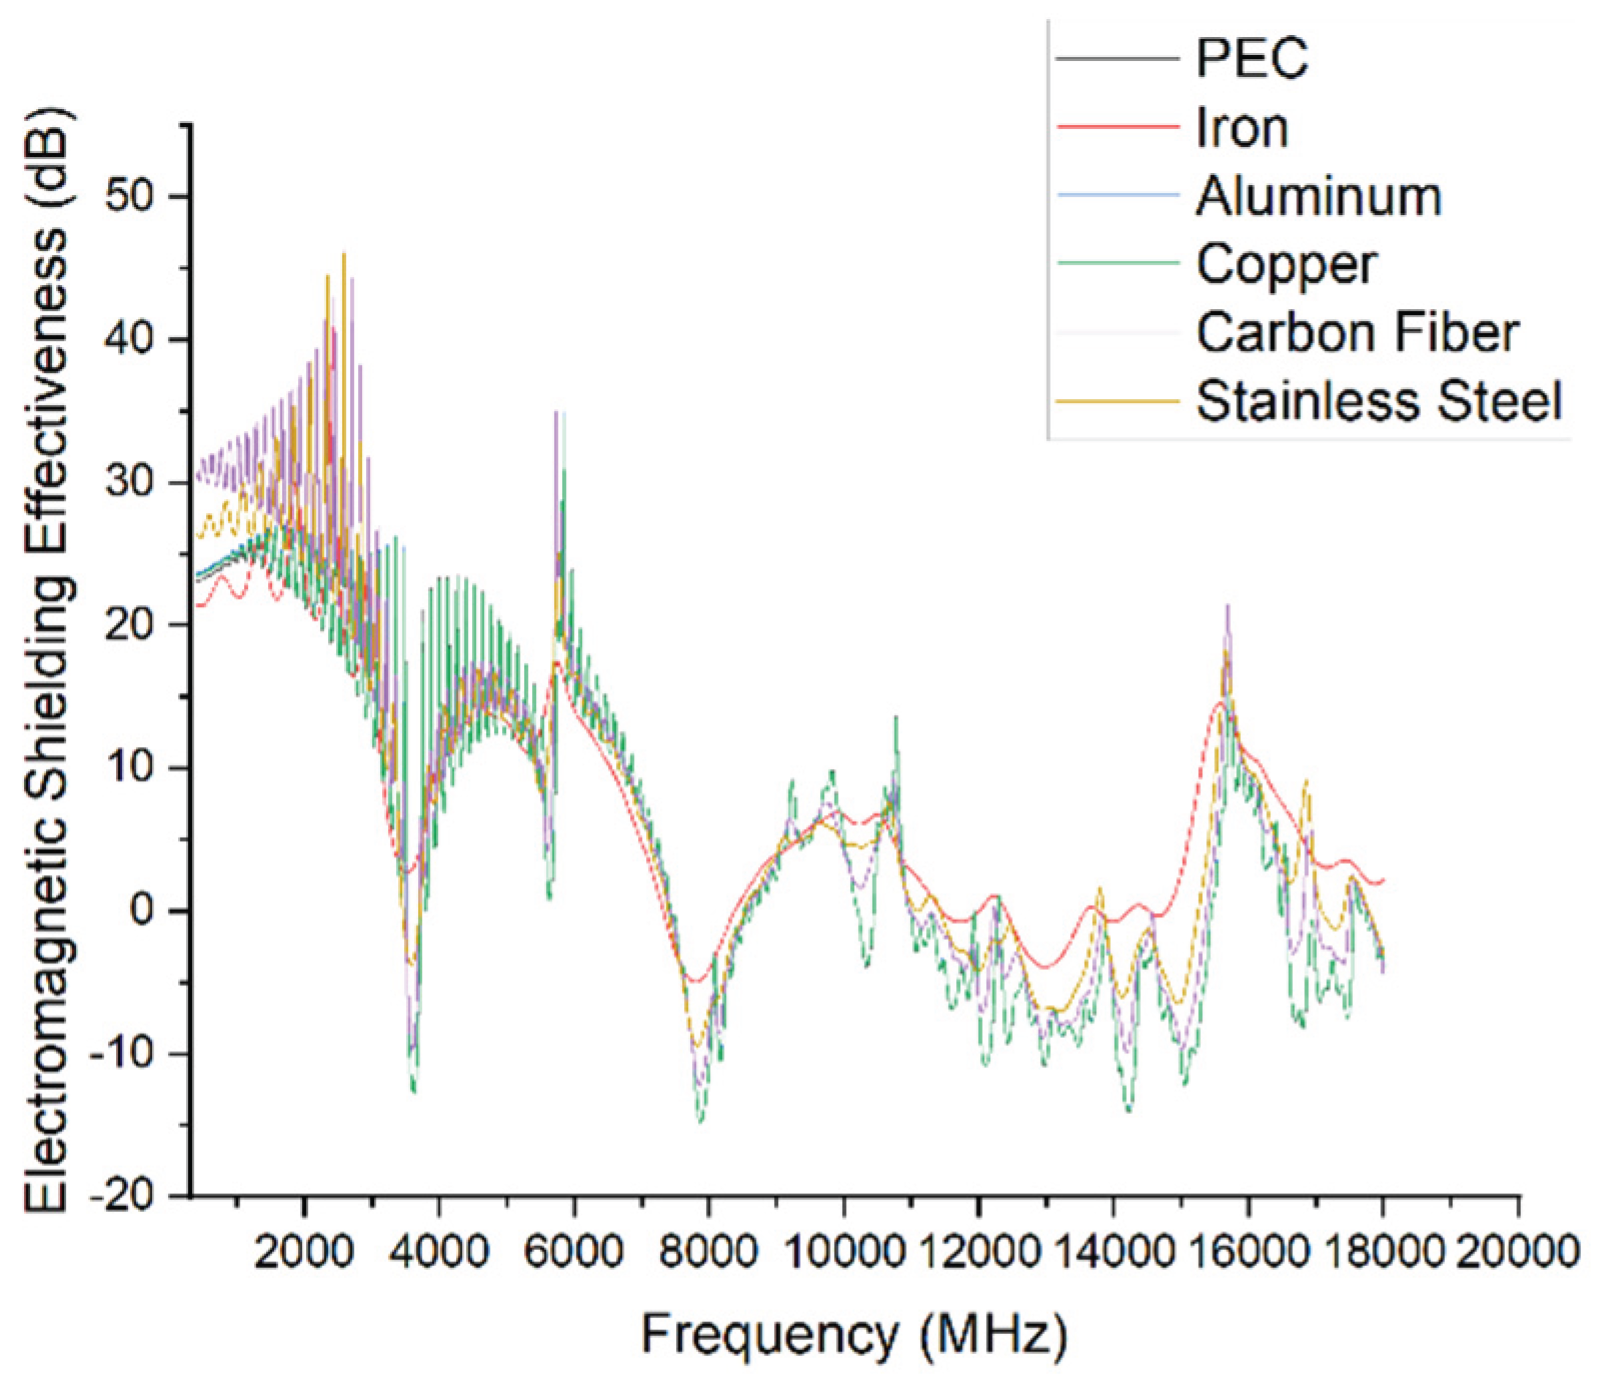
Figure 17.
Simulation results of different materials (low-frequency range).
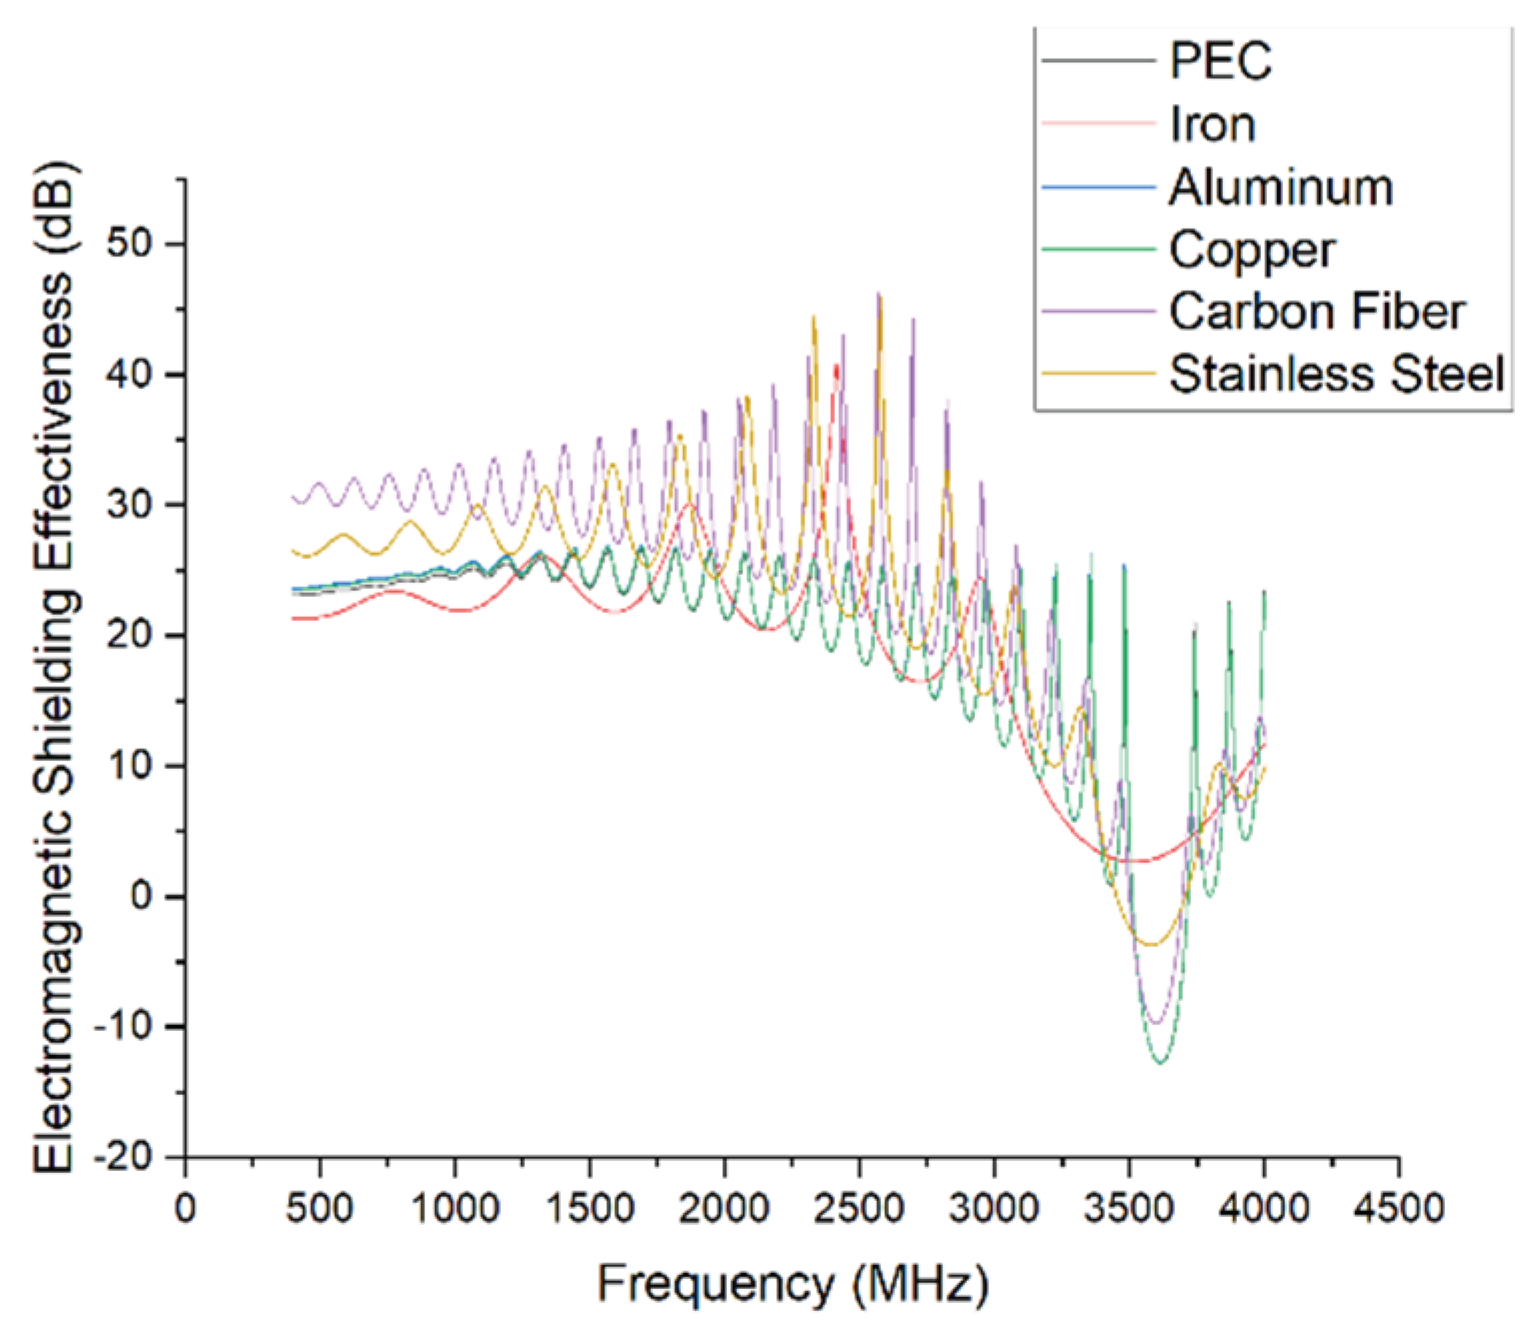
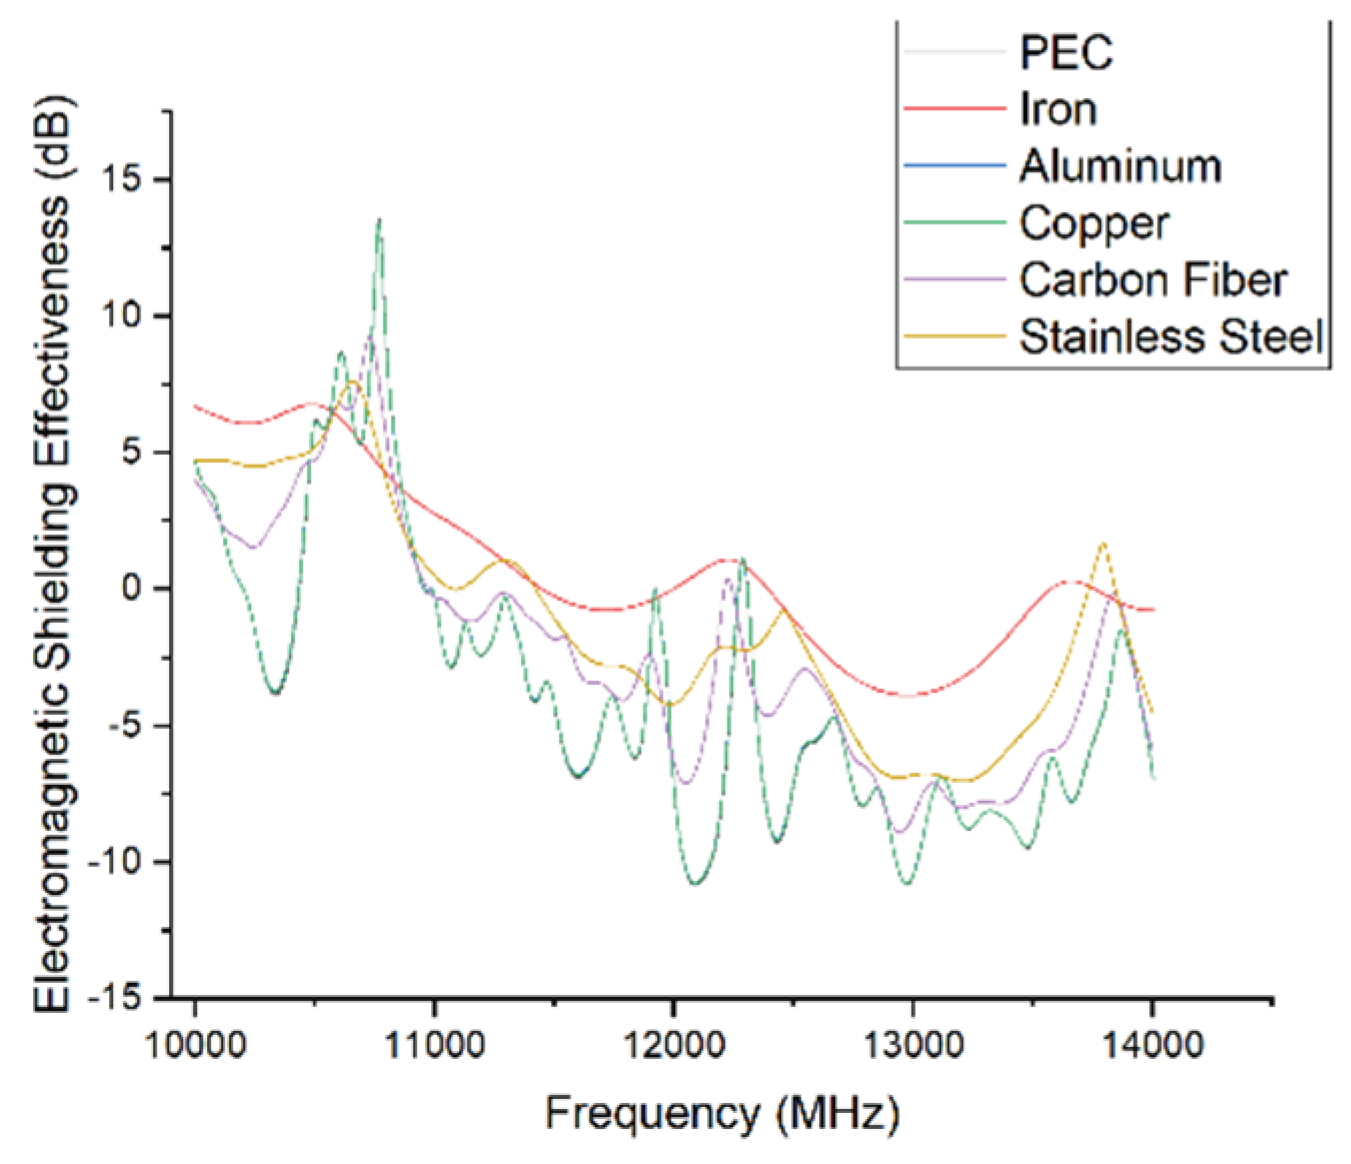
Figure 18.
Simulation results of different materials (high-frequency range).
The simulation results show that while the overall trend of shielding effectiveness is similar across different materials, the SE degradation during resonance and the degree of fluctuation vary significantly.
- Copper, aluminum, and the perfect electric conductor (PEC) exhibit very similar performance due to their high conductivity. Their SE curves largely overlap and show sharp dips near 3.6 GHz and 8 GHz, with minimum SE values dropping to approximately 15 dB, indicating severe resonance.
- Carbon fiber performs best in the low-frequency range (<3 GHz) but shows greater fluctuation overall. It displays slightly better SE than copper, aluminum, and PEC in resonance zones and in the high-frequency region (>10 GHz).
- Iron also exhibits resonances near 3.6 GHz and 8 GHz, but with less severe SE drops and smoother transitions, indicating greater stability. This stable performance extends into the high-frequency range as well
- Stainless steel performs slightly worse than carbon fiber below 3 GHz but lies between iron and other materials across most of the spectrum.
This performance difference is likely due to the presence of magnetic permeability in iron and stainless steel, especially the high permeability of iron, which enhances its ability to absorb the magnetic component of incident waves. This effect suppresses resonance and improves SE stability.
In conclusion, materials with higher magnetic permeability can effectively mitigate SE degradation caused by structural resonance and improve the system's resistance to electromagnetic disturbances. This may explain the relatively stable shielding behavior observed in iron.
4.6. Effect of Aperture Shape
The shape of an aperture directly influences the local electric field distribution and current concentration characteristics, thereby affecting electromagnetic wave coupling and overall shielding performance. In this section, the shielding effectiveness of circular and rectangular openings is compared under the condition of equal effective aperture area.
Figure 19.
Illustration of different aperture shapes:(a) Circular opening; (b) Rectangular opening.
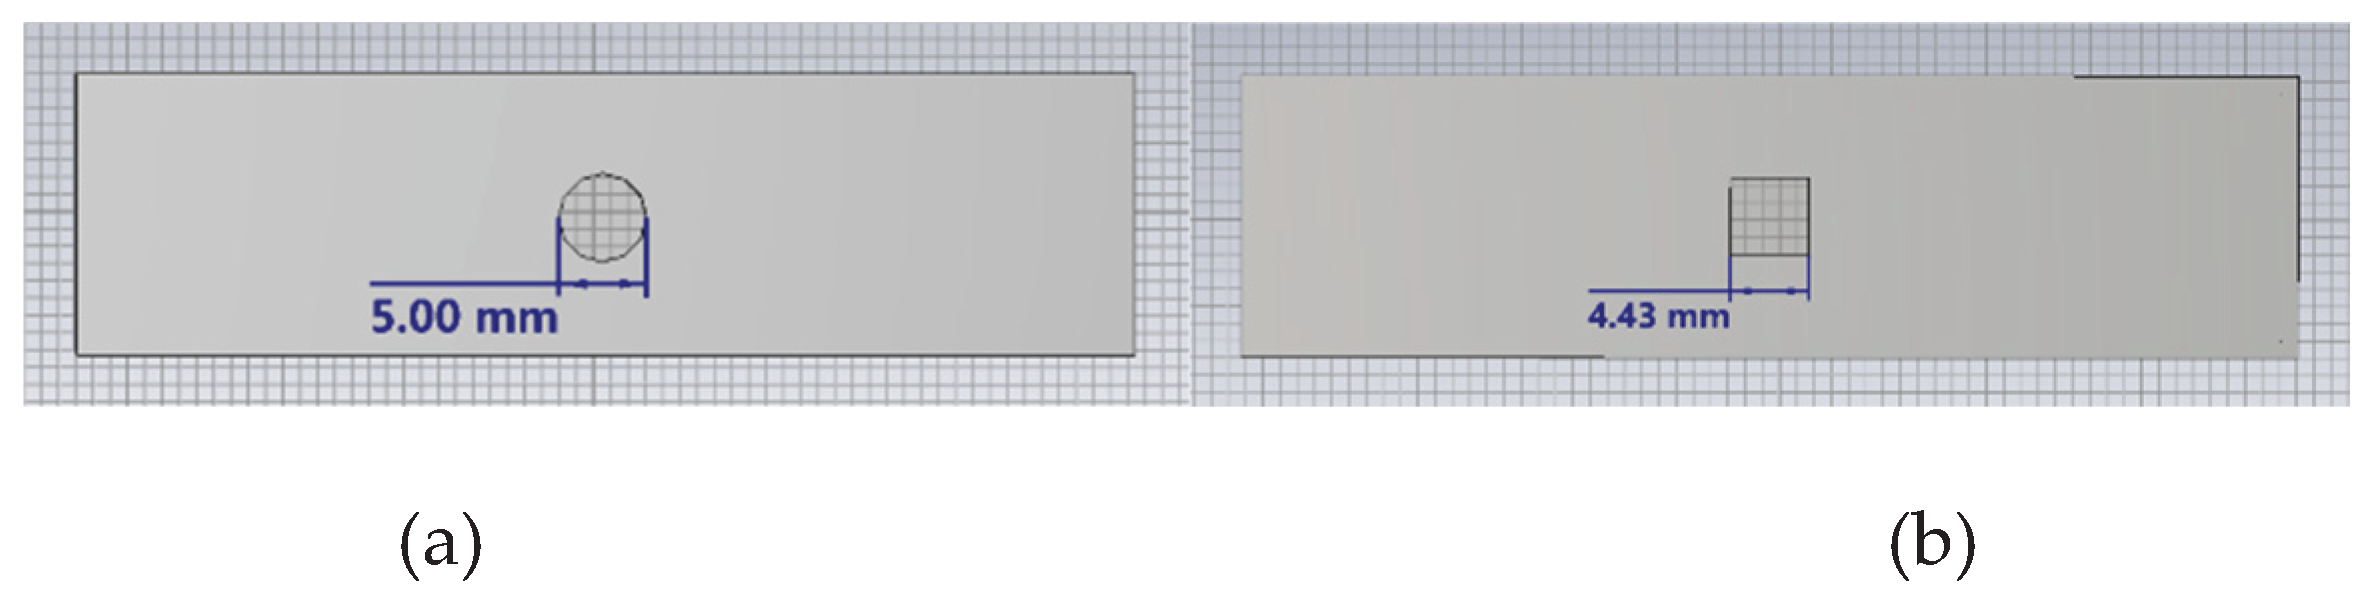
Figure 20.
Simulation results for different aperture shapes.
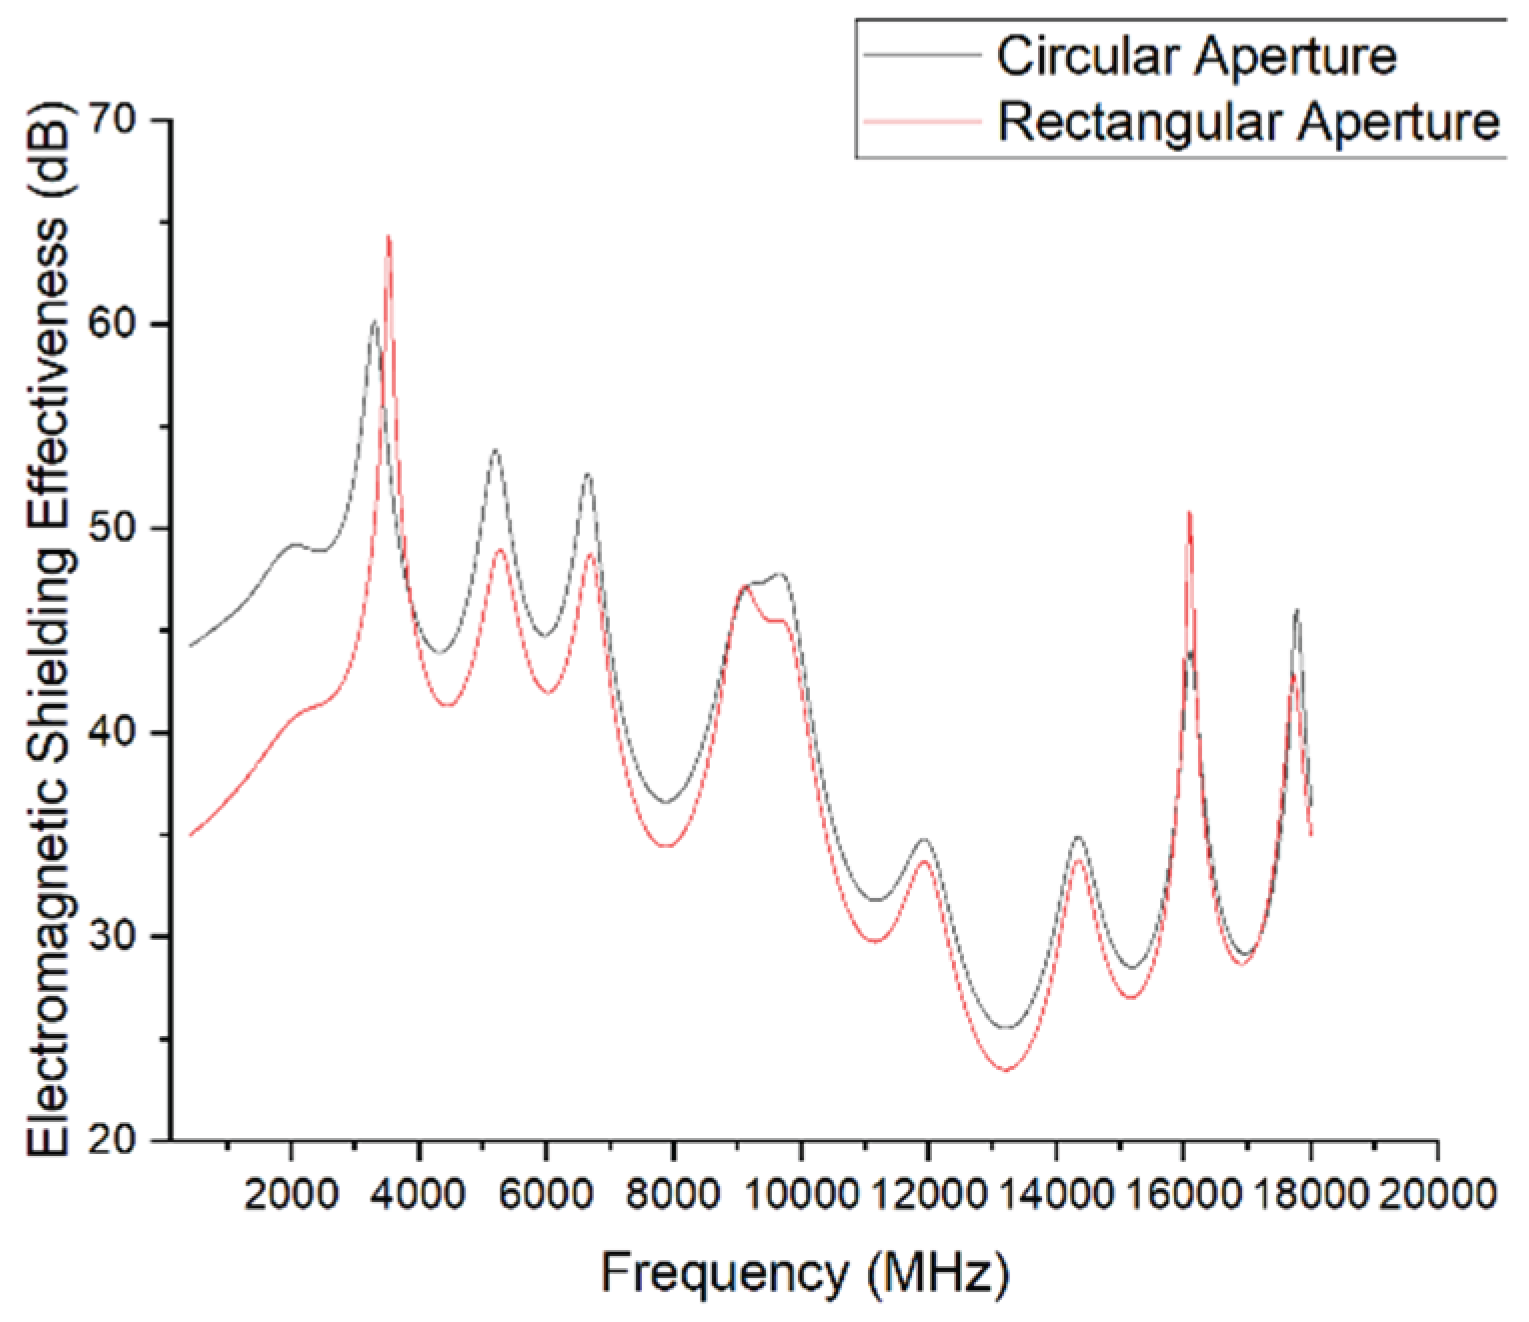
The simulation results show that even with identical aperture areas, the shape of the aperture has a significant effect on shielding effectiveness. The circular opening (diameter = 5 mm) demonstrates superior shielding performance across the entire frequency range compared to the rectangular opening (square, side length = 4.43 mm). This difference is particularly pronounced in the low-frequency range (2–6 GHz), where the maximum SE difference exceeds 10 dB.
As the frequency increases, the performance difference between the two shapes gradually decreases, and in the high-frequency range (16–20 GHz), the results tend to converge.
The underlying reason is that circular structures produce weaker edge field enhancement, and the diffraction path of electromagnetic waves is more evenly distributed, which helps mitigate gap coupling effects and improves shielding performance. In contrast, rectangular apertures feature sharp corners where electric fields are more likely to concentrate, leading to stronger coupling and resonance, and thus lower SE.
This demonstrates that even with identical aperture areas, the geometric edge characteristics and symmetry significantly affect the enclosure’s electromagnetic shielding behavior. Therefore, in structural design, circular or rounded aperture shapes should be prioritized to enhance electromagnetic compatibility.
4.7. Effect of Aperture Size
perture size is a critical factor that determines the local failure risk of a shielding structure. This section systematically analyzes the impact of aperture size on shielding performance and evaluates how it affects SE trends and failure mechanisms, particularly in resonance frequency bands.
Figure 21.
Illustration of different aperture sizes:(a) Rectangular opening, side length = 2 mm; (b) Rectangular opening, side length = 4.43 mm; (c) Rectangular opening, side length = 6 mm.
Figure 21.
Illustration of different aperture sizes:(a) Rectangular opening, side length = 2 mm; (b) Rectangular opening, side length = 4.43 mm; (c) Rectangular opening, side length = 6 mm.
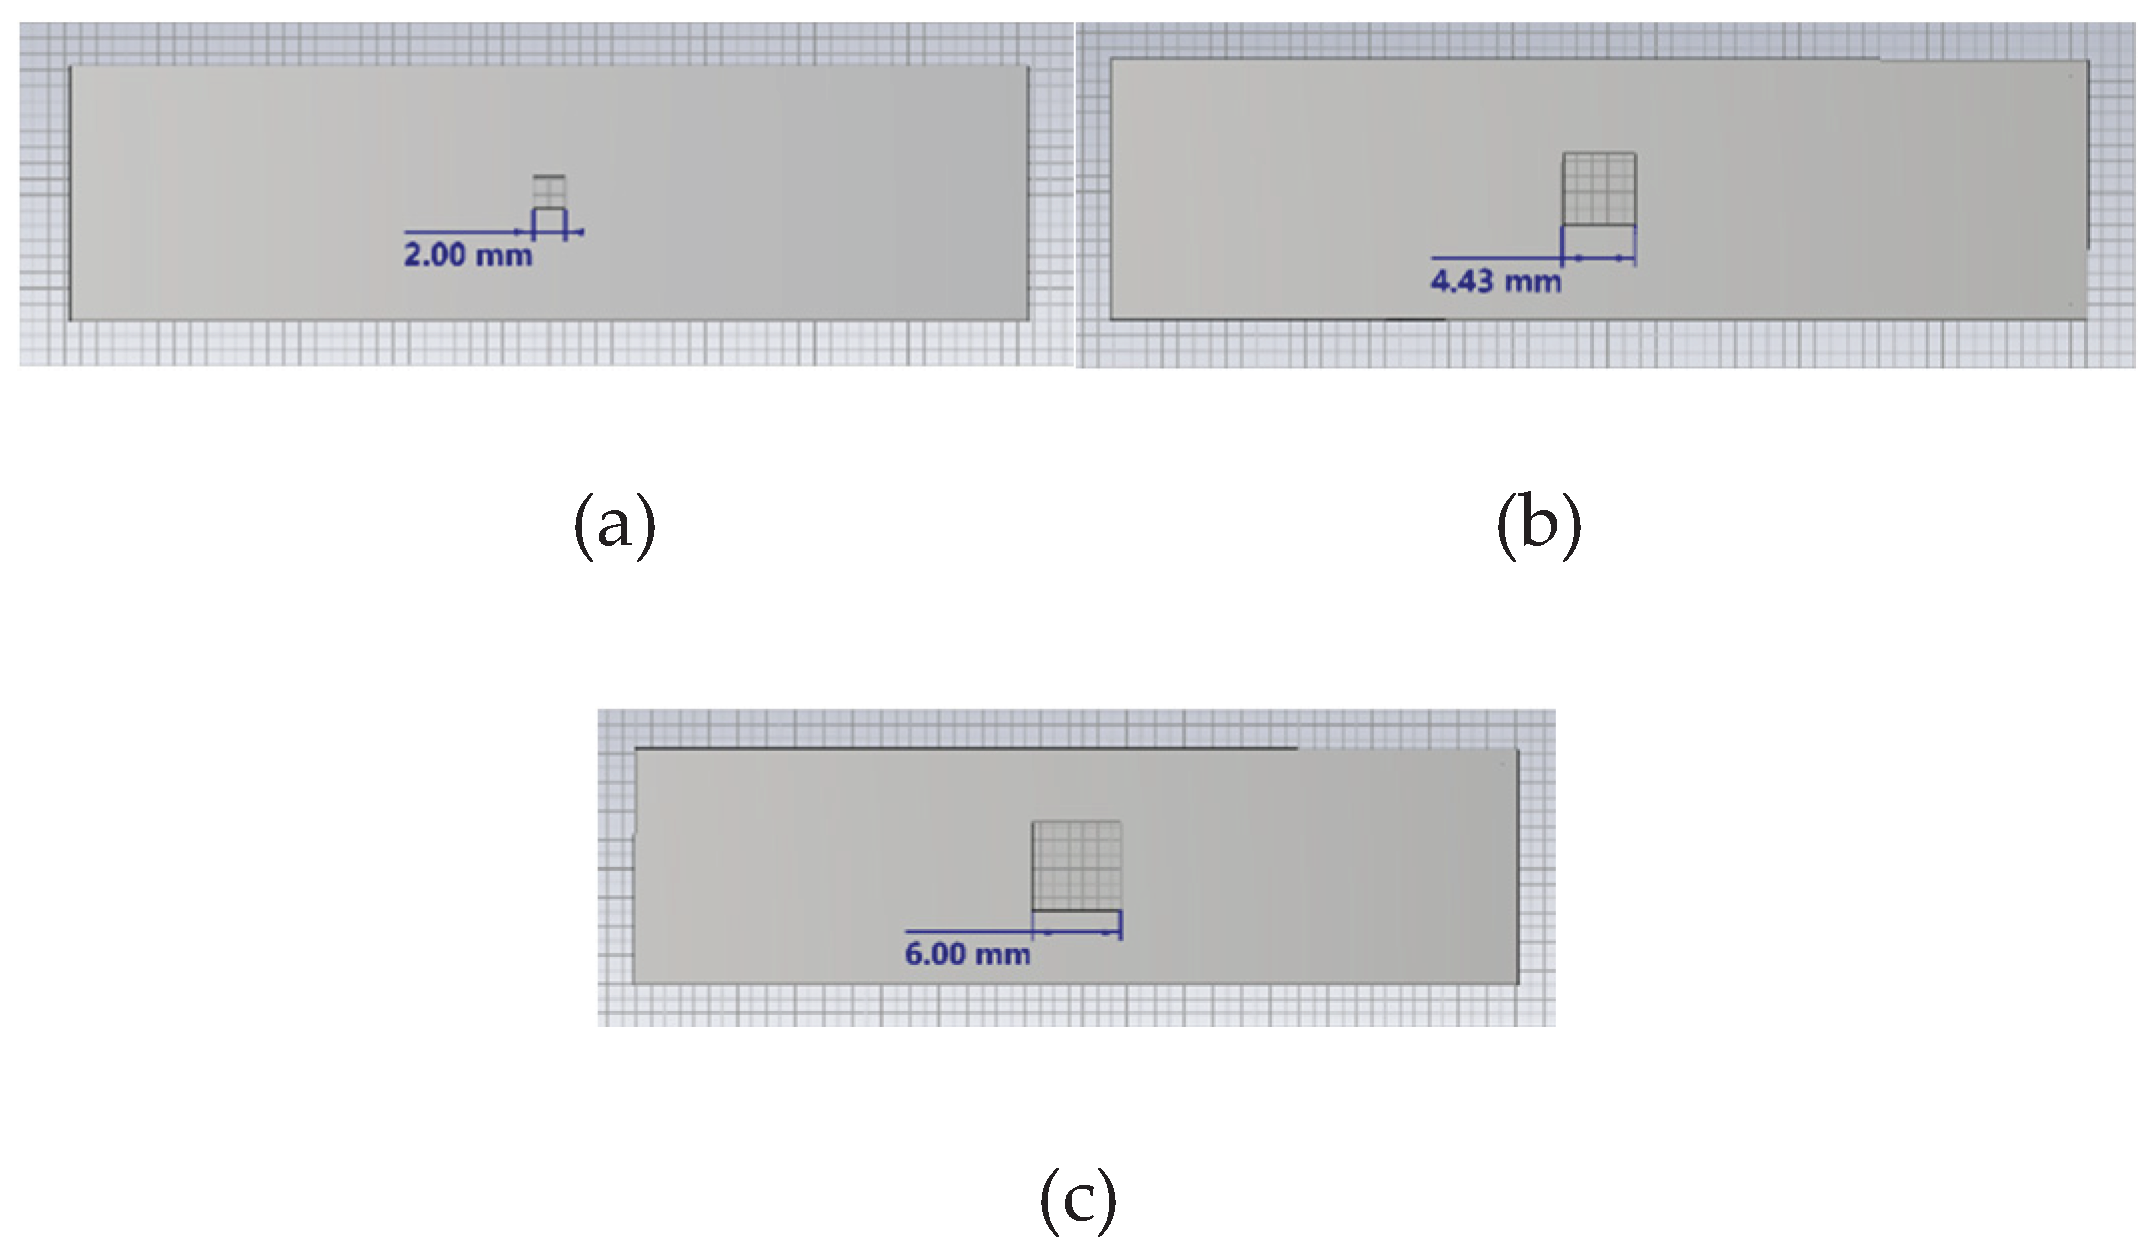
Figure 22.
Simulation results for different aperture sizes
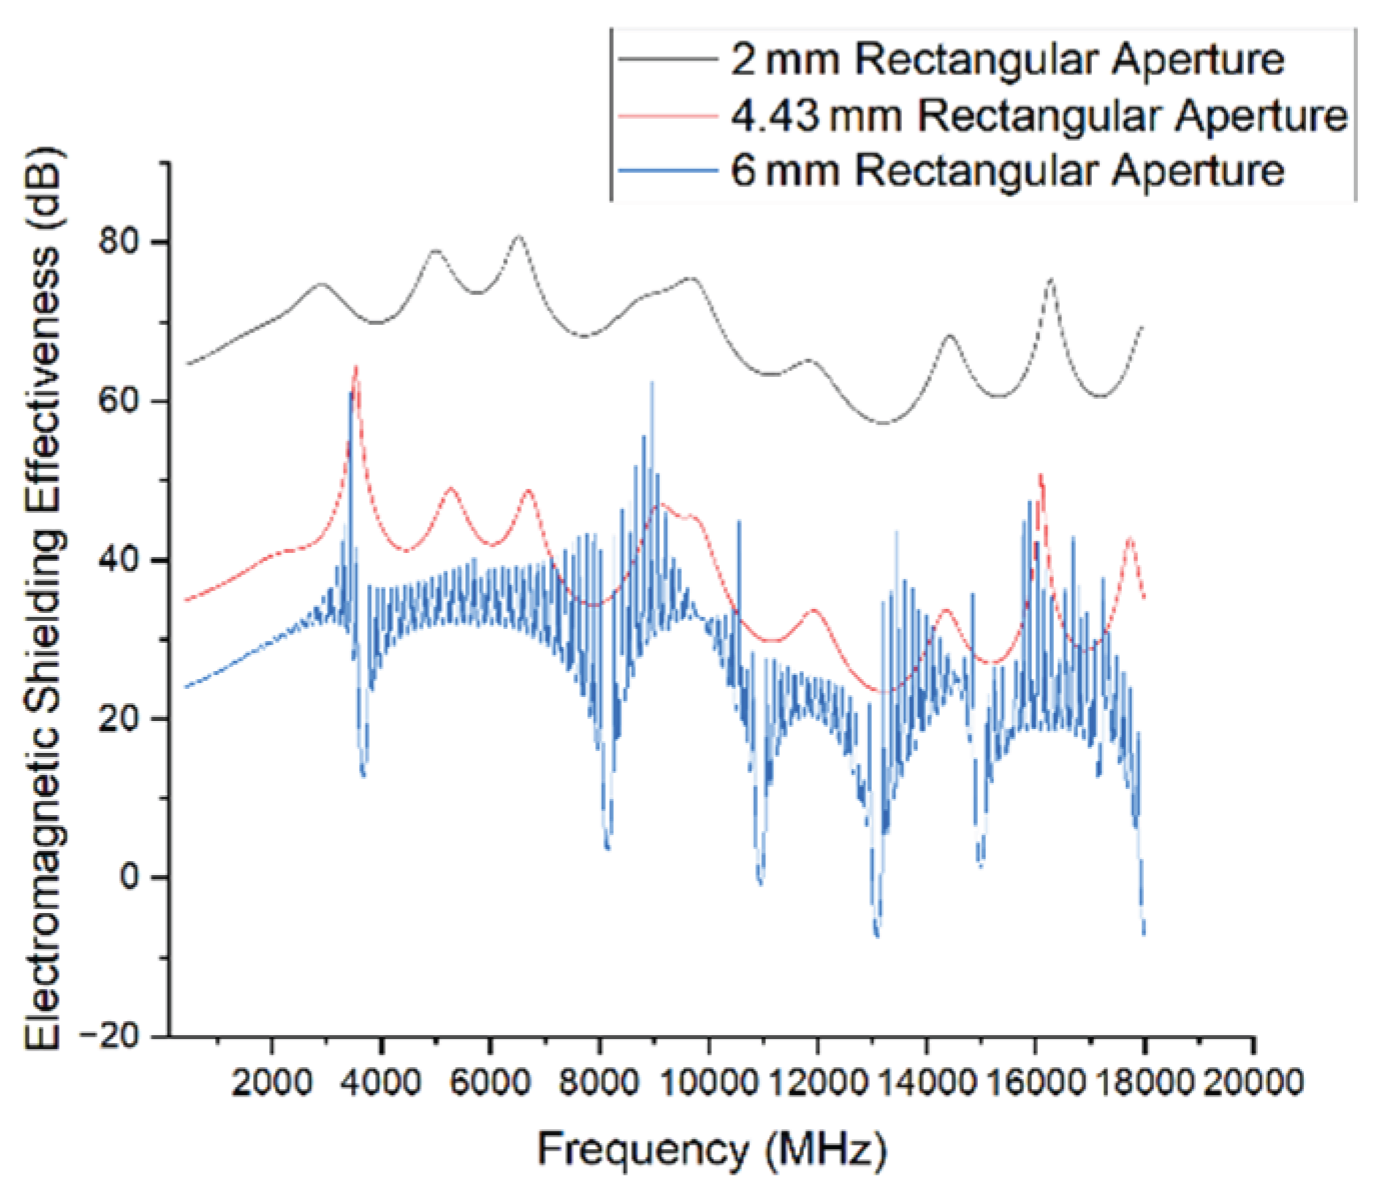
The simulation results clearly demonstrate that the size of the rectangular aperture has a significant influence on shielding effectiveness. As the side length increases, the shielding capability deteriorates notably.
- The 2 mm aperture exhibits excellent shielding performance across the entire frequency range, with SE consistently maintained between 60 and 75 dB, indicating strong electromagnetic protection.
- When the side length increases to 4.43 mm, the overall SE drops by approximately 20–30 dB, with localized dips observed at several frequencies.
- Further increasing the side length to 6 mm results in severe SE fluctuations, with the minimum dropping to around –10 dB and multiple strong resonances appearing.
This sharp degradation in performance is closely related to enhanced coupling effects caused by larger apertures. Larger openings are more susceptible to resonance excitation, allowing electromagnetic waves to penetrate more efficiently and thereby severely compromising the shielding integrity of the enclosure.
Therefore, in equipment structural design, large apertures should be avoided, especially in systems sensitive to mid- and high-frequency interference. Controlling aperture size is a key factor in maintaining stable shielding performance.
4.8. Effect of Aperture Quantity
When the total aperture area remains constant, the number of apertures and their spatial distribution affect the formation of electromagnetic leakage paths in different ways. This section compares concentrated versus distributed multi-aperture configurations to assess their influence on shielding effectiveness across a range of frequencies.
Figure 23.
Illustration of different aperture quantity configurations:(a) One rectangular aperture with side length = 6 mm; (b) Four rectangular apertures with side length = 3 mm each.
Figure 23.
Illustration of different aperture quantity configurations:(a) One rectangular aperture with side length = 6 mm; (b) Four rectangular apertures with side length = 3 mm each.
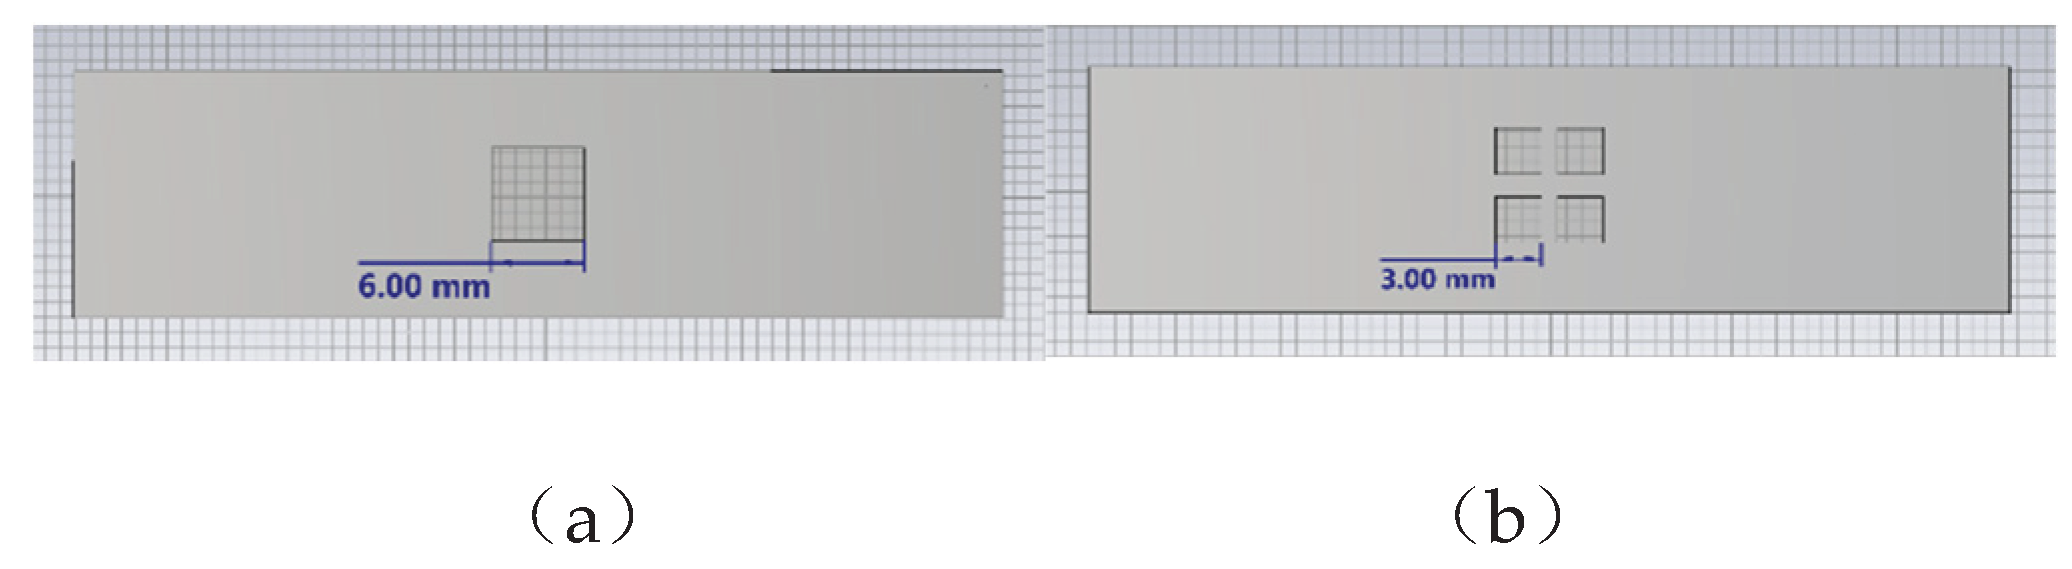
Figure 24.
Simulation results for different aperture quantities.
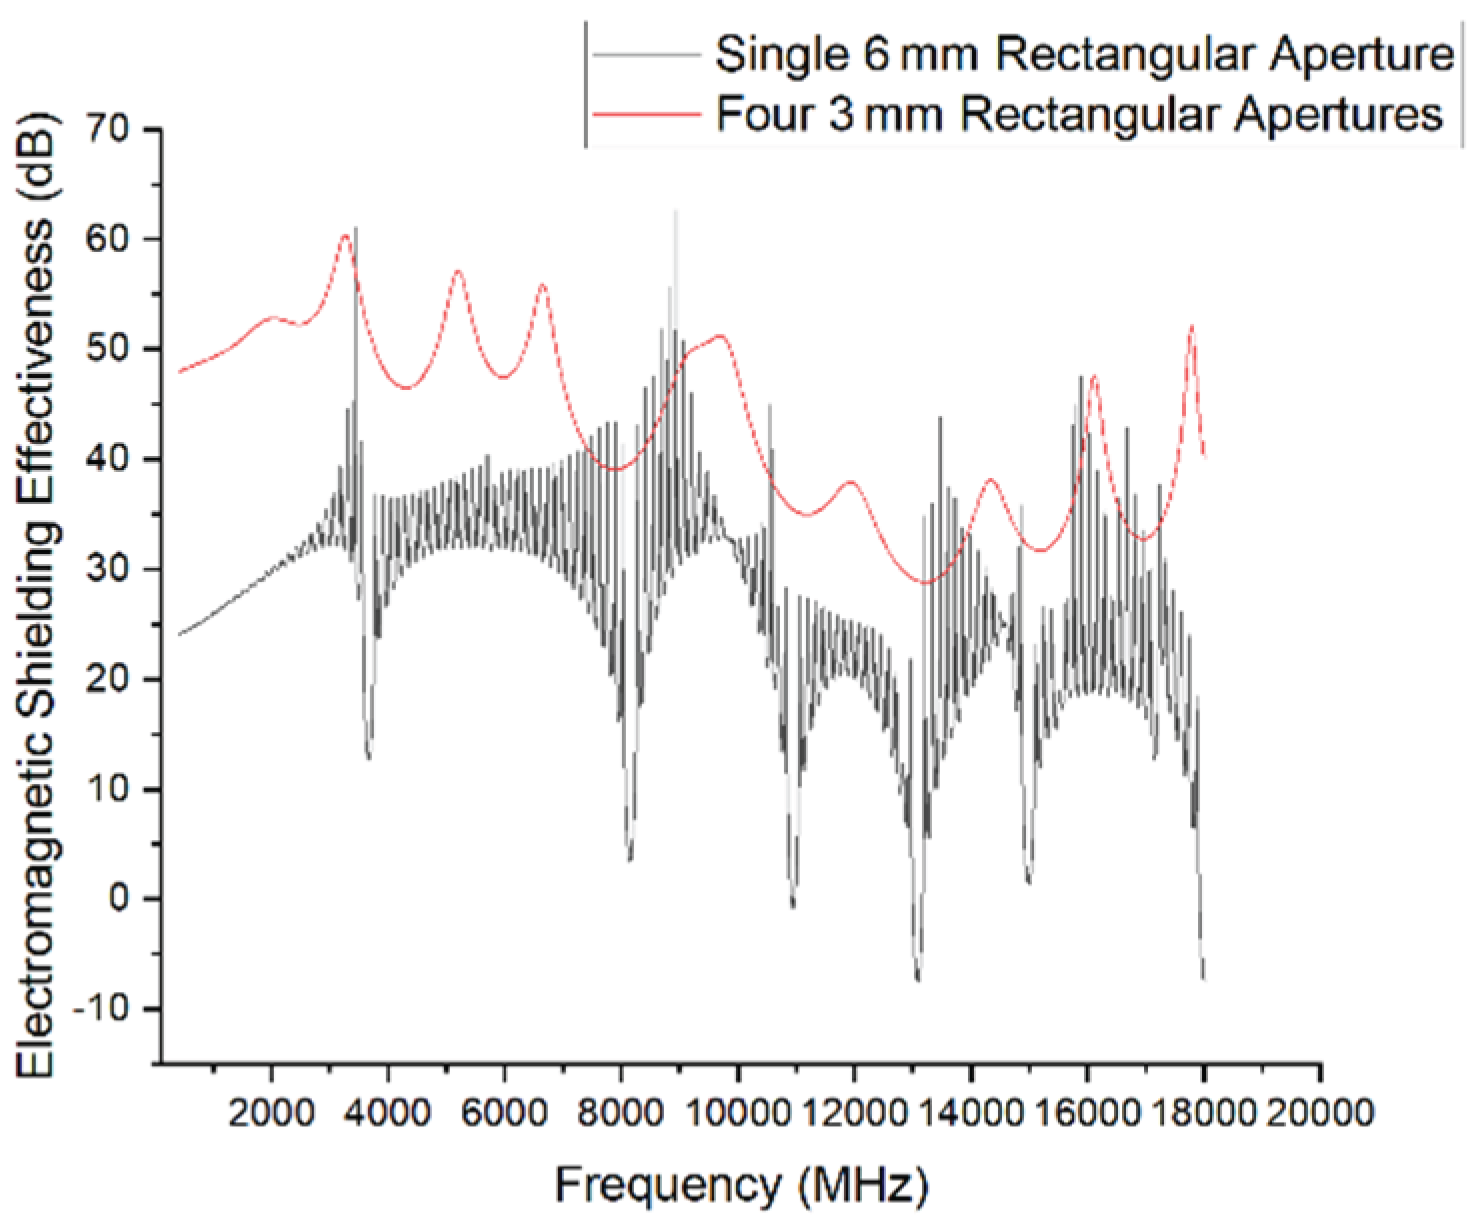
The simulation results clearly demonstrate that even under the same total aperture area, aperture quantity has a significant impact on shielding effectiveness. Compared to a single large rectangular opening (6 mm side length), the configuration with four smaller apertures (each 3 mm in side length) exhibits better overall shielding performance across the entire frequency range.
The single large aperture model shows severe resonances at multiple frequencies, where SE values drop dramatically, with minimum levels approaching –10 dB, indicating a substantial loss of shielding capability. In contrast, the four-aperture configuration maintains a higher and more stable SE, with no clear signs of resonant failure in the spectrum.
This result indicates that higher aperture concentration increases the likelihood of strong coupling effects and resonance, which in turn leads to enhanced electromagnetic leakage. In contrast, distributing the same total aperture area helps reduce the intensity of local resonances and improves the enclosure’s overall ability to suppress incident electromagnetic waves.
4.9. Effect of Aperture Spacing
This section investigates the impact of aperture spacing on shielding effectiveness while keeping the number, shape, and total area of the apertures constant.
Figure 25.
Illustration of different aperture spacing: (a) Closely spaced apertures; (b) Widely spaced apertures.
Figure 25.
Illustration of different aperture spacing: (a) Closely spaced apertures; (b) Widely spaced apertures.
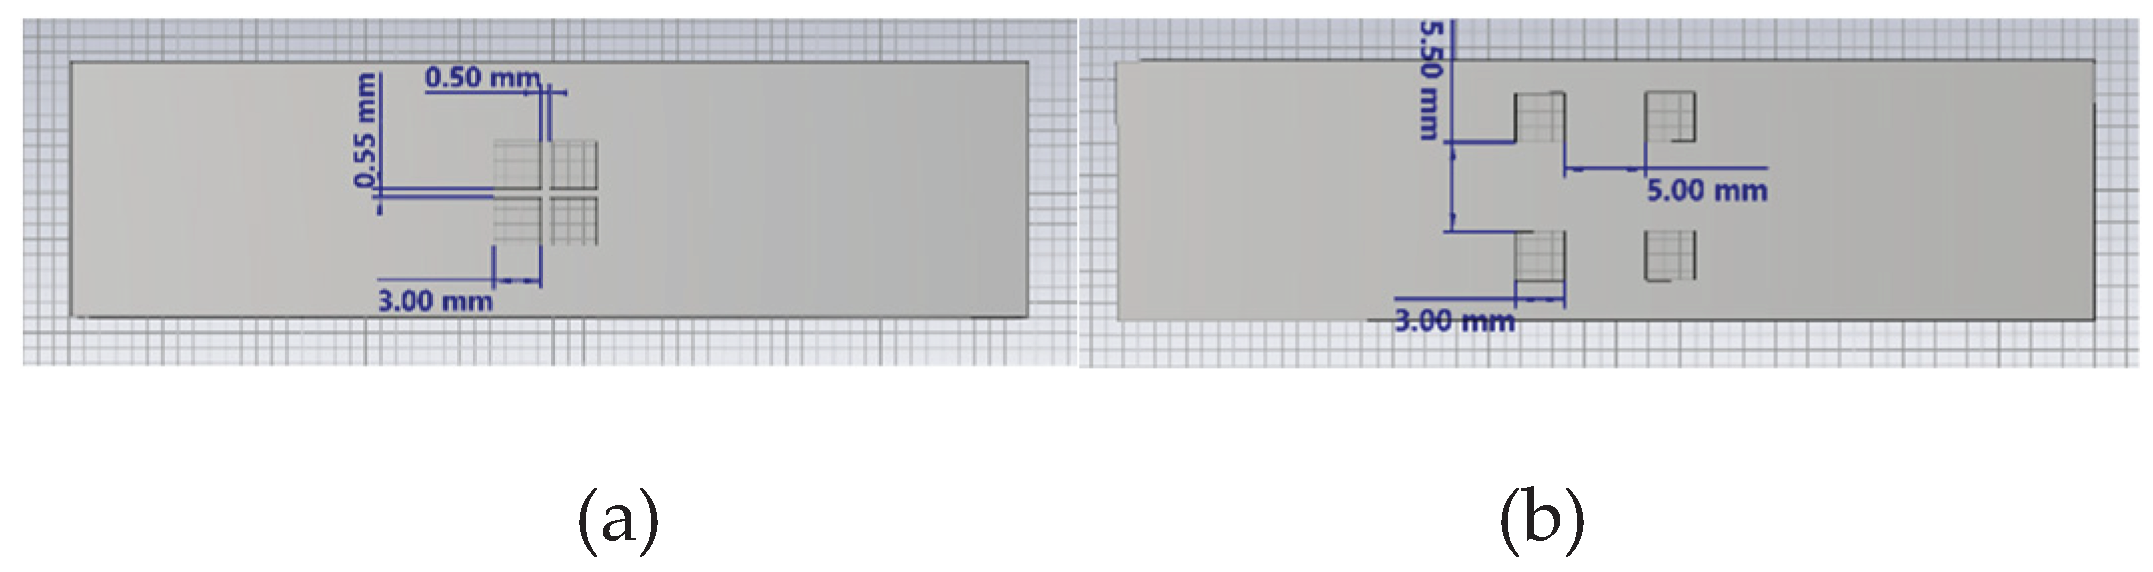
Figure 26.
Simulation results for different aperture spacing.
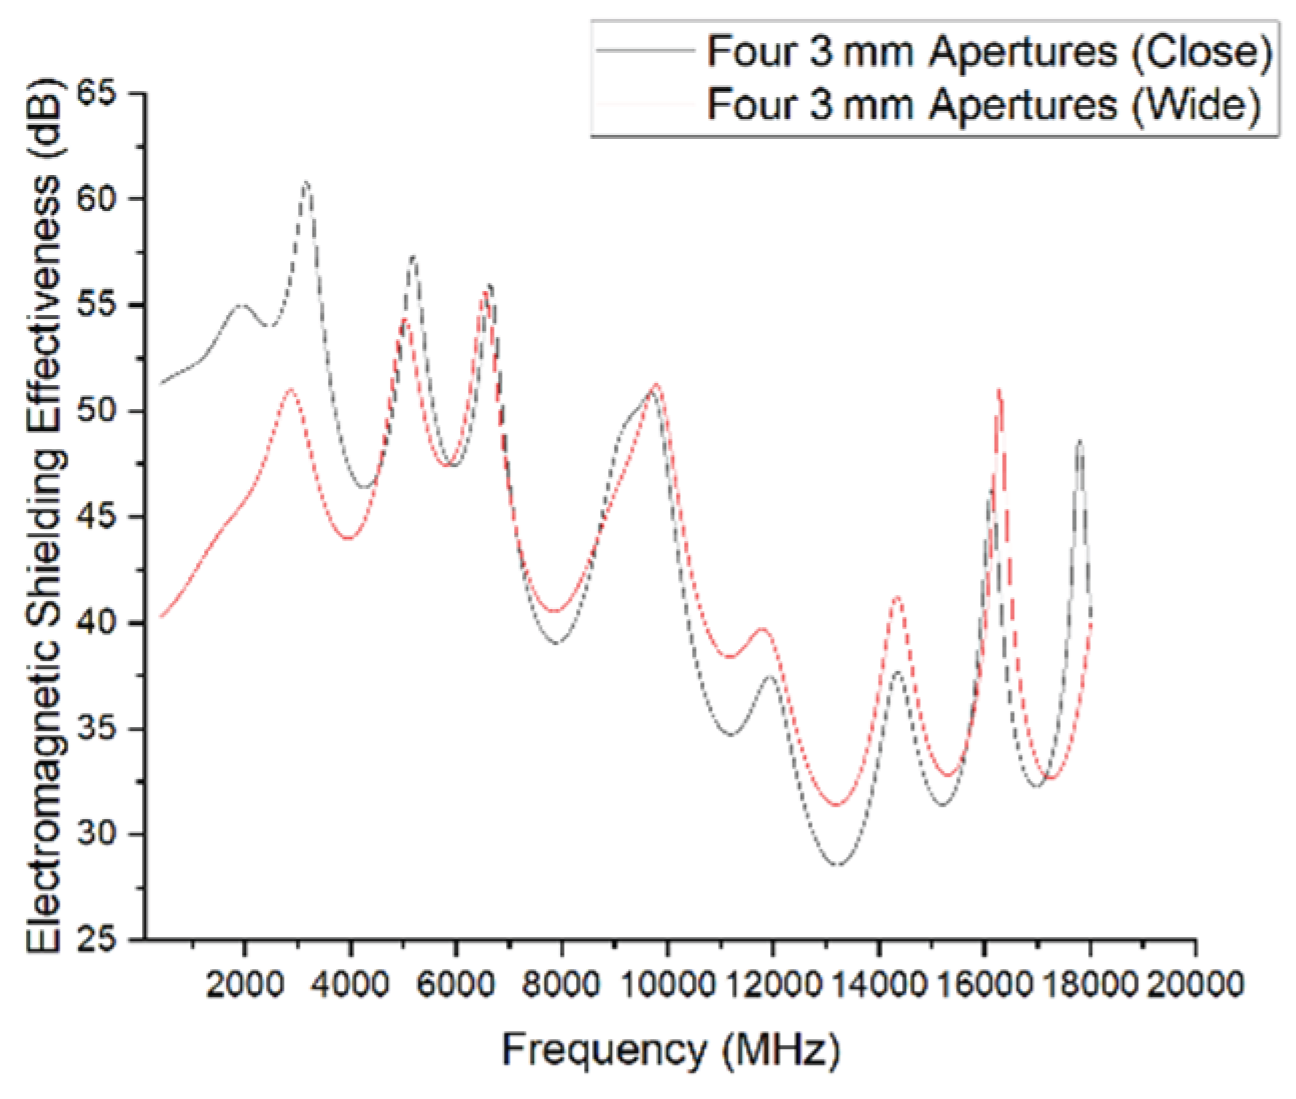
The simulation results indicate that aperture spacing significantly influences shielding performance, with varying effects across different frequency bands:
- In the low-frequency range (below 8 GHz), configurations with closely spaced apertures exhibit better shielding effectiveness than those with wider spacing. The maximum SE difference exceeds 10 dB.
- In the mid- to high-frequency range (8–16 GHz), the configuration with wider aperture spacing performs better at several frequency points, suggesting improved suppression of localized resonances.
- At very high frequencies (e.g., around 16 GHz), the shielding effectiveness of both configurations begins to converge, and the influence of spacing becomes less pronounced.
These findings suggest that closer spacing may suppress low-frequency leakage, possibly by limiting long-wavelength resonance paths. Conversely, increased spacing helps reduce mutual coupling between apertures at higher frequencies, thereby enhancing performance in the mid-to-high frequency bands. However, at very high frequencies, the wavelength is short enough that spacing effects diminish.
5. Experimental Validation in a Microwave Anechoic Chamber
To verify whether the simulation results align with real-world performance and to evaluate the GNSS receiver's immunity under actual HIRF conditions, a radiated immunity test was conducted in a microwave anechoic chamber.
5.1. Experimental Procedure
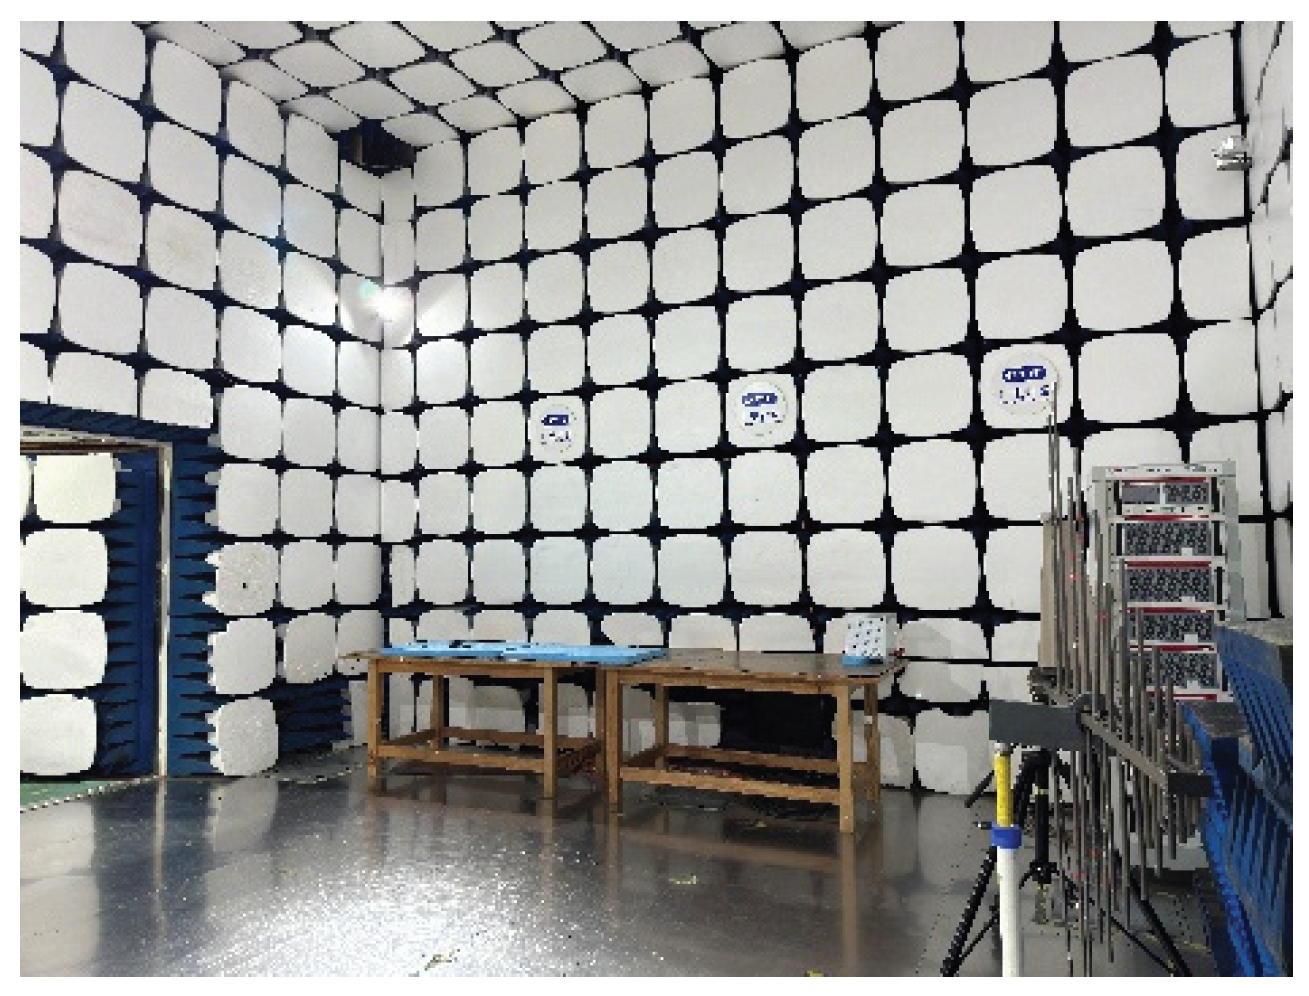
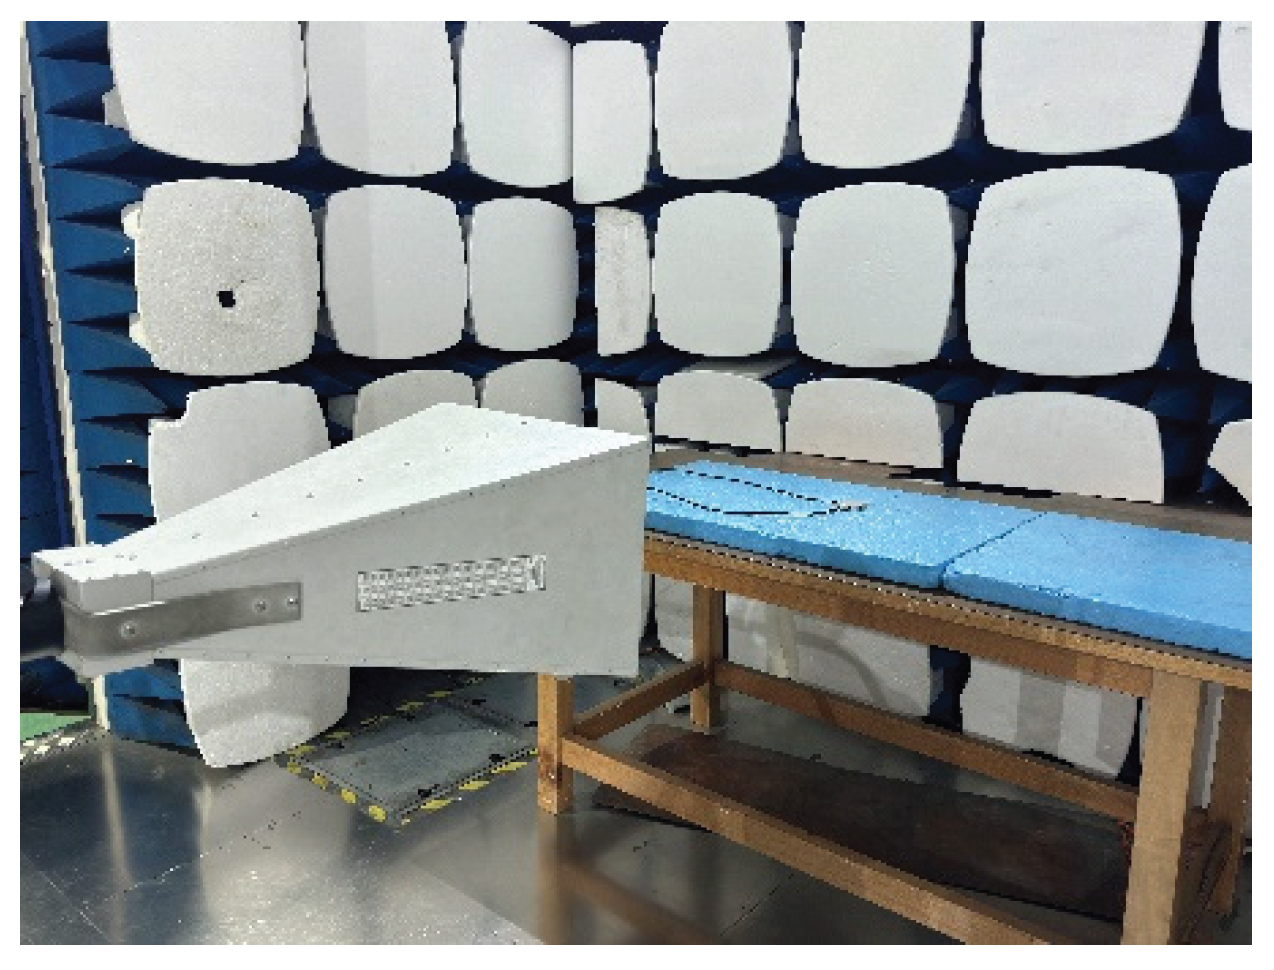
In radiated immunity testing, an anechoic chamber provides a stable and controlled electromagnetic environment for airborne electronic equipment, simulating the electromagnetic exposure conditions experienced by aircraft in HIRF scenarios. The chamber used in this study measures 10 m × 8 m × 6.4 m.
Figure 27.
Test environment for radiated immunity in the anechoic chamber.
In the field of electromagnetic compatibility (EMC), immunity testing is commonly used to assess the behavior of electronic equipment under the influence of external electromagnetic fields. Immunity refers to the ability of a device to maintain normal operation in the presence of electromagnetic interference (EMI). In this study, a continuous wave (CW) signal was used to conduct the radiated immunity test, assessing the GNSS receiver's stability under a steady-state HIRF environment.The specific experimental steps are as follows:
- Pre-test verification.
Before the test, the GNSS receiver was confirmed to operate normally in a non-interference environment.
- 2.
- Equipment setup.
The GNSS receiver was mounted on a test fixture inside the chamber and connected to a computer-based monitoring system to ensure stable data acquisition.
- 3.
- Field strength definition and generation.
To evaluate the receiver's performance under high HIRF levels, the test adopted the field strength standards listed below, aiming to replicate the challenges encountered by avionics in extreme electromagnetic environments.
Table 2.
Radiated immunity test field strength
| Test Frequency Range (GHz) | CW Field Strength (V/m) |
|---|---|
| 0.1-0.2 | 100 |
| 0.2-0.4 | 100 |
| 0.4-0.7 | 50 |
| 0.7-1 | 100 |
| 1-2 | 200 |
| 2-4 | 200 |
| 4-6 | 200 |
| 6-8 | 200 |
| 8-12 | 300 |
| 12-18 | 200 |
Figure 28.
Antenna illumination setup.
A sweep test was performed across each decade band with 100 frequency points, during which the receiver’s operating status was continuously monitored to evaluate its immunity under increasing field strengths.
- 4.
- GNSS receiver status monitoring.
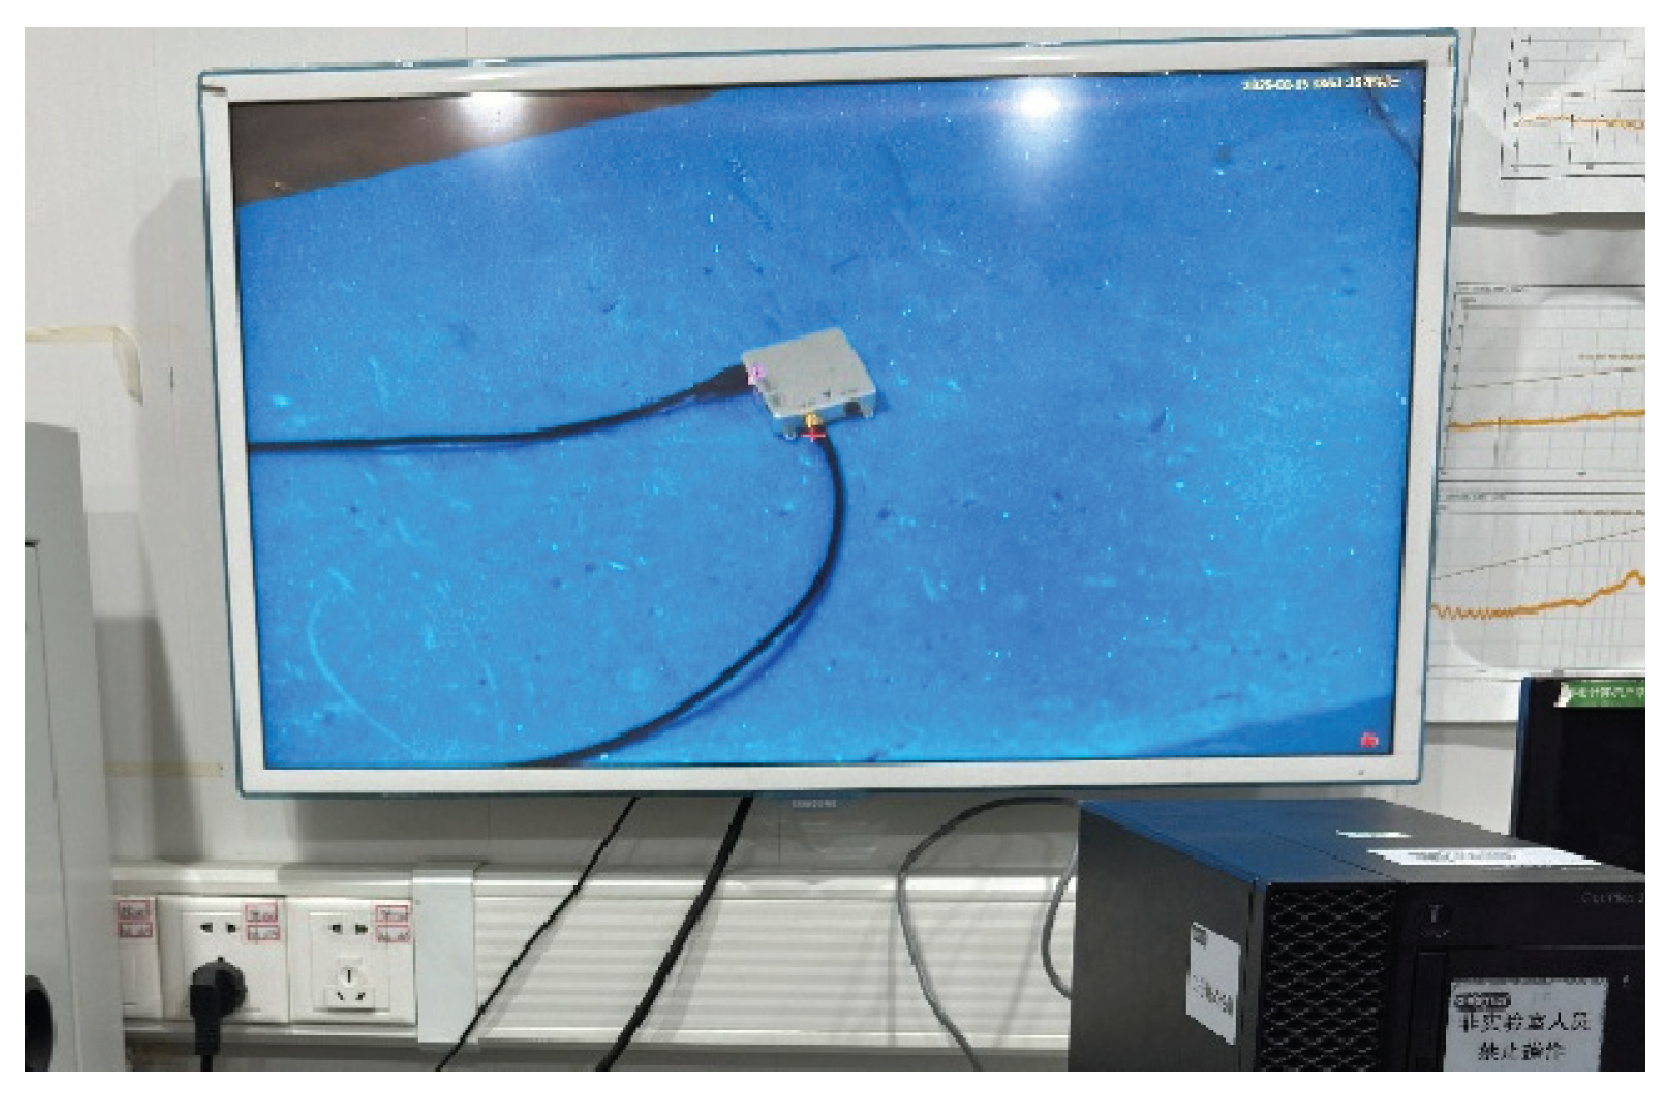
During the test, the GNSS receiver’s status indicators were observed using a camera system (see Figure 29) to detect any shutdown or reboot events. Simultaneously, the receiver's solution parameters—including latitude, longitude, altitude, speed, and DOP—were monitored via computer software to detect signal loss or degraded accuracy.
Figure 29.
Camera monitoring interface.
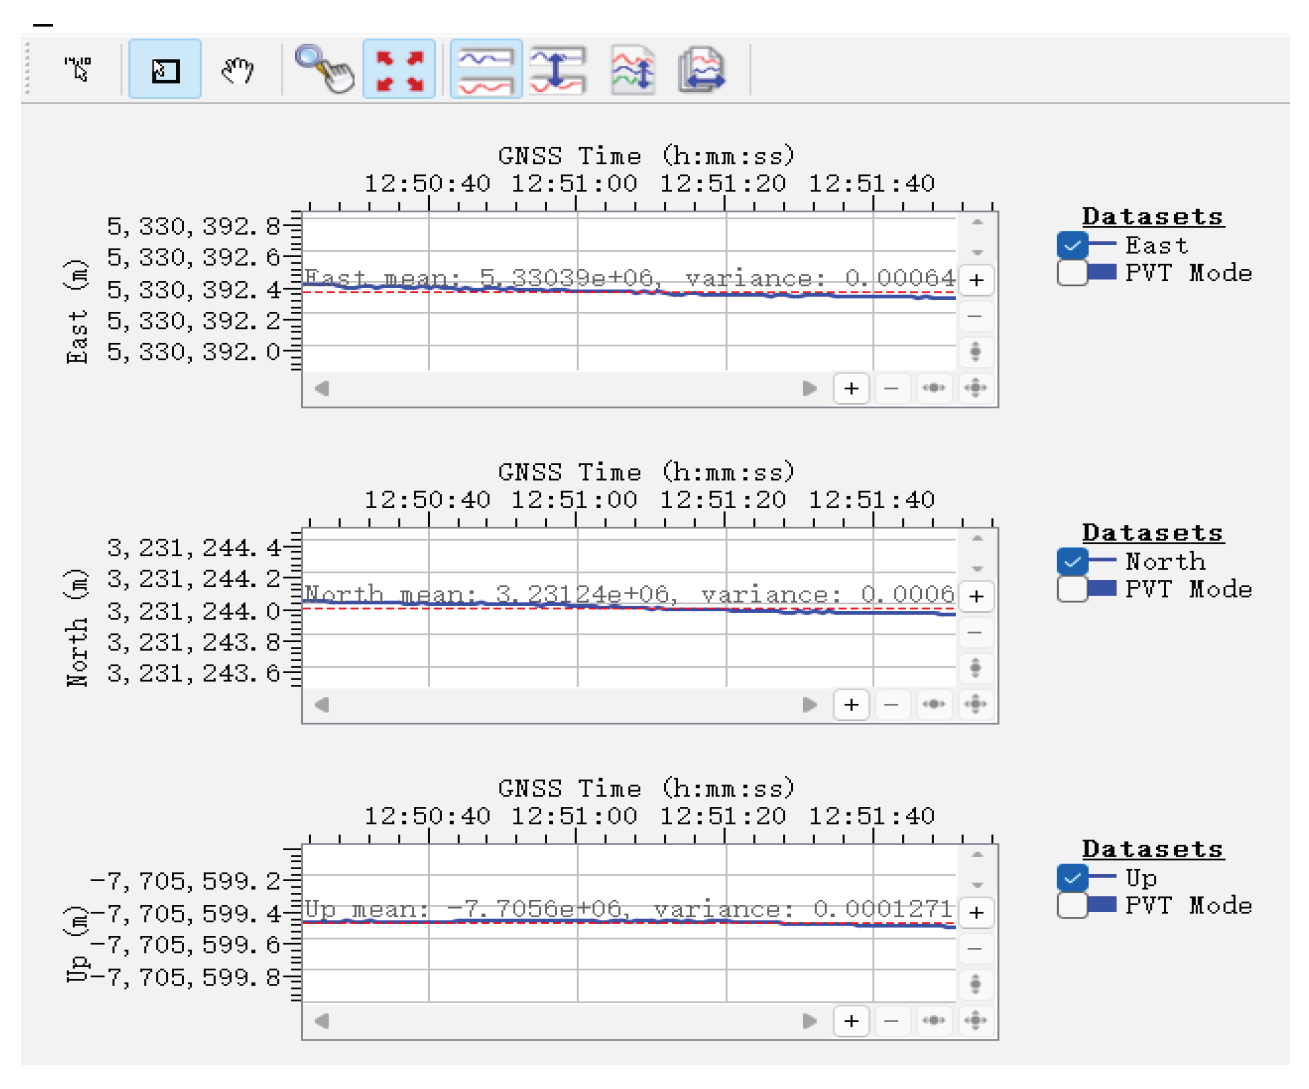
In the monitoring interface, the relative position is expressed using the East-North-Up (ENU) coordinate system, which represents the receiver’s deviation from a reference point in three orthogonal directions.
Figure 30.
ENU position monitoring under normal conditions.
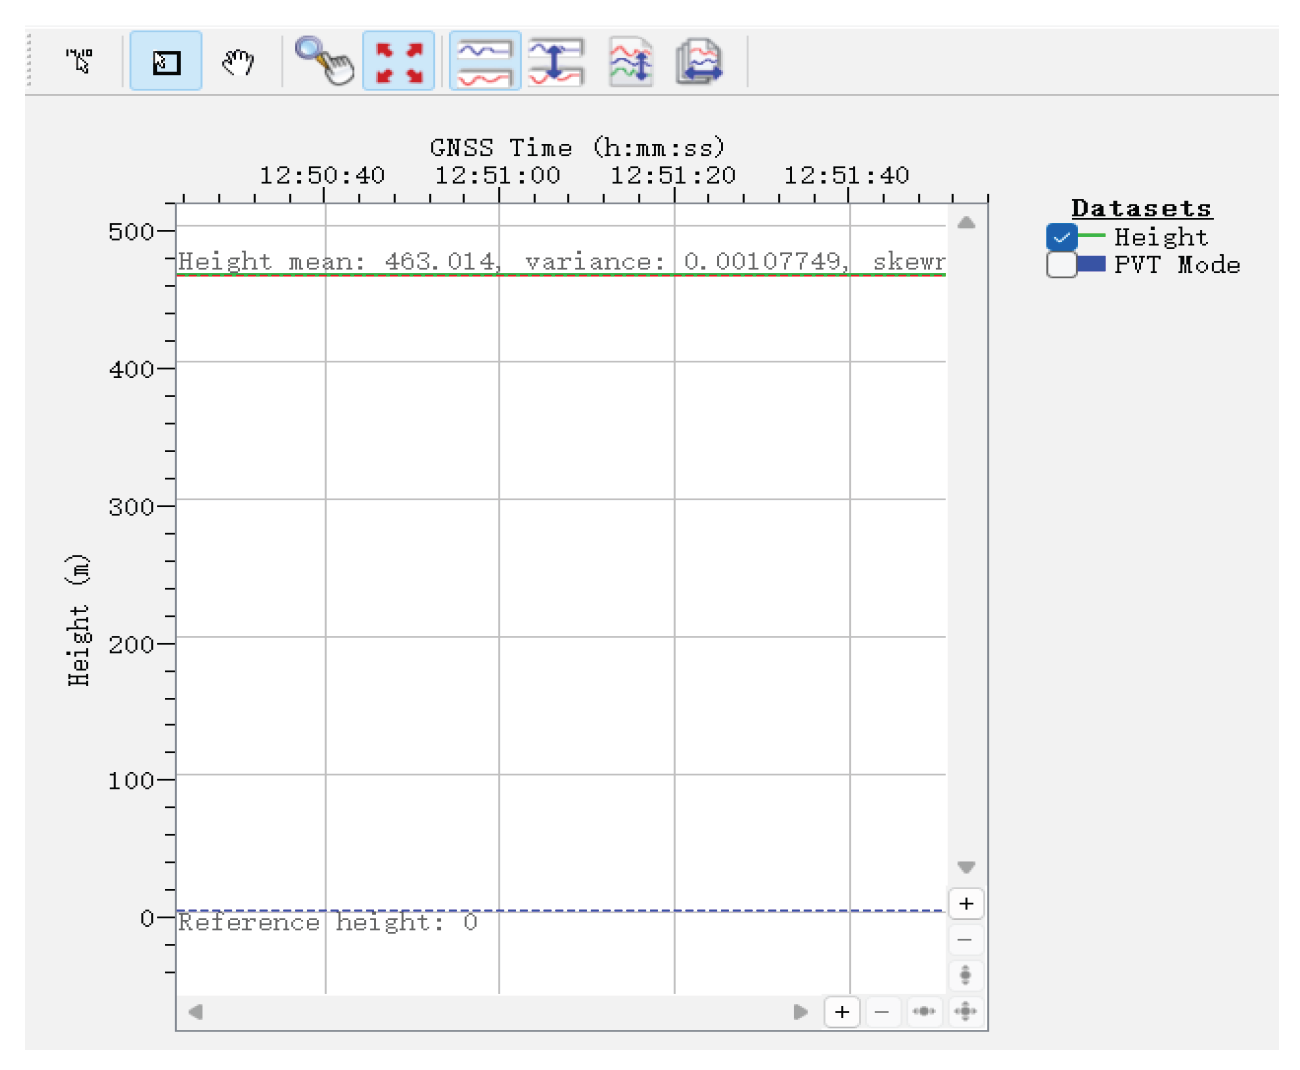
Ellipsoidal height refers to the altitude above the WGS-84 reference ellipsoid, a key parameter in GNSS positioning used for navigation and mapping.
Figure 31.
Ellipsoidal height under normal conditions.
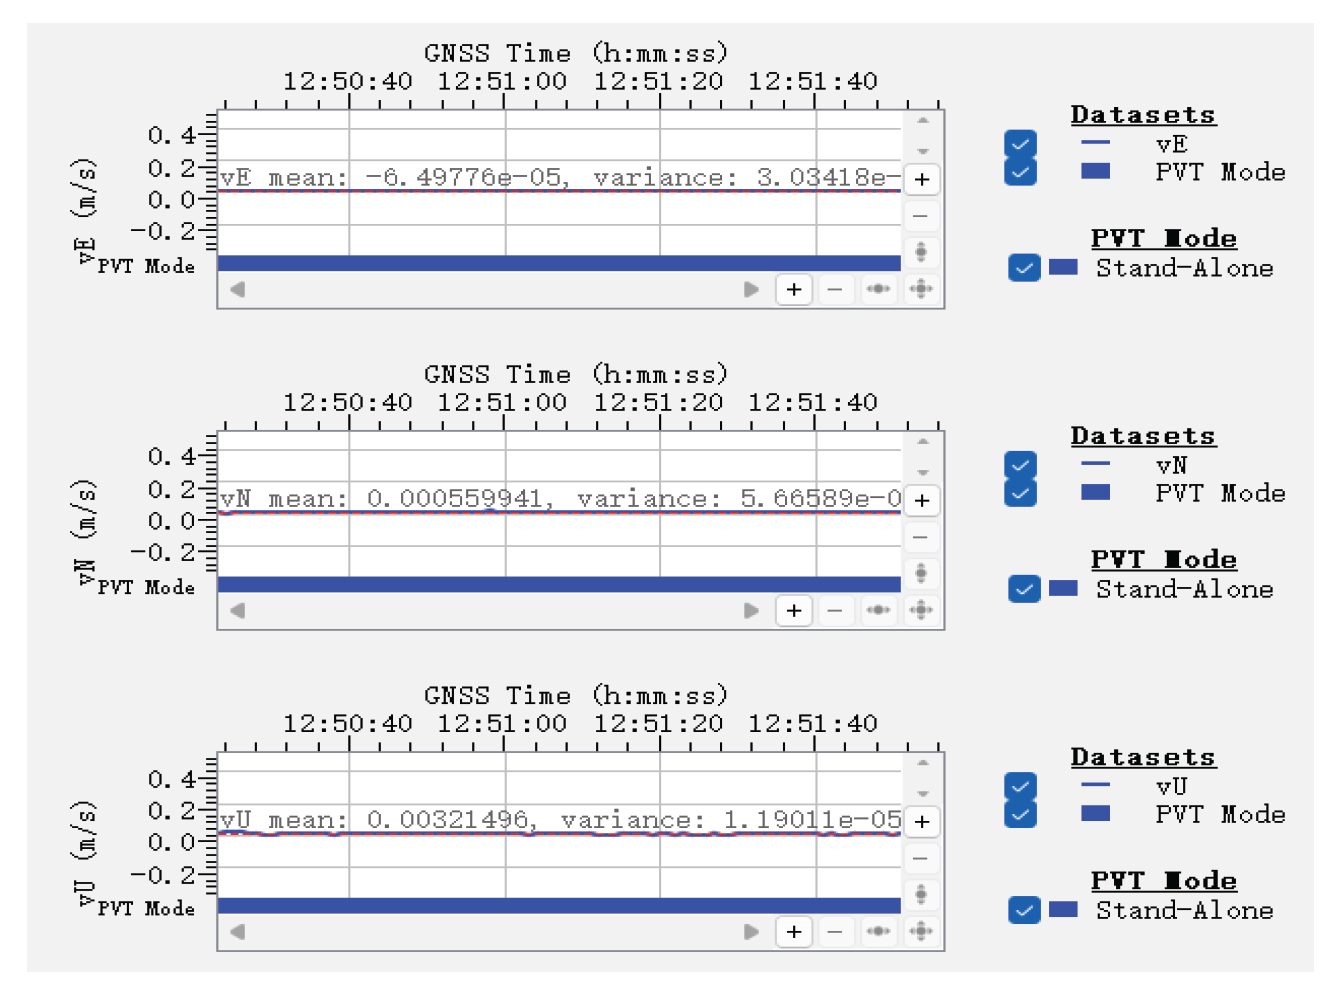
GNSS velocity is calculated in terms of velocity components along the ENU directions, represented by ∇E (eastward), ∇N (northward), and ∇U (upward or zenith).
Figure 32.
Velocity monitoring under normal conditions.
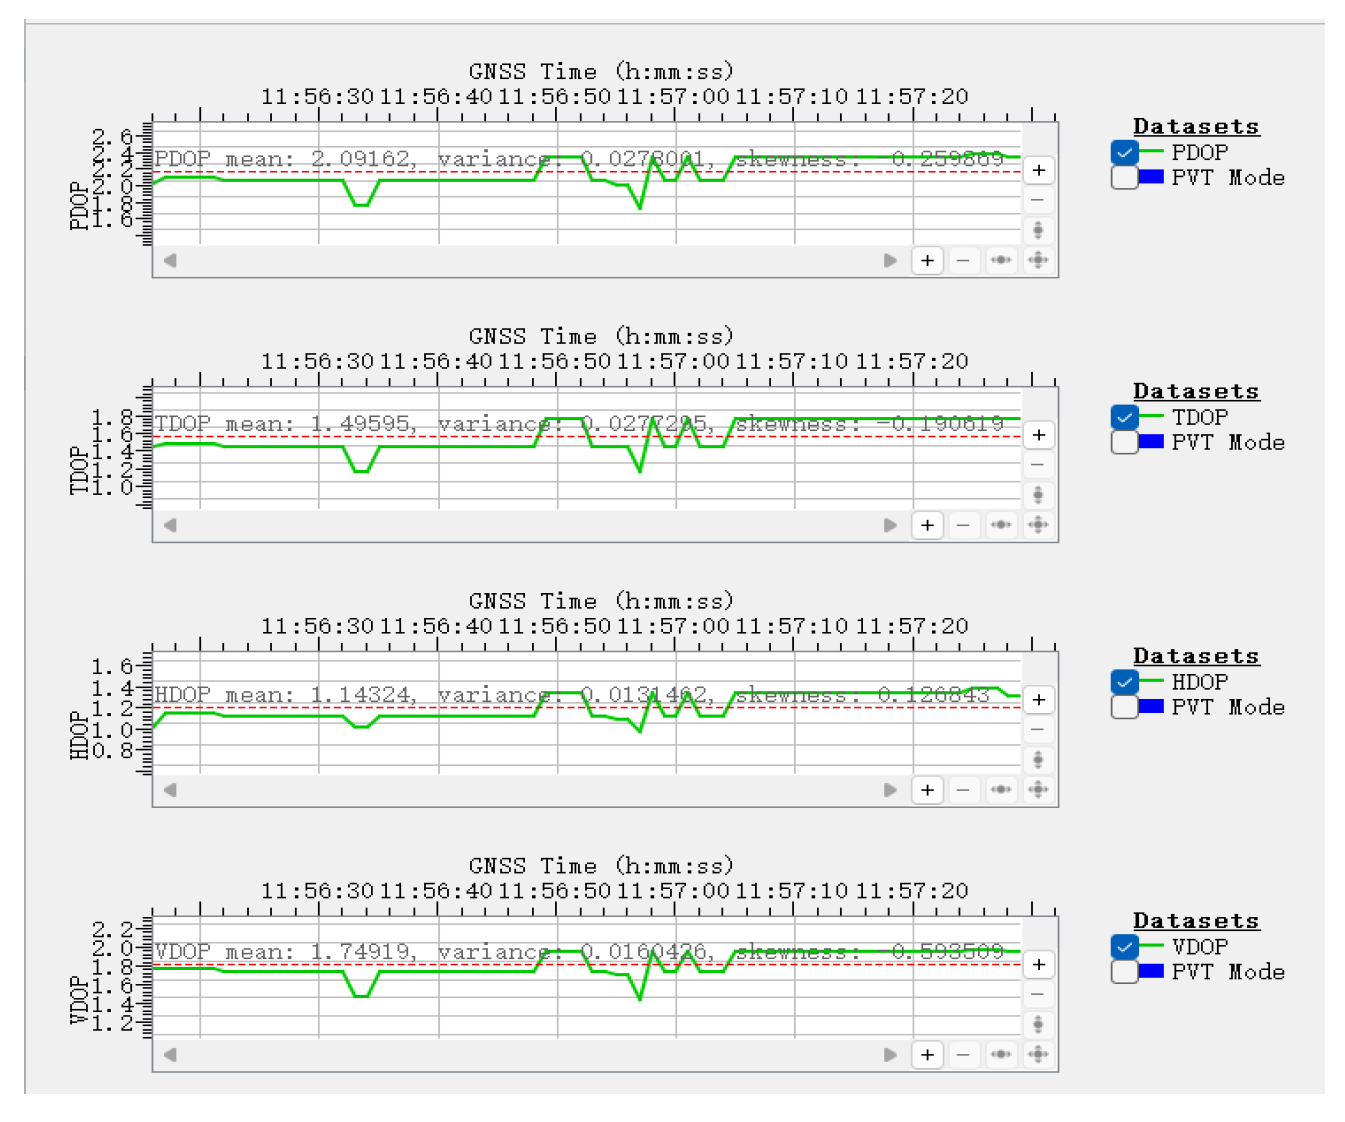
DOP (Dilution of Precision) is a critical metric for GNSS accuracy, reflecting the effect of satellite geometry on positioning precision. Key DOP indicators include:PDOP (3D positioning precision),TDOP (Timing precision),HDOP ( Horizontal precision), VDOP (Vertical precision).
Figure 33.
DOP monitoring under normal conditions.
- 5.
- Data logging and analysis
During testing, the GNSS receiver’s status was recorded in real time for each frequency point. Three failure modes were specifically monitored: Device shutdown or reboot, Signal loss, Severe degradation in positioning accuracy.
After testing, all data were statistically analyzed to assess the GNSS receiver’s immunity performance under HIRF conditions.
5.2. Analysis of Anechoic Chamber Test Results
To evaluate the GNSS receiver’s immunity under HIRF conditions, this section analyzes and summarizes the monitoring data obtained across all test frequency bands.
During the test, no shutdown or reboot events were observed. However, signal loss occurred at several specific frequency points, indicating that the receiver was affected by the high-intensity electromagnetic environment. These results demonstrate a need to further improve the receiver’s HIRF protection capability.
As shown in Figure 34, at 13.183 GHz with horizontal polarization, the GNSS receiver experienced repeatable signal loss. Once the electromagnetic field was applied, the receiver lost its navigation signal. The signal returned after the field was removed but disappeared again upon reapplying the same field strength. Although the signal eventually recovered, data discontinuities and degraded positioning accuracy were observed.
As illustrated in Figure 35, at 14.125 GHz with vertical polarization, a similar signal loss event occurred. After the electromagnetic field was removed, the signal resumed, but not without error—the recovered data deviated from the stable state, suggesting that the GNSS receiver temporarily failed and suffered drift errors. Additionally, the navigation data showed a gradual return to stability over time, implying that HIRF interference can temporarily reduce the receiver's positioning accuracy, and the recovery process involves a noticeable latency.
Signal loss events were also recorded at other frequencies. The summary of observed failures is presented in Table 3.
As shown in Table 3, most signal loss events occurred in the 12–18 GHz range, where the receiver's susceptibility to electromagnetic interference was notably higher. These findings are consistent with the simulation results, particularly the predicted resonance frequencies, confirming the validity of the simulation model. Moreover, the data suggest that the receiver's immunity performance at high frequencies remains insufficient, indicating the need for further enhancements in HIRF shielding and design robustness.
6. Optimization Recommendations
To enhance the electromagnetic shielding effectiveness (SE) of airborne equipment enclosures under High-Intensity Radiated Fields (HIRF), this chapter presents targeted design recommendations based on the simulation results and anechoic chamber tests. The focus is on high-frequency shielding degradation, with strategies proposed in terms of frequency response behavior, material selection, and structural design.
6.1. Frequency Response Characteristics and Resonance Suppression
In the 3–10 GHz range, the enclosure is particularly prone to localized resonances, where the shielding effectiveness drops sharply. This typically occurs when the characteristic dimensions of the structure are comparable to the wavelength of the incident wave. To mitigate resonance-induced shielding failures, the following measures are recommended:
- Geometrical Adjustment: Modify the overall dimensions of the enclosure and openings to shift the structure’s natural resonant frequencies away from critical EMI bands.
- Absorptive Material Application: Apply ferrite coatings, conductive rubber, or other lossy materials near openings or regions with high surface current concentrations to suppress resonance.
- Gap Optimization: Improve electrical continuity at seams and joints using conductive gaskets, EMI shielding fabric, or seam-sealing techniques to prevent resonance-induced coupling.
Table 4 summarizes the proposed mitigation strategies and their target frequency ranges.
6.2. Optimization of Aperture Design
The number, shape, size, and distribution of apertures are among the most critical factors affecting electromagnetic shielding performance. The following design recommendations are proposed to mitigate aperture-induced degradation, particularly in the mid-to-high frequency range:
- Aperture Size Control: Larger aperture dimensions significantly degrade shielding effectiveness, especially at higher frequencies. It is essential to strictly limit the maximum aperture size, particularly for functional openings such as ventilation holes and connector interfaces. To maintain both functionality and shielding, EMC design solutions—such as honeycomb waveguide windows or filtered connectors—are recommended.
- Aperture Shape Optimization: Prefer small-sized, circular, or rounded-corner apertures to avoid sharp-edge-induced electric field enhancement and current concentration, which increase the likelihood of resonance. Rounded geometries help minimize local field distortion and improve broadband SE stability.
- Aperture Quantity and Distribution Strategy: When openings are unavoidable, adopt a multi-aperture, small-size, and non-periodic distribution strategy. For devices requiring large-scale ventilation, replacing a single large opening with multiple small, dispersed apertures is more effective in avoiding strong coupling and resonant failures. Additionally, avoid uniform spacing between apertures, as periodic distributions may induce structural resonance, forming localized weak points in the shielding performance.
6.3. Material Selection and Electromagnetic Property Matching
Materials with high electrical conductivity—such as copper and aluminum—generally offer strong shielding effectiveness (SE), but tend to exhibit severe performance fluctuations near resonance frequencies. In contrast, materials with high magnetic permeability, such as iron, demonstrate better resilience against resonance effects, providing more stable shielding performance across the spectrum.
Therefore, it is recommended to locally or globally incorporate high-permeability materials or magnetic composites into the enclosure structure—particularly at critical locations such as seams, apertures, or areas prone to current concentration—to suppress resonance amplification and improve shielding stability under high-intensity electromagnetic environments.
6.4. Multi-Polarization and Multi-Directional Electromagnetic Protection Design
Simulation results demonstrate that shielding effectiveness (SE) varies significantly with different polarization modes, incident angles, and incident surfaces. In practical HIRF environments, the polarization, propagation direction, and incidence location of electromagnetic waves are highly random. Therefore, optimizing the structure under a single direction or specific polarization condition cannot ensure comprehensive protection. Structural design must provide robust omnidirectional shielding capability.
Fundamentally, the anisotropy of shielding performance stems from the non-uniform distribution of structural features, especially the number, shape, and orientation of openings. The following strategies are recommended to enhance the overall shielding stability:
- Structural Layout Optimization: Adjust the position of key apertures, seams, and connections to avoid strong coupling with specific polarization directions. This reduces polarization-sensitive weak points and enhances generalized SE performance.
- Enhanced Multi-Angle Protection: Simulations reveal that variation in incident angle significantly affects SE in the mid-frequency band. Oblique incidence weakens the parallel electric field component, reducing aperture and seam coupling. Thus, the design should consider shielding uniformity under multiple incidence angles, rather than optimizing performance for only a single direction.
- Reinforcement of Critical Aperture Surfaces: For areas with concentrated apertures, apply composite shielding techniques—such as EMI conductive gaskets, elastic grounding connections, and absorptive coatings. Incorporating waveguide-beyond-cutoff or notch structures within the aperture can block high-frequency leakage paths and suppress resonance effects. Moreover, aperture distribution should be spatially uniform to ensure balanced shielding across all incident surfaces, preventing "weakest surface" vulnerabilities.
6.5. Shielding Effectiveness Optimization in High-Frequency Bands
In the high-frequency range of 10–18 GHz, shielding effectiveness (SE) tends to decrease significantly, and airborne electronic systems become more prone to failure. At these frequencies, surface current concentration intensifies, and coupling paths become more complex, though gaps and small apertures remain the dominant leakage routes. The following strategies are recommended to enhance SE performance in the high-frequency domain:
- Optimized Material Selection: It is advisable to use composite materials that exhibit both high electrical conductivity and high magnetic permeability, or to apply ferromagnetic metals at critical locations. This dual-parameter approach enhances the suppression of both electric and magnetic field components, effectively reducing resonance sensitivity and improving SE stability at high frequencies.
- Integration of High-Frequency Notch Structures: Introduce frequency-selective structures (FSS)—such as embedded metallic grids or surface capacitive patches—inside the enclosure or at aperture sites. These microstructures are designed to produce frequency-selective attenuation, targeting high-frequency coupling paths for additional suppression.
- Control of Effective Gap Length: At high frequencies, even sub-millimeter-scale gaps can cause significant current localization and leakage due to resonance excitation. It is critical to enhance the electrical continuity across seams, refine edge transitions around apertures, and smooth abrupt structural changes to prevent field intensification and localized breakdown.
7. Conclusion
This study investigated the electromagnetic shielding performance of an airborne GNSS receiver under high-intensity radiated field (HIRF) environments. A realistic 3D model based on actual device structure was established, and comprehensive simulation and experimental analyses were conducted. The key conclusions are as follows:
- Shielding effectiveness (SE) shows strong frequency dependence. Structural resonances significantly degrade SE in the 3–10 GHz range, while overall shielding performance deteriorates above 10 GHz due to reduced structural stability.
- Apertures and slots are the main coupling paths. Their shape, size, number, and distribution directly impact SE. High-permeability materials and alignment between polarization and aperture orientation also play critical roles in shielding performance.
- Anechoic chamber testing confirmed the simulation results, with signal loss observed at high-frequency resonance points, validating the identified electromagnetic vulnerabilities.
- Targeted engineering optimizations were proposed, including aperture minimization, rounded-edge slot design, composite material selection, inclined layouts, and multi-polarization/multi-directional shielding, offering practical guidance for improving EMC in airborne systems under HIRF conditions.
8. Outlook
This study conducted a preliminary modeling, simulation, and experimental validation of device-level shielding effectiveness for GNSS receivers under HIRF exposure. However, several areas merit further investigation:
- Extension to Higher Frequencies: The current work focused on the 1–18 GHz range. Future studies should explore shielding performance under millimeter-wave HIRF (above 18 GHz), which is particularly relevant for emerging communication and radar technologies.
- Enhanced Model Complexity: While the model was based on actual device structures, internal elements such as cables, connectors, and functional modules were simplified. Incorporating these features would improve simulation accuracy and realism.
- Advanced Testing Approaches: Validation was limited to static anechoic chamber tests. Future efforts should include dynamic test scenarios, such as reverberation chambers, pulsed HIRF injection, and high-power ground emitter simulations, to better reflect real-world conditions.
- Integration with Airworthiness Standards: The optimization strategies proposed in this study could be aligned with system-level standards, such as RTCA DO-160G, to form a unified electromagnetic protection design and assessment framework for airborne equipment.
Author Contributions
Conceptualization, H.C. and X.L.; methodology, H.C.;; software, H.C.; validation, H.C., C.Z. and J.W.; formal analysis, H.C.; investigation, C.Z., Y.T. and Y.S.; resources, Y.W.; data curation, H.C.; writing—original draft preparation, H.C.; writing—review and editing, X.L. and J.H.; visualization, X.L.; supervision, H.C.; project administration, X.L.; funding acquisition, X.L. All authors have read and agreed to the published version of the manuscript.
Funding
This research was funded by Multi-Objective Intelligent Optimization of Task Execution Strategies for UAV-Based Interference Source Detection (24CAFUC03021), Mechanism Analysis of Electromagnetic Interference Effects from High-Speed Rail Pantograph-Catenary Arcs on Navigation and Positioning Systems of Low-Altitude UAVs (25CAFUC04008), Construction of a University-Industry Collaborative Talent Training Base for Cultivating New-Type Aviation Talents with Civil Aviation Characteristics (MHJY2025009), Study on HIRF Coupling Effects on Airborne Equipment of eVTOL (GY2024-63E), The Innovation and Entrepreneurship Training Program for Students of Civil Aviation University of China (S202410624146), The Innovation and Entrepreneurship Training Program for Students of Civil Aviation University of China (S202410624141), Research on the Influence of High-Speed Railway Pantograph-Arc on the Flight Safety of eVTOL at Emerging Urban Integrated Transportation Hubs (F2024KF17D), Research on the impact of high speed rail bow network arcing on the flight safety of low altitude unmanned aerial vehicles(2025UASKLSP02).
Institutional Review Board Statement
Not applicable.
Informed Consent Statement
Not applicable.
Data Availability Statement
The data that support the findings of this research are available from the author, H.C., upon reasonable request.
Conflicts of Interest
The authors declare no conflicts of interest.
References
- Fang, J., Zhang, Y., & Wu, Y. (2015). Ground multipath reflection interference mitigation methods in HIRF testing. Guidance & Fuze Journal, 36(2), 54–59. [CrossRef]
- Jia, B., & Liu, D. (2011). Analysis of HIRF protection for aircraft. Aeronautical Manufacturing Technology, (8), 86–89. https://doi.org/. [CrossRef]
- 14 CFR 25.1317, High-intensity Radiated Fields (HIRF) Protection. Washington, DC: Federal Aviation Administration, 2007.
- AC 20-158A, The Certification of Aircraft Electrical and Electronic Systems for Operation in the High-intensity Radiated Fields (HIRF) Environment[S]. Washington DC, Federal Aviation Administration, 2014.
- PS-ACE-23-10, HIRF/Lightning Test Levels and Compliance Methods for 14 CFR Part 23 Class I, II, and III Airplanes. Washington, DC: Federal Aviation Administration, 2017.
- RTCA/DO-160G, Environmental Conditions and Test Procedures for Airborne Equipment. Washington, DC: RTCA, 2010.
- AC-21-1317, Requirements for High-Intensity Radiated Fields (HIRF) Protection of Aircraft. Beijing: Civil Aviation Administration of China, 2006.
- CCAR-25-R4, Airworthiness Regulations for Transport Category Airplanes. Beijing: Civil Aviation Administration of China, 2011.
- AC-25-AA-2023-03, Type Certification of Transport Airplanes. Beijing: Civil Aviation Administration of China, 2023.
- Kong, S., Huang, D., & Xiang, Y. (2018). Review of aircraft HIRF protection design and verification technologies. Electronic Product Reliability and Environmental Testing, 36(2), 70–77. [CrossRef]
- Huang, S. (2020). Study on airworthiness compliance verification methods for HIRF protection of transport rotorcraft. China Equipment Engineering, (5), 143–145. [CrossRef]
- Ning, M., Wang, L., & Chen, J. (2017). Risk analysis method of high-intensity radiated fields due to lightning on civil aircraft. Science & Technology Innovation Herald, (14), 12–13. [CrossRef]
- Liang, X., Wang, L., & Xiong, W. (2016). Overview of test methods for HIRF in civil aircraft. In Proceedings of the 5th International Forum on Civil Aircraft Avionics Systems (pp. 431–435).
- Zhang, G. (2016). Research on HIRF airworthiness verification methods for civil aircraft. Science & Tech Vision, (6), 97–98. [CrossRef]
- Hu, P. (2010). Application of low-level coupling techniques in aircraft-level tests. Journal of Microwaves, 26(S2), 58–61. [CrossRef]
- Li, H. (2017). Study on radiation emission and immunity testing of UAVs (Master’s thesis). Heilongjiang University.
- Yuan, H., Duan, Z., Qiu, S., et al. (2020). Sensitivity study of airborne radios under HIRF in electromagnetic reverberation chamber. Aviation Engineering Progress, 11(6), 859–865+906. [CrossRef]
- Chen, J., Jia, R., Tang, B., et al. (2014). Investigation of radar electromagnetic irradiation effects under reverberation chamber conditions. Journal of Microwaves, 30(6), 55–58+79. [CrossRef]
- Lemaire, D., & Garrido, F. (2009). A unified approach for lightning and low-frequency HIRF transfer functions measurements on A380. In IEEE EMC Europe 2009 Workshop, Athens, 1–4.
- Yuan, H. (2020). Research on HIRF testing methods and protection of airborne equipment (Ph.D. dissertation). Hefei University of Technology. [CrossRef]
- Wang, C. (2012). Electromagnetic interference and airworthiness of EWIS wiring on aircraft (Master’s thesis). Civil Aviation University of China.
Figure 7.
Surface current distribution at different frequencies: (a) 400 MHz; (b) 2000 MHz; (c) 5000 MHz; (d) 10,000 MHz; (e) 13,000 MHz; (f) 18,000 MHz .
Figure 7.
Surface current distribution at different frequencies: (a) 400 MHz; (b) 2000 MHz; (c) 5000 MHz; (d) 10,000 MHz; (e) 13,000 MHz; (f) 18,000 MHz .
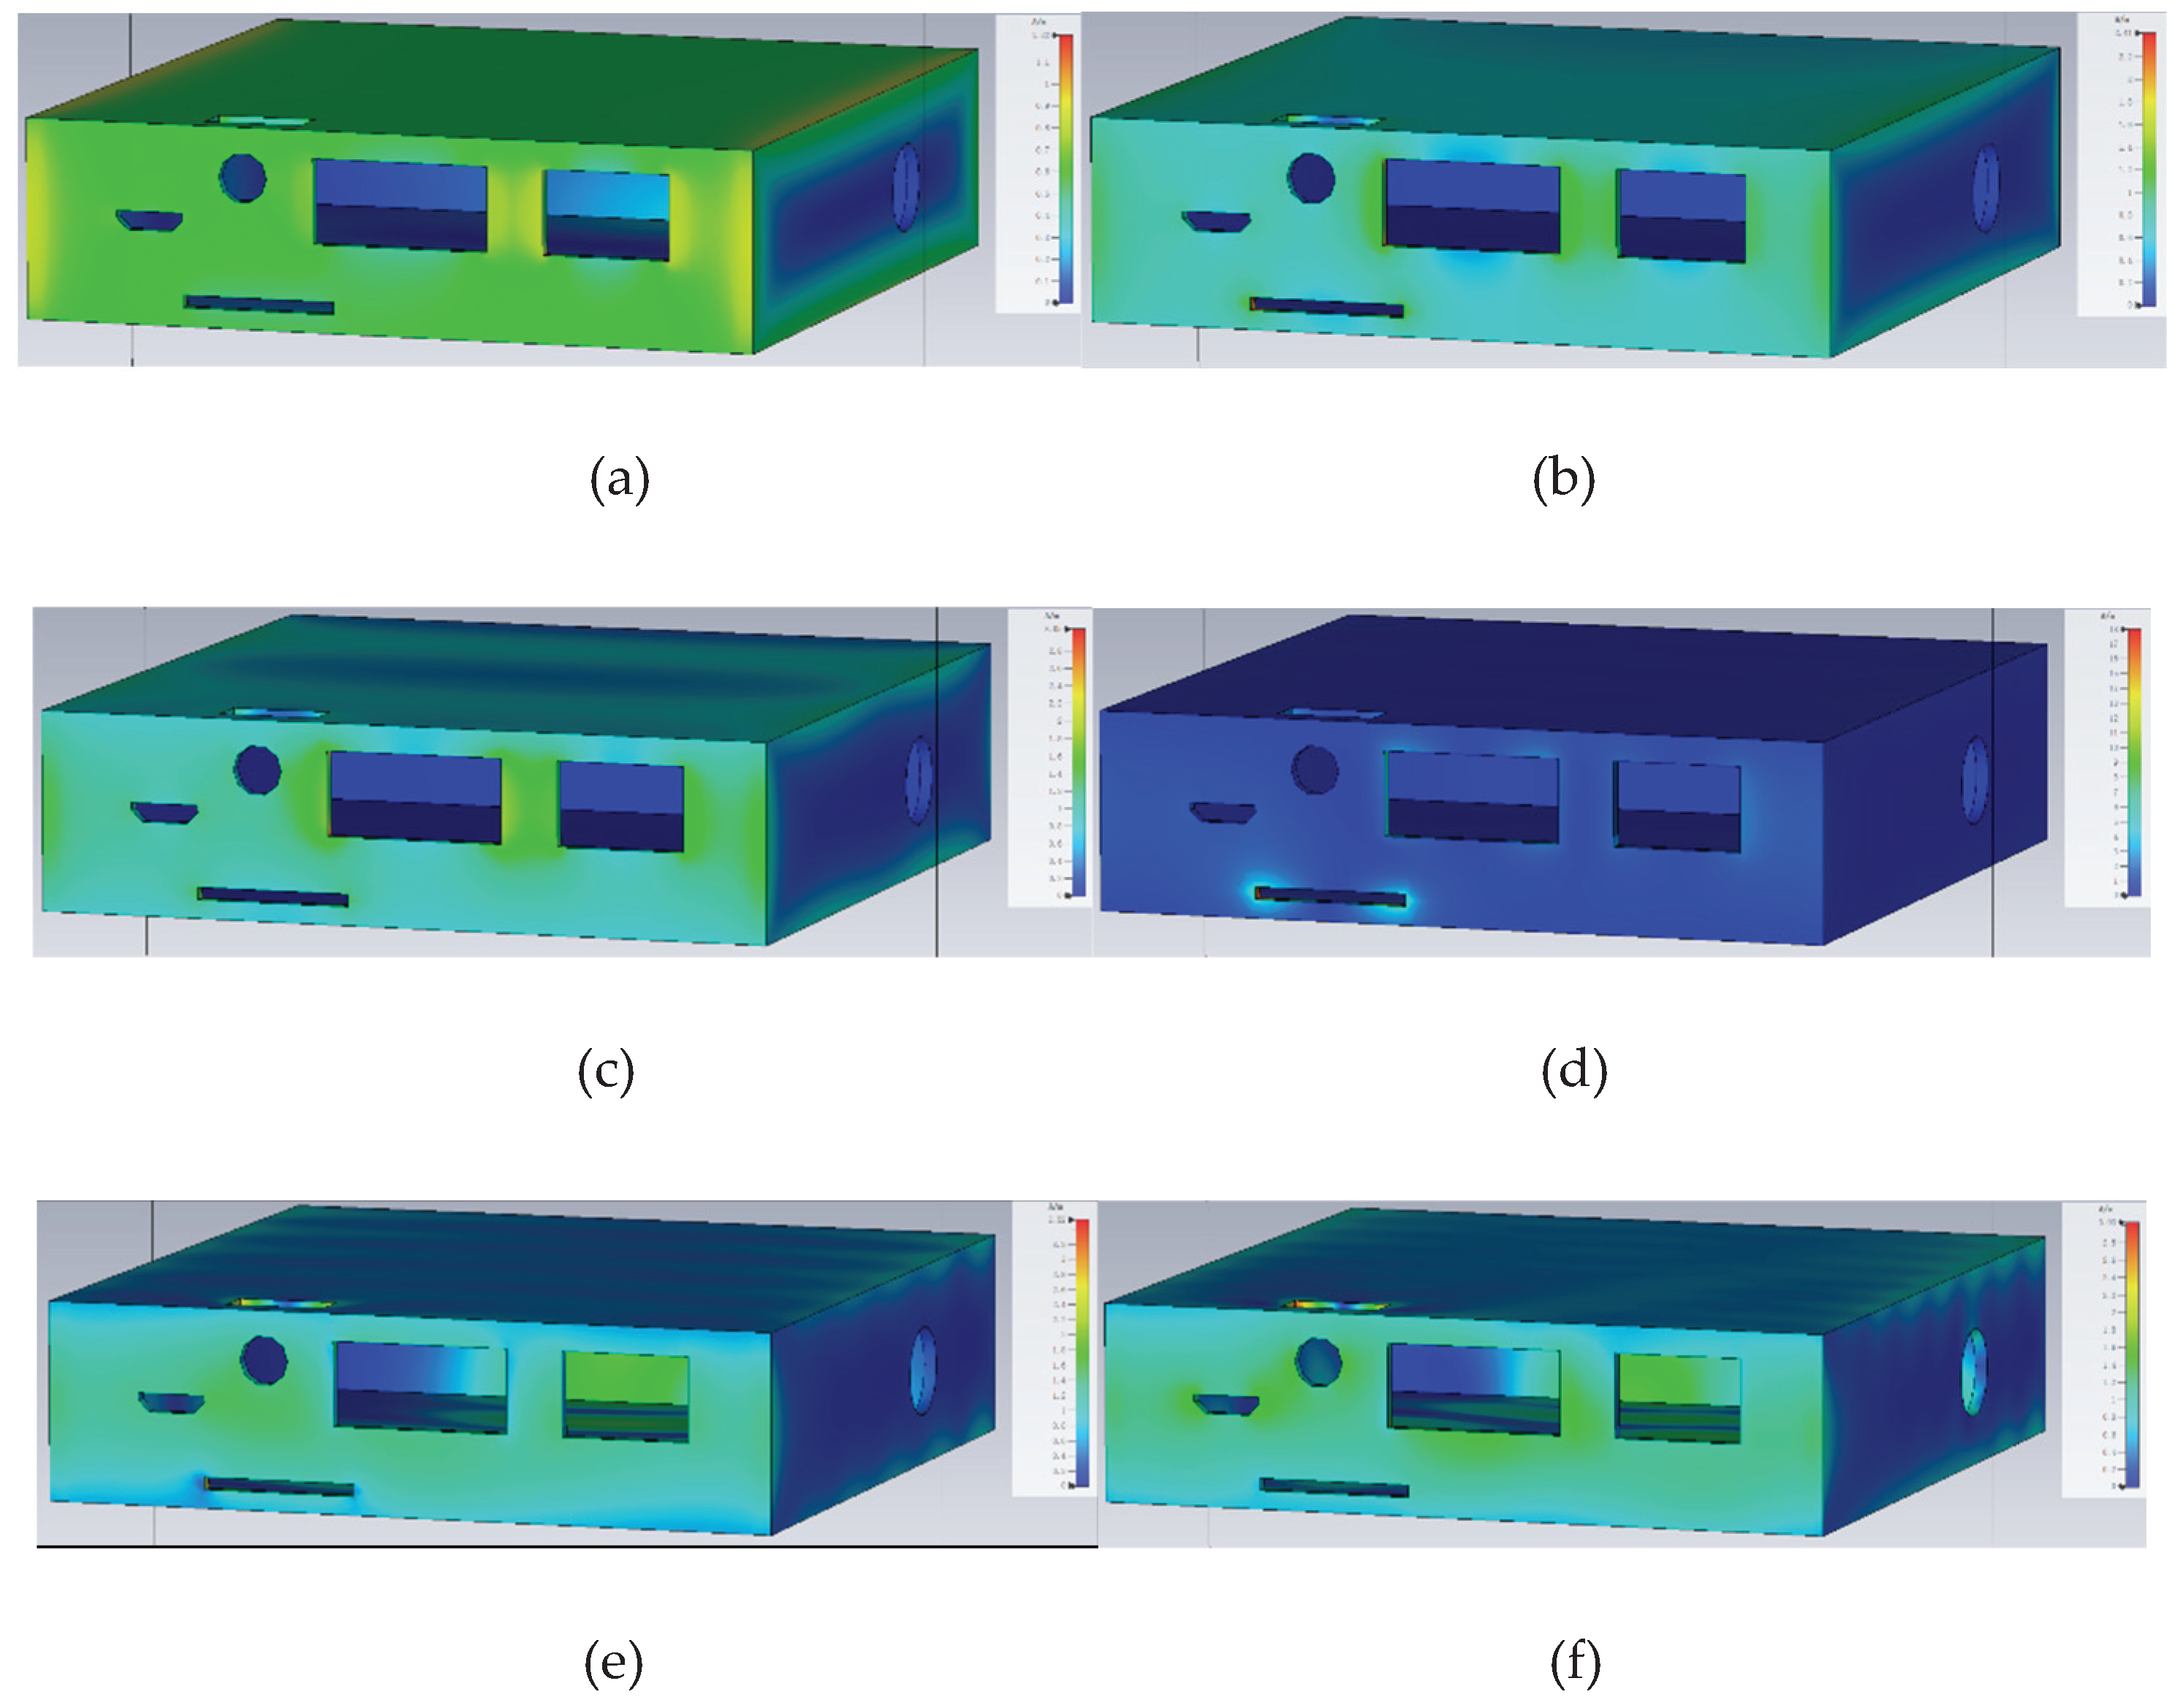
Figure 34.
Relative coordinate monitoring interface at 13.183 GHz (horizontal polarization).
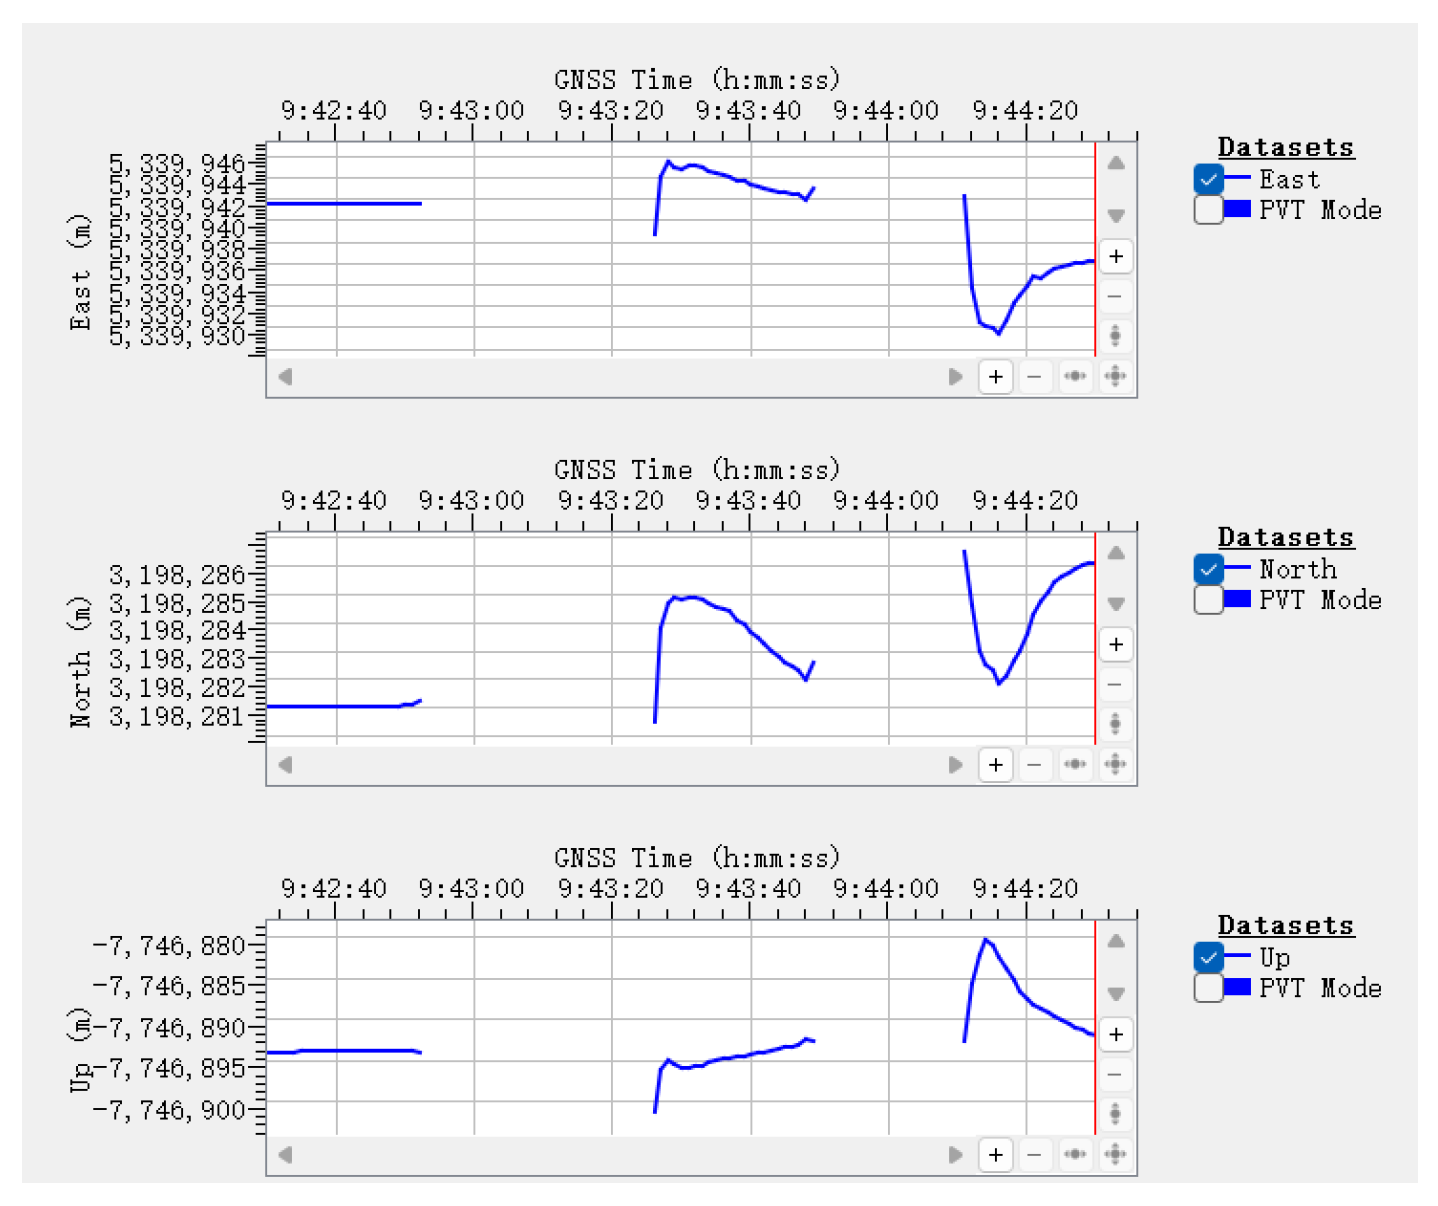
Figure 35.
Relative coordinate monitoring interface at 14.125 GHz (vertical polarization).
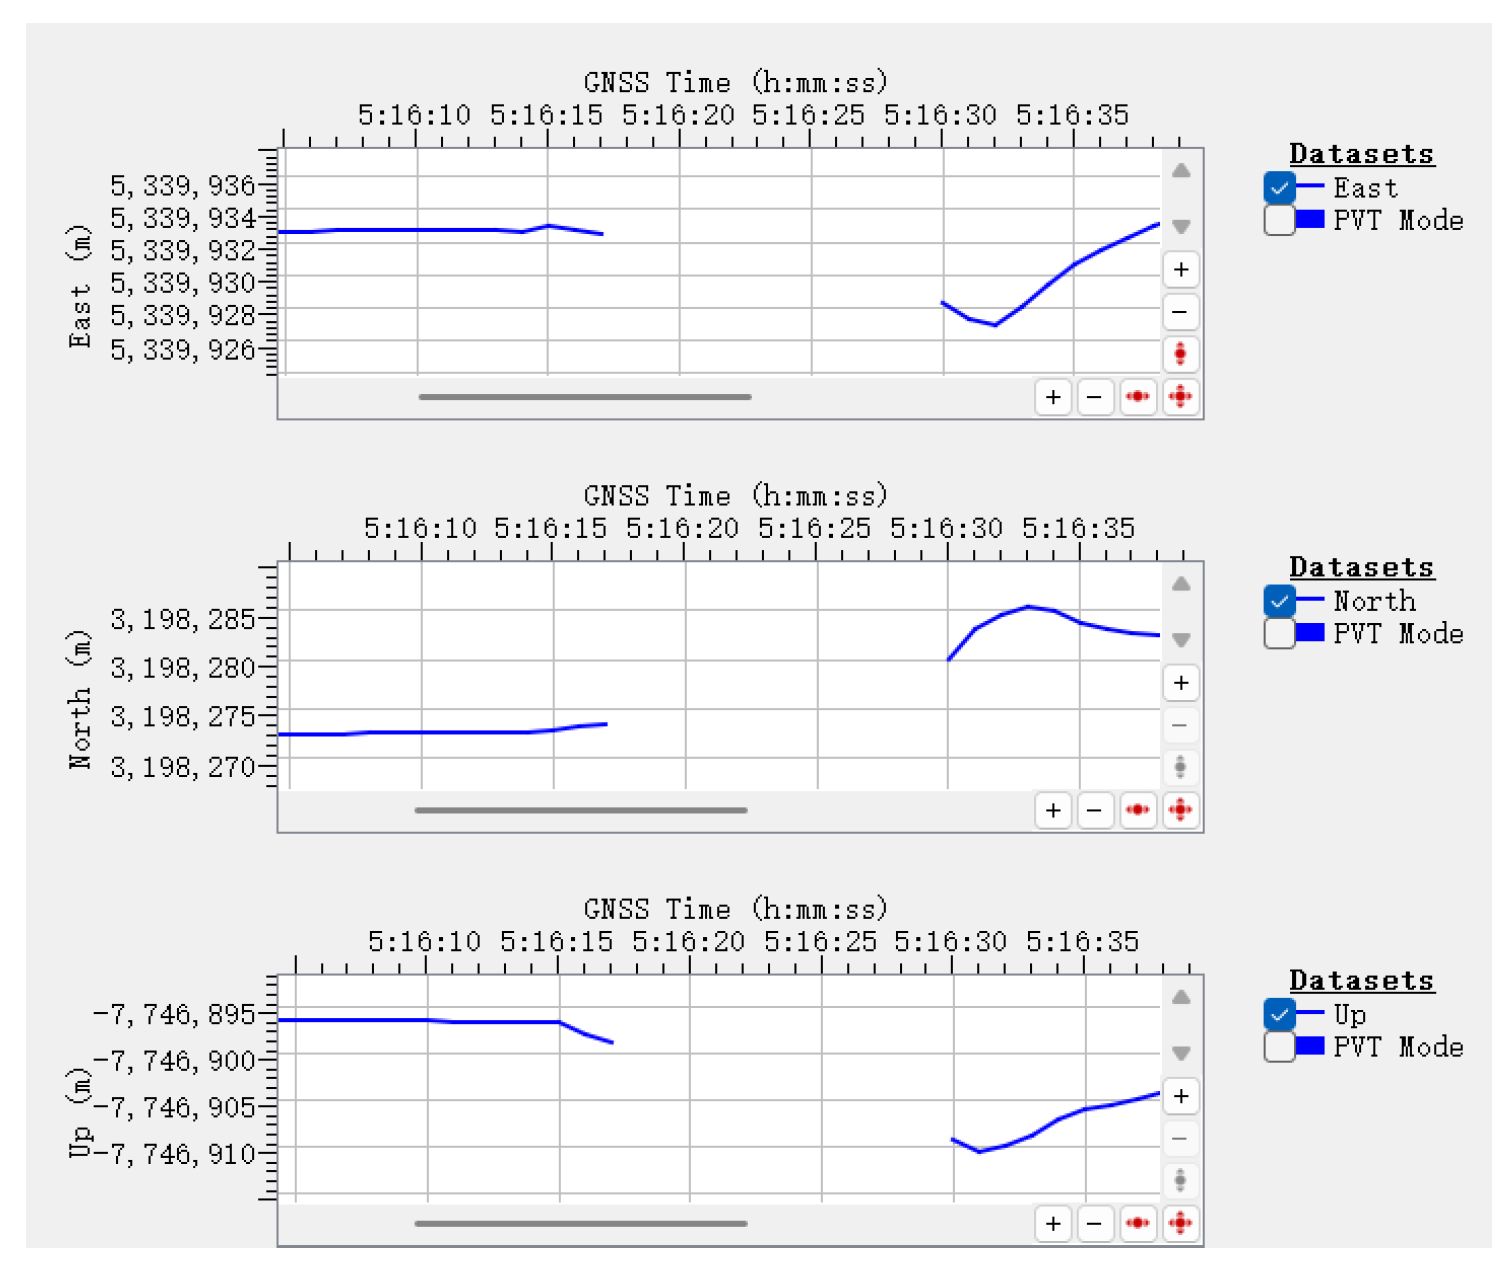
Table 3.
Recorded failure frequencies and types.
| Title 1 | Title 2 |
|---|---|
| 13.183(Horizontal) | Signal loss |
| 13.490(Vertical) | Signal loss |
| 14.125(Vertical) | Signal loss |
| 14.791(Horizontal) | Signal loss |
Table 4.
Key Shielding Optimization Techniques.
| Mitigation Technique | Target Frequency Range | Primary Objective |
|---|---|---|
| Modify enclosure proportions | Mid-frequency(3-10 GHz) | Avoid structural resonance |
| Apply absorbing materials | Mid/high frequency | Attenuate resonant coupling energy |
| Electrical continuity treatment | Full frequency range | Block current paths at discontinuities |
Disclaimer/Publisher’s Note: The statements, opinions and data contained in all publications are solely those of the individual author(s) and contributor(s) and not of MDPI and/or the editor(s). MDPI and/or the editor(s) disclaim responsibility for any injury to people or property resulting from any ideas, methods, instructions or products referred to in the content. |
© 2025 by the authors. Licensee MDPI, Basel, Switzerland. This article is an open access article distributed under the terms and conditions of the Creative Commons Attribution (CC BY) license (http://creativecommons.org/licenses/by/4.0/).
Copyright: This open access article is published under a Creative Commons CC BY 4.0 license, which permit the free download, distribution, and reuse, provided that the author and preprint are cited in any reuse.


