
Submitted:
31 July 2025
Posted:
04 August 2025
You are already at the latest version
Abstract
Colorectal cancer is the third most commonly diagnosed malignancy and the second leading cause of cancer-related death worldwide. Its incidence continues to rise, particularly in association with modifiable risk factors such as obesity, which is closely linked to chronic inflammation and metabolic disturbances, including dyslipidemia. These conditions contribute to the formation of a pro-inflammatory tumor microenvironment, characterized by elevated levels of tumor necrosis factor alpha (TNF-α) and oxidized low-density lipoprotein (ox-LDL).The objective of this study was to analyze the synergistic effect of ox-LDL and TNF-α on ROS production and cell proliferation via WNT/β-catenin and PI3K/AKT in colorectal cancer. To this end, the CRC cells, COLO320 and SW620, were treated with various concentrations of ox-LDL, TNF-α, and their combinations. The pro-liferative effect induced by their synergism was assessed using the IncuCyte® Real-Time Assay, as well as ROS generation was measured with the 2′,7′-dichlorodihydrofluorescein diacetate (H2DCFDA) probe, and cell viability was evaluated by MTT under conditions of pathway inhibition. Co-treatment with ox-LDL and TNF-α significantly increased proliferation in COLO320 cells, accompanied by a marked rise in ROS generation in both cell lines. Inhibition of the WNT/β-catenin and PI3K/AKT pathways revealed differential responses, suggesting a heterogeneous activation pattern dependent on the molecular context. To our knowledge, this is the first study to demonstrate the synergistic effect of ox-LDL and TNF-α in colorectal cancer cell models. These findings highlight the importance of considering both the molecular and redox context of the tumor microenvironment when designing personalized therapeutic strategies.
Keywords:
Colorectal cancer
; proliferation
; ROS
; TNF-α
; ox-LDL
1. Introduction
Colorectal cancer is one of the leading causes of morbidity and mortality worldwide. According to the World Health Organization (WHO), cancer is characterized by the uncontrolled proliferation of abnormal cells with the ability to invade tissues and form metastases, the latter being one of the main causes of death associated with the disease [1]. In 2022, nearly 20 million new cases of cancer and approximately 9.7 million deaths were reported globally, with CRC ranking as the third most commonly diagnosed type, with 1.9 million cases [2,3].
CRC mainly originates from adenomatous polyps of the colorectal epithelium, whose progression to invasive adenocarcinomas involves cumulative genetic and epigenetic alterations [4]. Approximately 60–65% of cases are sporadic, while 25–30% have a hereditary component, with Lynch syndrome and familial adenomatous polyposis being the most common [5,6].
Among the main non-genetic risk factors for CRC are obesity, dyslipidemia, and inflammatory bowel disease. Obesity generates a state of low-grade chronic inflammation, characterized by the sustained production of proinflammatory cytokines, such as TNF-α, and an increase in ROS, which promote damage to cellular macromolecules and tumor progression. In addition, around 60–70% of obese individuals have dyslipidemia, which increases the presence of ox-LDL. This proinflammatory lipoprotein binds to scavenger receptors such as LOX-1, further promoting the generation of ROS [7,8].
The imbalance between ROS production and the body’s antioxidant capacity lead to oxidative stress, a phenomenon that not only causes cellular damage but also modulates intracellular signaling pathways involved in proliferation, survival, and inflammation. In this context, two pathways stand out for their sensitivity to redox signals: PI3K/AKT and WNT/β-catenin [9].
The PI3K/AKT pathway participates in the transduction of signals that promote cell proliferation and inhibit apoptosis. In turn, AKT can increase the activity of NOX1, establishing a positive feedback loop [10,11]
On the other hand, the WNT/β-catenin pathway regulates the transcription of genes associated with cell proliferation. Under normal conditions, β-catenin is degraded by a complex that includes APC and GSK3β; however, mutations in APC or the redox modulation of proteins such as nucleoredoxin (NRX) can promote its activation. The production of ROS by NOX1 can oxidize NRX, releasing Dishevelled (Dvl) and activating WNT signaling [12,13]. Although both TNF-α and ox-LDL have been individually implicated in these processes, there are no conclusive studies evaluating their combined effect on the synergistic activation of these pathways in CRC. This gap is particularly relevant considering that both factors are elevated in patients with obesity.
Therefore, the objective of this study is to evaluate the synergistic effect between ox-LDL and TNF-α on the activation of the WNT/β-catenin and PI3K/AKT intracellular signaling pathways and their relationship with cell proliferation in colorectal cancer cell lines. Understanding these mechanisms could contribute to the identification of new biomarkers and therapeutic strategies in the context of the inflammatory and oxidative microenvironment of CRC.
2. Materials and Methods
2.1. Cell Culture
Human colorectal cancer cell lines HT-29, SW620 and COLO320 were obtained from the American Type Culture Collection (ATCC, Manassas, VA, USA) and maintained under standard culture conditions. HT-29 and SW620 cells were cultured in DMEM, while COLO320 cells were maintained in RPMI-1640 medium. Both media were supplemented with 10% heat-inactivated fetal bovine serum (FBS; Gibco, Thermo Fisher Scientific, USA), 100 U/ml penicillin, and 0.1 mg/ml streptomycin (Gibco). Cells were incubated at 37 °C in a humidified atmosphere containing 5% CO2. Culture media were changed every 2 to 3 days, and cells were passaged at approximately 70–80% confluence using 0.25% trypsin–EDTA solution (Gibco). Treatments were initiated in medium containing 2% FBS to reduce the influence of serum-derived growth factors while maintaining cell viability.
2.2. IncuCyte® Real-Time Assay
HT-29, SW620, and COLO320 cells (5,000 cells/well) were seeded in 96-well plates. After 24h, cells were treated with different ox-LDL and TNF-α concentrations or their combinations. Real-time proliferation experiments were conducted during 24, 48, 72 and 96 h using the IncuCyte® S3 live-cell analysis system (Bohemia, NY, USA) from the Advanced Microscopy Center (CMA Biobio, Concepción, Chile) of the University of Concepción.
2.3. ROS Measurement
Cells were seeded at densities of 5,5x10 cells per well in a black flat-bottomed 96-wel plate and incubated at 37°C with 5% CO2 in culture medium without phenol red. After 24 h, the cells were incubated with 5 µM 2′,7′-dichlorodihydrofluorescein diacetate (H2DCFDA) general oxidative stress indicator (5935, Tocris Bioscience, Bristol, UK) for 30 min in accordance with the manufacturer’s protocol. Then, cells were treated with ox-LDL, TNF-α or their combinations at 37°C several times. Fluorescence was then recorded at Ex 495 nm/Em 520 nm using the Synergy HTX multimode reader (BIOTEK, EE. UU.). For experiments using NOX1 inhibitor, 10 µM ML171 was added to the cultures for 1 h prior to incubation with H2DCFDA.
2.4. Cell Viability
The colorectal cancer cells (7.5 x 10³ cells/well) were incubated with ox-LDL, TNF-α or their combinations at 37°C during 94 h. After that, the medium was removed, and cell viability was measured by incubating the cultures with 5 mg/ml of 3-(4,5-dimethylthiazol-2-yl)-2,5-diphenyl tetrazolium bromide (MTT) (ThermoFisher Scientific, M6494) at 37°C for 3 h. Formazan crystals were dissolved with acidic isopropanol and absorbance was measured at 570 nm using the Synergy HTX multimode reader (BIOTEK, EE. UU.). For experiments using inhibitors, 30 nM Copanlisib (PI3K/AKT inhibitor) (Cayman, 20354) and 10 uM LF3 (WNT/β-catenin inhibitor) (Abcam, ab287122) were added to the cells with the different treatments.
2.5. Statistical Analysis
The results are represented as mean ± SD. Plots and statistical analysis were performed with GraphPad Prism 8.0 software. Data were evaluated using parametric and non-parametric methods depending on the results of the Shapiro-Wilk test normality. Comparisons were made using one-way ANOVA, 2-way ANOVA, Kruskal–Wallis test, Tukey post hoc test and Dunn test. A p-value <0.05 was considered significant.
3. Results
3.1. Evaluation of the Effect of Treatments on the Proliferation of CRC Cell Lines
To evaluate the effects of ox-LDL and TNF-α on CRC cell proliferation, in vitro treatments were performed over 94 hours. Variable concentrations of ox-LDL (0–25 µg/mL) and TNF-α (0-15 ng/mL) were applied individually and in combination.
Treatment with TNF-α at a concentration of 10 ng/mL produced an increase in cell proliferation in the COLO320 cell line after 48 hours of incubation (Figure 1A,C,E,G). However, this increase was not statistically significant compared to the control group. Using a concentration of 15 ng/mL of TNF-α produced an increase in cell proliferation after 72 hours (Figure 1B). However, this effect was not observed in other experimental conditions treated with the same concentration (Figure 1D,F,H).
Conversely, cells treated with ox-LDL at a concentration of 12.5 µg/mL tended increased proliferation after 72 hours, though no statistically significant differences were observed compared to the control group (Figure 1C,D). Concentrations of 6.25, 25, and 50 µg/mL of ox-LDL showed no difference in cell proliferation.
A statistically significant increase in cell proliferation was observed under the following conditions: 6.25 µg/mL ox-LDL + 15 ng/mL TNF-α starting at 48 h (Figure 1B); 12.5 µg/mL ox-LDL + 15 ng/mL TNF-α starting at 94 h (Figure 4D); and 25 µg/mL ox-LDL + 15 ng/mL TNF-α starting at 72 h (Figure 1F). These results suggest that a proliferative response is induced by TNF-α and ox-LDL under certain conditions, though not all combinations in the assay reach statistical significance.
Results from the COLO320 cell line indicate that a significant increase in cell proliferation is observed at low ox-LDL concentrations (6.25-25 µg/mL) when evaluating the synergistic effect with 15 ng/mL TNF-α.
Treatment with TNF-α at concentrations of 15 ng/mL and 10 ng/mL did not induce a statistically significant increase in cell proliferation in the SW620 cell line compared to the control (Figure 2A–H). Similarly, individual treatments with ox-LDL at concentrations of 6.25, 25, and 50 µg/mL did not cause a significant increase in cell proliferation compared to the control (Figure 2A,B,E,F,G,H). In contrast, treatment with 12.5 µg/mL of ox-LDL showed a slight tendency toward increased cell proliferation after 72 hours. However, this was not statistically significant either (Figure 2D).
Regarding co-treatments, no additional proliferative effect was observed in seven of eight combinations. Only the co-treatment of 25 µg/mL ox-LDL and 10 ng/mL TNF-α showed a slight tendency toward increased cell proliferation after 72 hours, though it was not statistically significant compared to the control.
The results observed in the SW620 cell line suggest an increase in proliferation, though it is not statistically significant in this evaluation.
To provide a detailed visualization of how each treatment and co-treatment affected cell proliferation, images were taken of each cell line. The COLO320 cell line showed a marked change in confluence between 0 h and 94 h in response to each treatment (Figure 3A). In the case of the SW620 cell line, although the variation in confluence between treatments was not as pronounced as in COLO320, an increase in proliferation was observed in the treated groups compared to the control (Figure 3B).
3.2. Measurement of Reactive Oxygen Species
The measurement of reactive oxygen species (ROS) was performed using the H2DCFDA probe. NOX1 was inhibited using ML171 prior to incubation with the selected treatments, and ROS levels were monitored at time intervals over a 2 hour period for each cell line. In the COLO320 cell line, co-treatment induced a significant increase in ROS levels at 30 minutes (Figure 4B), 45 minutes (Figure 4C), and 1 hour post-incubation (Figure 4D), with increases of 2.7-, 2.0-, and 2.2-fold, respectively, compared to the control. Although a trend toward increased ROS formation was observed at 10 minutes (Figure 4A), as well as at 1.5 hours (Figure 4E) and 2 hours (Figure 4F), these differences were not statistically significant. Individual treatments also showed increases in ROS levels, but without statistical significance. On the other hand, co-incubation with the NOX1 inhibitor ML171 induced a non-significant reduction in ROS at 10 minutes (Figure 4A); however, this effect was transient, as ROS levels rose again over time.
In the SW620 cell line, co-treatment significantly increased ROS levels at 45 minutes (Figure 4I), 1 hour (Figure 4J), and 1.5 hours post-incubation (Figure 4K), with fold changes of 2.8, 2.4, and 3.1, respectively, compared to the control. Among the individual treatments, only ox-LDL induced an increase in ROS levels, although this did not reach statistical significance. Co-incubation of the inhibitor ML171 with the co-treatment resulted in a significant reduction in ROS levels at 10 minutes (Figure 4G), 30 minutes (Figure 4H), and 45 minutes (Figure 4I), as well as at 1, 1.5, and 2 hours post-incubation, compared to the co-treatment without the inhibitor (Figure 4J,K,L). Similarly, ML171 co-incubated with ox-LDL caused a significant reduction in ROS at 45 minutes, 1 hour, and 1.5 hours compared to ox-LDL treatment alone (Figure 4I,J,K).
3.3. Measurement of Cell Viability with PI3K/AKT and WNT/β-Catenin Pathway Inhibitors
To evaluate the effect of co-treatment and its modulation by specific inhibitors of the PI3K/AKT and WNT/β-catenin signal transduction pathways, a cell viability assay (MTT) was performed on the COLO320 and SW620 cell lines. For this purpose, the inhibitors LF3 (10 μM) and Copanlisib (30 nM) were used, both individually and in combination with co-treatment for 72 h.
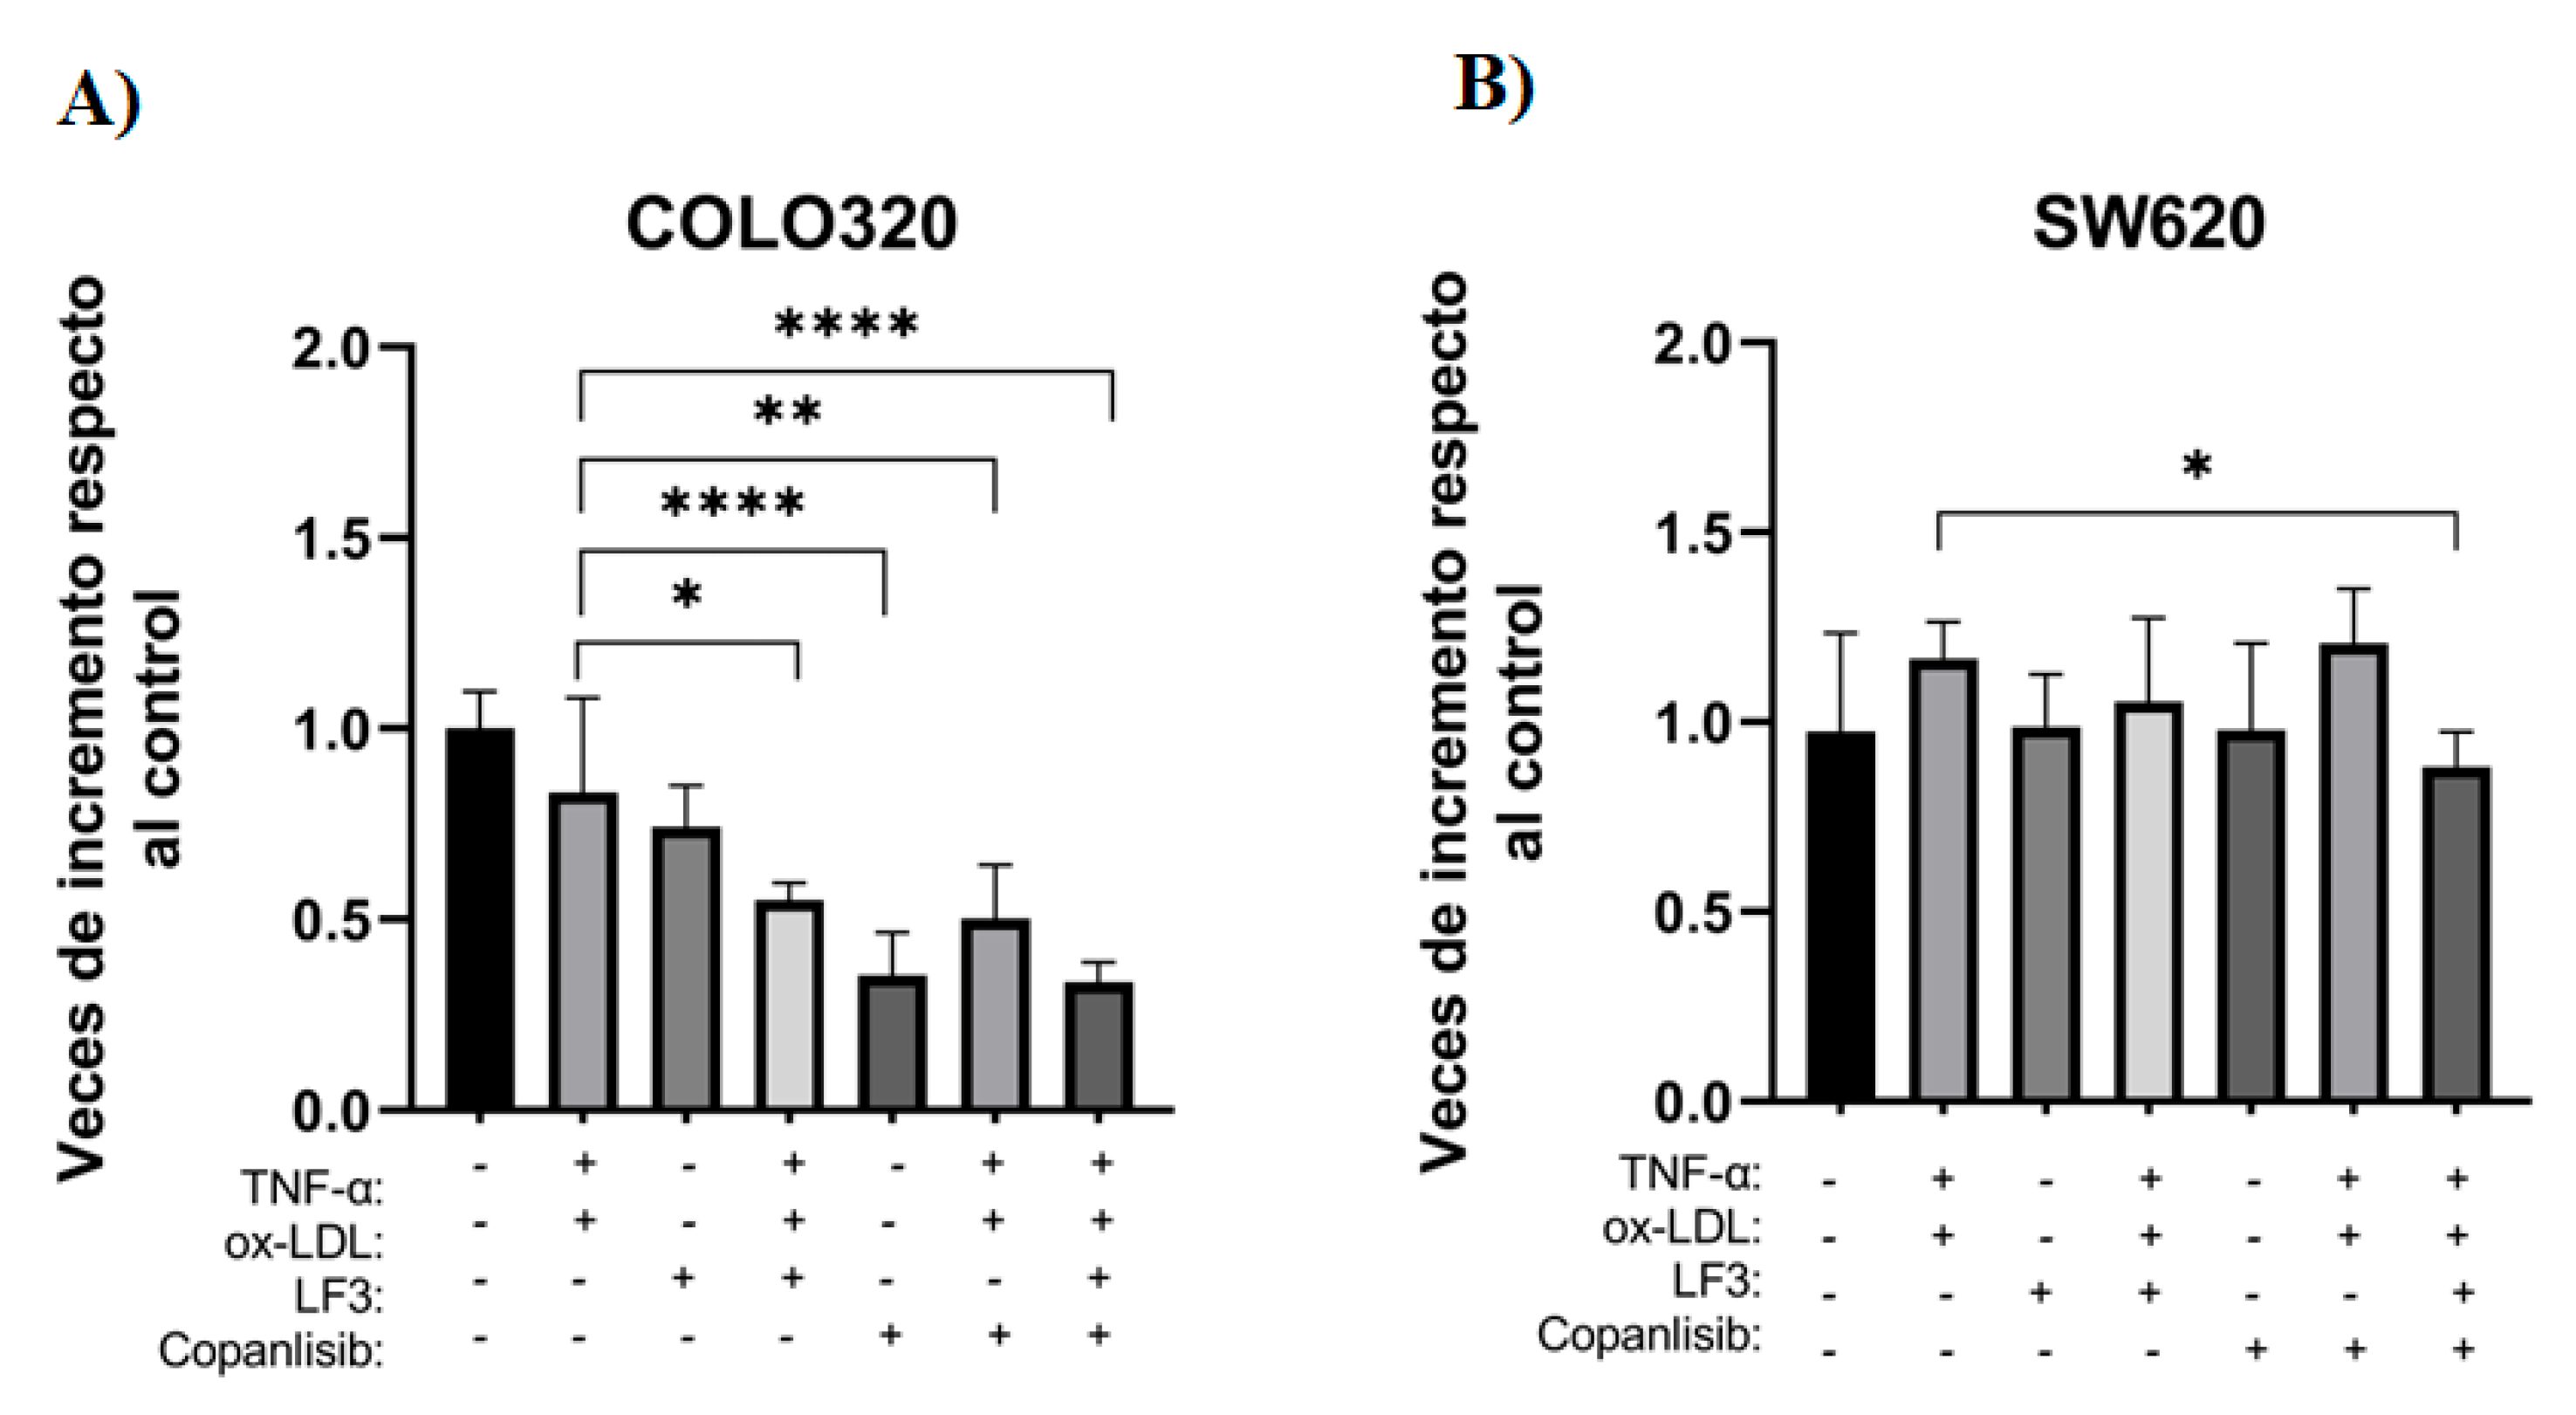
In the COLO320 line, a significant decrease in cell viability was observed between co-treatment and combination with inhibitors. Specifically, when directly comparing co-treatment with inhibitory conditions, it was observed that treatment with LF3 showed no significant differences, while the combination of LF3 with co-treatment decreased 1.51-fold (Figure 5A).
On the other hand, treatment with Copanlisib generated an even more marked effect, decreasing cell viability by 2.35 times compared to co-treatment. This trend was maintained when Copanlisib was combined with co-treatment, decreasing viability 1.65 times and reaching its maximum effect in the triple combination of LF3 + Copanlisib + co-treatment, where a 2.48-fold decrease was observed compared to co-treatment alone (Figure 5A).
Although co-treatment did not show a statistically significant increase in cell viability through MTT, it is suggested that the synergistic stimulus induced by ox-LDL and TNF-α promotes the activation of proliferation pathways, as the sensitivity of co-treatment to pharmacological inhibition demonstrated above reinforces the functional role of the PI3K/AKT and WNT/β-catenin pathways (Figure 5A).
In contrast, the SW620 cell line only showed a significant decrease in cell viability when treated with LF3 + Copanlisib + co-treatment, compared to co-treatment alone. Under this condition, viability was reduced by approximately 1.32-fold, indicating moderate sensitivity to simultaneous inhibition of the PI3K/AKT and WNT/β-catenin pathways under the combined stimulus (Figure 5B).
4. Discussion
Colorectal cancer is one of the most common invasive malignant neoplasms worldwide (Gupta, 2022). Given this scenario, it is essential to identify molecules that, when stimulated together, can act as biomarkers for the early detection of colorectal cancer, especially in patients with risk factors such as inflammation, dyslipidemia, and hypercholesterolemia.
4.1. Co-Treatment with ox-LDL and TNF-α Produces Synergism and Increases Cell Proliferation in the COLO320 Line
When evaluating the synergistic effect between ox-LDL and TNF-α on cell proliferation in CRC, the increase in the generation of reactive oxygen species and the activation of ROS-sensitive signal transduction pathways are observed. To this end, the working concentrations of ox-LDL, TNF-α, and their combination were determined. Regarding ox-LDL, no significant cytotoxicity was observed at the concentrations used (0-50 μg/mL) in the COLO320, SW620, and HT-29 cell lines. These findings are consistent with studies that have shown low or moderate concentrations stimulate cell proliferation, while high concentrations produce cytotoxicity and even apoptosis. This suggests a differential effect of cytotoxicity depending on the type of cell lines, as observed in the K562/AO2 (leukemia) and EC9706 (esophageal carcinoma) cell lines, where cell proliferation decreased from 20 μg/mL of ox-LD. In contrast, non-tumor cells, such as human umbilical vein endothelial cells, exhibit an increase in proliferation with the same treatment [14]. Similarly, in prostate cancer cell lines such as LNCaP, DU-145, and C4-2, treatment with ox-LDL stimulates cell proliferation between 10 and 100 μg/mL [15].
As for TNF-α, no significant changes in proliferation were detected at concentrations of 10 and 15 ng/mL in the COLO320, SW620, and HT-29 cell lines. However, in other studies conducted on colorectal cancer (HCT116), breast cancer (MDA-MB-468 and SK-BR3), and vascular smooth muscle (VSMC) cell lines, working concentrations of up to 20 ng/mL were used, which did not induce cytotoxicity but did induce cell proliferation in some lines. About co-treatment, a significant increase in cell proliferation was observed in several co-treatment combinations in the COLO320 cell line, as well as a tendency toward proliferation in the SW620 line. Regarding this last finding, the literature only reports one study that evaluated the combined and exogenous effect of ox-LDL and TNF-α on colorectal cancer cell lines, specifically HCT116 and COLO320. The results of this study indicated that ox-LDL promoted tumor cell invasion and migration, while co-incubation with TNF-α showed no appreciable additive or synergistic effect [7].
4.2. Co-Treatment Increases the Formation of Reactive Oxygen Species in the COLO320 and SW620 Lines
ROS analysis revealed a substantial increase in ROS after 45 minutes in both the COLO320 and SW620 cell lines when treated with the combination therapy compared to the individual therapies. For instance, one study found that ox-LDL binds to LOX-1 in tumor cells, activating NOX1 and generating ROS through signaling pathways such as NF-κB and MAPK [16]. Conversely, another study of intestinal cells showed that TNF-α stimulates NADPH oxidase through NOXO1, thereby increasing ROS production [17]. Both ox-LDL and TNF-α are proinflammatory molecules that increase ROS production; thus, our results are consistent with those described in the literature.
Regarding NOX1 inhibition by ML171, the COLO320 cell line exhibited NOX1 inhibition and reduced ROS formation during the initial minutes of treatment. However, the cell subsequently compensated for this effect. In contrast, NOX1 inhibition and ROS reduction were maintained over time in the SW620 cell line, reaching statistically significant values. For instance, studies on CRC cells show that ML171 potently inhibits NOX1 [18], whereas a study with organoids shows that ML171 only partially reduces ROS formation [8]. These results suggest that ROS formation is not exclusively limited to NOX1 activity but may also occur via alternative intracellular sources, such as the mitochondria, NOX2, or peroxidases. Another possible explanation for the lack of inhibition in the COLO320 line is that the dose of the inhibitor used was insufficient to counteract NOX1-mediated ROS production over time.
4.3. Differential Effect of PI3K/AKT and WNT/β-Catenin Inhibition on Cell Viability in Colorectal Cancer Lines
To evaluate whether the PI3K/AKT and WNT/β-catenin signaling pathways are involved in cell proliferation induced by co-treatment with ox-LDL and TNF-α, a cell viability assay was performed using MTT at 72 h. The COLO320 and SW320 cell lines were treated with the specific inhibitors LF3 (β-catenin/TCF4 complex inhibitor) and Copanlisib (PI3K/AKT pathway inhibitor), both individually and in combination with the co-treatment.
In the COLO320 line, a significant decrease in cell viability was observed after ox-LDL + TNF-α treatment with both inhibitors, either separately or in combination, compared to co-treatment. In contrast, in the SW620 line, a decrease in viability was only observed when treated with both inhibitors in combination with co-treatment.
These differences can be explained by the characteristic molecular profile of each line. Although both cell lines have a truncated mutation in APC, suggesting constitutive activation of the WNT/β-catenin pathway, COLO320 shows greater functional dependence on this pathway, so treatment with LF3 interrupts a key proliferation pathway. In contrast, SW620 is a KRAS/MAPK pathway-dependent line, which allows it to maintain its viability even after WNT/β-catenin inhibition, as its survival does not depend primarily on this pathway [19].
Regarding PI3K/AKT pathway inhibition, COLO320 showed a significant reduction in cell viability after treatment with Copanlisib and combined inhibitor treatment. This finding could be explained by the activation of alternative pathways downstream of PI3K, such as PDK1-mediated SGK1 phosphorylation, which can maintain mTORC1 activity and promote cell proliferation and survival, as has been described in other tumor models [20]. In the case of SW620, treatment with Copanlisib did not produce a significant decrease in cell viability, which can be attributed to its lower sensitivity to PI3K inhibitors. This resistance has been associated with the presence of constitutively active MAPK signaling, derived from its KRAS mutation, which allows the cell to compensate for PI3K inhibition through parallel pathways [21]. However, when treating with both inhibitors together with co-treatment, this resistance was partially overcome, demonstrating a combined effect on critical proliferation and survival pathways.
In summary, our results show that combined exposure to an inflammatory and dyslipidemic environment, represented by the co-treatment of ox-LDL and TNF-α, promotes a significant increase in cell proliferation in colorectal cancer lines that are more sensitive to ROS-induced oxidative stress and functionally dependent on signaling pathways activated by exogenous stimuli and their specific molecular profile.
Together, this work also suggests intervention strategies based on the combination of signaling inhibitors with knowledge of the cellular redox state. These approaches could contribute to the development of more effective and personalized therapies for colorectal cancer, as well as to the early prevention of this disease in contexts of chronic inflammation and dyslipidemia, advancing toward translational applications with clinical and biotechnological projections.
5. Conclusions
Our results show that co-treatment with ox-LDL and TNF-α at low concentrations has a synergistic effect that significantly enhances cell proliferation in the COLO320 line. This effect is accompanied by a significant increase in the generation of reactive oxygen species (ROS) in both COLO320 and SW620, suggesting a redox response associated with the combined stimulus. Furthermore, the differential inhibition observed in the WNT/β-catenin and PI3K/AKT signaling pathways between the different cell lines could be explained by their specific molecular profile, highlighting the role of mutations that constitutively regulate the activation or inhibition of these pathways. These findings reinforce the importance of considering the molecular and redox context of the tumor microenvironment for the design of personalized therapeutic strategies.
Author Contributions
Conceptualization, J.R.T. and M.P.V.; methodology, M.P.V., E.S., C.A.; validation, E.S., C.V.; formal analysis, M.P.V.; investigation, M.P.V., E.S., and C.V.; resources, C.A. and J.R.T.; writing—review and editing, M.P.V., E.S., C.V.; visualization, J.R.T.; supervision, C.A.; project administration, J.R.T.; founding acquisition, J.R.T. All authors have read and agreed to the published version of the manuscript.
Funding
This research was funded by FONDECYT, grant number 1201217.
Institutional Review Board Statement
Not applicable.
Data Availability Statement
The original contributions presented in the study are included in the article, further inquiries can be directed to the corresponding author.
Acknowledgments
The authors would like to acknowledge the Center of Advanced Microscopy CMA BIOBIO for their support with microscopy.
Conflicts of Interest
The authors declare no conflicts of interest.
Abbreviations
The following abbreviations are used in this manuscript:
| CRC | Colorectal Cancer |
| ROS | Reactive oxygen species |
| WHO | World Health Organization |
| TNF-α | Tumor necrosis factor alpha |
| ox-LDL | Oxidized low-density lipoprotein |
| H2DCFDA | 2′,7′-dichlorodihydrofluorescein diacetate |
| MTT | 3-(4,5-dimethylthiazol-2-yl)-2,5-diphenyl tetrazolium bromide |
| SD | Standard deviation |
| VSMC | Vascular smooth muscle cells |
References
- World Health Organization. Cáncer 2022. Available from: https://www.who.int/es/news-room/fact-sheets/detail/cancer.
- Globocan. world fact sheets. 2022.
- World Health Organization. Crece la carga mundial de cáncer en medio de una creciente necesidad de servicios 2024. Available from: https://www.who.int/es/news/item/01-02-2024-global-cancer-burden-growing--amidst-mounting-need-for-services.
- Fleming, M.; Ravula, S.; Tatishchev, S.F.; Wang, H.L. Colorectal carcinoma: Pathologic aspects. J Gastrointest Oncol. 2012, 3, 153–173. [Google Scholar] [PubMed]
- Goosenberg, K.A.; Babiker, H.M. A Review of Hereditary Colorectal Cancers. In: Publishing S, editor. StatPearls [Internet]. Treasure Island (FL), StatPearls Publishing; 2025.
- Keum, N.; Giovannucci, E. Global burden of colorectal cancer: emerging trends, risk factors and prevention strategies. Nat Rev Gastroenterol Hepatol. 2019, 16, 713–732. [Google Scholar] [CrossRef] [PubMed]
- González-Horta, E.; Vargas, Y.; Burgueño, J.; Abreu, M.; Toledo, J. P-305 Oxidized-LDL promotes colorectal cancer progression and growth of human colonoides. Annals of Oncology 2022, 33. [Google Scholar] [CrossRef]
- Gonzalez-Horta, E.E.; Burgueno, J.F.; Leiva, M.J.; Villavicencio, C.; Kawaguchi, F.I.; Hazime, H.; et al. Oxidized Low-Density Lipoprotein Induces Reactive Oxygen Species-Dependent Proliferation of Intestinal Epithelial Cells. Pharmaceuticals 2024, 17. [Google Scholar] [CrossRef] [PubMed]
- Catalano, T.; Selvaggi, F.; Cotellese, R.; Aceto, G.M. The Role of Reactive Oxygen Species in Colorectal Cancer Initiation and Progression: Perspectives on Theranostic Approaches. Cancers 2025, 17. [Google Scholar] [CrossRef] [PubMed]
- Koundouros, N.; Poulogiannis, G. Phosphoinositide 3-Kinase/Akt Signaling and Redox Metabolism in Cancer. Front Oncol. 2018, 8, 160. [Google Scholar] [CrossRef] [PubMed]
- Chen, M.; Inoue, K.; Narumiya, S.; Masaki, T.; Sawamura, T. Requirements of basic amino acid residues within the lectin-like domain of LOX-1 for the binding of oxidized low-density lipoprotein. FEBS Letters 2001, 499, 215–219. [Google Scholar] [CrossRef] [PubMed]
- He, X.C.; Yin, T.; Grindley, J.C.; Tian, Q.; Sato, T.; Tao, W.A.; et al. PTEN-deficient intestinal stem cells initiate intestinal polyposis. Nat Genet. 2007, 39, 189–198. [Google Scholar] [CrossRef] [PubMed]
- Lee, S.R.; Yang, K.S.; Kwon, J.; Lee, C.; Jeong, W.; Rhee, S.G. Reversible inactivation of the tumor suppressor PTEN by H2O2. J Biol Chem. 2002, 277, 20336–20342. [Google Scholar] [CrossRef] [PubMed]
- Li, H.; Li, X.X.; Ma, Q.; Cui, J. The variability of oxLDL-induced cytotoxicity on different types of cell lines. Cell Biochem Biophys. 2013, 67, 635–644. [Google Scholar] [CrossRef] [PubMed]
- Gonzalez-Chavarria, I.; Cerro, R.P.; Parra, N.P.; Sandoval, F.A.; Zuniga, F.A.; Omazabal, V.A.; et al. Lectin-like oxidized LDL receptor-1 is an enhancer of tumor angiogenesis in human prostate cancer cells. PLoS ONE 2014, 9, e106219. [Google Scholar] [CrossRef] [PubMed]
- Zhang, X.; Ye, X.; Jin, H. Oxidized Low-Density Lipoprotein as a Potential Target for Enhancing Immune Checkpoint Inhibitor Therapy in Microsatellite-Stable Colorectal Cancer. Antioxidants 2025, 14. [Google Scholar] [CrossRef] [PubMed]
- Kuwano, Y.; Tominaga, K.; Kawahara, T.; Sasaki, H.; Takeo, K.; Nishida, K.; et al. Tumor necrosis factor alpha activates transcription of the NADPH oxidase organizer 1 (NOXO1) gene and upregulates superoxide production in colon epithelial cells. Free Radic Biol Med. 2008, 45, 1642–1652. [Google Scholar] [CrossRef] [PubMed]
- Gianni, D.; Taulet, N.; Zhang, H.; DerMardirossian, C.; Kister, J.; Martinez, L.; et al. A novel and specific NADPH oxidase-1 (Nox1) small-molecule inhibitor blocks the formation of functional invadopodia in human colon cancer cells. ACS Chem Biol. 2010, 5, 981–993. [Google Scholar] [CrossRef] [PubMed]
- Chen GT, Tifrea DF, Murad R, Lyou Y, Mortazavi A, Edwards RA, et al. 2019.
- Castel, P.; Ellis, H.; Bago, R.; Toska, E.; Razavi, P.; Carmona, F.J.; et al. PDK1-SGK1 Signaling Sustains AKT-Independent mTORC1 Activation and Confers Resistance to PI3Kalpha Inhibition. Cancer Cell. 2016, 30, 229–242. [Google Scholar] [CrossRef] [PubMed]
- Clarke, P.A.; Roe, T.; Swabey, K.; Hobbs, S.M.; McAndrew, C.; Tomlin, K.; et al. Dissecting mechanisms of resistance to targeted drug combination therapy in human colorectal cancer. Oncogene 2019, 38, 5076–5090. [Google Scholar] [CrossRef] [PubMed]
Figure 1.
Cell proliferation assay in the COLO320 CRC cell line. Cells were treated with ox-LDL, TNF-α, and co-treatments for 24, 48, 72, and 94 h. (A–H) correspond to the different individual treatments of ox-LDL, TNF-α, and co-treatments used. The points represent the mean ± standard deviation (SD), with n=6. A two-way analysis of variance (ANOVA) was performed, and Tukey’s multiple comparison test was applied. Significance is indicated with * p<0.05, ** p<0.01.
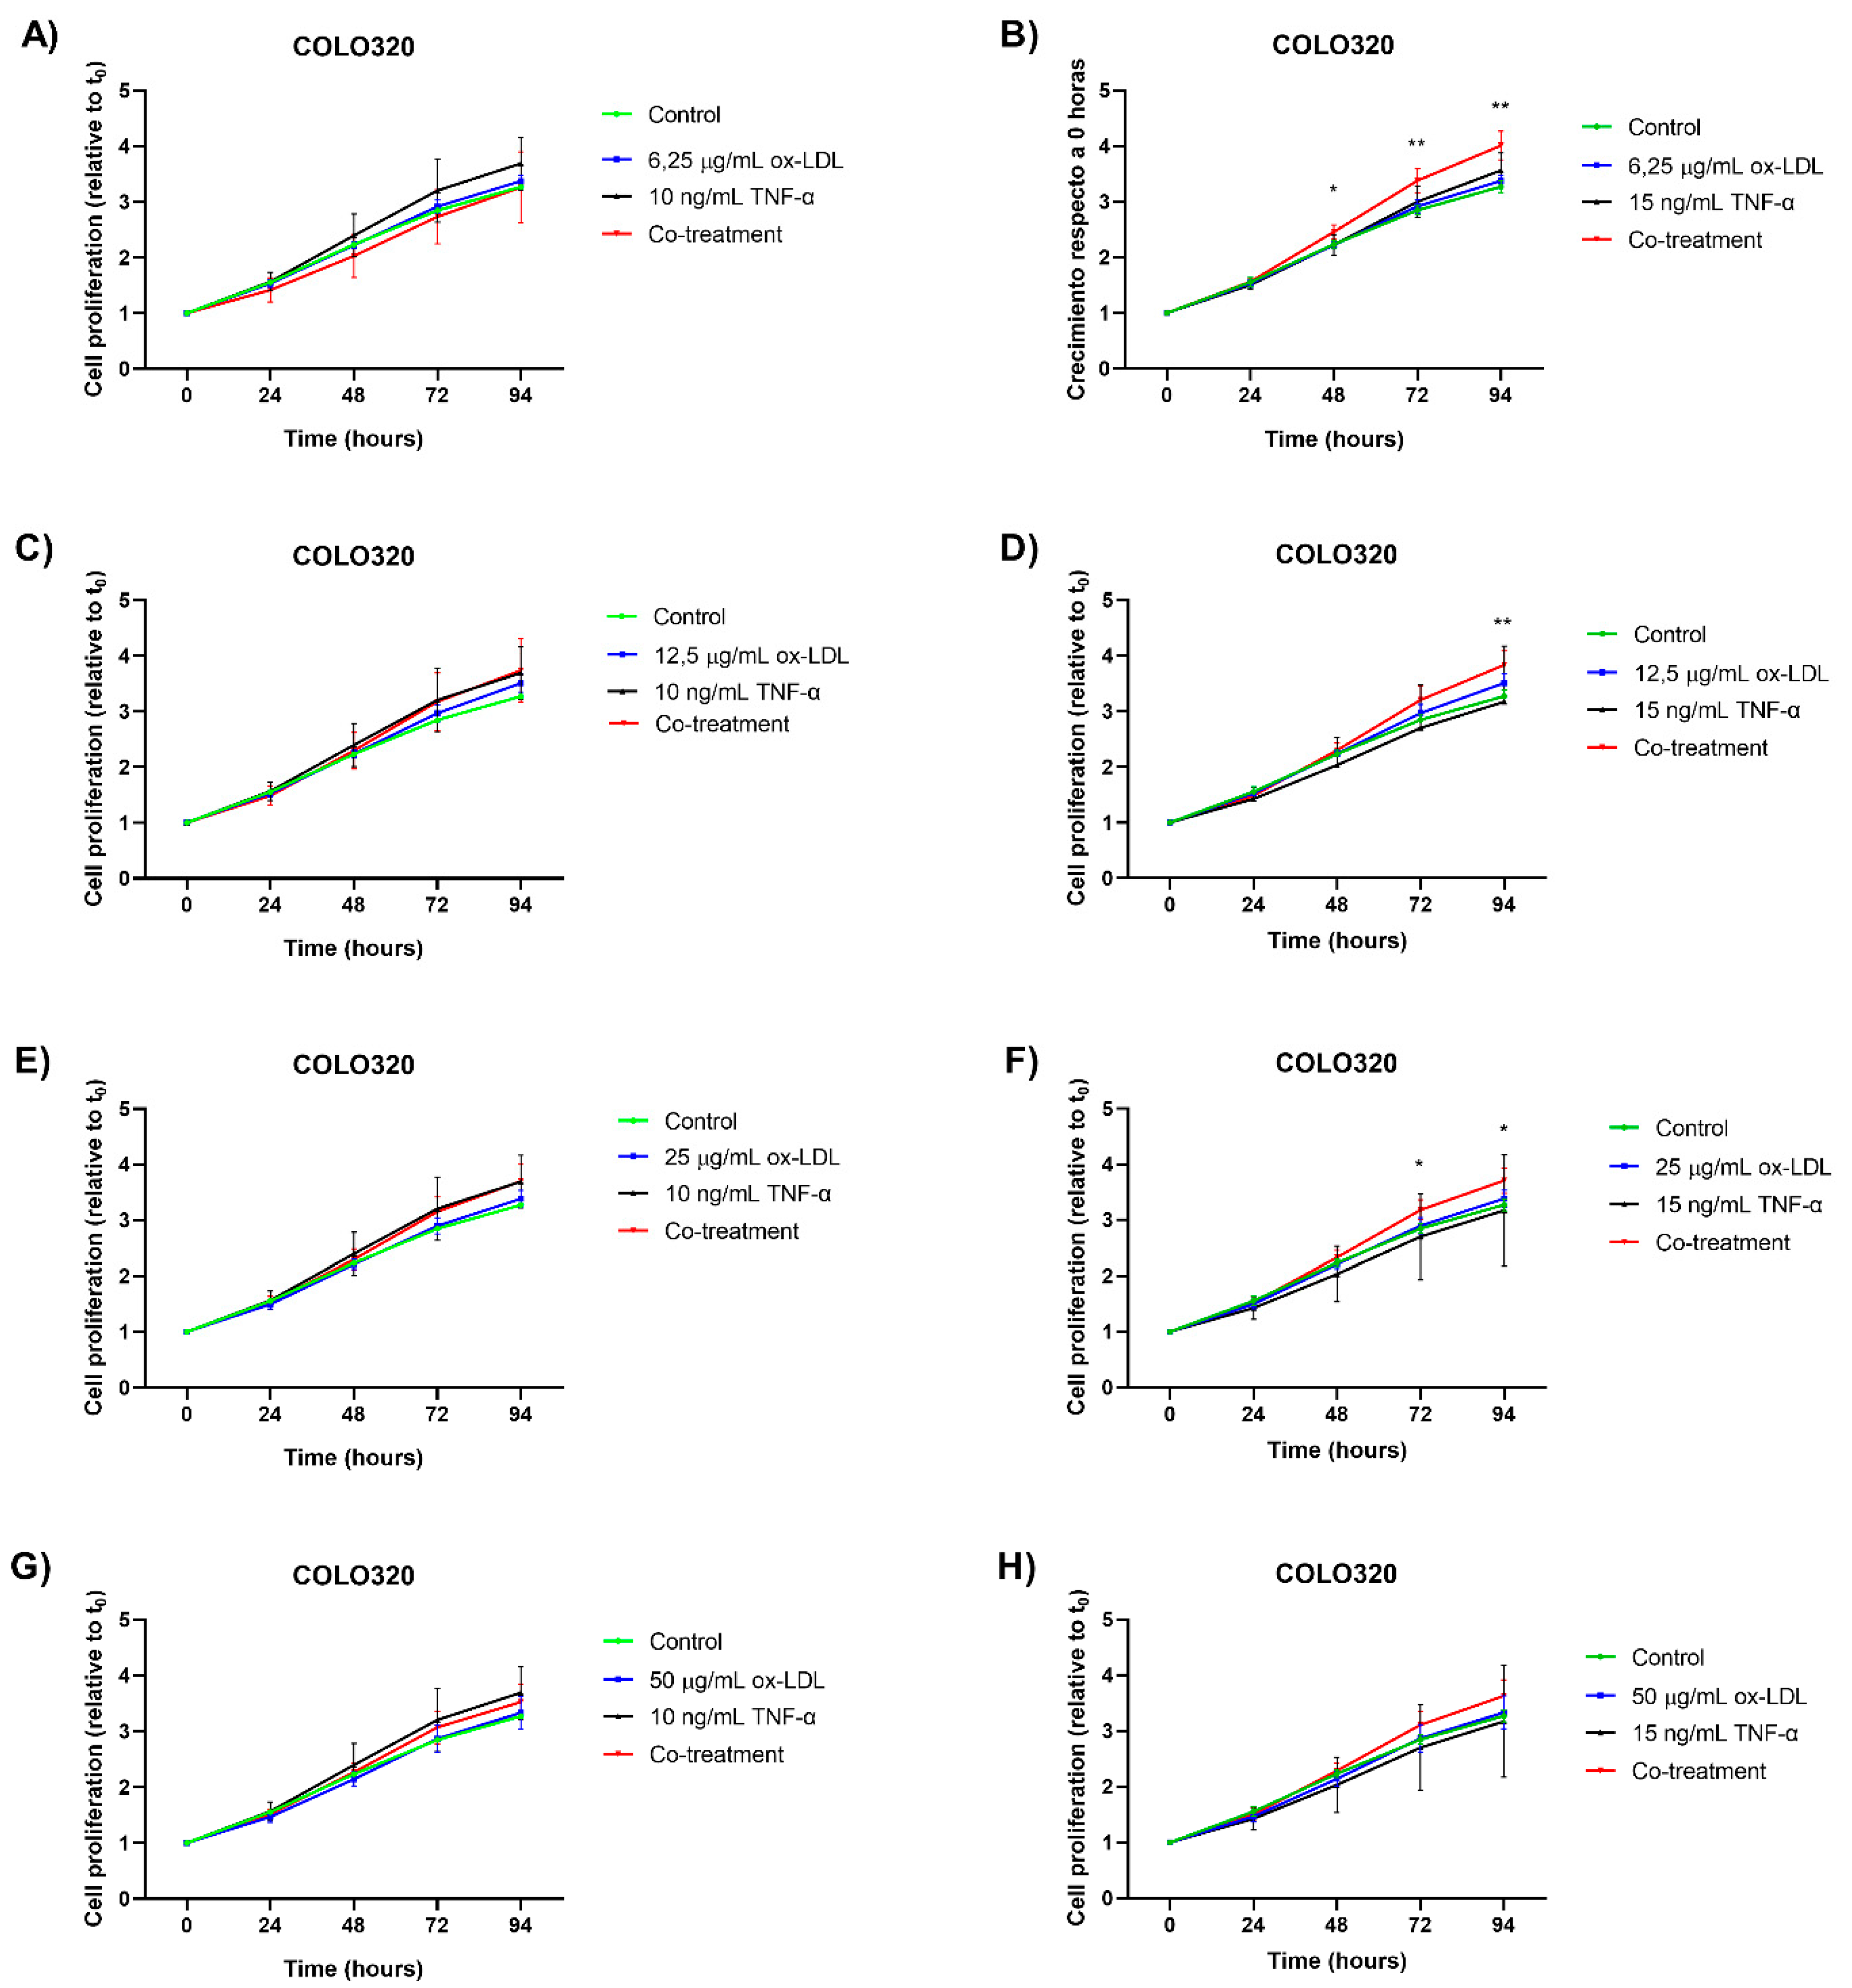
Figure 2.
Cell proliferation assay in the SW620 CRC cell line. Cells were treated with ox-LDL, TNF-α, and co-treatments for 24, 48, 72, and 94 hours. (A-H) corresponds to the different individual treatments of ox-LDL, TNF-α, and co-treatments used. The points represent the mean ± SD, with n=6. A two-way analysis of variance (ANOVA) was performed, and Tukey’s multiple comparison test was applied.
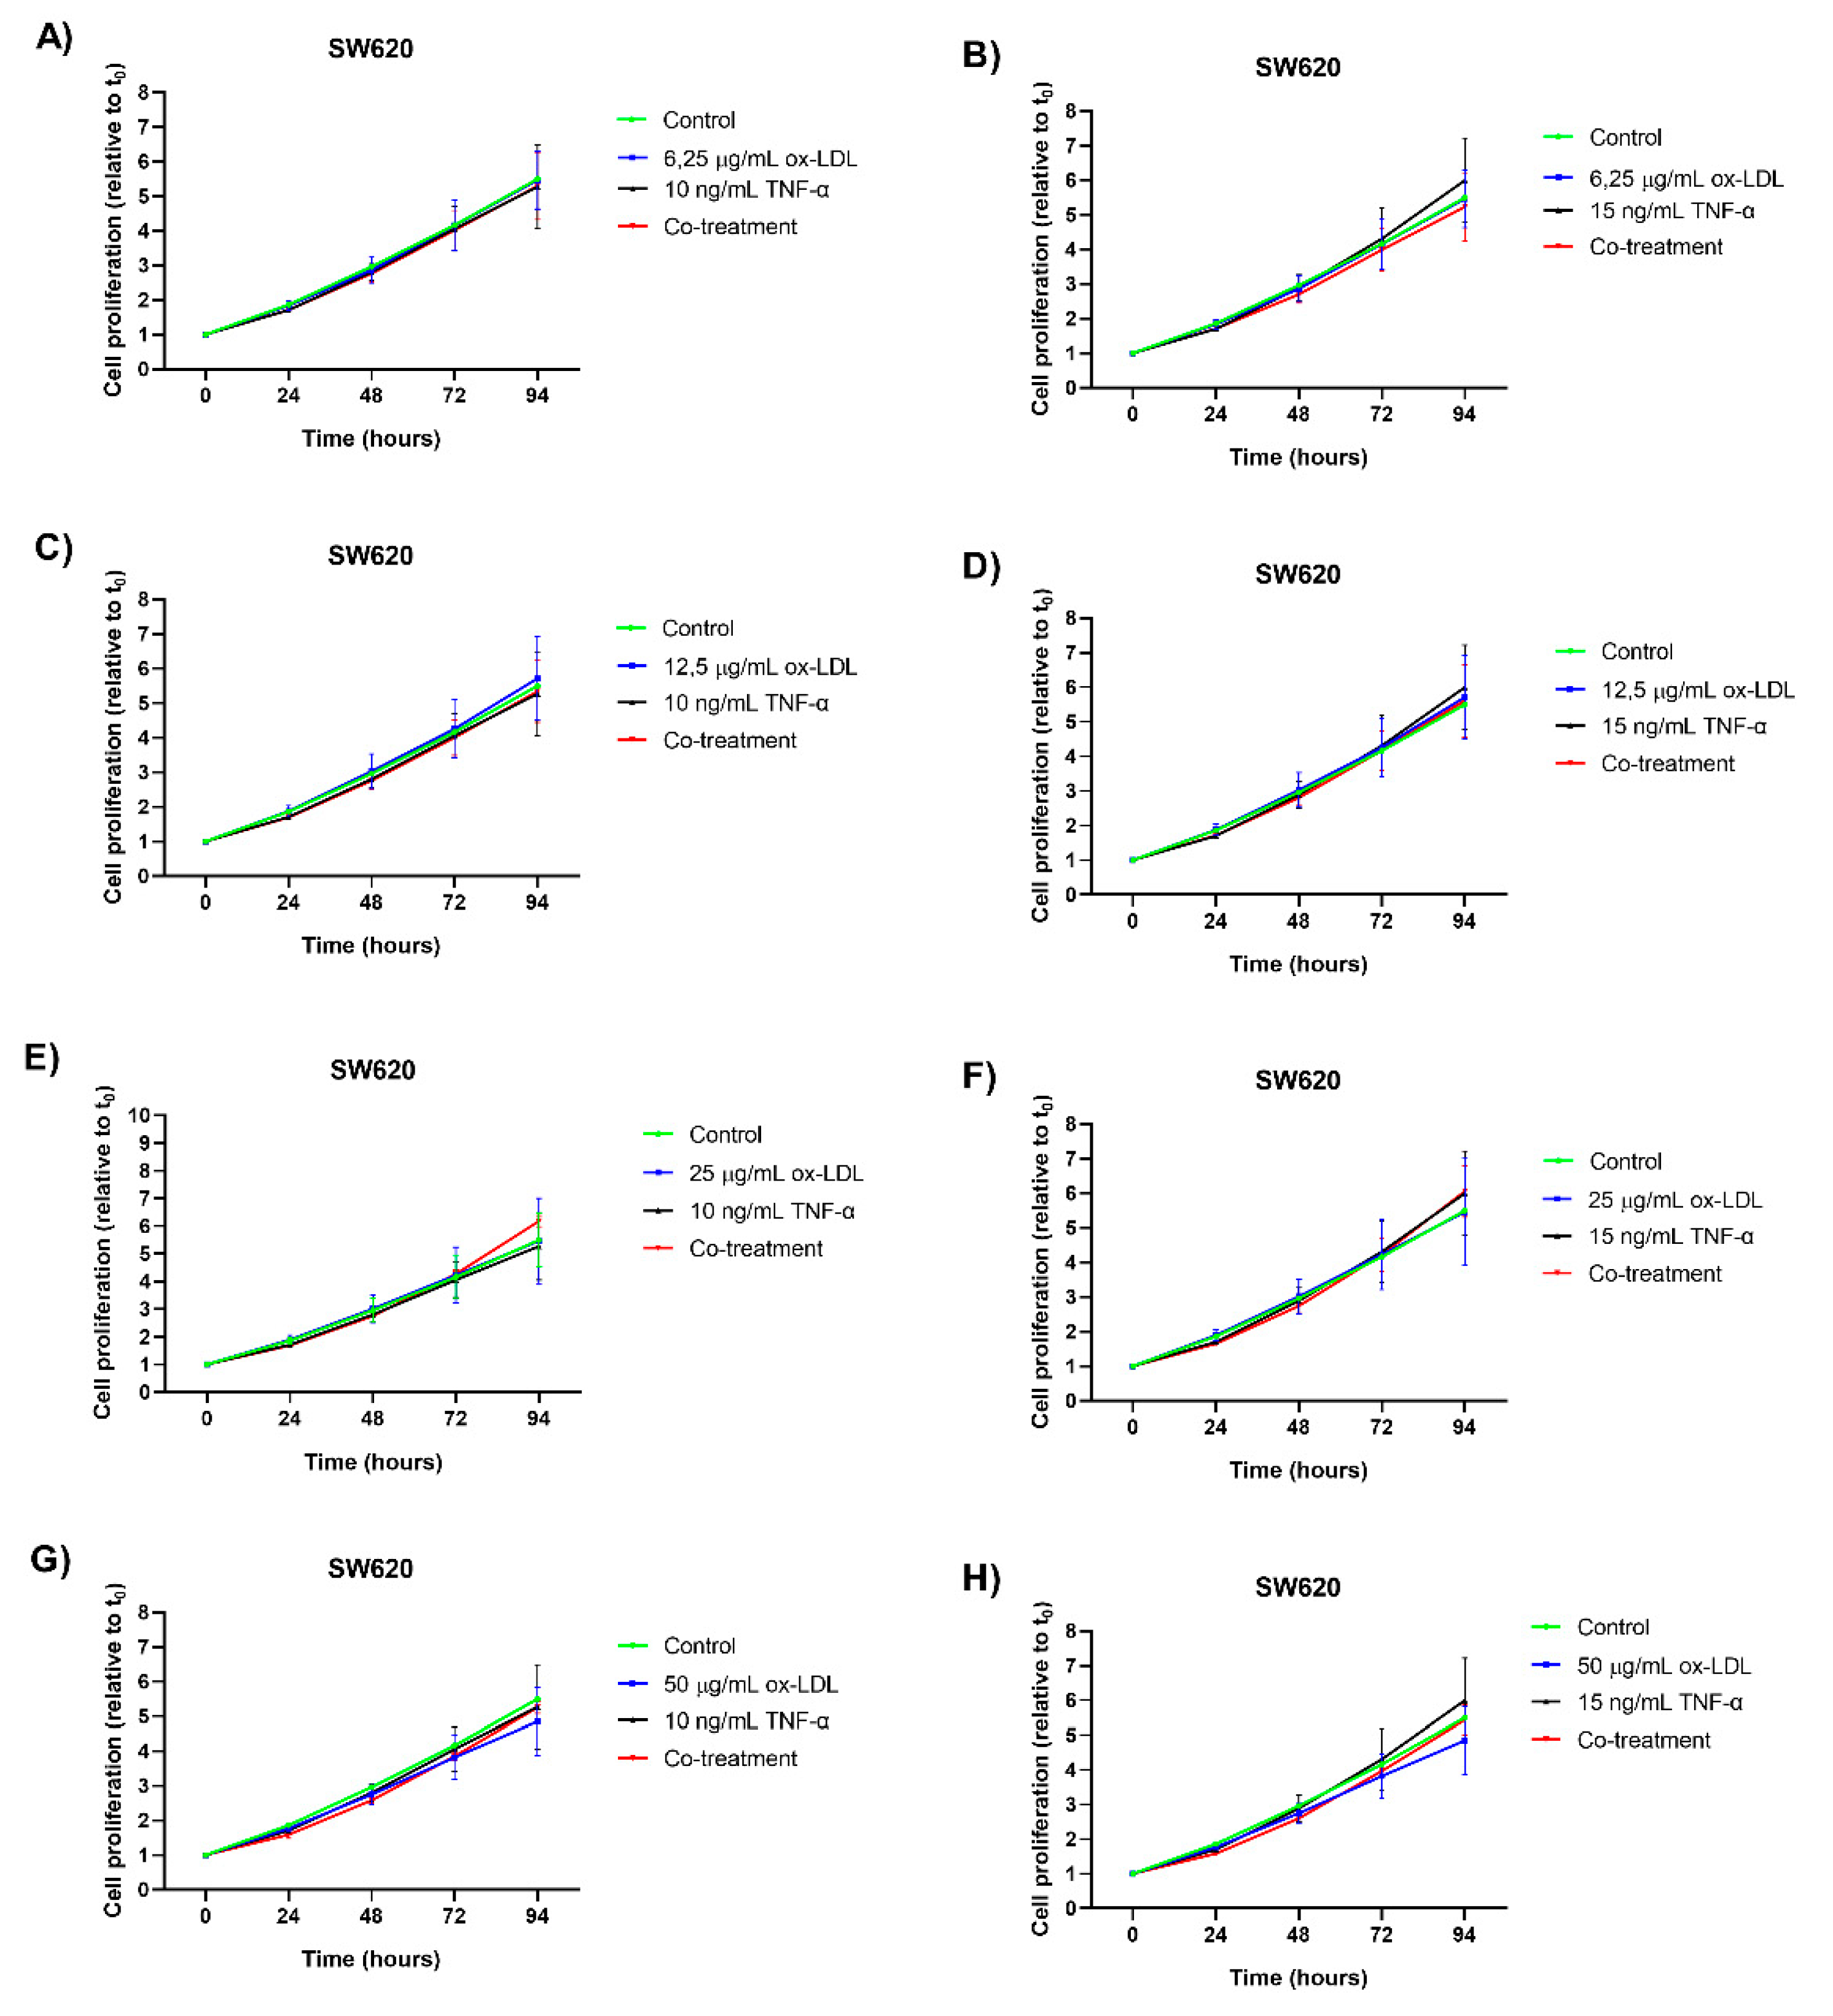
Figure 3.
Cell growth of colorectal cancer cell lines observed using Incucyte. Micrographs of colorectal cancer cell lines, 10× magnification at 0 and 94 hours; scale bar: 1.25 μm. Cells were treated with oxidized LDL, TNF-α, and co-treatments.
Figure 3.
Cell growth of colorectal cancer cell lines observed using Incucyte. Micrographs of colorectal cancer cell lines, 10× magnification at 0 and 94 hours; scale bar: 1.25 μm. Cells were treated with oxidized LDL, TNF-α, and co-treatments.
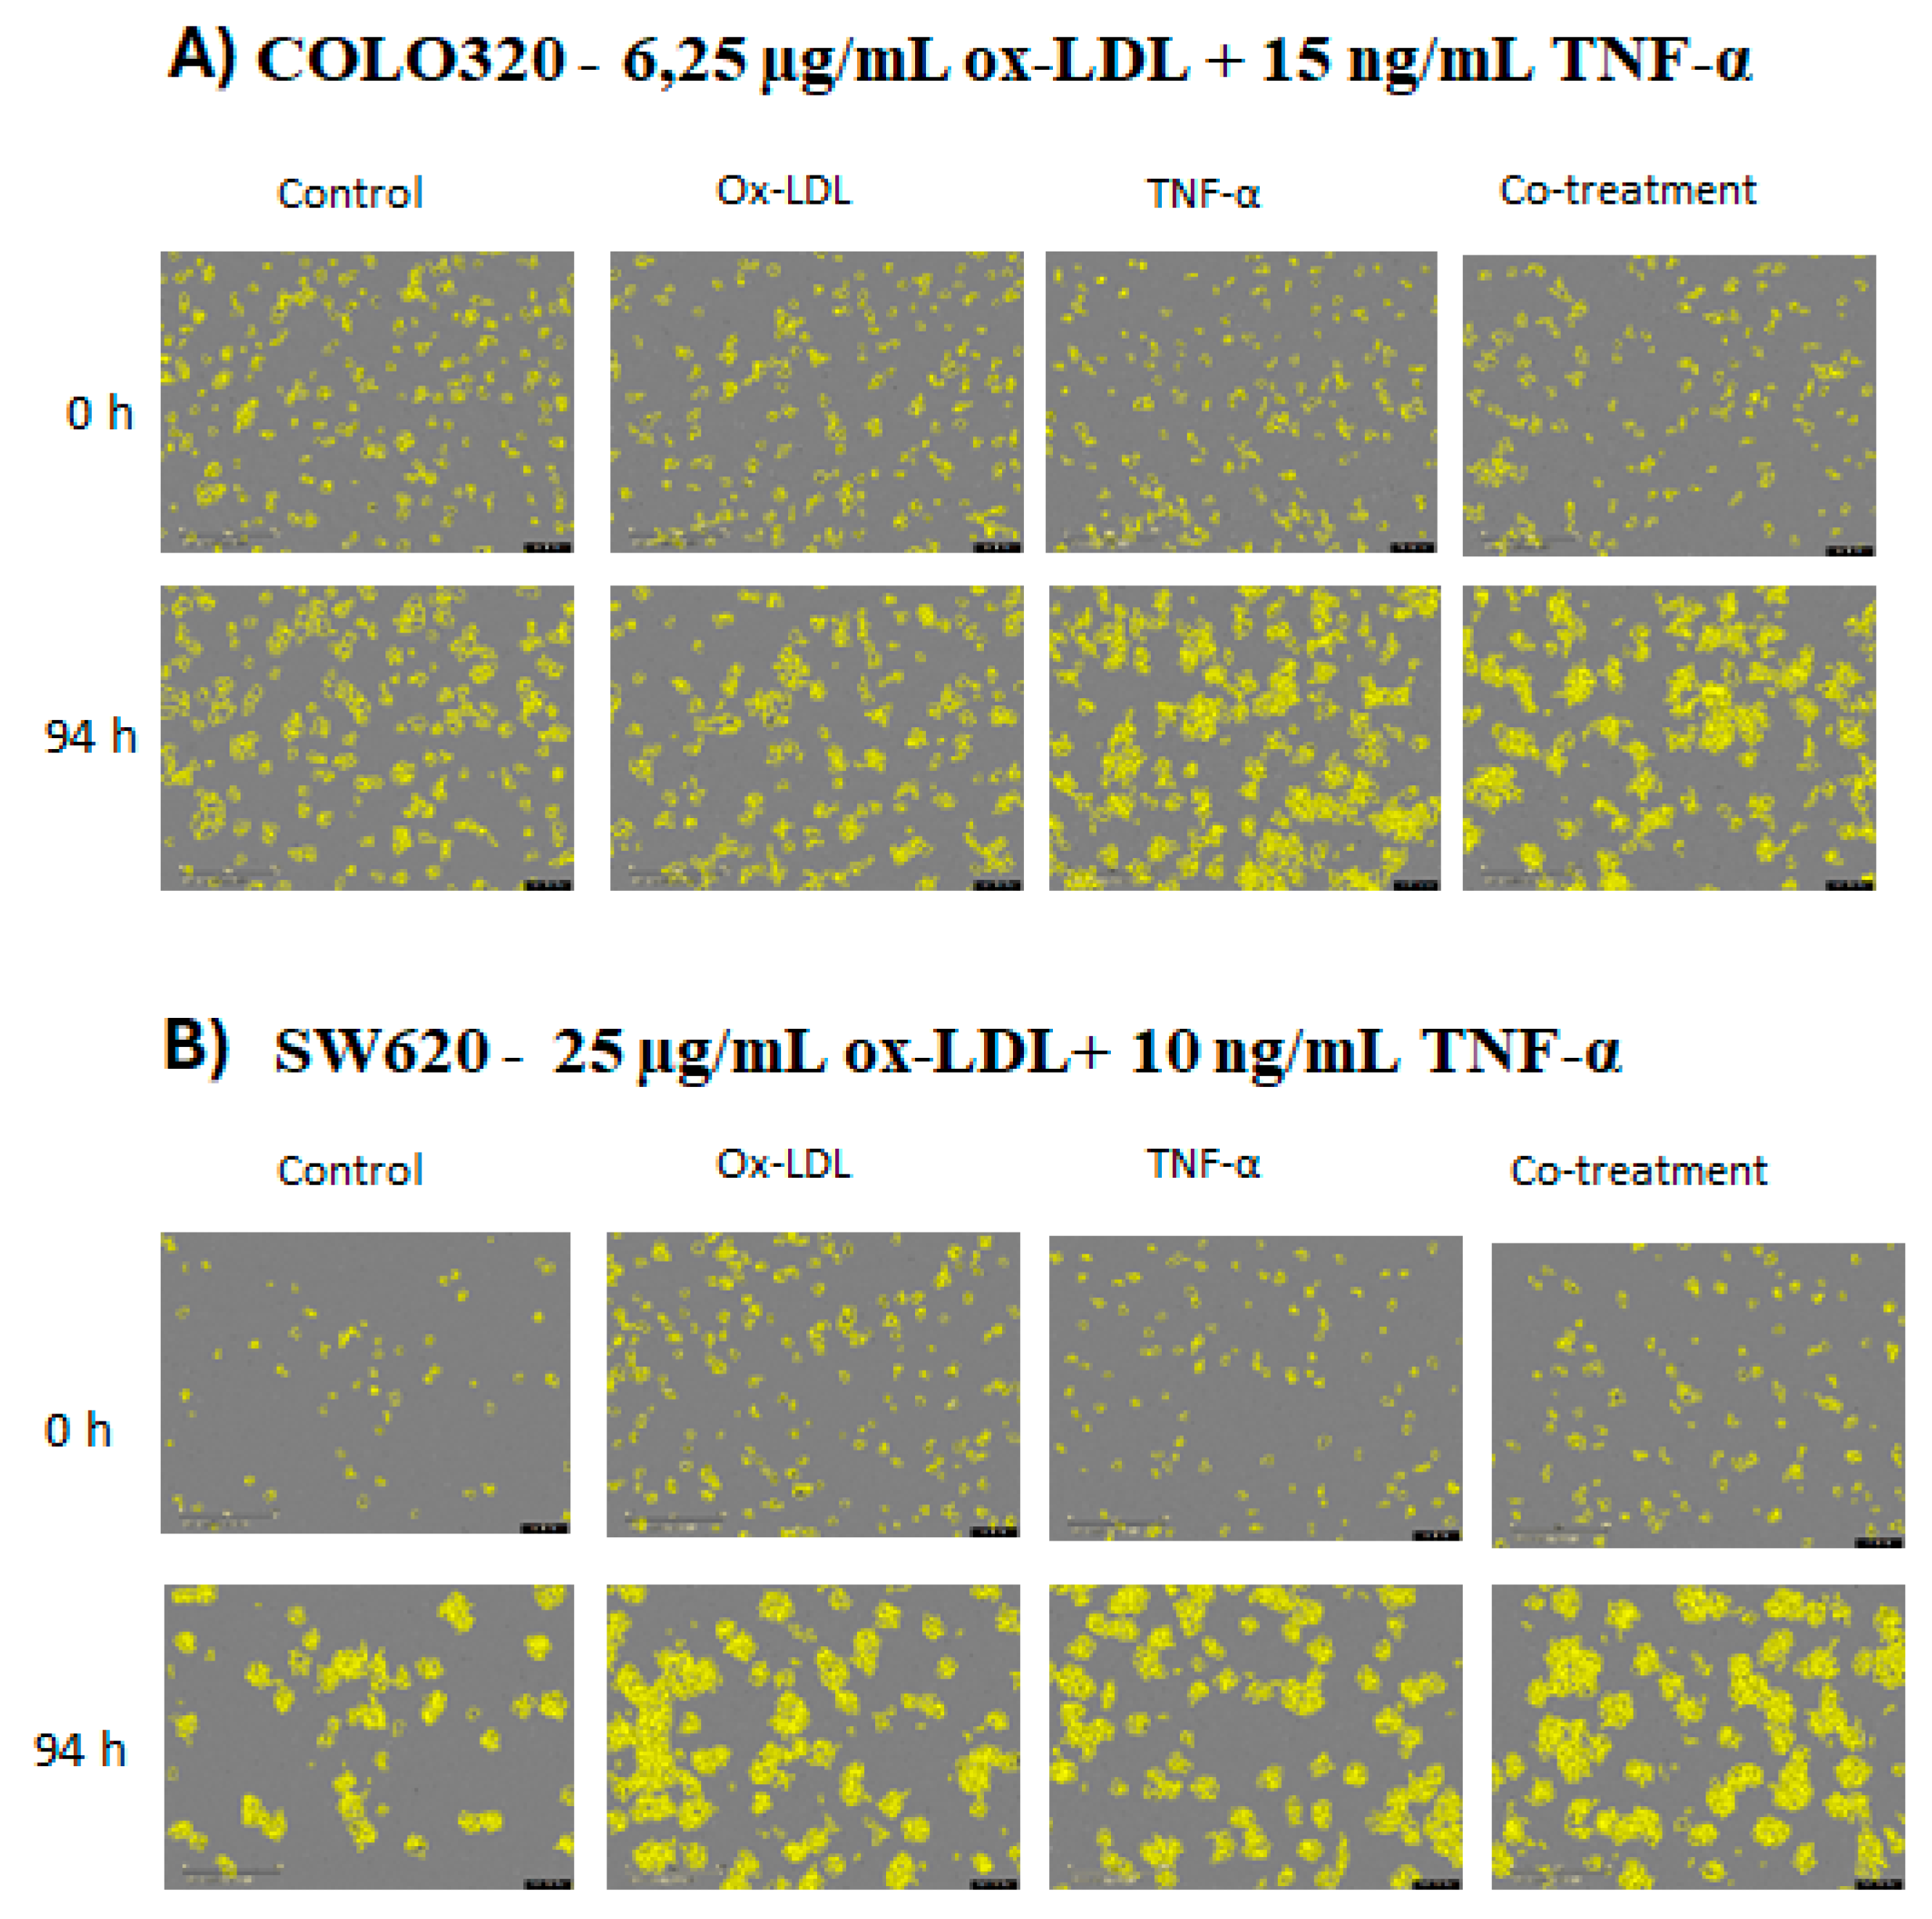
Figure 4.
Assay for measuring reactive oxygen species in cell lines (CRC). Cells were treated with ox-LDL, TNF-α, and measured at different times with the H2DCFDA probe. (A-F) correspond to the COLO320 cell line. (G-L) correspond to the SW620 cell line. The bars represent the mean ± SD, n=9. One-way ANOVA test and Tukey’s multiple comparison test and Kruskal-Wallis test and Dunn’s multiple comparison test. Significance is indicated with * p<0.05, ** p<0.01, *** p<0.001, and **** p<0.0001.
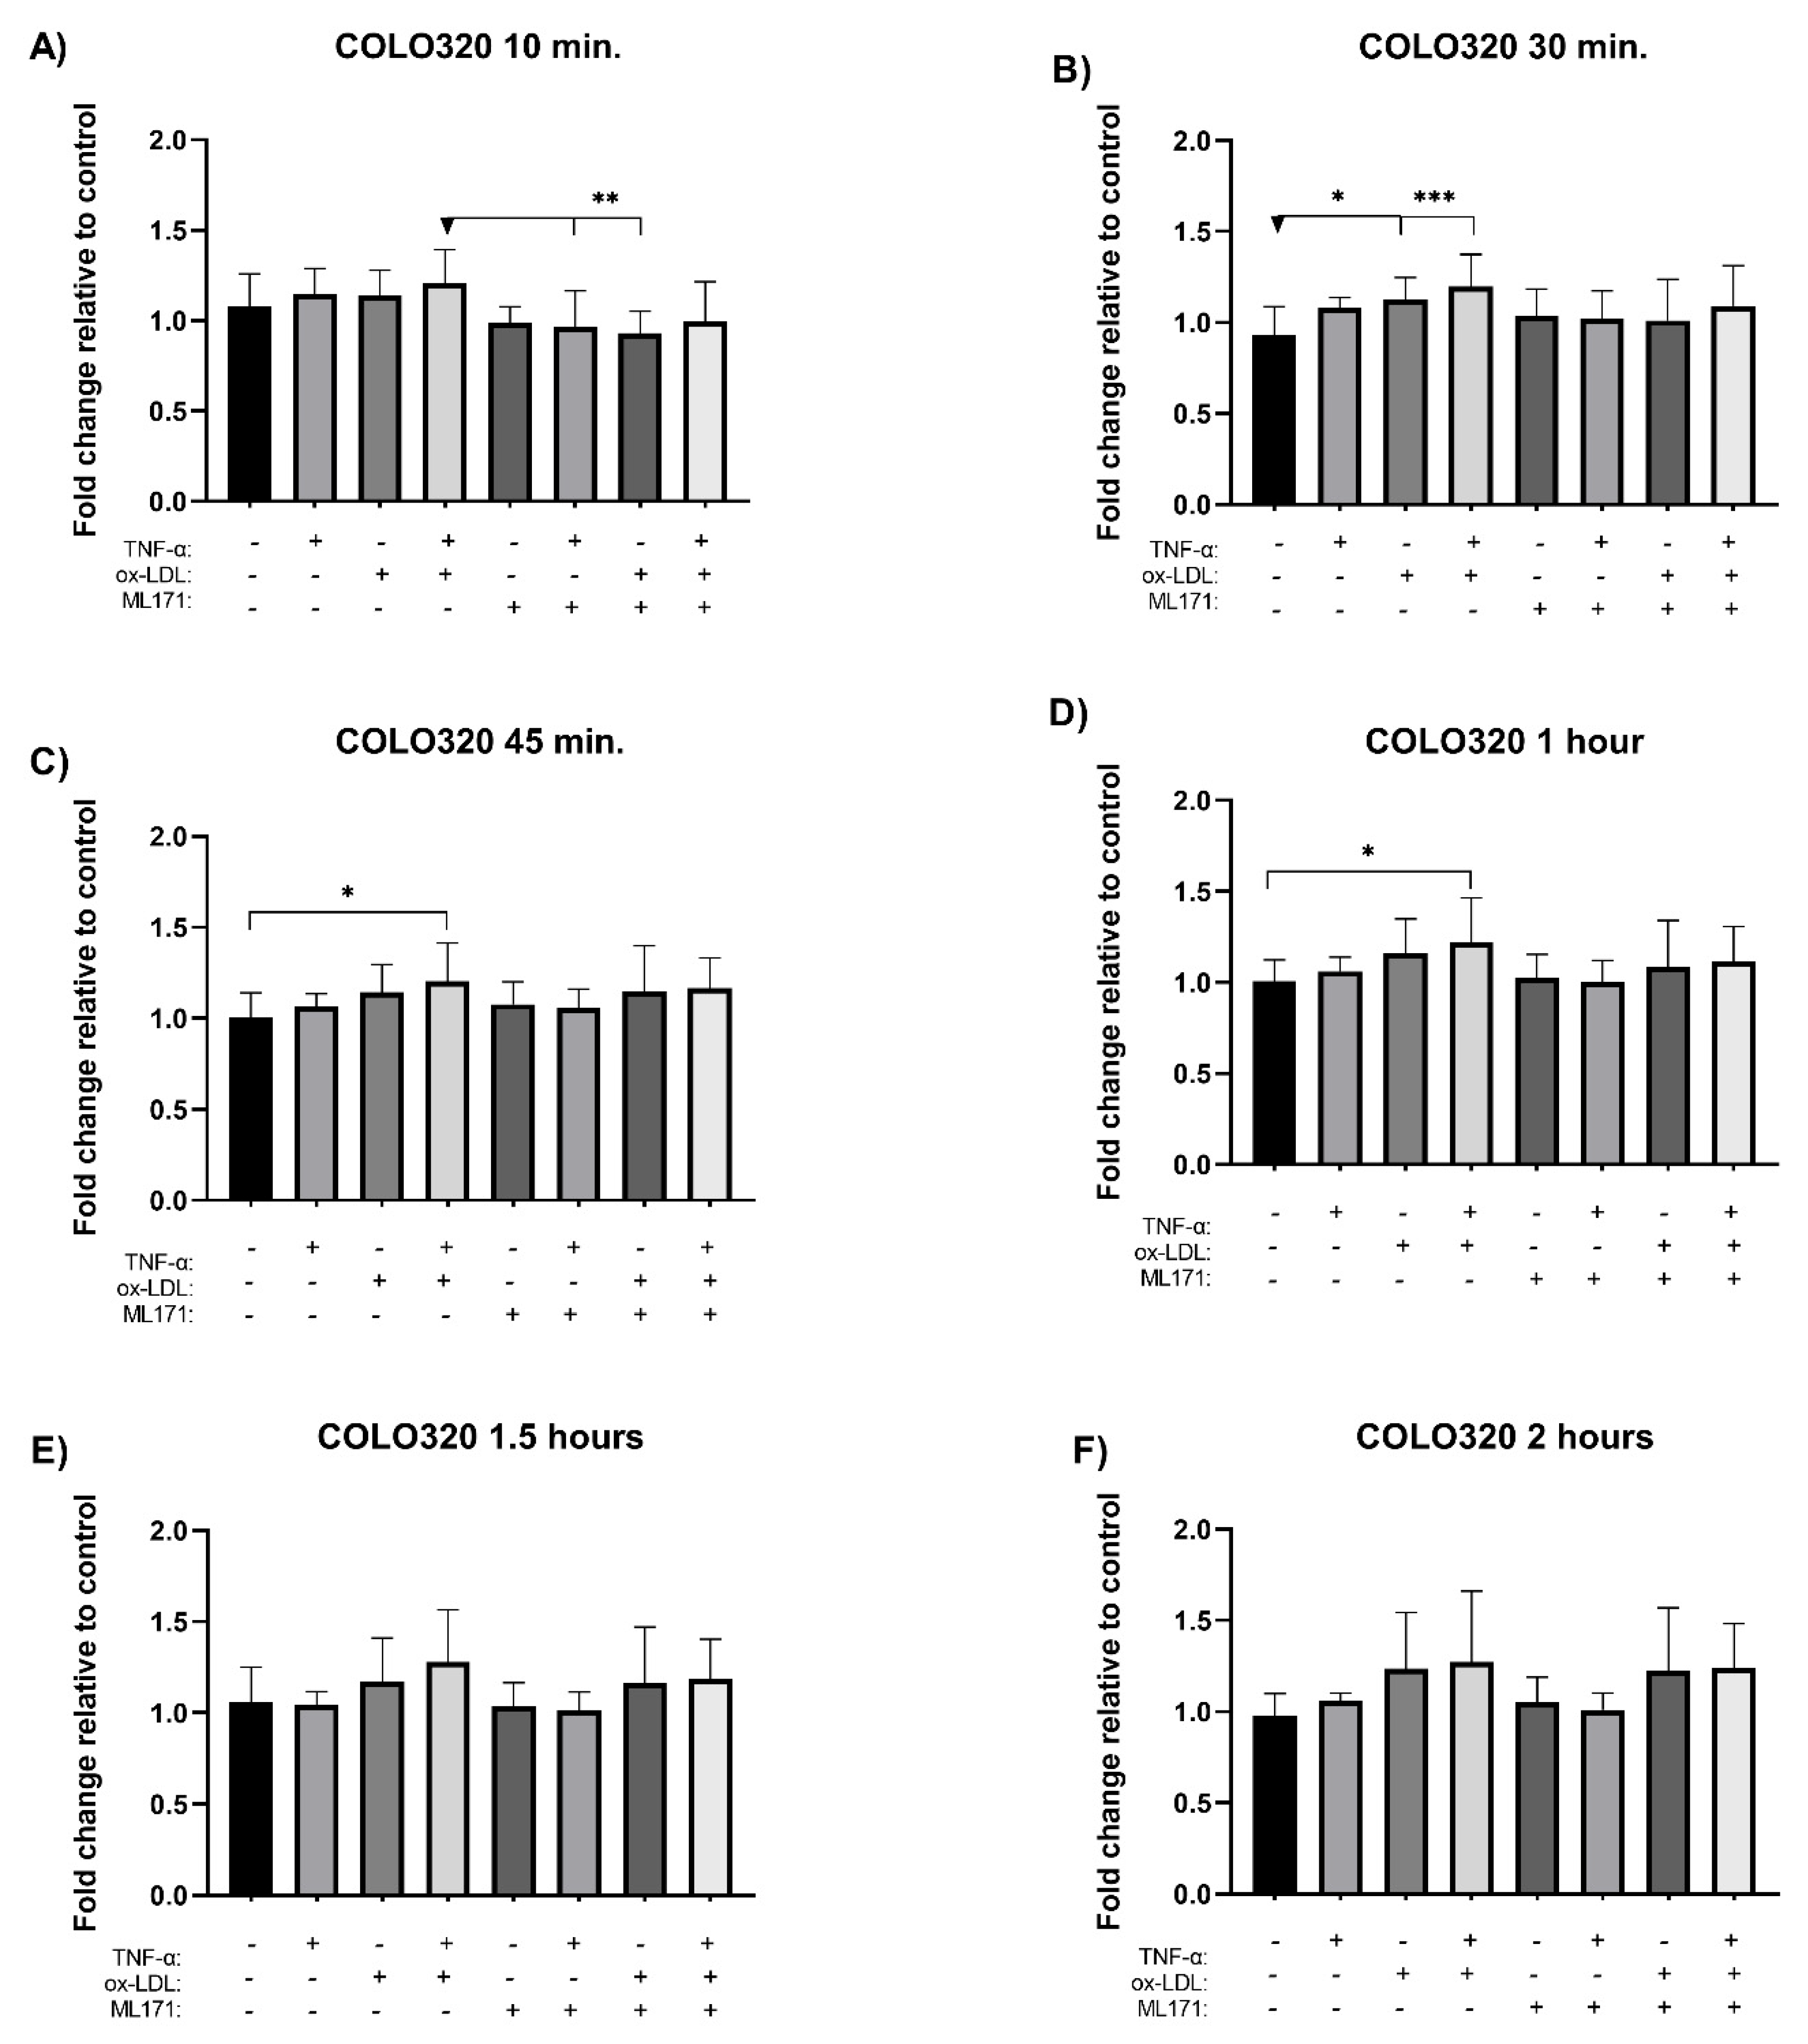
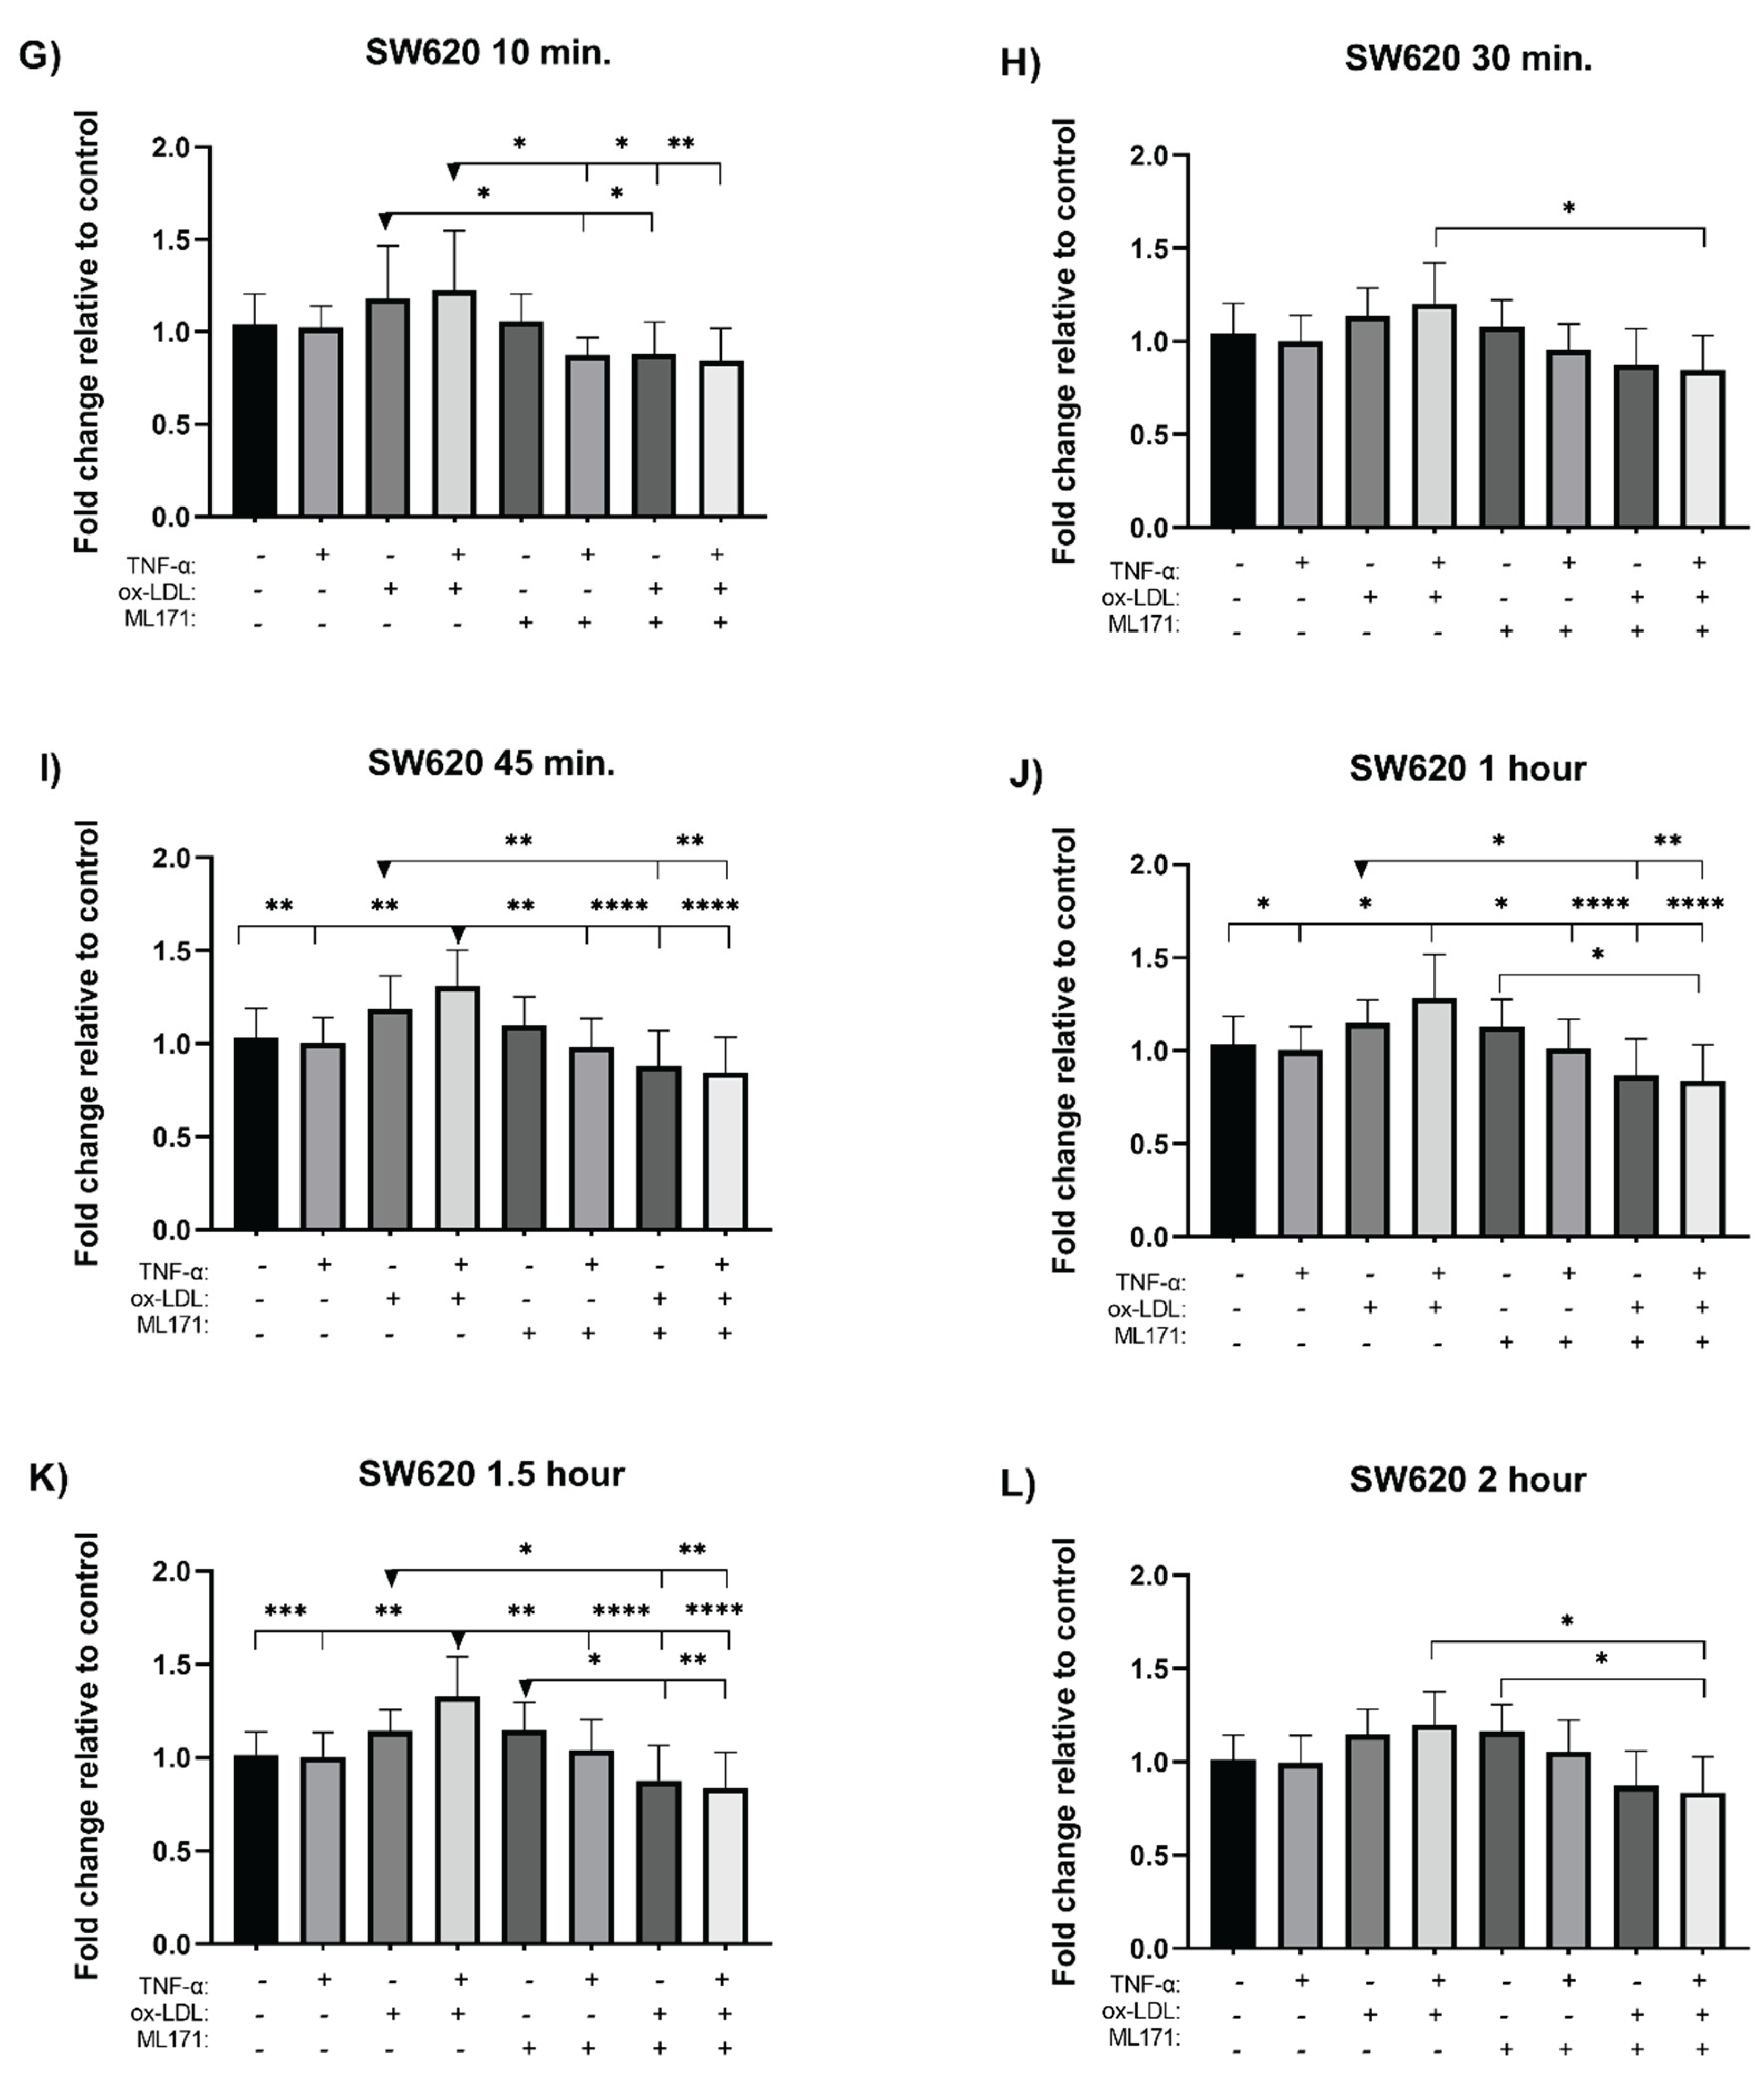
Figure 5.
Effect of inhibitors on signaling pathways in the cell viability of COLO320 and SW620. Cells were treated with 6.25 μg/ml ox-LDL and 15 ng/ml TNF-α for COLO320 and 25 μg/ml ox-LDL and 10 ng/ml TNF-α, Copanlisib inhibitor at 30 μM, and LF3 inhibitor at 10 nM. Each condition was tested in triplicate. Bars represent mean ± SD, n=2. One-way ANOVA and Tukey’s multiple comparison test. Significance is indicated by * p<0.05, ** p<0.01, *** p<0.001, and **** p<0.0001.
Disclaimer/Publisher’s Note: The statements, opinions and data contained in all publications are solely those of the individual author(s) and contributor(s) and not of MDPI and/or the editor(s). MDPI and/or the editor(s) disclaim responsibility for any injury to people or property resulting from any ideas, methods, instructions or products referred to in the content. |
© 2025 by the authors. Licensee MDPI, Basel, Switzerland. This article is an open access article distributed under the terms and conditions of the Creative Commons Attribution (CC BY) license (http://creativecommons.org/licenses/by/4.0/).
Copyright: This open access article is published under a Creative Commons CC BY 4.0 license, which permit the free download, distribution, and reuse, provided that the author and preprint are cited in any reuse.


