
Submitted:
31 July 2025
Posted:
01 August 2025
You are already at the latest version
Abstract
This study investigates the influence of key technological parameters—including marking speed, raster step (Δx), pulse duration, power density, and effective energy—on the laser marking of copper samples using Yb-doped fiber and CuBr MOPA lasers. The experiments were conducted in two groups: the first used pulse durations of 100 ns and 200 ns with the fiber laser, and the second employed 30 ns pulses with the copper bromide laser. The marking speed was varied from 10 mm/s to 80 mm/s. The raster step Δx ranged from 3 µm to 20 µm for the fiber laser and from 3 µm to 27 µm for the CuBr laser. The results are compared across different pulse durations of the fiber laser, and the influence of the laser wavelengths on the marking process is examined. Optimal ranges of effective energy for raster marking were identified: for the Yb-doped fiber laser, the range is 17.4 – 43.1 kJ/cm², and for the CuBr laser, 9.90 – 43.1 kJ/cm².
Keywords:
laser marking
; copper
; Yb-doped fiber laser
; CuBr MOPA laser
; contrast
; speed
; raster step
; effective energy
1. Introduction
Copper is a semi-precious metal with broad and diverse industrial applications [1]. Its excellent electrical and thermal conductivity, antimicrobial properties, ease of processing, and resistance to environmental influences make it indispensable in various sectors. Research into laser marking of copper surfaces is particularly important for industries such as aeronautics, aircraft construction, medicine, and defense. Laser marking on copper and copper alloys is widely utilized due to its high precision, marking quality, and the ability to produce durable, high-contrast engravings [2,3,4].
However, copper's reflective nature - especially at infrared wavelengths commonly used in industrial lasers - poses significant challenges for researchers. Its high reflectivity and low absorption hinder efficient energy transfer. Nevertheless, by exceeding specific power density thresholds and employing ultrashort pulses (nanosecond, picosecond, or femtosecond), it is possible to achieve effective material interaction and perform ablation processes suitable for applying serial numbers, matrix codes, and other identification markings on copper components.
Among the various process parameters, marking speed plays a crucial role, as it directly determines the laser’s interaction time with the material. Numerous studies have shown that increasing the marking speed generally reduces contrast, though in some cases this relationship has been reported to be nonlinear [5,6,7]. While slower speeds can enhance marking contrast, they tend to reduce overall process efficiency. Conversely, faster marking improves productivity but may compromise contrast and mark quality [8]. Thus, achieving an optimal balance between contrast and throughput is key to process optimization.
Pulse duration is another critical factor influencing the energy delivered per pulse and the thermal effects induced on the material. Longer pulses typically transfer more energy per pulse, enabling deeper and more intense markings, whereas shorter pulses reduce the heat-affected zone and produce finer, higher-contrast features. Žemaitis [9] investigated pulse durations ranging from 210 femtoseconds to 10 picoseconds and found that shorter pulses yielded superior contrast due to minimized thermal diffusion. In that study, a solid-state laser emitting at 1030 nm and operating at a 64.5 MHz pulse repetition rate was used.
In related work, Husinski et al. [10] explored the effects of pulse duration on the ablation threshold and incubation coefficient for three materials: copper (metal), silicon (semiconductor), and gelatin (biopolymer). Using a Ti:sapphire laser system with pulse durations of 10, 30, 250, and 550 fs, they demonstrated that shorter pulses consistently reduced the ablation threshold across all materials tested.
Mustafa et al. further confirmed that longer pulses (241 ns to 350 fs range) increase energy penetration and ablation depth but degrade surface quality. Their results indicate that shorter pulses result in smoother edges and higher contrast - a trend that is extendable to copper marking. While nanosecond pulses offer deeper penetration, picosecond and femtosecond pulses ensure finer surface resolution, albeit at potentially lower efficiency [11].
Additional studies have focused on the formation of surface microstructures during laser marking of copper, highlighting the influence of speed, fluence, and pulse count [12]. The role of laser parameters in optimizing contrast and surface texture during Nd:YAG laser marking of Data Matrix codes has also been examined [13]. A numerical simulation of laser-induced heating in metals by Tatarinov et al. [14] established correlations between temperature, intensity, and exposure duration, providing foundational insights into mechanisms of melting vs. vaporization-based marking.
Although many studies focus on copper, insights from other materials are also relevant. For example, [15] investigates color laser marking of steel using fiber lasers and finds a correlation between marking speed, defocus, and surface coloration. Evaluation methods for matrix code quality under varying process conditions are described in [16].
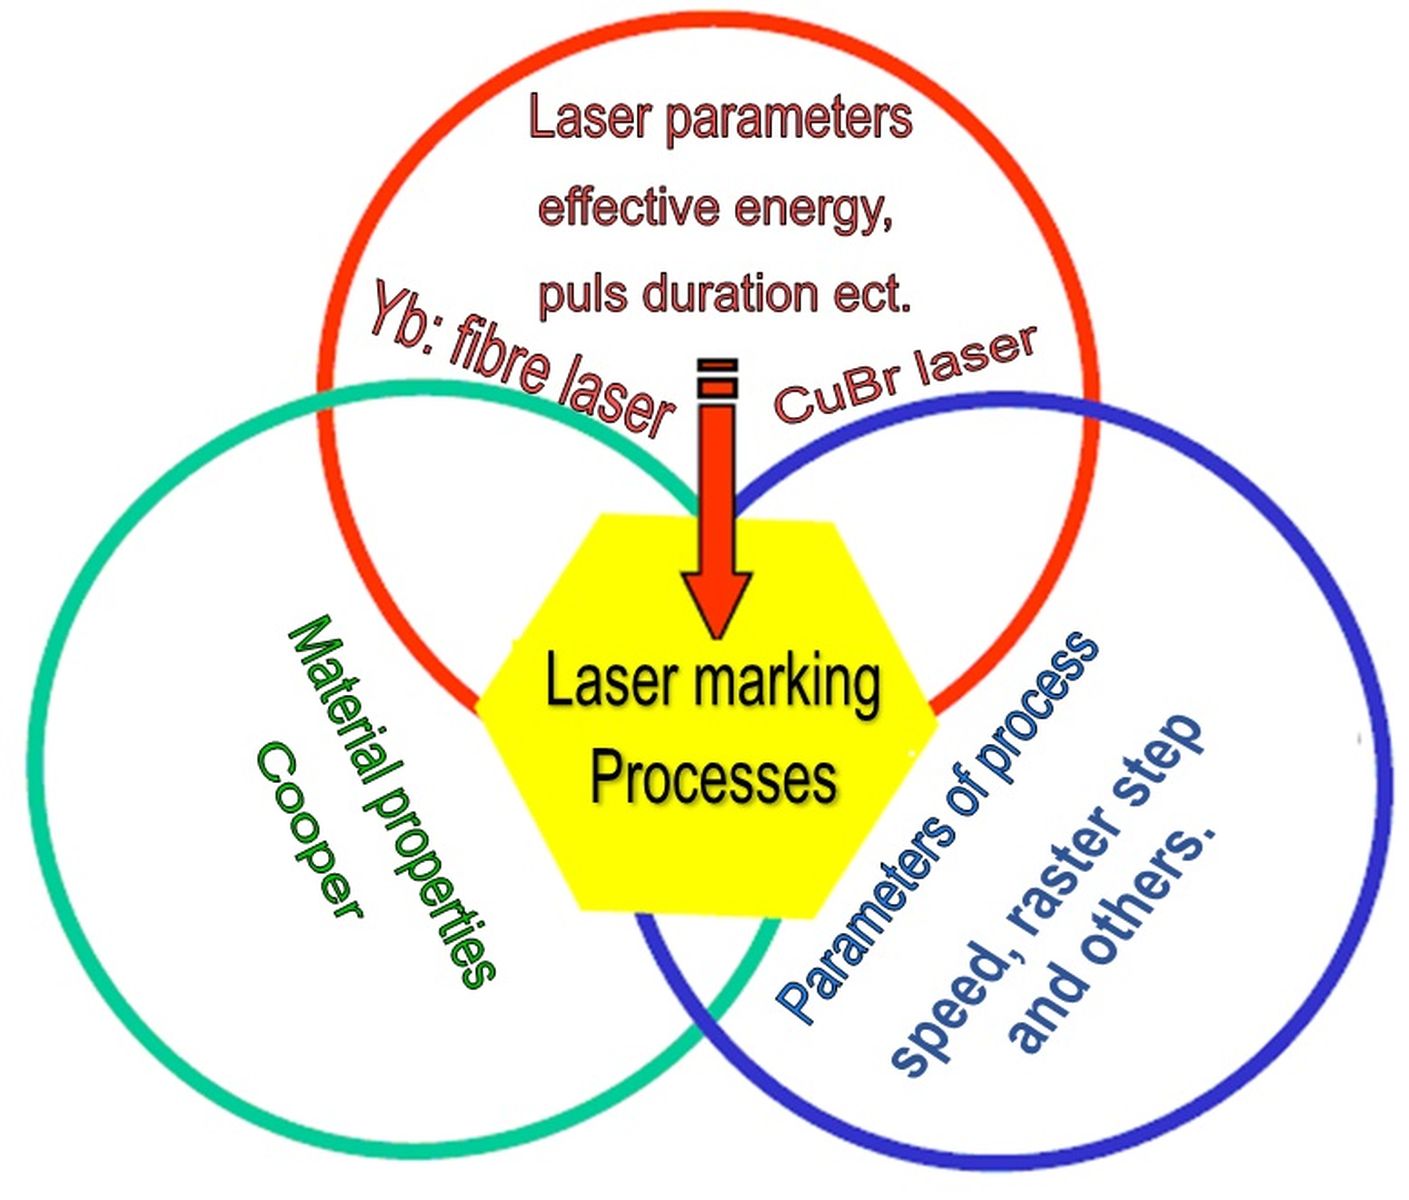
Overall, the factors influencing laser marking contrast can be grouped into three main categories [17]:
- Material properties: optical and thermo-physical characteristics;
- Laser parameters: wavelength, power density, pulse energy, pulse duration, and pulse frequency;
- Process parameters: marking speed, raster step Δx, defocus, and number of repetitions.
Despite substantial progress, many aspects of laser marking on copper remain underexplored. Each application - depending on component geometry, laser type, and functional requirements - requires tailored optimization through pilot studies.
The main objective of this study is to investigate the influence of key technological parameters - specifically marking speed v, raster step Δx, pulse duration τ, and effective energy Eeff - on the quality and contrast of laser markings on copper surfaces, with applications in aerospace, medicine, aircraft construction, and defense technologies.
2. Materials, Equipment and Methodology
2.1. Subsection
The experiments were done on Cu-ETP copper samples. It is used for current conductors, rolled products and high-quality tin-free bronzes; for the manufacture of products of cryogenic technology; for the manufacture of wire and rods for automatic welding in an inert gas environment, submerged arc and gas welding of non-critical structures made of copper, as well as the manufacture of electrodes for welding copper and cast iron [18]. The chemical composition is given in Table 1, and some basic parameters are presented in Table 2. The small amount of impurities in the material is impressive (the copper content is over 99.9 %). Copper Cu-ETP has very high coefficients of thermal conductivity and thermal diffusivity.

Table 1.
Chemical composition of copper Cu-ETP [20].
Table 1.
Chemical composition of copper Cu-ETP [20].
| Chemical Element | Content, % |
|---|---|
| Fe | 0.005 |
| Ni | 0.002 |
| S | 0.004 |
| As | 0.002 |
| Pb | 0.005 |
| Zn | 0.004 |
| O | 0.05 |
| Sn | 0.002 |
| Bi | 0.001 |
| Cu | Balance |
Table 2.
Main parameters of copper Cu-ETP.
| Parameter | Value |
|---|---|
| Coefficients of thermal conductivity k, W/(m.K) | 387 |
| Density ρ, kg/m3 | 0.002 |
| Specific heat capacity c, J/(kg.K) | 8940 |
| Coefficients of thermal diffusivity a, m2/s | 1.11 × 10⁻⁴ |
2.2. Laser Systems
Photographs in Figure 1 are the laser technological systems with a fiber laser and a CuBr laser were used to conduct the experiments. And Table 3 lists the important parameters of the Rofin Power Line F 20 Varia Yb fiber [19] and Copper-Bromide (CuBr) MOPA [20] laser system. Fiber laser F 20 Varia operates in the near infrared region and is a modern laser with very good beam quality and efficiency. Whereas the CuBr laser operates in the visible region with wavelengths of λ= 511 and 578 nm, but has a small working spot diameter at the focus with good laser beam quality and high pulse energy.
Figure 1.
Views of laser systems with a) Rofin Power Line F 20 Varia Yb-doped fibre laser [Latvia]; b) CuBr MOPA laser [Bulgaria].
Figure 1.
Views of laser systems with a) Rofin Power Line F 20 Varia Yb-doped fibre laser [Latvia]; b) CuBr MOPA laser [Bulgaria].
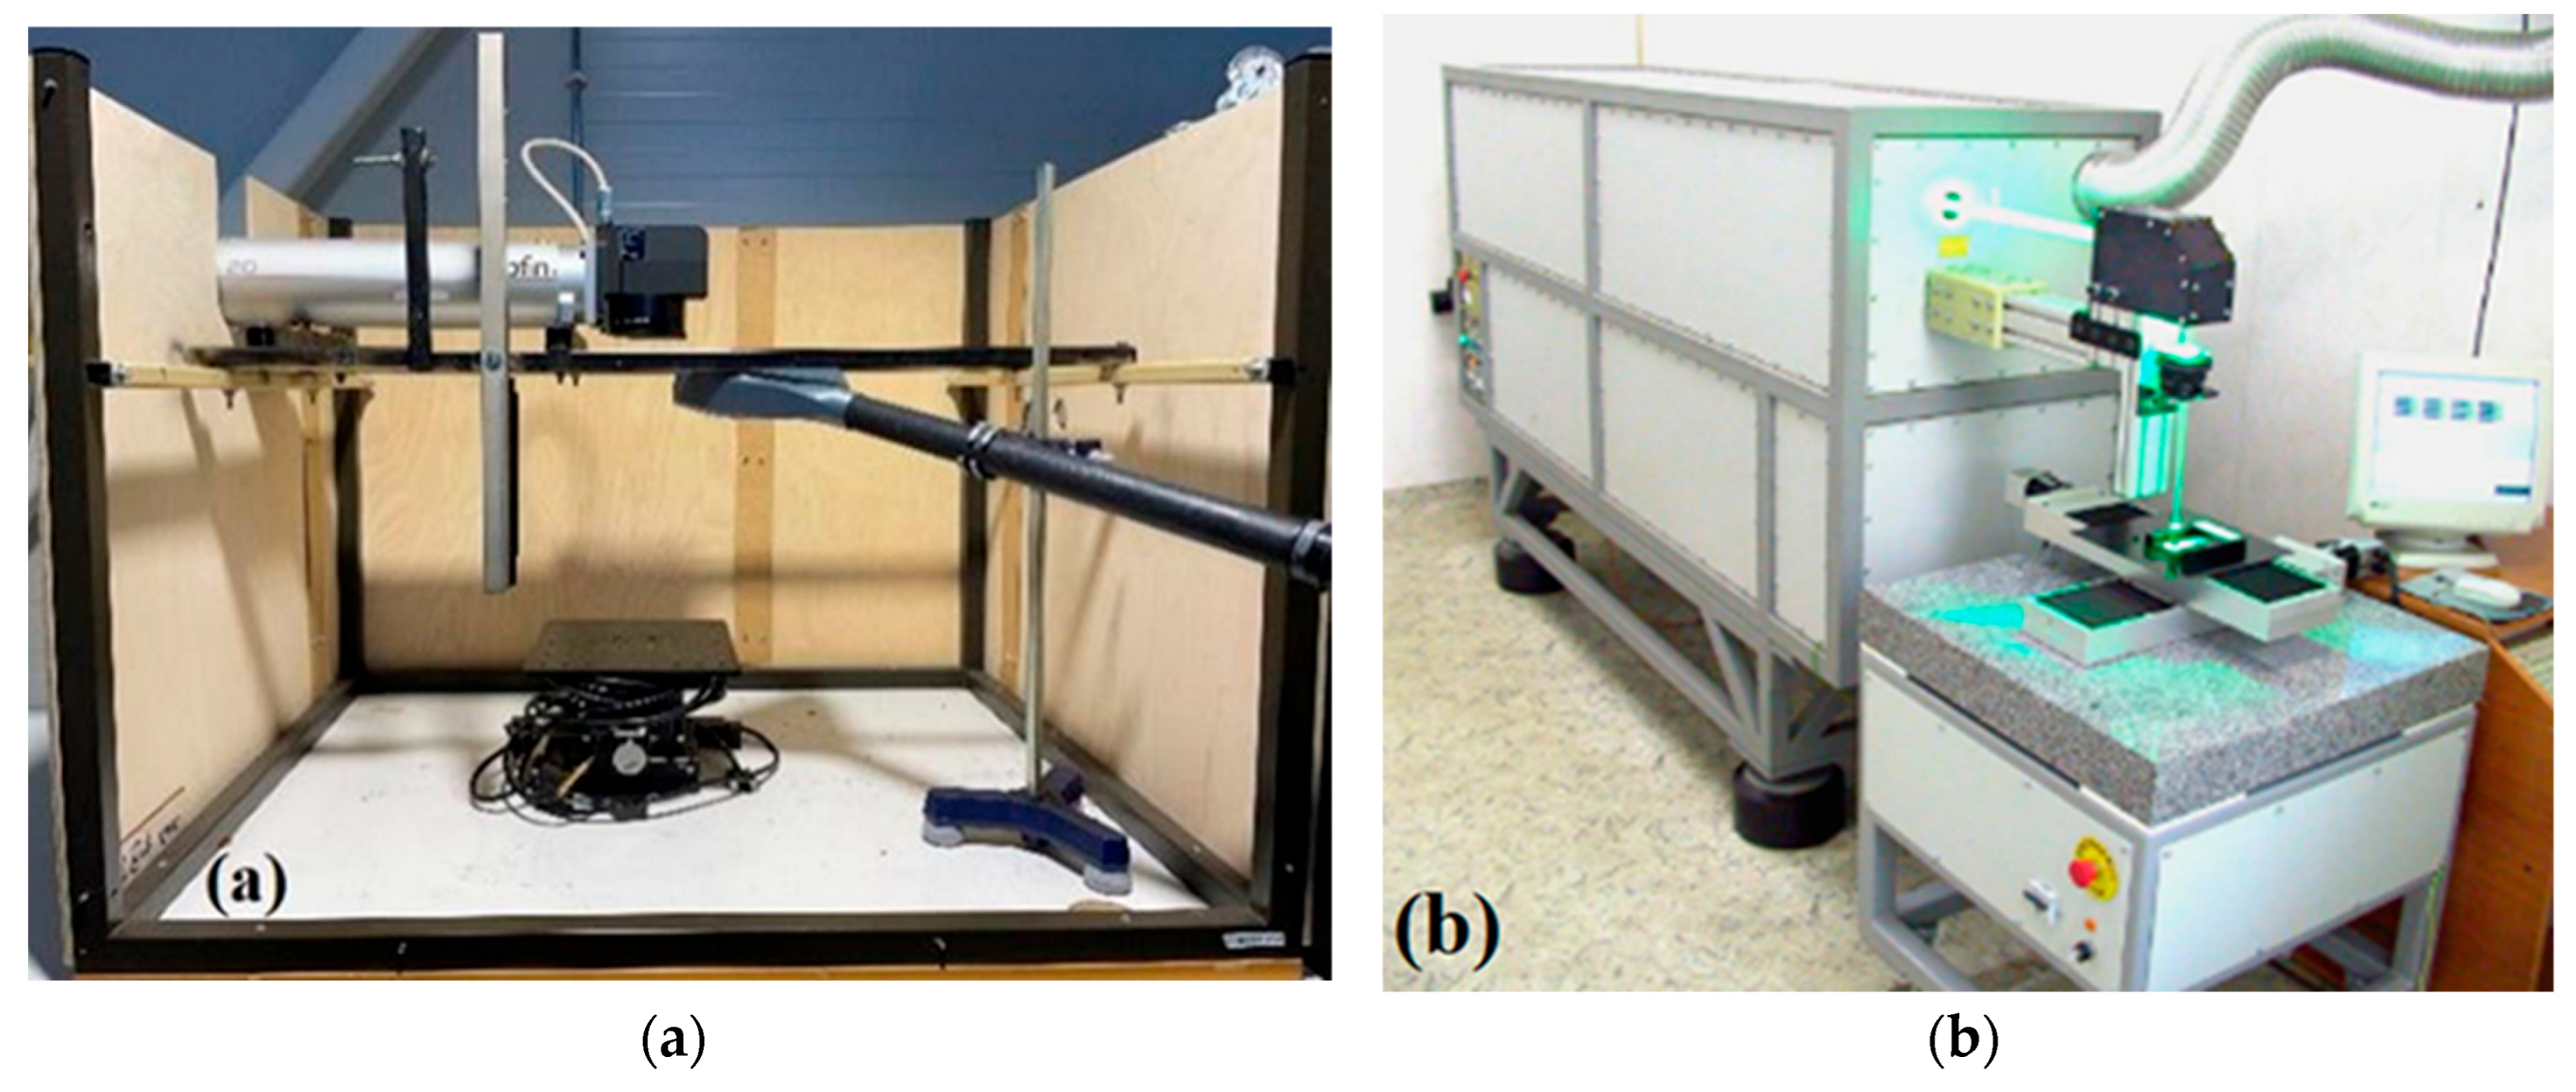
Table 3.
Parameters of laser systems used in the research.
| Laser Parameter | Fiber laser | CuBr laser |
|---|---|---|
| Wavelength λ, nm | 1030 | 511 & 578 |
| Power P, W | 20 | 10 |
| Diameter in focus d, µm | 30 | 30 |
| Frequency ν, kHz | 20 - 200 | 20 |
| Pulse duration τ, ns | 4 - 200 | 30 |
| Pulse energy Ep, mJ | 0.1 – 1.0 | 0.5 |
| Beam quality M2 | 1.1 | 1.5 |
| Efficiency, % | 40 | 20 |
2.3. Laser Microscope
To determine the change of surface structure after laser marking and used 3D measuring laser microscope OLS5000 is equipped with 2 types of optical systems: color imaging optical system and laser confocal optical system. Through the optical system, the surface microstructure is observed. Through the laser confocal optical system, the surface is scanned, determining the surface roughness and topography of the studied area. For the purpose of surface analysis, an optical magnification of 451x was used, and the studied area has dimensions of 645 µm x 645 µm.
2.4. Methodology
To achieve the objective, the following tasks are performed:
1) Influence of speed on contrast in fiber laser marking at 100 ns pulse duration.
2) Influence of speed on contrast in fiber laser marking at 200 ns pulse duration.
3) Influence of raster step on contrast in fiber laser marking.
4) Influence of raster step on contrast in CuBr laser marking.
5) Influence of effective energy on contrast for both lasers.
To conduct the experimental studies, the following steps were taken:
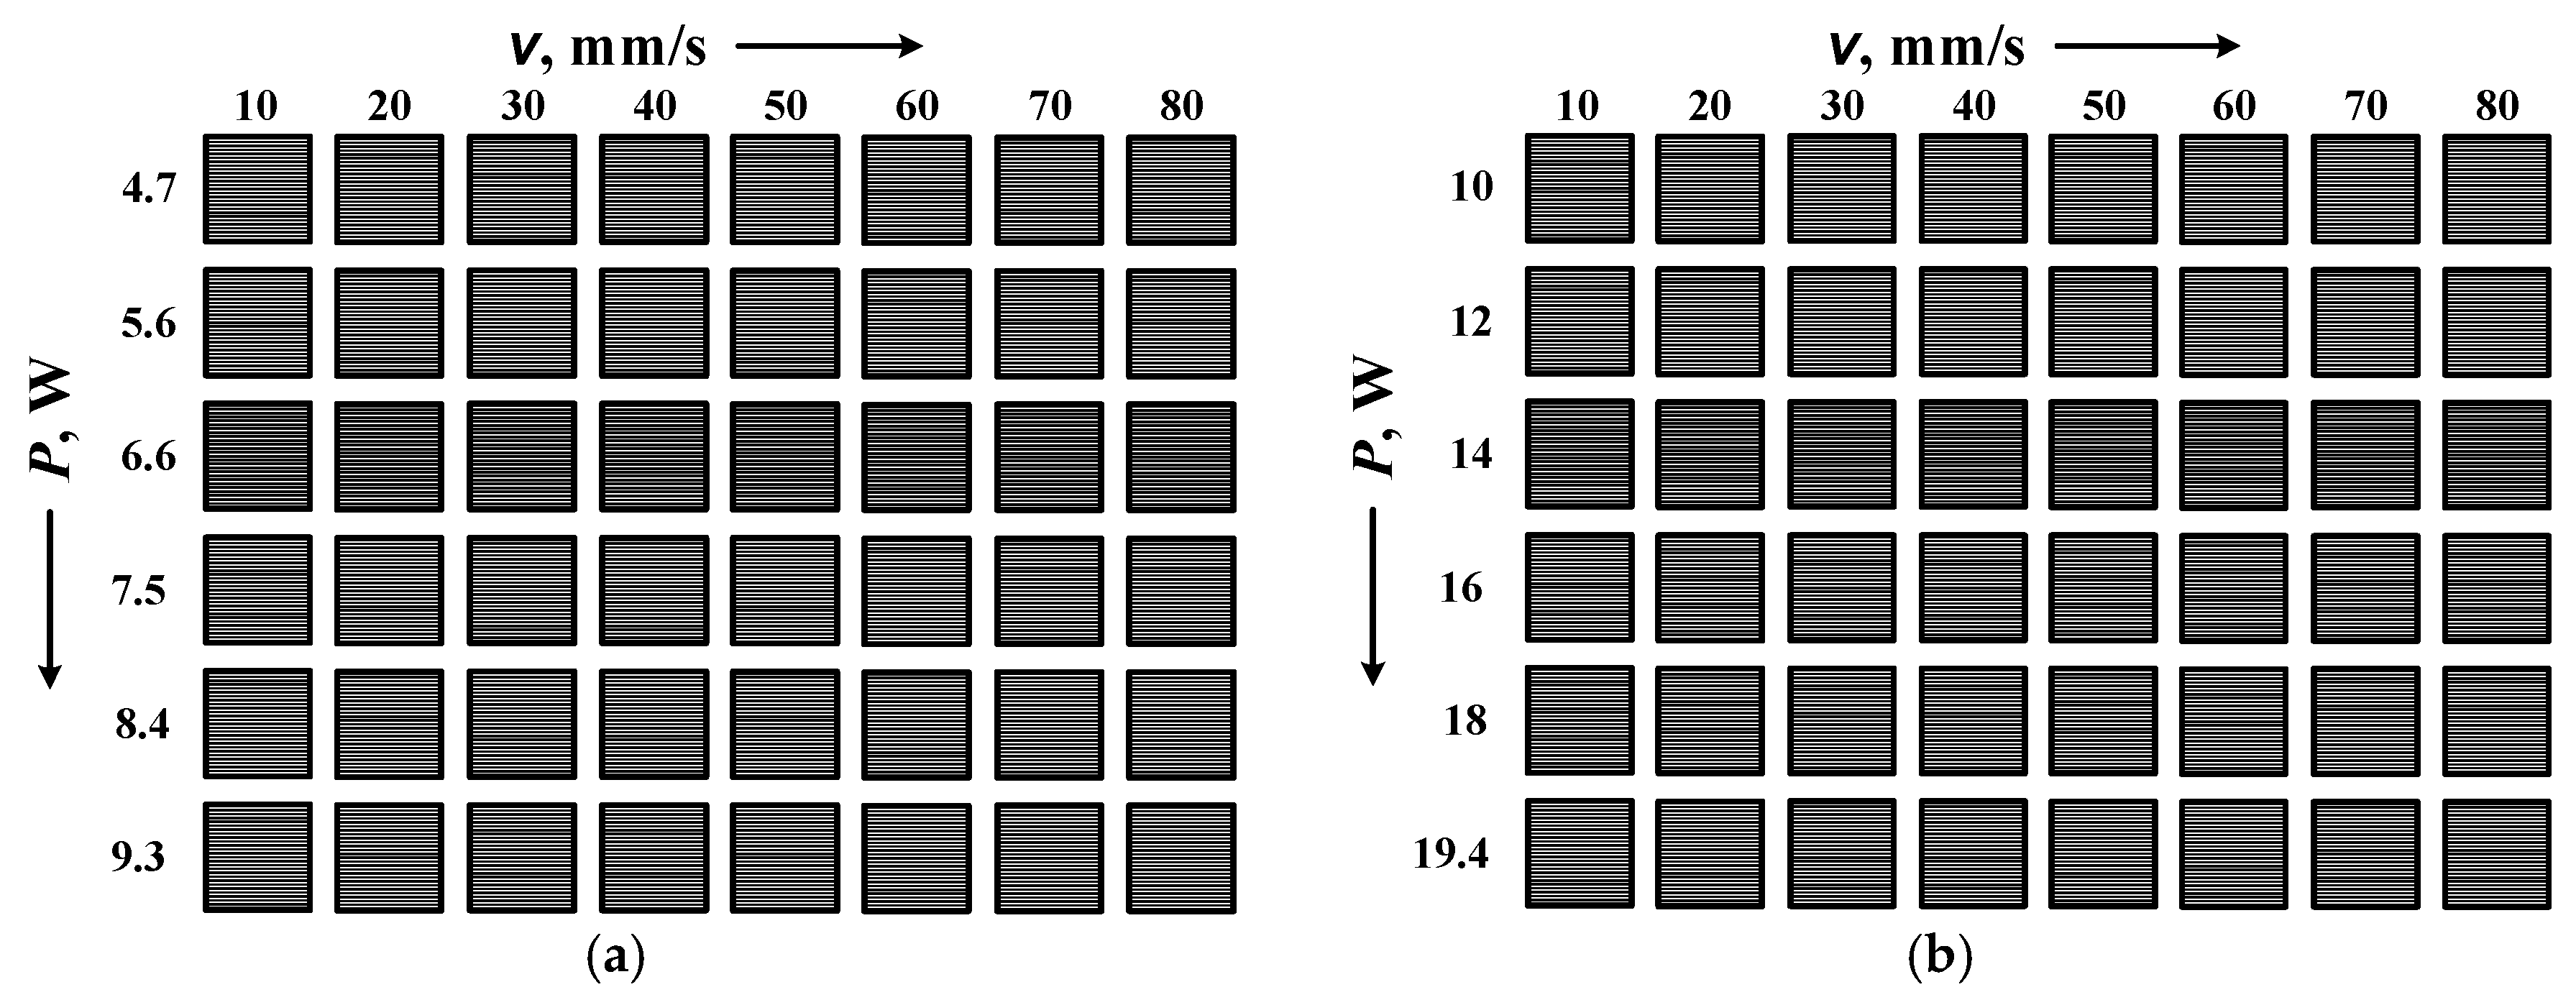
According to the set tasks, four matrices were designed. The three matrices are for the experiments with the fiber laser and contain 6 rows with 8 squares each. The first two of these are to study the dependence of the contrast on the rate for two pulse durations 100 ns and 200 ns and 6 powers that are different depending on the pulse duration. The third of them is for the study of the dependence of contrast on the raster step Δx for the faber laser at a pulse duration of 100 ns and 6 speeds. It has 6 rows of 8 squares. The fourth matrix is for the CuBr laser experiments and contains 6 rows of 6 squares. It is for studying the dependence of the contrast on the raster step Δx at a pulse duration of 30 ns and 6 speeds. An example designed matrix is given in Figure 2 to carry out tasks 1 and 2. It can be used to obtain the contrast versus velocity for two pulse durations – 100 ns (Figure 2a) and 200 ns (Figure 2b).
Figure 2.
Fiber laser marking matrix designs at pulse durations: a) 100 ns, b) 200 ns and different speeds and powers.
Figure 2.
Fiber laser marking matrix designs at pulse durations: a) 100 ns, b) 200 ns and different speeds and powers.
Copper plates of various sizes are cut. They are 150 mm × 100 mm × 1 mm for the fiber laser experiments and 100 mm × 80 mm × 1 mm for the CuBr laser experiments.
Raster marking of squares is performed on each sample according to the assigned tasks and designed matrices. The marked squares were obtained with different technological parameters such as speed, power, pulse duration, raster step or effective energy. The contrast of the marking is determined for each square.
The methodology for calculating the contrast k*x is as follows: the visual difference in reflectance between the treated and untreated surfaces is determined using Adobe Photoshop with a specialized algorithm. The contrast k*x is expressed in relative units or as a percentage (%) on the reference scale. The value of the reflectance Nf of the untreated (unmarked) surface and the value of the reflectance Nx of the laser-marked area are determined. The contrast is calculated using the following expression [21]
where Nf is the measured value of the reflectivity in the untreated (unmarked) area.
Nx – measured value of the reflectivity in the laser-treated area (marked area).
Five contrast measurements are made for each marked area (square). The root mean square (RMS) error is calculated for each marked square.
For process optimization, the effective energy Eeff value is introduced. The effective energy is related to the laser source and the technological process parameters. It determines the absorbed energy in the impact zone per unit area. The effective energy must be sufficient to melt or vaporize the material, depending on the chosen marking method. It is defined as the multiplication of the linear energy density El and the pulse density linear Il = . It is given with the expression
where power P is in watts, frequency υ is in Hz, speed is in cm/s.
The effective energy Eeff has a unit of measurement J/cm2.
From the obtained experimental results, the graphical dependencies are drawn. The graphs are analyzed and the obtained results are summarized. A comparison is also made of the results obtained for the two lasers (for the two different wavelengths).
3. Results
According to the prepared experimental research project, 4 matrices were marked on copper plates, which are presented in Figure 3. Matrices 1 (Figure 3a) and 2 (Figure 3b) were marked with a fiber laser, changing two technological parameters - marking speed and power density. The pulse duration was 100 ns for matrix 1 and 200 ns for matrix 2. Matrix 3 (Figure 3c) was marked with a fiber laser with a pulse duration of 100 ns, with the raster step and marking speed being variables. The marking on matrix 4 (Figure 4d) was carried out with a CuBr laser with a pulse duration of 30 ns, again changing the technological parameters - raster step and marking speed.
Figure 3.
Marked copper matrices with fiber laser: a) Matrix 1, b) Matrix 2, c) Matrix 3, and CuBr laser d) Matrix 4.
Figure 3.
Marked copper matrices with fiber laser: a) Matrix 1, b) Matrix 2, c) Matrix 3, and CuBr laser d) Matrix 4.
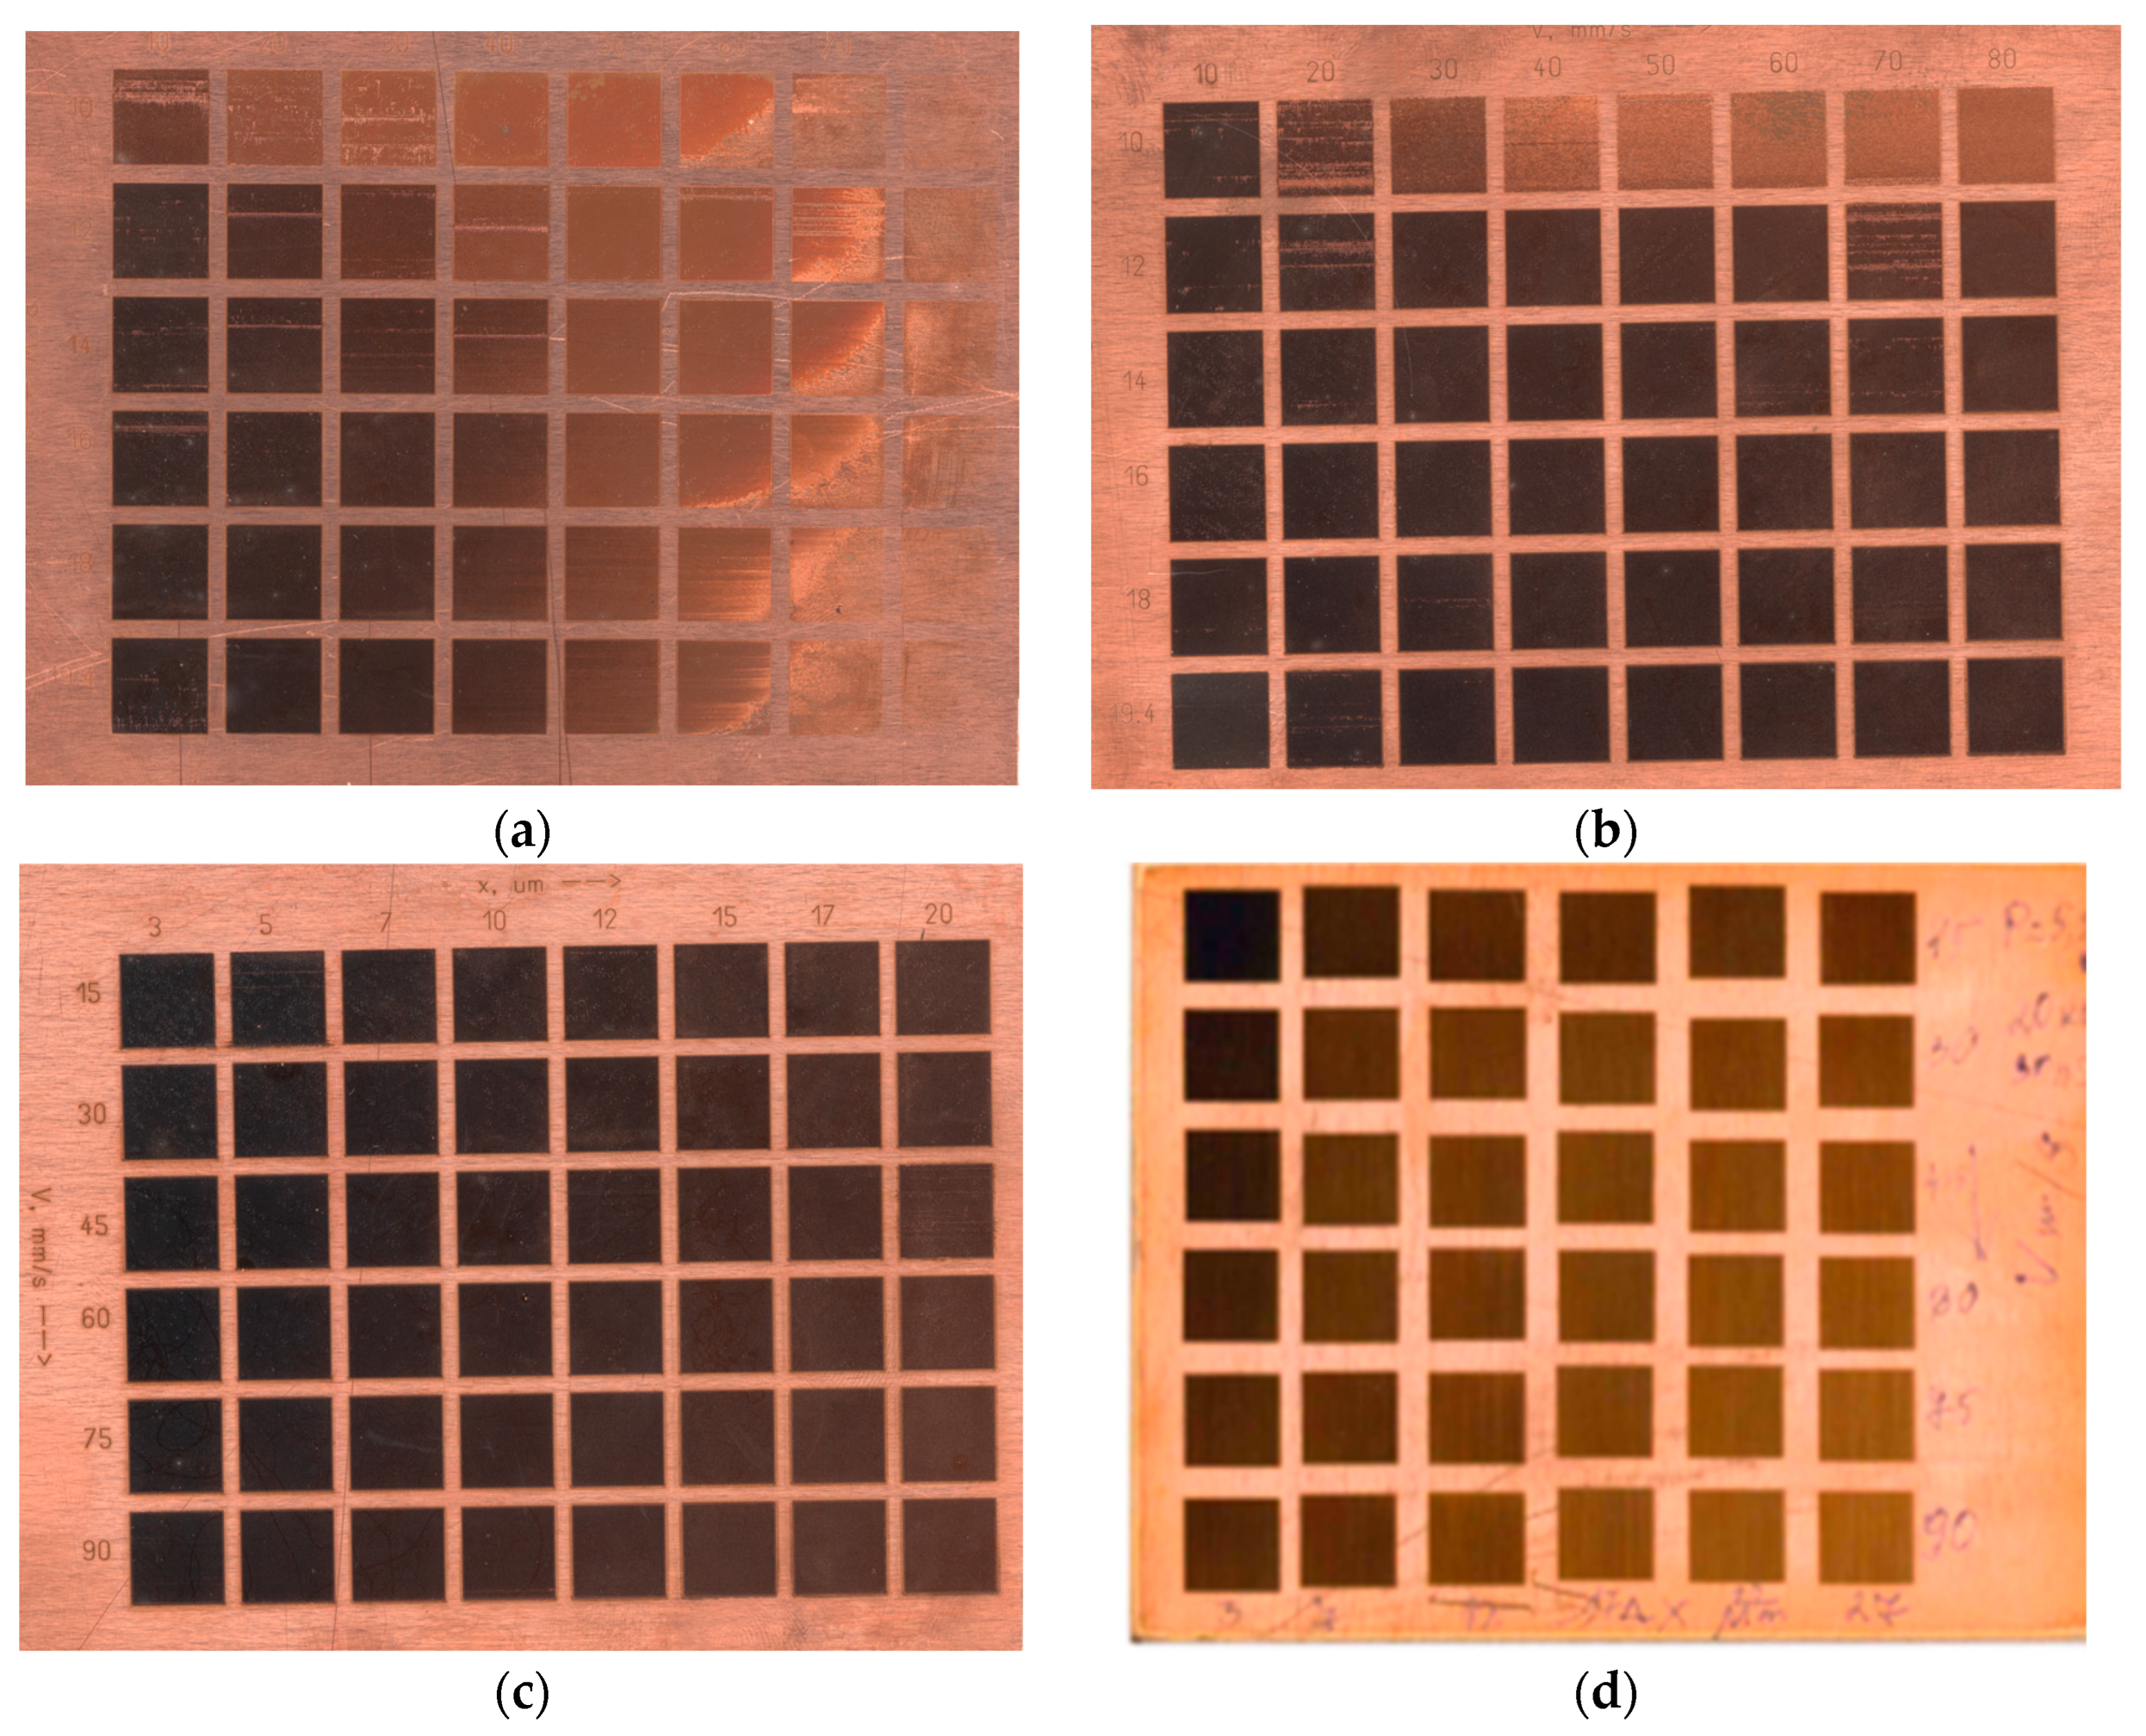
Figure 4.
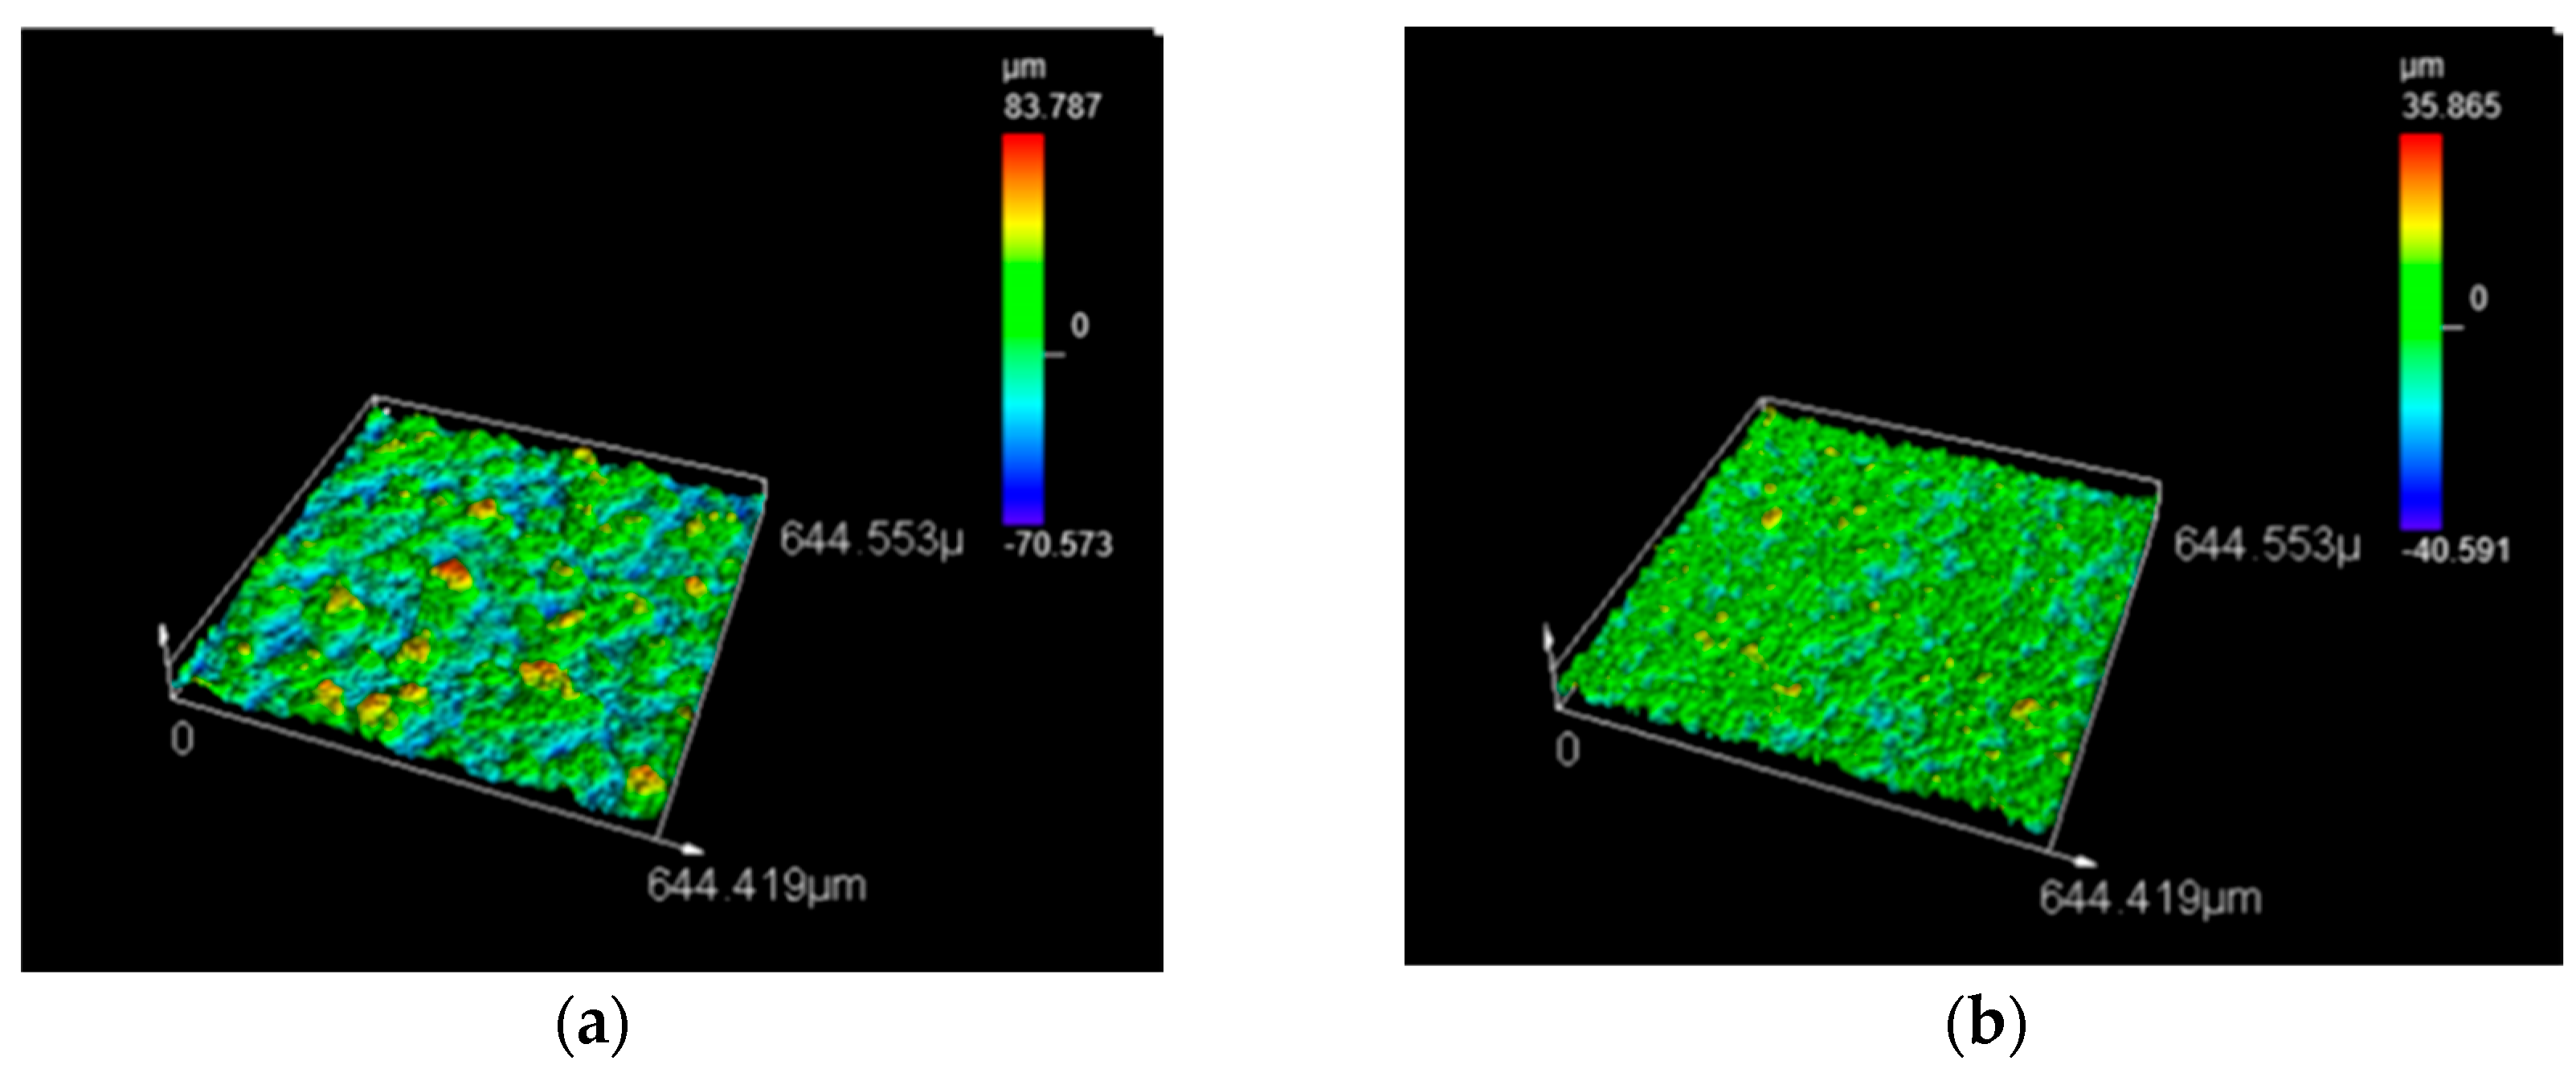
Images of laser-marked areas on a copper sample at power density qs = 9.67 kW/mm2 and speeds : a) 10 mm/s; b) 70 mm/s.
Figure 4.
Images of laser-marked areas on a copper sample at power density qs = 9.67 kW/mm2 and speeds : a) 10 mm/s; b) 70 mm/s.
3.1. Influence of Speed on Contrast in Fiber Laser Marking at 100 ns Pulse Duration
Figure 4 shows photographs of fibre laser-treated areas of copper samples. Images were obtained using a laser microscope. Figure 4.a was obtained for power density qs = 9.67 kW/mm2 and speed = 10 mm/s, and Figure 4.b – for power density qs = 9.67 kW/mm2 and speed = 70 mm/s. In the first case 4a, from the photograph taken with the laser microscope, a strongly pronounced melting and boiling of the surface is observed, which leads to higher roughness and high laser contrast (k* = 67 %), while in the second case 4b, as a result of the high speed, two times less roughness and contrast are obtained and k* = 23.8 %.
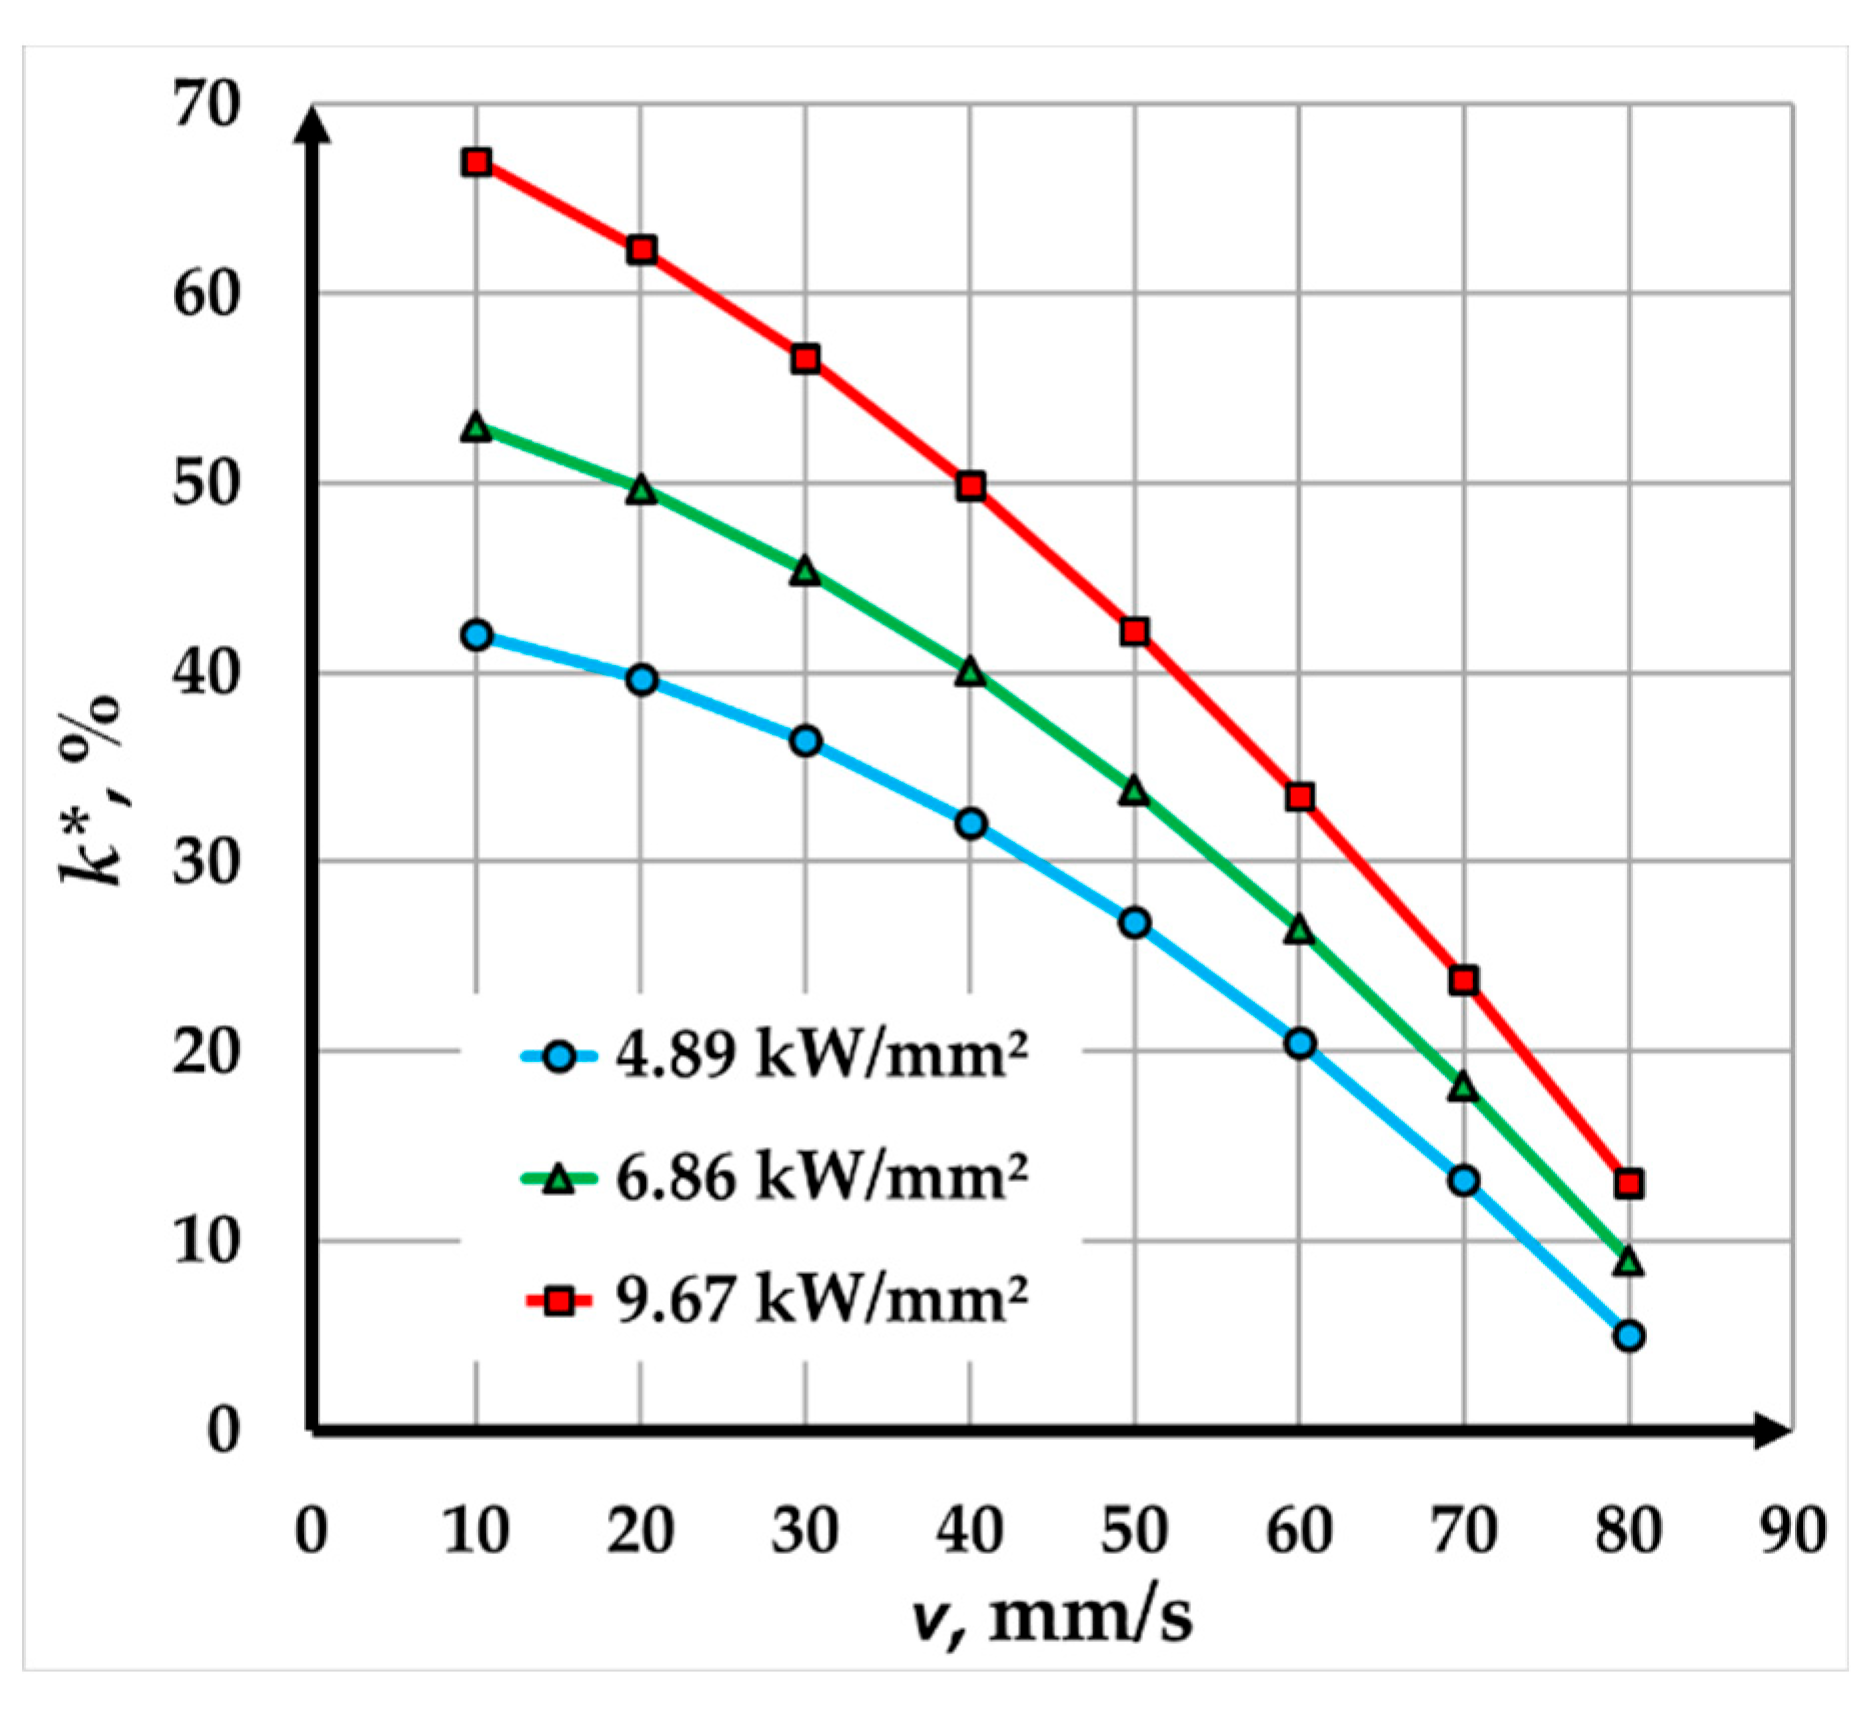
The experimental dependence depicted in Figure 5 illustrates the relationship between contrast and marking speed for a copper plate marked with a fiber laser at a pulse duration of 100 ns and three power densities. The analysis of the graphs reveals several trends and conclusions regarding the influence of speed and power density on contrast.
As the marking speed increases, the contrast decreases across all tested power densities. This decline in contrast is evident throughout the entire speed range, with variations depending on the applied power density. At a lower power density of 4.89 kW/mm², the contrast decreases significantly, dropping from 42 % at a speed of 10 mm/s to just 5 % at 80 mm/s. Similarly, for a power density of 6.86 kW/mm², the contrast falls from 53 % at 10 mm/s to 9 % at 80 mm/s. At the highest power density of 9.67 kW/mm², the initial contrast is the highest, starting at 67 % at 10 mm/s, but it also decreases sharply to 13 % at 80 mm/s.
The nature of the contrast curves reveals different trends across varying speed intervals. Between 10 mm/s and 40 mm/s, the curves show a gradual decrease, indicating a slower rate of contrast reduction. Additionally, in the higher speed range, from 40 mm/s to 80 mm/s, the curves become steeper, reflecting a faster decline in contrast. This sharp drop in the higher speed range suggests that the marking process becomes less effective at higher speeds, regardless of the power density used.
In summary, the results highlight the significant influence of marking speed and power density on contrast when using a fiber laser at a pulse duration of 100 ns. Lower speeds and higher power densities result in higher contrast, making them more suitable for applications requiring clear and precise markings. Higher speeds and lower power densities, however, are more appropriate for laser markings that will be interpreted using specialized readers. The findings emphasize the importance of optimizing these parameters to achieve the desired contrast levels in industrial laser marking processes.
Figure 5.
Graphics of the dependence of contrast on speed for marking a Cu plate with a fiber laser with a pulse duration of 100 ns.
Figure 5.
Graphics of the dependence of contrast on speed for marking a Cu plate with a fiber laser with a pulse duration of 100 ns.
3.2. Influence of Speed on Contrast in Fiber Laser Marking at 200 ns Pulse Duration
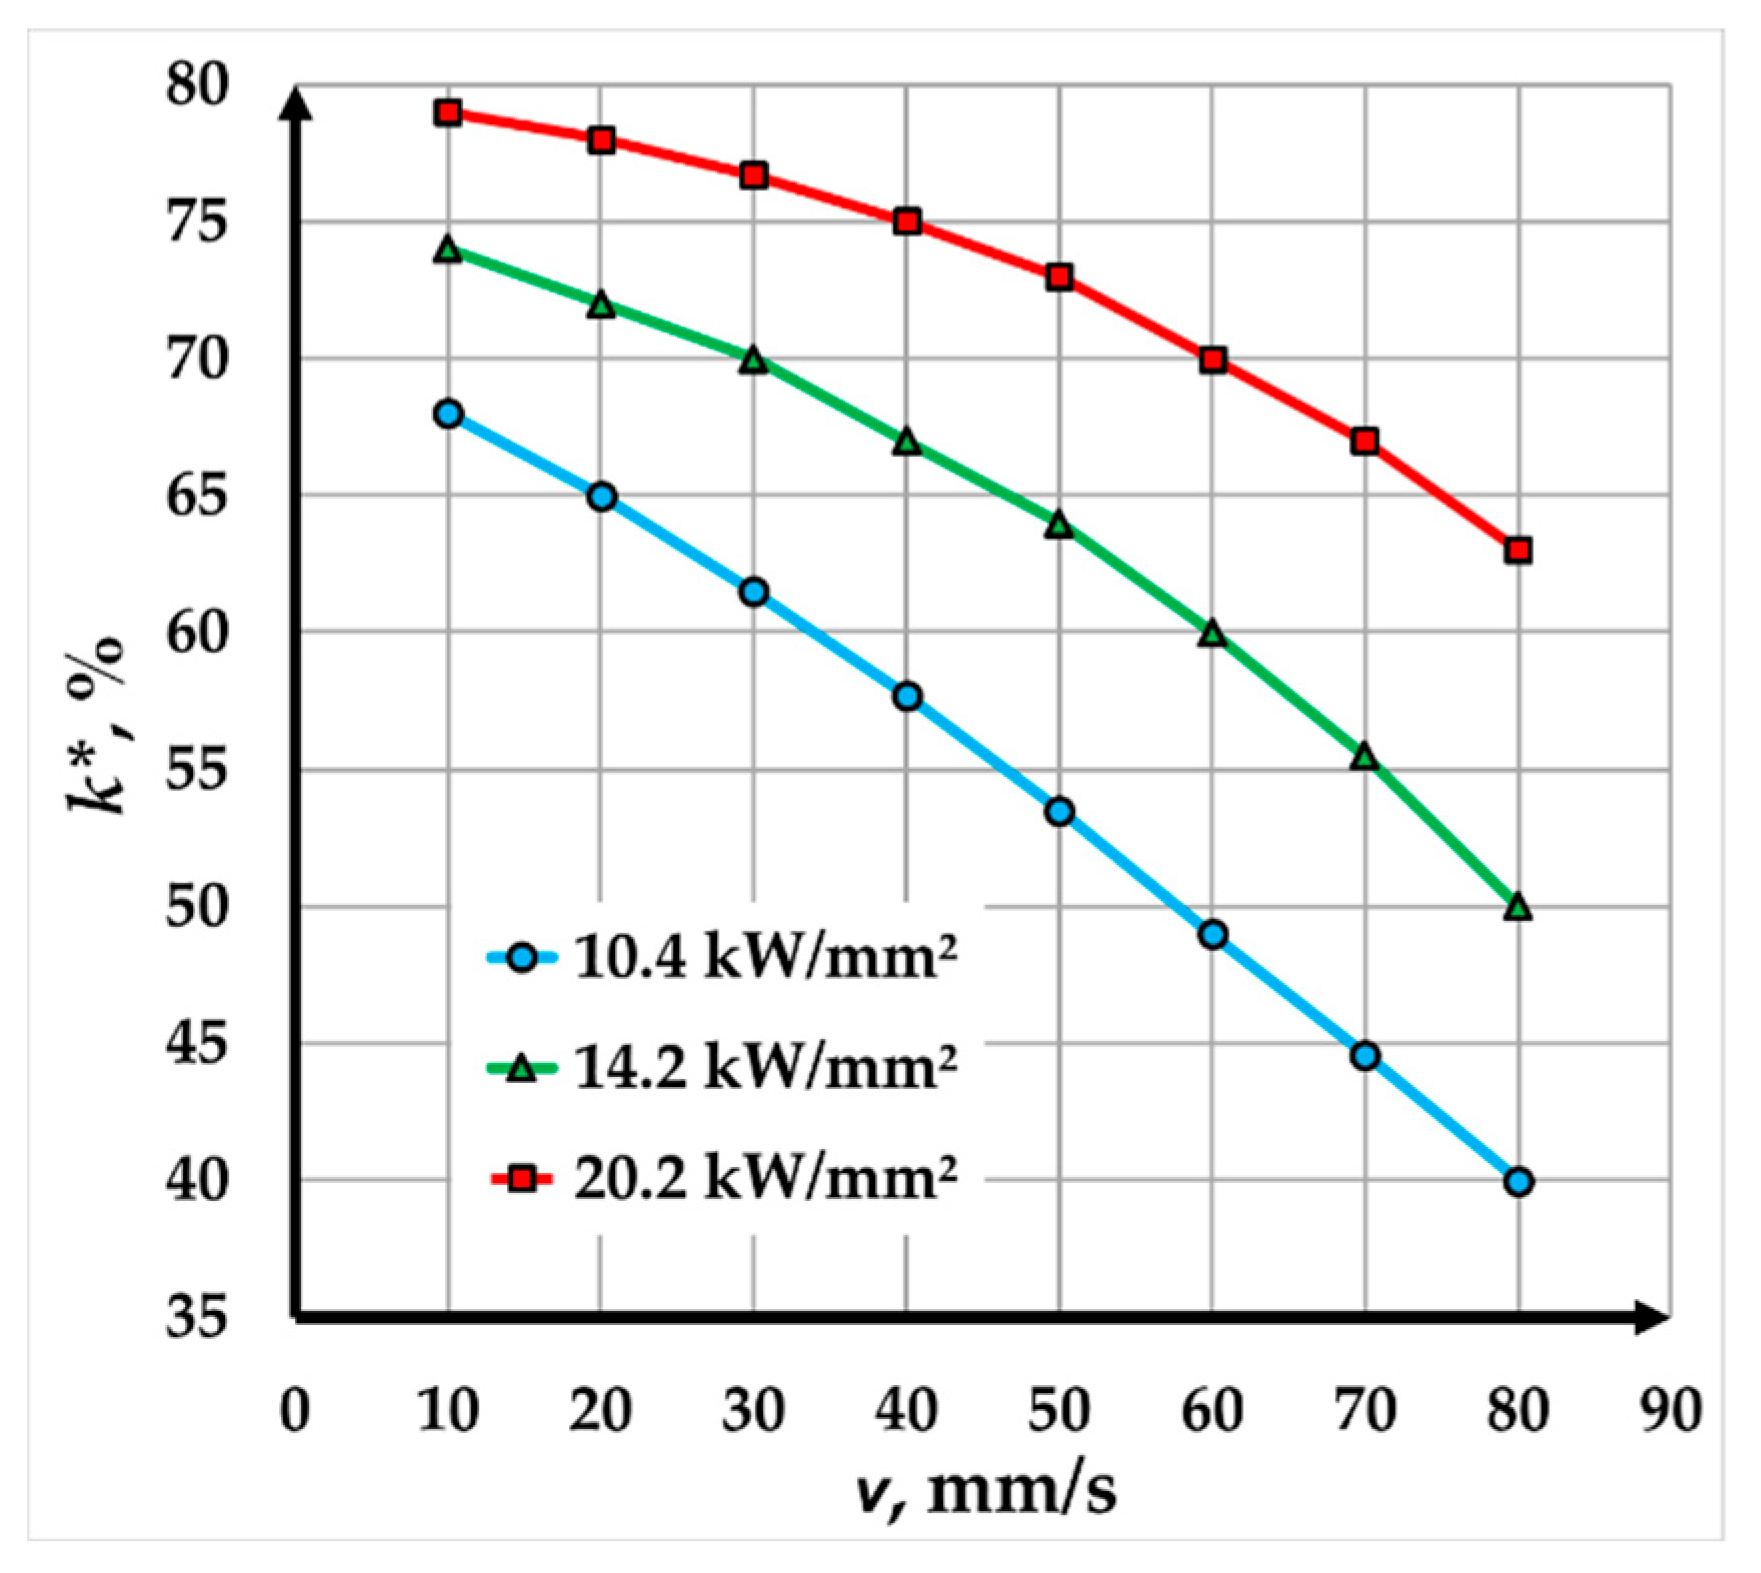
The graph in Figure 6 illustrates the relationship between contrast and speed for copper plates marked using a fiber laser with a pulse duration of 200 ns. Three power densities ns – 10.4 kW/mm², 14.6 kW/mm², and 20.2 kW/mm² – were studied to evaluate their impact on marking contrast at different speeds. The results demonstrate the behavior of marking contrast as a function of speed and power density within specific ranges.
- At all tested power density values, the contrast decreases nonlinearly with increasing speed. This trend is attributed to the reduced interaction time between the laser and the material at higher speeds, leading to lower energy absorption by the material.
- At the lowest power density of 10.4 kW/mm², the contrast decreases significantly, from 68 % at 10 mm/s to 40 % at 80 mm/s – a 1.7-fold reduction. The steep decline indicates that at this power level, higher speeds fail to provide sufficient energy for creating high-contrast markings, making it less suitable for applications requiring both high speed and high-quality markings.
- At a power density of 14.6 kW/mm², the contrast decreases from 74 % at 10 mm/s to 50 % at 80 mm/s, representing a reduction of about 1.48 times. The decrease is less pronounced compared to 10.4 kW/mm², suggesting that the increased power partially compensates for the reduced interaction time at higher speeds, maintaining better marking quality.
- At the highest power density of 20.2 kW/mm², the contrast decreases from 79 % at 10 mm/s to 63 % at 80 mm/s, a reduction of only 1.25 times. The minimal loss of contrast indicates that higher power levels are more effective in maintaining marking quality over a broader range of speeds, making this setting ideal for high-speed marking applications.
Figure 6.
Graphics of the dependence of contrast on speed for marking a Cu plate with a fiber laser with a pulse duration of 200 ns.
Figure 6.
Graphics of the dependence of contrast on speed for marking a Cu plate with a fiber laser with a pulse duration of 200 ns.
3.3. Comparison of Fiber Laser Marking Results with Pulse Durations of 100 ns and 200 ns
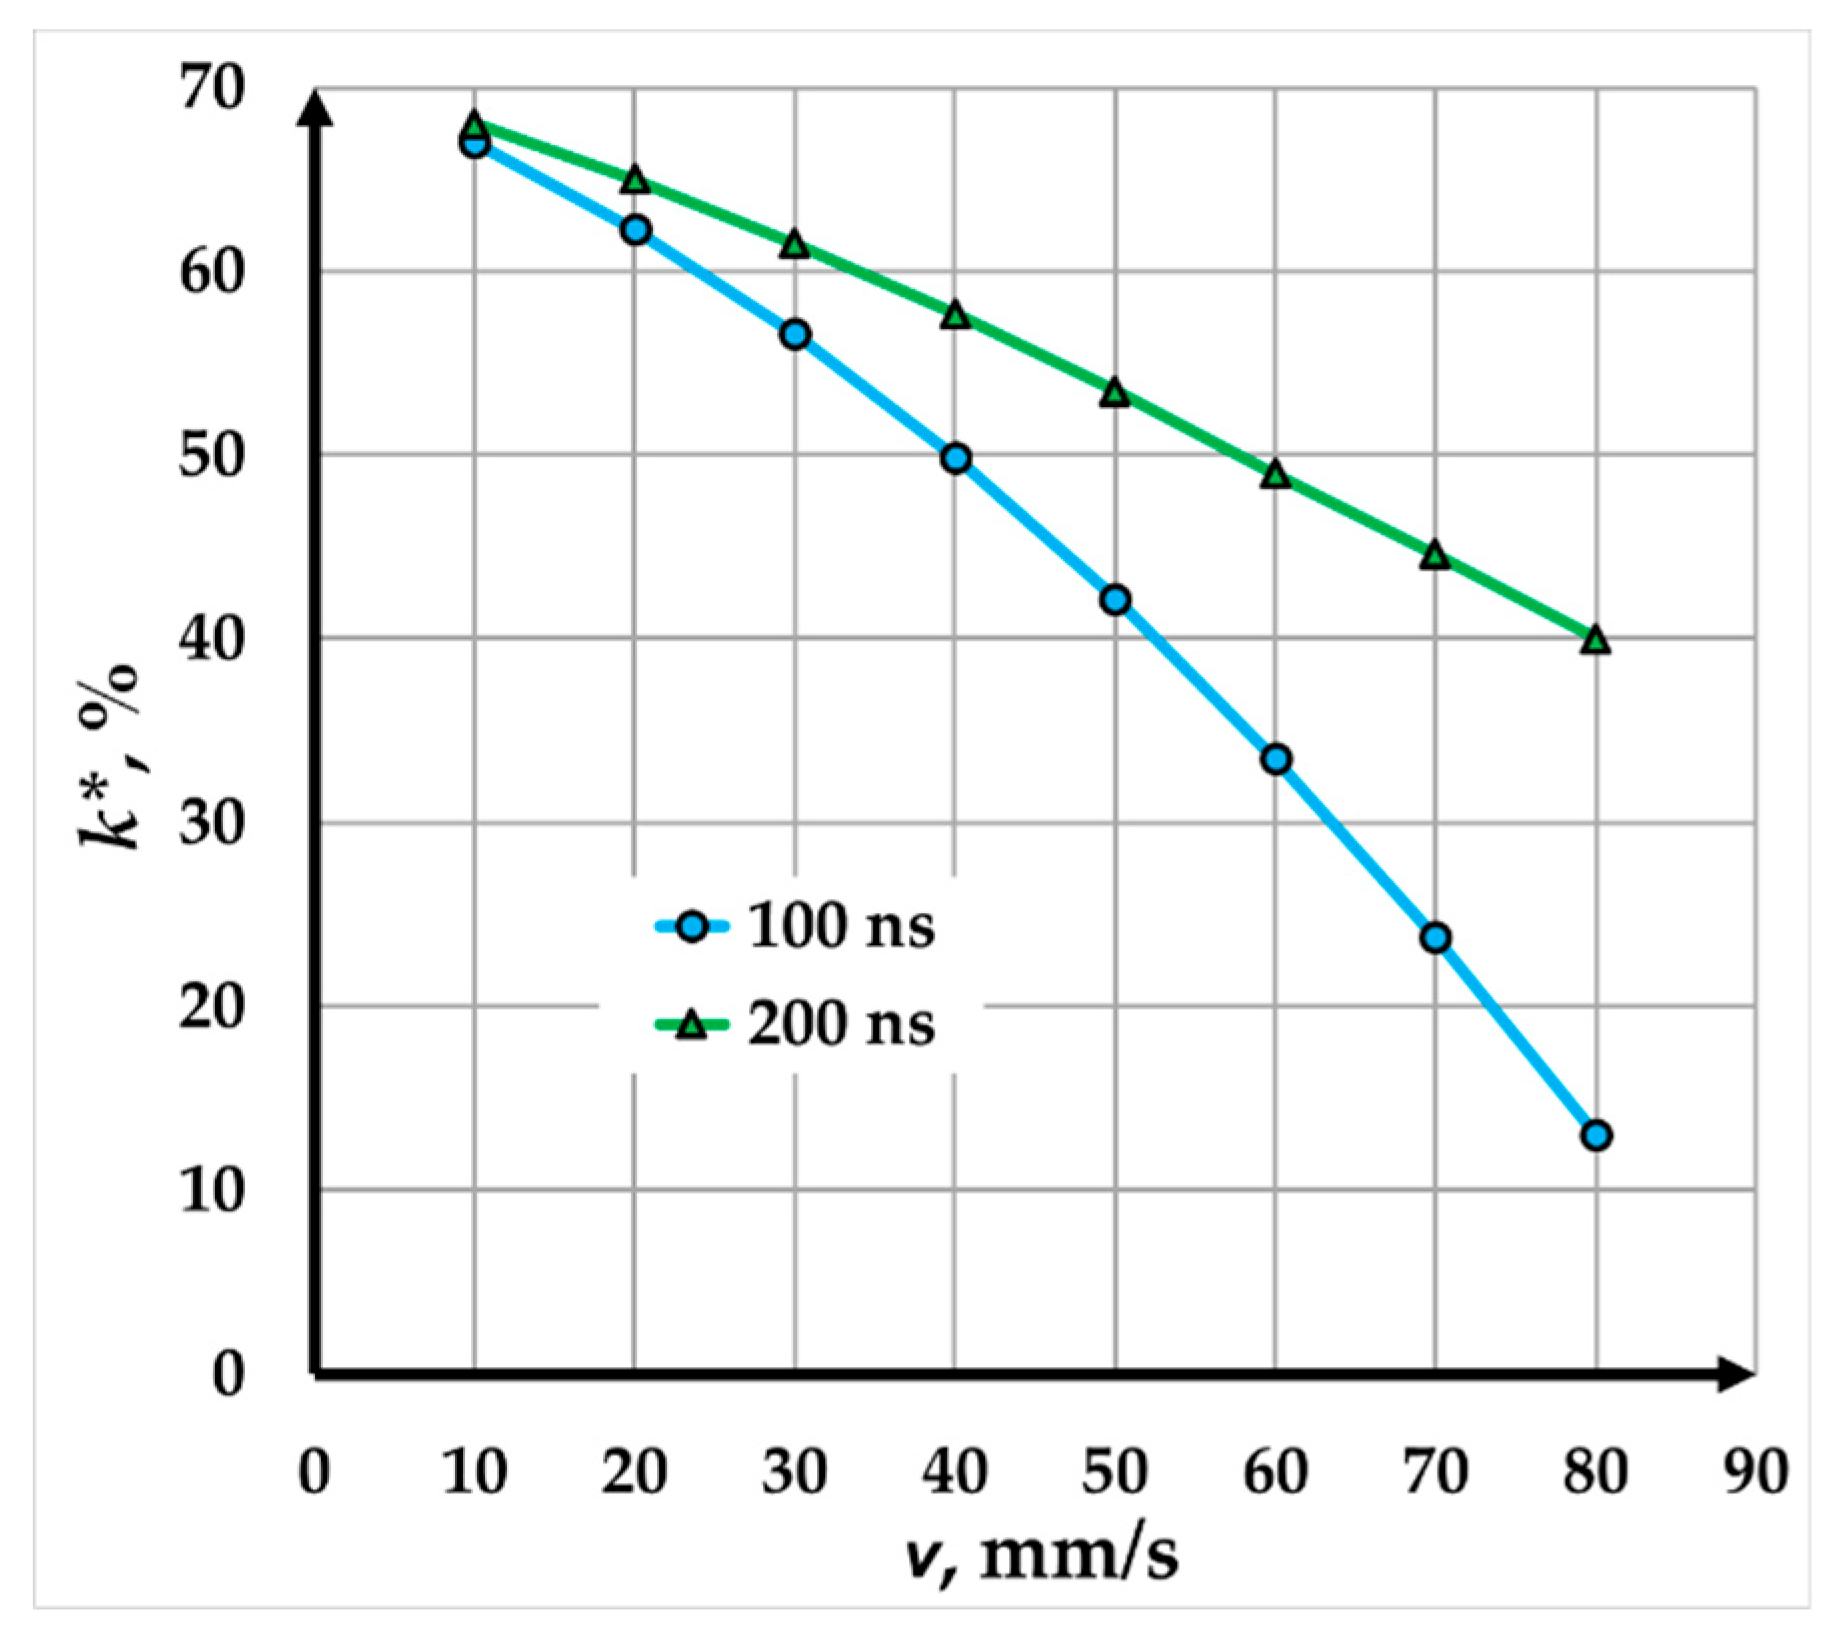
The influence of pulse duration can be inferred indirectly. A comparison was made between a pulse duration of 100 ns and a power density of 9.67 kW/mm² (green graphic in Figure 7) and a pulse duration of 200 ns and a power density of 10.4 kW/mm² (blue graphic in Figure 7) with both graphs having very similar power densities. It was found that for velocities from 10 mm/s to 80 mm/s, the curve for a pulse duration of 100 ns is steeper compared to the curve for a pulse duration of 200 ns.
Figure 7.
Graphics of the dependence of contrast on speed for marking a Cu plate with a fiber laser with a pulse duration of: green – 100 ns, blue – 200 ns.
Figure 7.
Graphics of the dependence of contrast on speed for marking a Cu plate with a fiber laser with a pulse duration of: green – 100 ns, blue – 200 ns.
Despite variations in contrast, high-contrast laser markings are consistently achieved within the studied range, making this technique highly suitable for industrial marking applications. For higher-speed applications, higher power density values (e.g., 20.2 kW/mm²) are recommended to maintain the necessary contrast at faster scanning speeds. Conversely, lower power density values are sufficient for applications with slower speeds, though this is accompanied by reduced production efficiency.
The RMS error in determining contrast ranges from 0.60 % to 1.35 %, confirming the high accuracy and reliability of the results.
3.4. Influence of Raster Step on Contrast in Fiber Laser Marking
The graphs in Figure 8 illustrate the relationship between contrast (k∗) and raster step (Δx) for copper samples marked using a fiber laser at three different speeds: 15 mm/s (gray line), 45 mm/s (orange line), and 90 mm/s (blue line). The analysis of the results demonstrates the influence of raster step and scanning speed on the quality of the laser marking:
For all three speeds, the contrast decreases non-linearly as the raster step increases. This behavior reflects how larger raster steps reduce the overlap of the laser beam, decreasing the number of repetitions and absorbed energy, and consequently, the contrast. The graphs indicate that the rate of contrast reduction becomes less pronounced as the raster step increases.
At the slowest speed of 15 mm/s, the contrast decreases from 83 % to 65 % as the raster step increases from 3 µm to 20 µm. This represents a 1.22-fold reduction in contrast. The relatively gradual decrease suggests that this scanning speed allows for higher energy density and better marking quality, even with larger raster steps.
At a speed of 45 mm/s, the contrast decreases from 82 % to 62 % over the same range of raster steps, corresponding to a 1.27-fold reduction. This slightly steeper decline compared to 15 mm/s suggests that the reduced interaction time between the laser and the material has a more significant impact on contrast and marking quality as the raster step increases.
At the fastest speed of 90 mm/s, the contrast decreases from 80 % to 57 % as the raster step increases from 3 µm to 20 µm, representing a 1.44-fold reduction. The more pronounced decrease at this speed reflects shorter interaction times and lower energy absorption, which adversely affect the marking contrast.
Figure 8.
Graphics of the dependence of contrast on raster step for marking a Cu plate with a fiber laser with a pulse duration of 100 ns.
Figure 8.
Graphics of the dependence of contrast on raster step for marking a Cu plate with a fiber laser with a pulse duration of 100 ns.
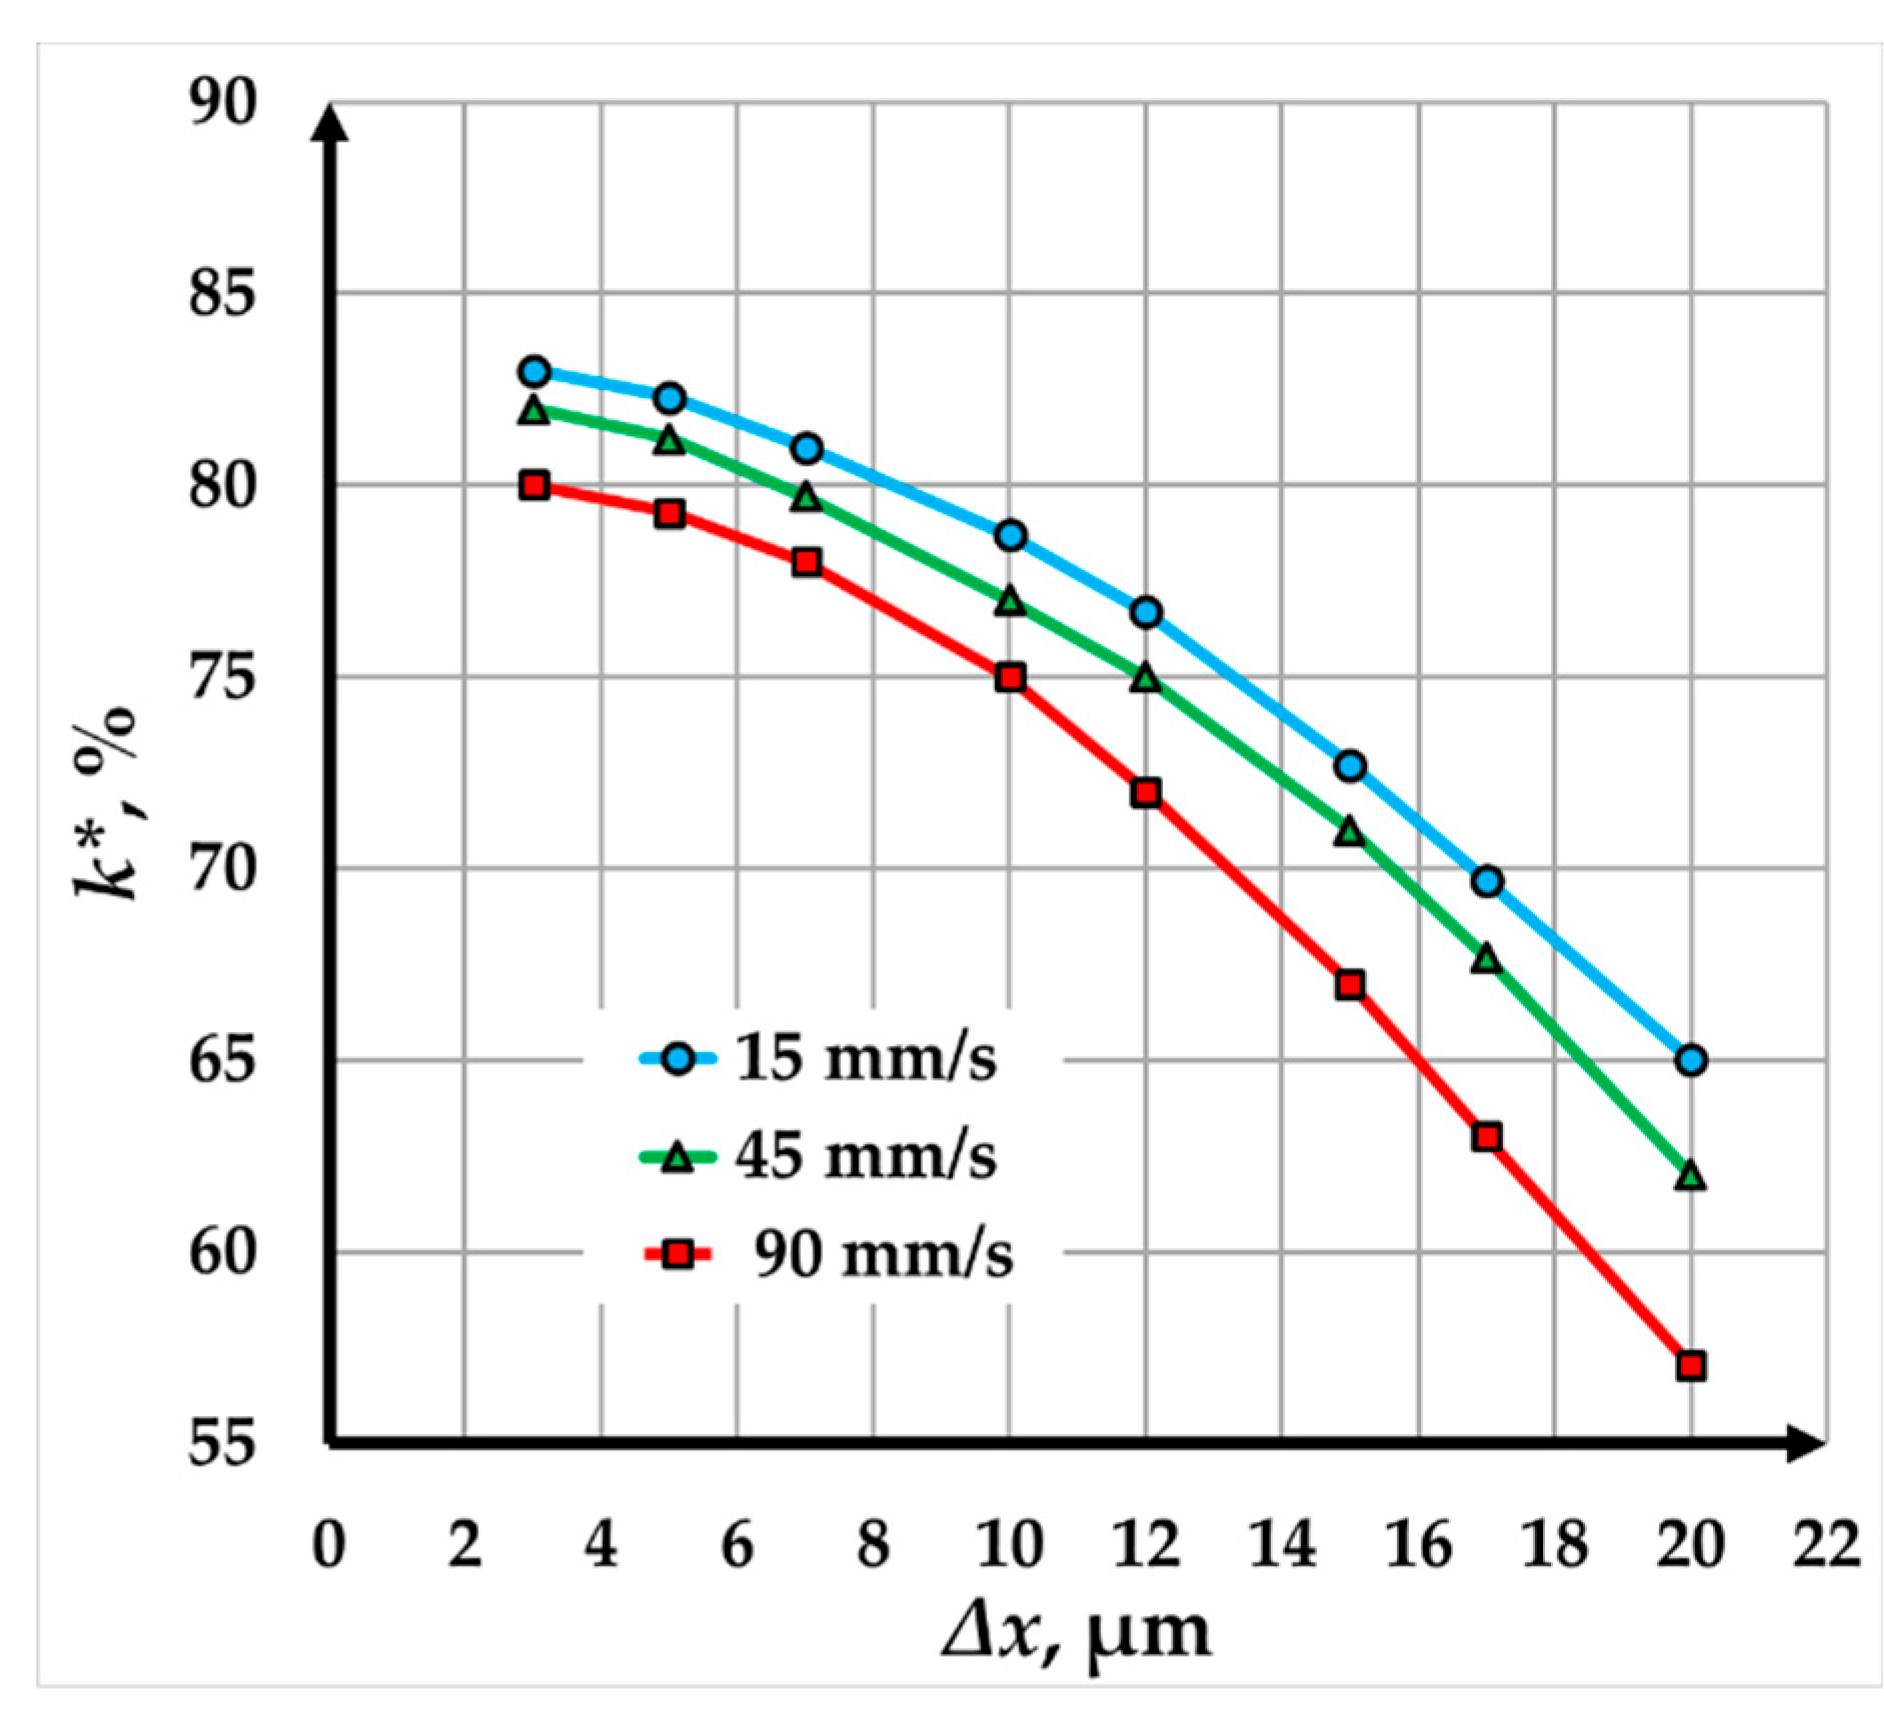
Despite the observed reduction in contrast at all speeds and raster steps, the data show that high-contrast laser markings are still achieved within the studied range. This makes fiber laser marking suitable for industrial applications requiring durable and visually distinct markings.
3.5. Influence of Raster Step on Contrast in CuBr Laser Marking
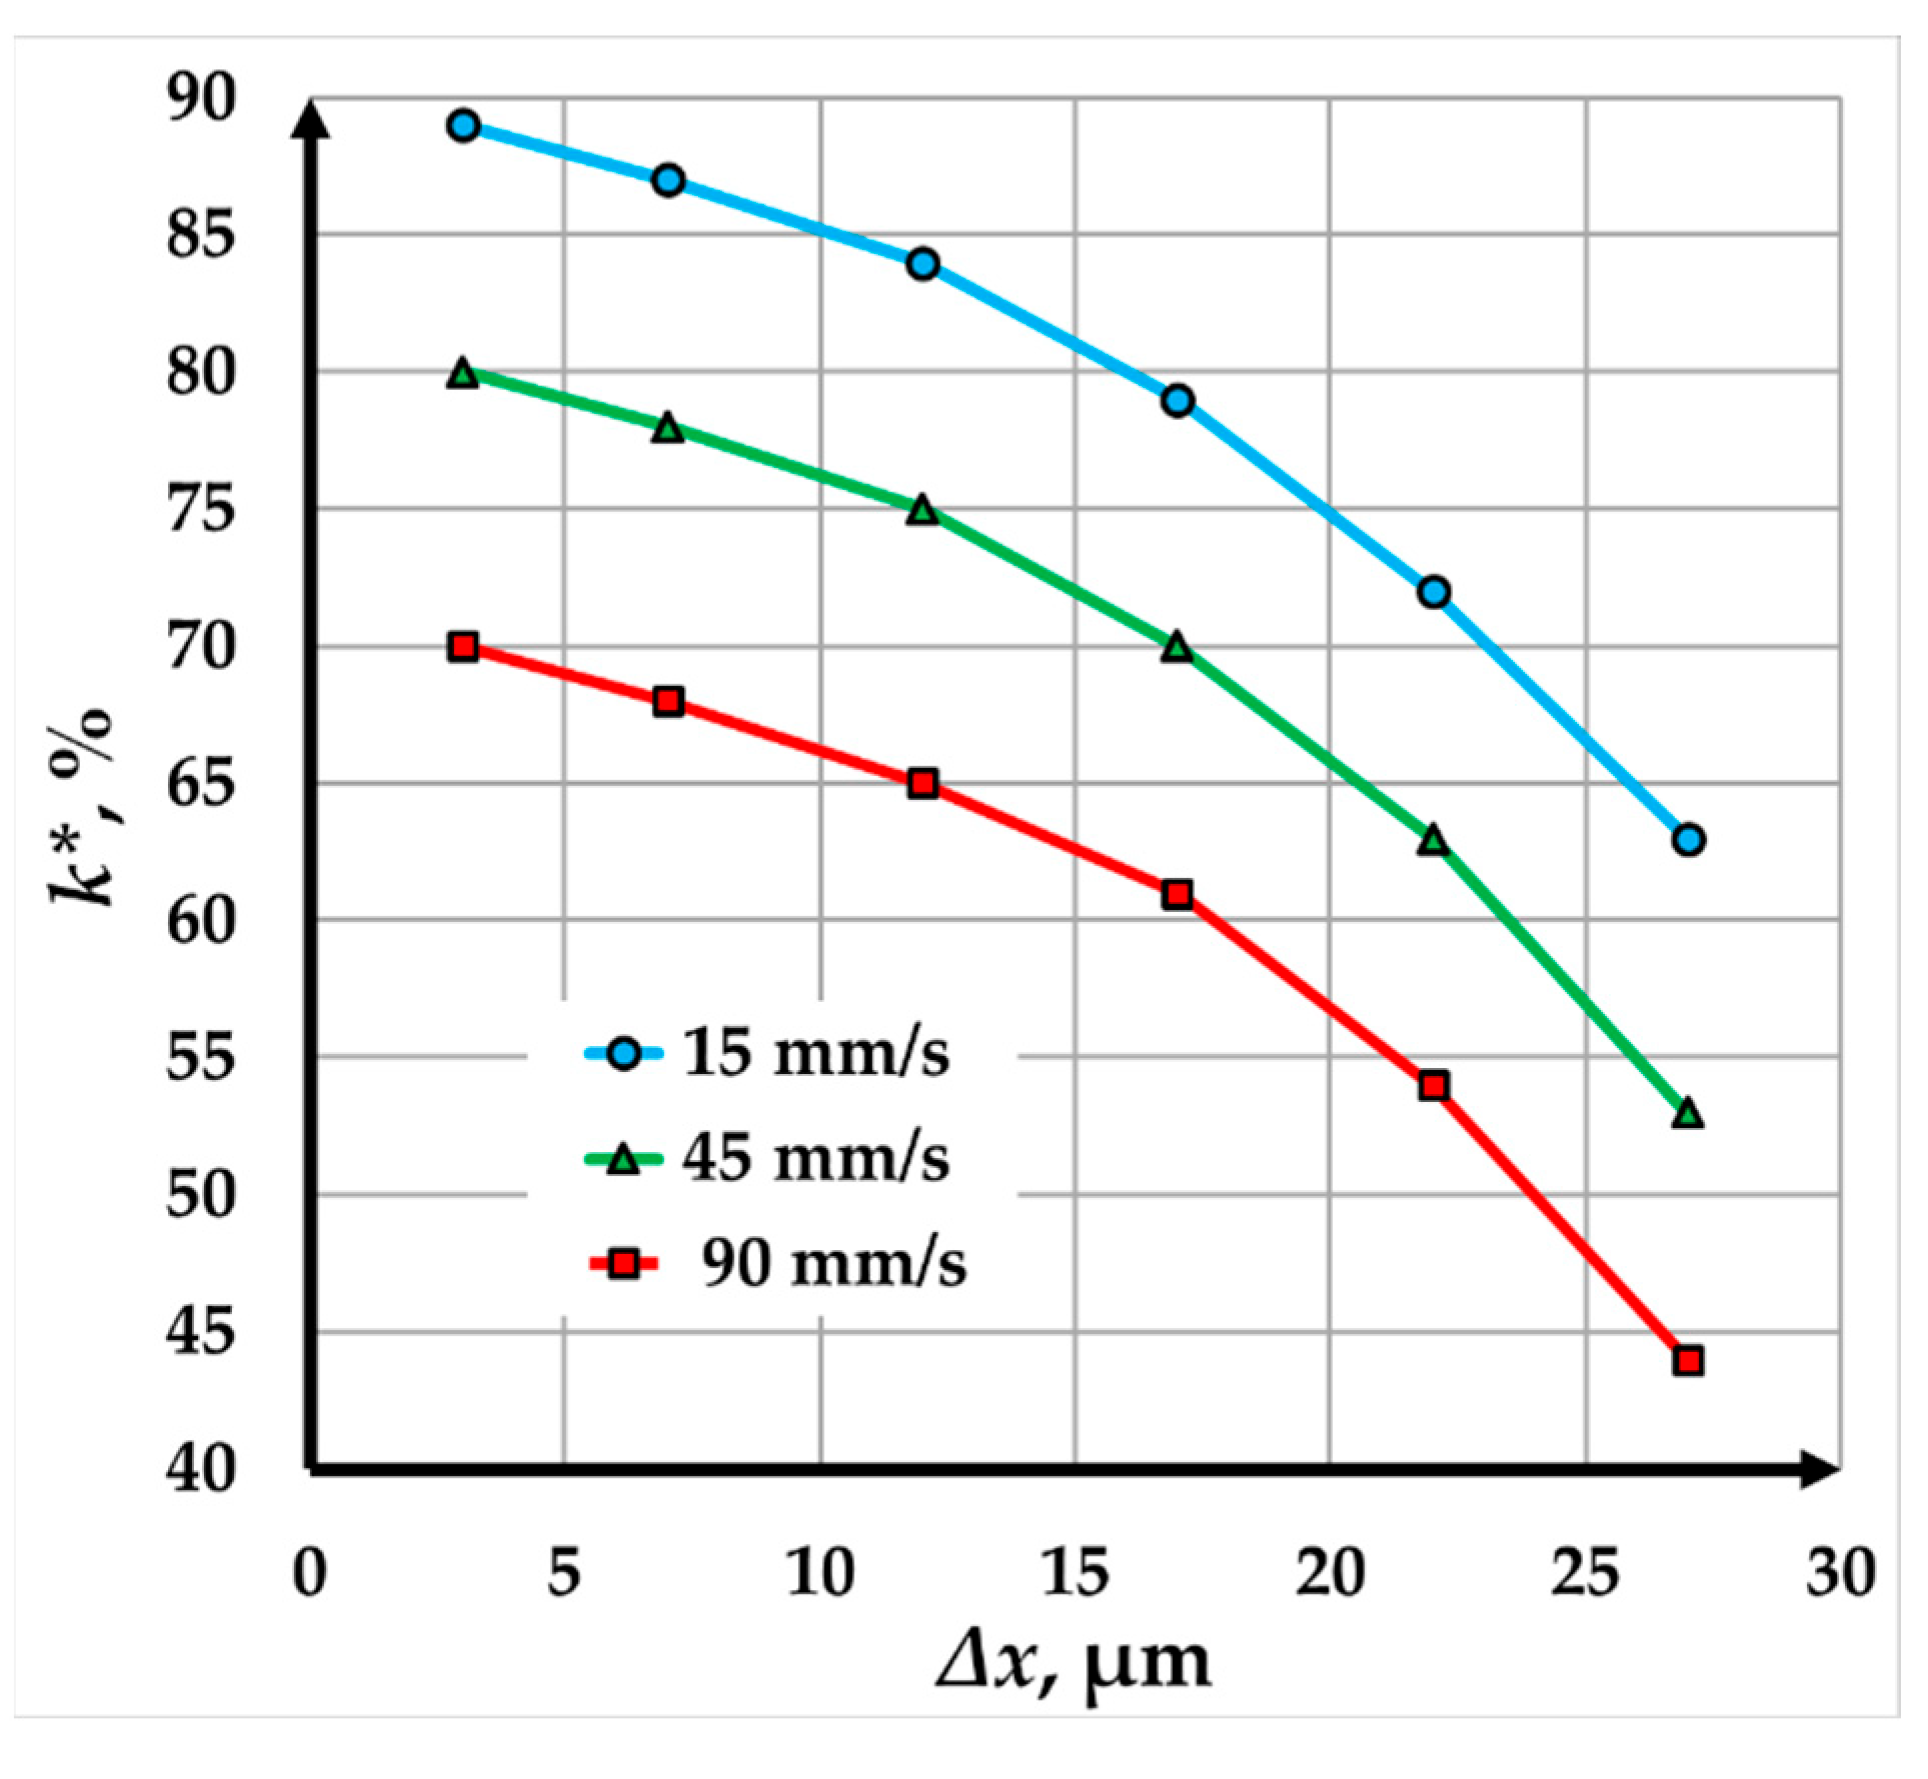
The graphs in Figure 9 show the relationship between marking contrast and raster step for three different speeds: 15 mm/s (blue line), 45 mm/s (gray line), and 90 mm/s (green line). Their analysis reveals the trends and variations in contrast at raster step and speed values suitable for industrial production.
For all three speeds, contrast decreases non-linearly as the raster step increases. This trend emphasizes that larger raster steps reduce beam overlap, resulting in less absorbed energy and thinner molten or oxidized layers for the largest raster steps. Consequently, a sharper contrast drop is observed.
At a scanning speed of 15 mm/s, the marking contrast decreases from 89 % to 63 % as the raster step increases from 3 µm to 27 µm. This represents a 1.29-fold reduction in contrast within the examined range. The relatively high initial contrast and slower reduction at this speed indicate that lower scanning speeds allow for greater energy absorption and better marking quality, even as the raster step increases.
At a scanning speed of 45 mm/s, contrast decreases from 80 % to 53 % over the same range of raster steps (3 µm to 27 µm), corresponding to a 1.34-fold reduction. The faster drop compared to 15 mm/s suggests that increasing the scanning speed reduces the interaction time between the laser and the material, making the markings less distinct at larger raster steps. However, the contrast remains sufficiently high for industrial applications across the entire working range of raster steps.
At the highest scanning speed of 90 mm/s, contrast drops from 70 % to 44 % as the raster step increases from 3 µm to 27 µm, representing a 1.7-fold reduction. The more pronounced contrast decrease at this speed reflects less absorbed energy by the material due to the rapid movement of the laser beam. For raster steps larger than 22 µm, the quality of the resulting marking is unsuitable for visual recognition.
The results also demonstrate the effectiveness of the CuBr laser in achieving high levels of contrast with relatively lower radiation power compared to fiber lasers. This efficiency is particularly beneficial for applications requiring precise markings with minimal energy consumption.
Figure 9.
Graphics of the dependence of contrast on raster step for marking a Cu plate with a CuBr laser with a pulse duration of 100 ns.
Figure 9.
Graphics of the dependence of contrast on raster step for marking a Cu plate with a CuBr laser with a pulse duration of 100 ns.
3.6. Influence of Effective Energy on Contrast for Both Lasers
Figure 10 illustrates the relationship between marking contrast k∗ and effective energy (Eeff) for copper samples marked using two types of lasers: a fiber laser (gray curve) and a CuBr laser (green curve). Effective energy is a composite parameter that accounts for the influence of power, and process-related factors, such as speed and raster step. In the experiments, the effective energy ranged from 3.03 kJ/cm² to 43.1 kJ/cm² for the fiber laser and from 1.36 kJ/cm² to 43.1 kJ/cm² for the CuBr laser.
Figure 10.
Graphics of the dependence of the contrast on the effective energy for both lasers.
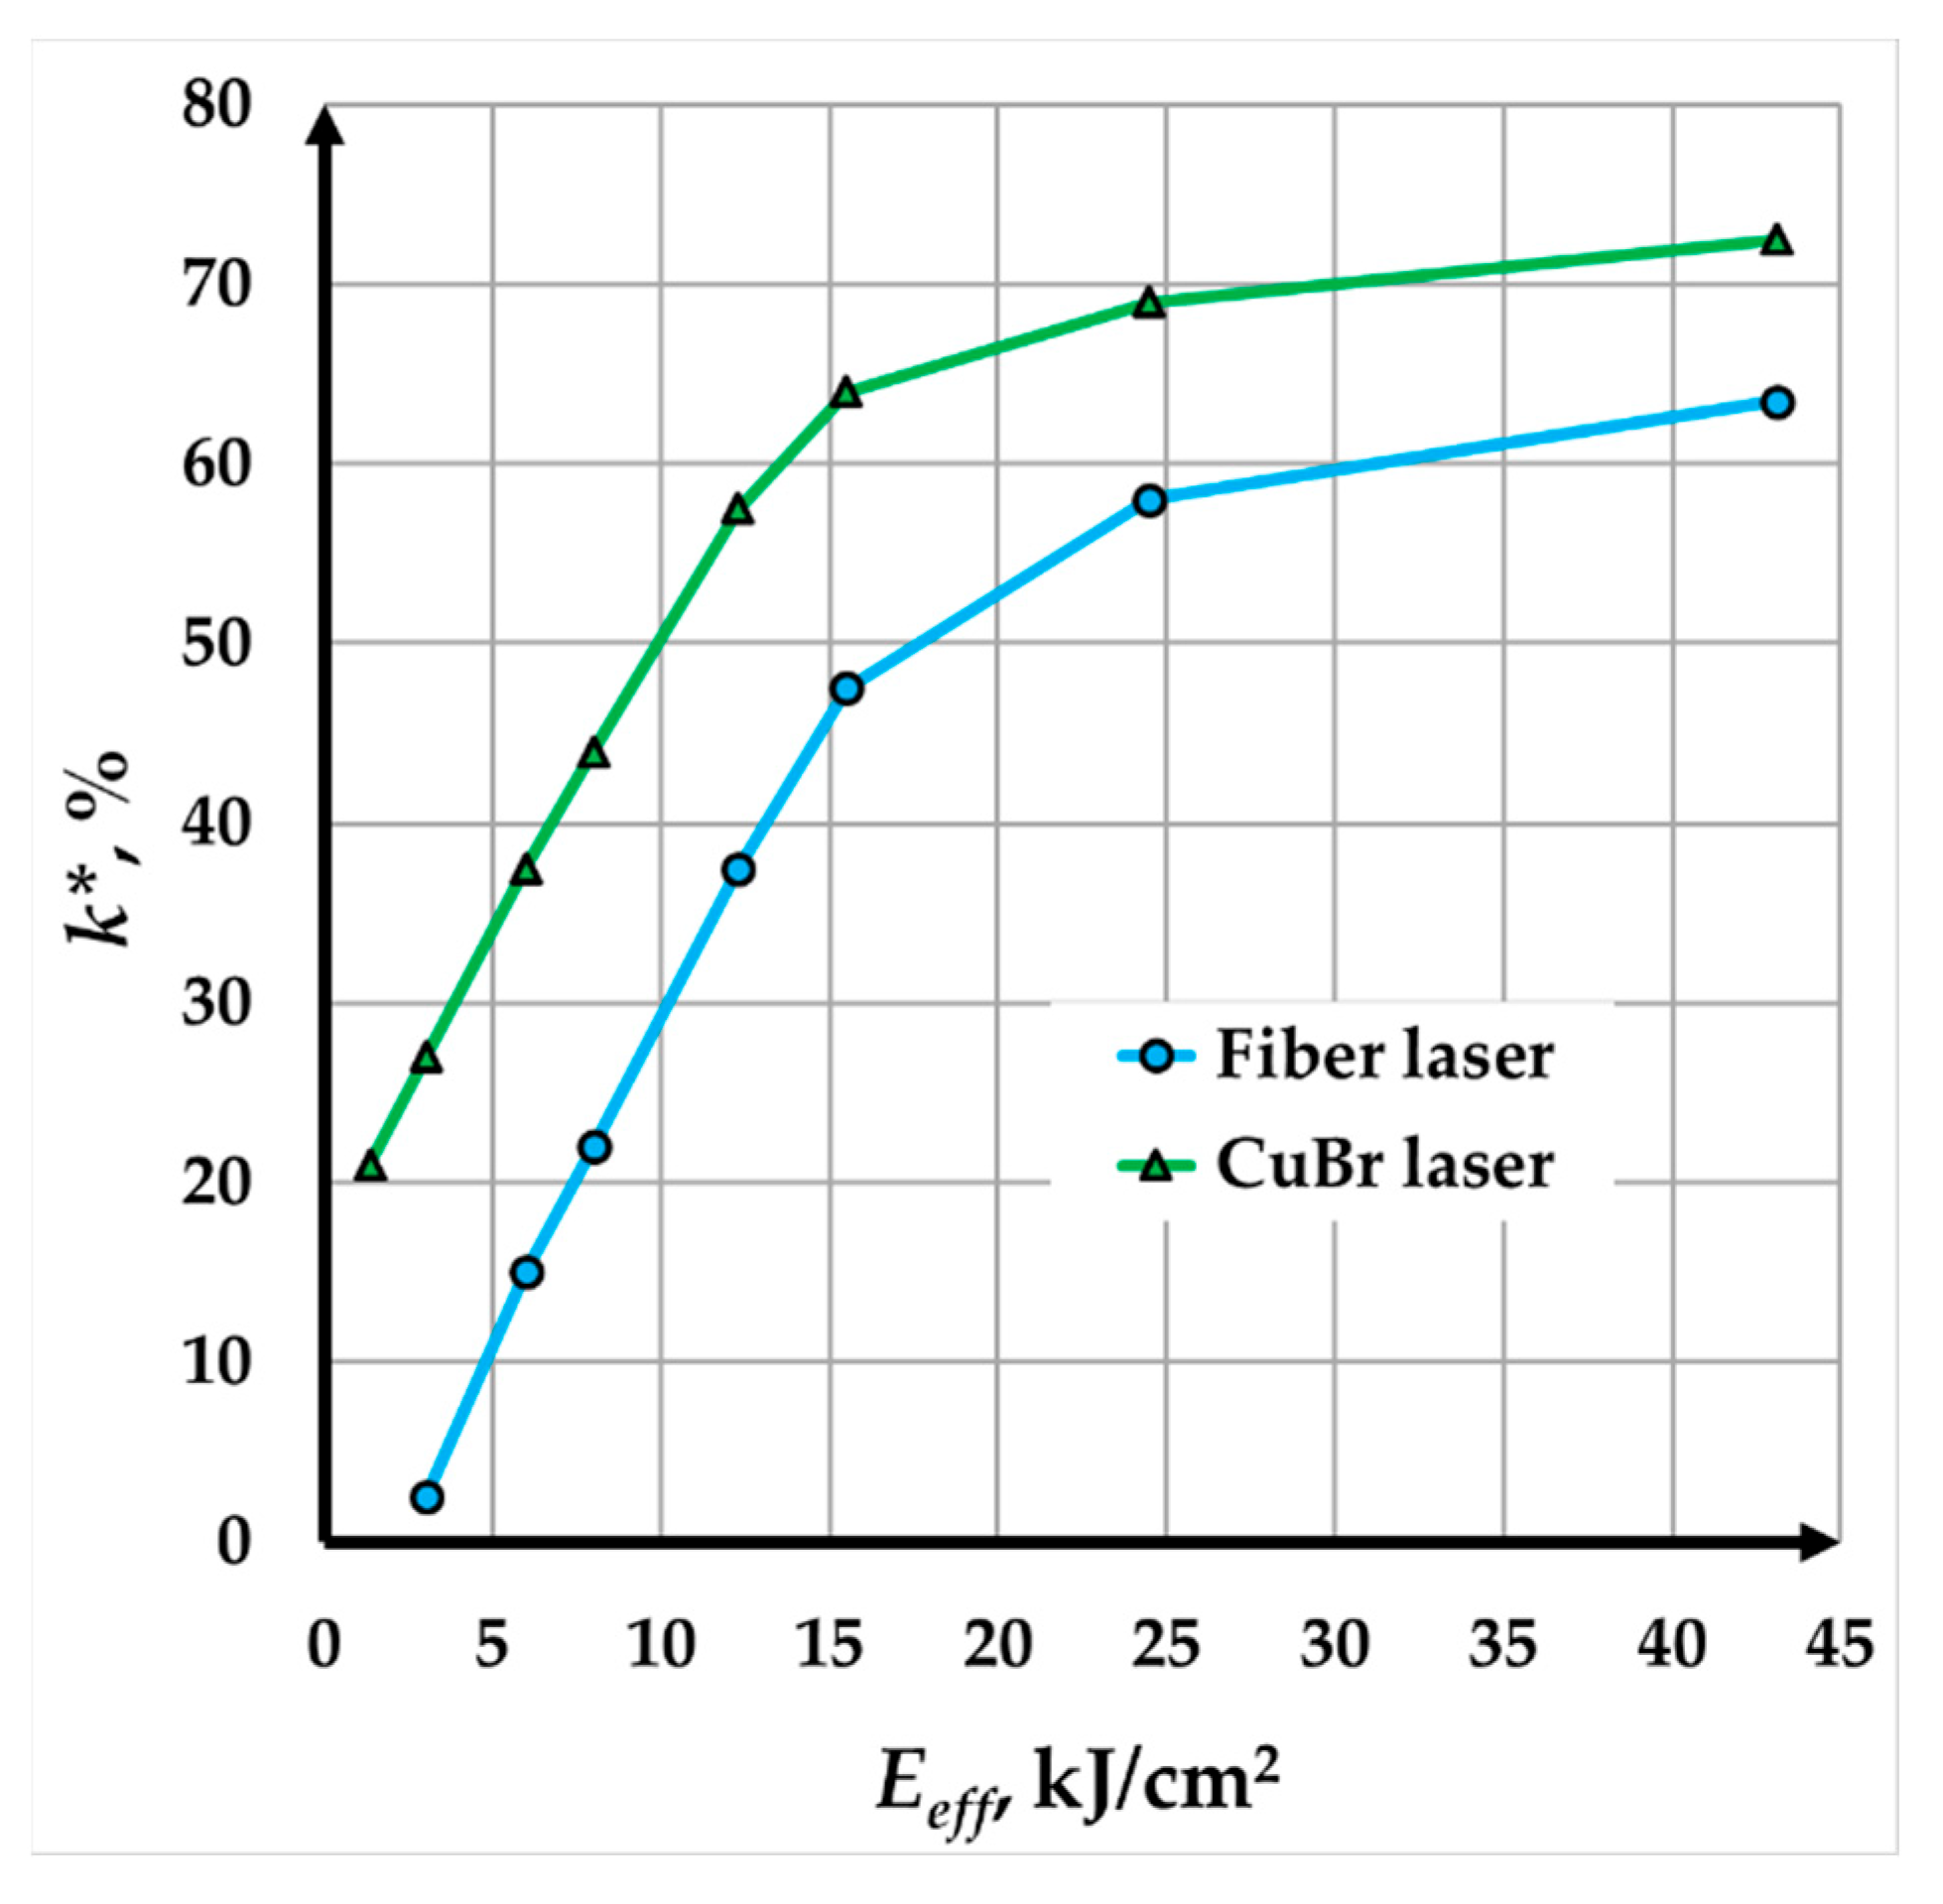
The following conclusions can be made from the two graphical dependencies presented:
- a nonlinear dependence of the marking contrast on the effective energy is obtained for both lasers.
- For the effective energy intervals from 3.03 kJ/cm² to 15.52 kJ/cm² for the fiber laser and from 1.36 kJ/cm² to 15.52 kJ/cm² for the CuBr laser, the curves are very steep, which indicates a rapid increase in contrast in these intervals.
- For the effective energy interval from 15.52 kJ/cm² to 43.1 kJ/cm² for both lasers, both curves are sloping, as the rate of contrast increase slows down, which suggests a saturation effect, in which additional energy has a negligible effect on the contrast. In this interval, marking occurs mainly by melting, with only minor increases in the marking depth.
-
The following effective energy ranges were determined to differ between the two lasers:from 17.4 kJ/cm² to 43.1 kJ/cm² for the fiber laser;from 9.90 kJ/cm² to 43.1 kJ/cm² for the CuBr laser
At equivalent effective energy values, the CuBr laser produces higher marking contrast than the fiber laser. This difference is probably due to the higher absorption capacity of the material for the CuBr laser wavelengths (λ = 511 nm & 578 nm) compared to that for the fiber laser wavelength (λ = 1030 nm).
4. Conclusions
This study investigated the impact of key technological parameters – such as speed , raster step Δx, power density qs, pulse duration τ, and effective energy Eeff – on the laser marking process of copper surfaces using two lasers: the Yb fiber laser and the CuBr MOPA laser. Experimental dependencies of contrast were analyzed, including the relationships between contrast and speed (k* = k*()) for different power densities qs and pulse durations (τ), as well as contrast and raster step (k* = k*(Δx)) and effective energy (k* = k*(Eeff)) for both types of lasers. A comparative analysis of the two wavelengths (1030 nm for the fiber laser and 578 & 511 nm for the CuBr laser) on the marking process was also performed.
Within the studied intervals of parameter changes, the following conclusions were made:
- With increasing speed, the contrast decreases nonlinearly for all studied pulse durations and power densities. For a pulse duration of 100 ns and a power density of 9.67 kW/mm², the contrast changes from 67 % to 13 % when the speed is in the interval from 10 mm/s to 80 mm/s. For a pulse duration of 200 ns and a power density of 10.4 kW/mm², the contrast varies between 68 % and 40 % in the same speed interval.
- With increasing raster step, a decrease in contrast is observed for both types of lasers. For a speed of 45 mm/s and a fiber laser, the contrast varies from 82 % to 62 % when changing the raster step Δx in the range from 3 µm to 20 µm. For the same speed and a CuBr laser, the contrast varies from 80 % to 53 % when the raster step Δx is in the range from 3 µm to 27 µm.
- To obtain a given contrast with a CuBr laser, less effective energy is needed than with a fiber laser. This is due to the fact that the absorption capacity of the material for the radiation of the CuBr laser is greater than that of the fiber laser. It should be noted that the efficiency of the fiber laser is twice that of the CuBr laser. This indicates that the fiber laser is more suitable for marking the studied material compared to the CuBr laser.
The results provide valuable insights for operators of laser systems, offering a basis for populating technological tables with parameters needed for marking various products. The research method outlined in this study can also be extended to other materials and laser types. These findings represent a significant step toward a comprehensive understanding of the laser marking process and lay the groundwork for further exploration of additional technological parameters.
Acknowledgement
The authors gratefully acknowledge financial support by the European Regional Development Fund, Postdoctoral research aid Nr. 1.1.1.2/16/I/001 research application "Analysis of the parameters of the process of laser marking of new industrial materials for high-tech applications, Nr. 1.1.1.2/VIAA/3/19/474". This study has been supported by a grant from the European Social Fund in frames of the research project “To strengthen the academic staff of higher education institutions in the areas of strategic specialisation of RTA, VeA and ViA”. Project No. 8.2.2.0/20/I/005”.
References
- Gao, M.Y.; et al. Progress in surface treatment techniques of copper and copper alloys. Chinese Journal of Nonferrous Metals 2021, 31, 1121–1133. [Google Scholar] [CrossRef]
- Lazov, L.; et al. Laser Marking Methods. Environment Technology Resources Proceedings 2015, 1, 108. [Google Scholar] [CrossRef]
- Naumova, M.G.; et al. Copper Alloy Marking by Altering its Surface Topology Using Laser Heat Treatment. Metallurgist 2018, 62, 464–469. [Google Scholar] [CrossRef]
- Astarita, A.; et al. Laser marking of titanium coating for aerospace applications. Procedia CIRP. 2015. [CrossRef]
- Jurčs, V.; et al. Influence of Technological Parameters on Laser Marking Process of Copper Surfaces. ETR Conference 2024, 3, 393–398. [CrossRef]
- Tsvyatkov, P.; et al. Investigation of the Influence of Technological Parameters of Laser Marking on the Degree of Contrast. ETR Conference 2023, 3, 370–374. [Google Scholar] [CrossRef]
- Ghalot, R.S.; et al. Investigation of Roughness and Microhardness in Laser Texturing of Copper. Coatings, 2023, 13, 1970. [Google Scholar] [CrossRef]
- Fraser, A.; et al. Analysis of Laser Marking Performance on Non-ferrous Metals. In: Light Metals, Springer, 2018. [Google Scholar] [CrossRef]
- Žemaitis, A.; et al. Highly-efficient laser ablation of copper by fs-ps pulses. Sci Rep 2019, 9, 12280. [Google Scholar] [CrossRef] [PubMed]
- Husinsky, W.; et al. Ultrashort laser pulse ablation of copper, silicon and gelatin. Appl. Phys. A 2016, 122, 107. [Google Scholar] [CrossRef]
- Mustafa, H.; et al. Pulse duration and material removal on galvanized steel. J. Laser Appl. 2020, 32, 022015. [Google Scholar] [CrossRef]
- Ehrhardt, M.; et al. Laser embossing of microstructures in copper. Physics Procedia 2012, 39, 735–742. [Google Scholar] [CrossRef]
- Li Ch et, a.l. Laser Marking of Data Matrix Codes on Metal Alloys. Key Eng. Mater. 2017, 744, 244–248. [Google Scholar] [CrossRef]
- Kalyon, M.; Yilbas, B. Laser pulse heating model for desired surface temp. Opt. Lasers Eng. 2003, 39, 109–119. [Google Scholar] [CrossRef]
- Gorbatyuk, S.M.; et al. Color Mark Formation on Metal Surface by Laser. Metallurgist 2016, 60, 646–650. [Google Scholar] [CrossRef]
- Li, Ch. Laser marked data matrix symbols quality. IOP Conf. Ser. Mater. Sci. Eng. 2018, 380, 012023. [Google Scholar] [CrossRef]
- Sobotova, L.; Demec, P. Laser Marking of Metal Materials. MM Sci. J. 2015, 808–812. [Google Scholar] [CrossRef]
- Grade of steel and alloys. Retrieved from http://www.splav-kharkov.com/mat_start.php?name_id=1117.
- Laser system Rofin PowerLine F 20 Varia. Retrieved from https://www.innotech-laser.com/wp-content/uploads/2014/12/PL_F_englisch_Endstand.pdf.
- Astadjov, D.; Stoychev, L.; Sabotinov, N. (M2 of MOPA CuBr Laser Radiation. Optics and Quantum Electronics 2007, 39, 603–610. [Google Scholar] [CrossRef]
- Yulmetova, O. S. , & Tumanova, M. A. Laser marking of contrast images for optical read-out systems. IOP Conf. Series: Journal of Physics: Conf. Series 2017, 917, 052007. [Google Scholar] [CrossRef]
Disclaimer/Publisher’s Note: The statements, opinions and data contained in all publications are solely those of the individual author(s) and contributor(s) and not of MDPI and/or the editor(s). MDPI and/or the editor(s) disclaim responsibility for any injury to people or property resulting from any ideas, methods, instructions or products referred to in the content. |
© 2025 by the authors. Licensee MDPI, Basel, Switzerland. This article is an open access article distributed under the terms and conditions of the Creative Commons Attribution (CC BY) license (https://creativecommons.org/licenses/by/4.0/).
Copyright: This open access article is published under a Creative Commons CC BY 4.0 license, which permit the free download, distribution, and reuse, provided that the author and preprint are cited in any reuse.


