
Submitted:
21 September 2025
Posted:
22 September 2025
You are already at the latest version
Abstract
In this study, we focus on the influence of basic parameters such as raster step, speed, frequency, linear energy density and scanning overlap coefficient on the process of raster laser marking of AISI 304 stainless steel samples. The change of the studied parameters is analyzed in relation to the resulting roughness in the processing area and is compared with the corresponding color coordinates of the resulting color markings in these areas. It is shown that each specific color is associated with a nanostructure as a result of the interaction between laser radiation with a certain laser energy density and the processed material. The present study is a small contribution to the topic of laser texturing of various materials, which allows obtaining new surface properties, with excellent wetting properties, which can be shown as exceptional water repellency, increased corrosion resistance, protection against icing, reduced resistance to laminar and turbulent flows, self-healing, antibacterial action, etc.
Keywords:
laser color marking
; AISI 304
; raster step
; speed
; frequency
; roughness
1. Introduction
Laser processing techniques, such as Laser Color Marking (LCM), have gained significant attention in recent years due to their ability to produce aesthetic, functional, and durable markings on metal surfaces. One of the most frequently studied materials for laser surface modification is AISI 304 stainless steel, a widely used alloy in various industries due to its excellent corrosion resistance, mechanical properties, and versatility. This material is especially prevalent in the food, chemical, medical, and aerospace industries, where stainless steel components are often exposed to extreme conditions, including high temperatures, corrosive environments, and mechanical wear [1]. The material’s aesthetic appeal, due to its ability to maintain its luster and resistance to tarnishing, makes it ideal for high-end appliances and visible applications, such as in architectural surfaces, medical devices, and decorative elements [2]. The ability to achieve precise and reproducible markings, such as color variations and identification codes, is crucial for traceability, branding, and functional applications in these sectors [3].
In particular, AISI 304 stainless steel finds broad use in automotive parts, kitchen equipment, pharmaceutical containers, and aircraft components, where the combination of strength and resistance to oxidation is critical [4]. However, despite its widespread application, the laser surface treatment of AISI 304 presents significant challenges. The process of laser color marking on stainless steel is primarily driven by the formation of oxide layers on the surface. These layers produce different colors due to light interference upon reflection, with the specific color determined by variations in oxide layer thickness. Factors such as laser power, scanning speed, pulse frequency, and hatch spacing directly influence the oxide layer formation, surface roughness, and color outcomes [5,6,7]. These complex relationships, while pivotal to achieving consistent and high-quality marks, are not fully understood, particularly in terms of how the interaction of these parameters affects the surface morphology and color consistency [8].
Nanosecond pulsed lasers have emerged as a key tool for surface treatment due to their ability to induce precise thermal and optical effects on materials, including oxide layer formation and color generation. These lasers, with pulse durations in the range of nanoseconds, provide a highly controlled thermal input that is suitable for generating thin oxide films without significantly melting or deforming the underlying material. Studies have demonstrated that nanosecond lasers are particularly effective for color marking on metals like stainless steel, as they allow for fine control of pulse energy and fluence, which directly impacts the thickness and uniformity of the oxide layer, and thus the resulting color formation [9,10,11]. In addition, laser parameters, including pulse frequency and scanning speed, are critical for achieving stable and reproducible color marks, which remain a challenge in industrial applications [12,13].
A major concern in the industrial application of laser color marking is the reproducibility of the marking process, especially under the high throughput conditions required in manufacturing environments. To achieve uniform, durable, and aesthetic color in industrial settings, a deep understanding of how processing parameters affect the roughness and optical properties of laser-marked surfaces is essential. Moreover, the energy input, thermal effects, and material properties must be precisely controlled to ensure the formation of high-quality oxide layers without undesirable side effects, such as excessive roughness or inconsistent color formation [14,15,16,17].
The purpose of this study is to analyze the influence of some key technological parameters—processing speed (v), raster step (Δx), frequency (ν), linear energy density (El), scan overlap coefficient (ksoc)—on the roughness (Ra) and color formation during laser color marking of AISI 304 stainless steel samples using a nanosecond laser. Since the color effect of the processed area is primarily due to the diffraction of light from periodic surface structures and oxide layers, the laser raster marking process is examined with particular attention to how these parameters influence the surface morphology and oxide layer growth. These processing parameters are interrelated and also directly affect the energy factors of the process, such as the linear pulse density and the energy density in the treated zone. Understanding these relationships provides essential insights into the initiation and control of laser-induced coloration, with the aim of achieving stable, reproducible, and industrially viable laser marking outcomes.
2. Material, Equipment and Methods
2.1. Material: AISI 304 Stainless Steel
The selected material for the experiments was AISI 304 stainless steel, one of the most widely used and versatile grades of stainless steels. It combines excellent corrosion resistance, weldability, and mechanical properties with relatively low cost, making it suitable for applications in the food, chemical, medical, aerospace, and household industries. Typical applications include tanks for liquids and chemicals, kitchen and pharmaceutical equipment, and components in machinery and microelectronics.
2.2. Laser System
During the study of the marking process, the laser intensity is controlled and scanned based on pre-selected marking parameters, which are edited using a graphical tool. The experiments were conducted using a pulsed optical laser system, specifically designed for high-precision marking applications. The laser operates in the near-infrared range (λ = 1064 nm) and offers excellent beam quality (M² < 1.1) along with high positioning accuracy (± 2.5 μm). It provides a wide range of adjustable parameters, including power, frequency, and scanning speed, making it ideal for systematic color marking studies. The main technical specifications of the laser system are summarized in Table 3.
The laser marking process is carried out by controlling the laser intensity according to the pre-selected marking data, edited in a graphical tool. Positioning and guidance of the laser radiation are achieved using a scanner. The focusing optics ensure the necessary power density in the processing area, facilitating the research process by laser scanning across the sample surface (see Figure 1).
2.3. Experimental Methodology
To systematically study the influence of laser parameters on surface roughness and color formation, a matrix of marking experiments was designed. The matrix consisted of 5 rows and 8 squares per row (Figure 2). A raster marking method was applied, where each row was processed at different scanning speeds: v = 25, 50, 75, 100, and 125 mm/s, combined with raster steps Δx ranging from 20 μm to 80 μm.
The influence of laser frequency was studied at three levels: 20 kHz, 50 kHz, and 100 kHz.
The effective energy density in the irradiated area for the physical process of laser interaction of radiation with matter is calculated according to:
El =P/v , J/m , (1)
where P is the average laser power (W), v is the scanning speed (mm/s).
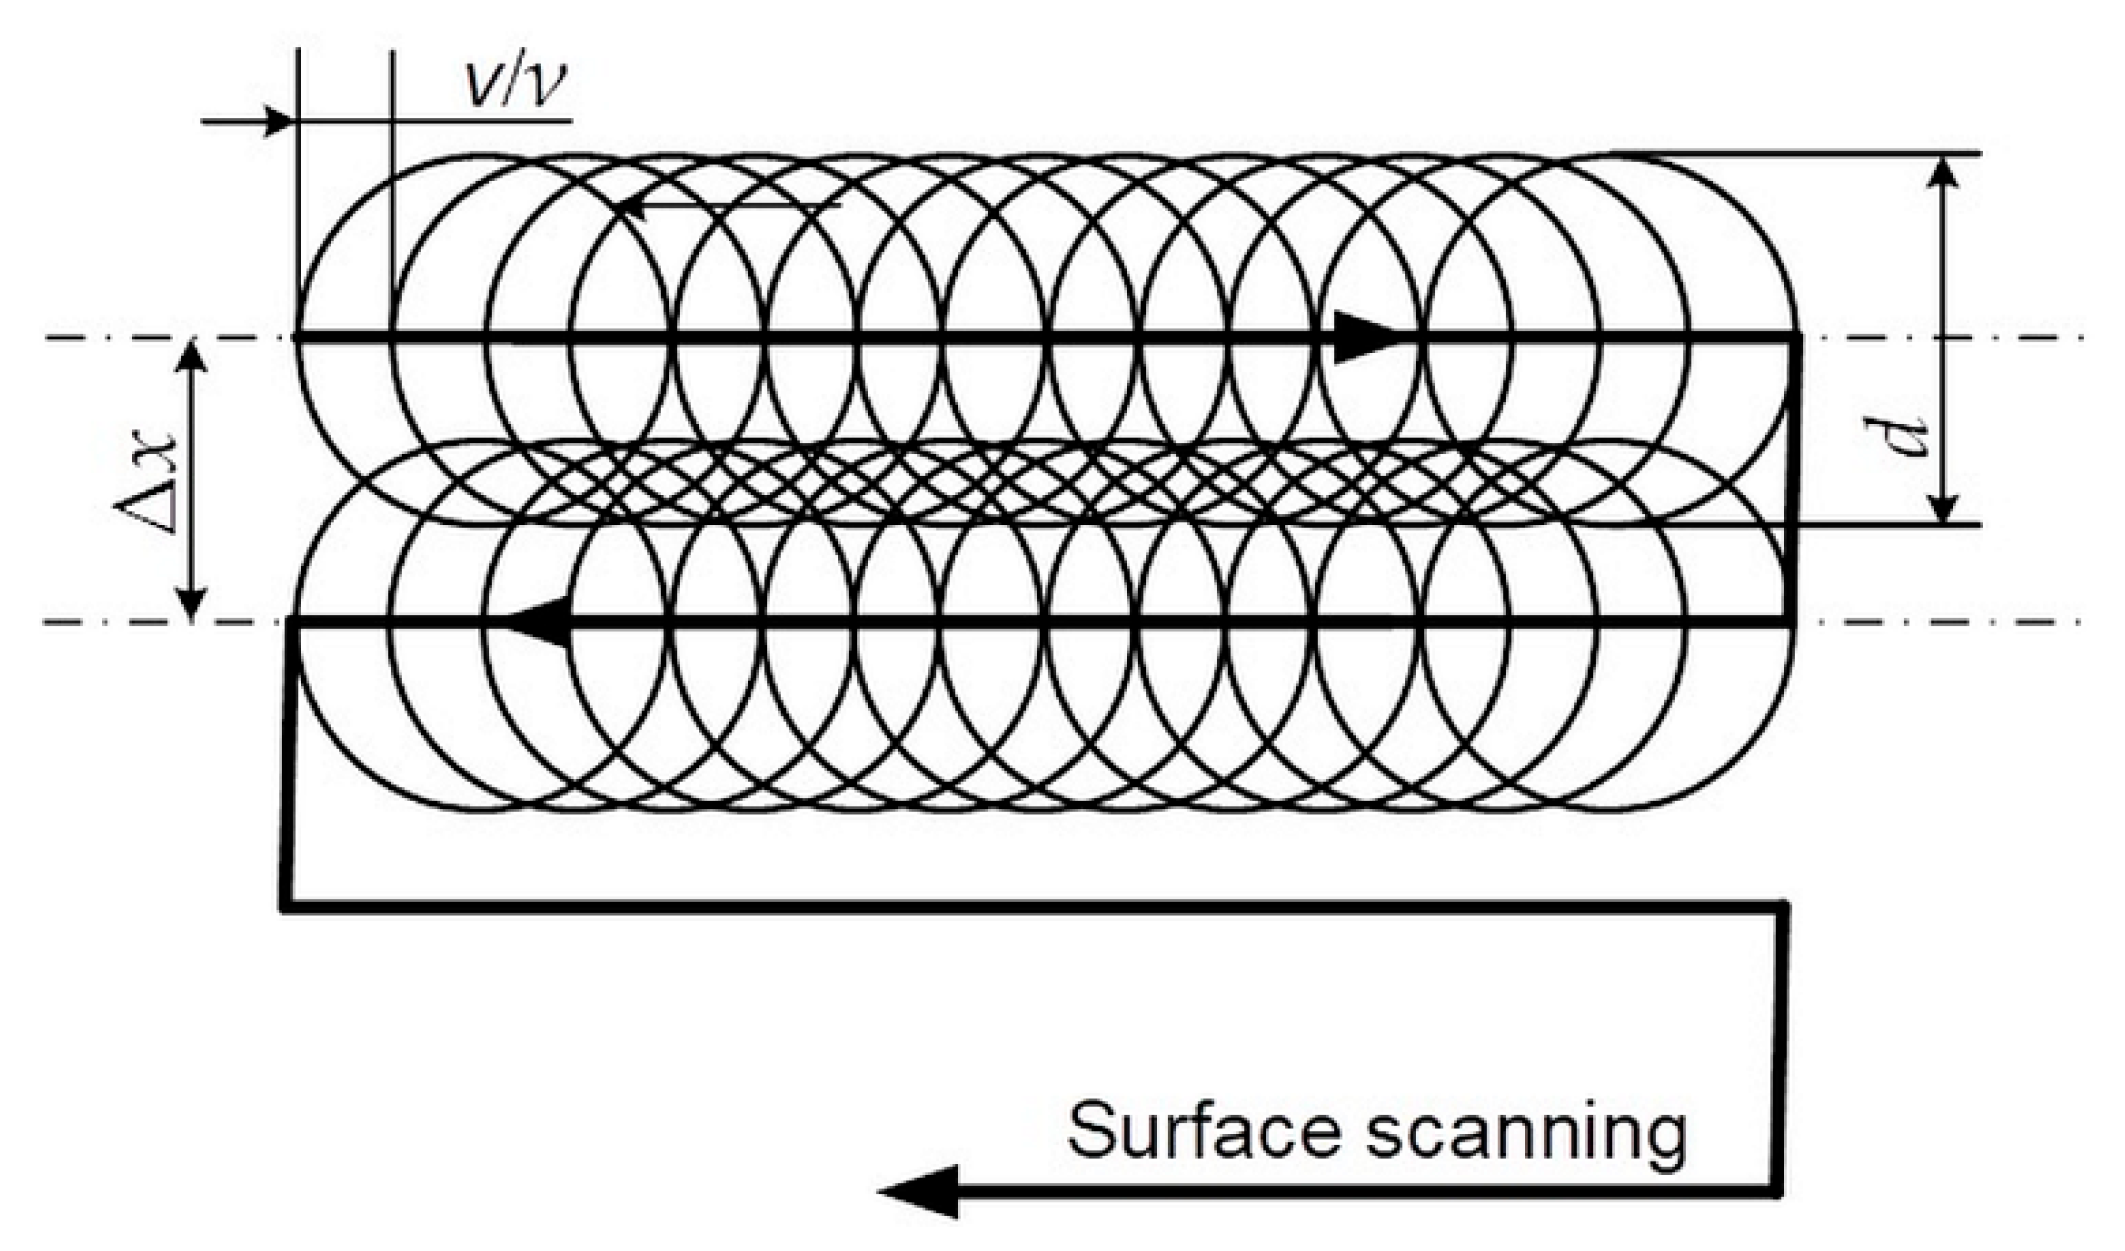
The degree of overlap in both X and Y directions depends on the spot size, frequency, scanning speed, and raster step (Figure 2). This overlap strongly affects both the surface roughness and the resulting color tones.
Figure 3.
Scheme of raster laser marking of a sample with speed v and raster step Δx.
2.4. Surface Roughness Measurements
Surface roughness of the marked zones was analyzed using a laser microscope OLS5100 for material analysis, providing high-resolution 3D imaging and precise roughness measurements. Key specifications are given in Table 4.
The microscope allowed quantitative evaluation of surface topography and correlation between roughness (Ra) and color appearance.
2.5. Measurement of Spectral Characteristics of Color-Marked Areas
Measurement of the reflectance spectra of colors obtained during laser marking of steel samples is performed using the Ocean Optics CHEM4-VIS-NIR USB4000 spectrophotometer. The spectrophotometer consists of a light source, a measuring probe and a meter in which the incoming light is analyzed. The optical probe is a bundle of optical fibers with the same diameter (600 μm), tightly packed and enclosed in a steel tube. Using this probe, we can perform reflection measurements, covering both the specular and diffuse components of the light. The spectrophotometer measures the amount of light, converts the received electrical signal into digital form and transmits the data to the computer. It compares the received signal with the reference signal and displays the spectral characteristic and spectral coordinates.
2.6. Investigated Functional Dependencies in the Conducted Experiments.
- The role of raster step Δx on roughness Ra = Ra (Δx)
- The role of speed v on roughness Ra = Ra (v)
- The role of frequency ν on roughness (column diagram) Ra = Ra (ν)
- The role of linear energy density El on roughness Ra = Ra (El) for obtaining a certain color in the processing area
- The role of the scan overlap coefficient ksoc on roughness Ra = Ra (ksoc)
3. Results
3.1. Influence of Raster Step on Roughness
The raster step changes in the interval Δx Є [20,80] µm. Experiments refer to five values of the speed of marking: v1 = 25 mm/s, v2 = 50 mm/s, v3 = 75 mm/s, v4 = 100 mm/s, and v5 = 125 mm/s. Microscopic images of marked samples for speed v1 = 25 mm/s and different frequencies, steps and roughness are shown in Figure 4. The parameters of the marked area in Figure 4a are frequency 20 kHz, raster step 20 μm and roughness 1.23 μm, and the color of the marking is dark brown. The image in Figure 4b is for frequency 50 kHz, raster step 20 μm and roughness 1.00 μm, and the resulting color is brown. The parameters of the marked area in Figure 4c are frequency 50 kHz, raster step 80 μm and roughness 1.29 μm, and the resulting color is yellow. The marking in Figure 4d is for frequency 100 kHz, raster step 70 μm and roughness 0.69 μm, and its color is light yellow.
The parameters that are kept constant are given in Table 5. The experimental results obtained by raster marking of a sample of 304 stainless steel with a fiber laser are presented in Figure 5.
From the graphics obtained from the experimental results, the following conclusions can be drawn:
- With increasing the raster step, an increase in roughness is observed for the five studied speeds and three frequencies;
- For a frequency of 20 kHz and a speed of 25 mm/s, the roughness increases from 1.23 μm to 1.47 μm for the raster step interval from 20 μm to 80 μm. For a frequency of 20 kHz and a speed of 125 mm/s, the roughness increases from 0.76 μm to 1.16 μm for the entire studied raster step interval;
- For a frequency of 50 kHz and a speed of 25 mm/s, the roughness changes from 1.00 μm to 1.29 μm for the raster step interval from 20 μm to 80 μm. For a frequency of 50 kHz and a speed of 125 mm/s, the roughness increases from 0.60 μm to 0.89 μm for the investigated raster pitch interval;
- For a frequency of 100 kHz and a speed of 25 mm/s, the roughness varies from 0.51 μm to 0.72 μm for the raster pitch interval from 20 μm to 80 μm. For a frequency of 100 kHz and a speed of 125 mm/s, the roughness varies from 0.25 μm to 0.48 μm for the investigated raster pitch interval;
- Graphics of the dependence of roughness on the raster pitch for a speed of 25 mm/s and three frequencies: 20 kHz, 50 kHz and 100 kHz are presented in Figure 6. For a frequency of 20 kHz, the roughness is about 15% greater than that for 50 kHz and 3-4 times greater than that for a frequency of 100 kHz.
3.2. Influence of Speed on Roughness
The speed varies in the interval v Є [25,125] mm/s. The experiments were conducted for three raster steps: Δx1 = 20 μm, Δx2 = 50 μm and Δx3 = 80 μm. The parameters that do not change during the experiments are given in Table 5. From the obtained graphics in Figure 7 it follows:
- With increasing speed, a nonlinear decrease in roughness is observed for the three studied raster steps and the three frequencies;
- For a frequency of 20 kHz and a raster step of 20 μm, the roughness decreases from 1.23 μm to 0.76 μm for the speed interval from 25 mm/s to 125 mm/s. For a frequency of 20 kHz and a raster step of 80 μm, the roughness decreases from 1.47 μm to 1.16 μm for the entire studied speed interval;
- For a frequency of 50 kHz and a raster step of 20 μm, the roughness changes from 1.00 μm to 0.60 μm for the studied speed interval. For a frequency of 50 kHz and a raster step of 50 μm, the roughness decreases from 1.29 μm to 0.89 μm for the studied speed interval;
- For a frequency of 100 kHz and a raster step of 20 μm, the roughness varies from 0.51 μm to 0.25 μm for the studied speed interval. For a frequency of 100 kHz and a raster step of 80 μm, the roughness varies from 0.72 μm to 0.48 μm for the studied speed interval.
- The graphics of the dependence of roughness on speed for a raster step of 20 μm and three frequencies: 20 kHz, 50 kHz and 100 kHz are presented in Figure 8. For the frequency of 20 kHz, the roughness is about 20 % greater than that for 50 kHz and about 2.5 times greater than that for the frequency of 100 kHz.
3.3. Influence of the Linear Energy Density on the Roughness
The linear energy density varies in the interval El Є [1.60, 8.00] J/cm. The experiments were conducted for three frequencies: ν1 = 20 kHz, ν2 = 50 kHz and ν3 = 100 kHz. The following conclusions can be made from the obtained graphics in Figure 9:
- With increasing linear energy density, a nonlinear increase in roughness is observed for the three studied frequencies;
- For a frequency of 20 kHz, the roughness increases from 0.76 μm to 1.23 μm for the linear energy density interval from 1.60 J/cm to 8.00 J/cm;
- For a frequency of 50 kHz, the roughness varies from 0.60 μm to 1.00 μm for the studied linear energy density interval;
- For a frequency of 100 kHz, the roughness increases from 0.25 μm to 0.51 μm for the studied linear energy density interval.
3.4. Influence of the Scan Overlap Coefficient on the Roughness
The scanning overlap coefficient changes in the interval ksoc Є [-14.3, 71.4] J/cm. The experiments were conducted for three frequencies: ν1 = 20 kHz, ν2 = 50 kHz and ν3 = 100 kHz. The following conclusions can be drawn from the obtained graphics in Figure 10:
- With increasing scanning overlap coefficient, a linear decrease in roughness is observed for the three studied frequencies;
- For a frequency of 20 kHz, the roughness decreases from 1.47 μm to 1.23 μm for the scanning overlap coefficient interval from (- 10.4) % to 71.4 %;
- For a frequency of 50 kHz, the roughness changes from 1.29 μm to 1.00 μm for the studied scanning overlap coefficient interval;
- For a frequency of 100 kHz, the roughness decreases from 0.72 μm to 0.51 μm for the studied scanning overlap coefficient interval.
3.5. Influence of Frequency on Roughness
A tabular graphic is presented in Figure 11 for the three studied frequencies 20 kHz, 50 kHz and 100 kHz, with all three zones marked at a speed of 25 mm/s and a raster step of 20 μm. With increasing frequency, a decrease in the roughness of the marking is observed, and its color changes from dark color (brown) to light color (yellow).
3.6. Relationship Between Technological parameters And Color Contrast
From the results obtained, some of which are presented in Table 6, we identified some relationships and trends between technological parameters and roughness and color contrast:
- With increasing raster step, the roughness of the marked areas increases and a change in the marking from dark (brown color) to light (yellow color) is observed when the other technological parameters are kept constant;
- With increasing speed, the roughness of the marked areas decreases and a change in the marking from dark to light is observed;
- With increasing frequency, the roughness of the marked areas decreases and a lightening of the marking is observed;
- Increasing the linear energy density leads to an increase in the roughness of the marked areas and a darkening of the marking;
- Increasing the scanning overlap coefficient leads to an increase in the roughness of the marked areas and a darkening of the marking.
5. Conclusions
The conducted experiments demonstrate that laser processing parameters exert a direct and quantifiable influence on both the surface roughness and the color contrast of AISI 304 stainless steel. It was established that increasing the raster step from 20 µm to 80 µm leads to a consistent increase in roughness—for example, from 1.23 µm to 1.47 µm at 20 kHz and 25 mm/s—accompanied by a shift from dark brown to lighter yellow hues. Conversely, raising the scanning speed from 25 mm/s to 125 mm/s produced a nonlinear reduction in roughness, such as from 1.23 µm to 0.76 µm at 20 kHz and Δx = 20 µm, which correlated with a progressive lightening of the surface color.
Frequency was found to be a critical factor: increasing it from 20 kHz to 100 kHz resulted in up to a threefold decrease in roughness (e.g., from 1.23 µm down to 0.25 µm at 20 µm raster step and 125 mm/s) and a corresponding shift from dark to bright yellow color tones. Similarly, higher linear energy density values (1.60–8.00 J/cm) caused roughness to increase nonlinearly (from 0.76 µm to 1.23 µm at 20 kHz) and the surface color to darken. In contrast, a higher overlap coefficient produced the opposite trend, reducing roughness while maintaining lighter coloration.
These dependencies highlight that the formation of stable and reproducible interference colors is strongly linked to controlled nanostructuring of the surface. The results not only clarify the mechanisms of color generation through oxide layer thickness and roughness modulation but also provide quantitative process windows for achieving desired chromatic effects. The established correlations create a basis for transferring laser color marking into industrial practice where both aesthetic differentiation and functional improvements—such as corrosion resistance, hydrophobicity, and antibacterial performance—are required.
Funding
The authors gratefully acknowledge financial support by the European Regional Devel-opment Fund, Postdoctoral research aid Nr. 1.1.1.2/16/I/001 research application “Analysis of theparameters of the process of laser marking of new industrial materials for high-tech applications, Nr.1.1.1.2/VIAA/3/19/474”.
Data Availability Statement
The original contributions presented in this study are included in thearticle. Further inquiries can be directed to the corresponding author.
Acknowledgments
This researchwas funded by the European Regional Development Fund within the OP “Research, Innovation and Digitalization Programme for Intelligent Transformation 2021–2027”, Project No. BG16RFPR002-1.014-0005 Center of Competence “Smart Mechatronics, Eco- and Energy Saving Systems and Technologies”.
Conflicts of Interest
The authors declare no conflict of interest.
References
- Linggam, R.; Quazi, M.M.; Bashir, M.N.; Aiman, M.H.; Qaban, A.; Dave, F.; Ali, M.M. A Review on the Formation of Colors on SS304 Stainless Steel Induced by Laser Color Marking Technique. J. Manuf. Mater. Process. 2021, 5, 123. [Google Scholar] [CrossRef]
- Veiko, V.P.; Odintsova, G.V.; Loginova, M.M.; Goloshevsky, E.S.; Uglov, S.A.; Slobodkin, I.M. Controlled Oxide Films Formation by Nanosecond Laser Pulses for Color Marking. Opt. Express 2014, 22, 24342–24347. [Google Scholar] [CrossRef] [PubMed]
- Swayne, J.; Youngs, D.; Halcovitch, N.; Griggs, A.J.; Grayson, M.; Perston, S.; Carter, L.N. Exploring the Impact of Laser Surface Oxidation Parameters on Surface Chemistry and Colour of Stainless Steel. Int. J. Refract. Met. Hard Mater 2024, 118, 106542. [Google Scholar] [CrossRef]
- Laser Color Marking of Stainless Steel—Investigation of the Fluence-Dependent and Thermal Mechanisms in Generating Laser-Induced Surface Modifications. Procedia CIRP 2024, 128, 345–352. [CrossRef]
- Leone, C.; Genna, S.; Caprino, G.; De Iorio, I. AISI 304 Stainless Steel Marking by a Q-Switched Diode-Pumped Nd:YAG Laser. J. Mater. Process. Technol. 2010, 210, 1297–1303. [Google Scholar] [CrossRef]
- Amara, E.H.; Haïd, F.; Noukaz, A. Experimental Investigations on Fiber Laser Color Marking of Steels. Appl. Surf. Sci. 2015, 351, 142–150. [Google Scholar] [CrossRef]
- Cui, C.Y.; Cui, X.G.; Ren, X.D.; Qi, M.J.; Hu, J.D.; Wang, Y.M. Surface Oxidation Phenomenon and Mechanism of AISI 304 Stainless Steel Induced by Nd:YAG Pulsed Laser. Appl. Surf. Sci. 2014, 305, 817–822. [Google Scholar] [CrossRef]
- Lu, Y.; Tan, Q.; Xia, X.; Xu, S.; Wang, Z.; Zhou, H. Nanosecond Laser Coloration on Stainless Steel Surface. Sci. Re 2017, 7, 15538. [Google Scholar] [CrossRef] [PubMed]
- Wang, J.; Fan, P.; et al. Enhancement of Laser-Induced Surface Coloring via Nanosecond Laser Double-Pulse Processing. Lasers Manuf. Mater. Process. 2020, 7, 345–359. [Google Scholar] [CrossRef]
- Qin, Z.; Wu, Y.; Wang, X.; Zhang, S.; Li, L. Laser Colour Reproduction Study of Stainless Steel AISI 304. Appl. Sci. 2024, 15, 28. [Google Scholar] [CrossRef]
- Zhang, D.; Yan, C.; Chen, J.; et al. Structural Colours on Steel Enabled by Laser-Induced Periodic Surface Structures and Oxide Films. Adv. Photonics Res. 2024, 5, 2300349. [Google Scholar] [CrossRef]
- Geng, H.; Huang, W.; et al. High-Speed Plasmonic Laser Writing of Structural Colours on Metals. Nat. Commun. 2023, 14, 7378. [Google Scholar] [CrossRef] [PubMed]
- Outokumpu. Core 304/4301 Datasheet. Available online: https://www.outokumpu.com (accessed on 23 August 2025).
- AZoM. Medical Applications of Stainless Steel 304 (UNS S30400). AZoM.com (2012). Available online: https://www.azom.com/article.aspx?ArticleID=6891 (accessed on 23 August 2025).
- Pandey, A.K.; Singh, V.; Kumar, S.; et al. Parametric Analysis of Fiber Laser Marking on AISI 304 Stainless Steel. IOP Conf. Ser. Mater. Sci. Eng. 2022, 1252, 012003. [Google Scholar] [CrossRef]
- Dobrotvorskiy, S. , Gnilitskyi L., Aleksenko B., Basova Y., Zawadzki P., Mikołaj Kościński M. 20 January 1003; 18. [Google Scholar] [CrossRef]
- Qin, Q. , Chen G., Parameters on Surface Roughness of Metal Parts by Selective Laser Melting, Advanced Materials Research, Vols. [CrossRef]
- Xiao, B. , & Zhang, Y. (2007). Marangoni and Buoyancy Effects on Direct Metal Laser Sintering with a Moving Laser Beam. Numerical Heat Transfer, Part A: Applications. [CrossRef]
Figure 1.
Fibre Laser System used in the research.
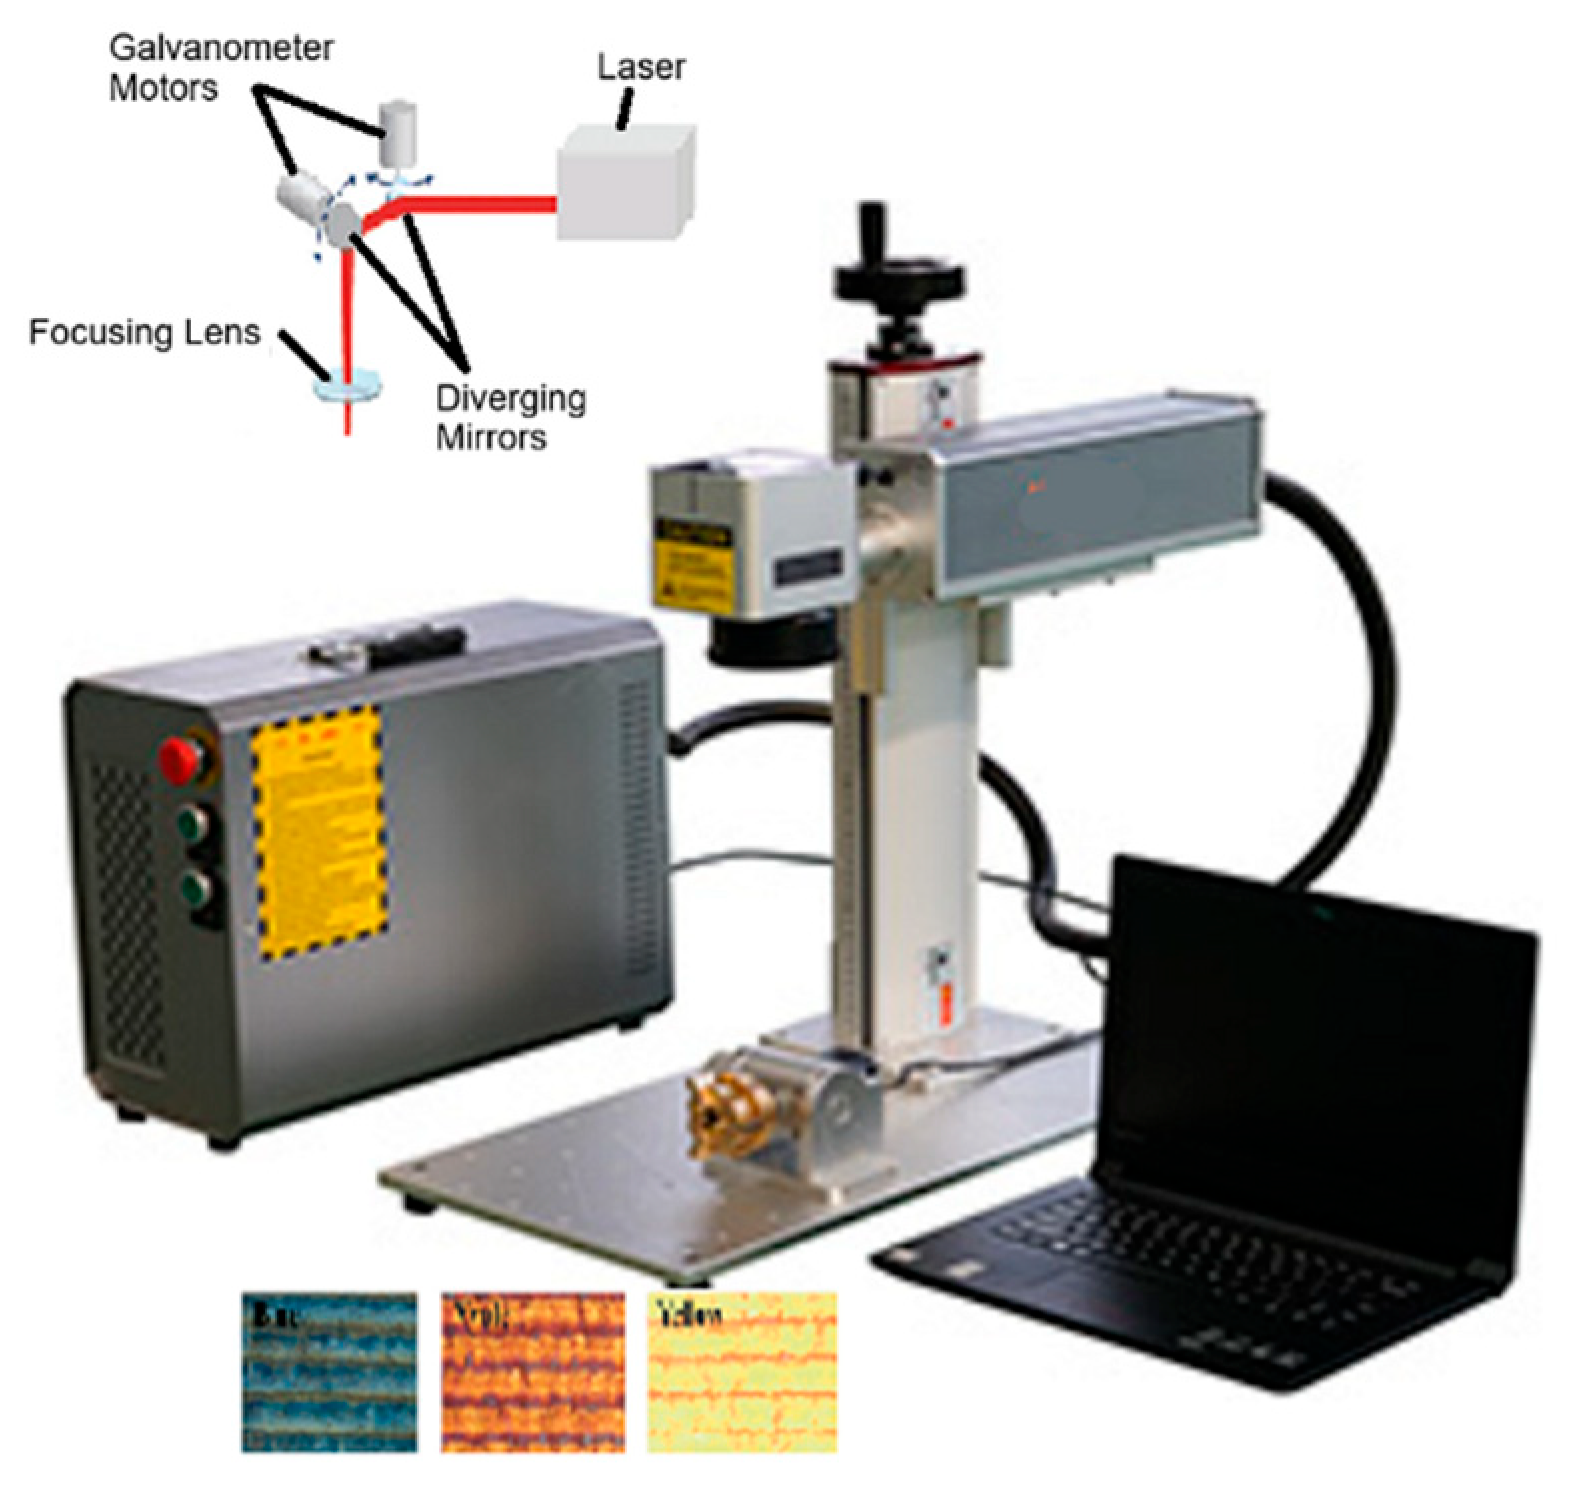
Figure 2.
Scheme of the matrix for conducting experiments for frequences 20 kHz, 50 kHz and 100 kHz.
Figure 2.
Scheme of the matrix for conducting experiments for frequences 20 kHz, 50 kHz and 100 kHz.
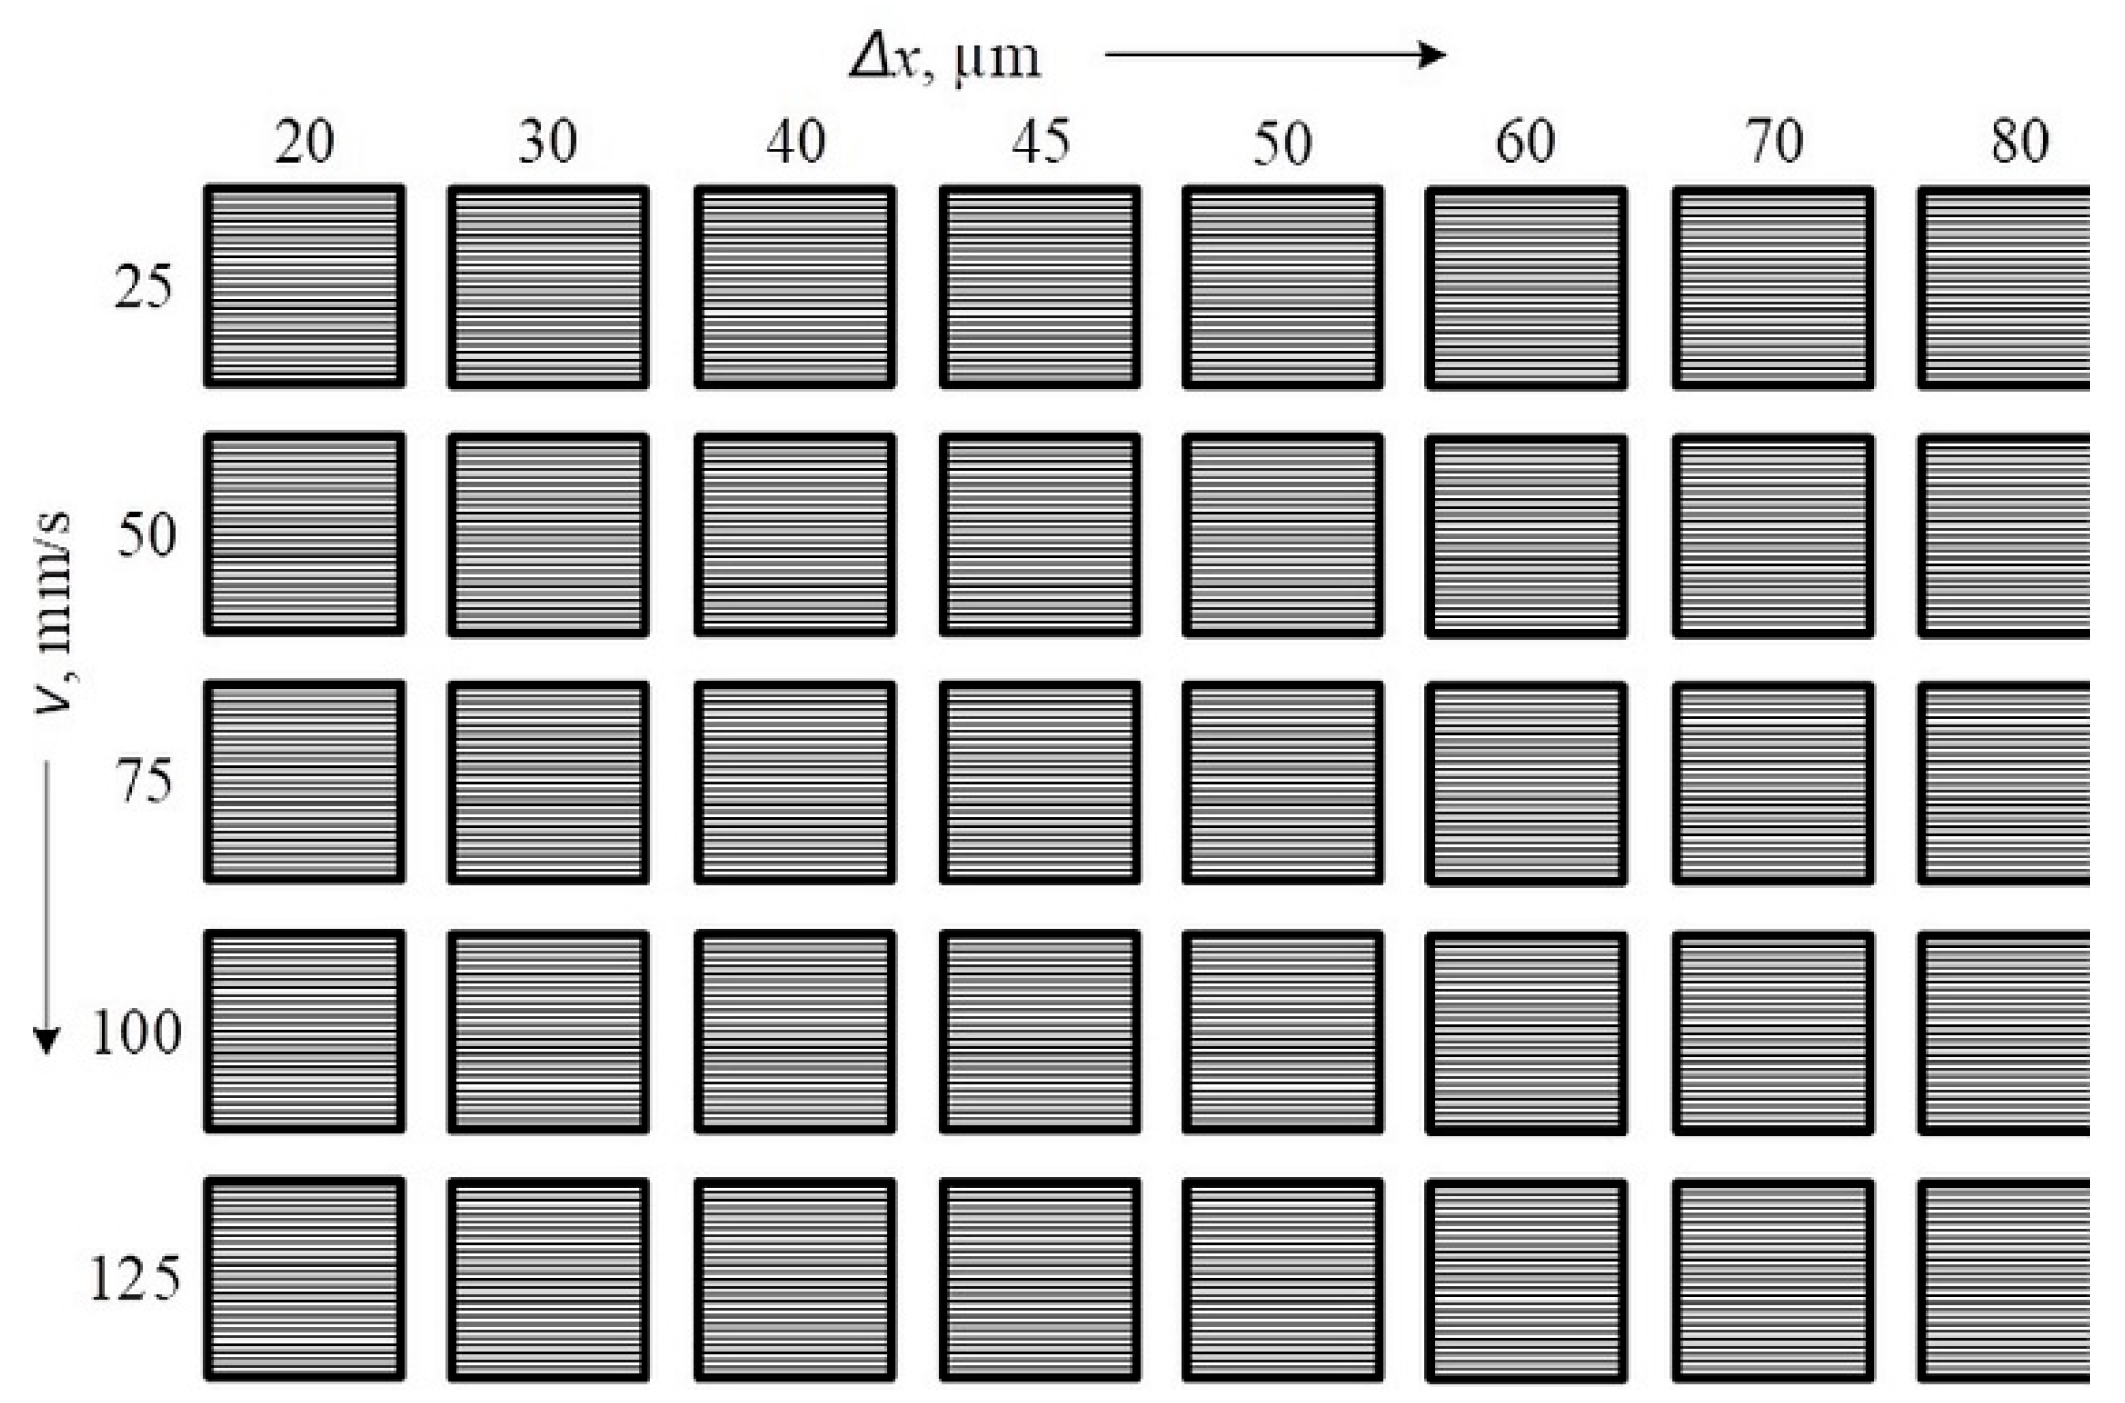
Figure 4.
Marked fields with a fiber laser on AISI 304 stainless steel samples with the following parameters: a) 20 kHz, 20 μm, and 25 mm/s; b) 50 kHz, 20 μm, and 25 mm/s; c) 50 kHz, 80 μm, and 25 mm/s; d) 100 kHz, 70 μm, and 25 mm/s.
Figure 4.
Marked fields with a fiber laser on AISI 304 stainless steel samples with the following parameters: a) 20 kHz, 20 μm, and 25 mm/s; b) 50 kHz, 20 μm, and 25 mm/s; c) 50 kHz, 80 μm, and 25 mm/s; d) 100 kHz, 70 μm, and 25 mm/s.
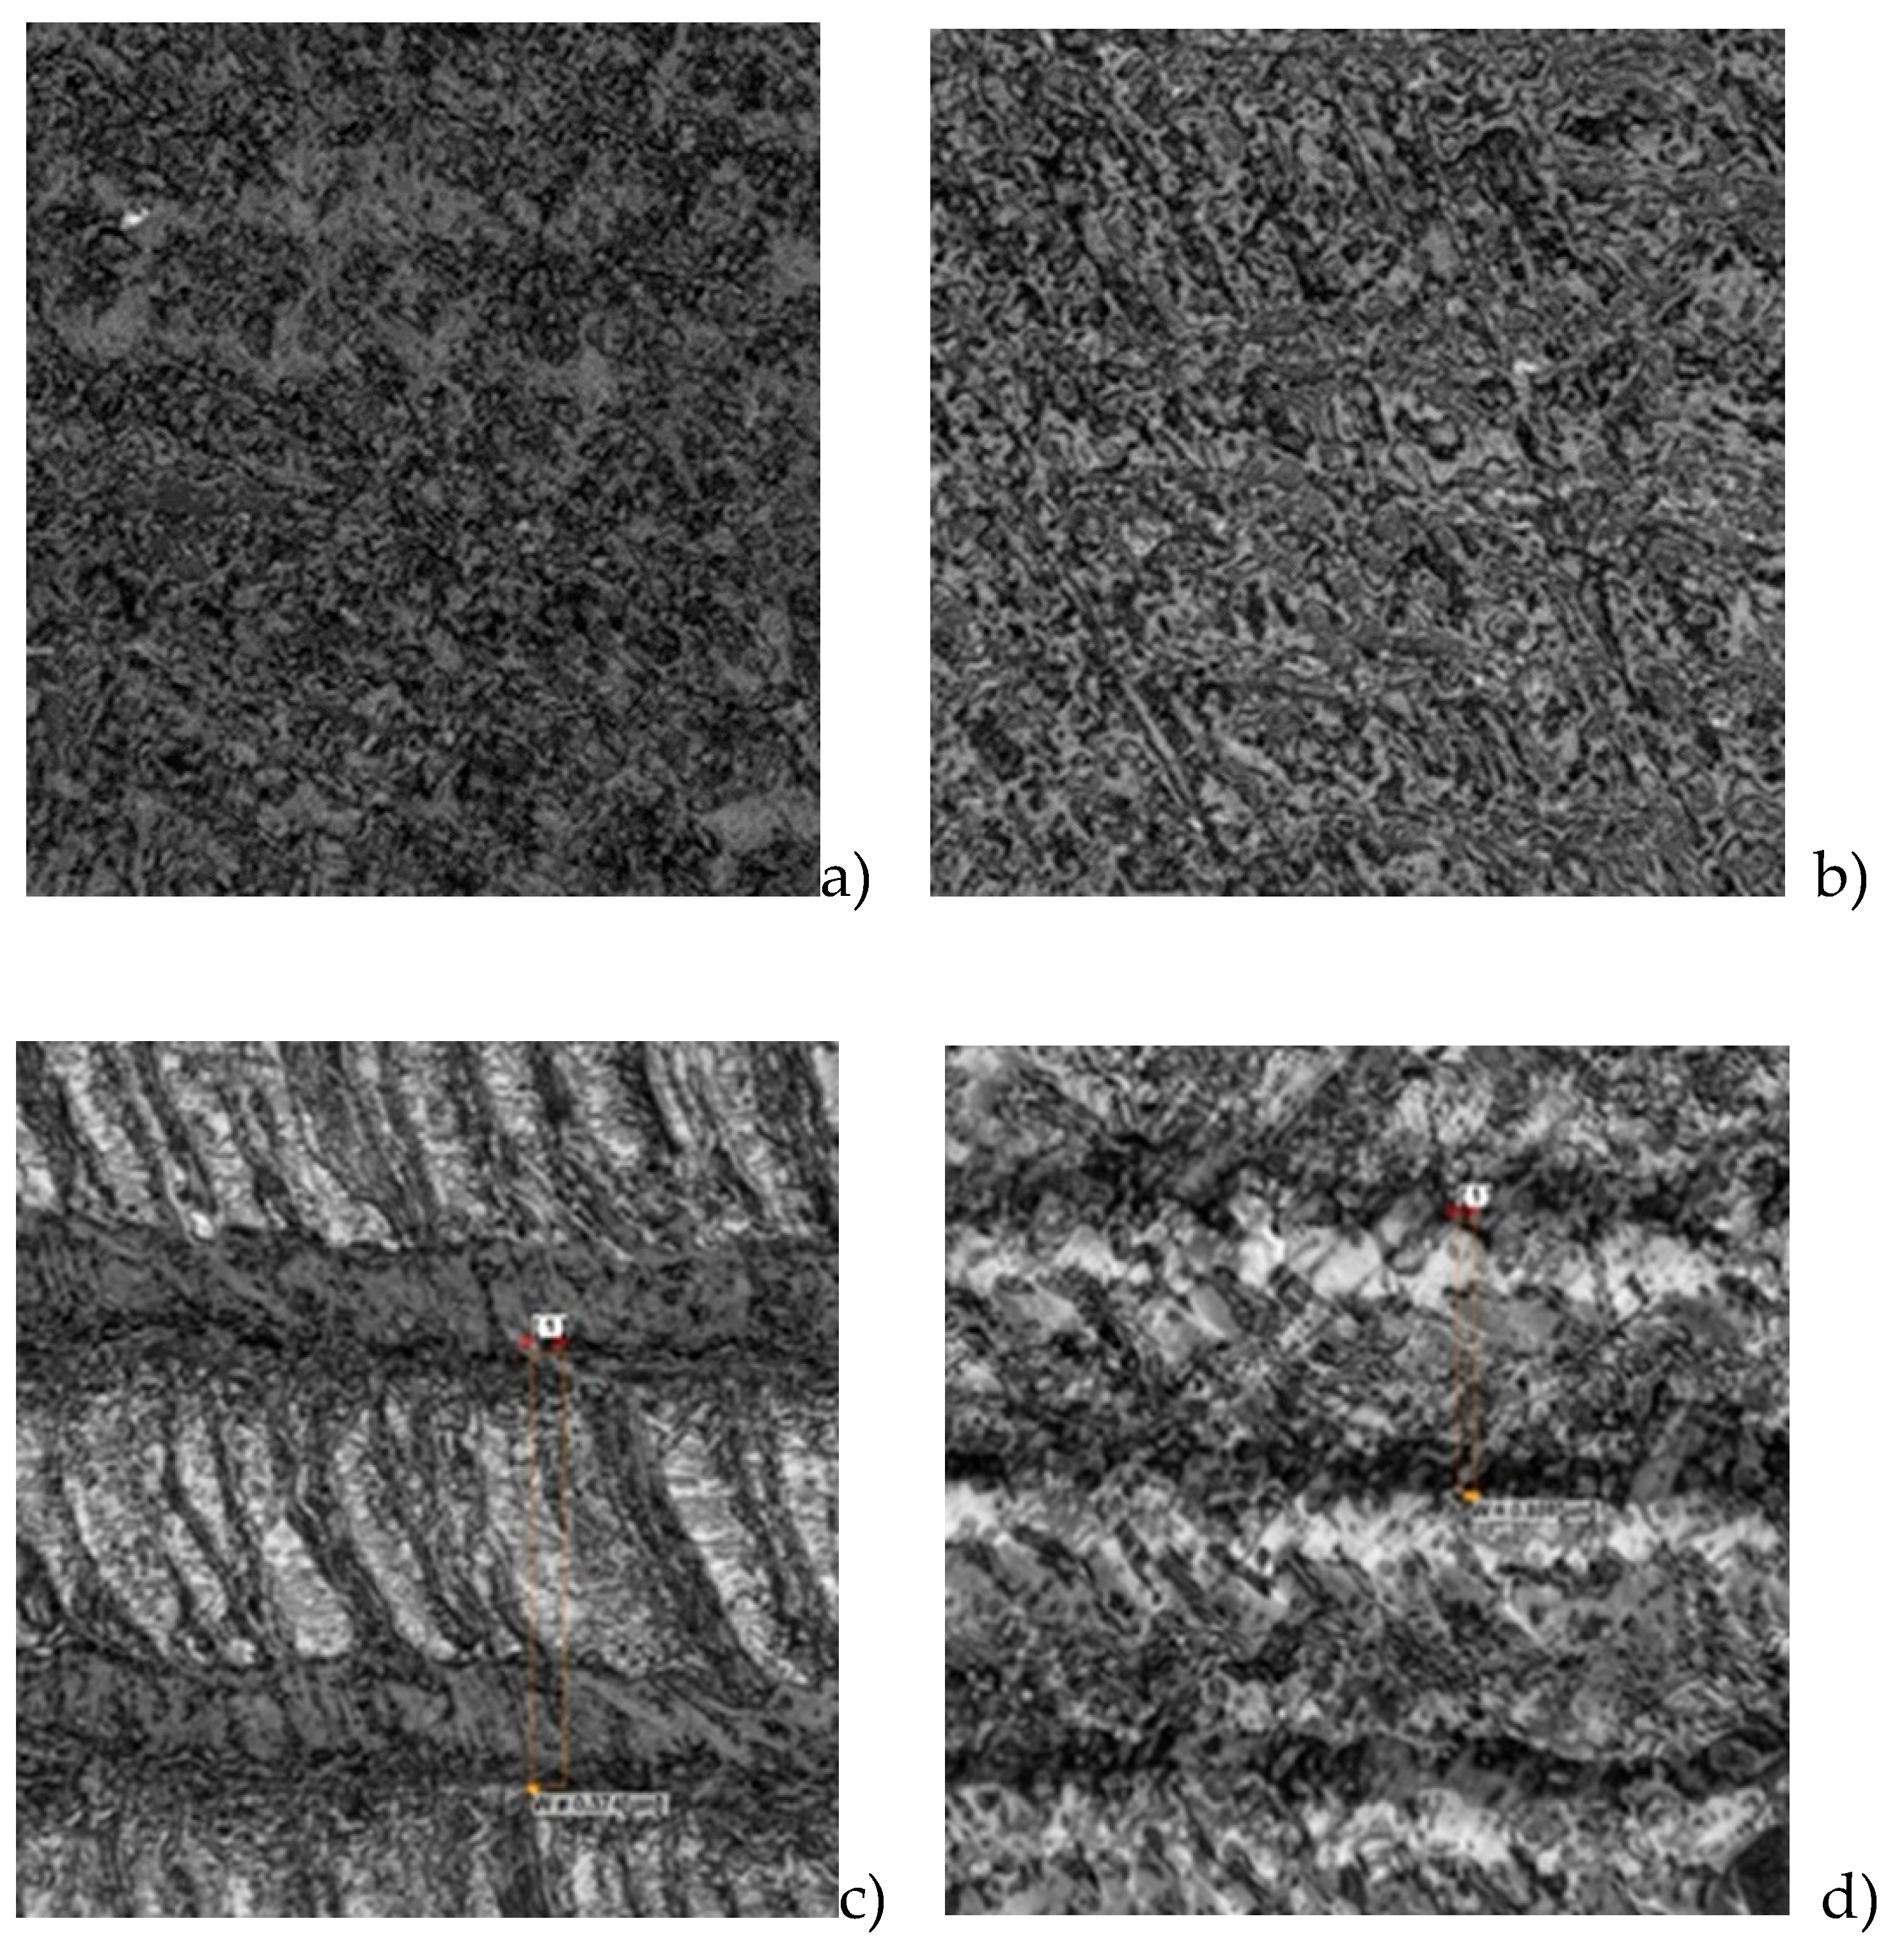
Figure 5.
Graphics of the dependence of roughness on the raster step for five speeds: blue color — 25 mm/s; orange color — 50 mm/s, green color — 75 mm/s, yellow color — 100 mm/s and red color — 125 mm/s and frequencies of: a) 20 kHz, b) 50 kHz and c) 100 kHz. The black dotted line is the roughness of the unprocessed surface.
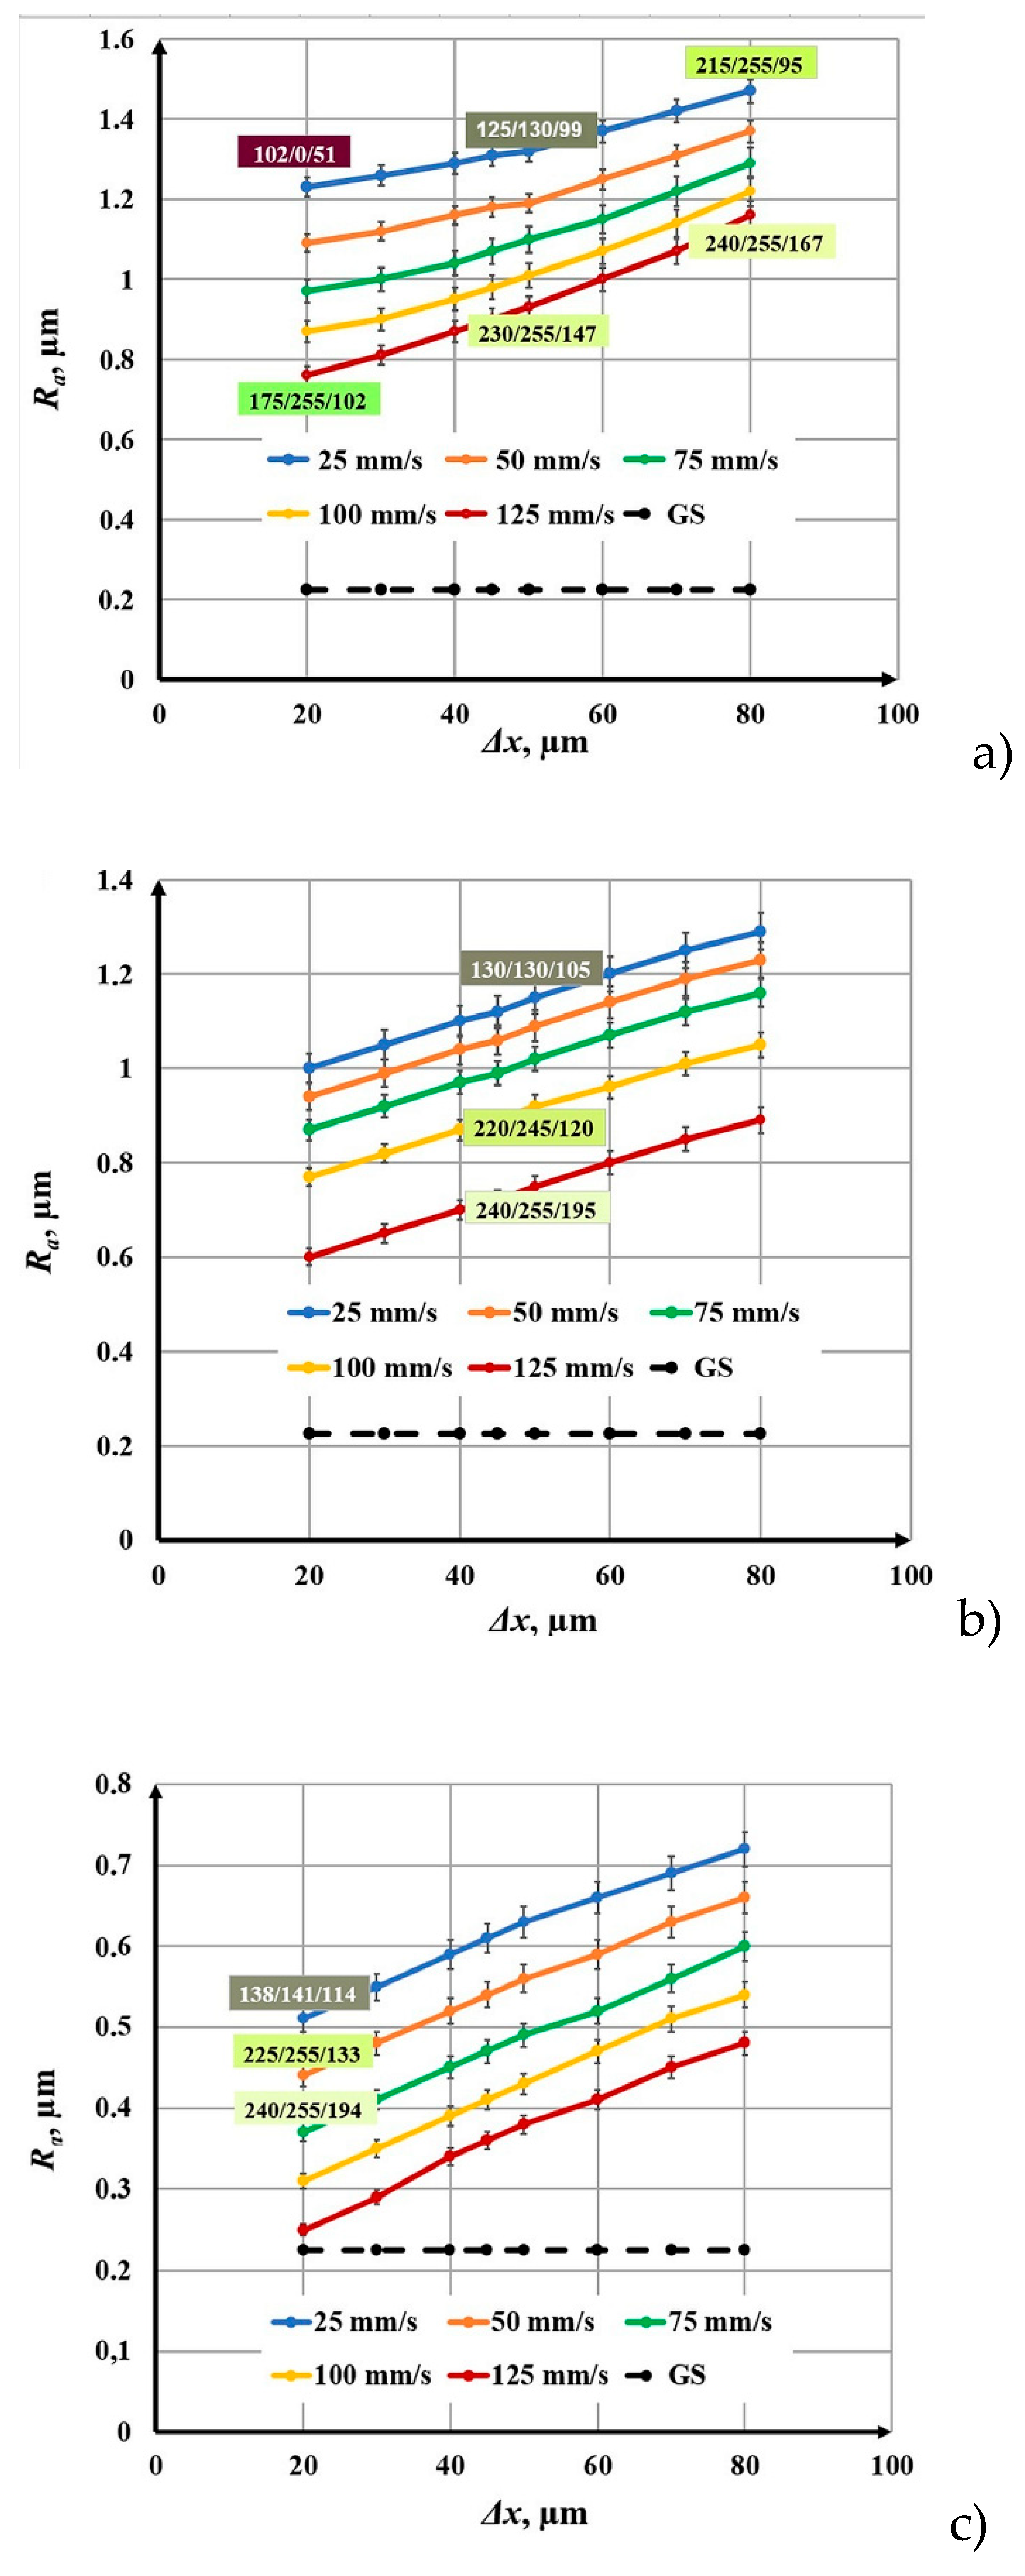
Figure 6.
Graphics of the dependence of roughness on the raster step for speed 25 mm/s and three frequencies: blue color — 20 kHz; orange color — 50 kHz and green color — 100 kHz. The black dotted line is the roughness of the unprocessed surface.
Figure 6.
Graphics of the dependence of roughness on the raster step for speed 25 mm/s and three frequencies: blue color — 20 kHz; orange color — 50 kHz and green color — 100 kHz. The black dotted line is the roughness of the unprocessed surface.
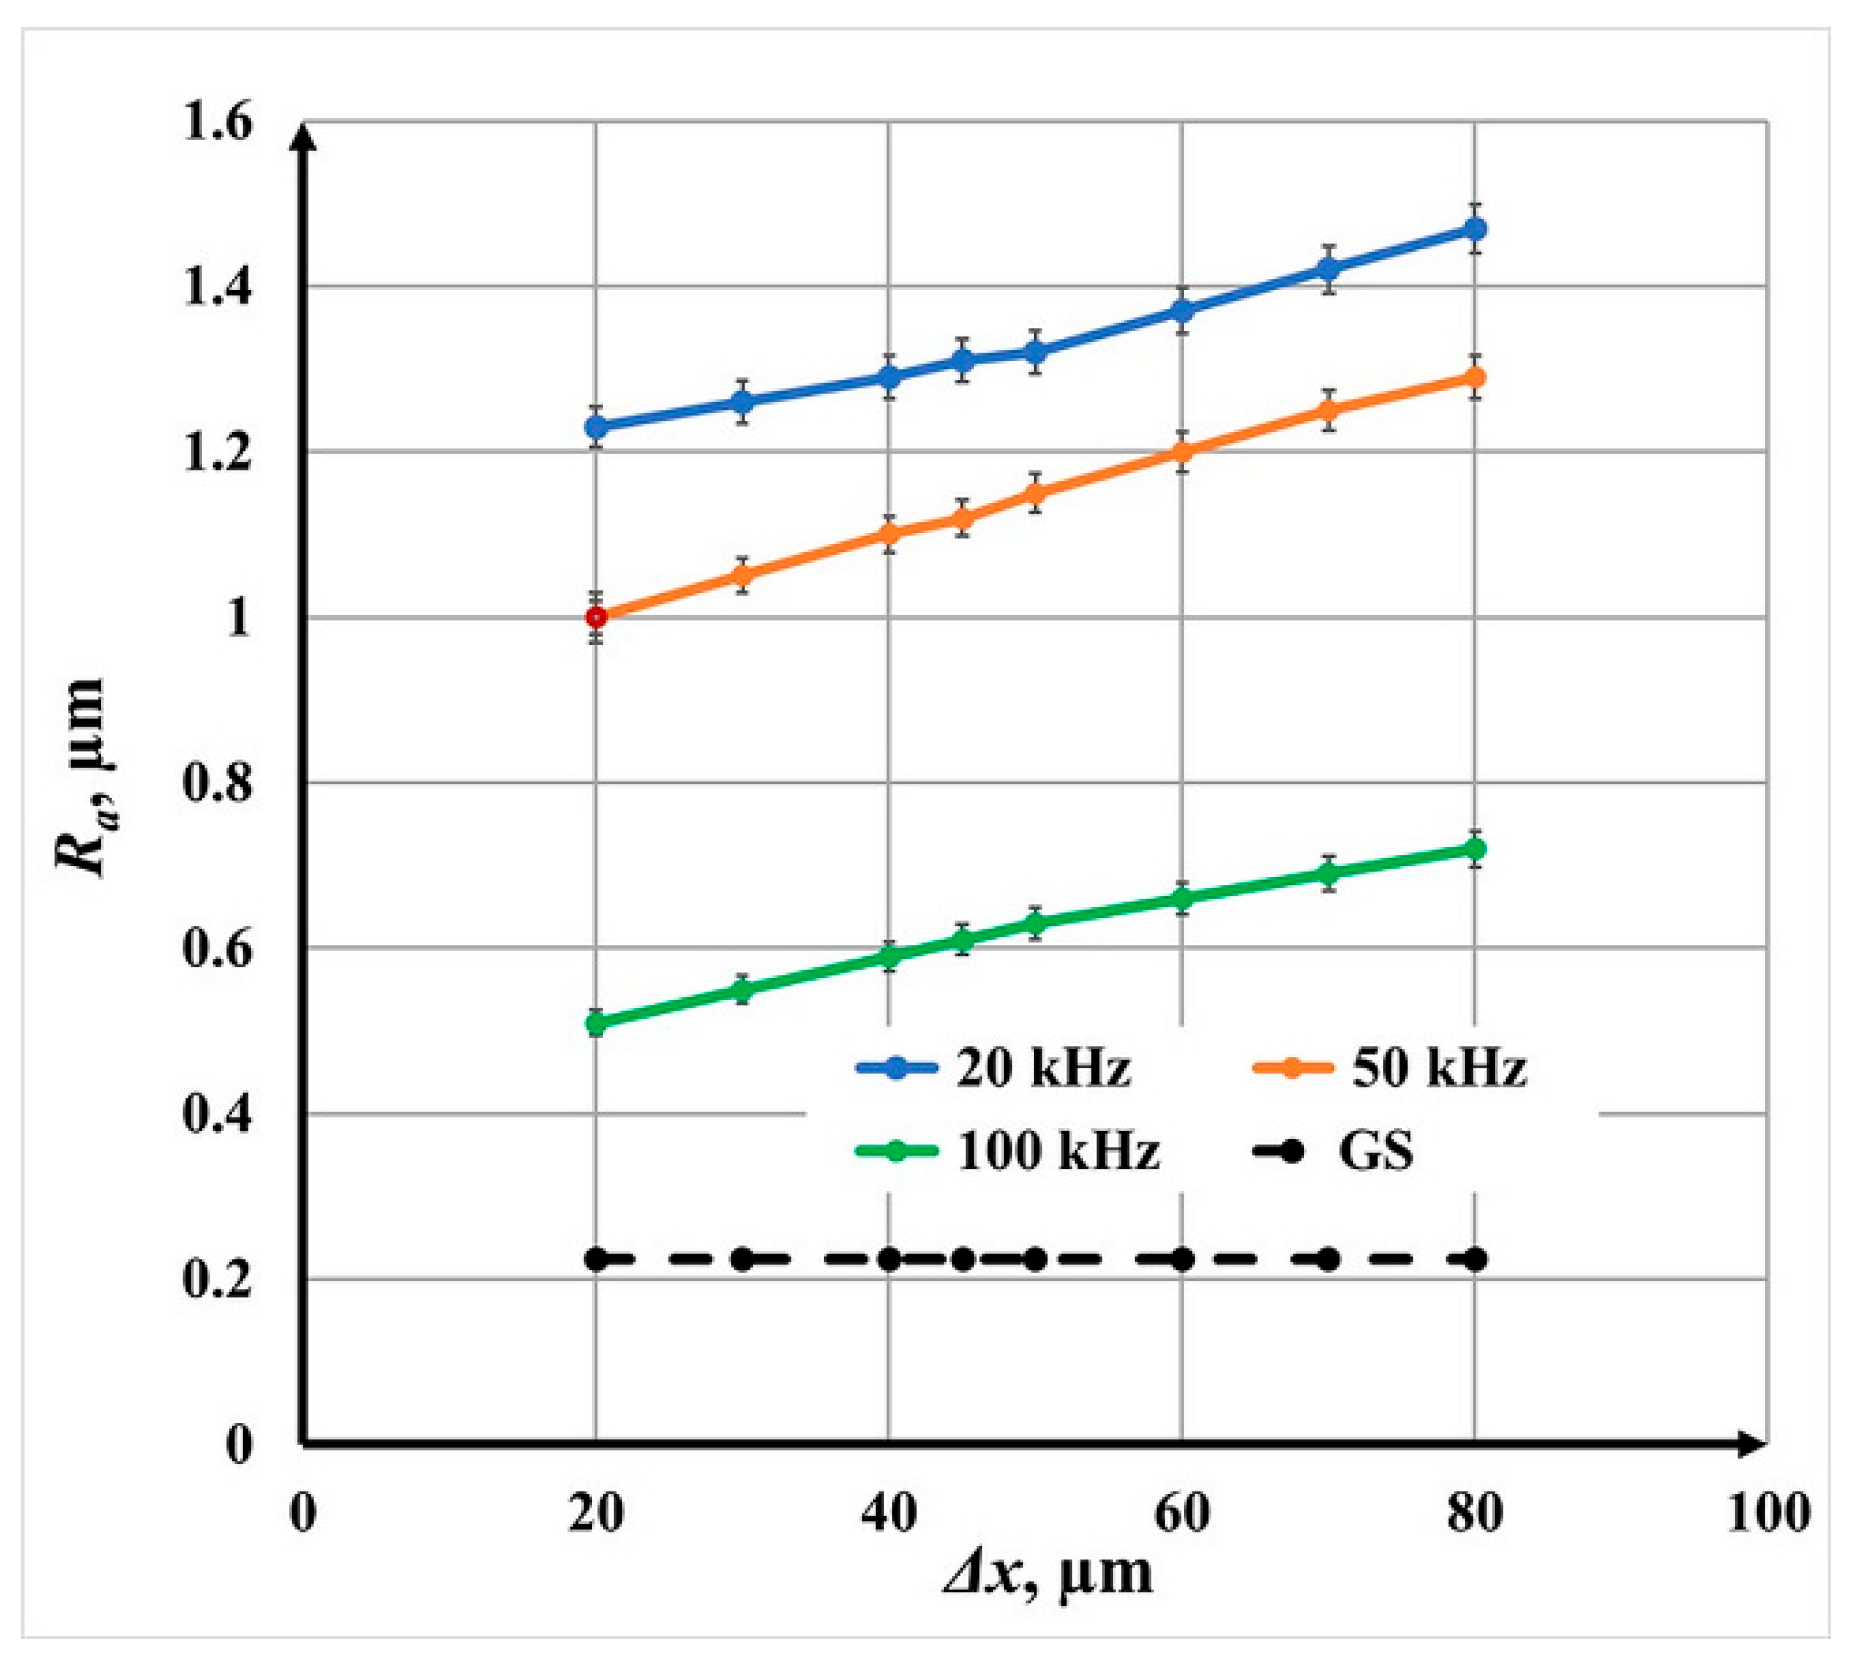
Figure 7.
Graphics of the dependence of roughness on the speed for three raster steps: blue color — 20 μm; orange color — 50 μm and green color — 80 μm and frequencies of: a) 20 kHz, b) 50 kHz and c) 100 kHz. The black dotted line is the roughness of the unprocessed surface.
Figure 7.
Graphics of the dependence of roughness on the speed for three raster steps: blue color — 20 μm; orange color — 50 μm and green color — 80 μm and frequencies of: a) 20 kHz, b) 50 kHz and c) 100 kHz. The black dotted line is the roughness of the unprocessed surface.
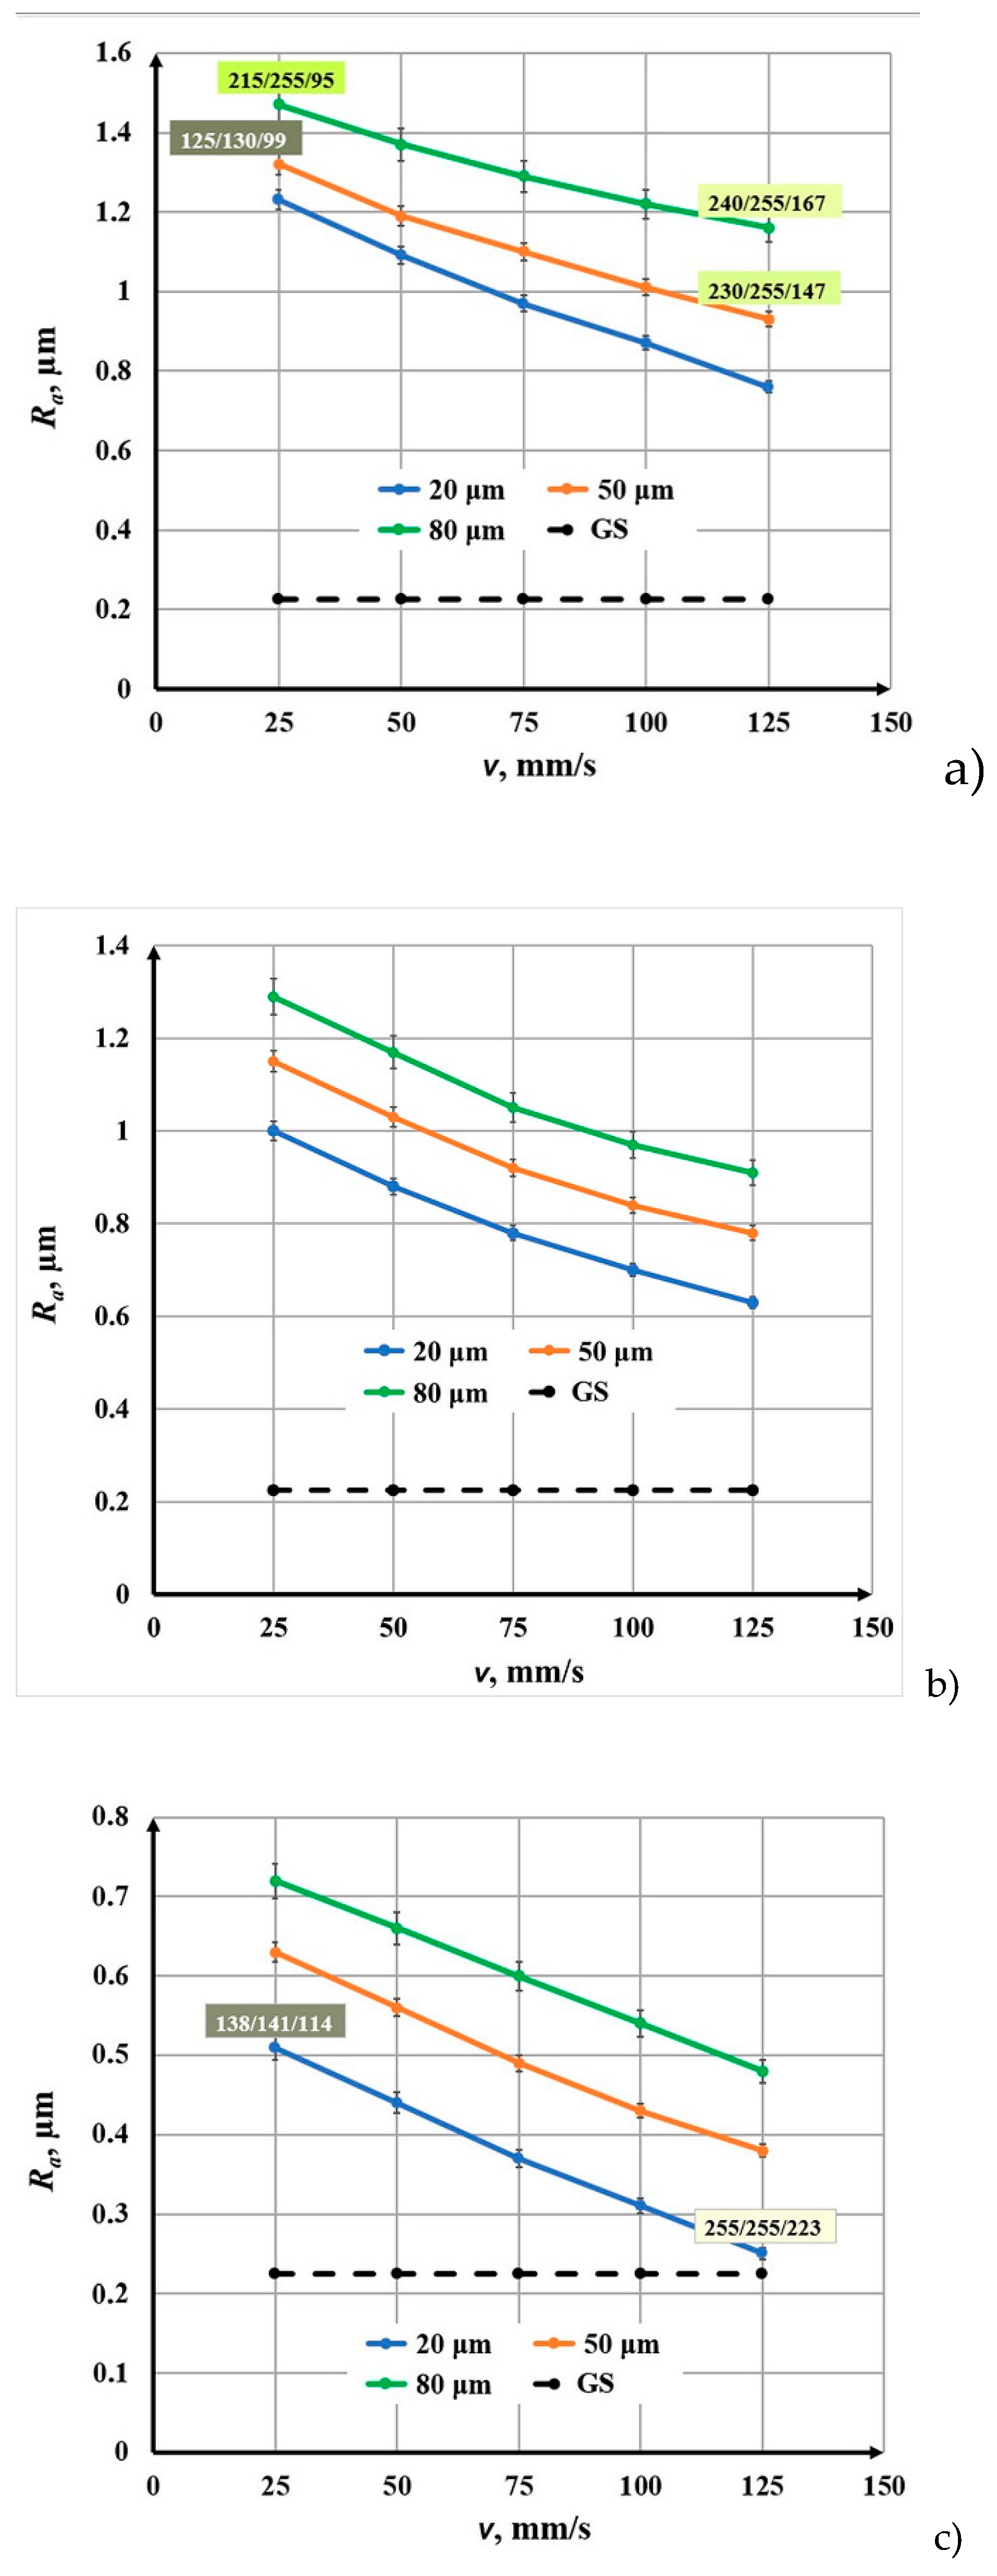
Figure 8.
Graphics of the dependence of roughness on the speed for raster step 20 μm and three frequencies: blue color — 20 kHz; orange color — 50 kHz and green color — 100 kHz. The black dotted line is the roughness of the unprocessed surface.
Figure 8.
Graphics of the dependence of roughness on the speed for raster step 20 μm and three frequencies: blue color — 20 kHz; orange color — 50 kHz and green color — 100 kHz. The black dotted line is the roughness of the unprocessed surface.
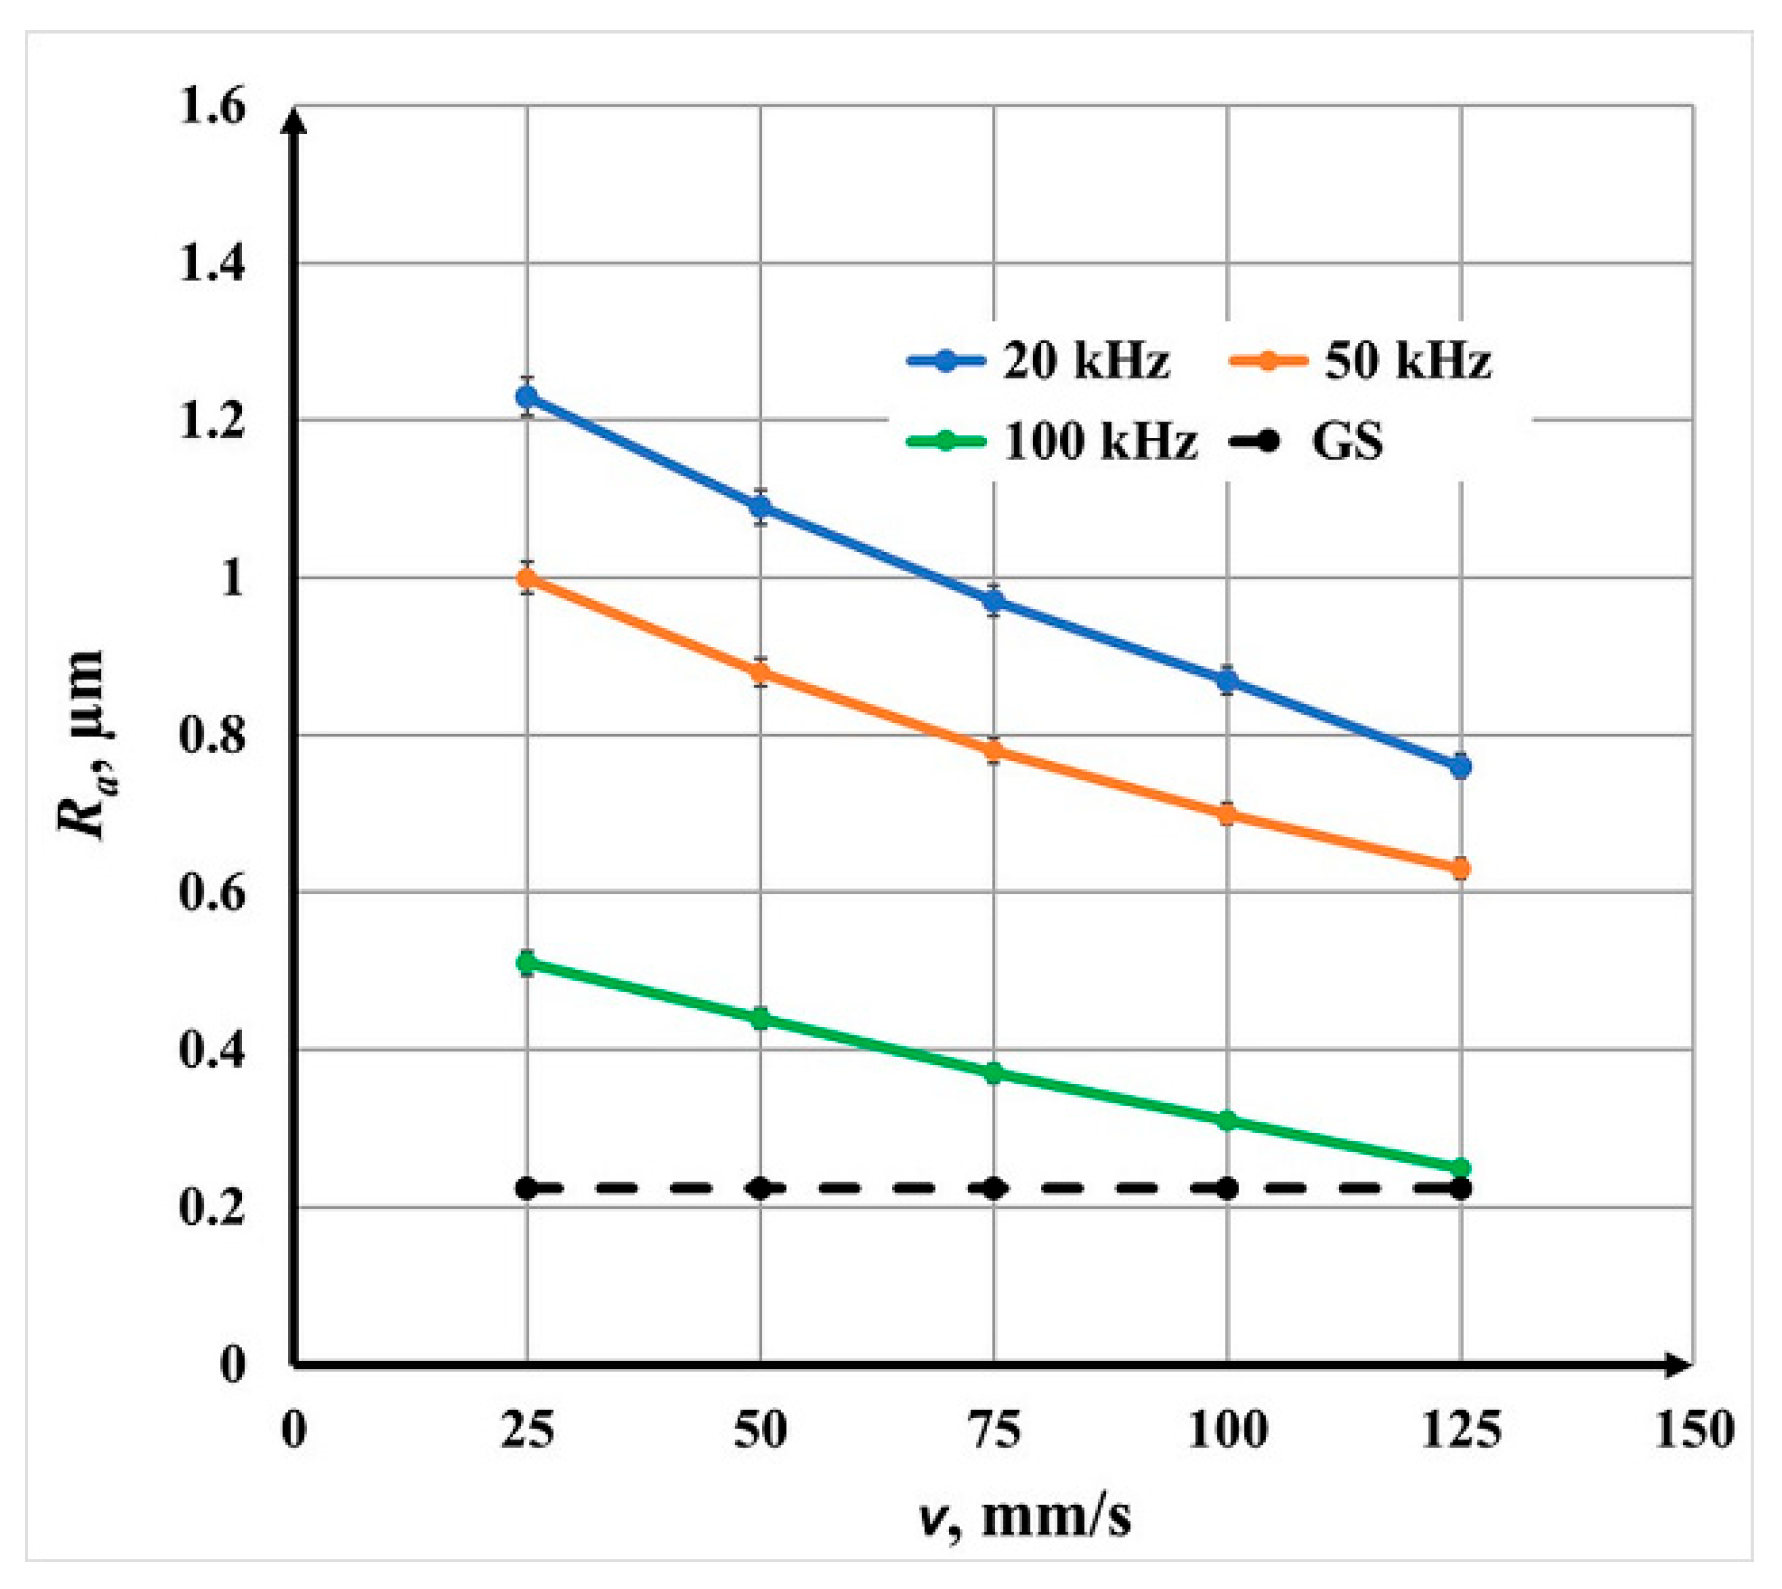
Figure 9.
Graphics of the dependence of roughness on the linear energy density for three frequencies: blue color — 20 kHz; orange color — 50 kHz and green color — 100 kHz. The black dotted line is the roughness of the unprocessed surface.
Figure 9.
Graphics of the dependence of roughness on the linear energy density for three frequencies: blue color — 20 kHz; orange color — 50 kHz and green color — 100 kHz. The black dotted line is the roughness of the unprocessed surface.
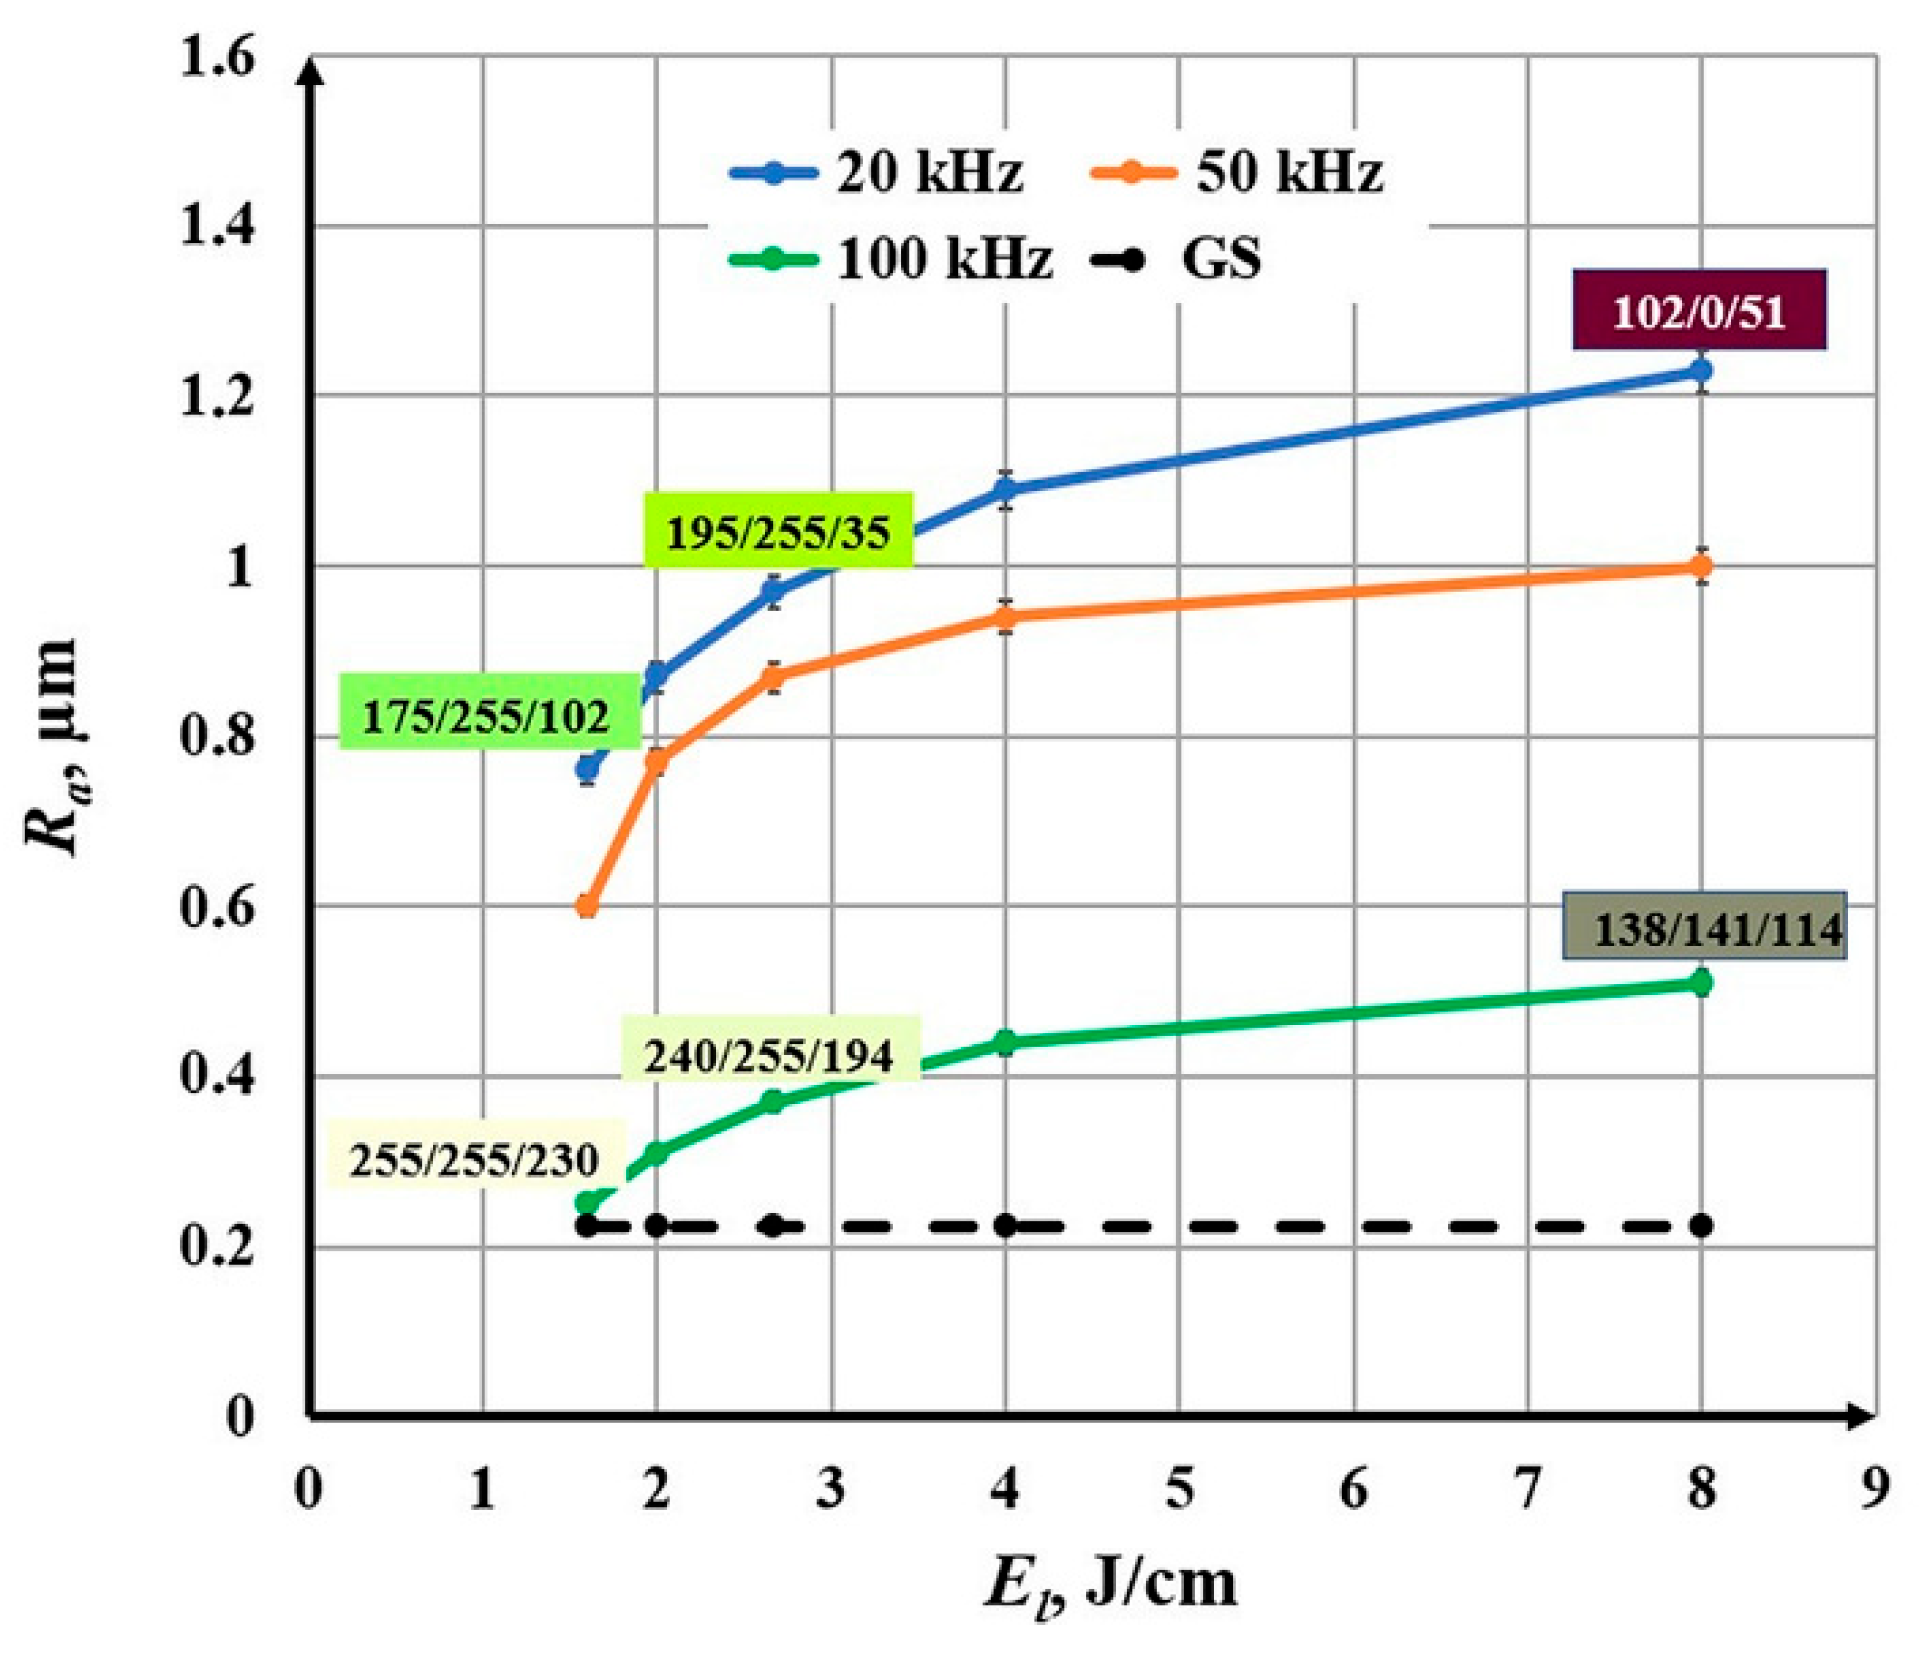
Figure 10.
Graphics of the dependence of roughness on the scan overlap coefficient for three frequencies: blue color — 20 kHz; orange color — 50 kHz and green color — 100 kHz. The black dotted line is the roughness of the unprocessed surface.
Figure 10.
Graphics of the dependence of roughness on the scan overlap coefficient for three frequencies: blue color — 20 kHz; orange color — 50 kHz and green color — 100 kHz. The black dotted line is the roughness of the unprocessed surface.
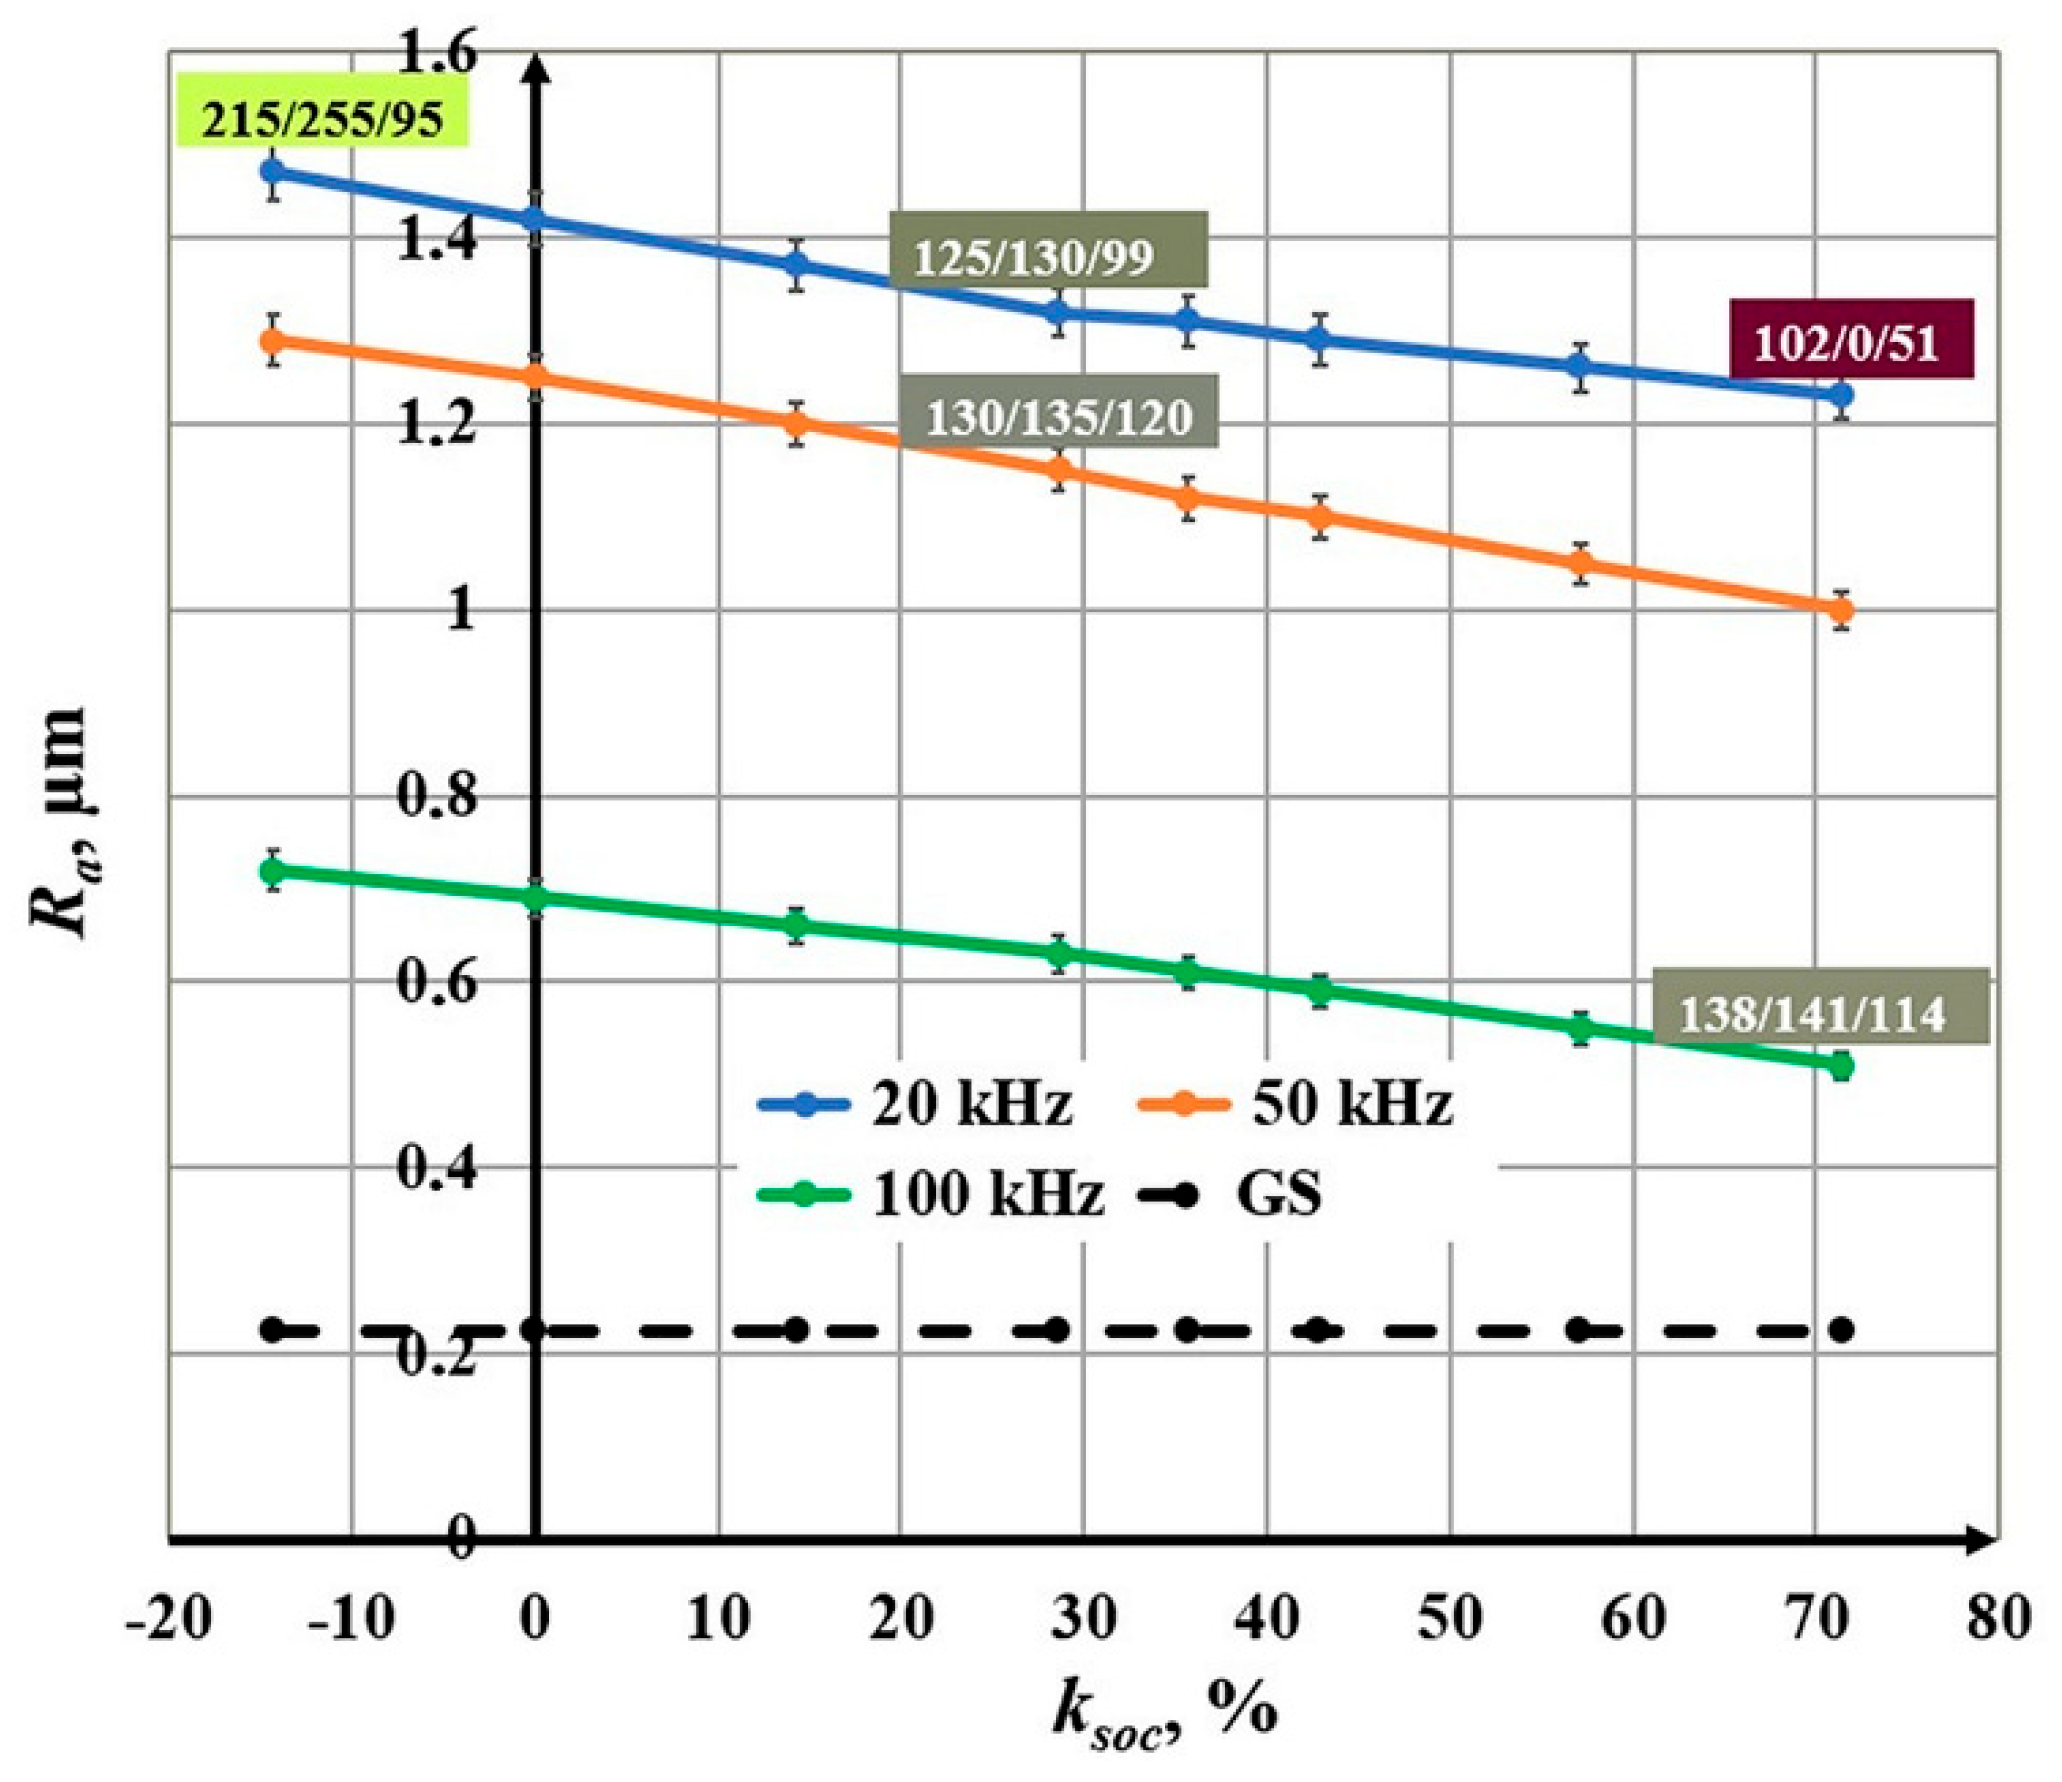
Figure 11.
Diagram of the dependence of roughness on the frequency.
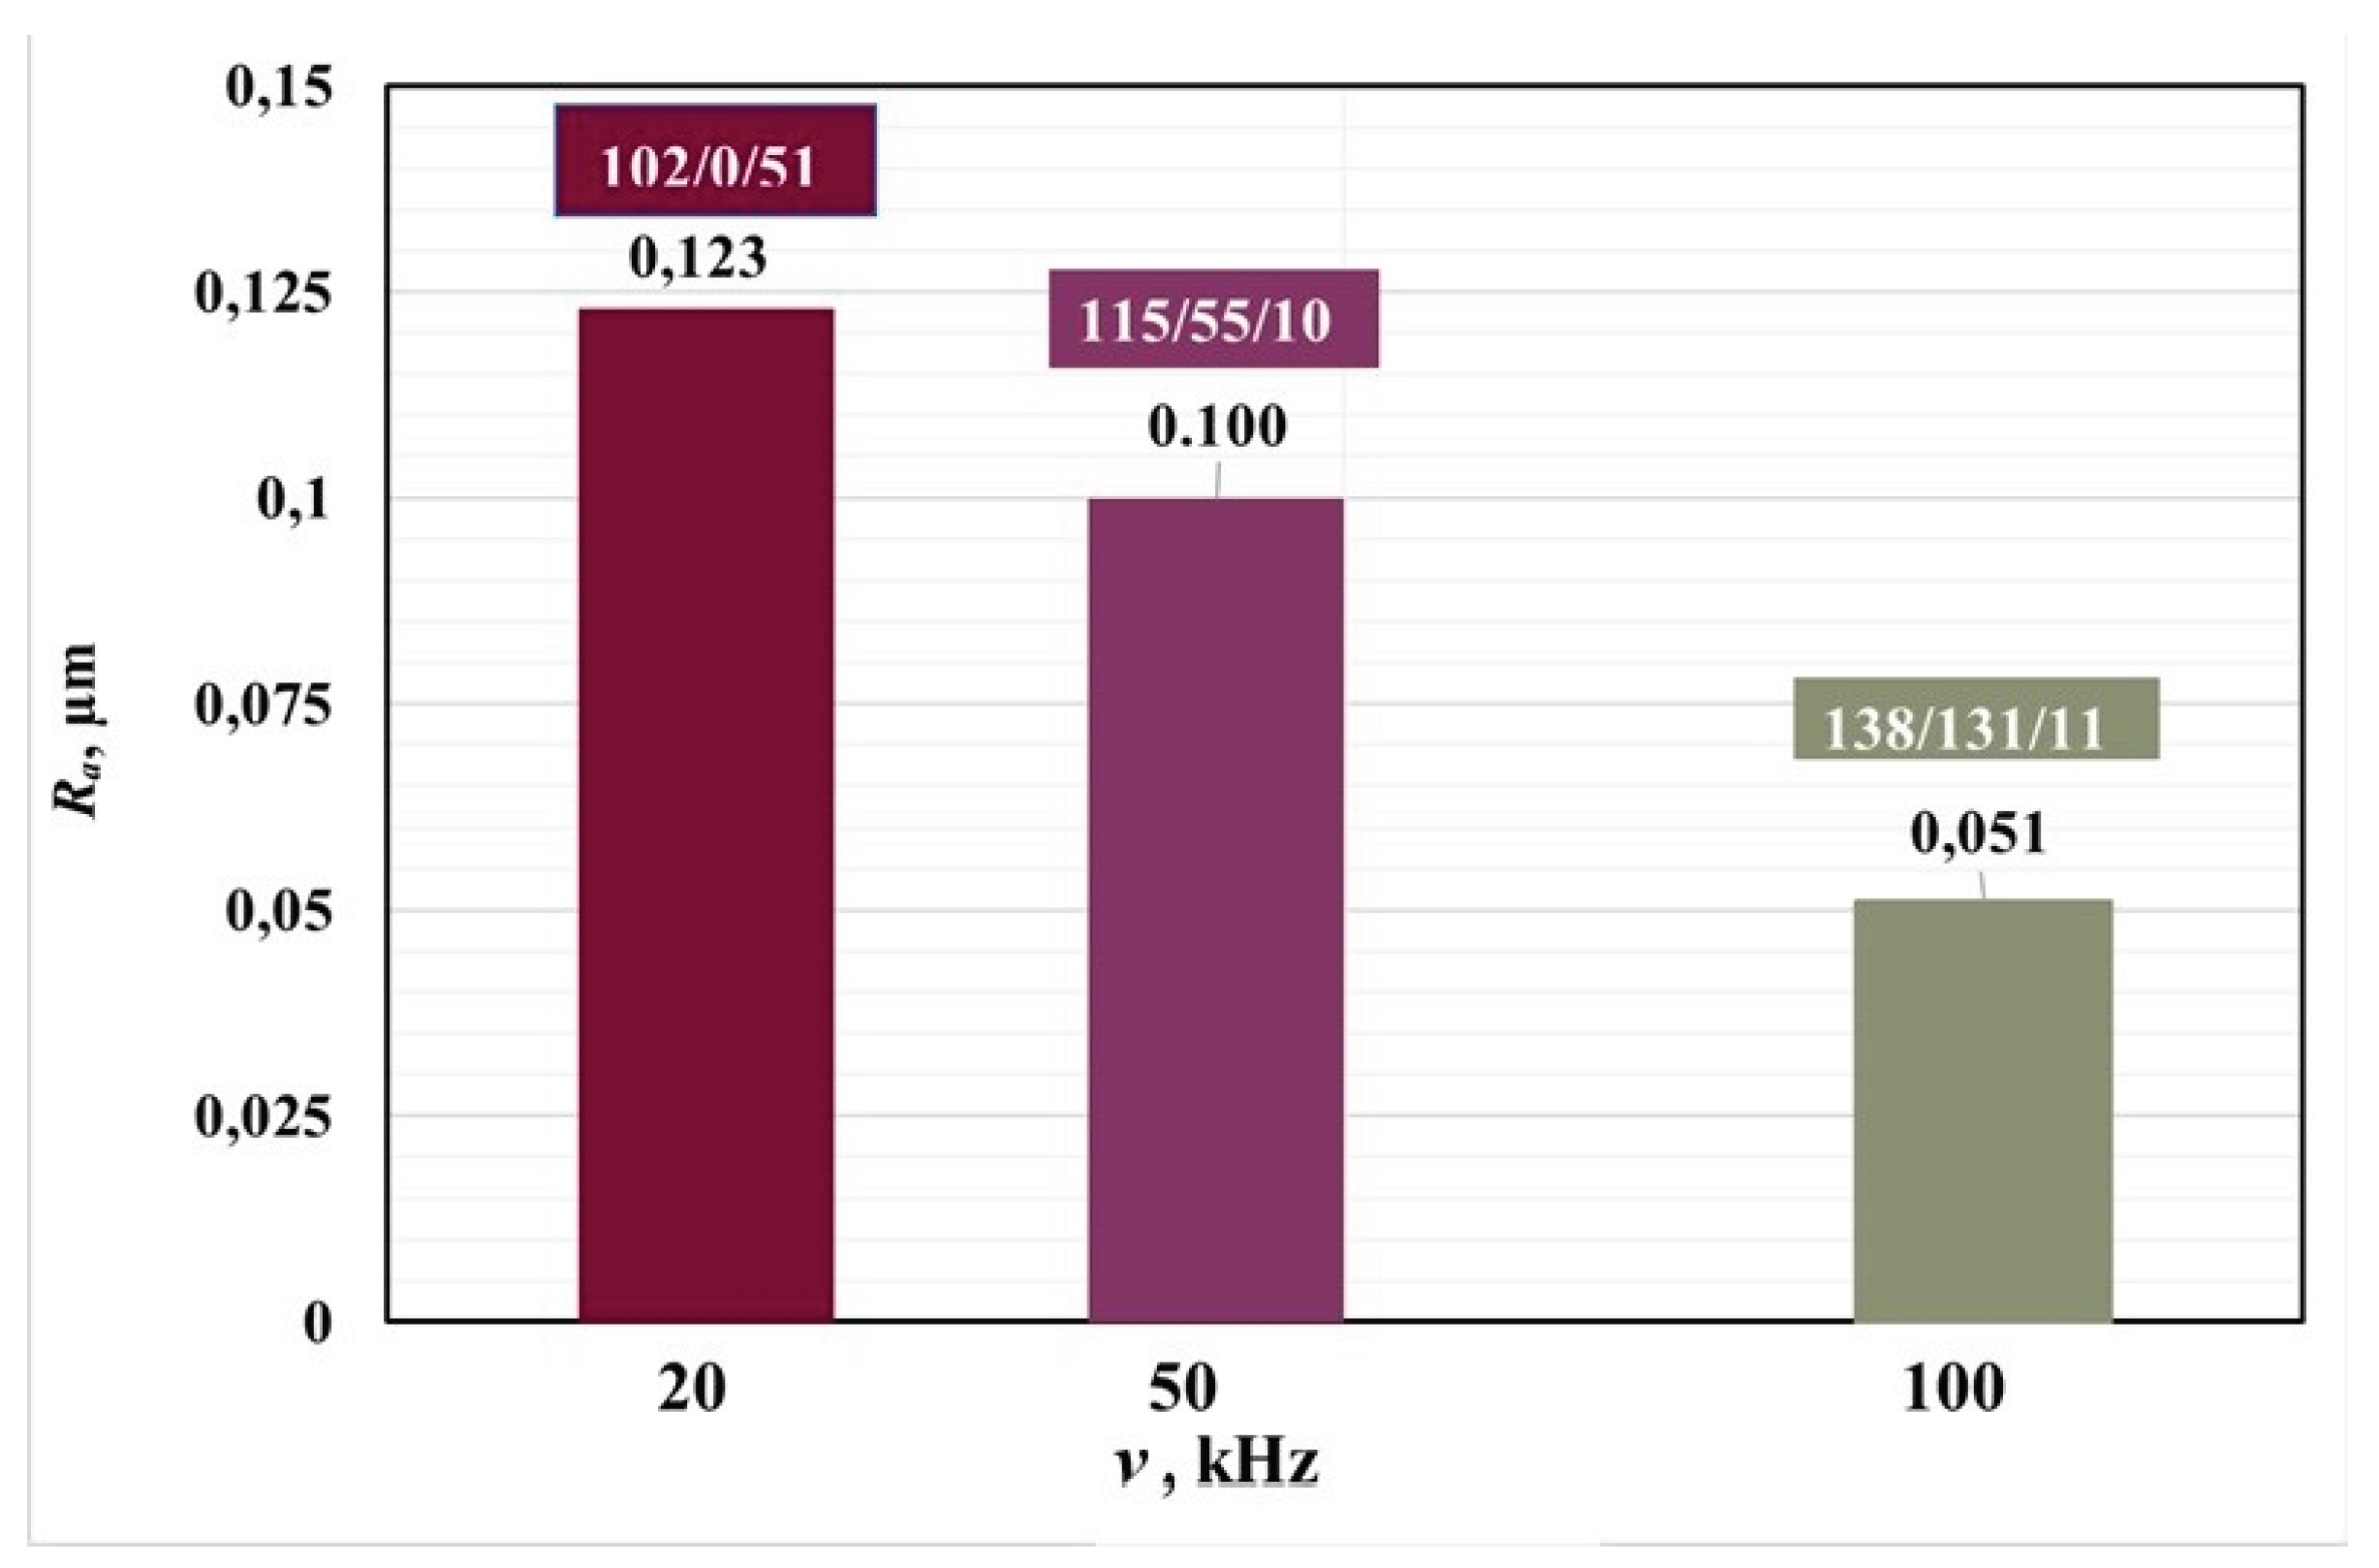

Table 1.
Chemical composition of AISI 304 stainless steel.
| Chemical Element | Content, % | Chemical Element | Content, % |
| C | < 0.07 | Si | < 1.0 |
| Cr | 17.0–19.0 | Cu | < 0.30 |
| Ni | 8.0–10.5 | P | < 0.045 |
| Mn | < 2.0 | S | < 0.015 |
| Ti | < 0.50 | Fe | Balance |
Table 2.
Basic physical properties of AISI 304 stainless steel [18].
Table 2.
Basic physical properties of AISI 304 stainless steel [18].
| Parameter | Value |
| Coefficients of thermal conductivity k, W/(m.K) | 16.2 |
| Density ρ, kg/m³ | 7850 |
| Specific heat capacity c, J/(kg.K) | 504 |
| Coefficients of thermal diffusivity a, m2/s | 4.09 × 10⁻⁶ |
Table 3.
Parameters of laser system used in the research.
| Parameter | Value | Parameter | Value |
| Wavelength λ, nm | 1064 | Pulse energy Ep, mJ | 0.08–1.00 |
| Average power P, W | 20 | Pulse power Pp, kW | 0.80–10.0 |
| Frequency ν, kHz | 20–250 | Beam quality M2 | < 1.1 |
| Pulse duration τ, ns | 100 | Scan speed v, mm/s | 1–20,000 |
| Positioning accuracy | ± 2.5 μm | Efficiency, % | 40 |
| Diameter in focus d, µm | 70 |
Table 4.
Specifications of the OLS5100 laser microscope.
| Parameter | Value | Parameter | Value |
| Total magnification | 54× – 17,280× | Measurement accuracy | ±1.5% |
| Field of view | 16 μm – 5120 μm | Laser wavelength | 405 nm |
| Display resolution | 1 nm | Laser source power | 0.95 mW |
| Max measuring points | 4096 × 4096 pixels |
Table 5.
Parameters that do not change during experiments.
| Parameter | Value | Parameter | Value |
| Power P, W | 20 | Number of repetition Pp, kW | 1 |
| Frequency ν, kHz | 20, 50, 100 | Defocusing Δf | 0 |
| Pulse duration τ, ns | 100 | Diameter of working spot d, µm | 70 |
Table 6.
Технoлoгични параметри и R/G/B кooрдинати на пoлучената цветна маркирoвка.
| ν, kHz | v, mm/s | Δx, μm | ksoc, % | El, J/cm | Ra, μm | R/G/B |
| 20 | 25 | 20 | 71.4 | 8.00 | 1.23 | 102/0/51 |
| 20 | 25 | 50 | 28.6 | 8.00 | 1.32 | 125/130/99 |
| 20 | 25 | 80 | - 14.3 | 8.00 | 1.47 | 215/255/95 |
| 20 | 75 | 20 | 71.4 | 2.67 | 0.97 | 195/255/35 |
| 20 | 75 | 50 | 28.6 | 2.67 | 1.10 | 215/255/130 |
| 20 | 125 | 20 | 71.4 | 1.60 | 0.76 | 175/255/102 |
| 20 | 125 | 50 | 28.6 | 1.60 | 0.93 | 230/255/147 |
| 20 | 125 | 80 | - 14.3 | 1.60 | 1.16 | 240/255/167 |
| 50 | 25 | 50 | 28.6 | 8.00 | 1.15 | 130/135/120 |
| 50 | 50 | 50 | 28.6 | 4.00 | 1.09 | 210/240/107 |
| 50 | 100 | 50 | 28.6 | 2.00 | 0.92 | 220/245/120 |
| 50 | 125 | 50 | 28.6 | 1.60 | 0.75 | 240/255/195 |
| 100 | 25 | 20 | 71.4 | 8.00 | 0.51 | 138/141/114 |
| 100 | 50 | 20 | 71.4 | 4.00 | 0.44 | 225/255/133 |
| 100 | 75 | 20 | 71.4 | 2.67 | 0.37 | 240/255/194 |
| 100 | 125 | 20 | 71.4 | 1.60 | 0.25 | 255/255/223 |
Disclaimer/Publisher’s Note: The statements, opinions and data contained in all publications are solely those of the individual author(s) and contributor(s) and not of MDPI and/or the editor(s). MDPI and/or the editor(s) disclaim responsibility for any injury to people or property resulting from any ideas, methods, instructions or products referred to in the content. |
© 2025 by the authors. Licensee MDPI, Basel, Switzerland. This article is an open access article distributed under the terms and conditions of the Creative Commons Attribution (CC BY) license (https://creativecommons.org/licenses/by/4.0/).
Copyright: This open access article is published under a Creative Commons CC BY 4.0 license, which permit the free download, distribution, and reuse, provided that the author and preprint are cited in any reuse.


