Submitted:
30 July 2025
Posted:
31 July 2025
You are already at the latest version
Abstract
Treadmill running gait differs to overland running and is commonly used to evaluate interventions. One challenge is accurately defining strike pattern and related impact kinetics. This study aimed to characterise foot-strike patterns during treadmill running using the spatial distribution of in-shoe plantar forces and to identify differences in impact kinetics through spectral analysis. Low- and high-frequency power components were analysed in heel, midfoot and forefoot strike patterns. No distinct impact peaks were identified in the force traces; however, significant spatial differences were found. Forefoot strikes exhibited lower peak impact force, average loading rate, and high-frequency power spectral density (PSD) components compared to heel and midfoot strikes, with heel also lower than midfoot. Strike pattern classification derived from spatial force distribution, where >70% posterior and >50% anterior denote heel and forefoot strikes. While midfoot strikes demonstrate a more balanced distribution with >25% in the central zone. These findings support the integration of spatial, force-based classification with frequency-domain analysis to enhance the evaluation of impact attenuation in treadmill based running interventions.
Keywords:
running
; gait
; foot-strike
; ground reaction forces
1. Introduction
Runners, whether barefoot or shod, have distinctive footstrike patterns categorised as heel, midfoot, or forefoot [1]. Typically, the best runners are forefoot strikers [2], yet over 90% of recreational runners are expected to be heel strikers [2]. Visually, it requires high-speed video [3] to capture the specific region of the foot making initial contact with the ground [4]. However, this method does not reveal the spatial application of plantar forces. Alternatively, it can be inferred from foot centre of pressure trajectories or vertical ground reaction force profiles [5] and more recently tri-axial accelerometer’s [6].
In respect to vertical ground reaction force traces, the presence of two force peaks indicates a heel or mid-foot strike (Figure 1A,B). A large 1st peak signifies a heel strike, a spur is a midfoot strike, and no peak within 13% of ground contact time from point of initial contact signifies a forefoot strike [7,8] (Figure 1C).
These landmarks are important as they reflect the impact absorption phase of stance, which occurs before skeletal muscles can actively engage [9], thereby capturing the unattenuated collision between the foot and ground [10]. While such patterns are typically derived from overground running, the average velocity of the centre of mass is zero in treadmill running [11], and joint kinematics differ during the stance phase [12]. However, since the advent of instrumented treadmills [13], ground reaction force profiles at matched speeds suggest modalities are very similar [14]. Though some variability may occur between treadmill brands or when compared to in-shoe pressure insoles [15]. Furthermore, peak plantar pressures are generally lower during treadmill running, though directionally similar [16]. These modality differences may influence strike-pattern classification [17] and impact-related metrics derived from them.
The magnitude of this collision force along with its loading rate have been thoroughly researched in relation to the very high injury prevalence within runners [18,19,20] and the impact of shoe-midsole cushioning interventions to attenuate the impact force and associated loading rate [10,21,22,23,24]. However, in both cases the links are tenuous, where higher impact forces and loading rates are observed within heel strikes, compared to midfoot or forefoot strikers [25]. Likewise, research into the cushioning properties of a shoe’s ability is somewhat inconclusive. Questions have been raised [26] regarding the efficacy of traditional kinetic metrics used as indicators of foot-strike mechanics [5] and impact severity. The authors highlighted how total force measurements may be influenced by spatially non-specific components, masking the differences related to footwear cushioning interventions [26] and, by extension, foot-strike patterns. Additionally, the reliance on total peak values may overlook the spectral composition of the force signal, where low-frequency (<10 Hz), more related to the active processes rather than impact [27], can hide [26] the high-frequency (>10 Hz) component more directly related to impact and caused by the rapid deceleration of the limb [28].
Therefore, the aim of this study is to characterise foot-strike patterns during treadmill running based on the spatial distribution of in-shoe plantar forces, and to identify differences in impact kinetics using spectral analysis, with a specific focus on low- and high-frequency power components.
2. Materials and Methods
2.1. Participants
Eleven recreational to nationally competitive endurance runners, free of injury, participated in the study after providing written consent in accordance with the University Human Ethics Committee approval. This sample size was based on priori statistics (G*power V 3.1.9.7, Heinrich-Heine University, Dusseldorf, Germany) for analysis of variance (ANOVA) repeated measures within factors, using an alpha value of 0.05, power of 0.95, and effect sizes based on previously reported differences in foot strike patterns and kinetic variables: peak impact force, 2.43 [23]; heel pressure, 1.08 [26]; loading rate, 1.62 – 2.44 [23,29,30]; active peak force, 0.56 – 1.41 [5,23,29].
Participant characteristics (mean ± SD) where: age (yrs.) 29.6 ± 9.8, height (cm) 174.0 ± 8.7, body mass (kg) 65.4 ± 8.9 and Body Mass Index 21.5 ± 1.3) and weekly training volume (km∙wk-1) 77.3 ± 23.6.
Prior to the study, participants had recently displayed individual peak impact force spatial distribution values (Figure 2) during treadmill running at 12 km∙h-1 (mean ± SD: n-steps 138 ± 10; heel component (%) 47.7 ± 29.4; midfoot component (%) 29.1 ± 10.4, forefoot component (%) 23.2 ±15.6).
2.2. Procedures and Measurements
The experimental protocol consisted of three trials (heel, midfoot, and forefoot strike patterns) while treadmill running at 10 km∙h-1. Each trial was performed in one session on the same day in a counter balanced order of strike pattern, with participants all wearing the same brand-model of shoe that they were familiar with.
Upon arrival at the laboratory, participants were weighed, measured and presented with the required shoe size. The prototype cushioned shoe (Figure 3A) has a 38 mm heel (12% from heel) and a 32 mm forefoot stack height (75% from heel) midsole, featuring a single layer of ATPU (Aliphatic Thermoplastic Polyether Polyurethane) super critical bead foam cushioning. The foam had a factory pre-processing density of 0.08 ± 0.01 g∙cm-2. Shoe cushioning property assessment using a modified industry standard test (ISO 20344:2021 (5.17)) [31] - Instron 4467 (Instron, Norwood, MA, United States) - compressed the midsole vertically at a rate of 10 mm per minute with a maximum applied force of 2.2 kN. Results of this test are provided in Figure 3B.
Following a self-selected warm-up period on the treadmill (Life Fitness, Hamilton, New Zealand) at 10 km∙h-1, participants were asked to use one of three strike pattern techniques (Heel, Midfoot, or Forefoot). Prior to and during each trial, where necessary, instructions were given to land (make initial contact) on the heel, flat footed, or on the balls of their feet. Once they were comfortable that they were using the specified technique, 10 s of data were logged for each condition [31,32]. Time-force data from Loadsol® pressure sensitive in-soles, segmented into posterior, central, and anterior zones (Figure 2 legend) was logged at 200 Hz. The data was then uploaded to MATLAB (R2022b, (MathWorks, Inc., Natick, MA, United States), re-sampled to 1,000 Hz, and processed using a 10-20 N force threshold to detect initial foot contact and toe-off in the total force trace. Based on these identified points, the following variables were identified or calculated [31] including spatial zone data where applicable:
- Stride duration was the time from one initial impact to the next initial impact for the same foot.
- Ground contact time (s) was the time the foot remained in contact with the treadmill surface i.e. toe-off – initial contact times.
- Swing time (s) was the time the foot has no contact with the treadmill surface.
- Active peak vertical force (N∙BW-1) was the second peak for heel strike runners, or the highest force reading of each step for midfoot and forefoot strikers.
- Peak vertical impact force (N∙BW-1) identified as the first peak in the total force trace between initial contact and the active peak. If the first peak was not present in running (mid-forefoot strike) it was defined as the force at 13% of the ground contact time.
- Average loading rate (N∙BW-1∙s-1) is the difference between forces at 20% and 80% of the peak impact force divided by the corresponding time interval (s).
- Impulse (N∙s∙BW-1), the area under the force-time curve.
- Power Spectral Density (PSD) analysis: During the stance phase, while the right foot was in contact with the ground, force data (total and spatial zones) were analysed in the frequency domain. PSD was computed using Welch’s [33] method (MATLAB, default windowing), and applied to the first 20% of each step’s stance phase to isolate impact related portion of ground contact. A frequency resolution of 2 Hz was used from 0-100 Hz. PSD values were retained in their raw form (N2∙Hz-1), preserving magnitude to reflect actual spectral energy differences across the zones in relation to strike pattern. Spectral power was partitioned into low-frequency (<10 Hz) and high-frequency (10-100 Hz) bands to quantify relative contributions and frequency dependent loading characteristics.
All dependent variable data were calculated per step and expressed as mean±SD for each independent variable. Differences in spatiotemporal and kinetic parameters determined from total force were compared between strike patterns using a one-way ANOVA, with Tukey post-hoc multiple comparisons if significance was found. Differences between strike pattern and spatial zones and or low-frequency and high-frequency bands were analysed using a two-way repeated-measures ANOVA, with 2 within-subject variables (strike-pattern*Spatial-zone) or (strike-pattern*Frequency-band). Where significance was found, Sidak’s post-hoc multiple comparisons testing was performed. All statistics were performed using GraphPad Prism (V 8.4, (GraphPad Software, San Diego, CA, United States) with significance set at p<0.05.
3. Results
The data analysis period resulted in the analysis of 13 ± 1, 13 ± 1, 14 ± 1 right steps for the heel, midfoot, and forefoot strike patterns, respectively. No first peaks were identified in any foot-strike method for any participant despite there being clear spatial differences, as demonstrated in Figure 4.
Mean±SD data for total force derived variables stride duration, ground contact time, swing time, peak impact force, average loading rate, active peak force, and impulse are presented in Table 1. One-way ANOVA found no-significant differences for stride duration (F(1.76, 17.65) =1.6, p=0.230), ground contact time (F(1.85, 18.47)=1.05, p=0.365), or swing time (F(1.85, 18.47) =0.98, p=0.389). There were overall significant differences for: peak impact force (F(1.63, 16.25) =13.58, p=0.0006, Table 1) with forefoot impact being less than heel (P=0.024) and midfoot (p=0.002) strike patterns; average loading rate (F(1.75, 17.54) =14.61, p=0.0003), with forefoot being less than heel (p=0.009) and midfoot (p=0.001) strike patterns; active peak force (F(1.36, 13.55) =20.32, p=0.0002, Table 1) with the heel being less than both midfoot (p=0.023) or forefoot (p=0.001), and the midfoot less than the forefoot (p=0.006); impulse (F(1.11, 11.05) =23.9, p=0.0004, Table 1) with the heel being less than the midfoot (p<0.0001), and the forefoot (p=0.0008), while the midfoot was also less than the forefoot (p=0.012) strike patterns.
Two-way ANOVA for peak impact identified a strike-pattern*Spatial-zone interaction (F(4,40)=91.12, p<0.0001, Figure 5) with a main effect for strike pattern (F(2,20)=14.14, p=0.0001) and spatial zone (F(2,20)=13.37, p=0.0002). Within each strike pattern multiple post-hoc comparisons (Figure 5A, Table 2) presented increased contribution of the posterior zone compared to either the central or anterior zone (p<0.0001) during heel striking; increased contribution of the posterior compared to the central or anterior zones (p<0.01) during midfoot strikes; while the anterior zone was greater (p<0.0001) than either the central or posterior zones during forefoot strikes. Between strike pattern comparisons for the major zone of force contribution showed that the posterior of the heel strike was greater than the posterior in the midfoot or anterior zone in the forefoot strikes (p<0.0001). From a contribution perspective, the Mean±SD (%) values for posterior, central and anterior zones were: heel strikes - 81±13, 16±11, 3±3; midfoot strikes - 49±19, 29±11, 21±10; and forefoot strikes - 9±15, 28±9, 63±17, respectively (Figure 5C). As such, the overall spatial zone contribution was significantly different for each foot strike (F(2,20)=10.27, p=0.0009,Figure 5C) where post-hoc identified significance (p<0.05) in every pairing accept between the central and anterior zones in the heel and midfoot strikes. There was also no difference across strike patterns for the central zone contribution.
Two-way ANOVA for average loading rate identified a strike-pattern*Spatial-zone interaction (F(4,40)=74.7, p<0.0001, Figure 5B, Table 2) with a main effect for strike pattern (F(2,20)=11.24, p=0.0007) and spatial zone (F(2,20)=22.9, p<0.0001). Within each strike pattern multiple post-hoc comparisons (Figure 5B, Table 2) presented increased contribution of the posterior zone compared to either the central or anterior zone (p<0.0001) but not the central and anterior zones (p=0.227) during heel striking; increased contribution of the posterior compared to the central (p=0.002) or anterior zones (p<0.0001), but no difference between central and anterior (p=0.587) during midfoot strikes; while the anterior zone was greater than the central (p<0.0001) and the posterior (p<0.0001) zone, and the central was greater than the posterior zone (p=0.06).
Two-way ANOVA (strike-pattern*spatial-zone) for active peak force resulted in an interaction (F(4,40)=59.17, p<0.0001) with a significant main effect for spatial zone (F(2,20)=35.84, p<0.0001) but not strike pattern (F(2,20)=0.94, p=0.406). Multiple post-hoc comparisons for spatial zone across strike patterns highlighted significance (p<0.001) for the posterior and anterior zones but not the central zone (P>0.8), Table 2. Impulse had an interaction (F(4,40)=104.4, p<0.0001) with main effect differences for both strike pattern (F(2,20)=20.88, p<0.0001) and spatial zone (F(2,20)=76.8, p<0.0001) with p<0.0001 post-hoc differences for both posterior and anterior zones but not the central zone (p>0.8), Table 2.
Two-way ANOVA for power spectral density data (Figure 6) found a frequency*strike-pattern interaction (F(2,20)=11.74, p=0.0005) with a main effect for frequency (F(1,10)=136.4, p<0.0001) and strike pattern (F(2,20)=12.37, p=0.0004). Post-hoc comparison between strike patterns were not significantly different in the low-frequency but there were differences in the high-frequency band for all pairings (Figure 6A). Specifically, total high-frequency was lower in the heel strike compared to midfoot strike (255351±79702, 302406±100656 N2∙Hz-1, p=0.011), heel strike was greater than the forefoot strike (255351±79702, 185948±51238 N2∙Hz-1, p=0.0004) and the midfoot was greater than the forefoot strike (302406±100656, 185948±51238 N2∙Hz-1, p<0.0001). Further analysis of the high-frequency component with regards to strike-pattern*spatial-zone (Figure 6B) showed an interaction (F(2,20)=65.6, p<0.0001), and main effects for both strike pattern (F(2,20)=16.91, p<0.0001) and spatial zone (F(1,10)=28.47, p<0.0001). Key post-hoc comparisons of interest highlighted greater PSD high-frequency in the heel strike posterior zone vs. midfoot strike central zone (166845±48401, 32613±18687 N2∙Hz-1, p<0.0001), heel posterior vs. forefoot anterior (166845±48401, 88075±30093 N2∙Hz-1, p<0.0001), and heel posterior vs. midfoot central (166845±48401, 77517±44168 N2∙Hz-1, p<0.0001). There was no post-hoc difference between midfoot central vs. forefoot central (32613±18687, 18082±15512 N2∙Hz-1, p<0.0001) or midfoot posterior vs. forefoot anterior (77517±44168, 88075±30093 N2∙Hz-1, p=0.990).
4. Discussion
This study aimed to characterise foot-strike patterns during treadmill running using in-shoe plantar force distributions to quantify impact related kinetics together with spectral analysis. While no significant spatiotemporal variations occurred between foot strike patterns, significant spatial differences in peak impact and average loading rate were evident, despite the absence of distinct peaks in the midfoot or heel strike force traces. As such, strike classification appears more useful when based on spatial force distribution than on total plantar force during treadmill running. Further, the high-frequency component of the PSD was greatest in midfoot and lowest in the forefoot strikes, with the posterior zone of heel strikes exhibiting the highest zone specific high-frequency power out of all strike pattern spatial zones. Lastly, total peak active force and total impulse were greater in forefoot strikes than in midfoot and heel strikes.
All participants successfully adopted the assigned footstrike techniques, enabling development of data driven classification guidelines based on spatial distribution of impact forces (Figure 5C). Where, runners exhibiting >70% of impact in the posterior zone were classified heel strikers; >50% in the anterior zone as forefoot strikers; and those with <70% posterior, <50% anterior, but >25% in the central zone were classified as midfoot strikers. Based on these classification thresholds, our cohort included four natural heel strikers and seven natural midfoot strikers (Figure 2).
The adaptation of different strike patterns resulted in no paired-differences to stride duration or its components, ground contact time or swing time. This agrees with comparisons between non-paired natural heel vs forefoot strikers [34,35] and paired natural heel vs unnatural forefoot strikers [30]. This likely reflects a preferred movement path [36], where individuals modulate impact attenuation or force production from strike specific spatial zones ( Figure 5A,B , Table 2). However, this contrasts with observations where midfoot strikers presented shorter duration ground contact times and superior running economy than heel strikers [37]. In the current study, participants wore a prototype shoe that, in vitro testing (Figure 3B), demonstrated approximately 11% greater cushioning than a maximally cushioned shoe, tested under the same conditions [31]. Given the association between footwear geometry and reduced ground contact time [38], as well as the influence of cushioning on leg stiffness and gait adaptations [39,40], such a design could influence strike pattern related spatiotemporal variables. However, no differences were observed in the current dataset, agreeing with comparisons between minimalistic and conventional cushioned shoes [8,41]. Further investigation exploring the interaction between shoe geometry, cushioning, and strike pattern is warranted.
The absorption phase of ground contact is characterised by impact kinetics, typically determined through force-trace peak identification [5] or the time component and inability to consciously dampen the impact [9]. While the first peak is always present in overland running, this criteria is somewhat equivocal during treadmill running [17], where both instrumented-treadmill brand, and kinetic measurement system, have produced presence and absence of such peaks [15]. Data from the current study suggests that the sole reliance on total vertical force traces may lead to misclassification of strike patterns. Specifically, in-shoe total plantar force data revealed no distinct impact peaks for midfoot or heel strike peaks (Figure 4), despite clear distinctions in spatial zone differences in peak impact and average loading rate (Figure 5). These spatial differences aligned consistently with the designated strike pattern (Figure 5A,B). The posterior zone exhibited the highest magnitude impact peak and average loading rate in the heel strike, the anterior zone dominated in the forefoot strike, and midfoot strike displayed a more even distribution with the posterior zone still being the dominant zone (Figure 5). These within-strike pattern distinctions highlight the value of using spatial force data to accurately identify foot strike pattern and more advanced analysis to assess impact kinetics during running interventions.
Spectral analysis has been used to separate the true (high-frequency) impact component of the total force signal from that of the active processes [26,27] that occur during limb deceleration. Figure 6A supports the presence of a low-frequency active process component but suggests it may not significantly influence the overall kinetic signal. Alternatively, it could be that within the same participants, strike pattern did not alter the active processes. Nonetheless, strike pattern had a significant effect on peak impact, average loading rate (Table 1), and the high-frequency PSD. Interestingly, the midfoot strike had significantly greater values than either the heel or forefoot strike, despite most participants being natural midfoot strikers (Figure 2) based on the classification criteria (Figure 5C). This contrasts with previous research that has focussed on natural strike pattern preferences or overland running, which often reported lower impact kinetics in midfoot and forefoot striker patterns [6,27,42]. It is possible that the instructions given to run flat footed produced a gait distinct from participants habitual midfoot style, potentially increasing vertical limb acceleration and thereby amplifying impact deceleration. This is supported where peak impact accelerations were greater in midfoot than rear or forefoot strike patterns [43]. Although not a primary focus, the small, non-significant decrease in swing time (Table 1) warrants further exploration from a kinematic perspective. Additionally, spatial analysis of the high-frequency component revealed similarity with peak impact (Figure 5A) and average loading rate (Figure 5B), but with notable differences in zone contributions. Specifically, in the heel and forefoot strikes where non-dominant zones contributed less (Figure 6B). This suggests that the low-frequency components may inflate non-specific zone data during impact.
Although this study primarily focused on comparing strike pattern with respect to impact kinetics and force signal characteristics, active peak force associated with propulsion was also measured. The results showed significantly lower active peak force in heel strikes compared to midfoot and forefoot strikes, in both total and spatial zone measures (Table 1 and Table 2). These findings contrast with previous work where there were no differences between total forces across strike patterns [42]. However, the data presented shows considerable non-anterior contributions to total force in both heel and midfoot strikes indicating differences in plantar surface mechanics.
While no spatiotemporal differences were observed between foot-strike patterns during treadmill running, and total force trace structure appeared similar when measured by in-shoe devices, distinct differences in kinetic variables between strike patterns were present, particularly when examined using frequency domain analysis. These distinct kinetic differences, combined with the ability to classify strike pattern based on spatial force metrics, could be used to discern intervention effects in treadmill running studies, where previous findings have been equivocal.
Author Contributions
Conceptualization, PWM; methodology, SW, PWM; software, PWM; formal analysis, PWM; investigation, PWM and SW; resources, SW and PWM; data curation, PWM; writing—original draft preparation, PWM; writing—review and editing, SW; visualization, PWM; project administration, PWM and SW. All authors have read and agreed to the published version of the manuscript.
Funding
This research received no external funding.
Institutional Review Board Statement
The study was conducted in accordance with the Declaration of Helsinki, and approved by the Ethics Committee of Massey University (OM1 24/44 approved 12.6.2025)
Informed Consent Statement
Informed consent was obtained from all subjects involved in the study.
Data Availability Statement
The raw data supporting the conclusions of this article will be made available by the authors on request.
Acknowledgments
We would like to acknowledge the support of Altra Running for the provision of the shoes used within this research, and Aden Murtagh at the New Zealand Leather & Shoe Research Association (inc.) for assistance with the mechanical testing of the shoes used in this research
Conflicts of Interest
The authors declare no conflicts of interest.
References
- Lieberman, D.E.; Venkadesan, M.; Werbel, W.A.; Daoud, A.I.; D’Andrea, S.; Davis, I.S.; Mang’Eni, R.O.; Pitsiladis, Y. Foot strike patterns and collision forces in habitually barefoot versus shod runners. Nature 2010, 463, 531–535. [Google Scholar] [CrossRef] [PubMed]
- Kasmer, M.E.; Liu, X.-c.; Roberts, K.G.; Valadao, J.M. Foot-Strike Pattern and Performance in a Marathon. Int J Sports Physiol Perform 2013, 8, 286–292. [Google Scholar] [CrossRef]
- Damsted, C.; Larsen, L.H.; Nielsen, R.O. Reliability of video-based identification of footstrike pattern and video time frame at initial contact in recreational runners. Gait & Posture 2015, 42, 32–35. [Google Scholar] [CrossRef] [PubMed]
- Nishida, K.; Hagio, S.; Kibushi, B.; Moritani, T.; Kouzaki, M. Comparison of muscle synergies for running between different foot strike patterns. PLoS ONE 2017, 12, e0171535. [Google Scholar] [CrossRef]
- Cavanagh, P.R.; Lafortune, M.A. Ground reaction forces in distance running. J. Biomech. 1980, 13, 397–406. [Google Scholar] [CrossRef] [PubMed]
- Giandolini, M.; Poupard, T.; Gimenez, P.; Horvais, N.; Millet, G.Y.; Morin, J.-B.; Samozino, P. A simple field method to identify foot strike pattern during running. J. Biomech. 2014, 47, 1588–1593. [Google Scholar] [CrossRef]
- Farley, C.T.; Gonzalez, O. Leg stiffness and stride frequency in human running. J. Biomech. 1996, 29, 181–186. [Google Scholar] [CrossRef]
- Chan, Z.Y.S.; Au, I.P.H.; Lau, F.O.Y.; Ching, E.C.K.; Zhang, J.H.; Cheung, R.T.H. Does maximalist footwear lower impact loading during level ground and downhill running? Eur J Sport Sci 2018, 18, 1083–1089. [Google Scholar] [CrossRef]
- Nigg, B.M.; Liu, W. The effect of muscle stiffness and damping on simulated impact force peaks during running. J. Biomech. 1999, 32, 849–856. [Google Scholar] [CrossRef]
- Nigg, B.M.; Bahlsen, H.A.; Luethi, S.M.; Stokes, S. The influence of running velocity and midsole hardness on external impact forces in heel-toe running. J. Biomech. 1987, 20, 951–959. [Google Scholar] [CrossRef]
- Winter, D.A. Calculation and interpretation of mechanical energy of movement. Exerc. Sport Sci. Rev. 1978, 6, 183–256. [Google Scholar] [CrossRef]
- Sinclair, J.; Jim, R.; Taylor, P.J.; Edmundson, C.J.; Brooks, D.; Hobbs, S.J. Three-dimensional kinematic comparison of treadmill and overground running. Sports Biomech. 2013, 12, 272–282. [Google Scholar] [CrossRef]
- Kram, R.; Griffin, T.M.; Donelan, J.M.; Chang, Y.H. Force treadmill for measuring vertical and horizontal ground reaction forces. J. Appl. Physiol. 1998, 85, 764–769. [Google Scholar] [CrossRef] [PubMed]
- Van Hooren, B.; Fuller, J.T.; Buckley, J.D.; Miller, J.R.; Sewell, K.; Rao, G.; Barton, C.; Bishop, C.; Willy, R.W. Is Motorized Treadmill Running Biomechanically Comparable to Overground Running? A Systematic Review and Meta-Analysis of Cross-Over Studies. Sports Med. 2020, 50, 785–813. [Google Scholar] [CrossRef] [PubMed]
- Asmussen, M.J.; Kaltenbach, C.; Hashlamoun, K.; Shen, H.; Federico, S.; Nigg, B.M. Force measurements during running on different instrumented treadmills. J. Biomech. 2019, 84, 263–268. [Google Scholar] [CrossRef] [PubMed]
- García-Pérez, J.A.; Pérez-Soriano, P.; Llana, S.; Martínez-Nova, A.; Sánchez-Zuriaga, D. Effect of overground vs treadmill running on plantar pressure: Influence of fatigue. Gait & Posture 2013, 38, 929–933. [Google Scholar] [CrossRef]
- Kluitenberg, B.; Bredeweg, S.W.; Zijlstra, S.; Zijlstra, W.; Buist, I. Comparison of vertical ground reaction forces during overground and treadmill running. A validation study. BMC Musculoskel. Disord. 2012, 13, 235. [Google Scholar] [CrossRef]
- Costa, M.E.F.; Fonseca, J.B.; Oliveira, A.I.S.d.; Cabral, K.D.d.A.; Araújo, M.d.G.R.d.; Ferreira, A.P.d.L. Prevalence and factors associated with injuries in recreational runners: A cross-sectional study. Revista Brasileira de Medicina do Esporte 2020, 26. [Google Scholar] [CrossRef]
- Johnson, C.D.; Tenforde, A.S.; Outerleys, J.; Reilly, J.; Davis, I.S. Impact-Related Ground Reaction Forces Are More Strongly Associated With Some Running Injuries Than Others. The American Journal of Sports Medicine 2020, 48, 3072–3080. [Google Scholar] [CrossRef]
- Davis, S.I.; Bradley, J.B.; David, R.M. Greater vertical impact loading in female runners with medically diagnosed injuries: A prospective investigation. Br. J. Sports Med. 2016, 50, 887. [Google Scholar] [CrossRef]
- Clarke, T.E.; Frederick, E.C.; Cooper, L.B. Effects of Shoe Cushioning Upon Ground Reaction Forces in Running. Int. J. Sports Med. 1983, 04, 247–251. [Google Scholar] [CrossRef]
- Bergstra, S.A.; Kluitenberg, B.; Dekker, R.; Bredeweg, S.W.; Postema, K.; Van den Heuvel, E.R.; Hijmans, J.M.; Sobhani, S. Running with a minimalist shoe increases plantar pressure in the forefoot region of healthy female runners. J. Sci. Med. Sport 2015, 18, 463–468. [Google Scholar] [CrossRef]
- Kulmala, J.-P.; Kosonen, J.; Nurminen, J.; Avela, J. Running in highly cushioned shoes increases leg stiffness and amplifies impact loading. Sci. Rep 2018, 8, 17496. [Google Scholar] [CrossRef]
- Hannigan, J.J.; Pollard, C.D. Differences in running biomechanics between a maximal, traditional, and minimal running shoe. J. Sci. Med. Sport 2020, 23, 15–19. [Google Scholar] [CrossRef] [PubMed]
- Almeida, M.O.; Davis, I.S.; Lopes, A.D. Biomechanical Differences of Foot-Strike Patterns During Running: A Systematic Review With Meta-analysis. Journal of Orthopaedic & Sports Physical Therapy 2015, 45, 738–755. [Google Scholar] [CrossRef] [PubMed]
- Shorten, M.; Mientjes, M.I.V. The ‘heel impact’ force peak during running is neither ‘heel’ nor ‘impact’ and does not quantify shoe cushioning effects. Footwear Science 2011, 3, 41–58. [Google Scholar] [CrossRef]
- Gruber, A.H.; Boyer, K.A.; Derrick, T.R.; Hamill, J. Impact shock frequency components and attenuation in rearfoot and forefoot running. Journal of Sport and Health Science 2014, 3, 113–121. [Google Scholar] [CrossRef]
- Gruber, A.H.; Edwards, W.B.; Hamill, J.; Derrick, T.R.; Boyer, K.A. A comparison of the ground reaction force frequency content during rearfoot and non-rearfoot running patterns. Gait & Posture 2017, 56, 54–59. [Google Scholar] [CrossRef]
- Williams, D.S.; McClay, I.S.; Manal, K.T. Lower Extremity Mechanics in Runners with a Converted Forefoot Strike Pattern. J Appl Biomech 2000, 16, 210–218. [Google Scholar] [CrossRef]
- Shih, Y.; Lin, K.-L.; Shiang, T.-Y. Is the foot striking pattern more important than barefoot or shod conditions in running? Gait & Posture 2013, 38, 490–494. [Google Scholar] [CrossRef]
- Macdermid, P.W.; Walker, S.J.; Cochrane, D. The Effects of Cushioning Properties on Parameters of Gait in Habituated Females While Walking and Running. Applied Sciences 2025, 15, 1120. [Google Scholar] [CrossRef]
- Renner, K.E.; Peebles, A.T.; Socha, J.J.; Queen, R.M. The impact of sampling frequency on ground reaction force variables. J. Biomech. 2022, 135, 111034. [Google Scholar] [CrossRef]
- Welch, P. The use of fast Fourier transform for the estimation of power spectra: A method based on time averaging over short, modified periodograms. IEEE Transactions on Audio and Electroacoustics 1967, 15, 70–73. [Google Scholar] [CrossRef]
- Zhuang, Y.; Zhou, W.; Zeng, Z.; Mo, S.; Wang, L. Influences of footstrike patterns and overground conditions on lower extremity kinematics and kinetics during running: Statistical parametric mapping analysis. PLoS ONE 2025, 20, e0317853. [Google Scholar] [CrossRef] [PubMed]
- Kulmala, J.-P.; Avela, J.; Pasanen, K.; Parkkari, J. Forefoot strikers exhibit lower running-induced knee loading than rearfoot strikers. Med. Sci. Sports Exerc. 2013, 45, 2306–2313. [Google Scholar] [CrossRef] [PubMed]
- Nigg, B.M.; Vienneau, J.; Smith, A.C.; Trudeau, M.B.; Mohr, M.; Nigg, S.R. The Preferred Movement Path Paradigm: Influence of Running Shoes on Joint Movement. Med. Sci. Sports Exerc. 2017, 49, 1641–1648. [Google Scholar] [CrossRef] [PubMed]
- Di Michele, R.; Merni, F. The concurrent effects of strike pattern and ground-contact time on running economy. J. Sci. Med. Sport 2014, 17, 414–418. [Google Scholar] [CrossRef]
- Sobhani, S.; van den Heuvel, E.R.; Dekker, R.; Postema, K.; Kluitenberg, B.; Bredeweg, S.W.; Hijmans, J.M. Biomechanics of running with rocker shoes. J. Sci. Med. Sport 2017, 20, 38–44. [Google Scholar] [CrossRef]
- Milner, C.E.; Ferber, R.; Pollard, C.D.; Hamill, J.; Davis, I.S. Biomechanical factors associated with tibial stress fracture in female runners. Med. Sci. Sports Exerc. 2006, 38, 323–328. [Google Scholar] [CrossRef]
- Rodrigo-Carranza, V.; Hoogkamer, W.; González-Ravé, J.M.; Horta-Muñoz, S.; Serna-Moreno, M.d.C.; Romero-Gutierrez, A.; González-Mohíno, F. Influence of different midsole foam in advanced footwear technology use on running economy and biomechanics in trained runners. Scandinavian Journal of Medicine & Science in Sports 2024, 34, e14526. [Google Scholar] [CrossRef]
- Mann, R.; Malisoux, L.; Urhausen, A.; Statham, A.; Meijer, K.; Theisen, D. The effect of shoe type and fatigue on strike index and spatiotemporal parameters of running. Gait & Posture 2015, 42, 91–95. [Google Scholar] [CrossRef] [PubMed]
- Mercer, J.A.; Horsch, S. Heel–toe running: A new look at the influence of foot strike pattern on impact force. Journal of Exercise Science & Fitness 2015, 13, 29–34. [Google Scholar] [CrossRef] [PubMed]
- Napier, C.; Fridman, L.; Blazey, P.; Tran, N.; Michie, T.V.; Schneeberg, A. Differences in Peak Impact Accelerations Among Foot Strike Patterns in Recreational Runners. Front Sports Act Living 2022, 4. [Google Scholar] [CrossRef] [PubMed]
Figure 1.
Examples of running strike patterns running at 14 km∙h-1 overland using the same running shoe design. Where, A. Heel , B. Midfoot, and C. Forefoot Strikes.
Figure 1.
Examples of running strike patterns running at 14 km∙h-1 overland using the same running shoe design. Where, A. Heel , B. Midfoot, and C. Forefoot Strikes.
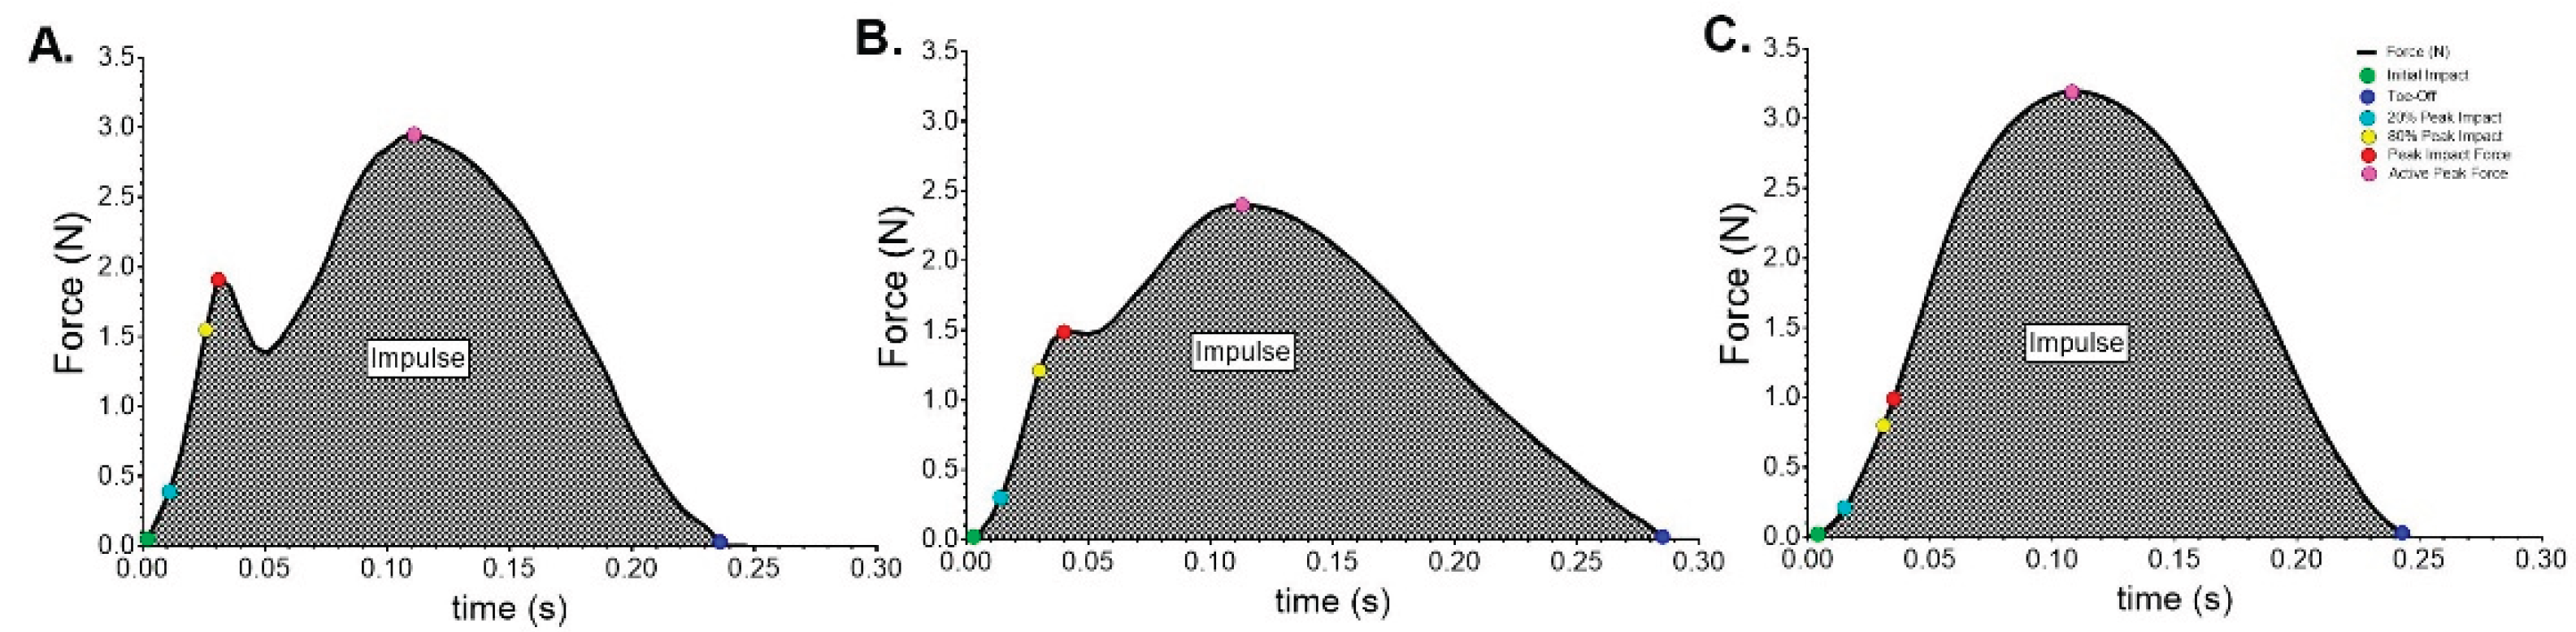
Figure 2.
Spatial distribution of peak impact force during 12 km∙h-1 treadmill running for each participant.
Figure 2.
Spatial distribution of peak impact force during 12 km∙h-1 treadmill running for each participant.
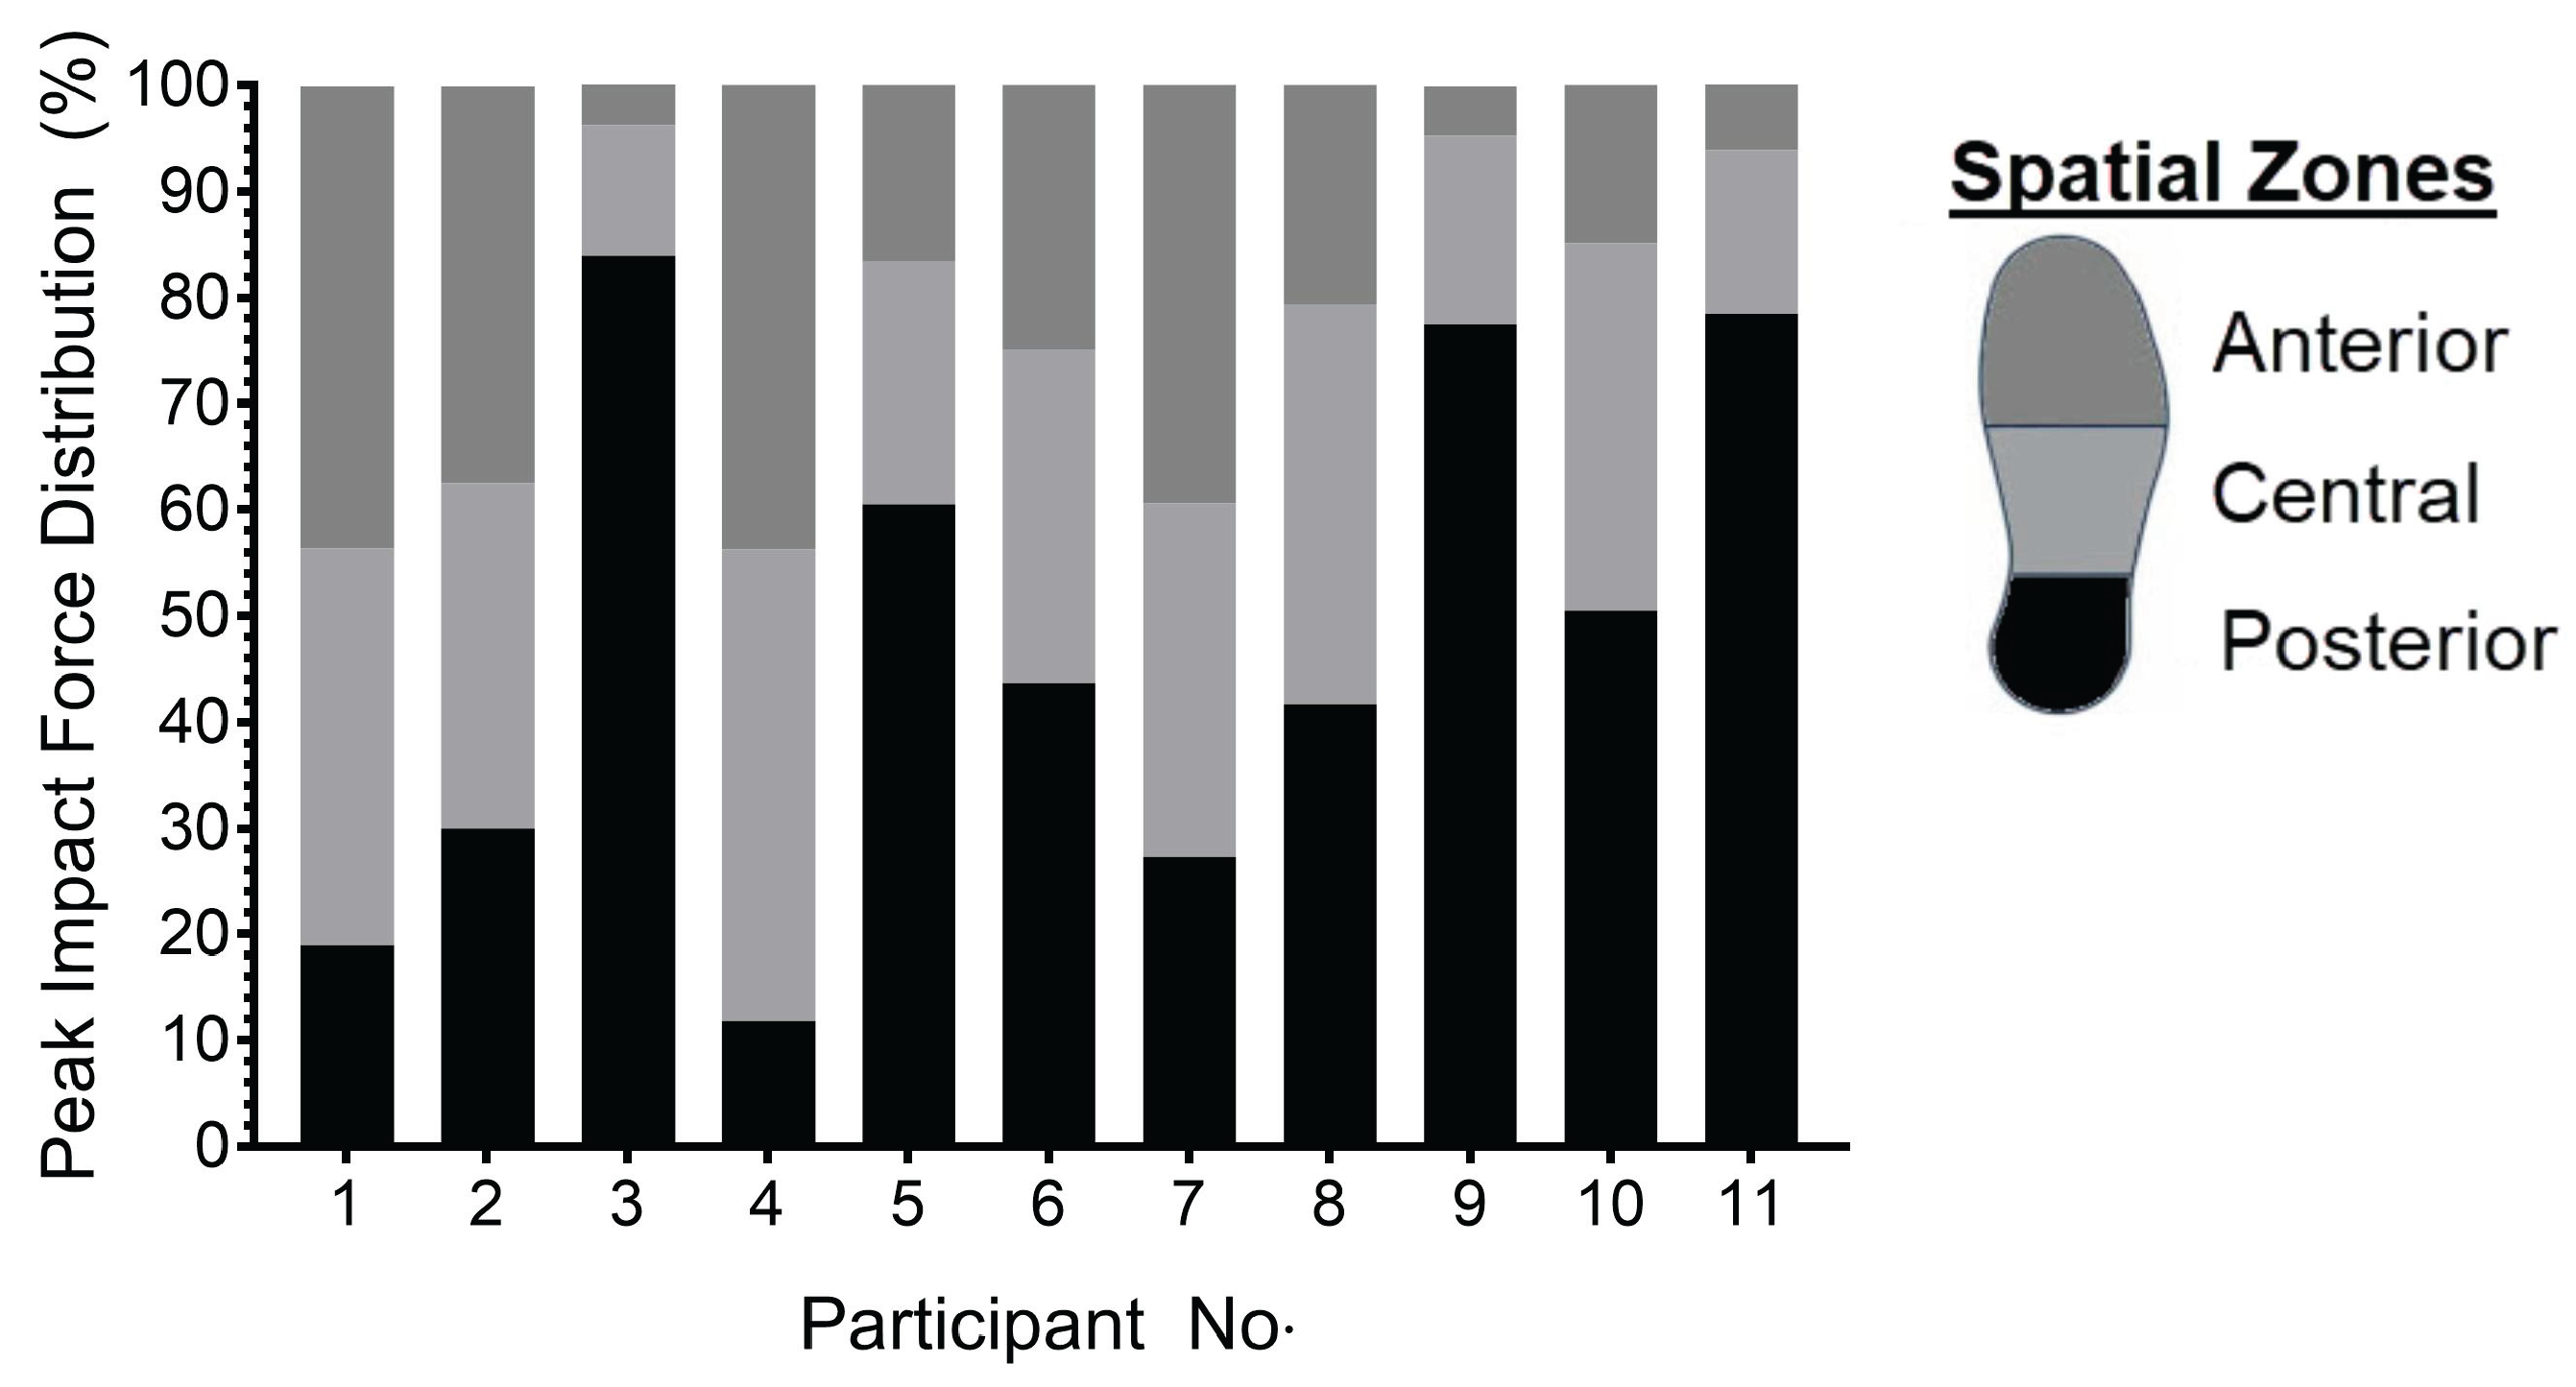
Figure 3.
A. The test footwear, and B. The load-extension profile illustrating the midsole energy absorption and hysteresis behaviour.
Figure 3.
A. The test footwear, and B. The load-extension profile illustrating the midsole energy absorption and hysteresis behaviour.
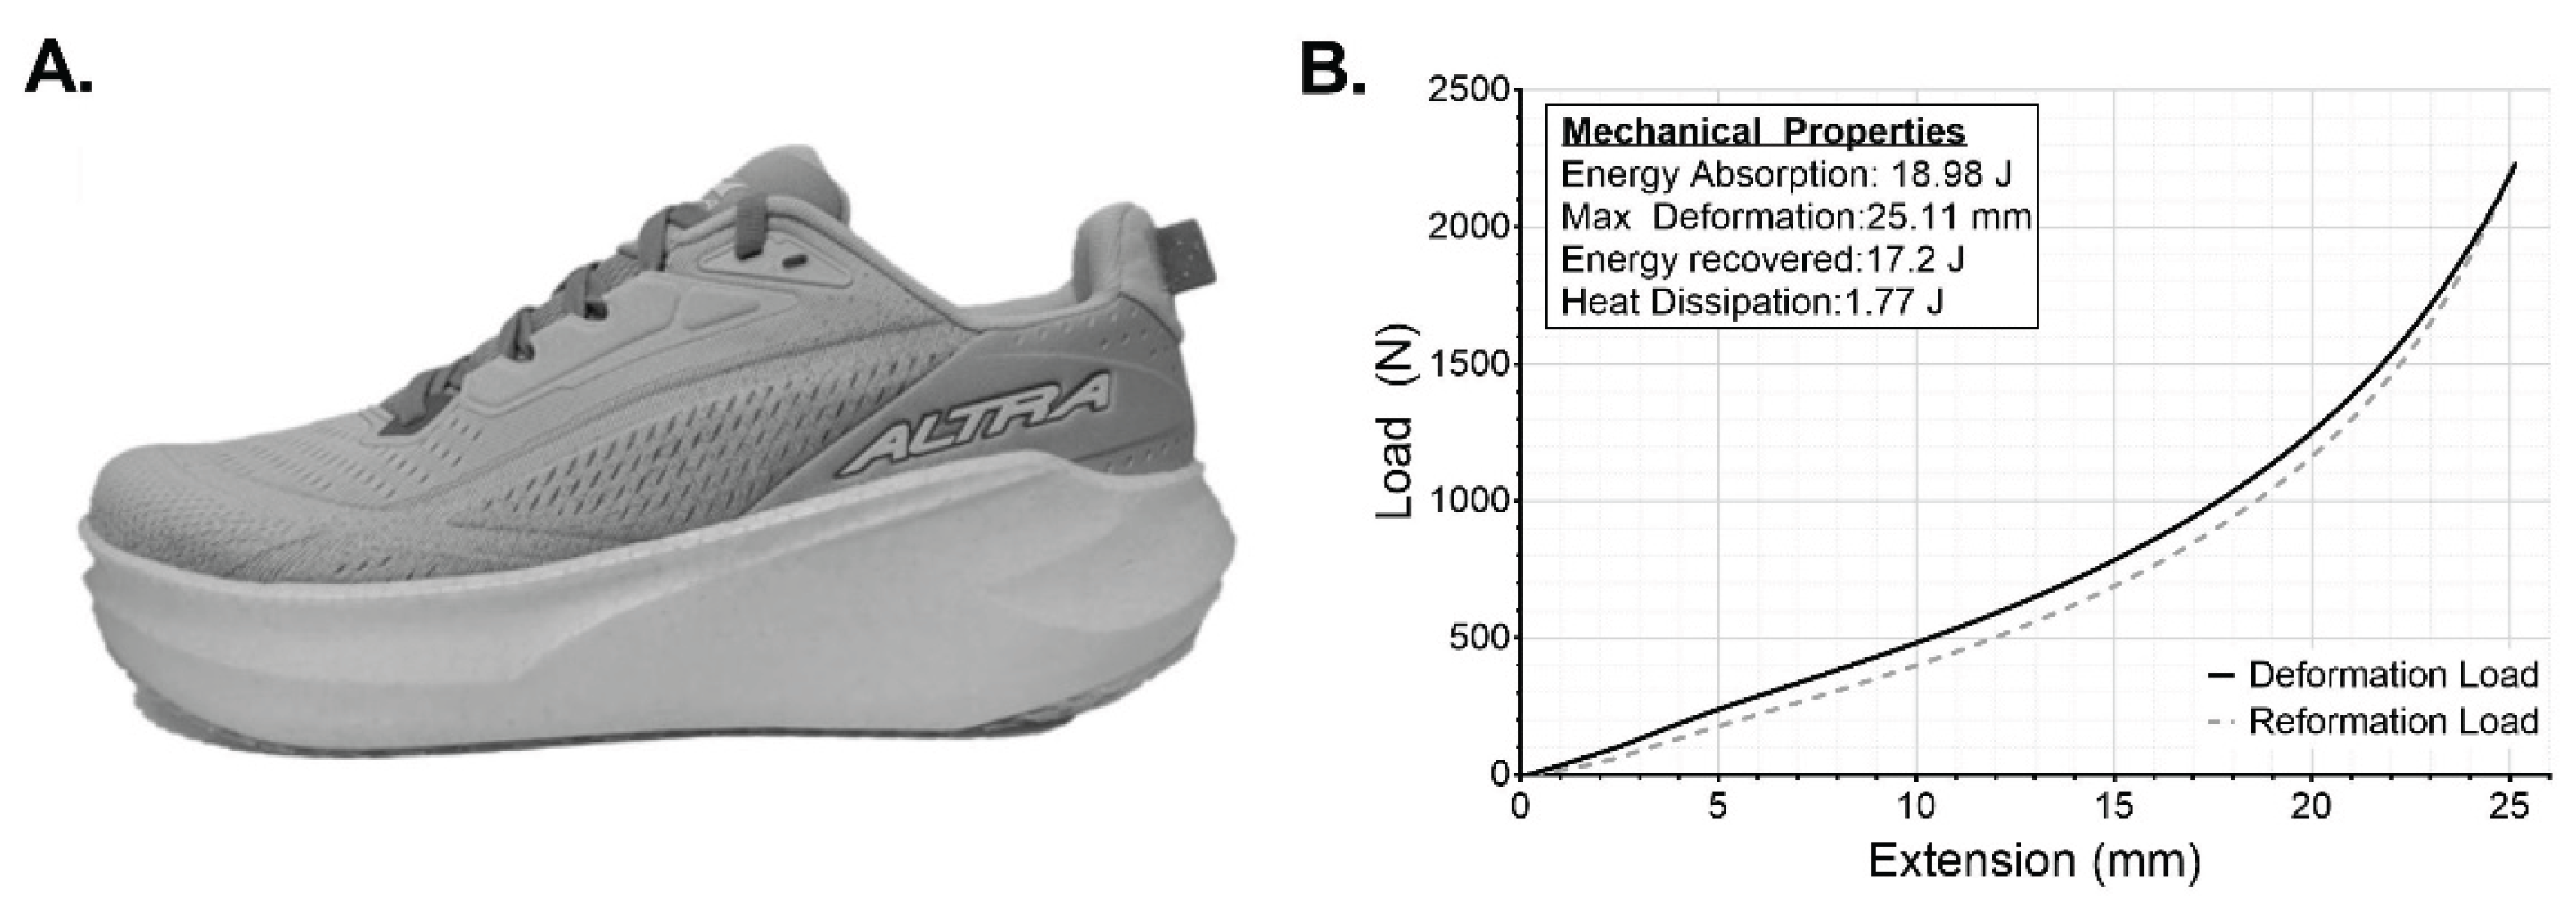
Figure 4.
Plantar force traces from participant 10 for total, posterior, central, and anterior zones whilst using A. Heel , B. Midfoot, and C. Forefoot strike pattern.
Figure 4.
Plantar force traces from participant 10 for total, posterior, central, and anterior zones whilst using A. Heel , B. Midfoot, and C. Forefoot strike pattern.
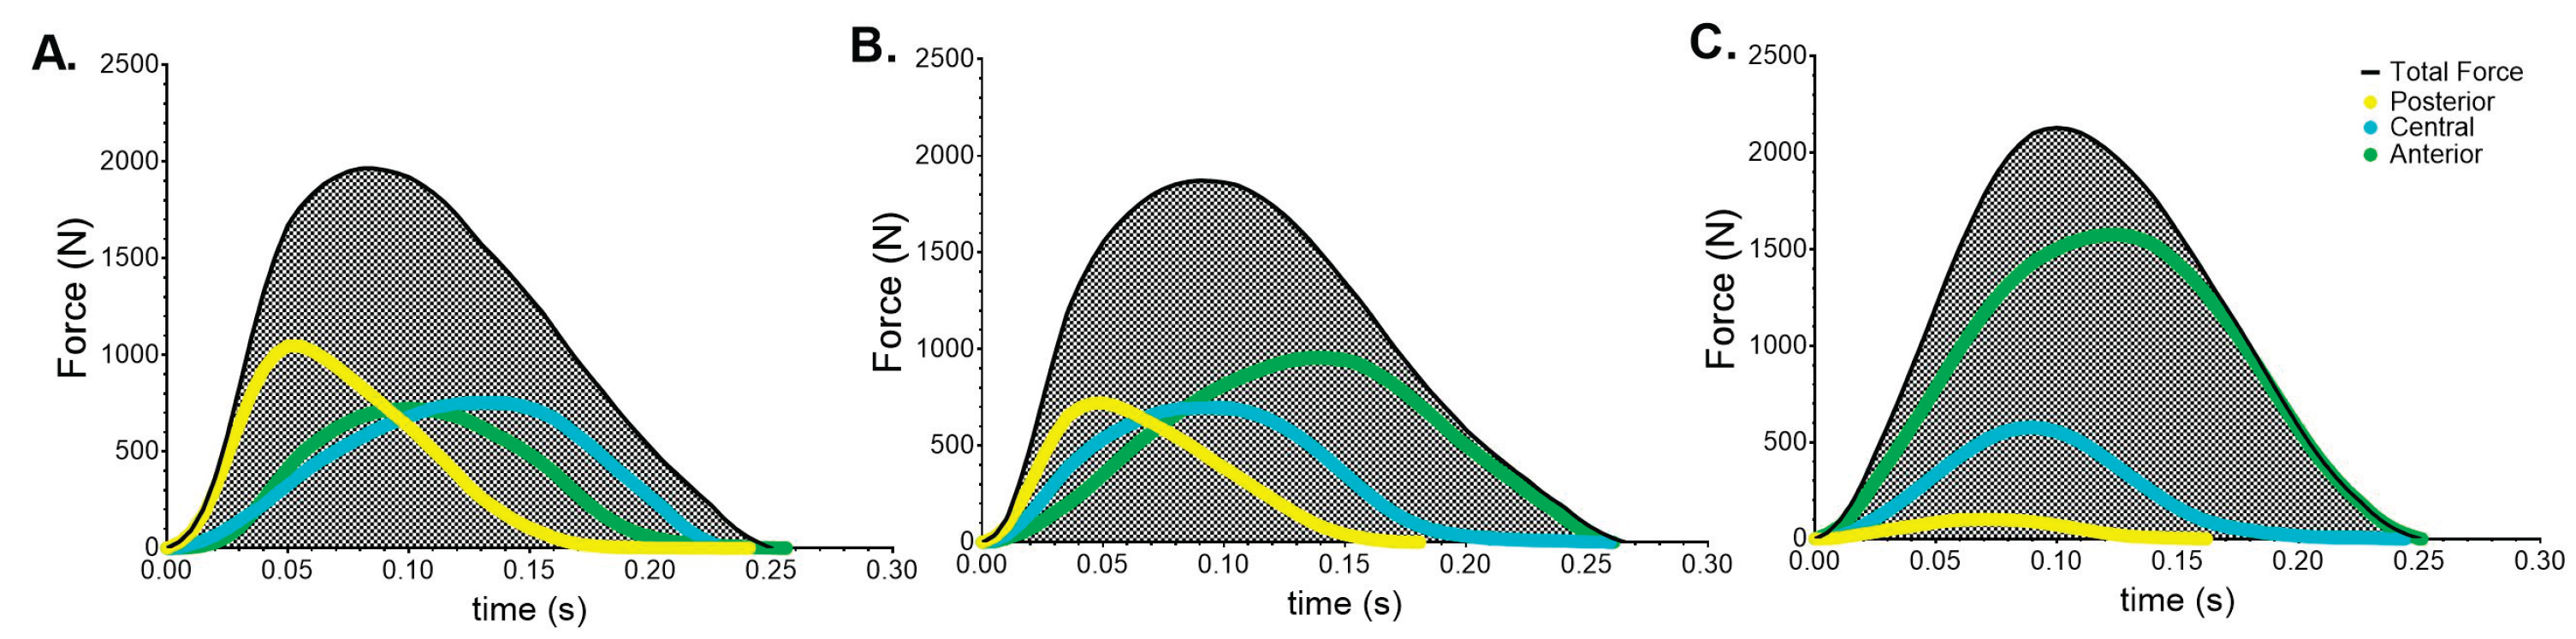
Figure 5.
Mean±SD data for each strike pattern for A. Spatial component of vertical peak impact force (N∙BW-1), B. Spatial component of average loading rate (N∙s-1∙BW-1), C. Mean percentage contribution of spatial components to total vertical peak impact force.
Figure 5.
Mean±SD data for each strike pattern for A. Spatial component of vertical peak impact force (N∙BW-1), B. Spatial component of average loading rate (N∙s-1∙BW-1), C. Mean percentage contribution of spatial components to total vertical peak impact force.
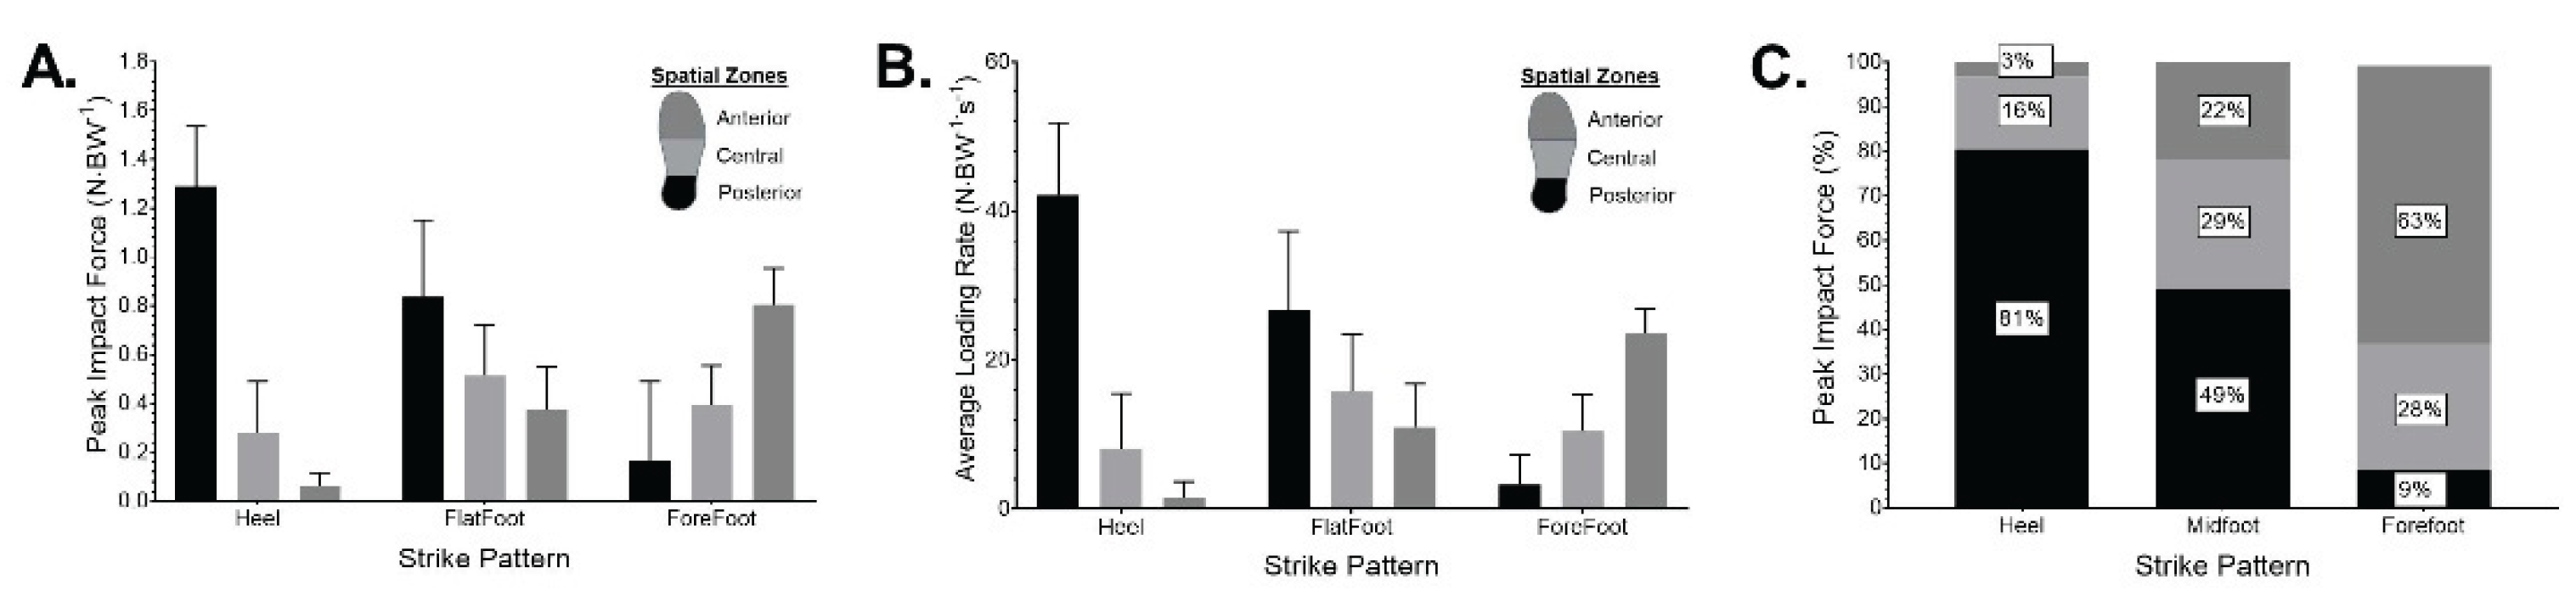
Figure 6.
Mean±SD data from power spectral density (PSD) of plantar forces for each strike pattern. A. Comparison of the low-frequency (<10 Hz) and high-frequency (>10 Hz) PSD components, B. High-frequency PSD distribution for the posterior, central, and anterior zones of the foot.
Figure 6.
Mean±SD data from power spectral density (PSD) of plantar forces for each strike pattern. A. Comparison of the low-frequency (<10 Hz) and high-frequency (>10 Hz) PSD components, B. High-frequency PSD distribution for the posterior, central, and anterior zones of the foot.
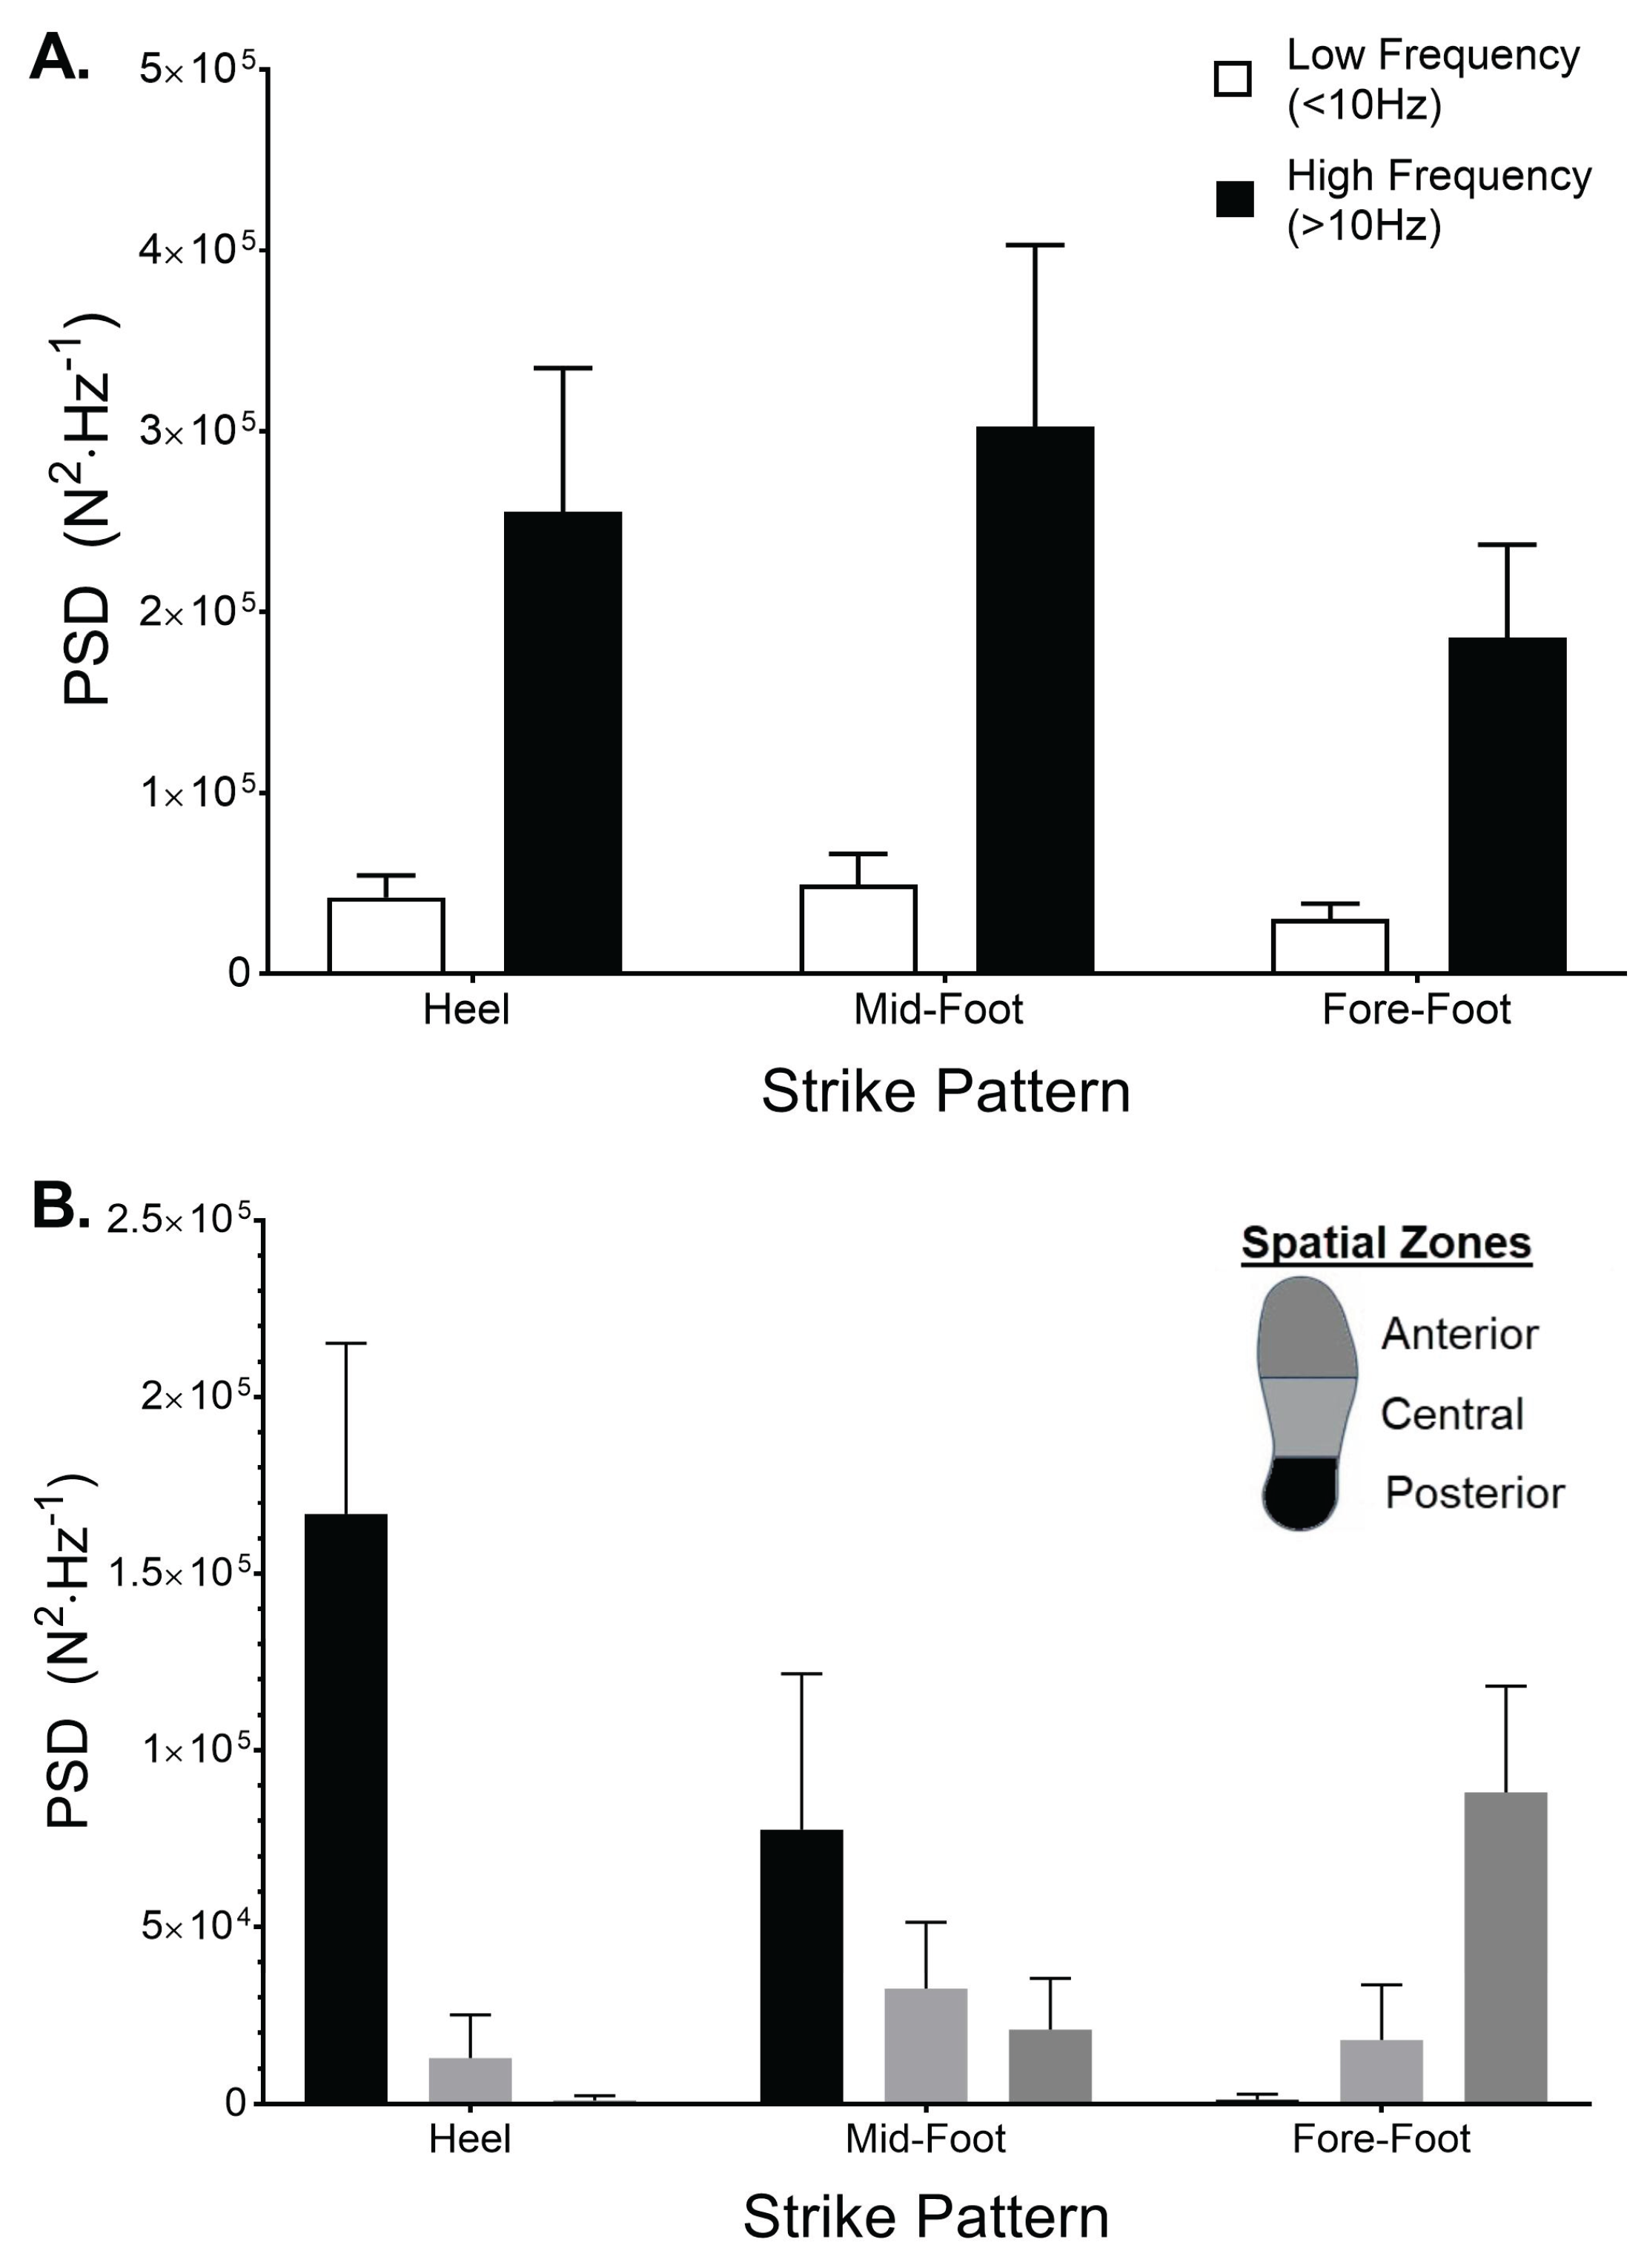

Table 1.
Mean±SD spatiotemporal and kinetic variables generated from total force for each strike pattern.
Table 1.
Mean±SD spatiotemporal and kinetic variables generated from total force for each strike pattern.
| Strike Pattern | |||
|---|---|---|---|
| Heel | Mid-Foot | Fore-Foot | |
| Stride duration (s) | 0.762 ± 0.035 | 0.753 ± 0.043 | 0.760 ± 0.039 |
| Ground contact time (s) | 0.257 ± 0.018 | 0.253 ± 0.012 | 0.253 ± 0.015 |
| Swing time (s) | 0.505 ± 0.049 | 0.500 ± 0.052 | 0.508 ± 0.050 |
| Peak Impact Force (N∙BW-1) | 1.64 ± 0.35 | 1.74 ± 0.31 | 1.37 ± 0.34 |
| Average Loading Rate (N∙s-1∙BW-1) | 53.7 ± 16.1 | 55.3 ± 13.2 | 39.11 ± 12.6 |
| Active Peak Force (N∙BW-1) | 2.93 ± 0.35 | 3.04 ± 0.30 | 3.31 ± 0.26 |
| Impulse (N∙s∙BW-1) | 0.45 ± 0.03 | 0.47 ± 0.03 | 0.49 ± 0.03 |
Table 2.
Mean±SD for kinetic variables for the spatial zones across strike patterns.
| Strike Pattern | |||||||||
|---|---|---|---|---|---|---|---|---|---|
| Heel | Mid-Foot | Fore-Foot | |||||||
| Spatial Zone | Posterior | Central | Anterior | Posterior | Central | Anterior | Posterior | Central | Anterior |
| Peak Impact Force (N∙BW-1) | 1.29±0.25 | 0.28±0.21 | 0.17±0.33 | 0.84±0.31 | 0.52±0.21 | 0.17±0.33 | 0.17±0.33 | 0.39±0.17 | 0.81±0.15 |
| Average Loading Rate (N∙s-1∙BW-1) | 42.16±9.70 | 8.17±7.32 | 1.15±2.15 | 26.68±10.63 | 15.76±7.71 | 11.01±5.81 | 3.28±4.05 | 10.46±4.92 | 23.58±3.31 |
| Active Peak Force (N∙BW-1) | 1.06±0.03 | 0.98±0.23 | 0.89±0.11 | 0.64±0.28 | 0.97±0.24 | 1.43±0.26 | 0.18±0.22 | 0.82±0.34 | 2.12±0.53 |
| Impulse (N∙s∙BW-1) | 0.16±0.03 | 0.12±0.03 | 0.17±0.02 | 0.09±0.04 | 0.12±0.03 | 0.25±0.04 | 0.02±0.03 | 0.10±0.04 | 0.37±0.05 |
Disclaimer/Publisher’s Note: The statements, opinions and data contained in all publications are solely those of the individual author(s) and contributor(s) and not of MDPI and/or the editor(s). MDPI and/or the editor(s) disclaim responsibility for any injury to people or property resulting from any ideas, methods, instructions or products referred to in the content. |
© 2025 by the authors. Licensee MDPI, Basel, Switzerland. This article is an open access article distributed under the terms and conditions of the Creative Commons Attribution (CC BY) license (http://creativecommons.org/licenses/by/4.0/).
Copyright: This open access article is published under a Creative Commons CC BY 4.0 license, which permit the free download, distribution, and reuse, provided that the author and preprint are cited in any reuse.


