Submitted:
30 July 2025
Posted:
31 July 2025
You are already at the latest version
Abstract
To study conformational changes in oligomeric hyaluronan (HN) macromolecules (11.2-50.0 kDa) in aqueous solutions over a wide pH range (4.0-10.0), 2-aminobenzoic ac-id-labeled macromolecules of the polysaccharide were synthesized. The main macromo-lecular chain stability during the process of the label to HN conjugation was confirmed by the solutions viscosity permanence. To verify the HN molecules modification, Fluores-cence Spectrophotometry (FS) and Hydrophilic Interaction High-Performance Liquid Chromatography (HILIC HPLC) with fluorimetric detection were used. The conforma-tional behavior of labeled HNs was studied with Differential Scanning Fluorimetry (DSF), and the average hydrodynamic sizes of particles were estimated with Dynamic Light Scattering (DLS) and Nanoparticle Tracking Analysis (NTA). The change in the label flu-orescence intensity and the particle sizes of both the original labeled HNs and the prod-ucts of their chemical interaction with n-Butanediol diglycidyl ether (BDDE) were as-sessed. Assumptions regarding the direction of the chemical interaction processes of HNs and glycidyl ethers were made.
Keywords:
hyaluronan
; conformational changes
; oligomeric molecules
; 2-aminobenzoic Acid Labeling
; Differential Scanning Fluorimetry
; Dynamic Light Scattering
; Crosslinking
; n-Butanediol diglycidyl ether
1. Introduction
Hyaluronans (HNs), hyaluronic acids and their salt forms, are common glycosaminoglycans consisting of monomer units of D-Glucuronic acid and N-Acetyl-D-Glucosamine [1,2,3,4,5,6,7,8,9,10,11,12,13,14,15,16]:
Figure 1.
Monomeric unit of HN in salt form.
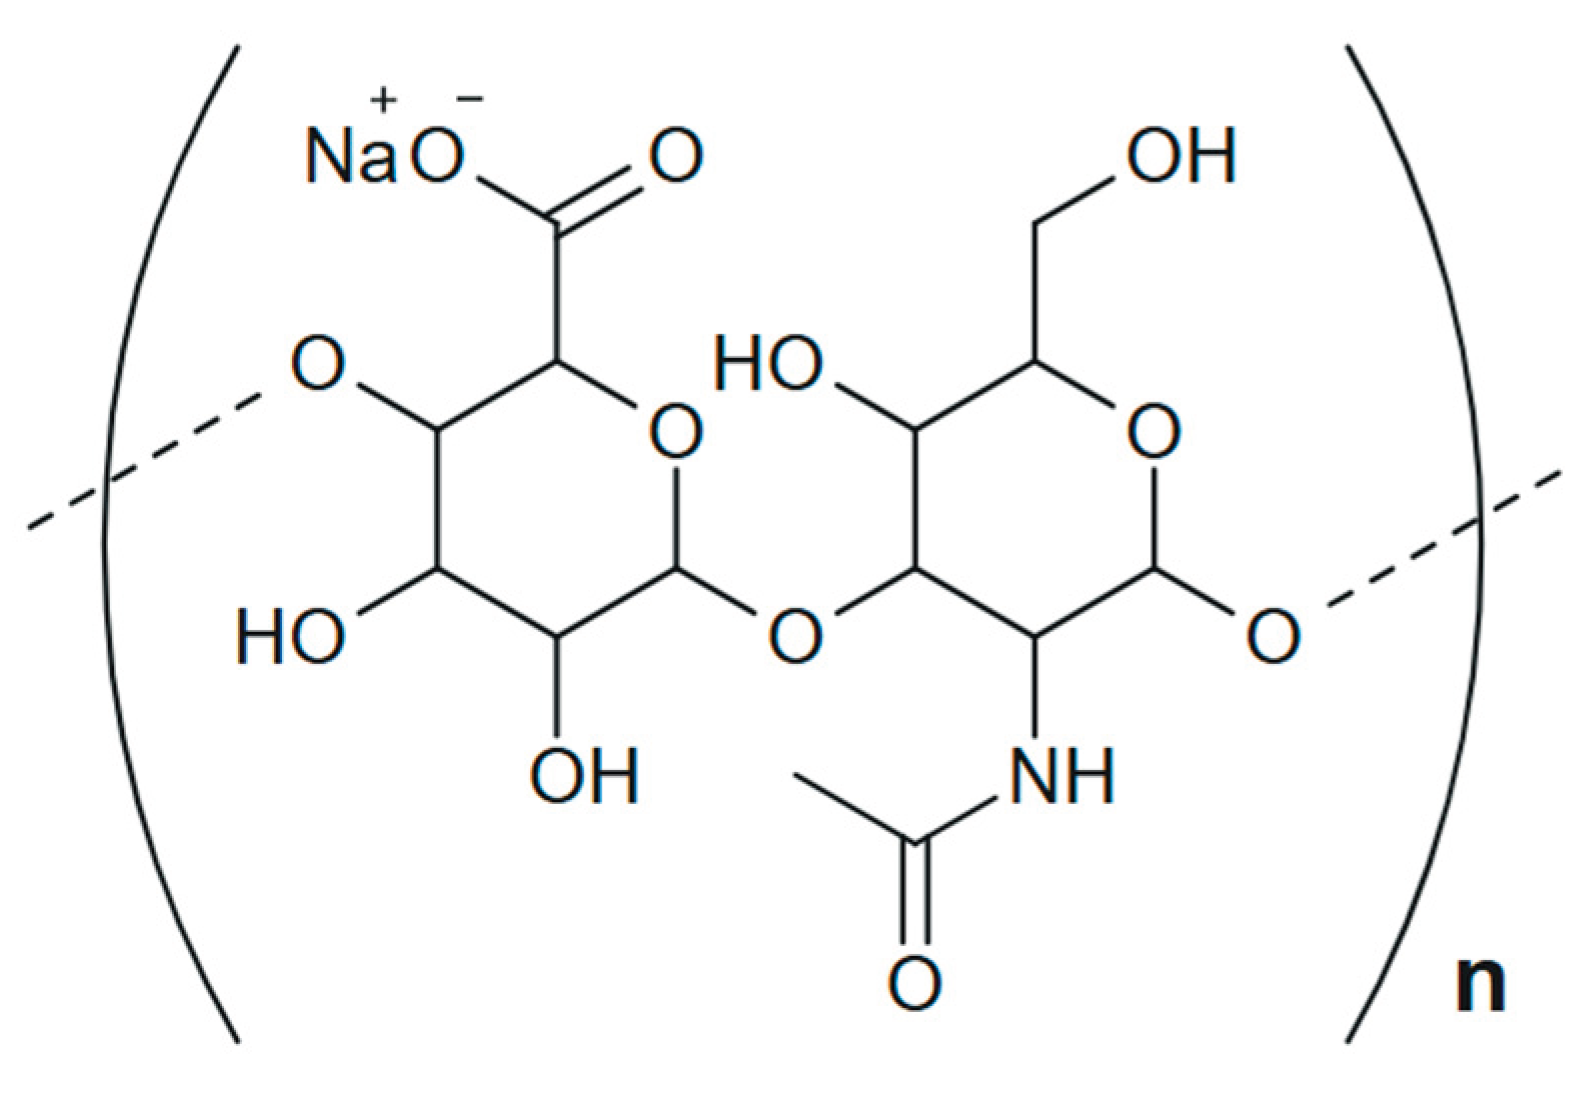
The chemical structure of HN is quite regular; the only possible deviation is the replacement of N-acetyl-D-glucosamine residues with the corresponding deacetylated fragments [4].
HN are ubiquitous in vertebrate organisms, as well as in many bacterial strains cell membrane [17]; the largest amount of HN is found in the extracellular matrix of soft connective tissues [4]. The biocompatibility and non-immunogenicity of these polysaccharides, and outstanding viscoelastic properties of their aqueous solutions are of great interest to researchers [4,15,17,18,19,20,21]. The aforementioned properties are the reason why HNs are in high demand in cosmetic, medical and pharmaceutical fields [9,16,22,23,24,25,26,27,28,29,30].
One of the current areas in HN research is their chemical modification to obtain new products with specifically altered properties. Such modification is possible due to the presence of reactive groups in HN, i.e., carboxyl – usually in the salt form –СОО– – and hydroxy [31,32,33]. Among the chemical modification methods, it should be noted the reactions with divinyl sulfone [34,35], epoxy compounds [36,37,38,39,40,41,42], diamines [43], carbodiimides [20,37,44], aldehydes [37,45] and other substances [20]. Obviously, when carrying out the corresponding chemical processes, the HN reactive groups availability for the modifier is of great importance, which is determined, among other conditions, by the macromolecule conformation in solution [46,47,48,49,50,51,52]. According to [17,21,53], in aqueous solutions the HN macromolecule takes a random spiral form. Several levels of supramolecular organisation of HN are distinguished:
- Spatial tertiary structure of HN formed as a result of the helices interweaving and stabilized by hydrogen bonds between them due to –OH groups [16,21]. These bonds in HNs are weak [64,67,68,69] and can be dynamically destroyed/formed when the solution pH changes [18,56,64,67,68,69], altering the spatial characteristics of HN supramolecular formation over a wide range [70,71,72].
The conformational behavior of HN depends on many factors, including the molecular mass (MM) and concentration of the polymer, the ionic strength of the solution, etc. [16,55,56,70]. For example, an increase in the HN concentration promotes the amplification of intermolecular interactions [73,74], resulting in the complex supramolecular structures formation. It should be noted that most studies of HNs reviewing their supramolecular structure features are concerned with high MM HNs. It is known that HNs of bacterial origin usually have the MM of approximately 1.5-2.5 MDa [28], 1.0-4.0 MDa according to [55], whereas the HNs of animal origin demonstrate higher molecular mass, their MM is on average 4-6 MDa [28], but can reach 8 MDa [75] and even 20 MDa [76]. At the same time, enzymatic methods make it possible to obtain HNs with lower MM, less than 2.5 MDa [76]. The authors [75,77] note that the biological effect of HN is highly dependent on their MM; the difference was already observed when comparing HN with MM of 0.4–4.0 kDa and 6–20 kDa [55,77,78]. Probably, the peculiarities of the macromolecules supramolecular structure are one of the reasons for such diversity. In this case, both local conformational rearrangements of individual macromolecules at the secondary structure level and the tertiary structure evolution could contribute to changes in the structure and properties. It should be noted that due to the polysaccharide macromolecules rigid-chain nature the formation of true random macromolecular HN coils cannot be expected, but some degree of curvature, according to [79], is acceptable.
To study the features of the supramolecular structure of HN the methods of NMR spectroscopy [80,81,82], Atomic Force Microscopy [83,84], Surface Plasmon Resonance and Colloidal Probe Microscopy [85], Light Scattering [83] and Molecular Modeling [49,86] are successfully used. However, complete understanding of the HN conformational behavior in dilute solution remains a challenging task. One of the relatively new method useful for this purpose may be Differential Scanning Fluorimetry (DSF). Therefore, the goal of this work was to study the HNs supramolecular structure using DSF and to analyze the features of their interaction with a curing agent, Butane-1,4-diol (BDDE).
2. Materials and Methods
2.1. Materials
The following materials were used for the HNs’ samples preparation: HNs’ powder with average MMs: 11.2, 20.2 and 50.0 kDa (≥97.5% Xi′an Lyphar Biotech Co., Ltd, China), 2-aminobenzoic (anthranilic) acid (2-AA) (≥98%, Sigma-Aldrich, USA), cyanoborohydride (≥95%, Sigma-Aldrich, USA), dimethyl sulfoxide (DMSO) (99.5%, NeoFroxx GmbH, Germany), acetic acid (glacial) (99.5-100.5%, Panreac, USA), tris(hydroxymethyl)aminomethane (99-100.5%, Dia-m, Russia), and acetonitrile (UV-IR-HPLC-gradient) (99.9%, Panreac, USA). The Millipore Milli-Q water purification system (USA) was used to prepare all solutions. For HILIC HPLC, the following mobile phases were prepared: 100 mM ammonium formate solution, 100% acetonitrile. All reagents used in the investigation were pharma grade. Butane-1,4-diol (BDDE) (≥95%, Sigma-Aldrich, USA) was used as a curing agent. 2,3-Epoxy-1-propanol (Glycidol) (≥95%, Sigma-Aldrich, USA) was used to prepare model systems for NMR.
2.2. Conjugation of HN with a Fluorescent Label
Conjugation of the fluorescent label 2-AA with HN was carried out using freshly prepared aqueous solutions of these substances with a concentration of the target polysaccharide of at least 2.0 mg/ml according to the method [87]. The solution for derivatization was prepared as follows: 2-AA, NaBH3CN, DMSO (100%) and acetic acid (glacial) in the required proportions were placed in a propylene test tube and incubated at temperature of (65±2) °C for 1.5 hour. The resulting solution was centrifuged in a D3024 centrifuge with an angle rotor (DLAB, China) at 5000g for 15 min. Then the supernatant was decanted, and the sediment was washed with acetonitrile at least 3 times and centrifuged again. Residual acetonitrile was removed by evaporation for 15-20 minutes at 60 °C. The resulting precipitate was dissolved in purified water, and the solution was used for further studies.
2.3. Interaction of HNs with BDDE
To carry out chemical modification of oligomeric HNs with BDDE, the following procedure was carried out. BDDE was added to solutions of HNs modified with 2-AA in a volume ratio of 1:1, the resulting systems were thoroughly mixed, and the required amount of titrant 1.0 M NaOH/0.1 M HCl or purified water (depending on the required pH = 3; 6-7 or 12) was added to the total volume (300 μL). The obtained systems were studied using DSF and DLS methods.
2.4. Model Systems for the HN Modification Studying
To assess the direction of crosslinking of HN using epoxy oligomers, several model systems were used. The initial HN sample with MM 50.0 kDa was dissolved in the required amount of NaOH solution w/wo the addition of glycidol, followed by synthesis at (60±2) °C for 2 h. The obtained samples were then dialyzed and lyophilized for subsequent NMR analysis. Dialysis was performed using Spectra/Por cellulose bags (Cole-Parmer, France) with a pore diameter corresponding to MM 6-8kDa, in the system being stirred for 12 h. Lyophilization in a Harvest Right Benchtop Freeze Dryer (Harvest Right, USA) at minus 20°C, in 10R format glass vials of hydrolytic class I sealed with bromobutyl stoppers, with a filling volume of 5.0 ml was carried out.
2.5. Methods
The main research methods were DSF and light scattering methods, i.e., dynamic light scattering (DLS) and nanoparticle tracking analysis (NTA). To confirm the conjugation of the fluorescent label with oligomeric HN, fluorescence spectrophotometry and hydrophilic interaction high-performance liquid chromatography (HILIC HPLC) methods were additionally used. The presence of destructive processes during conjugation was assessed using rotational viscometry data. The samples for the studies were aqueous solutions of 2-AA-labeled oligomeric HNs, the pH of which was adjusted using 0.1 M HCl and 1.0 M NaOH solutions. pH was controlled using a Mettler Toledo pH meter with a microelectrode (sample volume - 180 μL).
The assessment of conformational stability of labelled HN samples were provided by DSF method on the biological stability screening platform UNcle (Unchained Labs, USA). The measurements were carried out in dynamic mode under the following conditions, i.e., incubation time 120 sec, temperature range 10-90 °C, heating rate 1°C/min; IgG1 antibody was used as a standard sample, the total analysis time was 2 hours.
The average hydrodynamic particle size of the modified HN was determined by DLS using a ZetaSizer Ultra Red Label instrument (Malvern Pananalytical LTD, UK) in isothermal mode at 60 °C for 3 h. The thermostatting time before the initial measurement by the DLS method was 120 sec; the measurement frequency was every 10 minutes in three replicates; the cuvette was ZEN0040; the measurement angle was 174°.
The investigations by the NTA method were carried out using the NanoSight NS300 device with an automatic syringe pump and a highly sensitive Scientific CMOS video camera (Malvern Panalytical, UK). The measurements were performed in the following mode: temperature (25±2) °C, syringe filling volume – 1.0 ml, syringe pump pressing speed – 200 ppm, concentration of the studied solutions 1.0 and 0.25 mg/ml.
Fluorescence spectra of labelled HN solutions were obtained using an Agilent Cary Eclipse fluorescent spectrophotometer (Agilent Technologies, USA) in fluorimetry mode, in the wavelength range from 375 to 600 nm (with a step of 1.0 nm), excitation at 360 nm, emission 425 nm.
HILIC HPLC was carried out using a chromatographic system with a fluorescence detector Alliance 2695/e2695 (Waters, USA), Advancebio Glycan Map column 2.1×150 mm, 2.7 Um (Agilent Technologies, USA), excitation at 360 nm, emission at 425 nm, time chromatography 60 min, in a gradient of mobile phase B, viz. a solution of acetonitrile. A derivatization solution (10 μL) was added to the HN solutions (100 μL). The resulting samples were incubated at (65±2) °C for 30 minutes and then analysed. It should be noted that a similar HILIC HPLC technique is used to assess the different content of glycans (sialylated, afucosylated, high mannose, etc.) in various protein molecules, in particular the IgG family – the so-called glycoprofile technique [88]. However, in the case of proteins, this analysis requires lengthy and labor-intensive sample preparation, which can take up to 24 hours, since the first step involves the enzymatical cleavage of sugars from the native antibody followed by the addition of derivatization solution to the resulting glycans and labeling them. In this case, the sample preparation procedure was considerably streamlined by omitting the initial step and focusing solely on preparing the derivatization solution and labeling the HN.
The analysis of the rheoviscosimetric characteristics of HN aqueous solutions was carried out with a Brookfield DV2T RV rotational viscometer (Brookfield Engineering Laboratories, Inc. USA) using a working unit in the form of coaxial cylinders, in CR mode, at shear rates of 190-270 1/s and a constant cell temperature of (25±2) °C.
Dialysis of HN model systems w/wo glycidol was carried out using Spectra/Por cellulose bags (Cole-Parmer, France) with a pore size of 6–8 kDa at a temperature of (15±2) °C for 12 h with constant stirring at 100 ppm. The resulting systems were then placed in 10R format hydrolytic class I glass vials sealed with bromobutyl stoppers and lyophilized using a Harvest Right Benchtop Freeze Dryer (Harvest Right, USA).
The 13C-NMR spectra were recorded on a Bruker DPX-300 NMR spectrometer (Bruker Physic-AG, Germany) at a frequency of 75 MHz, at a temperature of 30 °C in the InverseGate mode, with a delay between pulses according to the 5T1 rule of 60 s. The samples were dissolved in heavy water D2O.
3. Results and Discussion
In the first stage of the study, the effect of pH and temperature on the HNs conformation in aqueous solutions was assessed. For this purpose, DLS and NTA techniques were used.
The DSF method implemented using UNcle was originally intended to study the conformational behavior of proteins by determining their internal/intrinsic fluorescence with changes in temperature or under the action of chaotropes [89]. The change in the degree of protein folding leads to alteration in its fluorescence intensity, allowing for the assessment of the protein macromolecular internal functional groups accessibility to the action of exciting electromagnetic beam. In this way, it is possible to determine the critical temperature at which protein unfolding of up to 50% is achieved. However, polysaccharides, one of which is HN, do not exhibit their own fluorescence. For the study of such objects the DSF method allows labels, special marker substances, which must be chemically bound to the macromolecules being studied, to be used.
The choice of the label for HN in this work was carried out simultaneously with the choice of the method for confirming its conjugation with this polysaccharide. To verify conjugation, the method based on HILIC HPLC was chosen similar to the technique for determining the glycosylation profile, both qualitative and quantitative, of protein molecules by the reductive amination of N-glycans [90,91].
Within the framework of this method, various fluorescent substances can be used as fluorescent labels that establish the glycan profile [92,93,94,95], the most common of which being 2-aminobenzoic acid (2-AA) and 2-aminobenzamide (2-AB). With the only negative charge being present on it, 2-AA is a universal label and can be used to detect both neutral and sialylated glycans by HPLC [95]. Since we were only interested in qualitative confirmation of label binding to the target glycosaminoglycan, 2-AA was chosen for this purpose.
Conjugation of 2-AA to HN was performed using a previously reported amination method [87] in the presence of the reducing agent, sodium cyanoborohydride (NaBH3CN) (Figure 2). Reductive amination proceeds in several steps. First an imine intermediate is formed, which is then reduced to a secondary amine in the presence of NaBH3CN [87,95,96,97]. Notably, this reaction is selective, with a single molecule of 2-AA labeling one terminal N-acetyl-D-glucosamine residue within the polymer chain. The fluorescent labeling was conducted with an excess of the dye.
The process under consideration is carried out in an aqueous environment at an elevated temperature of approximately 65 °C, which, according to [56,98], can stimulate the degradation of the main HN polymer chain. Since the viscosity of their solutions is a characteristic that is sensitively dependent on the molecular weight of polymers, we evaluated its change during the synthesis period (Figure 3). The figure shows that there are no changes in the dynamic viscosity of aqueous HN solutions under the synthesis conditions, so it can be assumed that the degradation of the HN macrochain does not occur under the conditions of conjugation with the label.
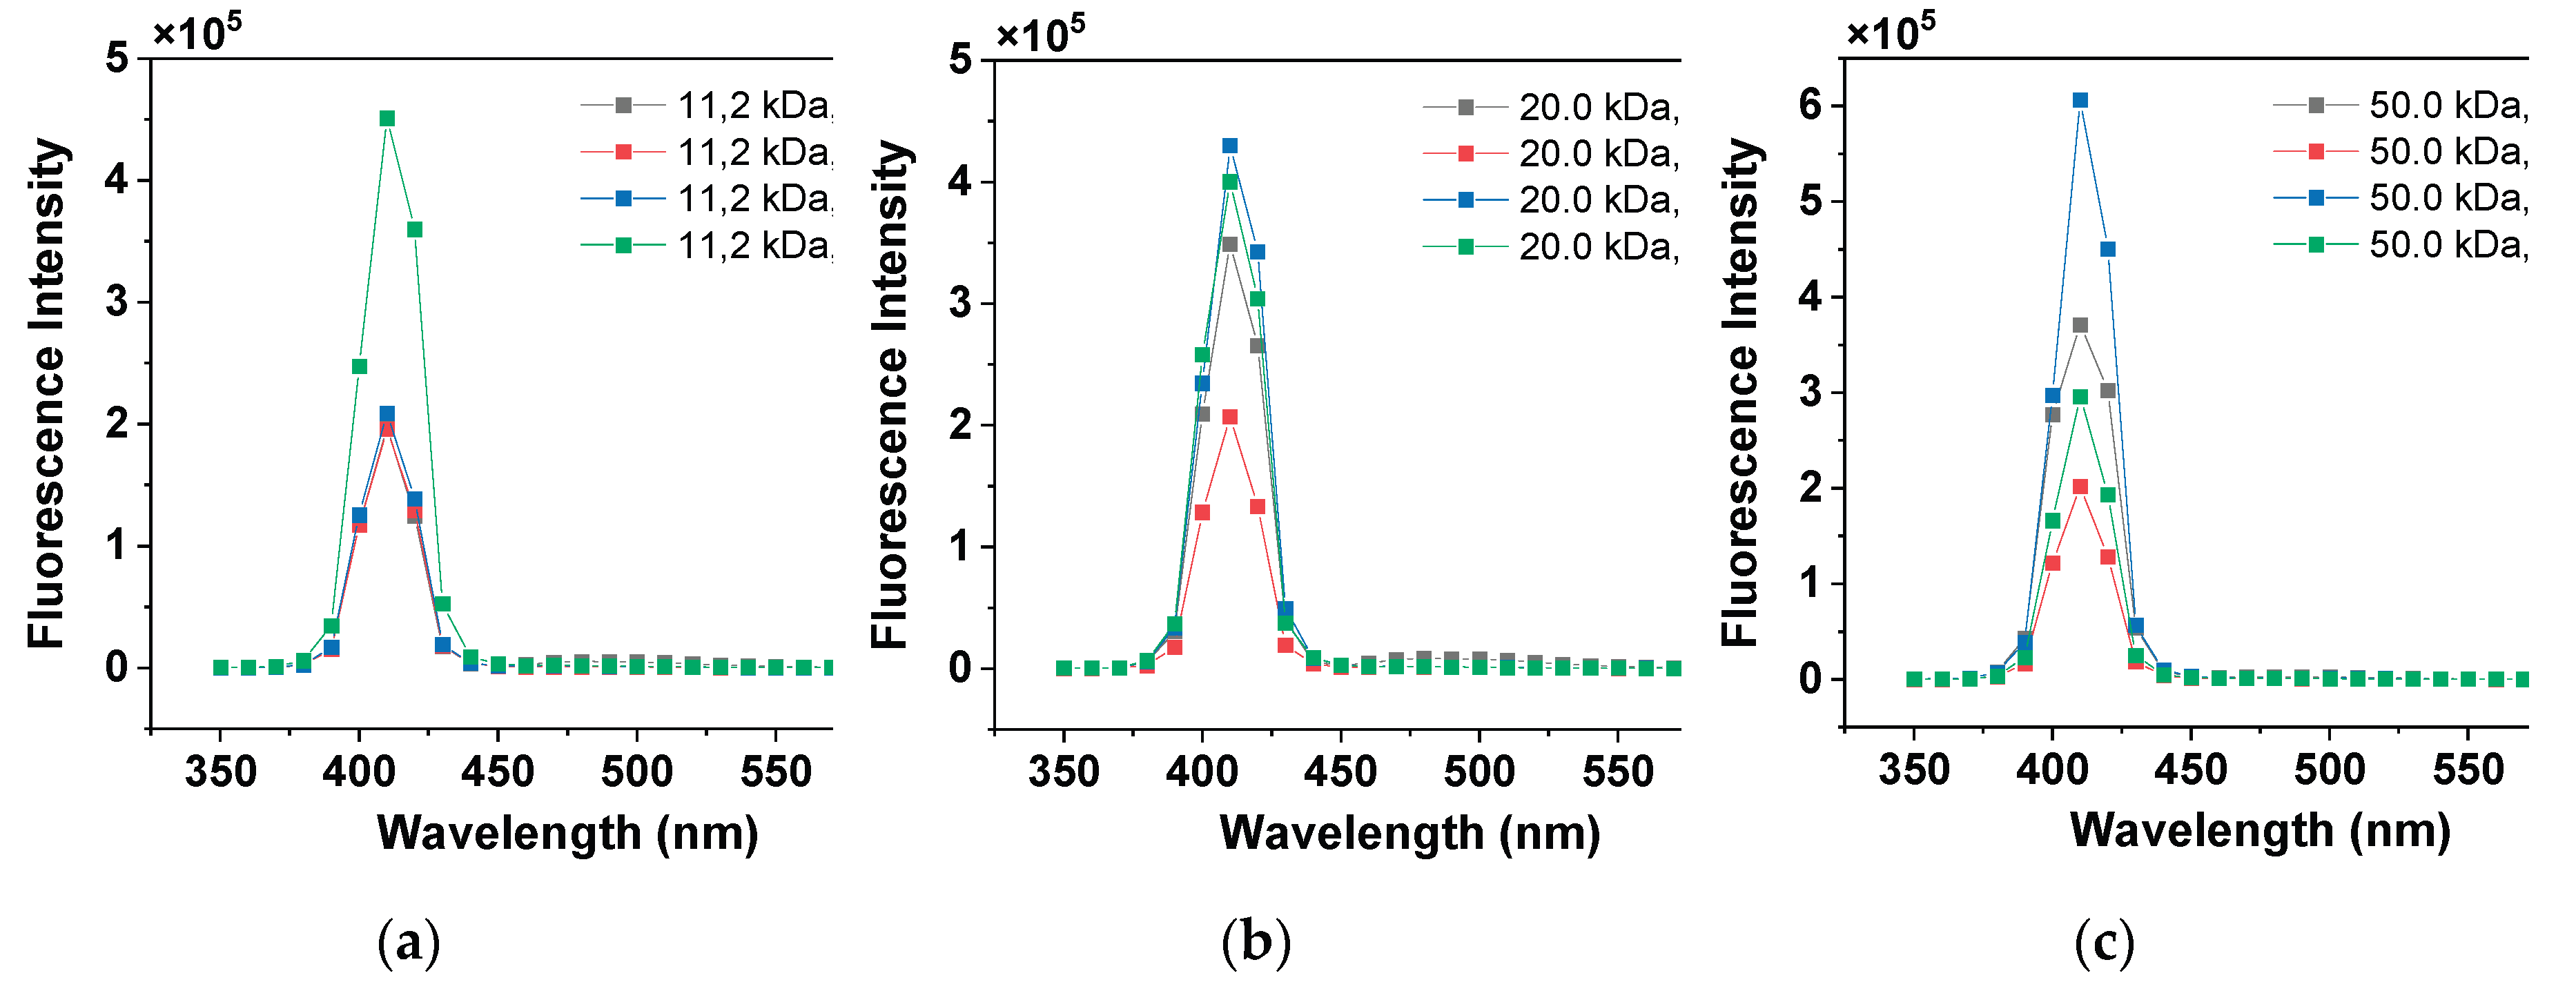
The conjugation of the label with the HN macromolecule was confirmed by HILIC HPLC with fluorescence detector. To determine the optimal detection wavelength, the fluorescence spectra of 2-AA-labeled HNs in aqueous solutions were preliminarily taken (Figure 4). For comparison, Figure 4 shows the spectrum of an aqueous solution for derivatization with a concentration of the label 2-AA of 50 mg/mL.
Figure 4 shows that the conjugation of 2-AA with HNs leads to a hypsochromic shift of the wavelength corresponding to the fluorescence maximum from 430 to 408-410 nm. Obviously, this is due to the appearance of an electron-withdrawing substituent (HN residue) in the structure of 2-AA. This is indirect evidence of the covalent binding of the label to HN. In addition, it was noted that the fluorescence intensity decreases with increasing HN molecular weight, which is quite explainable: the proportion of terminal groups in oligomeric HNs with a lower MM is higher than that in the higher ones. For further experiments using HILIC HPLC, the detection wavelength of 425 nm was used. When determining the fluorescence intensity, according to Figure 4, the influence of noise is less pronounced. It should be noted that the pH of the solution in the range of 4-9 does not affect the position of the fluorescence maximum (Figure A1), so the conjugation of the label with HN can be considered unchanged under these conditions.
Typical chromatograms obtained by HILIC HPLC are shown in Figure 5. The most noticeable signals on it are the high-intensity peak of washing off the unbound fluorescent dye at 2-4 min and the intense peak in the region of 48-50 min associated with washing the column with eluent after the completion of chromatography. However, the most interesting peaks characterizing the HN-2-AA conjugates are located in the region of 6-46 min (inset of Figure 5). When this region is enlarged, three pairs of intense peaks are visible, whose intensity ratios are repeated. In the absence of conjugation of 2-AA with HNs, it would be impossible to observe such signals, i.e., individual 2-AA elutes at 2-4 min. Thus, the conjugation of 2-AA with HN can be considered confirmed. The presence of two closely spaced signals, the most intense in the region under consideration, is likely due to the different hydrophobicity of the N-acetyl-D-glucosamine and D-glucuronic acid fragments that make up the HN macrochain, and the repeated repetition of this pair is due to the molecular weight distribution of HN.
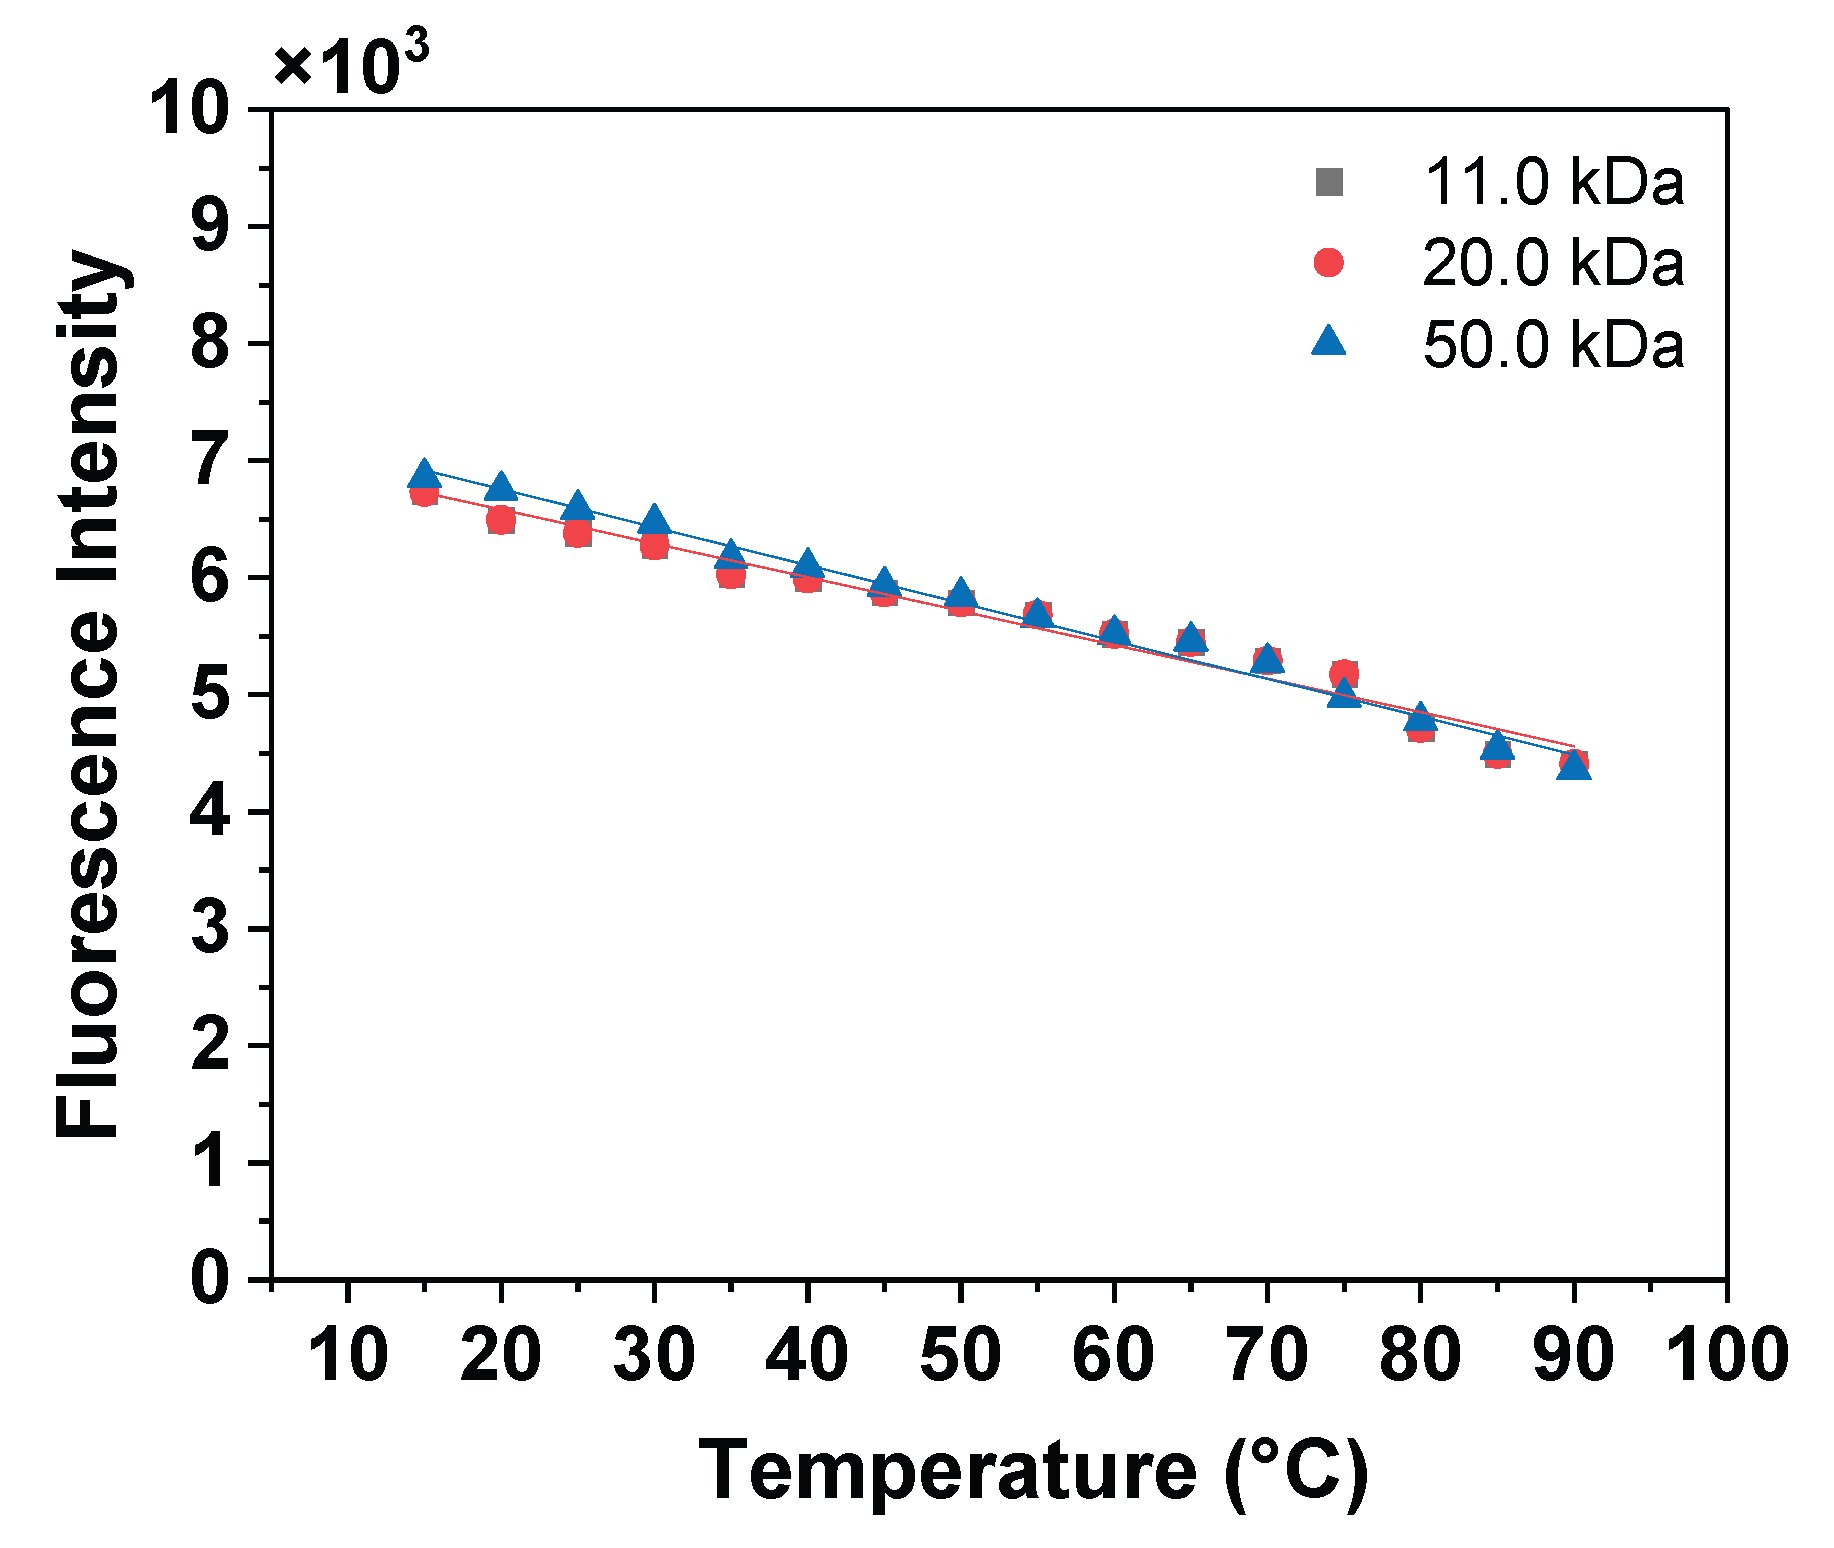
Having obtained 2-AA-labeled oligomeric HNs and confirmed the conjugation of the label to HN, we proceeded to investigate the conformational behavior of these oligomers using DSF. Labeled HNs were studied over a wide range of temperatures, 15-95 °C, and pH values, 4-10; the corresponding dependencies of fluorescence intensity on temperature are shown in Figure 6 and Figure A2. It is worth noting that the label has a hydrophobic nature. Therefore, it is expected that in aqueous media, it will be shielded by the more hydrophilic fragments of the HA macrochains, and the fluorescence intensity will decrease accordingly.
As expected, the fluorescence intensity systematically decreases with increasing temperature, as the acceleration of molecules thermal motion promotes the excited centers deactivation. However, this effect is more pronounced in the neutral-to-alkaline region, i.e., pH 6.5-10.0, whereas it is less significant under acidic conditions, i.e., pH 4.0. Furthermore, a sharp difference in the fluorescence intensity of labeled HA solutions is observed, which is much higher in the neutral-to-alkaline pH range, i.e., from 6.5·103 to 7.0·103, than in the acidic range, i.e., 2·103. Similar results were obtained for all tested oligomeric HN samples in the MW range of 11.2 to 50.0 kDa. Initially, we hypothesized that these changes were associated with the aggregation of HA macromolecules at low pH, which contributes to a decrease in fluorescence due to the formation of a more hydrophobic core of the aggregate. However, according to the results of particle size distribution analysis by NTA (Figure 7 (a)), regardless of the pH of the medium, the hydrodynamic radius of HA particles is in the range of 30 to 350 nm, and their z-average values are 109 ± 3 nm at pH 4.0, 117 ± 3 nm at pH 6.5, and 99 ± 5 nm at pH 13.0. At the same time, a sharp decrease (Figure 7 (b)) in the concentration of HA particles is observed with increasing MM of this polysaccharide from 11.2 to 20 and 50 kDa, which is obviously due to a regular decrease in the number of HN molecules, provided that a constant concentration of the test solution of 1.0 mg/mL is maintained.
A second obvious reason for the significant differences in
fluorescence intensity for HA in the acidic and neutral-to-alkaline pH regions
may be the change in the state of the label carboxyl groups, which undergo a
reversible transformation –COOH⇆–COO– with
changes in pH. In acidic environment, the carboxyl groups are in a more
hydrophobic form –COOH and are shielded by more hydrophilic fragments of HN,
whereas in alkaline form. They transform to the state of an easily dissociating
salt –COO–…Na+, as a result of which the hydrophilicity
of the label fragment noticeably increases. Moreover, the higher the HN MM (Figure 6 and Figure
A2), the lower the fluorescence intensity, that is, the effect is more
pronounced. Such transformations of the terminal group cannot but affect the
spatial conformation of macromolecules. However, this is not reflected in the
NTA results (Figure 7), probably due to
the contribution of the hydration shell of macromolecules to the results.
In the second stage of the work, we evaluated the change in the supramolecular structure of HNs in the presence of curing agent BDDE. For this purpose, BDDE was added to the HN-2-AA conjugates, and the kinetics of changes in fluorescence intensity and average particle size were investigated by DLS at a constant temperature of 60 °C and pH 13.0. It should be noted that under these conditions, as shown in [99,100], a chemical interaction occurs between HN and BDDE (Figure 8), which is presumably due to the reaction of hydroxy [101] and/or carboxyl [102,103] groups of HN with the epoxy groups of BDDE (Figure 8 (a) and (b)). In addition, there is a possibility of concomitant partial deacetylation of HN in an alkaline medium (Figure 8 (c)) similar to the deacetylation of chitosan [103] with the formation of primary amino groups that readily react with the epoxy groups of BDDE.
Experimental results (Figure 9 (a)) indicate that the fluorescence intensity decreases sharply in all cases within 15-35 minutes after the start of the measurements, after which it reaches a constant low value in the range of 3∙103 to 5∙103. In other words, the fluorophore is quenched to a certain constant level during this time. This quenching can be attributed to the processes shown in Figure 8, which result in the formation of HN-BDDE adducts. Initially, we hypothesized that the time tF – its definition is shown by the arrow in Figure 9 (a) – is related to the formation of a BDDE "bridging fragment" between HN macromolecules. Such a flexible "bridge" would allow for more pronounced conformational changes in the adduct and the shielding of the fluorophore. However, the average particle size – the centres of light scattering – remains practically unchanged in this time range (Figure 9 (b)), which leads us to favour another interpretation, i.e., the preferential interaction of HN with BDDE via carboxyl groups, including the –COOH groups of the fluorophore. Considering this last point, we suppose that the reaction of the –COOH groups of the fluorophore with the epoxy groups of BDDE reduces the fluorescence of the indicated fluorophore, which is observed experimentally. Only after the carboxyl groups are consumed does the reaction with the OH groups of HN begins.
On the other hand, at longer synthesis times, i.e., 156-160 min, the average particle size increases sharply. This process may be due to the formation of flexible aliphatic BDDE "bridges" between HA macromolecules, which allow the adducts to form larger particles. Thus, it can be assumed that the time tZ – its definition is shown by the arrow in Figure 9 (b) – is related to the onset of a noticeable reaction between BDDE and HN via the hydroxy groups of the latter.
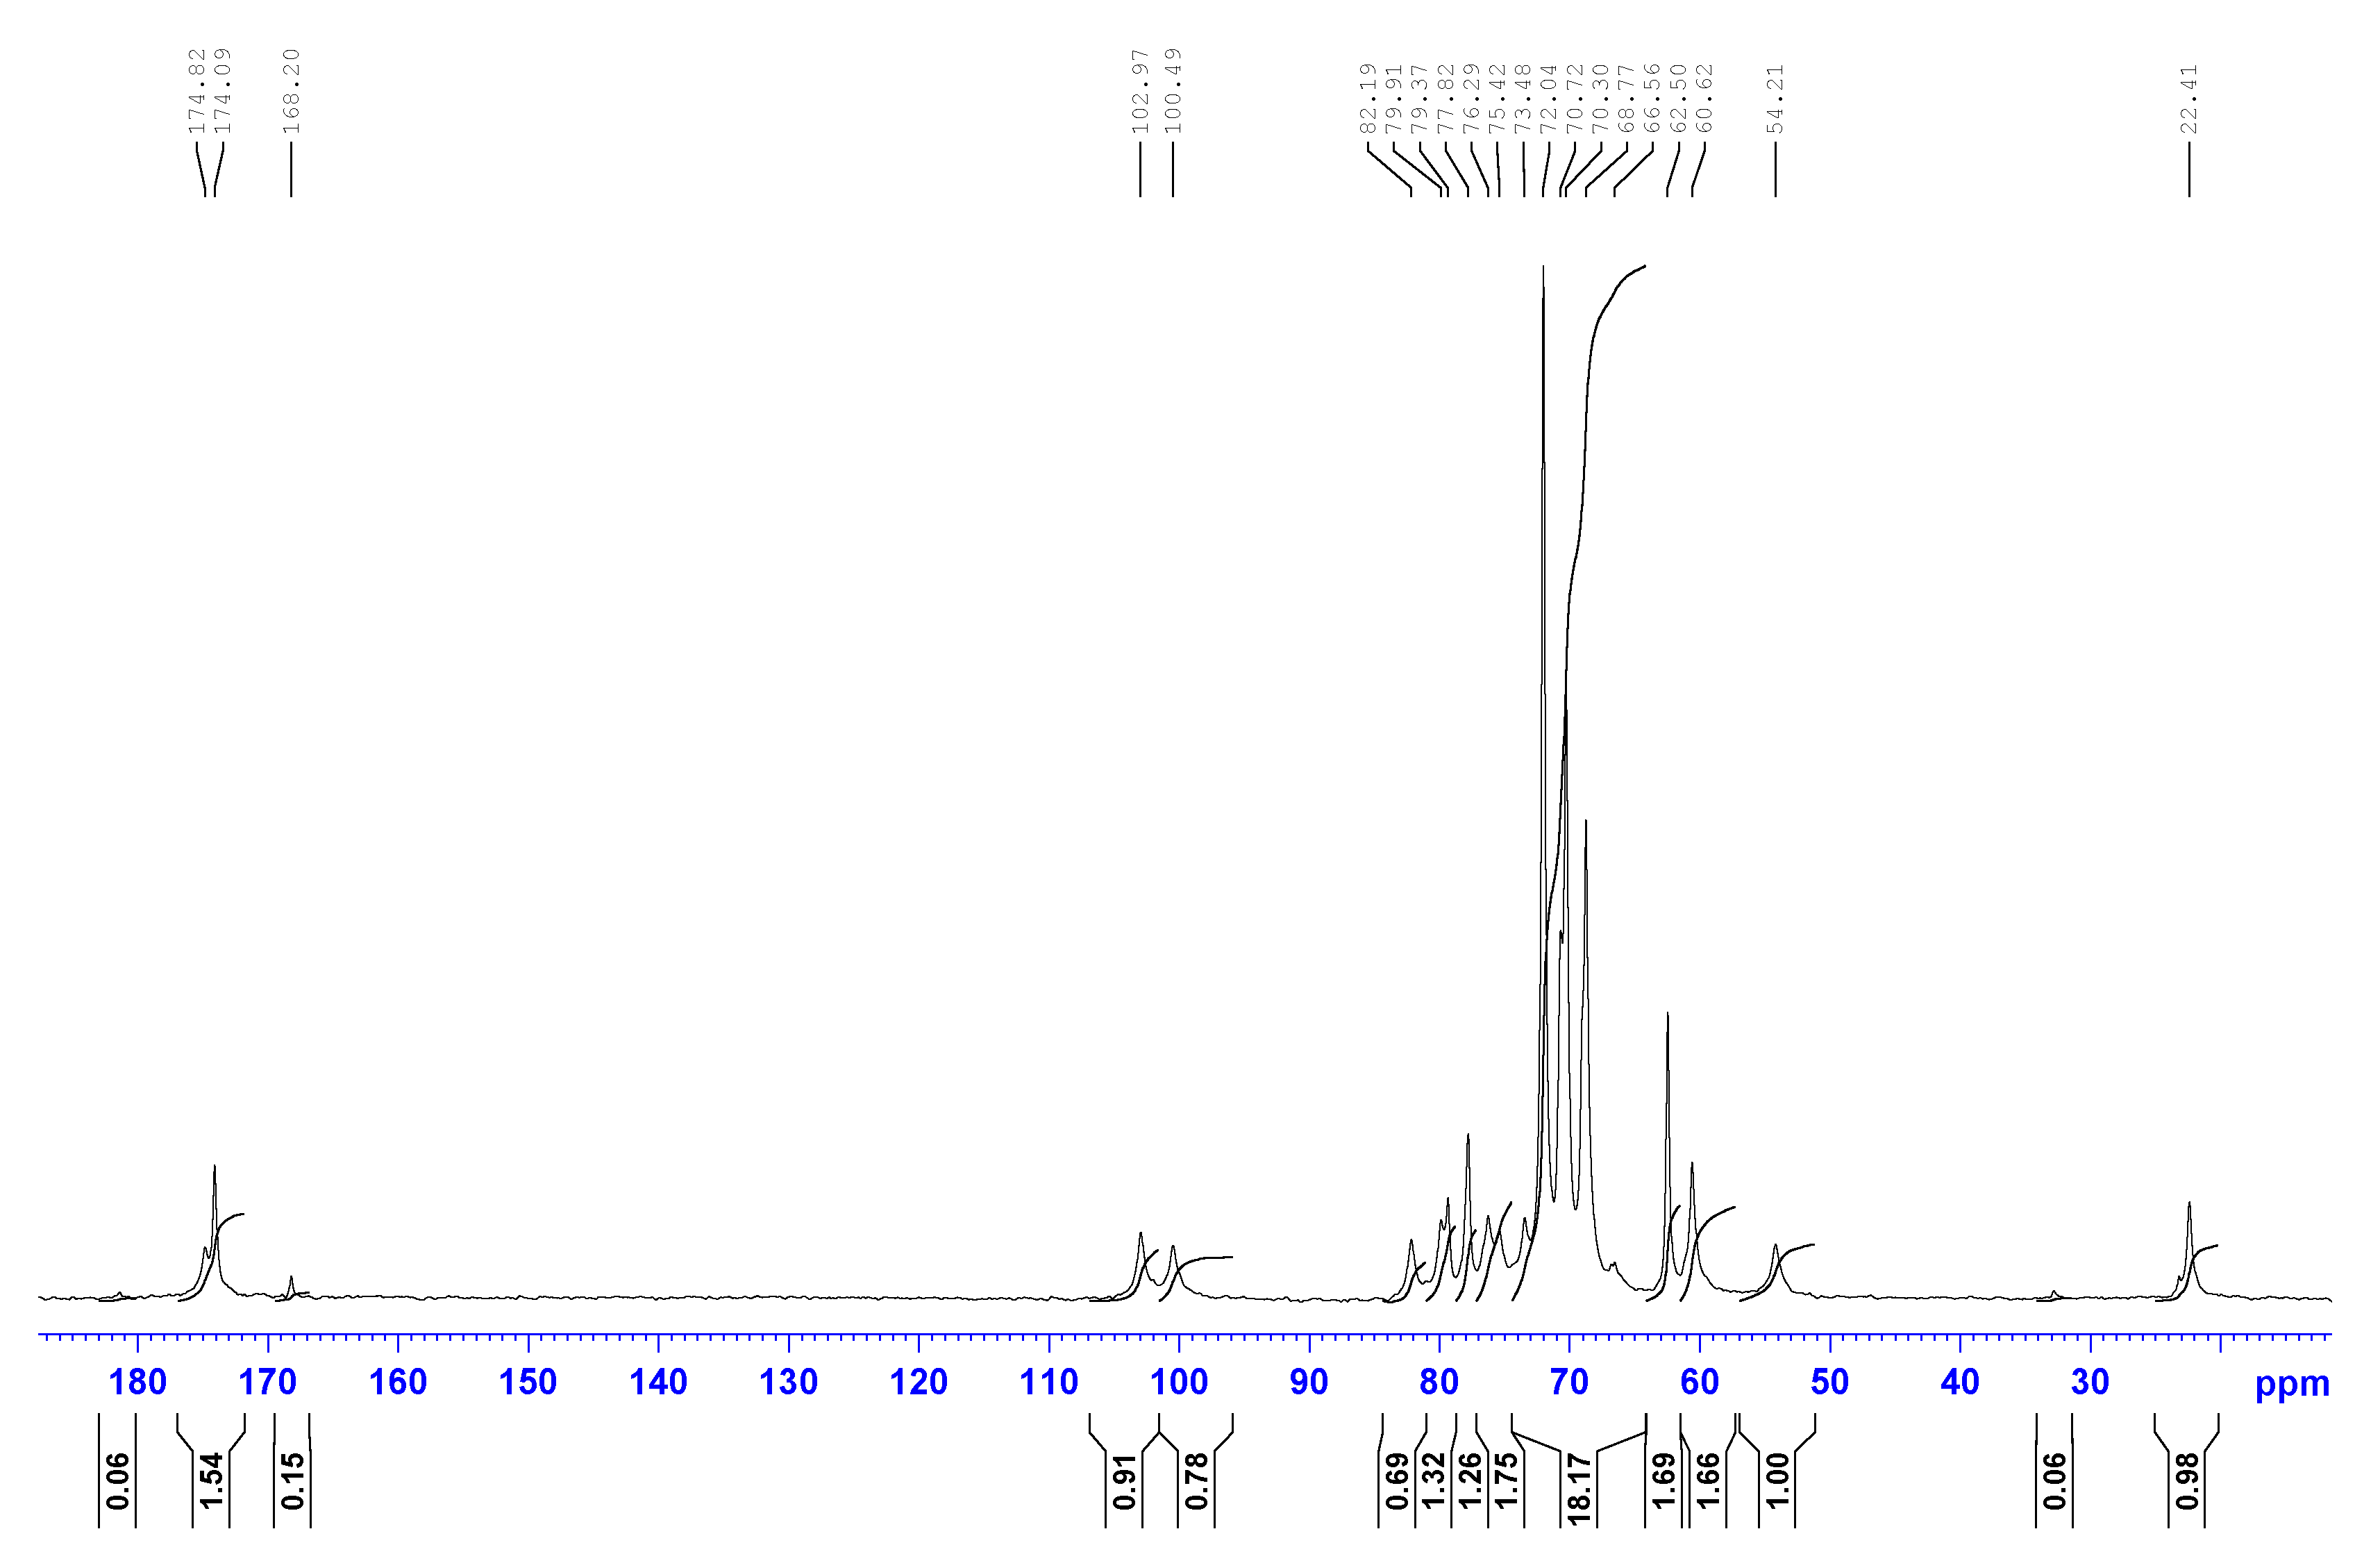
To clarify the possibility of the reaction shown in Figure 8 (c), additional studies were performed on model systems under synthesis conditions using glycidol instead of BDDE. The chemical structure of glycidol is similar to that of BDDE, but glycidol contains only one functional group, and its use does not lead to HN crosslinking. This allows such samples to be studied in the form of solutions, for example, by NMR methods. To purify the glycidol-HN adducts and control systems without glycidol carried out under the same conditions, the samples after the reaction were dialyzed followed by lyophilization, and then dissolved in deuterated water and subjected to 13С NMR spectroscopy in Inverse Gate mode. The resulting spectra are shown in Figure 10 and in Figure A3-A5.
The main peaks appearing in the spectra are signals at 173-176 ppm, which relate to the C=O carbon of the carboxylate and acetamide groups, two peaks of the anomeric carbon of HN at 100-105 ppm, carbon atoms of the saccharide ring at 53-85 ppm, and at 22 ppm the carbon peak of the acetamide group CH3. Of particular interest is the latter peak, changes in which would indicate the occurrence of HN deacetylation (Figure 8 (c)). However, no pronounced changes in the position of this peak or in its relative intensity compared to the integral intensity of the carbonyl peak at 173-176 ppm were noted. This indicates that there is no significant contribution of HN deacetylation to the crosslinking process under alkaline conditions. Thus, the most significant chemical process of the three (Figure 8) can be considered the interaction of the epoxy group with the OH groups of HNs.
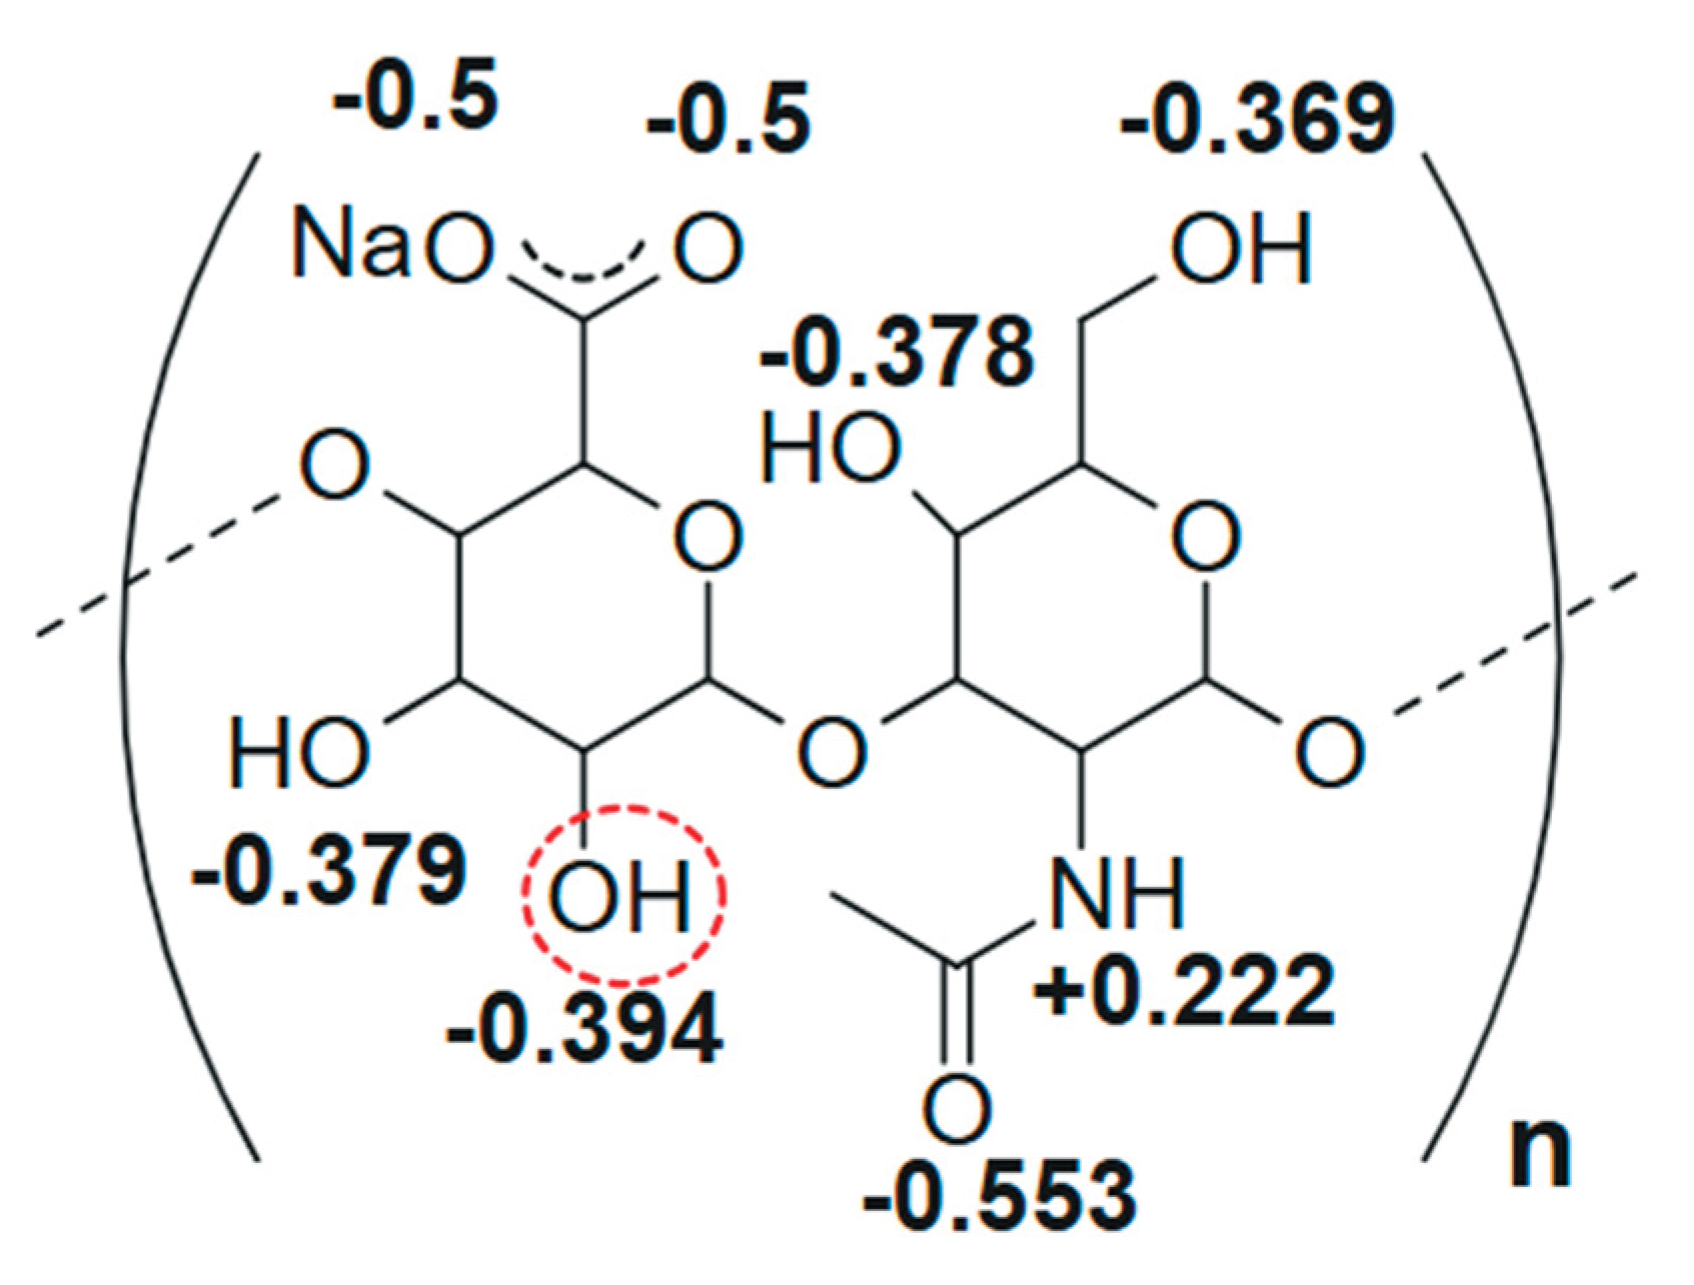
To identify the most reactive –OH group, partial charges on O and N atoms in the sodium hyaluronate molecule were calculated using ChemDraw 16.0 (Figure 11). From these calculations, the hydroxy group with the most electronegative O atom, circled in red, was identified, which is more likely to react with the epoxy group of the crosslinking agent.
4. Conclusions
To sum up, 2-aminobenzoic acid-labeled macromolecules of oligomeric hyaluronans (11.2-50.0 kDa) were synthesized by reductive amination in the presence of sodium cyanoborohydride. The conjugation of the label with hyaluronan was confirmed by fluorescence spectrophotometry and HILIC HPLC with fluorescence detector. It was shown that in aqueous solutions, labeled hyaluronans undergo conformational transformations upon changes in pH, primarily related to the protonation of carboxyl groups in a basic medium. After the addition of a curing agent, i.e., Butane-1,4-diol, the hyaluronans enter into a chemical interaction with it. The results of fluorimetry and DLS methods indicate that at the initial stages there is a chemical interaction of the epoxy groups of the curing agent with the carboxyl groups of hyaluronan. Only then do the hydroxy groups of this polysaccharide enter into the reaction selectively at the 2-position of the polysaccharide ring.
Author Contributions
Conceptualization, E. Zhavoronok and E. Li; methodology, E. Li.; software, E. Li.; validation, E. Zhavoronok., A. Panov and E. Li; formal analysis, E. Zhavoronok; investigation, E. Li.; resources, A. Panov.; data curation, E. Zhavoronok.; writing—original draft preparation, E. Li.; writing—review and editing, S. Kedik; visualization, E. Li.; supervision, E. Zhavoronok.; project administration, S. Kedik; funding acquisition, S. Kedik. All authors have read and agreed to the published version of the manuscript.
Funding
This research received no external funding.
Institutional Review Board Statement
Not applicable.
Data Availability Statement
Data are contained within the article.
Acknowledgments
The authors gratefully acknowledge A. Rodionov, I. Kargapolov, K. Agafonova (JSC GENERIUM) for their assistance with the HILIC HPLC analyses, and N.A. Mironova (MIREA – Russian Technological University) for her expert editorial contributions to the manuscript.
Conflicts of Interest
The authors declare no conflicts of interest.
Abbreviations
The following abbreviations are used in this manuscript:
| HN | Hyaluronan |
| FS | Fluorescence Spectrophotometry |
| HILIC HPLC | Hydrophilic Interaction High-Performance Liquid Chromatography |
| DSF | Differential Scanning Fluorimetry |
| DLS | Dynamic Light Scattering |
| NTA | Nanoparticle Tracking Analysis |
| BDDE | Butane-1,4-diol |
| MM | Molecular Mass |
| NMR | Nuclear Magnetic Resonance |
| 2-AA | 2-aminobenzoic acid |
| NaBH3CN | sodium cyanoborohydride |
| 2-AB | 2-aminobenzamide |
Appendix A
Appendix A.1
Figure A1.
Fluorescence spectra of the HN samples with conjugated label in 2.0 mg/ml aqueous solutions in the pH range from 4.0 to 9.0 with MM of HN is (a) 11.2, (b) 20.0 and (c) 50.0 kDa.
Figure A1.
Fluorescence spectra of the HN samples with conjugated label in 2.0 mg/ml aqueous solutions in the pH range from 4.0 to 9.0 with MM of HN is (a) 11.2, (b) 20.0 and (c) 50.0 kDa.
Appendix A.2
Figure A2.
Typical temperature dependence of fluorescence intensity at the peak maximum for 2.0 mg/ml aqueous solution of HN with MM 11.2, 20.0 and 50.0 kDa at pH 6.5
Figure A2.
Typical temperature dependence of fluorescence intensity at the peak maximum for 2.0 mg/ml aqueous solution of HN with MM 11.2, 20.0 and 50.0 kDa at pH 6.5
Appendix A.3
Figure A3.
13C IG NMR spectra of HN with MM 50 kDa
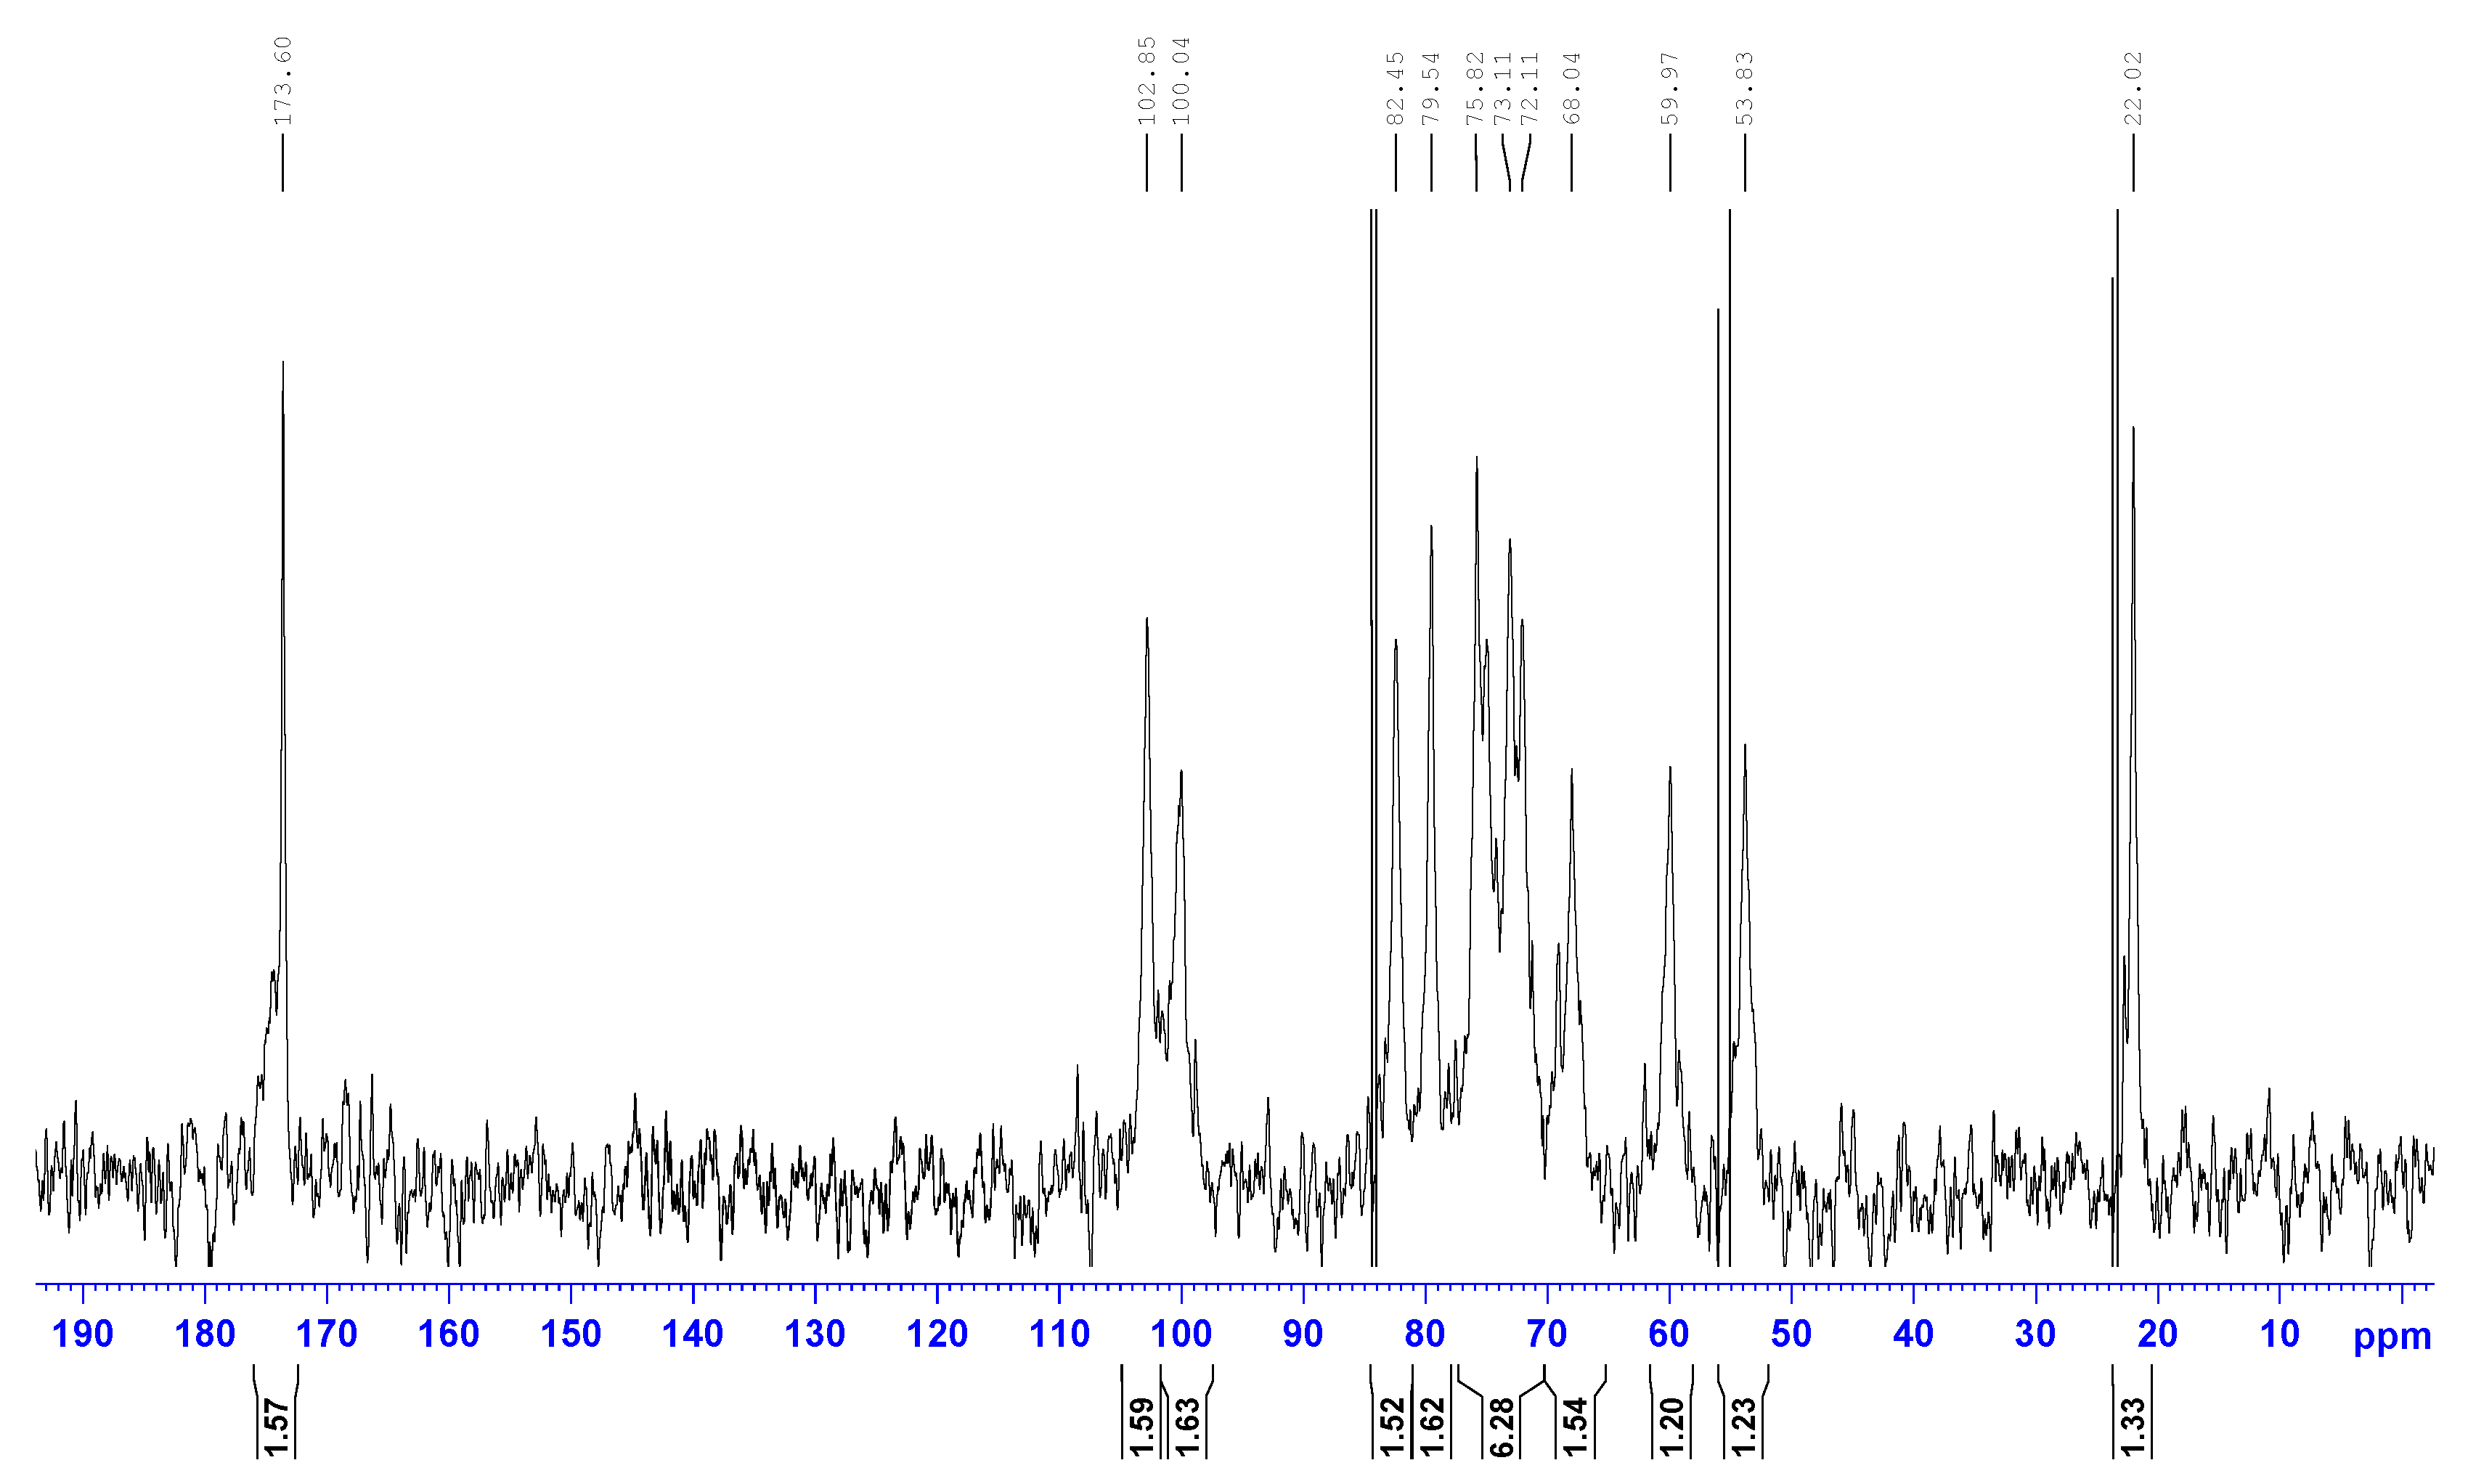
Figure A4.
13C IG NMR spectra of HN with MM 50 kDa maintained under synthesis conditions without glycidol
Figure A4.
13C IG NMR spectra of HN with MM 50 kDa maintained under synthesis conditions without glycidol
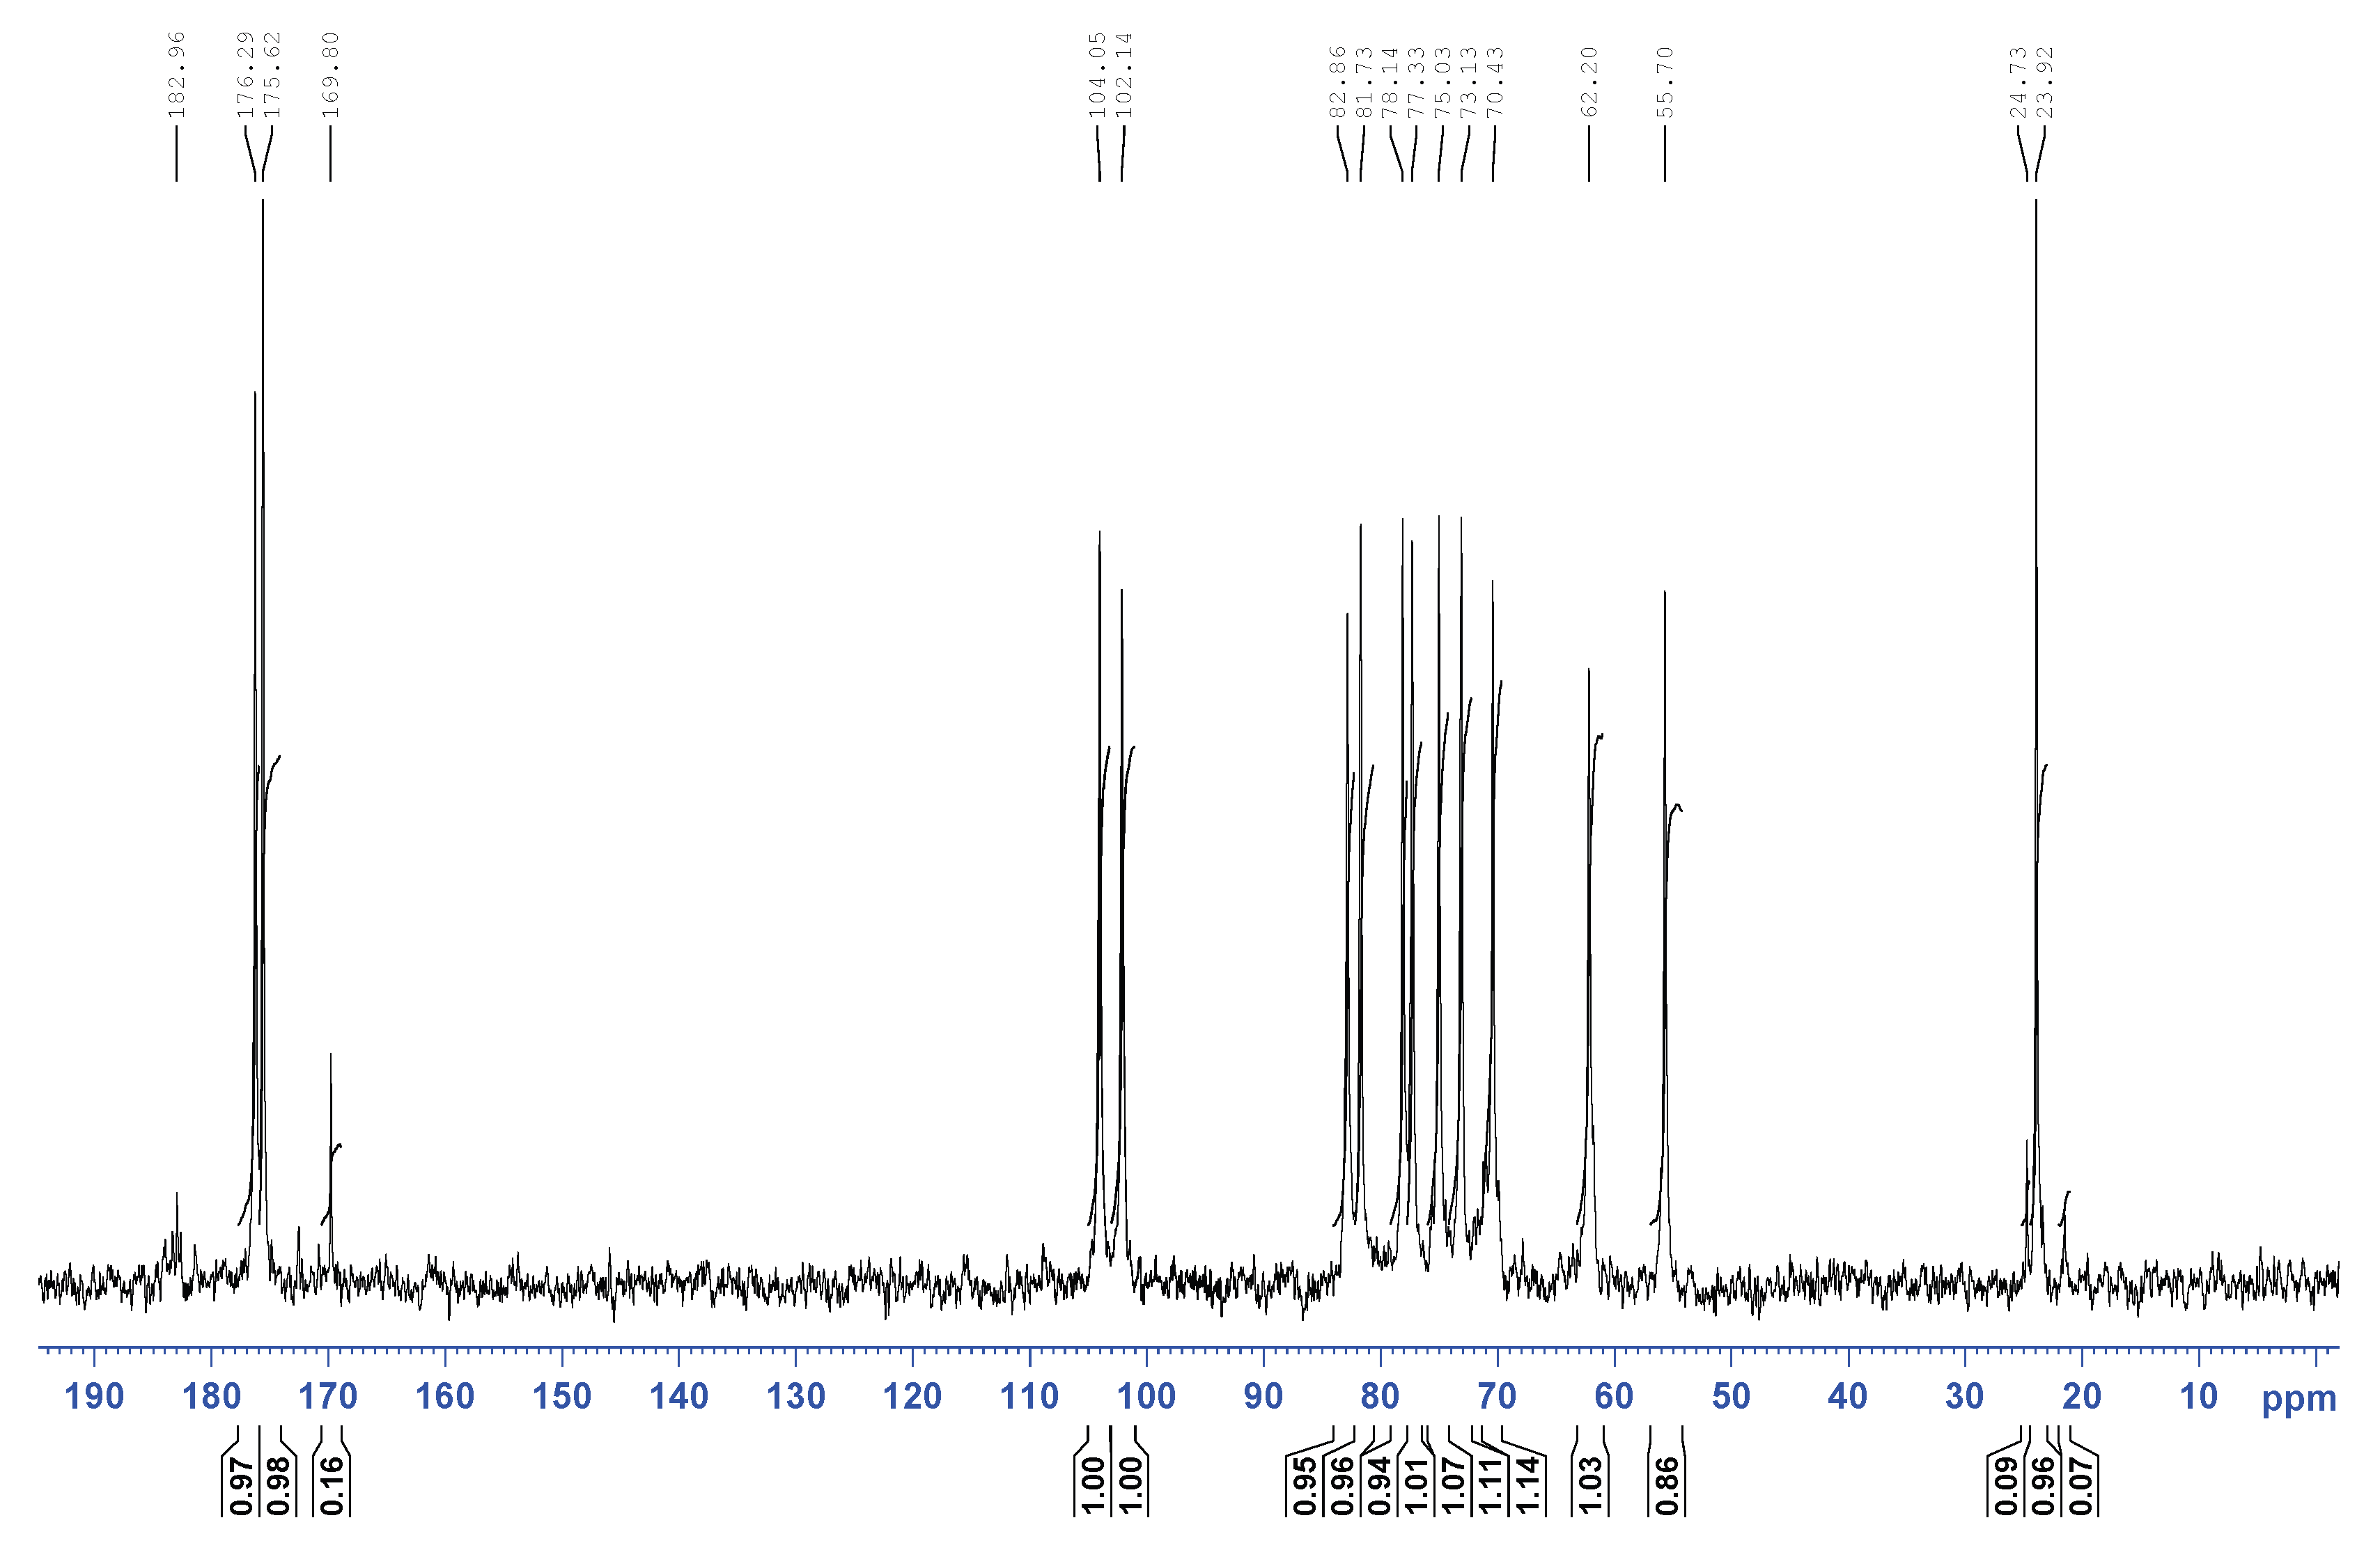
Figure A5.
13C IG NMR spectra of HN with MM 50 kDa maintained under synthesis conditions with glycidol
Figure A5.
13C IG NMR spectra of HN with MM 50 kDa maintained under synthesis conditions with glycidol
References
- Selyanin, M. A., Boykov, P. Y., & Khabarov, V. N. Hyaluronic Acid: Preparation, Properties, Application in Biology and Medicine. Translated by Felix Polyak, 1st ed., Wiley, 2015.
- Hyaluronan: Structure, Biology and Biotechnology; Passi, A., Ed.; Springer: 2023; 220 p.
- Rapport, M.; Weissmann, B.; Linker, A.; Meyer, K. Isolation of a Crystalline Disaccharide, Hyalobiuronic Acid, from Hyaluronic Acid. Nature 1951, 168, 996–997. [Google Scholar] [CrossRef]
- Volpi, N.; Schiller, J.; Stern, R.; Soltés, L. Role, metabolism, chemical modifications and applications of hyaluronan. Curr. Med. Chem. 2009, 16, 1718–1745. [Google Scholar] [CrossRef]
- Hascall, V.C. Hyaluronan, a common thread. Glycoconj. J. 2000, 17, 607–616. [Google Scholar] [CrossRef] [PubMed]
- Hascall, V.C.; Majors, A.K.; De La Motte, C.A.; Evanko, S.P.; Wang, A.; Drazba, J.A.; Strong, S.A.; Wight, T.N. Intracellular hyaluronan: a new frontier for inflammation? Biochim. Biophys. Acta. 2004, 1673, 3–12. [Google Scholar] [CrossRef] [PubMed]
- Kogan, G.; Soltés, L.; Stern, R.; Gemeiner, P. Hyaluronic acid: a natural biopolymer with a broad range of biomedical and industrial applications. Biotechnol. Lett. 2007, 29, 17–25. [Google Scholar] [CrossRef] [PubMed]
- Garg, H. G.; Hales, C. A. Chemistry and Biology of Hyaluronan; Elsevier: Amsterdam, 2004. [Google Scholar]
- Kogan, G.; Soltés, L.; Stern, R.; Mendichi, R. Hyaluronic acid: A biopolymer with versatile physicochemical and biological properties. In Handbook of Polymer Research: Monomers, Oligomers, Polymers and Composites, Pethrick, R.A., Ballada, A., Zaikov, G.E., Eds.; Nova Sci. Publishers: New York, 2007. [Google Scholar]
- Kogan, G.; Soltés, L.; Stern, R.; Schiller, J.; Mendichi, R. Hyaluronic acid: Its function and degradation in in vivo systems. In Studies in Natural Products Chemistry, Atta-ur-Rahman, Ed.; Elsevier B.V.: Amsterdam, The Netherlands, 2008; p. 34. [Google Scholar]
- Laurent, T.C. The Chemistry, Biology and Medical Applications of Hyaluronan and Its Derivatives; Portland Press: London, 1998. [Google Scholar]
- Balazs, E.A. The introduction of elastoviscous hyaluronan for viscosurgery. In Viscoelastic Materials. Basic Science and Clinical Applications, Rosen, E.S., Ed.; Pergamon Press: Oxford, 1989; pp. 167–183. [Google Scholar]
- Balazs, E.A. Viscoelastic Properties of Hyaluronan and its Therapeutic Use. In Chemistry and Biology of Hyaluronan, Garg, H.G., Hales, C.A., Eds.; Elsevier B.V.: Amsterdam, The Netherlands, 2004. [Google Scholar]
- Vercruysse, K.P.; Prestwich, G.D. Hyaluronate derivatives in drug delivery. Crit. Rev. Ther. Drug Carrier. Syst. 1998, 15, 513–555. [Google Scholar] [CrossRef]
- Lapcík, L., Jr.; Lapcík, L.; De Smedt, S.; Demeester, J.; Chabrecek, P. Hyaluronan: Preparation, Structure, Properties, and Applications. Chem. Rev. 1998, 98, 2663–2684. [Google Scholar] [CrossRef]
- Liao, Y.-H.; Jones, S.A.; Forbes, B.; Martin, G.P.; Brown, M.B. Hyaluronan: pharmaceutical characterization and drug delivery. Drug Delivery 2005, 12, 327–342. [Google Scholar] [CrossRef]
- Snetkov, P.; Hyaluronic acid. Encyclopedia. Polymers and Plastics, Biochemistry. Available online: https://encyclopedia.pub/2492 (accessed on 18 February 2021).
- Cowman, M.K. Hyaluronan and hyaluronan fragments. Adv. Carbohydr. Chem. Biochem. 2017, 74, 1–59. [Google Scholar] [CrossRef]
- Snetkov, P.; Zakharova, K.; Morozkina, S.; Olekhnovich, R.; Uspenskaya, M. Hyaluronic Acid: The Influence of Molecular Weight on Structural, Physical, Physico-Chemical, and Degradable Properties of Biopolymer. Polymers 2020, 12, 1800. [Google Scholar] [CrossRef]
- Perez, L.A.; Hernandez, R.; Alonso, J.M.; Perez-Gonzalez, R.; Saez-Martinez, V. Hyaluronic acid hydrogels crosslinked in physiological conditions: synthesis and biomedical applications. Biomedicines 2021, 9, 1113. [Google Scholar] [CrossRef]
- Negas, J.; Bartosikova, L.; Brauner, P.; Kolar, J. Hyaluronic acid (hyaluronan): a review. Veterinarni Medicina 2008, 53, 397–411. [Google Scholar] [CrossRef]
- Brun, P.; Panfilo, S.; Daga, G.D.; Cortivo, R.; Abatangelo, G. The effect of hyaluronan on CD44-mediated survival of normal and hydroxyl radical-damaged chondrocytes. Osteoarthr. Cartil. 2003, 11, 208–216. [Google Scholar] [CrossRef]
- Messmer, E. The pathophysiology, diagnosis, and treatment of dry eye disease. Dtsch. Arztebl. Int. 2015, 112, 71–82. [Google Scholar] [CrossRef] [PubMed]
- Laremore, T.N.; Zhang, F.; Dordick, J.S.; Liu, J.; Linhardt, R.J. Recent progress and applications in glycosaminoglycan and heparin research. Curr. Opin. Chem. Biol. 2009, 13, 633–640. [Google Scholar] [CrossRef]
- Zhang, Z.; Suner, S.S.; Blake, D.A.; Ayyala, R.S.; Sahiner, N. Antimicrobial activity and biocompatibility of slow-release hyaluronic acid-antibiotic conjugated particles. Int. J. Pharm. 2020, 576, 119024. [Google Scholar] [CrossRef]
- Lepidi, S.; Abatangelo, G.; Vindigni, V.; Deriu, G.P.; Zavan, B.; Tonello, C.; Cortivo, R. In vivo regeneration of small-diameter (2 mm) arteries using a polymer scaffold. FASEB J. 2006, 20, 103–105. [Google Scholar] [CrossRef]
- Dennaoui, H.; Chouery, E.; Rammal, H.; Abdel-Razzak, Z.; Harmouch, C. Chitosan/hyaluronic acid multilayer films are biocompatible substrate for Wharton’s jelly derived stem cells. Stem Cell Investig. 2018, 20, 5–47. [Google Scholar] [CrossRef]
- Tezel, A.; Fredrickson, G.H. The science of hyaluronic acid dermal fillers. J. Cosmet. Laser Ther. 2008, 10, 35–42. [Google Scholar] [CrossRef] [PubMed]
- Horn, E.M.; Beaumont, M.; Shu, X.Z.; Harvey, A.; Prestwich, G.D.; Horn, K.M.; Gibson, A.R.; Preul, M.C.; Panitch, A. Influence of cross-linked hyaluronic acid hydrogels on neurite outgrowth and recovery from spinal cord injury. J. Neurosurg. Spine 2007, 6, 133–140. [Google Scholar] [CrossRef]
- Ave, M.N.; de Almeida Issa, M.C. Hyaluronic Acid Dermal Filler: Physical Properties and Its Indications. In Botulinum Toxins, Fillers and Related Substances. Clinical Approaches and Procedures in Cosmetic Dermatology; Issa, M., Tamura, B., Eds.; Springer: Cham, 2018. [Google Scholar]
- Khabarov, V.N.; Ivanov, P.L. Biomedical applications of hyaluronic acid and its chemically modified derivatives. Geotar-Media: Moscow, Russia, 2020.
- Ponedelkina, I.Yu.; Lukina, E.S.; Odinokov, V.N. Acidic glycosaminoglycans and their chemical modification. Russ. J. Bioorg. Chem. 2008, 34, 5–28. [Google Scholar]
- Pouyani, T.; Prestwich, G.D. Functionalized derivatives of hyaluronic acid oligosaccharides: drug carriers and novel biomaterials. Bioconjug. Chem. 1994, 5, 339–347. [Google Scholar] [CrossRef]
- Sahiner, N.; Suner, S.S.; Ayyala, R.S. Mesoporous, degradable hyaluronic acid microparticles for sustainable drug delivery application. Colloids Surf. B Biointerfaces 2019, 177, 284–293. [Google Scholar] [CrossRef] [PubMed]
- Shimojo, A.A.M.; Pires, A.M.B.; Lichy, R.; Rodrigues, A.A.; Santana, M.H.A. The crosslinking degree controls the mechanical, rheological, and swelling properties of hyaluronic acid microparticles. J. Biomed. Mater. Res. A 2015, 103, 730–737. [Google Scholar] [CrossRef] [PubMed]
- Bencherif, S.; Srinivasan, A.; Horkay, F.; Hollinger, J. Influence of the degree of methacrylation on hyaluronic acid hydrogels properties. Biomaterials 2008, 29, 1739–1749. [Google Scholar] [CrossRef]
- Zhao, X. Synthesis and characterization of a novel hyaluronic acid hydrogel. J. Biomater. Sci. Polym. Ed. 2006, 17, 419–433. [Google Scholar] [CrossRef]
- Tomihata, K.; Ikada, Y. Preparation of cross-linked hyaluronic acid films of low water content. Biomaterials 1997, 18, 189–195. [Google Scholar] [CrossRef]
- Yui, N.; Jun, N.; Teruo, O.; Yasuhisa, S. Regulated release of drug microspheres from inflammation responsive degradable matrices of crosslinked hyaluronic acid. J. Control. Release 1993, 25, 133–143. [Google Scholar] [CrossRef]
- Yui, N.; Teruo, O.; Yasuhisa, S. Inflammation responsive degradation of crosslinked hyaluronic acid gels. J. Control. Release 1992, 22, 105–116. [Google Scholar] [CrossRef]
- Xue, Y.; Chen, H.; Xu, C.; Yu, D.; Xu, H.; Hu, Y. Synthesis of hyaluronic acid hydrogels by cross-linking the mixture of high-molecular-weight hyaluronic acid and low-molecular-weight hyaluronic acid with 1,4-butanediol diglycidyl ether. RSC Adv. 2020, 12, 7206–7213. [Google Scholar] [CrossRef]
- Al-Sibani, M.; Al-Harrasi, A.; Neubert, R.H.H. Effect of hyaluronic acid initial concentration on cross-linking efficiency of hyaluronic acid – based hydrogels used in biomedical and cosmetic applications. Pharmazie 2017, 72, 81–86. [Google Scholar] [CrossRef] [PubMed]
- Jeon, O.; Song, S.J.; Lee, K.J.; Park, M.H.; Lee, S.-H.; Hahn, S.K.; Kim, S.; Kim, B.-S. Mechanical properties and degradation behaviors of hyaluronic acid hydrogels cross-linked at various cross-linking densities. Carbohydr. Polym. 2007, 70, 251–257. [Google Scholar] [CrossRef]
- Nakajima, N.; Ikada, Y. Mechanism of amide formation by carbodiimide for bioconjugation in aqueous media. Bioconjug. Chem. 1995, 6, 123–130. [Google Scholar] [CrossRef] [PubMed]
- Sulman, A.M.; Molchanov, V.P.; Balakshina, D.V.; Grebennikova, O.V.; Matveeva, V.G. New nanostructured carriers for cellulase immobilization. Fine Chem. Technol. 2025, 20, 119–136. [Google Scholar] [CrossRef]
- Haxaire, K.; Braccini, I.; Milas, M.; Rinaudo, M.; Perez, S. Conformational behavior of hyaluronan in relation to its physical properties as probed by molecular modeling. Glycobiology 2000, 10, 587–594. [Google Scholar] [CrossRef] [PubMed]
- Morris, E.R.; Rees, D.A.; Welsh, E.J. Conformation and dynamic interactions in hyaluronate solutions. J. Mol. Biol. 1980, 138, 383–400. [Google Scholar] [CrossRef]
- Lakkoji, S.; Santra, S.; Tsurkan, M.V.; Werner, C.; Jana, M.; Sahoo, H. Conformational changes of GDNF-derived peptide induced by heparin, heparan sulfate, and sulfated hyaluronic acid – Analysis by circular dichroism spectroscopy and molecular dynamics simulation. Int. J. Biol. Macromol. 2021, 182, 2144–2150. [Google Scholar] [CrossRef] [PubMed]
- Ellis, S.T.; Nizzolo, S.; Freato, N.; Bertocchi, L.; Bianchini, G.; Yates, E.A.; Guerrini, M. Modeling the Detailed Conformational Effects of the Lactosylation of Hyaluronic Acid. Biomacromolecules 2025, 26, 541–555. [Google Scholar] [CrossRef]
- Huang, X.; Hu, J.; Chen, G.; Liang, Y.; Yan, J.; Koh, C.; Liu, D.; Chen, X.; Zhou, P. Conformational Entropy of Hyaluronic Acid Contributes to Taste Enhancement. Int. J. Biol. Macromol. 2023, 241, 124513. [Google Scholar] [CrossRef]
- Nam, G.; Lee, H.W.; Jang, J.; Kim, C.H.; Kim, K.H. Novel Conformation of Hyaluronic Acid with Improved Cosmetic Efficacy. J. Cosmet. Dermatol. 2023, 22, 1312–1320. [Google Scholar] [CrossRef]
- Tsuji, R.; Ogata, S.; Mochizuki, S. Interaction between CD44 and Highly Condensed Hyaluronic Acid through Crosslinking with Proteins. Bioorg. Chem. 2022, 121, 105666. [Google Scholar] [CrossRef] [PubMed]
- Amandusova, A.K.; Savel’eva, K.R.; Morozov, A.V.; Shelekhova, V.A.; Persanova, L.V.; Polyakov, S.V.; Shestakov, V.N. Physico-Chemical Properties and Methods of Quantitative Determination of Hyaluronic Acid (Review). Drug Dev. Regist. 2020, 9, 136–140. [Google Scholar] [CrossRef]
- Laurent, T.C. Biochemistry of Hyaluronan. Acta Oto-Laryngol. Suppl. 1987, 442, 7–24. [Google Scholar] [CrossRef]
- Scott, J.E.; Cummings, C.; Brass, A.; Chen, Y. Secondary and Tertiary Structures of Hyaluronan in Aqueous Solution, Investigated by Rotary Shadowing-Electron Microscopy and Computer Simulation. Hyaluronan is a Very Efficient Network-Forming Polymer. Biochem. J. 1991, 274, 699–705. [Google Scholar] [CrossRef]
- Nakajima, A.; Shinoda, K. Complex Formation Between Oppositely Charged Polysaccharides. J. Colloid Interface Sci. 1976, 55. [Google Scholar] [CrossRef]
- Guss, J.M.; Hukins, D.W.L.; Smith, P.J.C.; Winter, W.T.; Arnott, S.; Moorhouse, R.; Rees, D.A. Hyaluronic Acid: Molecular Conformations and Interactions in Two Sodium Salts. J. Mol. Biol. 1975, 95, 359–384. [Google Scholar] [CrossRef]
- Winter, W.T.; Smith, P.J.C.; Arnott, S. Hyaluronic Acid: Structure of a Fully Extended 3-Fold Helical Sodium Salt and Comparison with the Less Extended 4-Fold Helical Forms. J. Mol. Biol. 1975, 99, 219–235. [Google Scholar] [CrossRef]
- Winter, W.T.; Arnott, S. Hyaluronic Acid: The Role of Divalent Cations in Conformation and Packing. J. Mol. Biol. 1977, 117, 761–784. [Google Scholar] [CrossRef]
- Sheehan, J.K.; Atkins, E.D.T. X-Ray Fibre Diffraction Study of Conformational Changes in Hyaluronate Induced in the Presence of Sodium, Potassium and Calcium Cations. Int. J. Biol. Macromol. 1983, 5, 215–221. [Google Scholar] [CrossRef]
- Scott, J.E.; Heatley, F.; Hull, W.E. Secondary Structure of Hyaluronate in Solution. A 1H-n.m.r. Investigation at 300 and 500MHz in [2H6]dimethyl Sulphoxide Solution. Biochem. J. 1984, 220, 197–205. [Google Scholar] [CrossRef]
- Dea, I.C.M.; Moorhouse, R.; Rees, D.A.; Arnott, S.; Guss, J.M.; Balazs, E.A. Hyaluronic Acid: A Novel, Double Helical Molecule. Science 1973, 179, 560–562. [Google Scholar] [CrossRef]
- Atkins, E.D.; Sheehan, J.K. Hyaluronates: Relation between Molecular Conformations. Science 1973, 179, 562–564. [Google Scholar] [CrossRef]
- Cowman, M.K.; Cozart, D.; Nakanishi, K.; Balazs, E.A. 1H NMR of Glycosaminoglycans and Hyaluronic Acid Oligosaccharides in Aqueous Solution: The Amide Proton Environment. Arch. Biochem. Biophys. 1984, 230, 203–212. [Google Scholar] [CrossRef]
- Sheehan, J.K.; Gardner, K.H.; Atkins, E.D.T. Hyaluronic Acid: A Double-Helical Structure in the Presence of Potassium at Low pH and Found Also with the Cations Ammonium, Rubidium and Caesium. J. Mol. Biol. 1977, 117, 113–135. [Google Scholar] [CrossRef] [PubMed]
- Arnott, S.; Mitra, A.K.; Raghunathan, S. Hyaluronic Acid Double Helix. J. Mol. Biol. 1983, 169, 861–872. [Google Scholar] [CrossRef] [PubMed]
- Toffanin, R.; Kvam, B.J.; Flaibani, A.; Atzori, M.; Biviano, F.; Paoletti, S. NMR Studies of Oligosaccharides Derived from Hyaluronate: Complete Assignment of 1H and 13C NMR Spectra of Aqueous Di- and Tetra-Saccharides, and Comparison of Chemical Shifts for Oligosaccharides of Increasing Degree of Polymerisation. Carbohydr. Res. 1993, 245, 113–128. [Google Scholar] [CrossRef]
- Cowman, M.K.; Hittner, D.M.; Feder-Davis, J. 13C-NMR Studies of Hyaluronan: Conformational Sensitivity to Varied Environments. Macromolecules 1996, 29, 2894–2902. [Google Scholar] [CrossRef]
- Cowman, M.K.; Feder-Davis, J.; Hittner, D.M. 13CNMR Studies of Hyaluronan. 2. Dependence of Conformational Dynamics on Chain Length and Solvent. Macromolecules 2001, 34, 110–115. [Google Scholar] [CrossRef]
- Liu, G.; Ma, D.; Fang, D. Effects of Solution Properties and Electric Field on the Electrospinning of Hyaluronic Acid. Carbohydr. Polym. 2011, 83, 1011–1015. [Google Scholar] [CrossRef]
- Kim, T.G.; Chung, H.J.; Park, T.G. Macroporous and Nanofibrous Hyaluronic Acid/Collagen Hybrid Scaffold Fabricated by Concurrent Electrospinning and Deposition/Leaching of Salt Particles. Acta Biomater. 2008, 4, 1611–1619. [Google Scholar] [CrossRef]
- Khabarov, V. On the Question of the Concentration of Hyaluronic Acid in Preparations for Biorevitalization. J. Aes. Med. 2015, 14, 3–6. [Google Scholar]
- Terbojevich, M.; Cosani, A.; Palumbo, M. Structural Properties of Hyaluronic Acid in Moderately Concentrated Solutions. Carbohydr. Res. 1986, 149, 363–377. [Google Scholar] [CrossRef]
- Bothner, H.; Wik, O. Rheology of Hialuronate. Acta Oto-Laryngol. Suppl. 1987, 442, 25–30. [Google Scholar] [CrossRef] [PubMed]
- Kapuler, O.; Galeeva, A.; Sel’skaya, B.; Kamilov, F. Hyaluronan: Properties and Biological Role. Vrach 2015, 2, 25–27. [Google Scholar]
- Boeriu, C.G.; Springer, J.; Kooy, F.K.; Van Den Broek, L.A.M.; Eggink, G. Production Methods for Hyaluronan. Int. J. Carbohydr. Chem. 2013, 1–14. [Google Scholar] [CrossRef]
- Khabarov, V.N.; Boikov, P.Y.; Chizhova, N.A.; Selyanin, M.A.; Mikhailova, N.P. Significance of the Molecular Weight Parameter of Hyaluronic Acid in Preparations for Aesthetic Medicine. J. Aes. Med.. 2009, 8, 16–21. [Google Scholar]
- Stern, R.; Asari, A.A.; Sugahara, K.N. Hyaluronan Fragments: An Information-Rich System. Eur. J. Cell Biol. 2006, 85, 699–715. [Google Scholar] [CrossRef]
- Trimm, H.H.; Jennings, B.R. Study of Hyaluronic Acid Flexibility by Electric Birefringence. Biochem. J. 1983, 213, 671–677. [Google Scholar] [CrossRef]
- Gargiulo, V.; Morando, M.A.; Silipo, A.; Nurisso, A.; Pérez, S.; Imberty, A.; Cañada, F.J.; Parrilli, M.; Jiménez-Barbero, J.; De Castro, C. Insights on the Conformational Properties of Hyaluronic Acid by Using NMR Residual Dipolar Couplings and MD Simulations. Glycobiology 2010, 20, 1208–1216. [Google Scholar] [CrossRef]
- Guvench, O. Atomic-Resolution Experimental Structural Biology and Molecular Dynamics Simulations of Hyaluronan and Its Complexes. Molecules 2022, 27. [Google Scholar] [CrossRef]
- Bu, C.; Jin, L. NMR Characterization of the Interactions Between Glycosaminoglycans and Proteins. Front. Mol. Biosci. 2021, 8, 646808. [Google Scholar] [CrossRef] [PubMed]
- Cowman, M.K.; Spagnoli, C.; Kudasheva, D.; Li, M.; Dyal, A.; Kanai, S.; Balazs, E.A. Extended, Relaxed, and Condensed Conformations of Hyaluronan Observed by Atomic Force Microscopy. Biophys. J. 2005, 88, 590–602. [Google Scholar] [CrossRef]
- Spagnoli, C.; Korniakov, A.; Ulman, A.; Balazs, E.A.; Lyubchenko, Y.L.; Cowman, M.K. Hyaluronan Conformations on Surfaces: Effect of Surface Charge and Hydrophobicity. Carbohydr. Res. 2005, 340, 929–941. [Google Scholar] [CrossRef] [PubMed]
- Chang DP, Abu-Lail NI, Guilak F, Jay GD, Zauscher S. Conformational Mechanics, Adsorption, and Normal Force Interactions of Lubricin and Hyaluronic Acid on Model Surfaces. Langmuir 2008, 24 (4), 1183–1193. [CrossRef]
- Taweechat, P.; Pandey, R.B.; Sompornpisut, P. Conformation, Flexibility and Hydration of Hyaluronic Acid by Molecular Dynamics Simulations. Carbohydr. Res. 2020, 493, 108026. [Google Scholar] [CrossRef]
- Zhu, Y.; Liu, X.; Zhang, Y.; Wang, Z.; Lasanajak, Y.; Song, X. Anthranilic Acid as a Versatile Fluorescent Tag and Linker for Functional Glycomics. Bioconjug. Chem. 2018, 29, 2894–2902. [Google Scholar] [CrossRef]
- Tengattini, S.; Massolini, G.; Rinaldi, F.; Calleri, E.; Temporini, C. Hydrophilic Interaction Liquid Chromatography (HILIC) for the Analysis of Intact Proteins and Glycoproteins. TrAC Trends Anal. Chem. 2024, 174, 117702. [Google Scholar] [CrossRef]
- Differential Scanning Fluorimetry. UNchained LABs. Available online: https://www.unchainedlabs.com/differential-scanning-fluorimetry/ (accessed on 17 June 2025).
- Thaysen-Andersen, M. Analysis of Protein Glycosylation Using HILIC. Merck Sequant Technical Summary, 2010, 1-4.
- Kozlik, P.; Goldman, R.; Sanda, M. Hydrophilic Interaction Liquid Chromatography in the Separation of Glycopeptides and Their Isomers. Anal. Bioanal. Chem. 2018, 410, 5001–5008. [Google Scholar] [CrossRef] [PubMed]
- Jiang, K.; Zhu, H.; Xiao, C.; Liu, D.; Edmunds, G.; Wen, L.; Ma, C.; Li, J.; Wang, P.G. Solid-Phase Reductive Amination for Glycomic Analysis. Anal. Chim. Acta 2017, 962, 32–40. [Google Scholar] [CrossRef]
- Morelle, W.; Michalski, J.-C. Analysis of Protein Glycosylation by Mass Spectrometry. Nat. Protoc. 2007, 2, 1585–1602. [Google Scholar] [CrossRef]
- Broberg, A. High-Performance Liquid Chromatography/Electrospray Ionization Ion-Trap Mass Spectrometry for Analysis of Oligosaccharides Derivatized by Reductive Amination and N, N-Dimethylation. Carbohydr. Res. 2007, 342, 1462–1469. [Google Scholar] [CrossRef]
- Ruhaak, L.; Zauner, G.; Huhn, C.; Bruggink, C.; Deelder, A.; Wuhrer, M. Glycan Labeling Strategies and Their Use in Identification and Quantification. Anal. Bioanal. Chem. 2010, 397, 3457–3481. [Google Scholar] [CrossRef]
- Hemström, P.; Irgum, K. Hydrophilic Interaction Chromatography. J. Sep. Sci. 2006, 29(12), 1784–1821. [Google Scholar] [CrossRef]
- Whitmore, E.K.; Martin, D.; Guvench, O. Constructing 3-Dimensional Atomic-Resolution Models of Nonsulfated Glycosaminoglycans with Arbitrary Lengths Using Conformations from Molecular Dynamics. Int. J. Mol. Sci. 2020, 21. [Google Scholar] [CrossRef]
- Simulescu, V.; Kalina, M.; Mondek, J.; Pekar, M. Long-Term Degradation Study of Hyaluronic Acid in Aqueous Solutions Without Protection Against Microorganisms. Carbohydr. Polym. 2016, 137, 664–668. [Google Scholar] [CrossRef] [PubMed]
- La Gatta, A. , Salzillo, R., Catalano, C., Pirozzi, A. V. A., D’Agostino, A., Bedini, E., Cammarota, M., De Rosa, M., & Schiraldi, C. Hyaluronan-Based Hydrogels via Ether-Crosslinking: Is HA Molecular Weight an Effective Means to Tune Gel Performance? Int. J. Biol. Macromol. 2020, 144, 94–101. [Google Scholar] [CrossRef]
- Peng, F.; Wang, A.; Wang, F. A Facile Crosslinked Hyaluronic Acid Hydrogel Strategy: Elution Conditions Adjustment. Chem. Select. 2025, 10. [Google Scholar] [CrossRef]
- Kenne, L.; Gohil, S.; Nilsson, E.M.; Karlsson, A.; Ericsson, D.; Helander Kenne, A.; Nord, L.I. Modification and Cross-Linking Parameters in Hyaluronic Acid Hydrogels—Definitions and Analytical Methods. Carbohydr. Polym. 2013, 91, 410–418. [Google Scholar] [CrossRef] [PubMed]
- Khunmanee, S.; Jeong, Y.; Park, H. Crosslinking Method of Hyaluronic-Based Hydrogel for Biomedical Applications. J. Tissue Eng. 2017, 8, 1–13. [Google Scholar] [CrossRef] [PubMed]
- Sapuła, P.; Bialik-Wąs, K.; Malarz, K. Are Natural Compounds a Promising Alternative to Synthetic Cross-Linking Agents in the Preparation of Hydrogels? Pharmaceutics 2023, 15. [Google Scholar] [CrossRef]
Figure 2.
Scheme of HN and fluorescent label 2-AA conjugation.
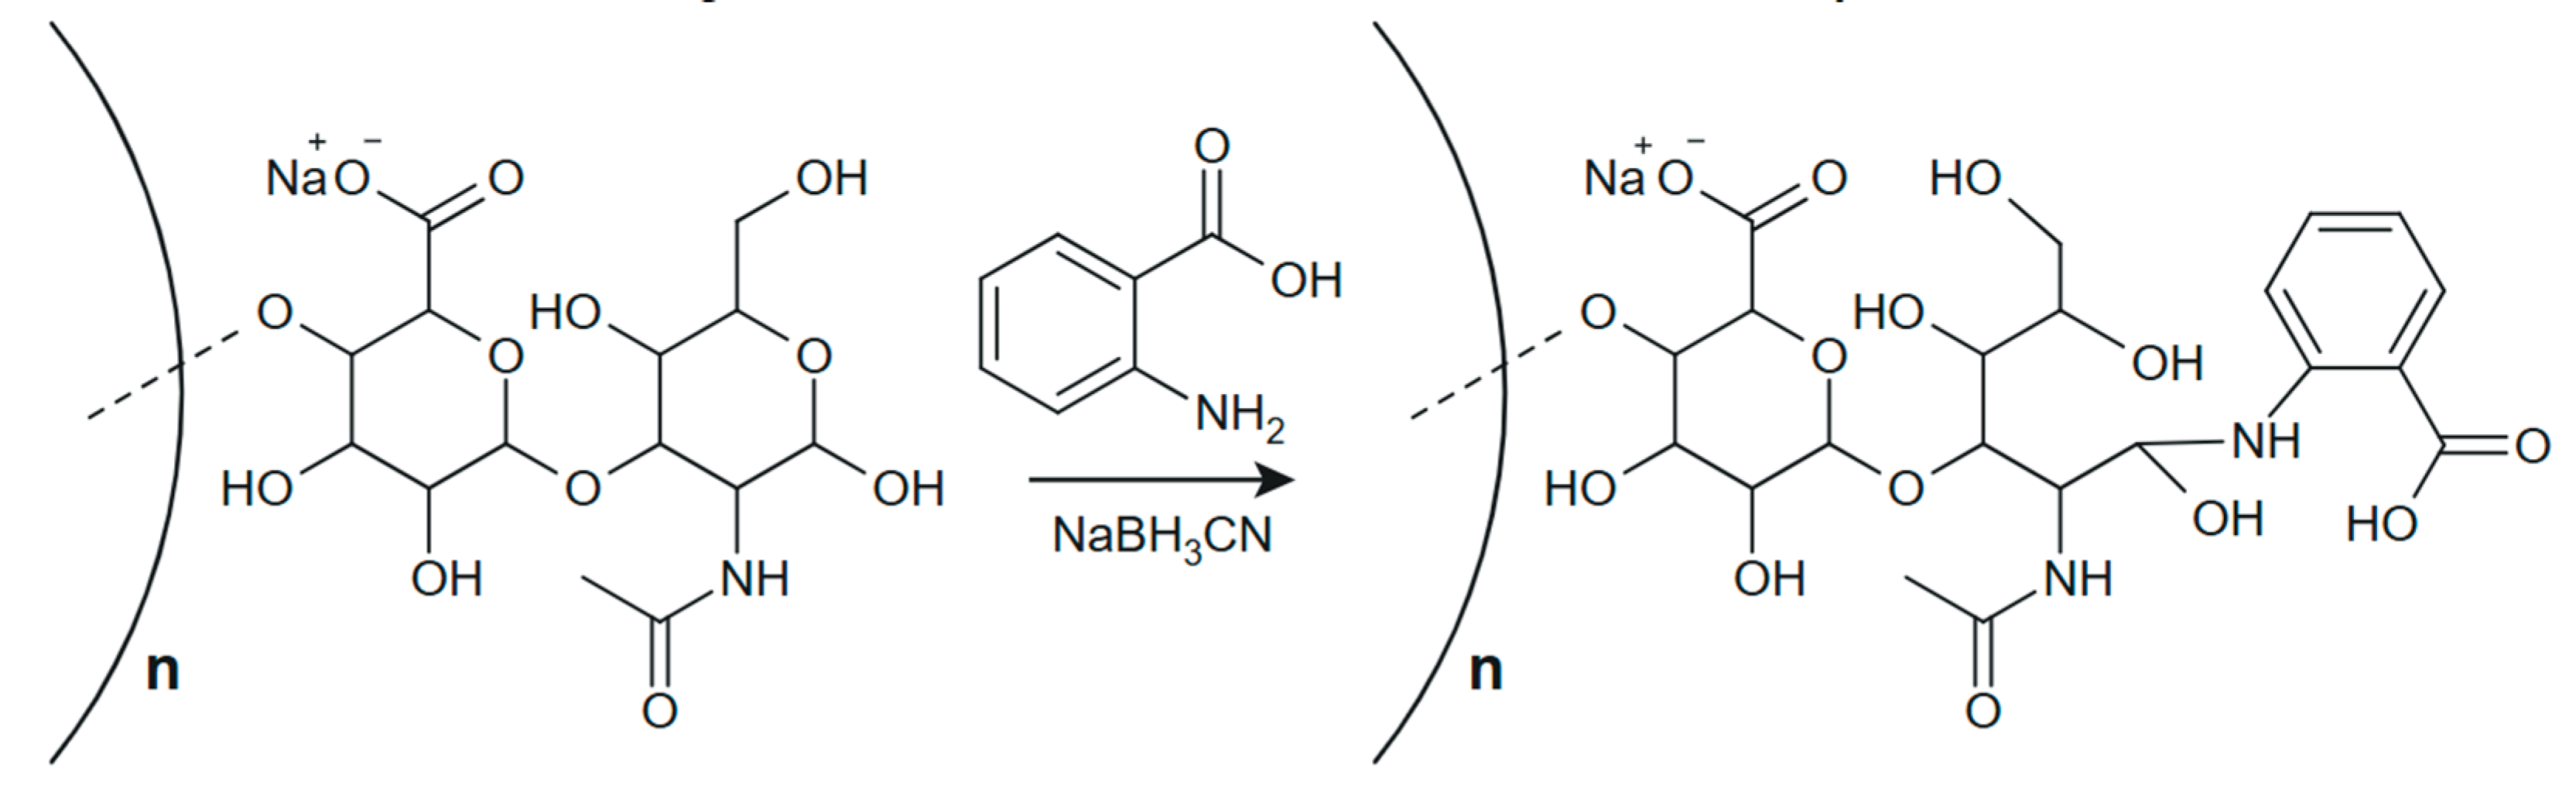
Figure 3.
Typical viscosity-velocity curves of aqueous solutions of HN using the example of 1.0 mg/ml HN solution with MM 50.0 kDa measured at (25±2) °C: (1) – control sample before incubation, (2) – test sample after incubation at (65±2) °C for 2 hours.
Figure 3.
Typical viscosity-velocity curves of aqueous solutions of HN using the example of 1.0 mg/ml HN solution with MM 50.0 kDa measured at (25±2) °C: (1) – control sample before incubation, (2) – test sample after incubation at (65±2) °C for 2 hours.
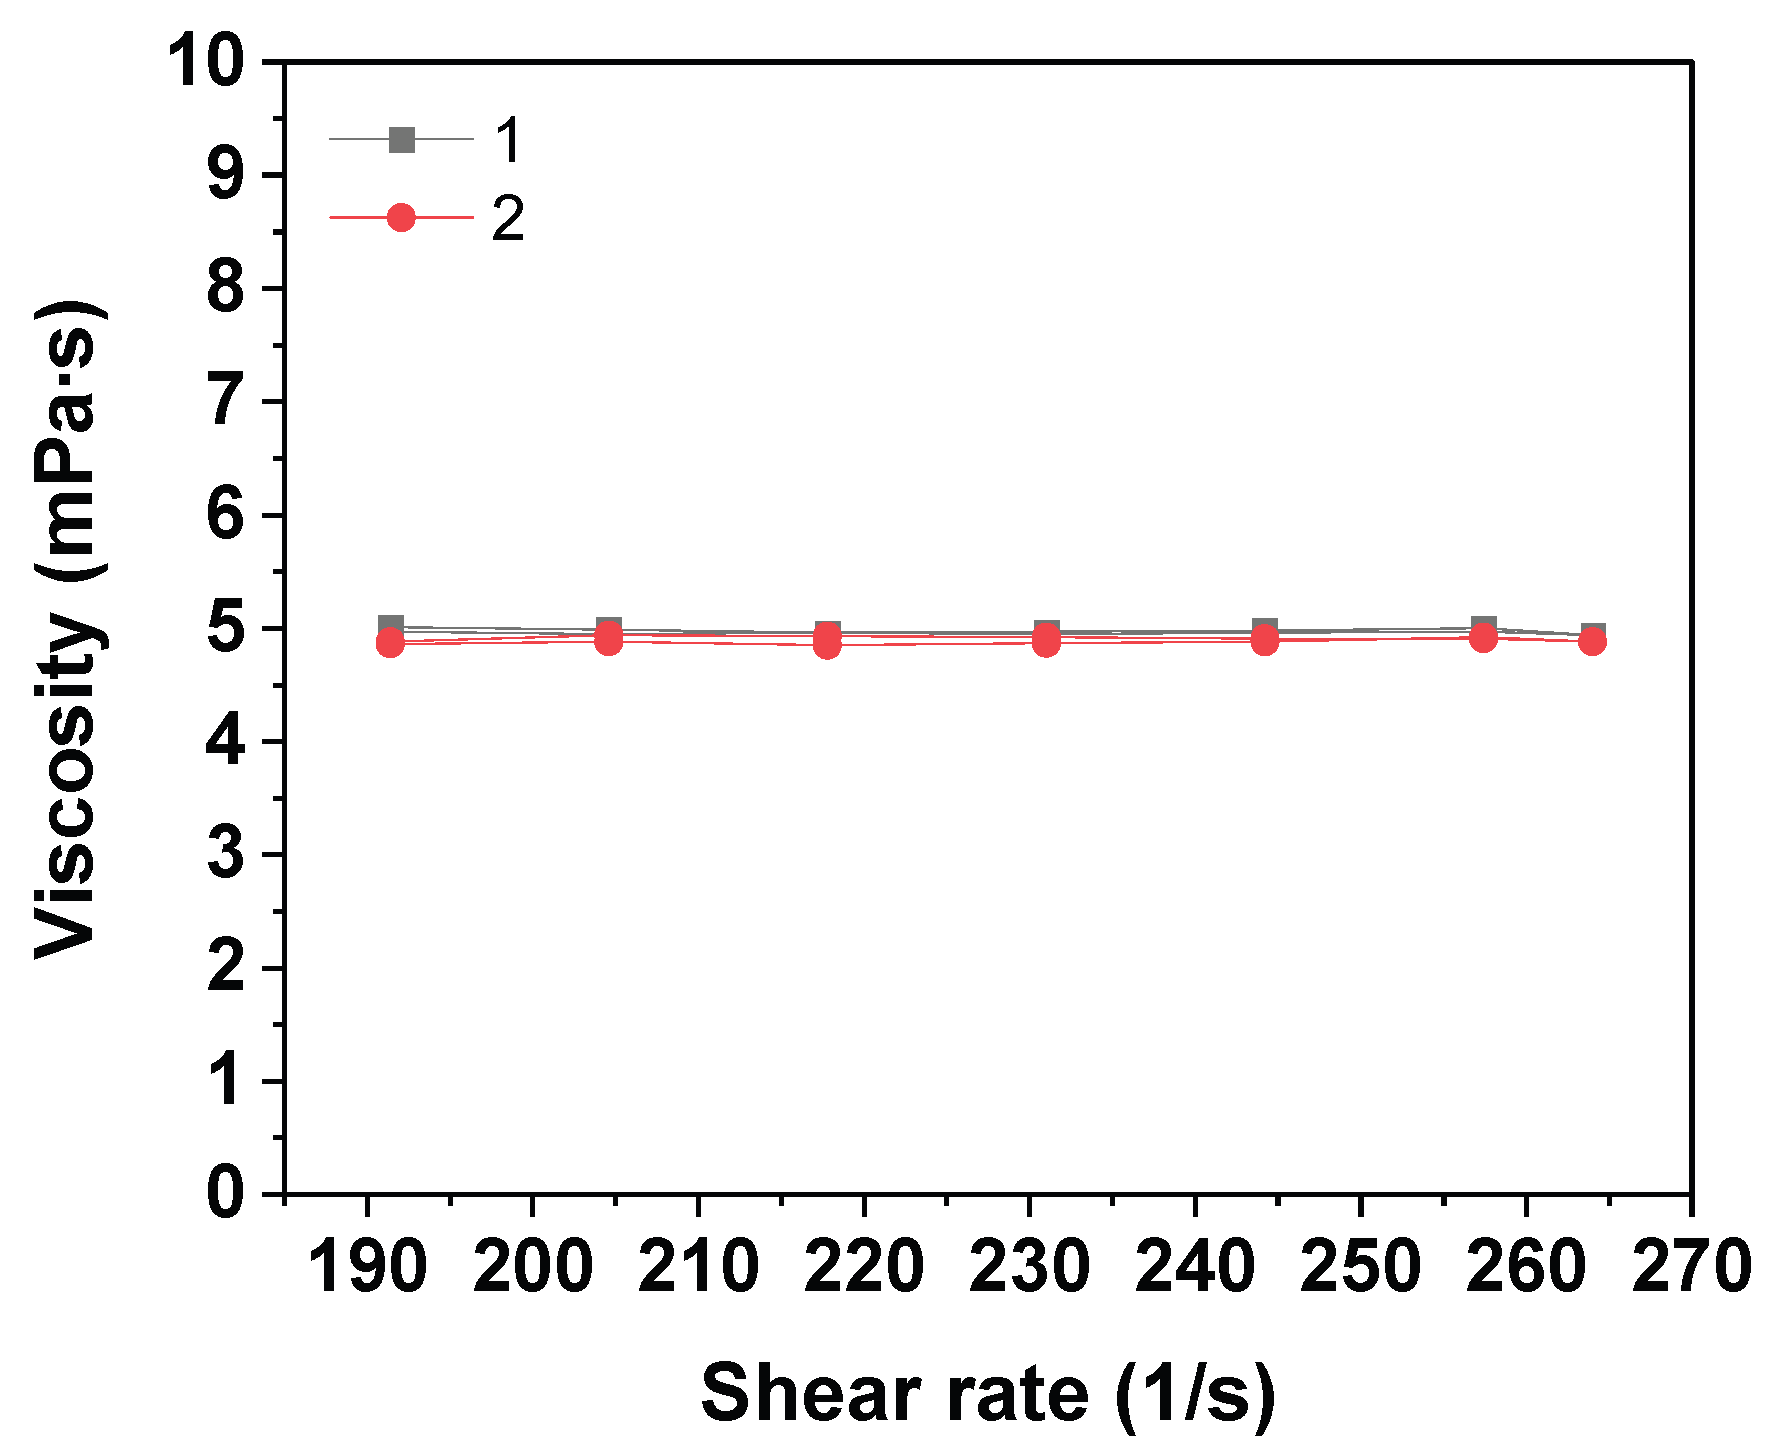
Figure 4.
Fluorescence spectra of the HN samples with conjugated label in 2.0 mg/ml aqueous solutions; MM of HN is (1) 11.2, (2) 20.0 and (3) 50.0 kDa.
Figure 4.
Fluorescence spectra of the HN samples with conjugated label in 2.0 mg/ml aqueous solutions; MM of HN is (1) 11.2, (2) 20.0 and (3) 50.0 kDa.
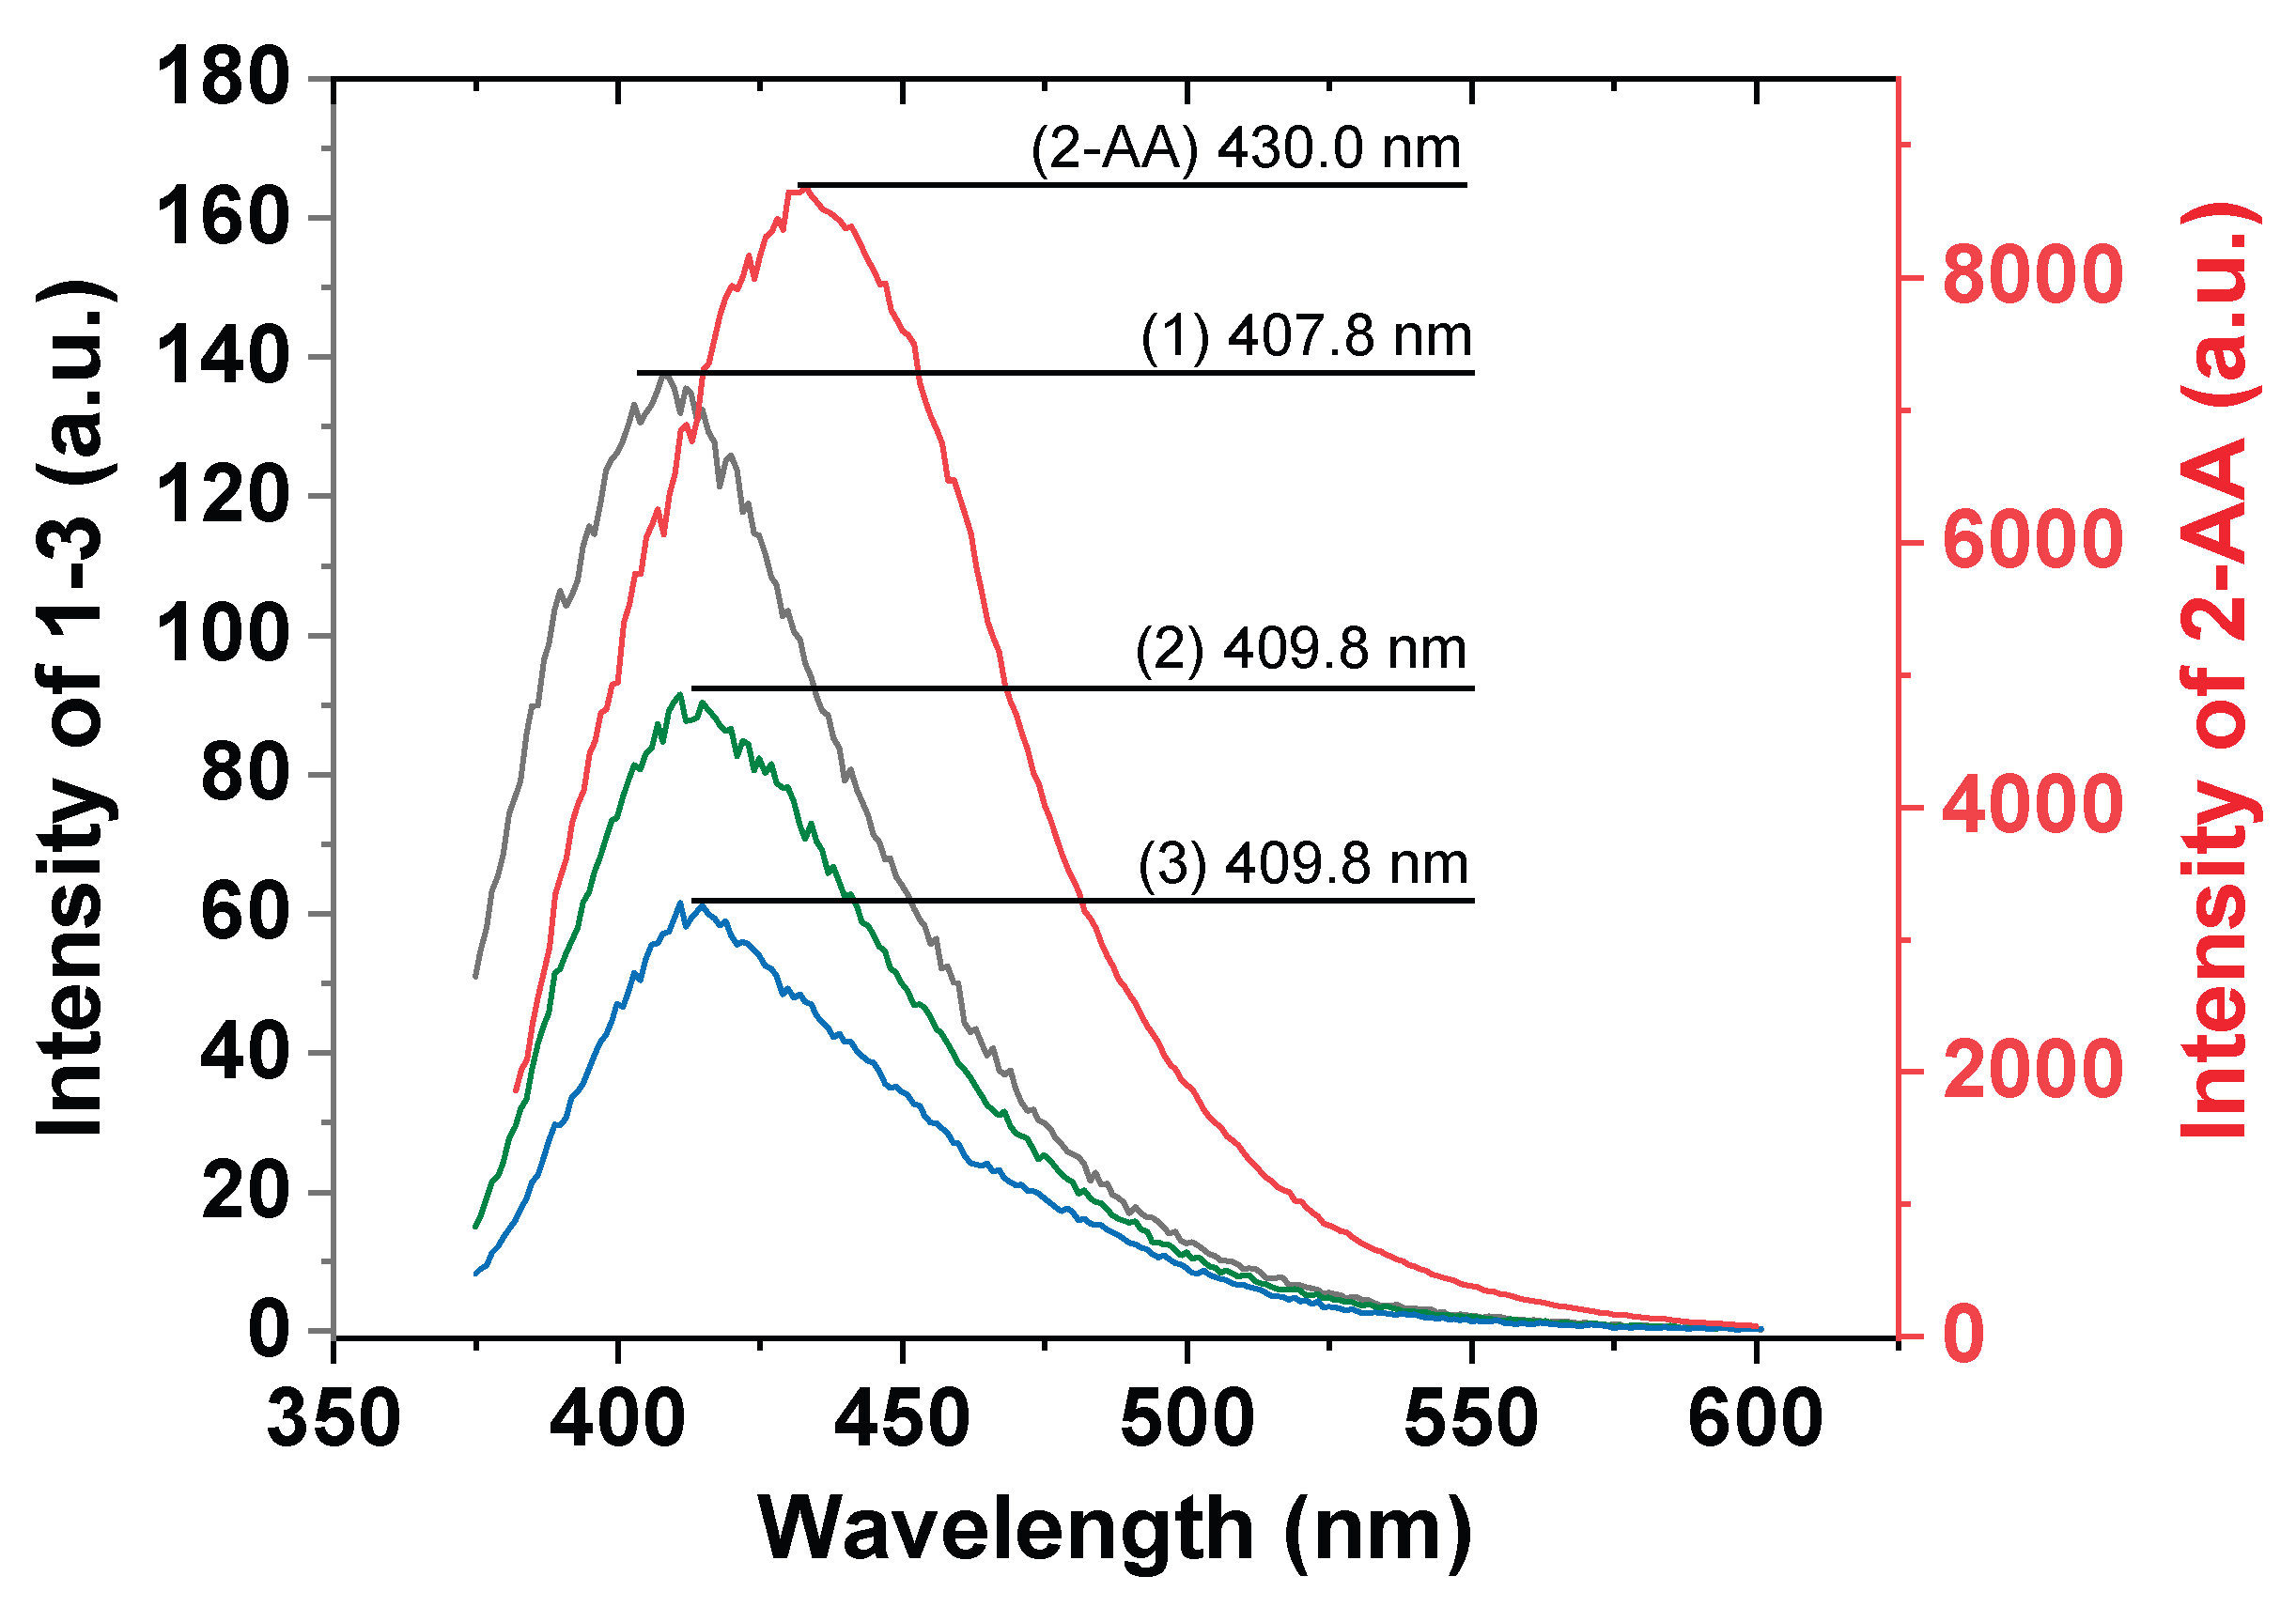
Figure 5.
Typical representation of the HN samples chromatographic profiles after conjugation with 2-AA obtained by HILIC HPLC. The inset shows enlarged sections of the chromatogram for HNs with MM (1) 50, (2) 20 and (3) 11.2 kDa
Figure 5.
Typical representation of the HN samples chromatographic profiles after conjugation with 2-AA obtained by HILIC HPLC. The inset shows enlarged sections of the chromatogram for HNs with MM (1) 50, (2) 20 and (3) 11.2 kDa
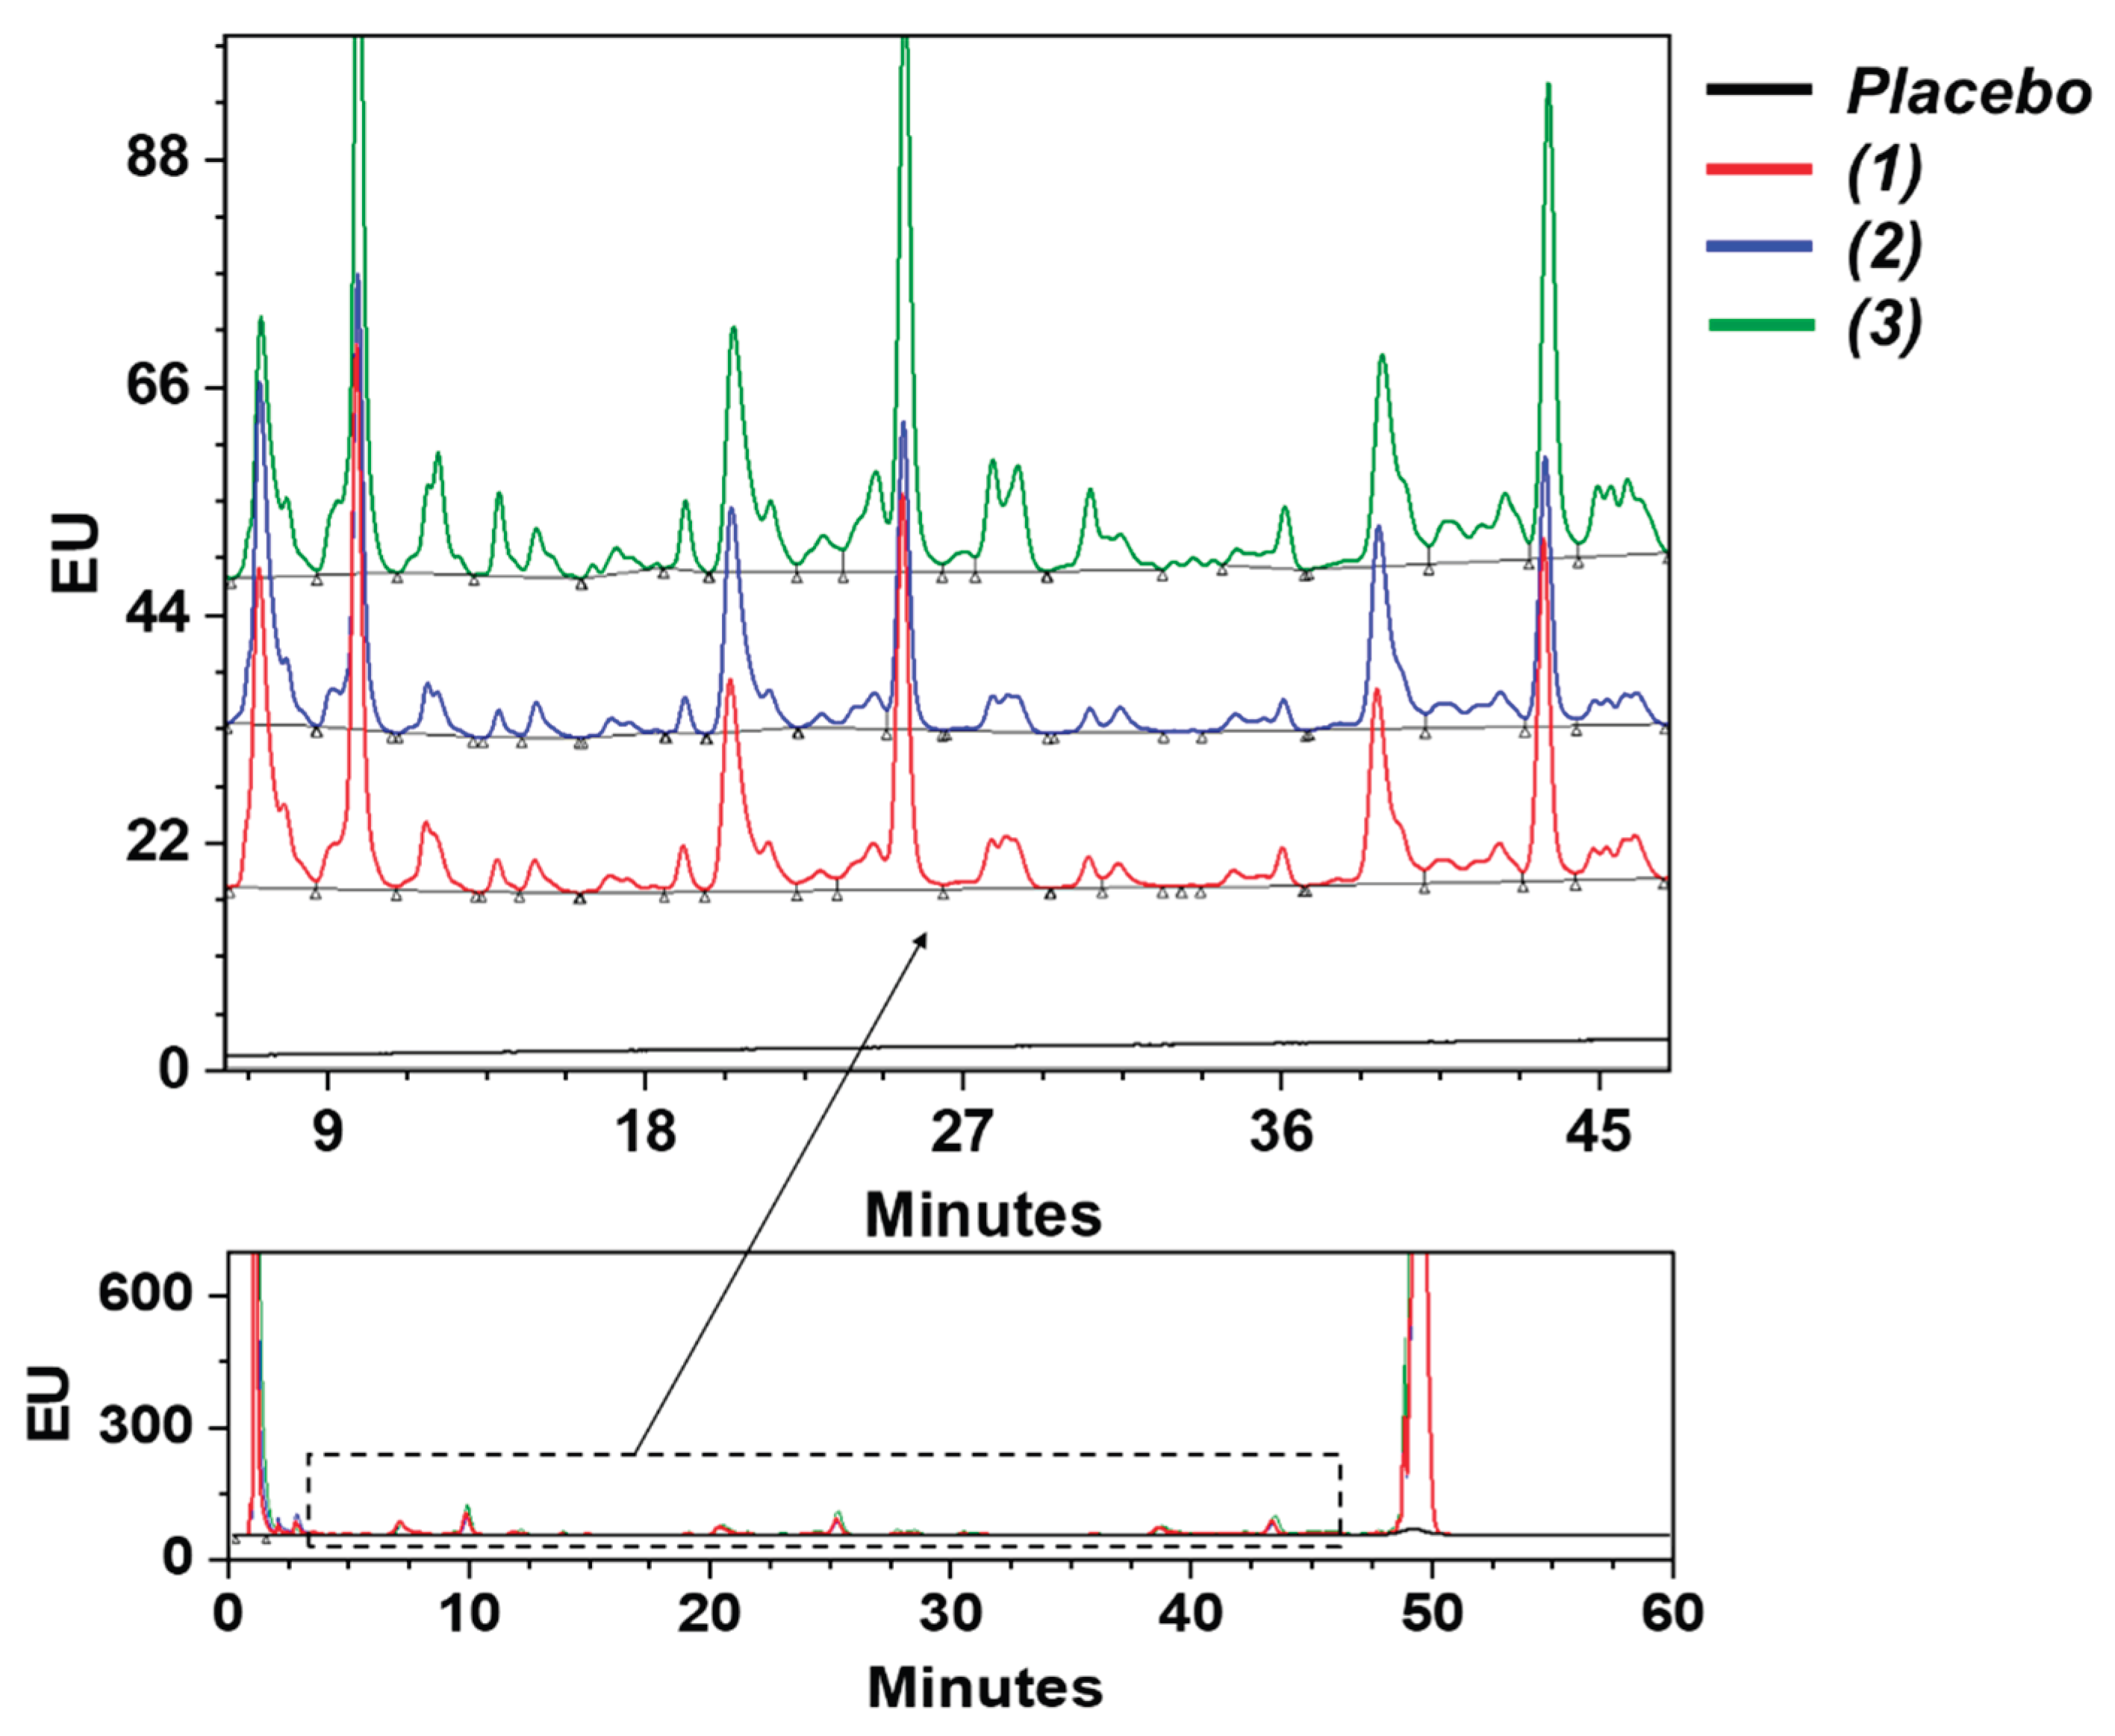
Figure 6.
Typical temperature dependence of fluorescence intensity at the peak maximum for an aqueous solution of HN with MM=11.2 kDa modified with 2-AA at various pH
Figure 6.
Typical temperature dependence of fluorescence intensity at the peak maximum for an aqueous solution of HN with MM=11.2 kDa modified with 2-AA at various pH
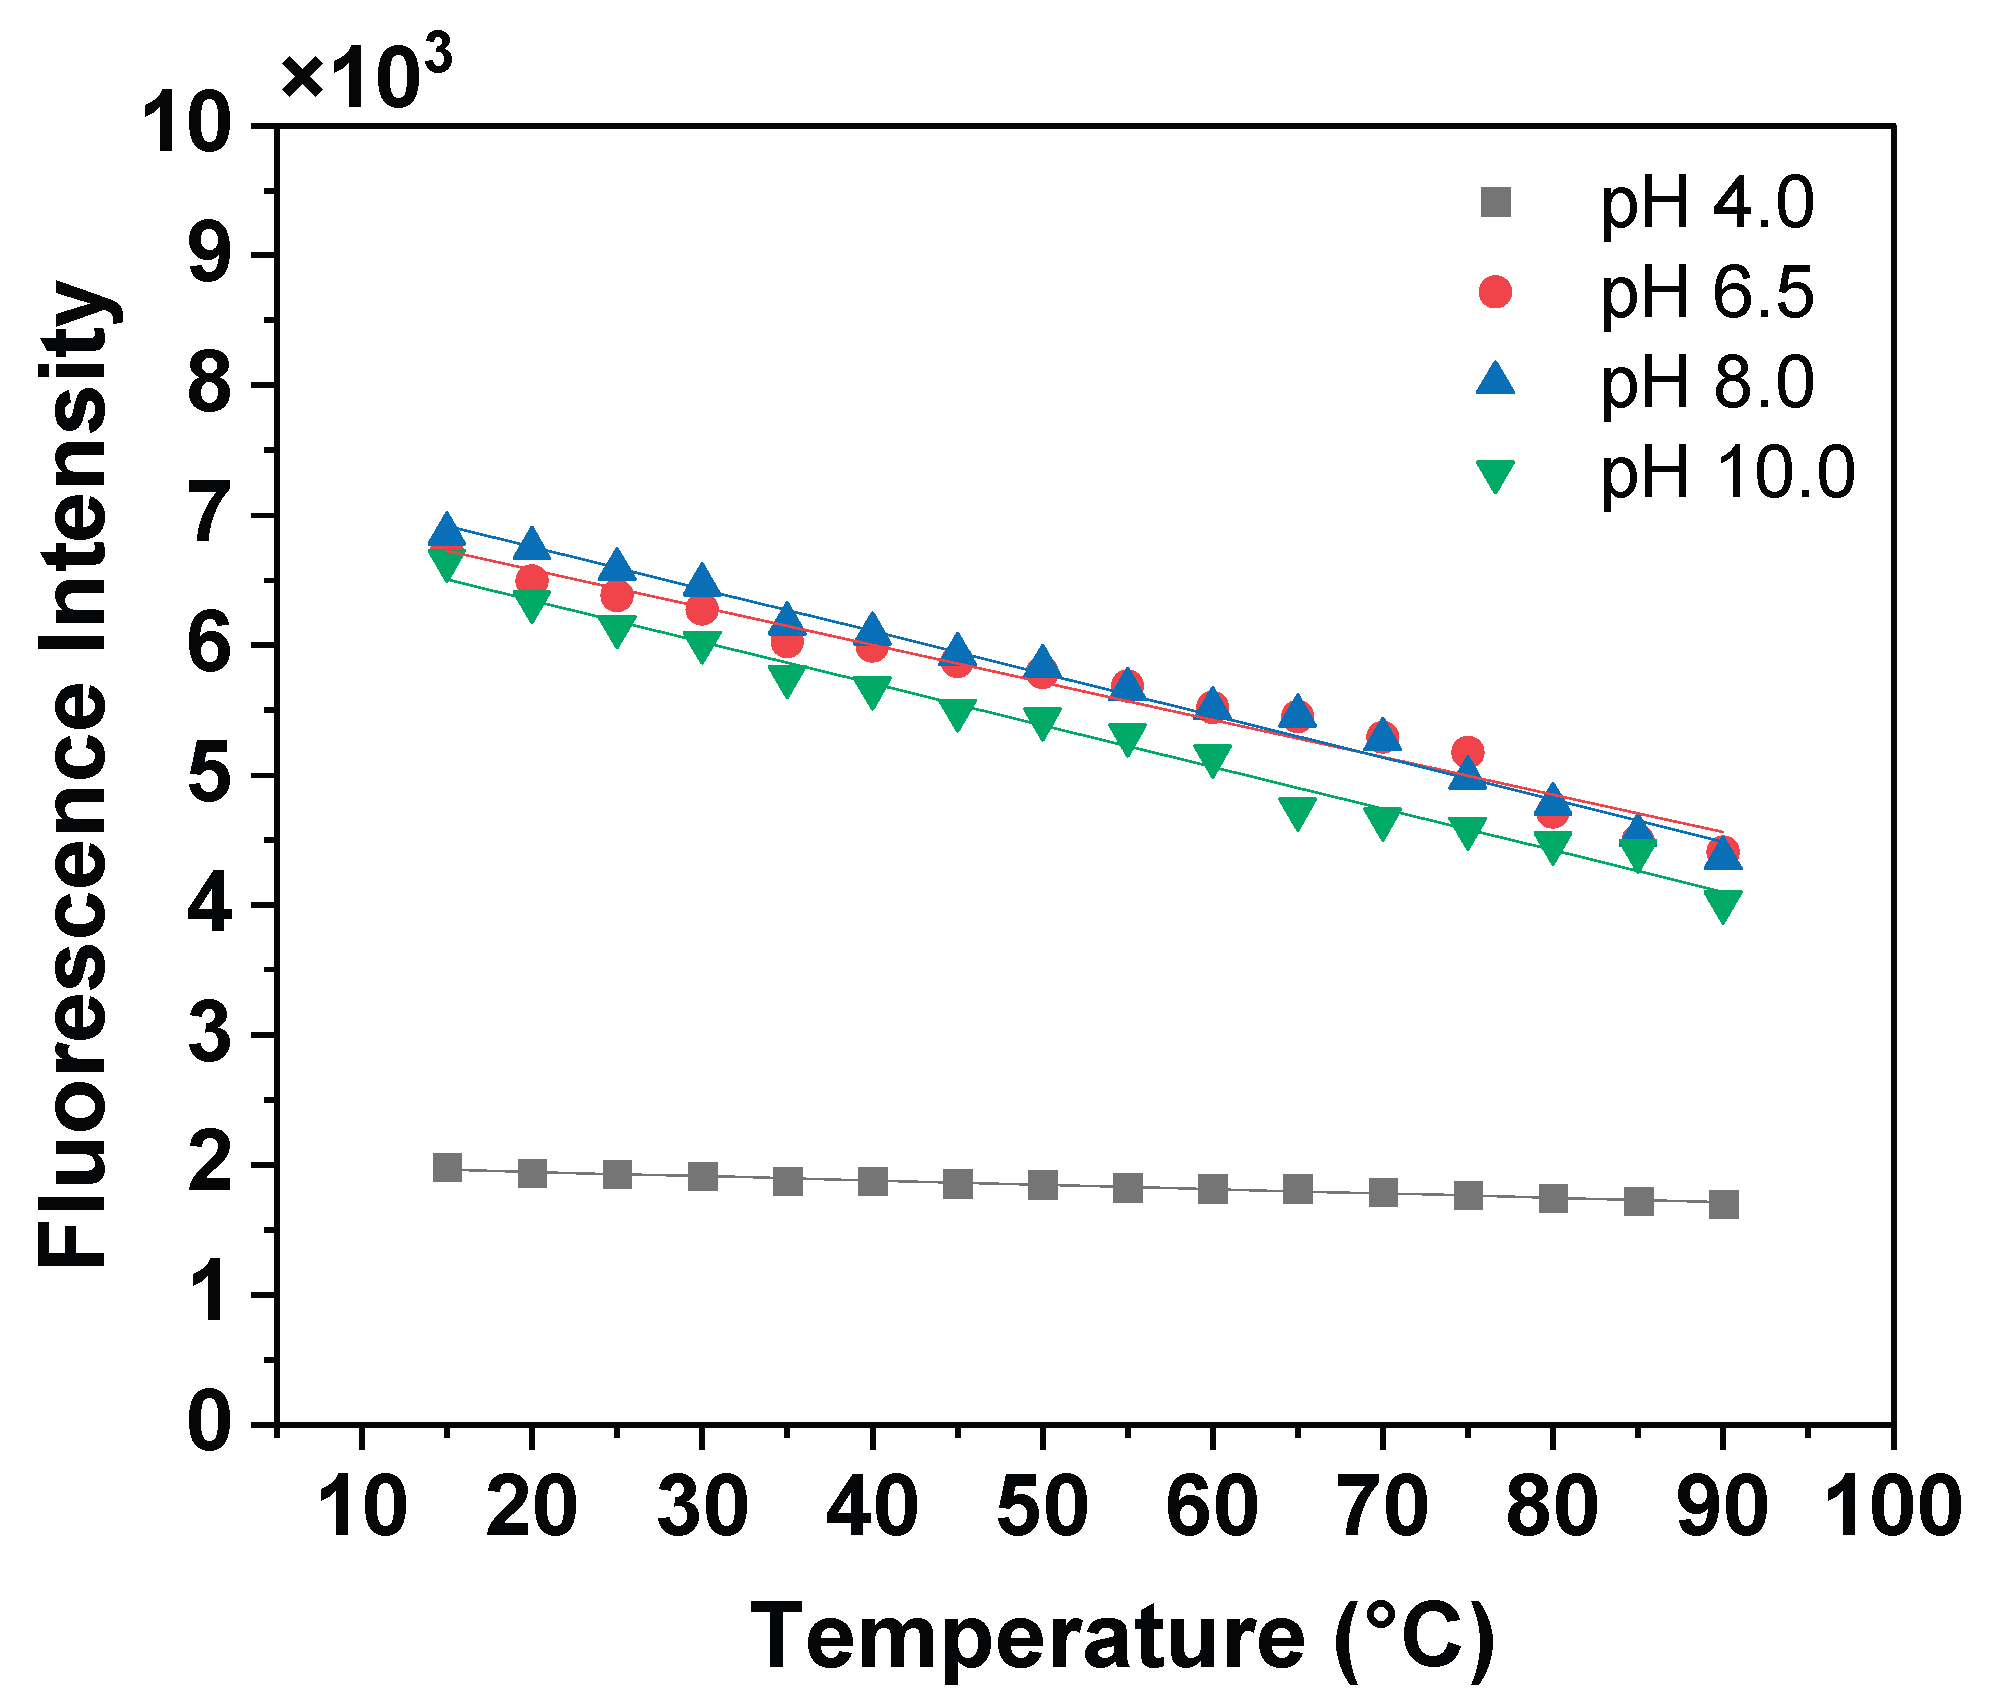
Figure 7.
Typical distribution curves of the numerical concentration of HN particles by size (a) at different pH
using the example of HN with MM 11.2 kDa; (b) for HN of different MM at pH 6.5. The concentration of HN is
1.0 mg/ml.
Figure 7.
Typical distribution curves of the numerical concentration of HN particles by size (a) at different pH
using the example of HN with MM 11.2 kDa; (b) for HN of different MM at pH 6.5. The concentration of HN is
1.0 mg/ml.
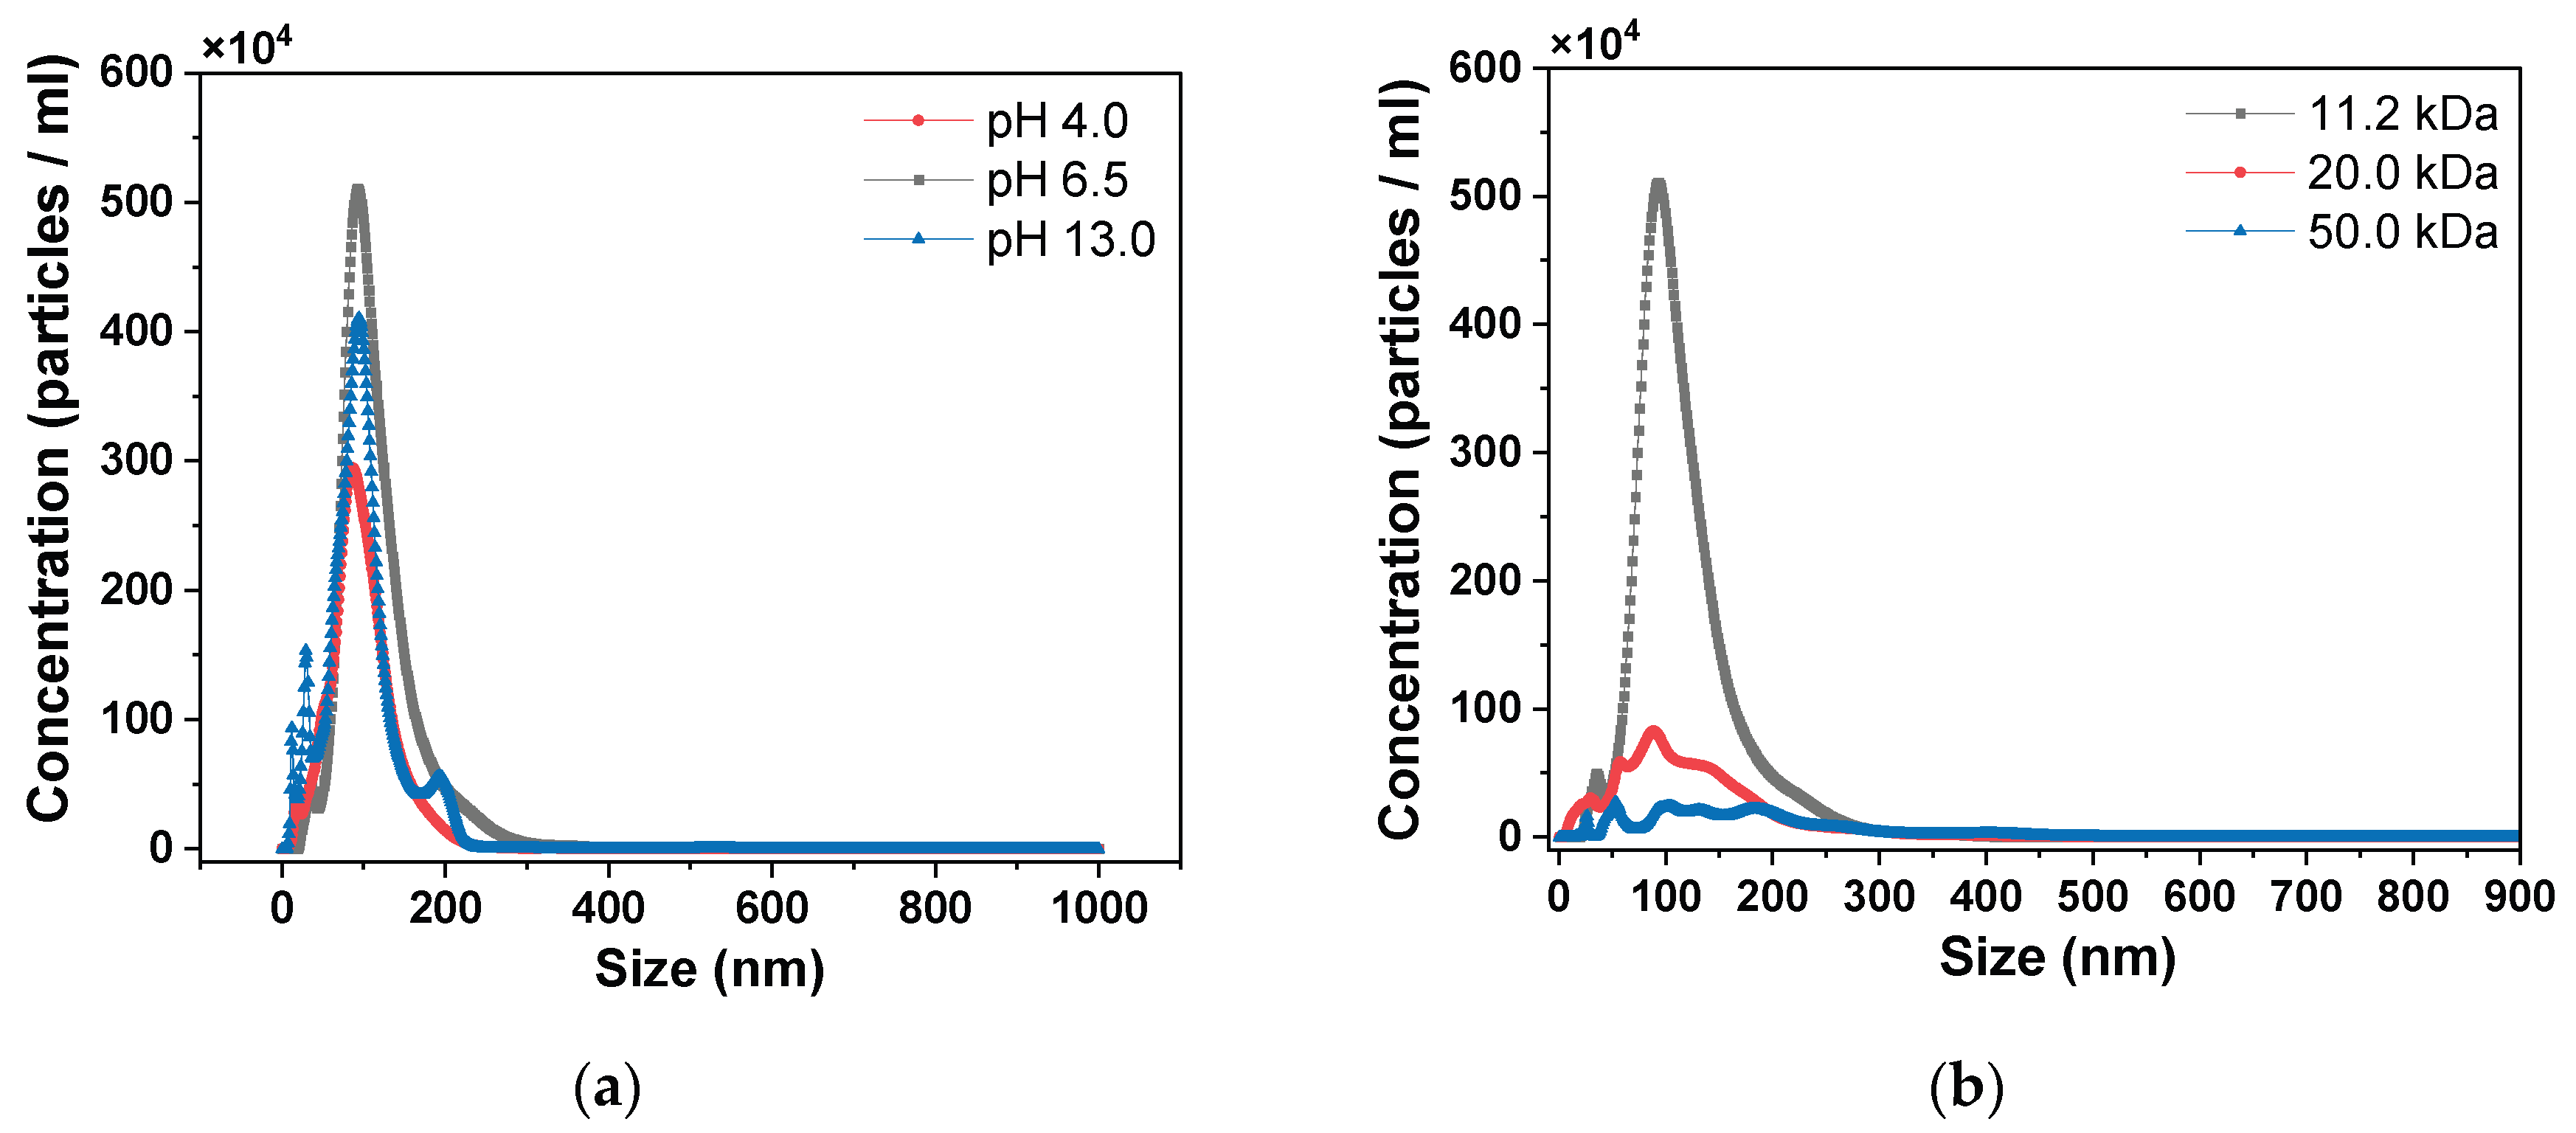
Figure 8.
Scheme of HN and BDDE chemical modification proceeding via carboxyl (a), hydroxy (b) and amino groups formed as a result of partial deacetylation of acetamide groups of HN (c).
Figure 8.
Scheme of HN and BDDE chemical modification proceeding via carboxyl (a), hydroxy (b) and amino groups formed as a result of partial deacetylation of acetamide groups of HN (c).
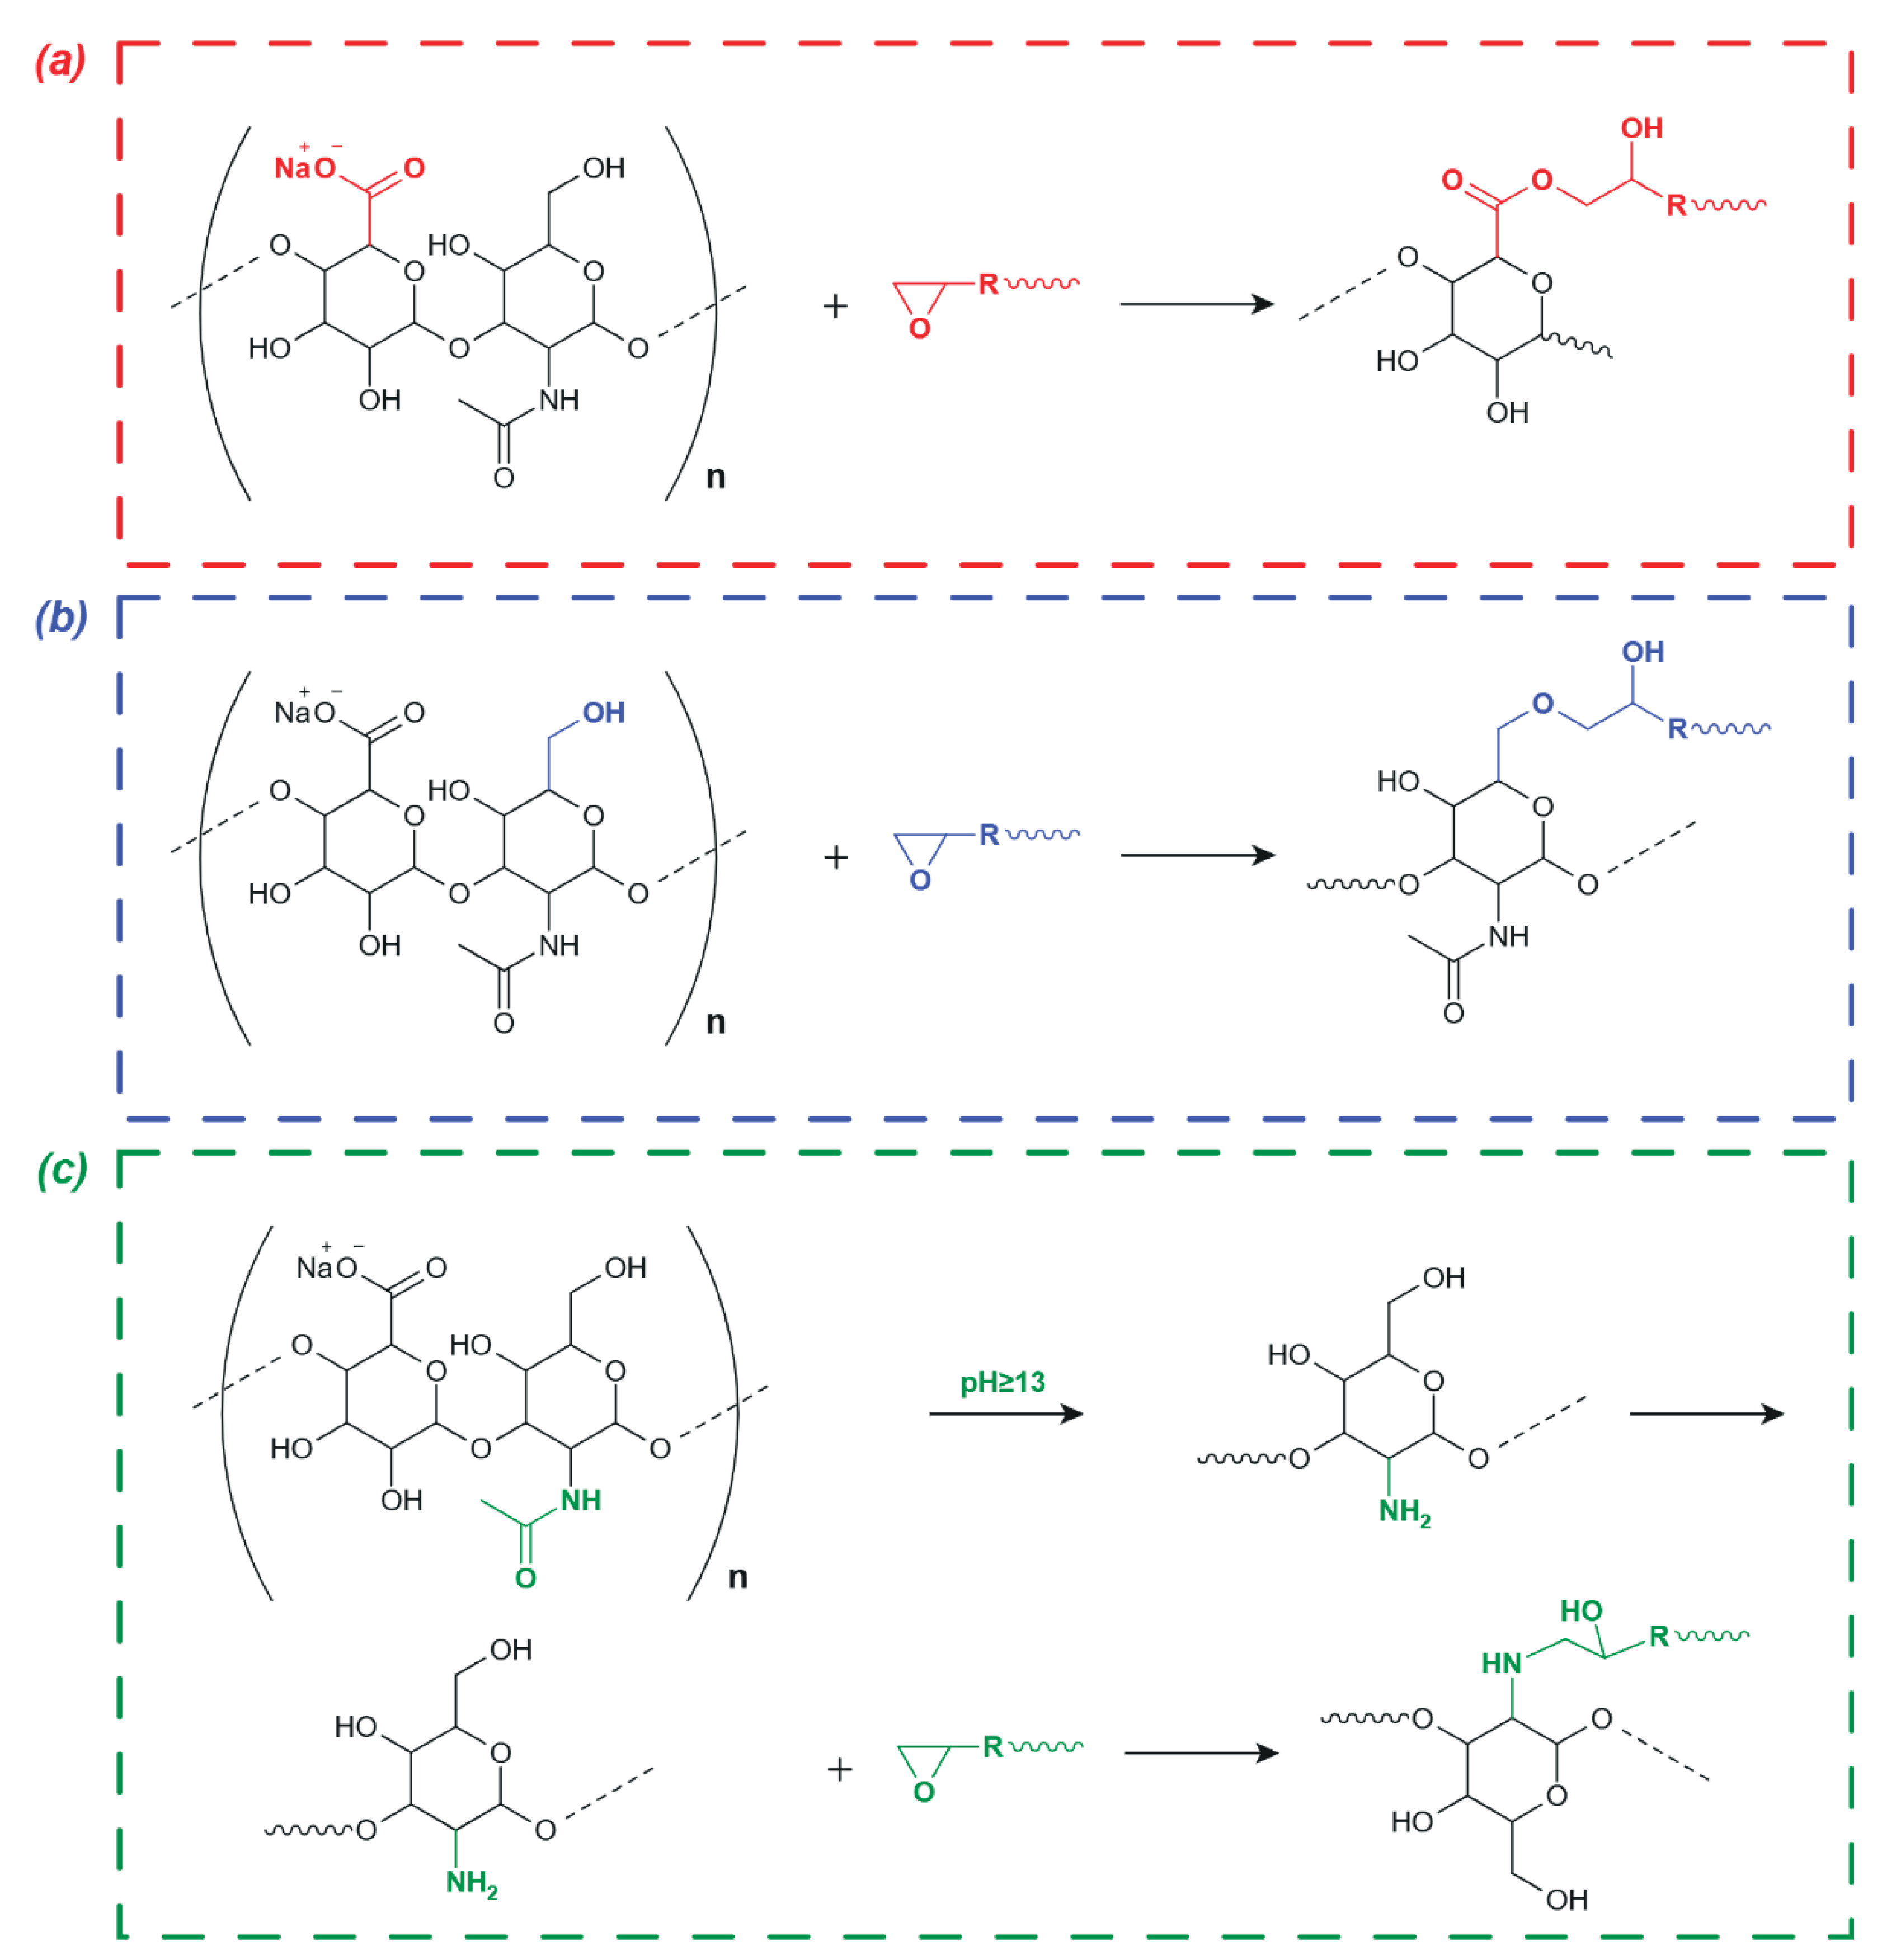
Figure 9.
Kinetic dependences of fluorescence intensity (a) and average size of light scattering centers (b) for 1.0 mg/ml HN aqueous solutions with MM 11.2, 20.0 and 50.0 kDa in the presence of BDDE in a molar ratio of 1:1 at pH 13.0 at a constant temperature of (60±2) °C. Arrows indicate the determination of tF and tZ for HN with MM 11.2 kDa.
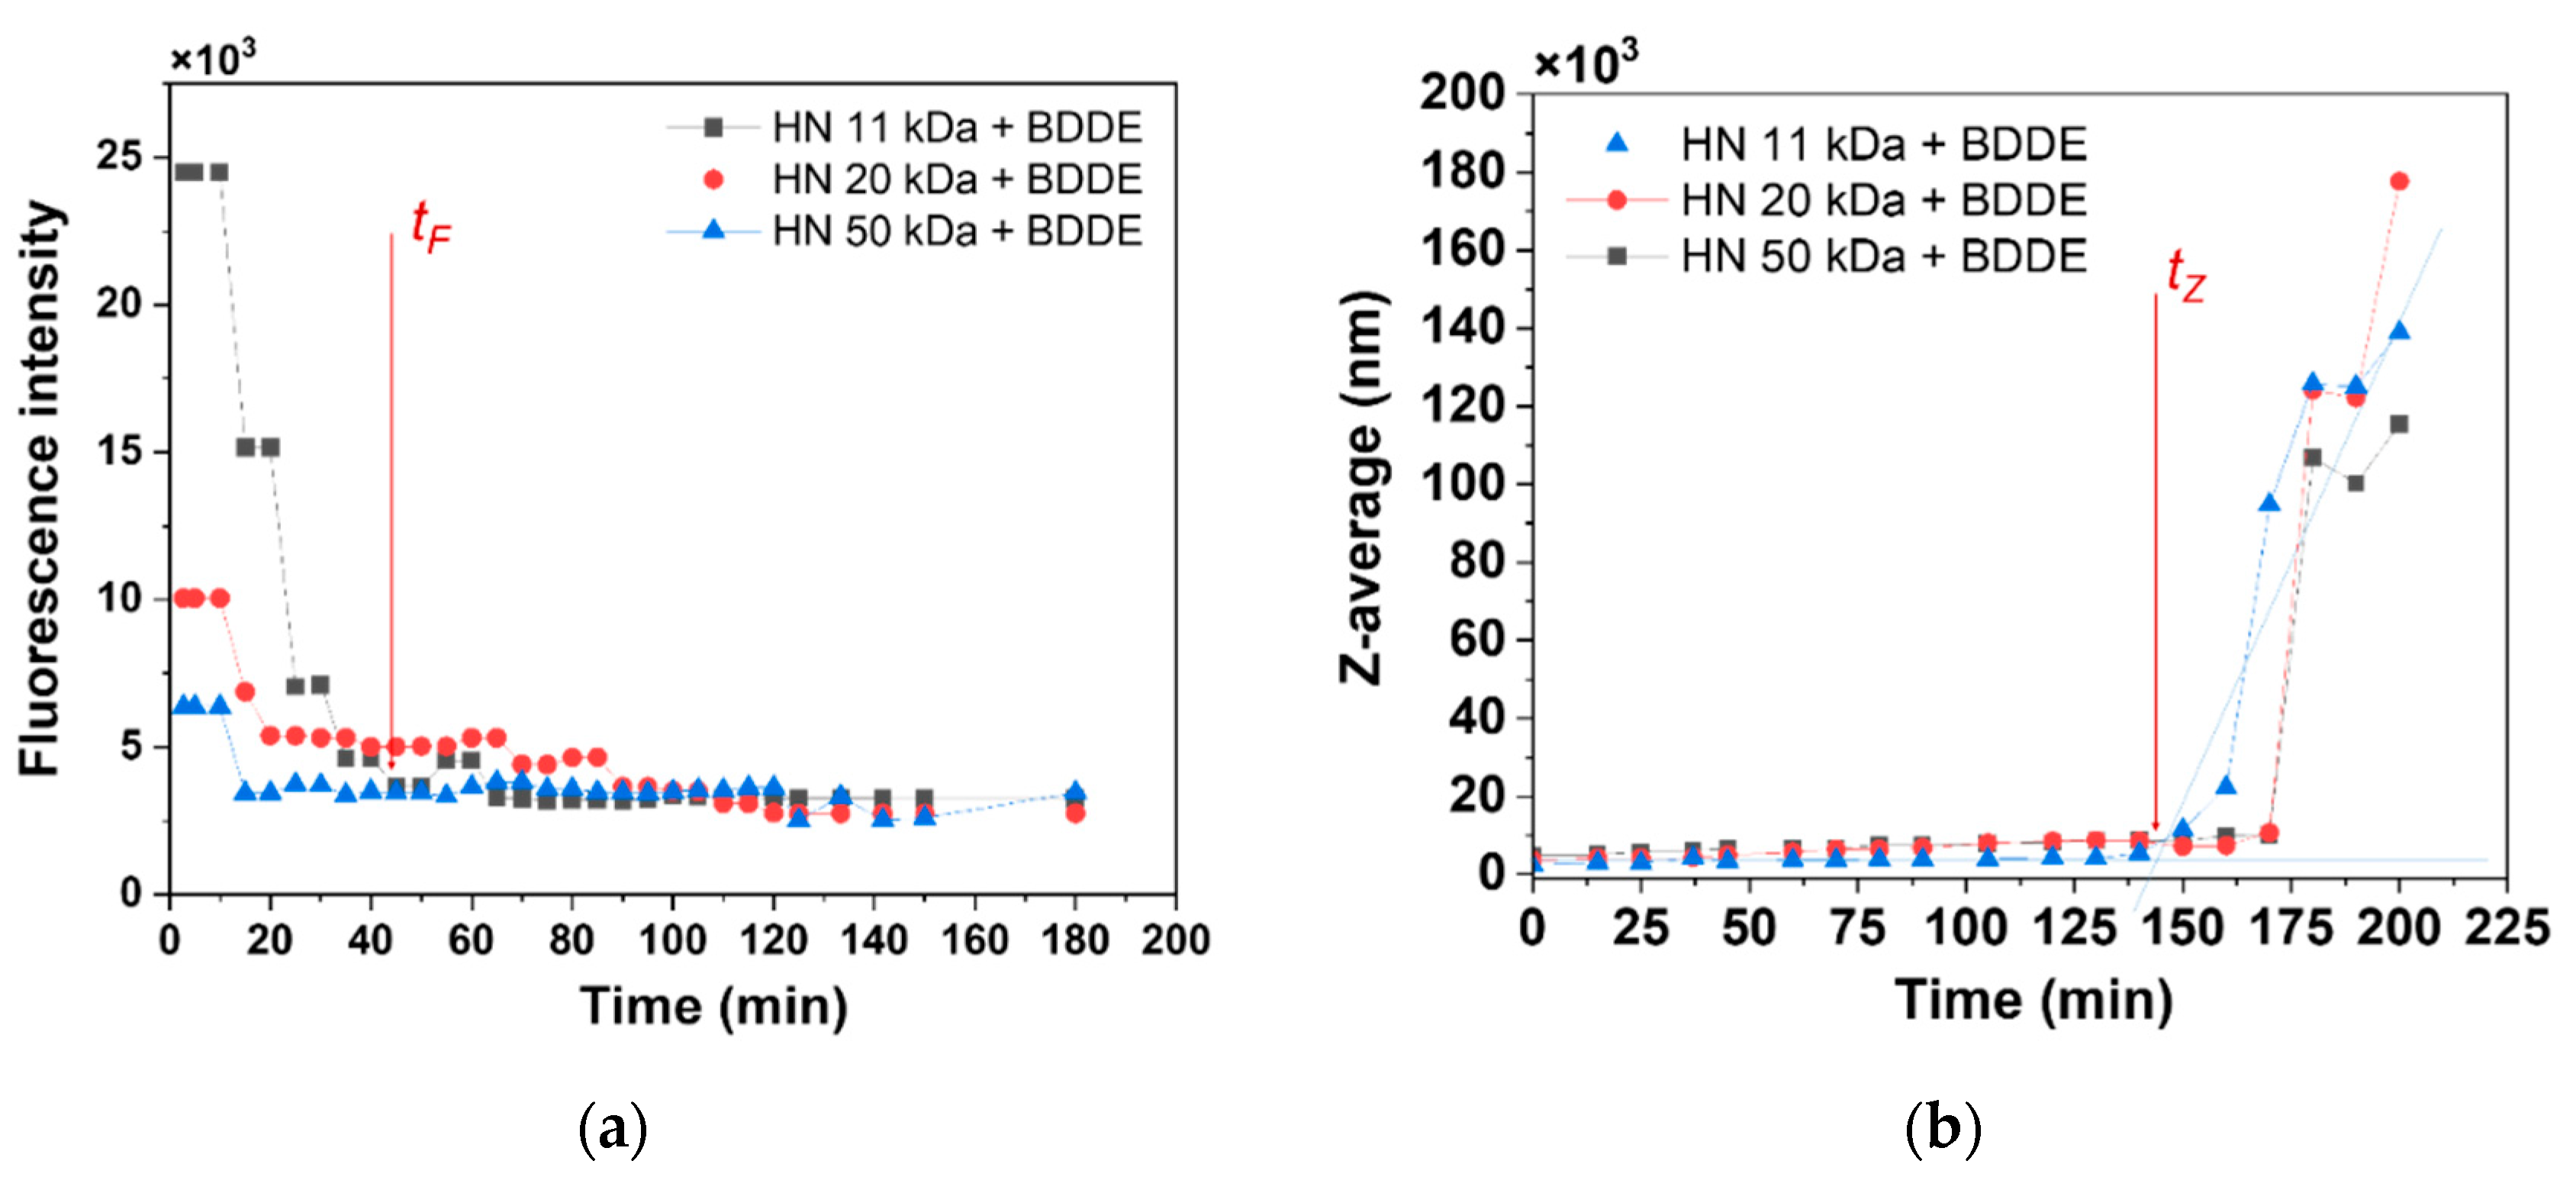
Figure 10.
13C IG NMR spectra of HN with MM 50 kDa: initial HN (a), HN maintained under synthesis conditions without (b) and with glycidol (c).
Figure 10.
13C IG NMR spectra of HN with MM 50 kDa: initial HN (a), HN maintained under synthesis conditions without (b) and with glycidol (c).
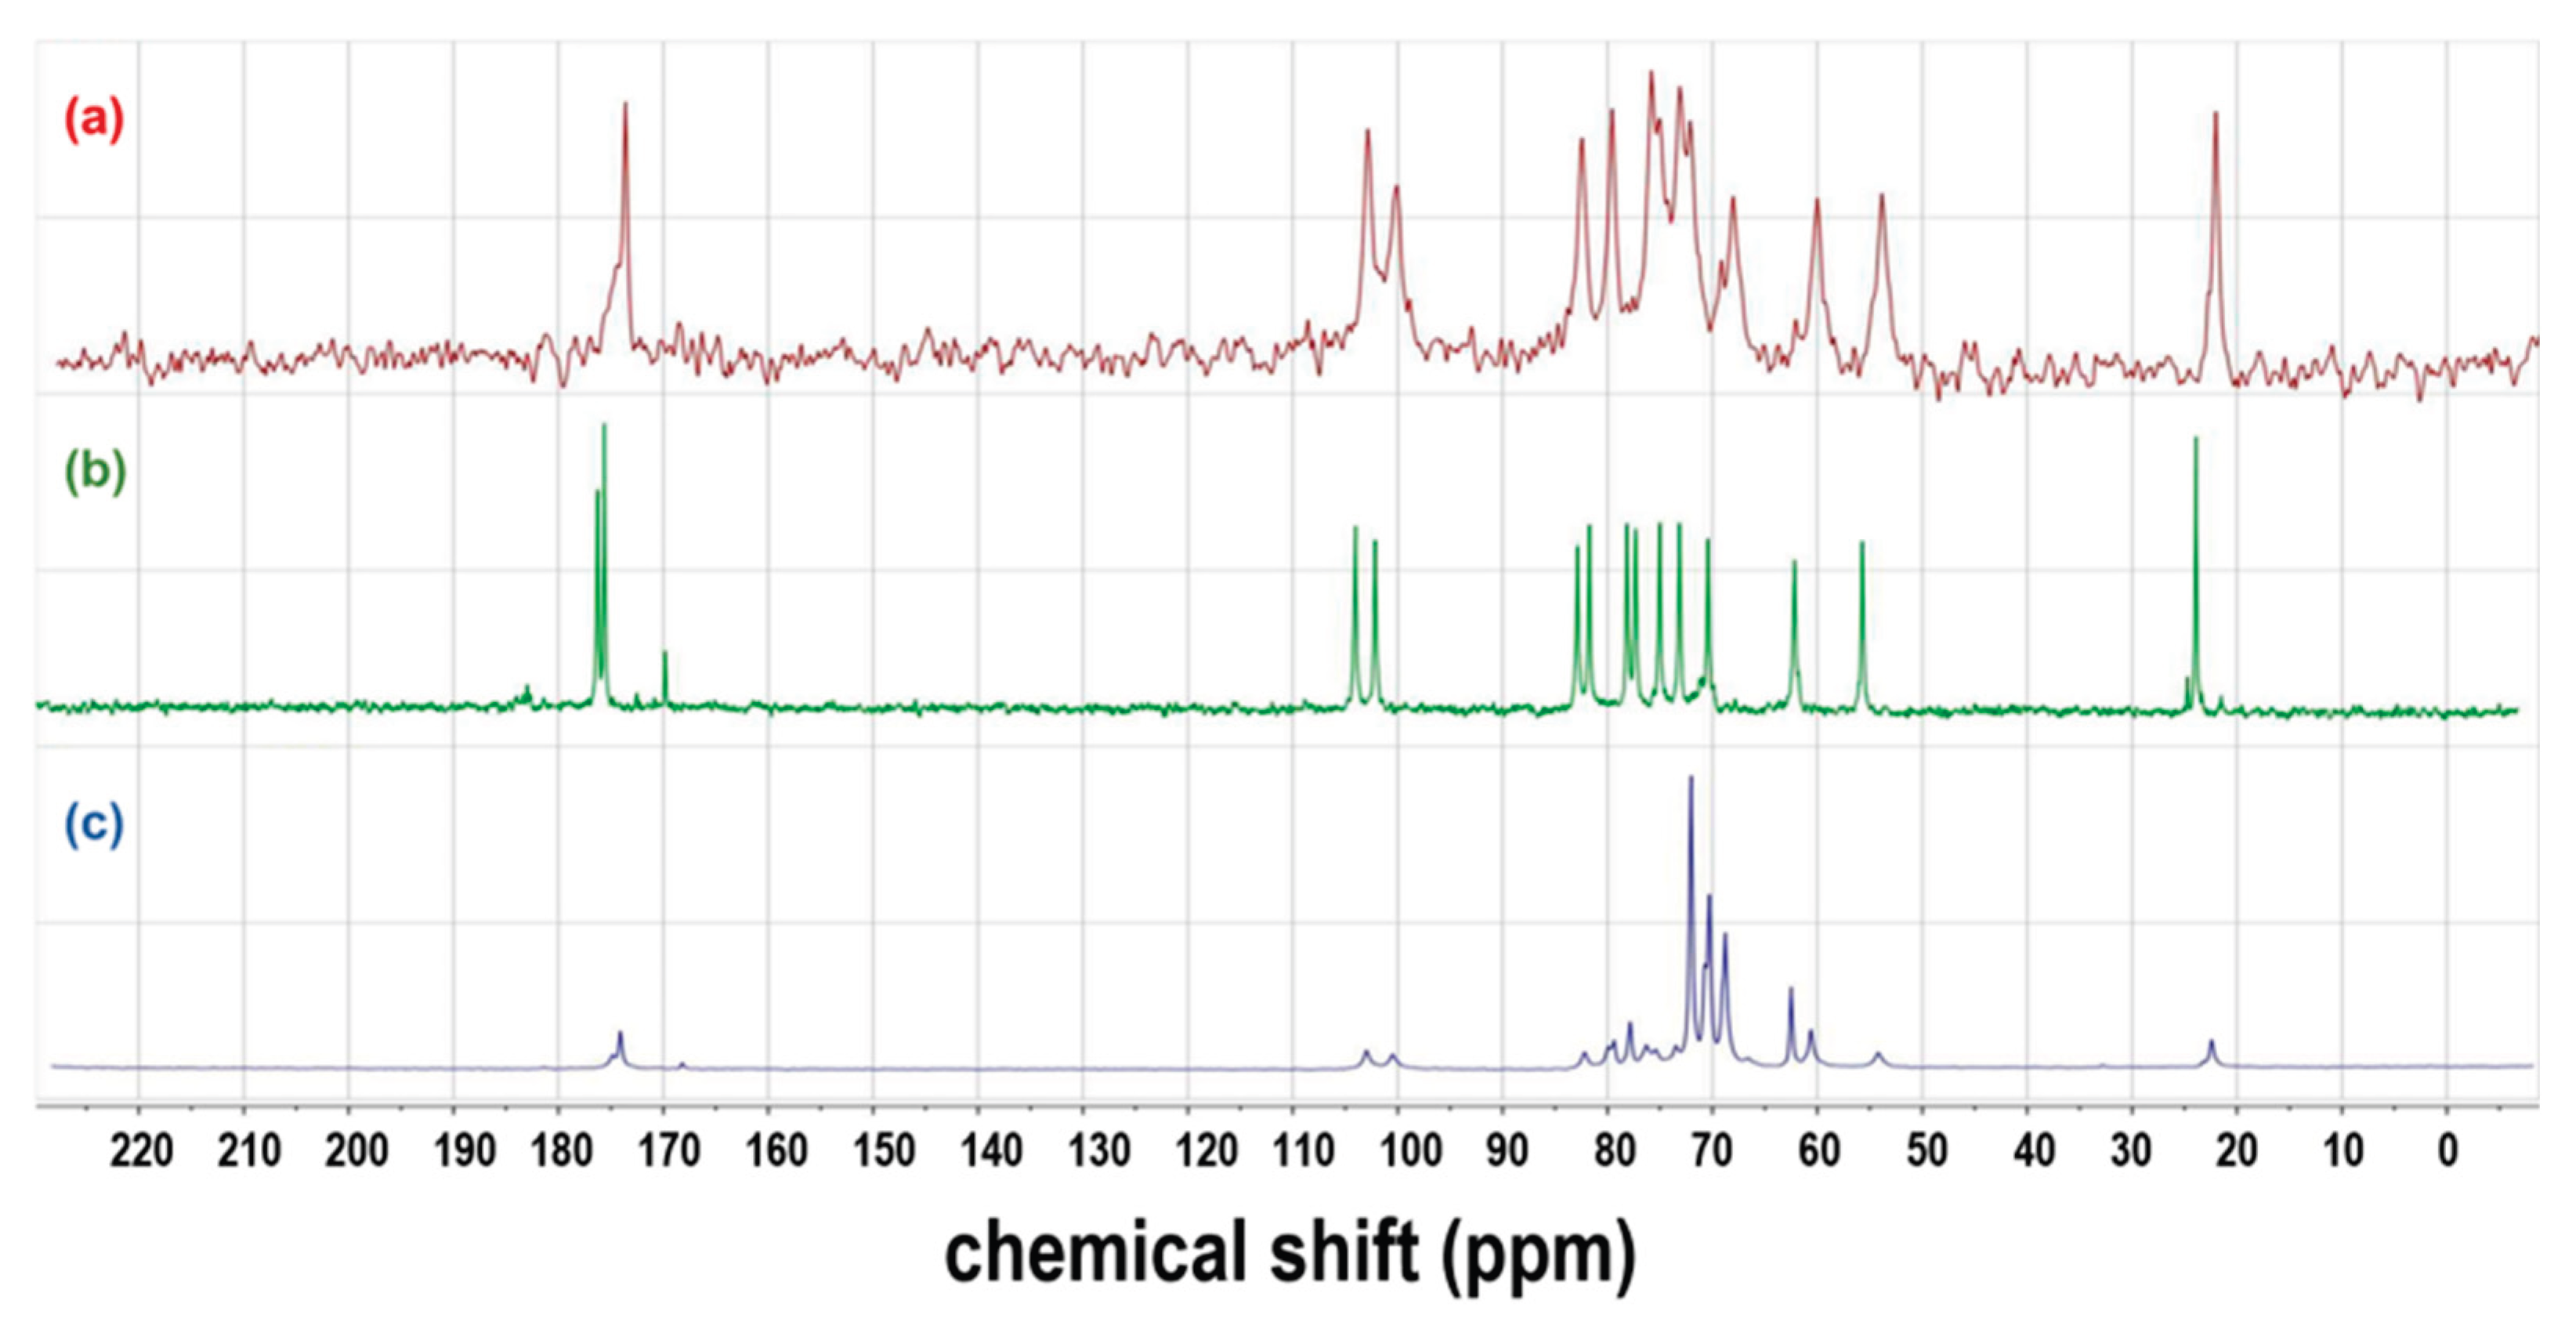
Figure 11.
Partial charges of O and N atoms in a sodium hyaluronate fragment.
Disclaimer/Publisher’s Note: The statements, opinions and data contained in all publications are solely those of the individual author(s) and contributor(s) and not of MDPI and/or the editor(s). MDPI and/or the editor(s) disclaim responsibility for any injury to people or property resulting from any ideas, methods, instructions or products referred to in the content. |
© 2025 by the authors. Licensee MDPI, Basel, Switzerland. This article is an open access article distributed under the terms and conditions of the Creative Commons Attribution (CC BY) license (http://creativecommons.org/licenses/by/4.0/).
Copyright: This open access article is published under a Creative Commons CC BY 4.0 license, which permit the free download, distribution, and reuse, provided that the author and preprint are cited in any reuse.


