
Submitted:
29 July 2025
Posted:
30 July 2025
You are already at the latest version
Abstract
This study explores the effect of E-beam radiation on gellan conformations in dilute aqueous solutions. Native and E-beam-modified gellan samples (N&EBMs) were prepared at 0.05 g/cm³ in 0.1M KCl under atmospheric conditions. Their relative viscosities were measured at different temperatures, and intrinsic viscosity and molar mass were determined using the Solomon–Ciuta and Mark-Houwink equations. The degradation of molar mass was analyzed, and first-order rate constants and degradation lifetimes were calculated. Structural properties such as the radius of gyration and second virial coefficient were evaluated, yielding scaling coefficients of 0.62 and 0.15, respectively, indicating that gellan chains adopt a perturbed coil structure in a good solvent. The shape parameter confirmed that E-beam radiation did not affect the ideal random coil structure of gellan. Chain flexibility was assessed using theoretical models, including the transition state theory (TST), freely rotating chain (FRC) model, and worm-like chain (WLC) model. According to TST, E-beam radiation reduced molar mass and activation energy while increasing activation entropy, decreasing chain flexibility but enhancing solvent quality. FRC model provided the end-to-end distance (R_θ) and characteristic ratio (C_∞), while WLC model determined the persistence length (l_p). E-beam radiation decreased R_θ and increased〖 l〗_p, suggesting reduced flexibility and improved solvent interactions. However, C_∞ remained largely unchanged, indicating that gellan retained its ideal chain structure despite radiation exposure. These findings offer insight into the structural and conformational changes in gellan under E-beam radiation, with implications for its rheological and functional properties.
Keywords:
e-beam degradation
; gellan intrinsic viscosity
; scaling laws
; chain flexibility
; activation functions
1. Introduction
Polymers are distinctive materials characterized by a wide range of high molar masses and corresponding solution viscosities [1]. They are composed of chain molecules formed by repeating organic units called monomers, where each pair of monomers is covalently bonded [2].
In solution, the length of the covalent bond (b) is usually referred to as the chain segment; the length of a single polymer chain corresponds to a specific number of segments (N) and degree of polymerization (DP), where N is equal to 2 DP; the degree of polymerization, also called the number of monomers, is equal to the chain molar mass (M) divided by the monomer molar mass Mu [1]. Both are represent average values due to the varying chain lengths of polymeric substances.
In a diluted solution, polymer chains exist as individual coils and behave ether as a random walk coils or self-avoiding walk coils [3,4,5]. In a good solvent, these coils adopt irregular and dynamic shapes due to segmental perturbations, behaving like a real chain that is fully dissolved and conforming to the self-avoiding walk (SAW) model [4,5]. However, electrolyte chains tend to adopt stretched conformations unless a small amount of neutralizing salt is added, which causes the chains to collapse back into the coil shapes [1].
In contrast, in a theta (θ) solvent, the coil assumes a static, spherical shape due to its unperturbed segments, following the random walk (RW) model or freely rotating chain (FRC) model [3,4,5]. In this case, the chain behaves like an ideal chain, neither completely dissolved nor precipitate.
Polymers in infinitely diluted solutions (IDS) exhibit specific intrinsic properties (Ps) such as intrinsic viscosity ([η]), radius of gyration (Rg), chain end-to-end distance (Re), hydrodynamic radius (Rh), and interaction parameter (A2). Their relationships play a critical role in the viscosity analysis of polymers in solution [1,4,5,6,7].
Polysaccharides are natural polymer, composed of glycosidic-linked mono-saccharide units, and commonly utilized in numerous industrial and biomedical contexts [8]. A key task in these applications is controlling the M- P relationships of polysaccharides. Radiation degradation methods, such as electron beam (EB) techniques, are effective, eco-friendly ways to regulate these relationships. When irradiated polysaccharides are dissolved in a solution, their viscosity behavior often differs from that of the native polysaccharides, see for example Ref. [9,10,11,12].
In dilute solutions, polysaccharides exhibit a range of M-P relationships, which are typically analyzed Flory [4,13] scaling laws and theoretical models such as the FRC and SAW models, as previously discussed [3,4,5]. Additionally, the transition state theory (TST) and the worm-like chain (W-LC) model, covered in References [6,14] and [1,8,15], provide further insight into their behavior.
Gellan is a linear, water-soluble polysaccharide obtained through bacterial fermentation [15,16]. It functions as an anionic polysaccharide and is composed of repeating monomeric units, as shown in Figure 1 [16].
Gellan gum, utilized in solutions across a variety of molar masses, serves multiple purposes, including as a food, antioxidant activities, in drug delivery systems, and plant growth regulators [16,17].
In the literature, relevant studies have primarily explored the formulation of the Mark–Houwink equation [18], the structural and conformational properties of polysaccharides in organic solvents [19], and the impact of radiation on the molar mass-viscosity relationship [20]. However, our research specifically examines radiation-induced M-P modifications in diluted gellan within an aqueous solution, a topic that has not yet been addressed in previous studies.
This study seeks to offer scientists and engineers working with polymers and polysaccharides an efficient approach to modifying gellan in aqueous solution for targeted applications. The objectives of the study are categorized into three main areas: examining radiation degradation kinetics, establishing scaling laws, and analyzing changes in chain flexibility following modification.
2. Experimental
2.1. Materials
Gellan was supplied as commercial-grade powder by Glentham Life Sciences Ltd at UK. The Potassium Chloride (KCl) powered was supplied as Commercial-grade powder by Surechem products ltd, Needham market, Suffolk, UK.
2.2. Solution preparations
Potassium chloride, KCl, was dissolved in double-distilled water to obtain a stock solvent up to 0.1M. Gellan gum, GG, was then dissolved in the solvent to obtain a stock solution up to 0.05 g/cm³. In both dissolution proses, the mixture was gently stirred using a magnetic stirrer to ensure complete dissolution.
2.3. Viscosity measurements
Viscosity measurements were performed using a thermostated water bath (TCB-7-Viscometer Bath, 230V/50-60Hz, PSL-Rheotek) maintained at a temperature of 24.99 ± 0.01°C. The measurements utilized an Ostwald viscometer (YUCHENGTECH) with a capillary diameter of 0.5 mm and a water flow time ranging from 100 to 150 seconds. Flow times for both the solvent and the solution were measured in triplicate, and their averages were calculated using Eq. 1[1,6]:
ηr = t / to , ηsp = ηr -1
Here, t, t₀, ηᵣ, and ηₛ represent the solution flow time, solvent flow time, relative viscosity, and specific viscosity, respectively.
2.4. E-beam irradiation
The solution samples were irradiated using a digital linear accelerator manufactured by Elekta Infinity Company in Sweden, situated at the National Oncology Center in Benghazi, Libya. The irradiation process was conducted in an air atmosphere at room temperature, with electron energy of 6 MeV. The chosen absorbed dose ranged from 50 to 500 Gy, and changes in each sample were assessed through viscosity analysis immediately after irradiation and at various intervals.
2.5. Intrinsic viscosity and molar mass determinations
For the native and degraded 0.05 g/cm³ GG solutions, the intrinsic viscosity ([η]) was determined by the single-concentration method, using the Solomon–Ciuta equation [21]:
The molar masses Ms of the native and degraded gellan were calculated, using Mark-Houwink equation (Eq.3) relating to intrinsic viscosity as [22,23]:
where the M-H constantans of the used polymer-solvent system were given in the literature as [18]: K[η] = 7.48 × 10⁻³ cm3 /g anda = 0.91.
[η] = K[η] Mra
2.6. Characterizations
2.6.1. Degradation kinetics
The degradation rate (k) of GL in the diluted solution was graphically obtained by using Eq.4 [10,24]:
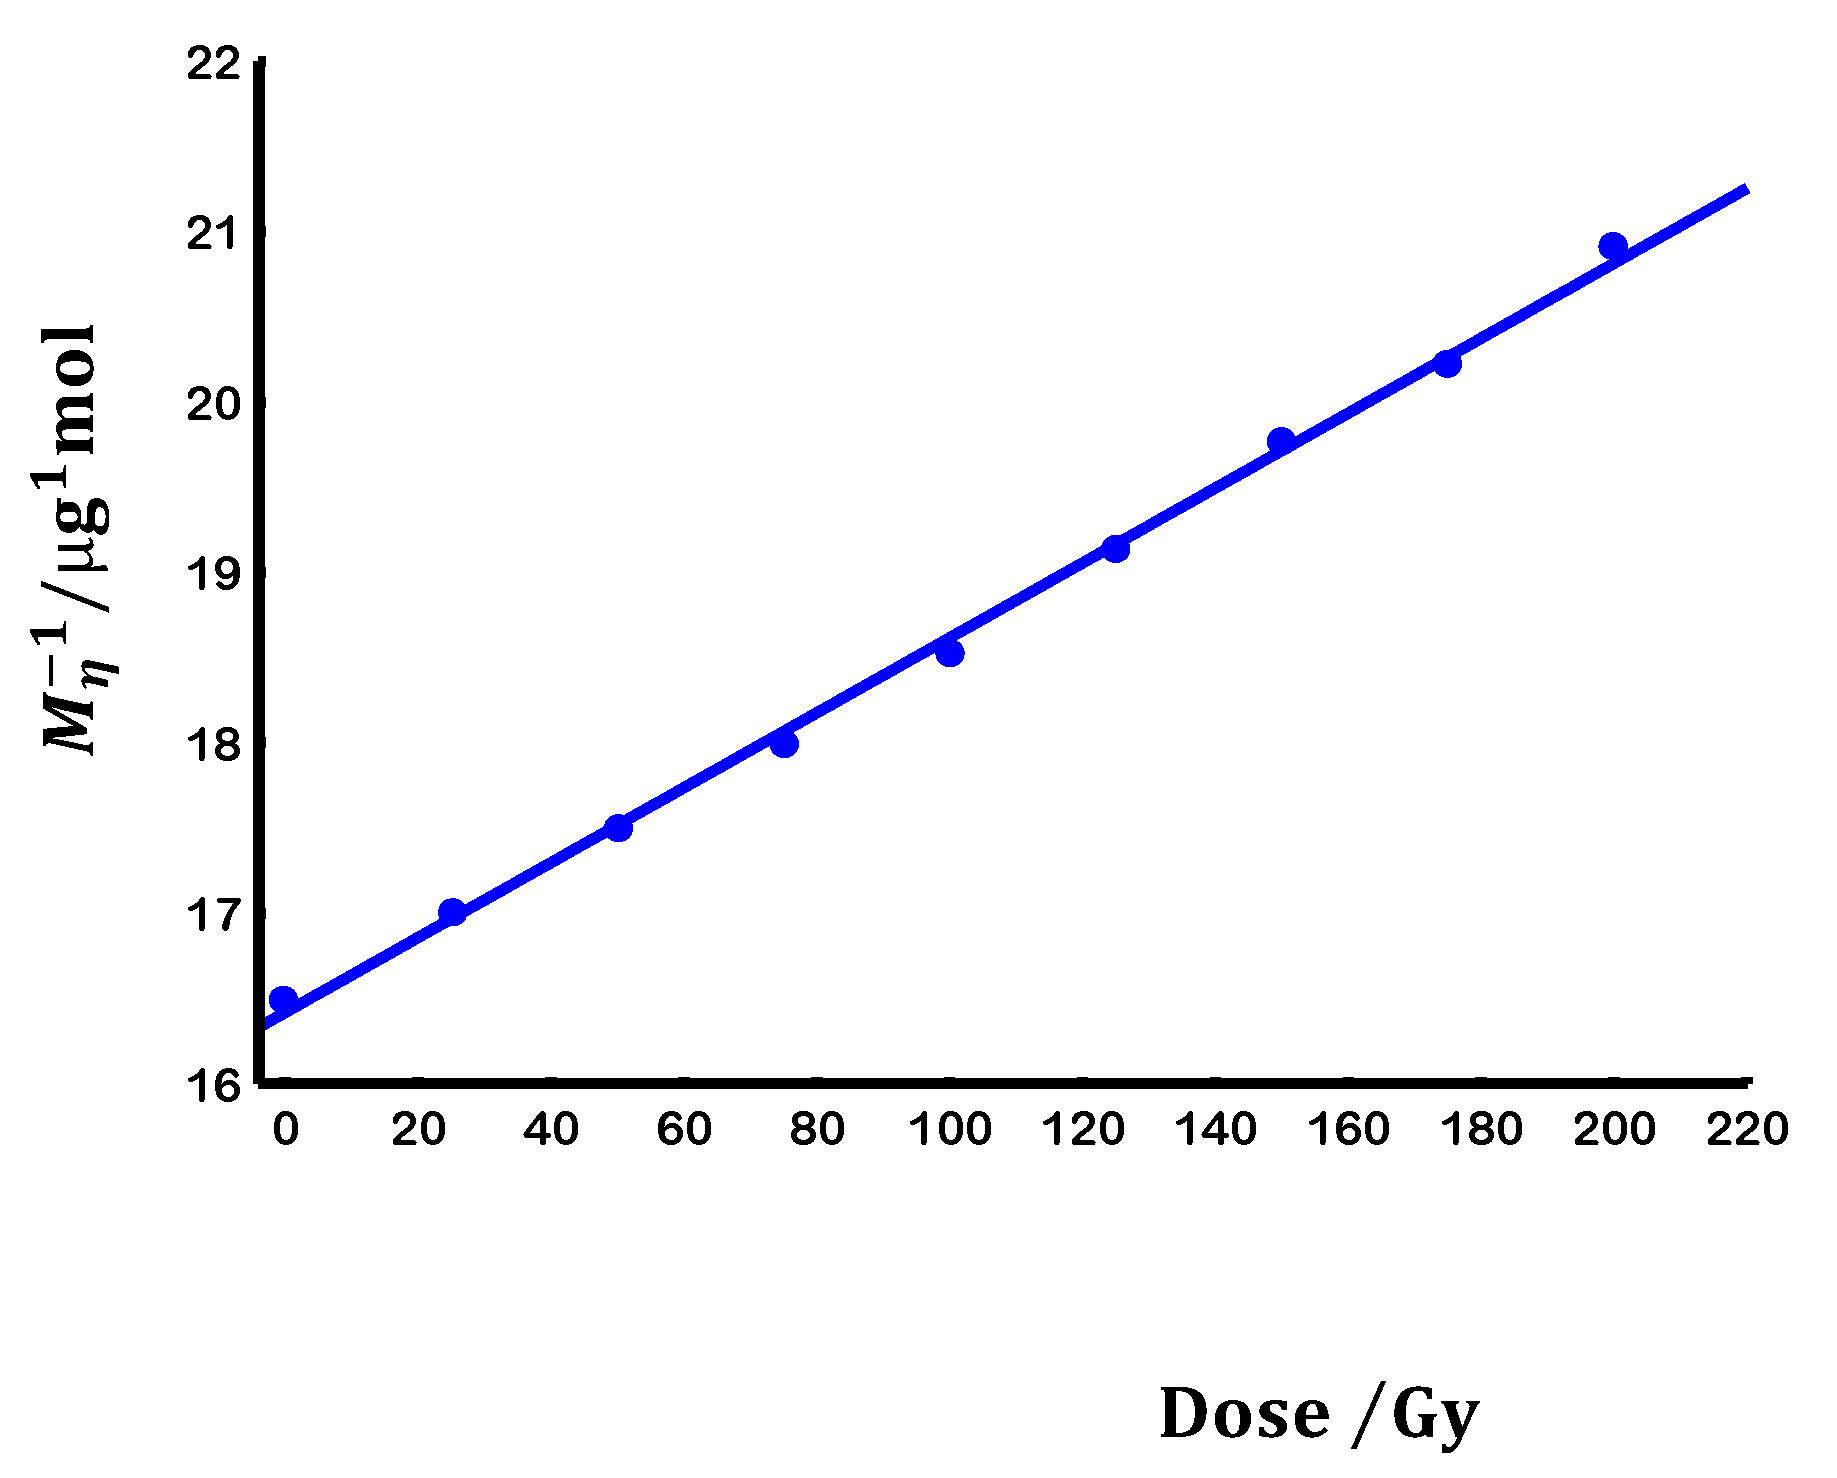
where: MD is GL molar mass at specific radiation dose, MO is the initial GL molar masses, and Mu is the monomeric GL molar mass. Furthermore, the rate constant k is related to the first order lifetime (τ) as:
1/MD – 1/MO = k D/Mu
1/k = τ
2.6.2. Scaling laws
The scaling parameters, including Rg and A2, were determined using calculations based on Eq.( 6) and (7), respectively [1,4,13]:
where and are the equations proportionality constants.
2.6.3. Chain flexibility
The chain flexibility parameters under non-theta conditions, including the shape parameter (), activation energy (), and solution entropy (), were determined using equations (10), (11), and (12), respectively [1,6,14]:
In the above equations was computed from the relation:
where is the Avogadro constant; , and T are respectively the activation energy, Arrhenius–like constant, gas constant, and the temperature in Kelvin; , and are the solvent entropy, solution entropy, relative enthalpy, and the Plank constant, respectively.
3. Results and discussion
3.1. Degradation kinetics
Figure 2 shows how EB-radiation affects gellan when it is in a solution. The observed rapid decrease indicates a strong molar mass reduction up to an absorbed dose of 200 Gy. After that point the no major reduction were seen. This behavior happens because of random chain breaks, which are likely to occur at a steady rate during the fast decline part. According to Figure 2, the rate constant was found to be a 1.03 x 10⁻⁵ Gy⁻¹ and the lifetime was 97 x 103 Gy.
Figure 2.
Progress of E-beam degraded molar mass for gellan samples at 25°C.
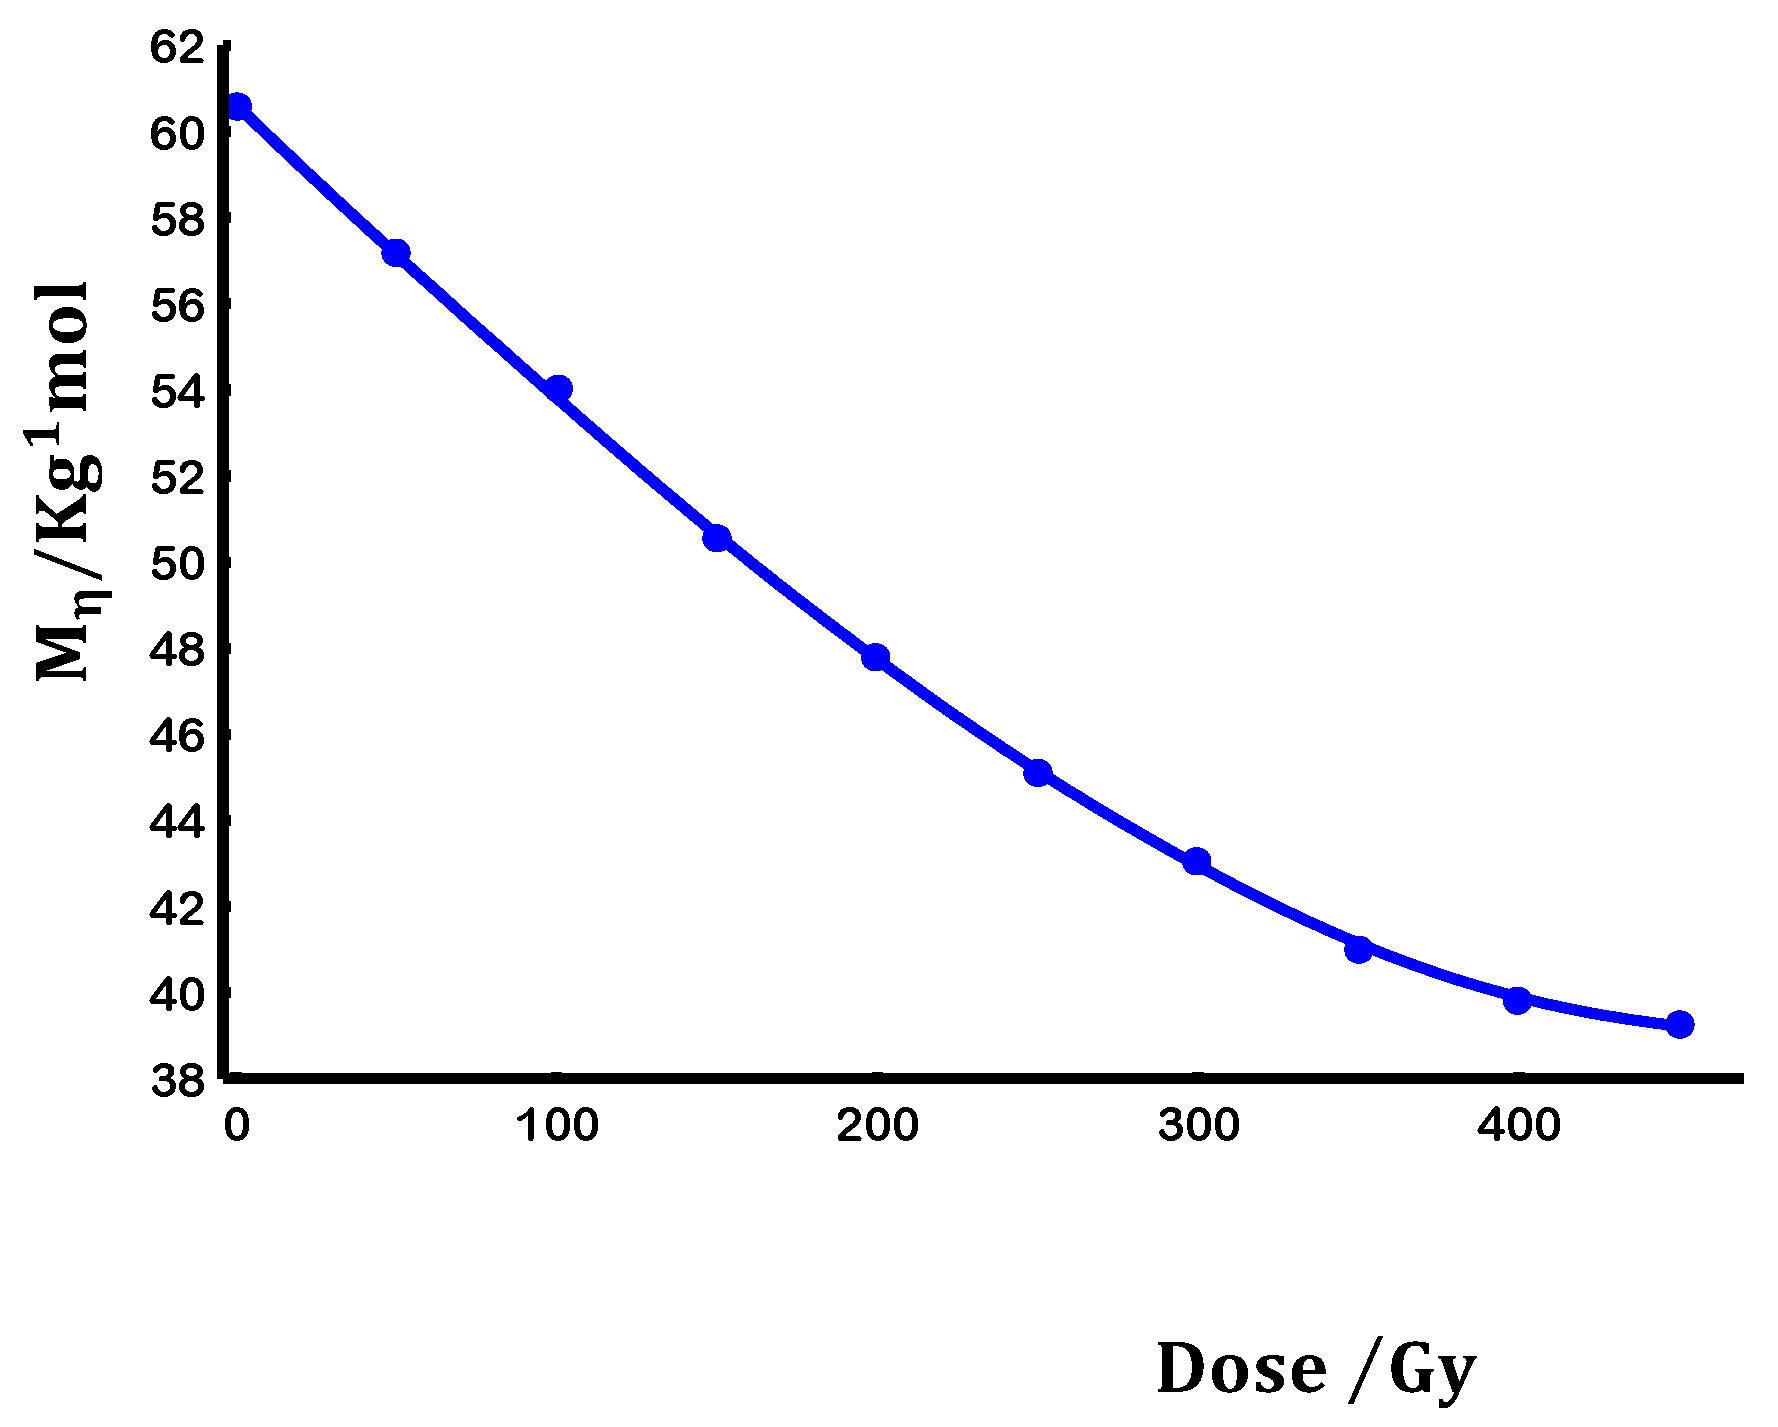
Figure 3.
First order degradation law of native gellan sample by E-beam at 25°C.
3.2. Scaling laws
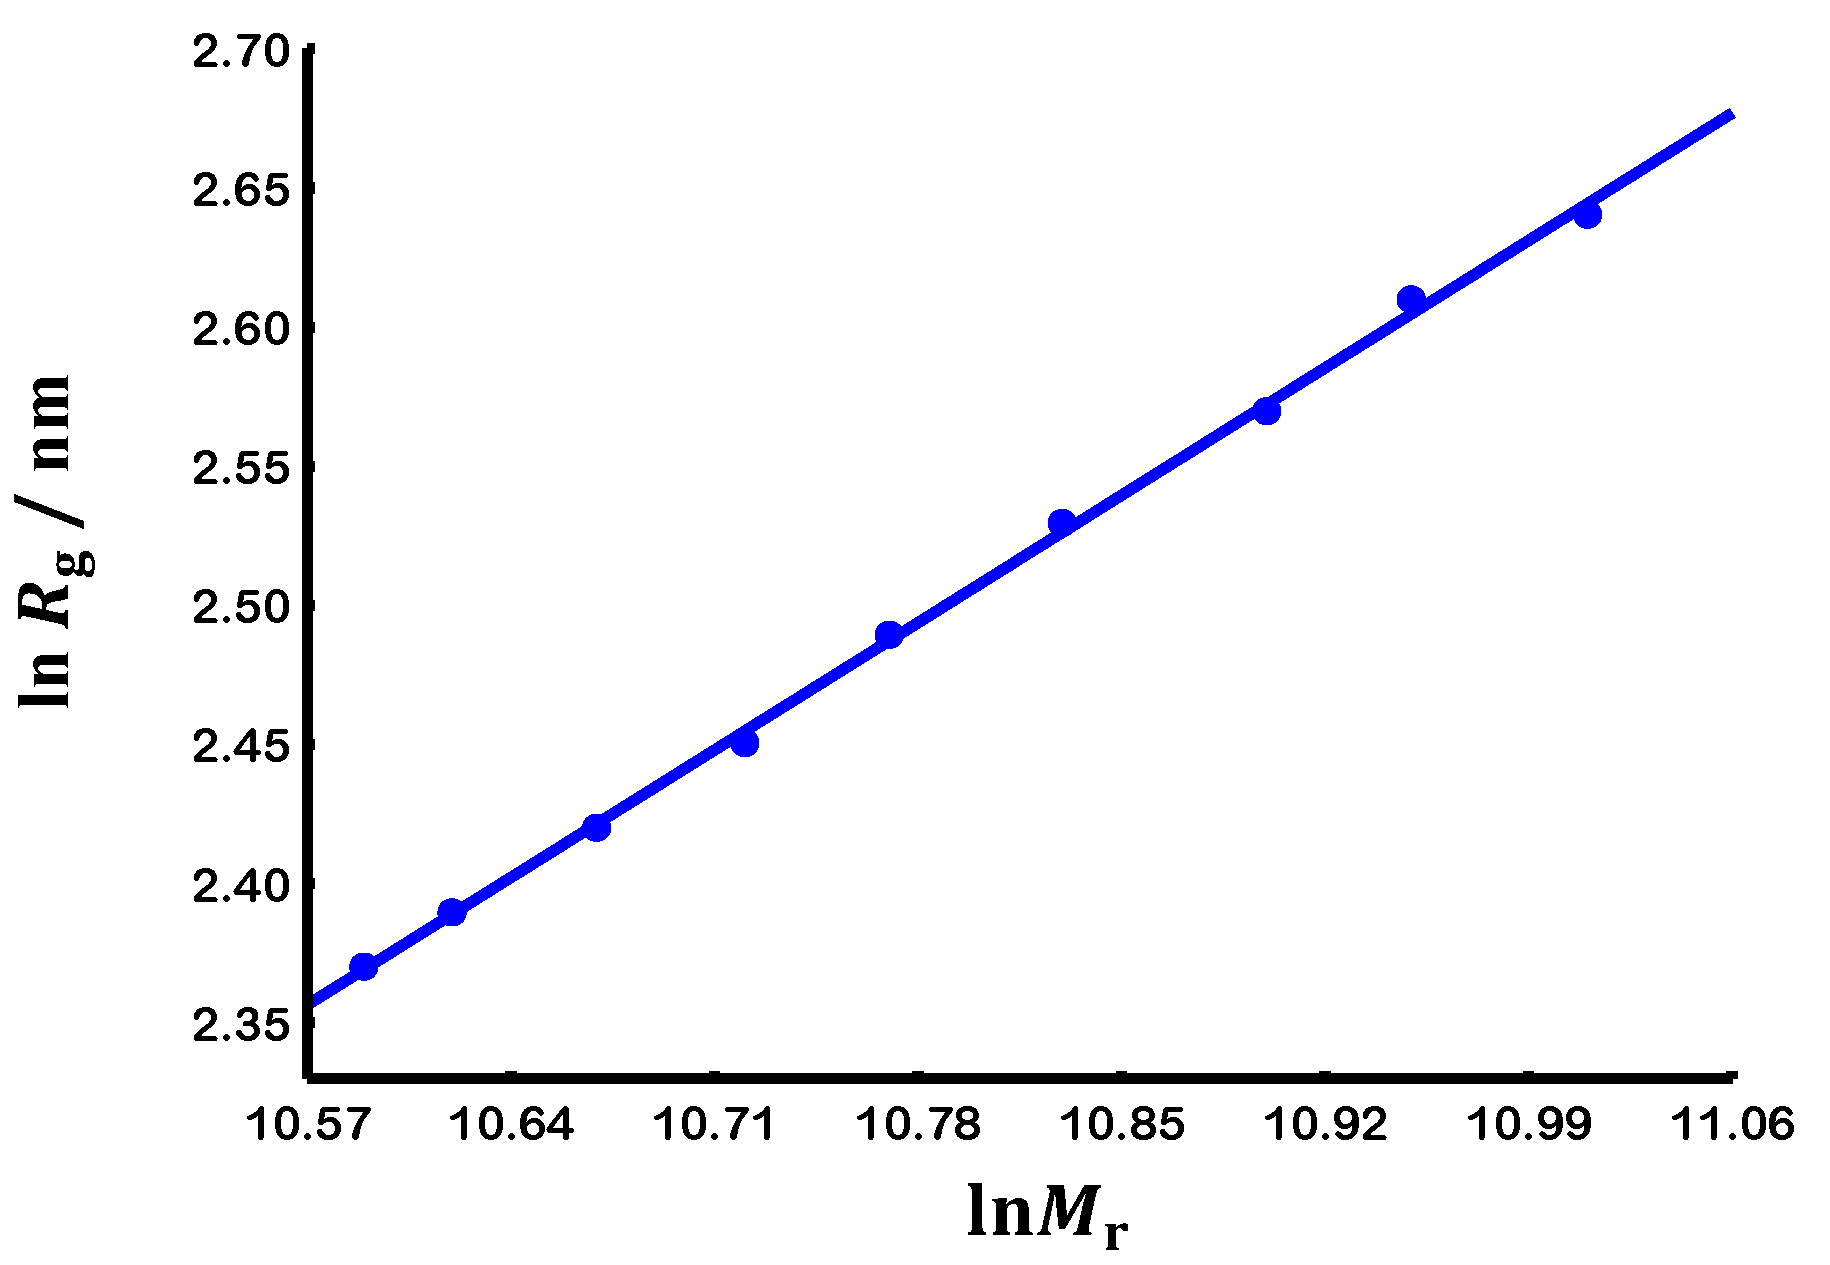
Similar to the degraded molar masses (Ms) shown in Figure 2, Figure 4 illustrates the effect of EB-radiation on the size parameter of the polymer–solvent system. A logarithmic plot in Figure 4 was then utilized to derive the corresponding scaling law.
Figure 4.
Progress of E-beam degraded radius of gyration for gellan samples at 25°C.
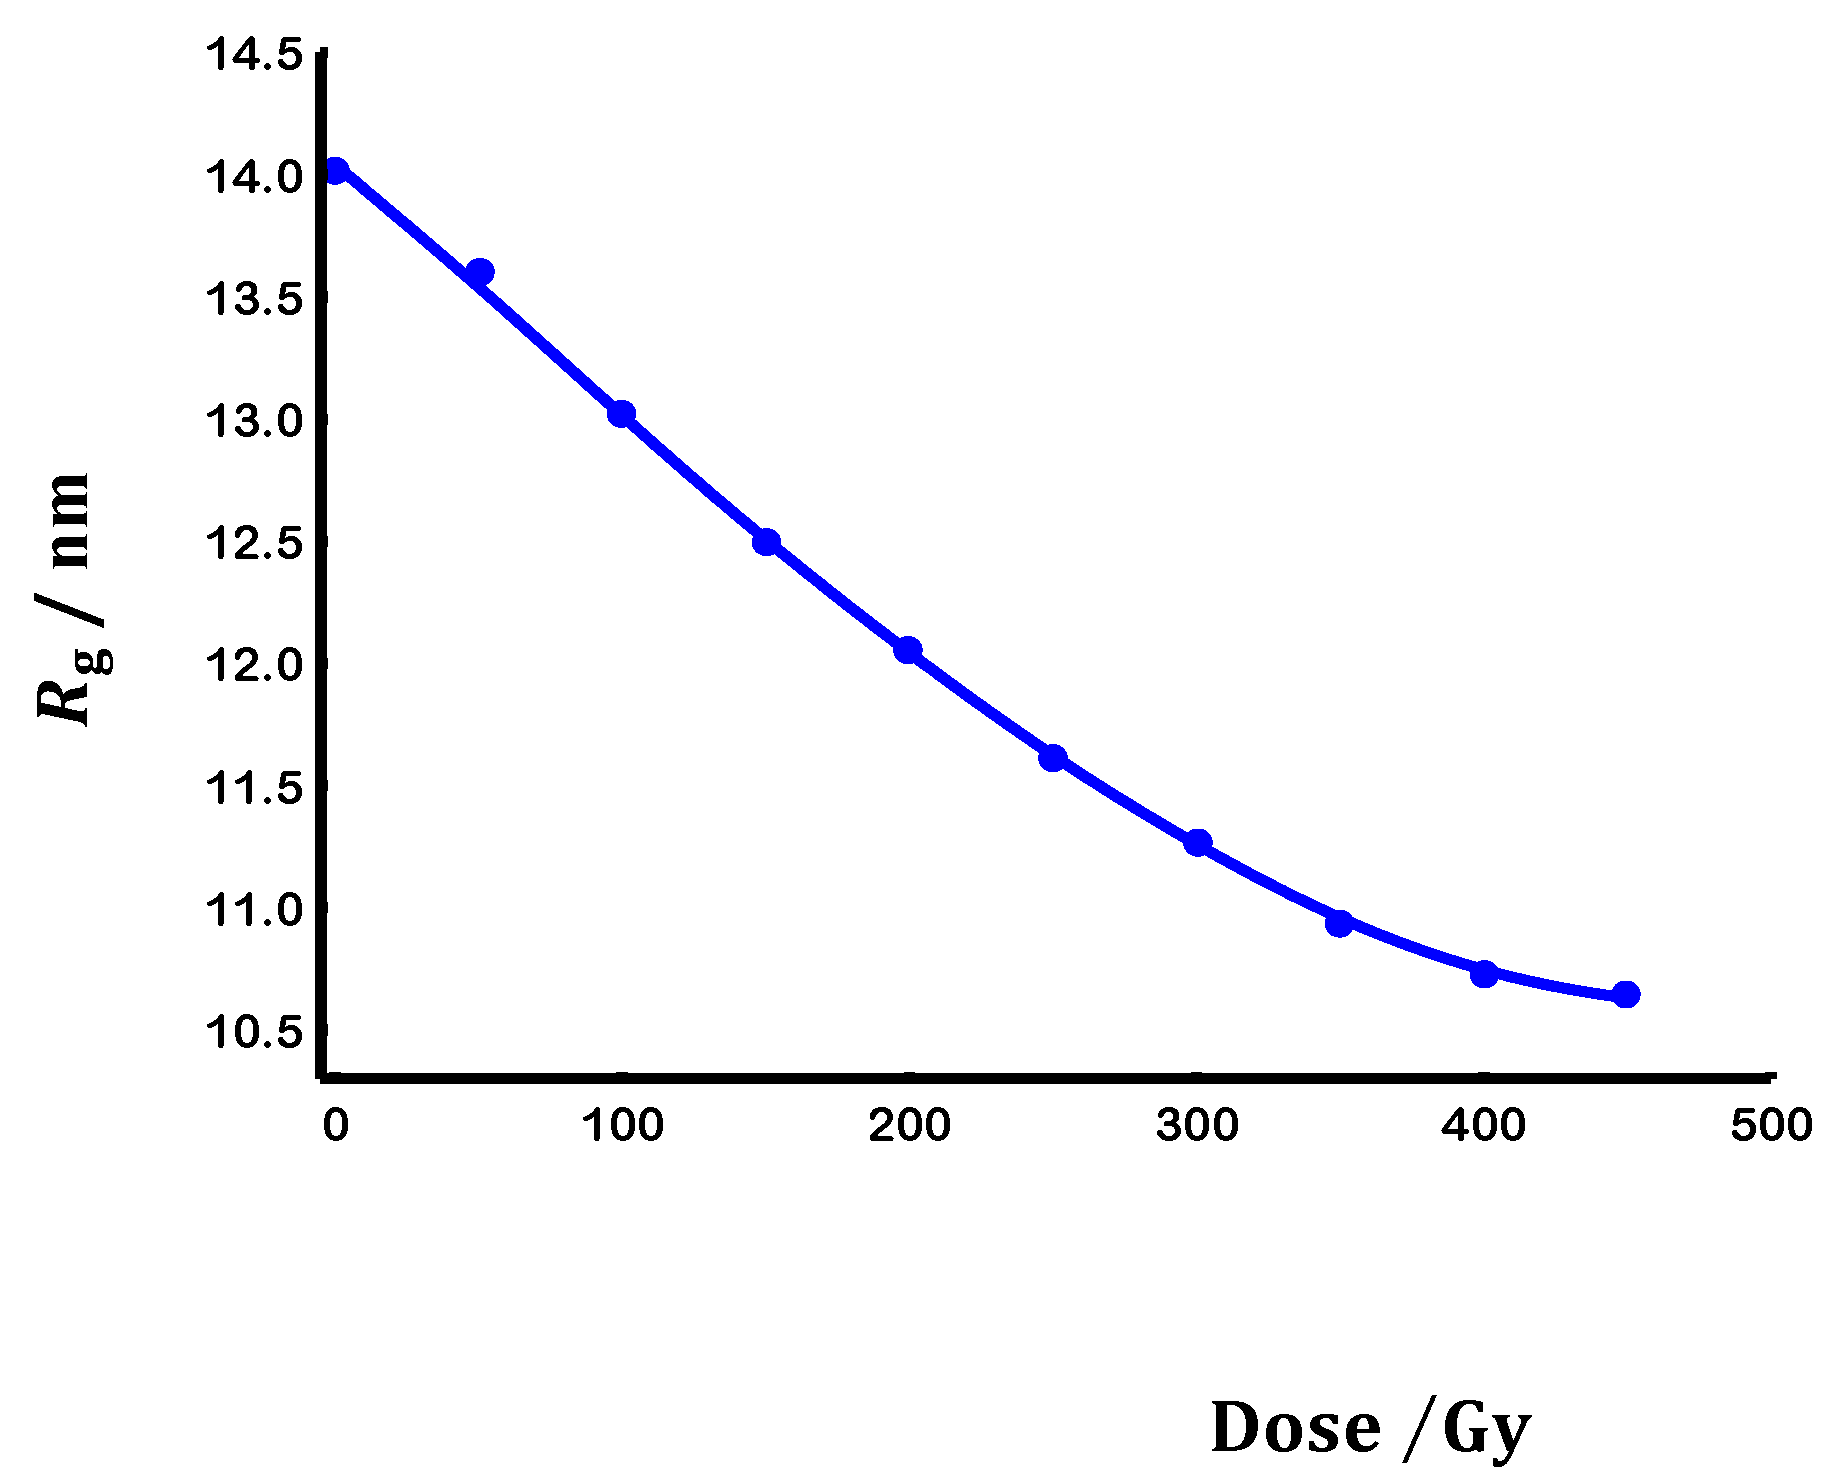
Figure 5.
The logarithmic forms of radius of gyration vs molar mass for gellan samples at 25
3.3. Chain flexibility
3.3.1. Evaluation at non-theta conditions
Figure 8 and Figure 9 illustrate Eq. 10 and 11, respectively, for large (L), medium (M), and small (S) molar masses of diluted gellan in the solvent used. These are represented by the linear plots shown in the figures.
The linear plots in Figure 8 and Figure 9 were utilized to calculate and values, respectively. These values, along with their correspondingvalues, are summarized in Table 2 to assess the effect of EB radiation on them and, consequently, on gellan flexibility.
As in Table 2, EB radiation led to a decrease in Ms and s of gellan in solution, while it increased of gellan in solution. This reduction in caused a decrease in the flexibility of the gellan chain [6,14]. Conversely, the solvent quality (SQ) was enhanced by EB radiation due to the increase in its [6]. However, the ideal random coiled structure of gellan, as defined by it’s, remained unaffected by EB-radiation.
3.3.2. Evaluation at theta conditions
Figure 10 and Figure 11 illustrate the relationships between and with, which represents the chain size, for both native and degraded gellan samples. As expected, these characteristics are influenced by the gellan chain length and related molar mass M, particularly at high values of.
The M dependencies of these characteristics are summarized in Table 3. As shown in Table 3, EB radiation resulted in a reduction in Ms and of the GL samples, while increasing . This increase led to a decrease in CF and an increase in SQ of the gellan samples, as discussed in section 3.3.1. Additionally, the data in Table 3 indicate no deviation from chain ideality, as reflected by, at the molar masses listed in Table 3.
4. Concluding remarks
(1) Viscometry serves as an effective technique for analyzing radiation-modified gellan in diluted aqueous solutions.
(2) Electron beam (E-beam) degradation enables precise control over the applicability of gellan solutions, by modifying the relationship between molar mass and viscosity.
(3) Gellan scaling laws have practical significance for users, allowing them to tailor the polymer’s molar mass to achieve desired properties and vice versa.
(4) Activation parameters, including activation energy and activation entropy, can be utilized to assess the flexibility of both native and modified gellan through relative viscosity measurements.
(5)The flexibility characteristics of native and E-beam-degraded gellan chains, such as end-to-end distance and persistence length, can be determined using the Mark-Houwink relationship under theta conditions.
References
- Kulicke WM, Clasen C. Viscosimetry of polymers and polyelectrolytes. Berlin: Springer; 2004.
- W. B. Jensen, “The Origin of the Term Allotrope,” J. Chem. Educ., 2006, 83, 838-839..
- W. Kuhn, Kolloid-Zeitschrift, 1934, 68, 2–15.
- P. J. Flory, Principles of polymer chemistry, Cornell university press, 1953.
- P. J. Flory, Statistical Mechanics of Chain Molecules, Hanser-Gardner, Ohio, 1989.
- Moore WR. Viscosities of dilute polymer solutions. Progress in polymer science. 1967 Jan 1;1:1-43.
- M. Kurata and Y. Tsunashima, in The Wiley Database of Polymer Properties, 1999.
- R. Lapasin, Rheology of industrial polysaccharides: theory and applications, Springer Science & Business Media, 2012.
- Li S, Xiong Q, Lai X, Li X, Wan M, Zhang J, Yan Y, Cao M, Lu L, Guan J, Zhang D. Molecular modification of polysaccharides and resulting bioactivities. Comprehensive Reviews in Food Science and Food Safety. 2016 Mar;15(2):237-50.
- Al-Assaf S, Coqueret X, Zaman HM, Sen M, Ulański P, editors. The radiation chemistry of polysaccharides. Vienna, Austria: International Atomic Energy Agency; 2016.
- Hamdani AM, Wani IA, Gani A, Bhat NA, Masoodi FA. Effect of gamma irradiation on physicochemical, structural and rheological properties of plant exudate gums. Innovative Food Science & Emerging Technologies. 2017 Dec 1;44:74-82.
- N. L. del Mastro, in Radiation-Processed Polysaccharides: Emerging Roles in Agriculture, eds. M. Naeem, T. Aftab and M. M. A. Khan, Academic Press, 2022, pp. 91–106.
- Krigbaum WR, Flory PJ. Statistical Mechanics of Dilute Polymer Solutions. IV. Variation of the Osmotic Second Coefficient with Molecular Weight1a, b. Journal of the american chemical society. 1953 Apr;75(8):1775-84.
- Kauzmann W, Eyring H. The viscous flow of large molecules. Journal of the American Chemical Society. 1940 Nov;62(11):3113-25.
- Kratky O, Porod G. Röntgenuntersuchung gelöster fadenmoleküle. Recueil des Travaux Chimiques des Pays-Bas. 1949;68(12):1106-22.
- Prajapati VD, Jani GK, Zala BS, Khutliwala TA. An insight into the emerging exopolysaccharide gellan gum as a novel polymer. Carbohydrate polymers. 2013 Apr 2;93(2):670-8.
- Lalebeigi F, Alimohamadi A, Afarin S, Aliabadi HA, Mahdavi M, Farahbakhshpour F, Hashemiaval N, Khandani KK, Eivazzadeh-Keihan R, Maleki A. Recent advances on biomedical applications of gellan gum: A review. Carbohydrate Polymers. 2024 Jun 15;334:122008.
- Dreveton E, Monot F, Lecourtier J, Ballerini D, Choplin L. Influence of fermentation hydrodynamics on gellan gum physico-chemical characteristics. Journal of fermentation and bioengineering. 1996 Jan 1;82(3):272-6.
- Kang D, Cai Z, Wei Y, Zhang H. Structure and chain conformation characteristics of high acyl gellan gum polysaccharide in DMSO with sodium nitrate. Polymer. 2017 Oct 16;128:147-58.
- Gao M, Li H, Yang T, Li Z, Hu X, Wang Z, Jiang Y, Zhu L, Zhan X. Production of prebiotic gellan oligosaccharides based on the irradiation treatment and acid hydrolysis of gellan gum. Carbohydrate polymers. 2022 Mar 1;279:119007.
- Solomon OF, Ciutǎ IZ. Détermination de la viscosité intrinsèque de solutions de polymères par une simple détermination de la viscosité. Journal of applied polymer science. 1962 Nov;6(24):683-6.
- Mark H. Über die entstehung und eigenschaften hoch polymer festkörper. In: Sanger R. editor. Der festekörper. Leipzig: Hirzel; 1938. p. 65-104.
- Houwink R. Zusammenhang zwischen viscosimetrisch und osmotisch bestimmten Polymerisationsgraden bei Hochpolymeren. J. Prakt. Chem. 1940;157(1-3):15–18.
- Şen M, Taşkın P, Güven O. Effects of polysaccharide structural parameters on radiation-induced degradation. Hacettepe Journal of Biology and Chemistry. 2014;42(1):9-21.
- Qian JW, Wang ML, Han DL, Cheng RS. A novel method for estimating unperturbed dimension [η] θ of polymer from the measurement of its [η] in a non-theta solvent. European polymer journal. 2001 Jul 1;37(7):1403-7.
- Graessley WW. Polymer chain dimensions and the dependence of viscoelastic properties on concentration, molecular weight and solvent power. Polymer. 1980 Mar 1;21(3):258-62.
Figure 1.
Chemical structure of gellan gum.
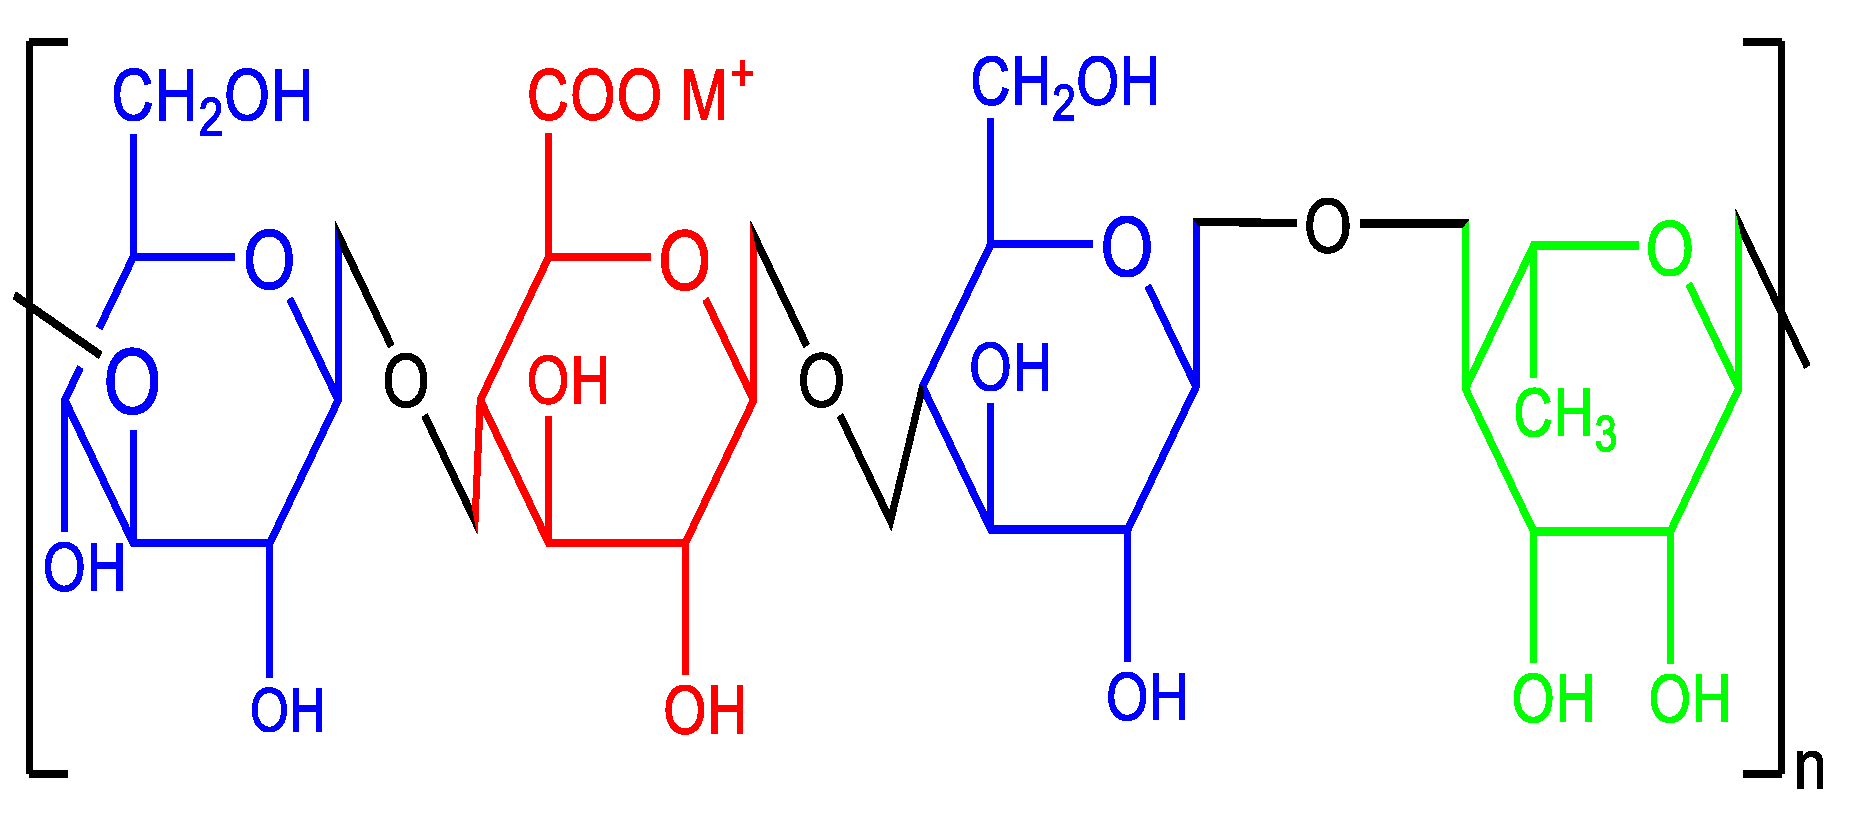
Figure 6.
Progress of E-beam degraded second virial coefficient for gellan samples at 25°C.
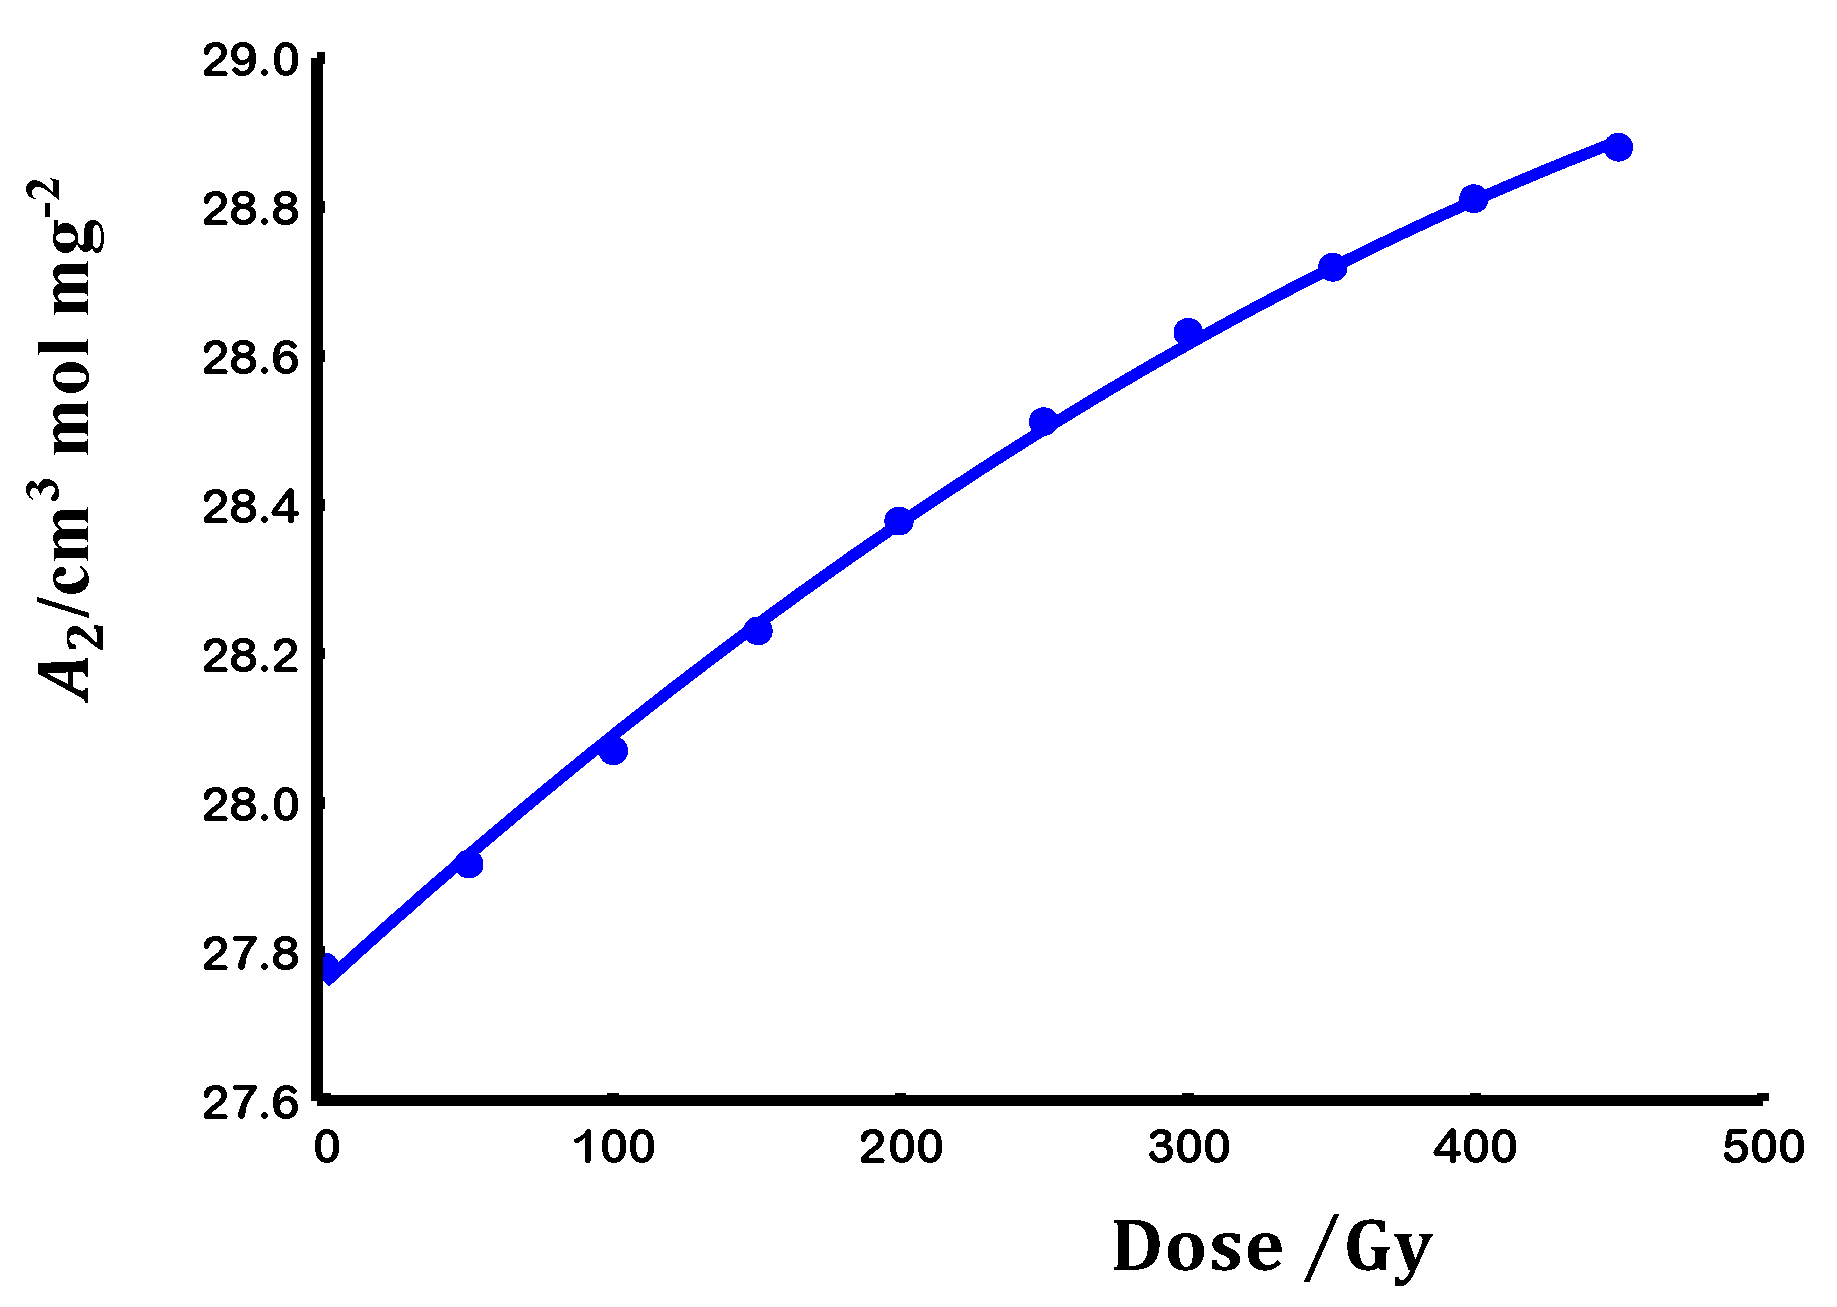
Figure 7.
The logarithmic form of second virial coefficient vs molar mass for gellan samples at 25

Figure 8.
Arrhenius like plots of large, medium and small size for gellan samples at different temperature.
Figure 8.
Arrhenius like plots of large, medium and small size for gellan samples at different temperature.
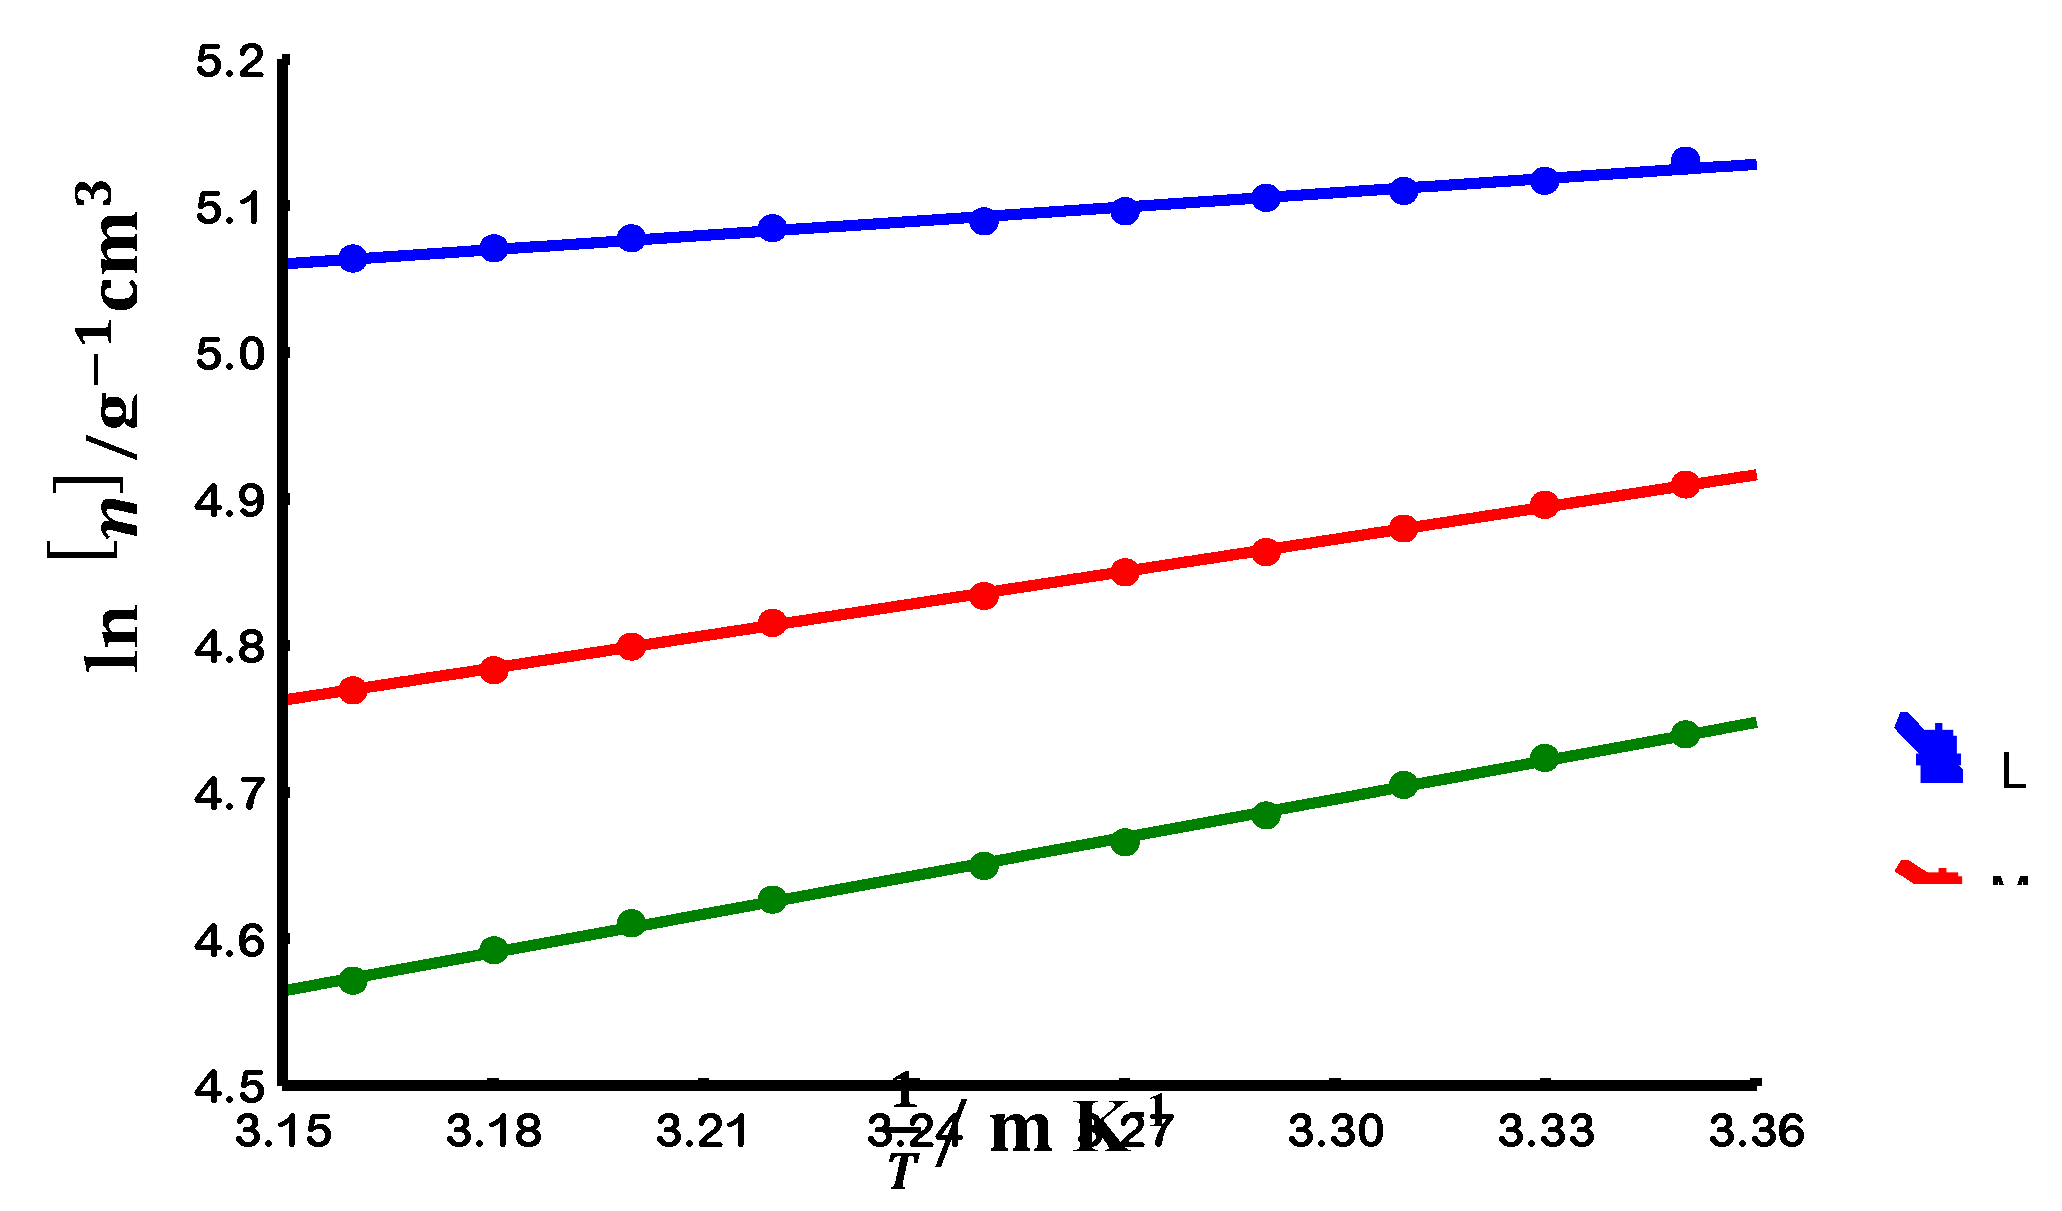
Figure 9.
Kauzmann- Eyring model plots of large and medium and small size for gellan samples at different temperature.
Figure 9.
Kauzmann- Eyring model plots of large and medium and small size for gellan samples at different temperature.
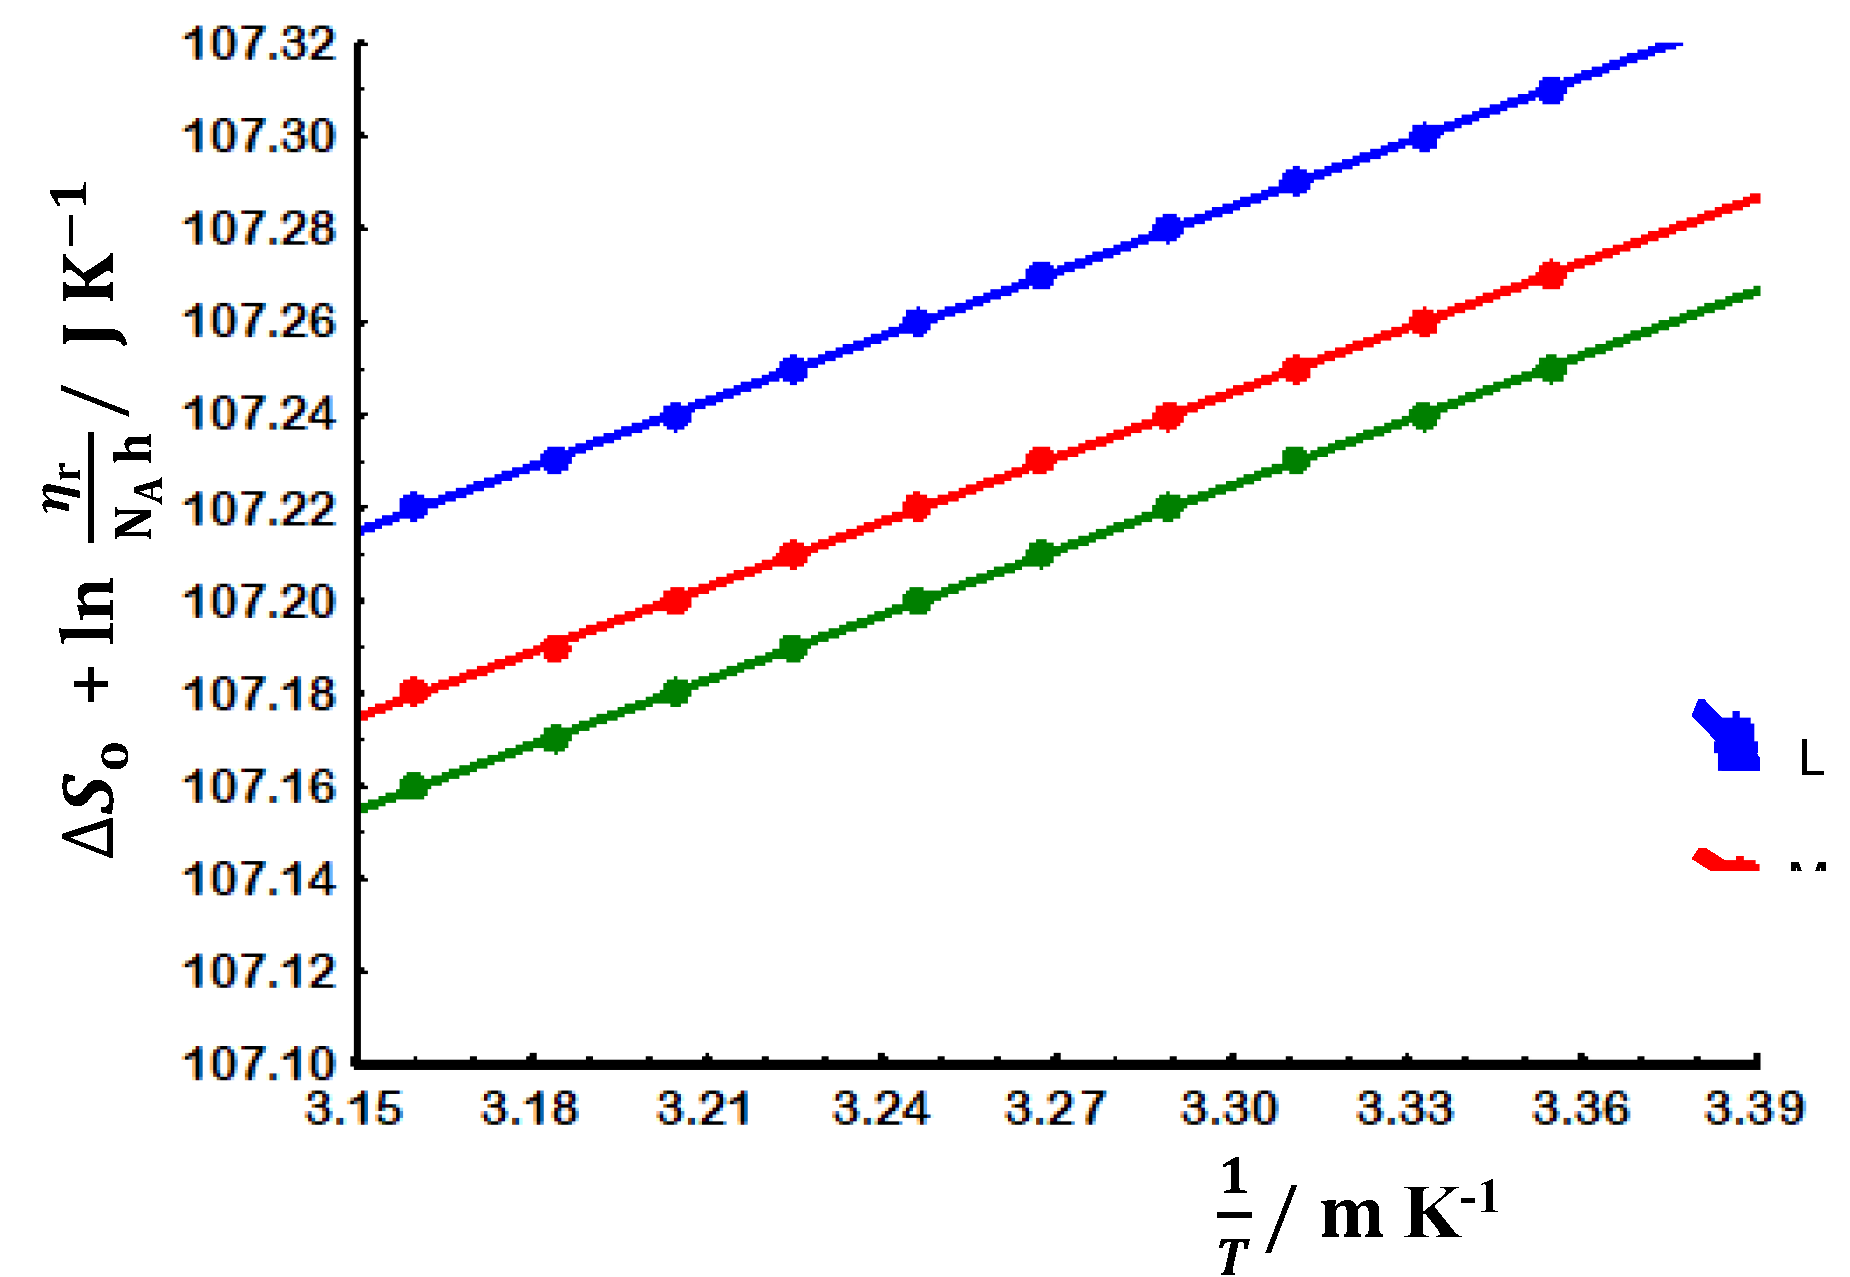
Figure 10.
End to end distance vs characteristic ratio for gellan samples at 25°C.

Figure 11.
End to end distance vs persistence length for gellan samples at 25°C.
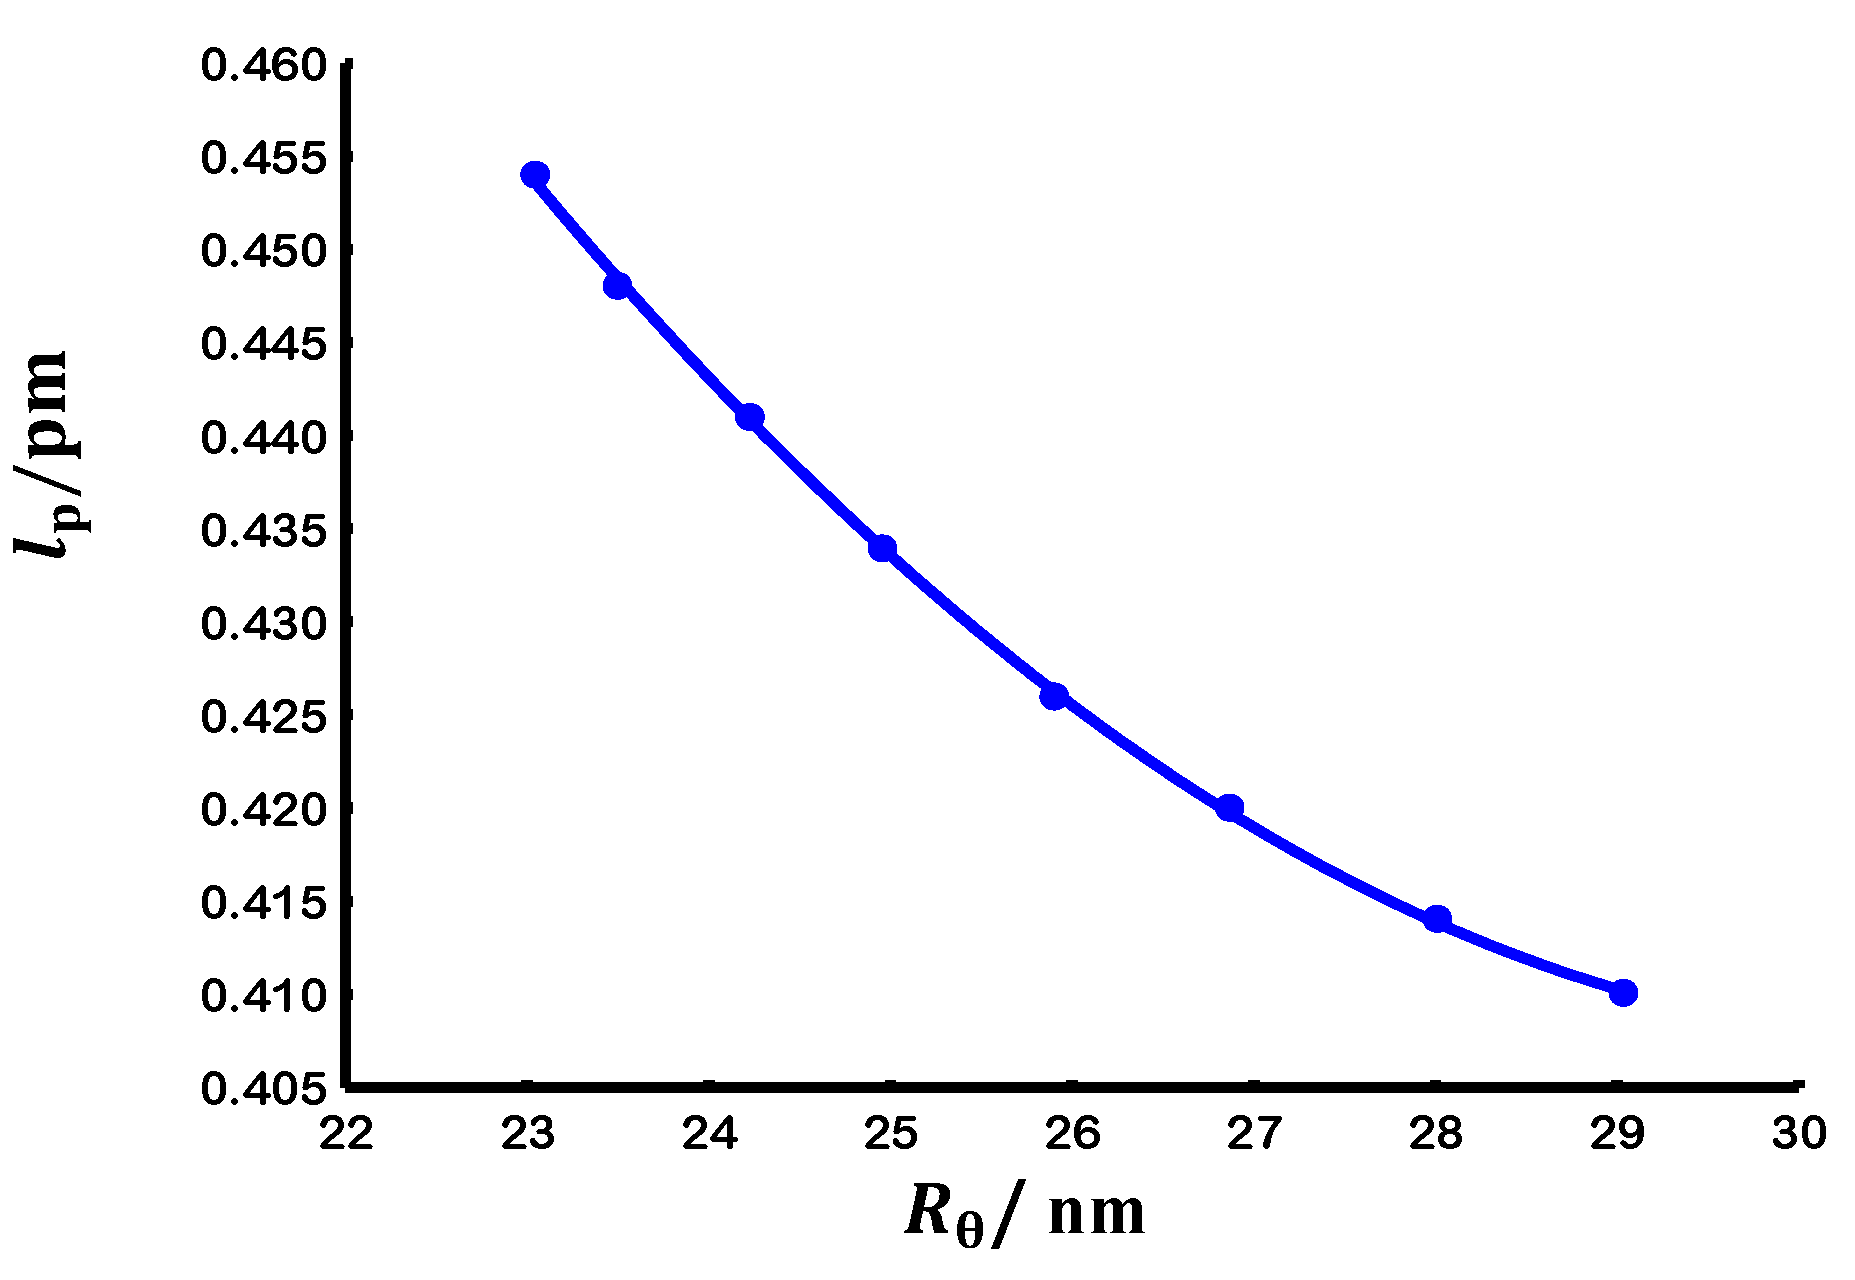

Table 1.
Scaling coefficients of gellan samples at 25°C.
| Coefficient | Value |
| a | 0.80 |
| 0.62 | |
| 0.15 |
Table 2.
Chain characteristics of gellan samples under non-theta conditions.
| M | |||
| L | 2.66 | -879 | 1.19 |
| M | 2.16 | -878 | 1.19 |
| S | 1.74 | -877 | 1.19 |
Table 3.
Chain characteristics of gellan samples under theta conditions.
| M | |||
| L | 30.15 | 5.69 | 0.40 |
| M | 25.91 | 6.08 | 0.43 |
| S | 23.05 | 6.40 | 0.45 |
Disclaimer/Publisher’s Note: The statements, opinions and data contained in all publications are solely those of the individual author(s) and contributor(s) and not of MDPI and/or the editor(s). MDPI and/or the editor(s) disclaim responsibility for any injury to people or property resulting from any ideas, methods, instructions or products referred to in the content. |
© 2025 by the authors. Licensee MDPI, Basel, Switzerland. This article is an open access article distributed under the terms and conditions of the Creative Commons Attribution (CC BY) license (http://creativecommons.org/licenses/by/4.0/).
Copyright: This open access article is published under a Creative Commons CC BY 4.0 license, which permit the free download, distribution, and reuse, provided that the author and preprint are cited in any reuse.


