
Submitted:
29 July 2025
Posted:
30 July 2025
You are already at the latest version
Abstract
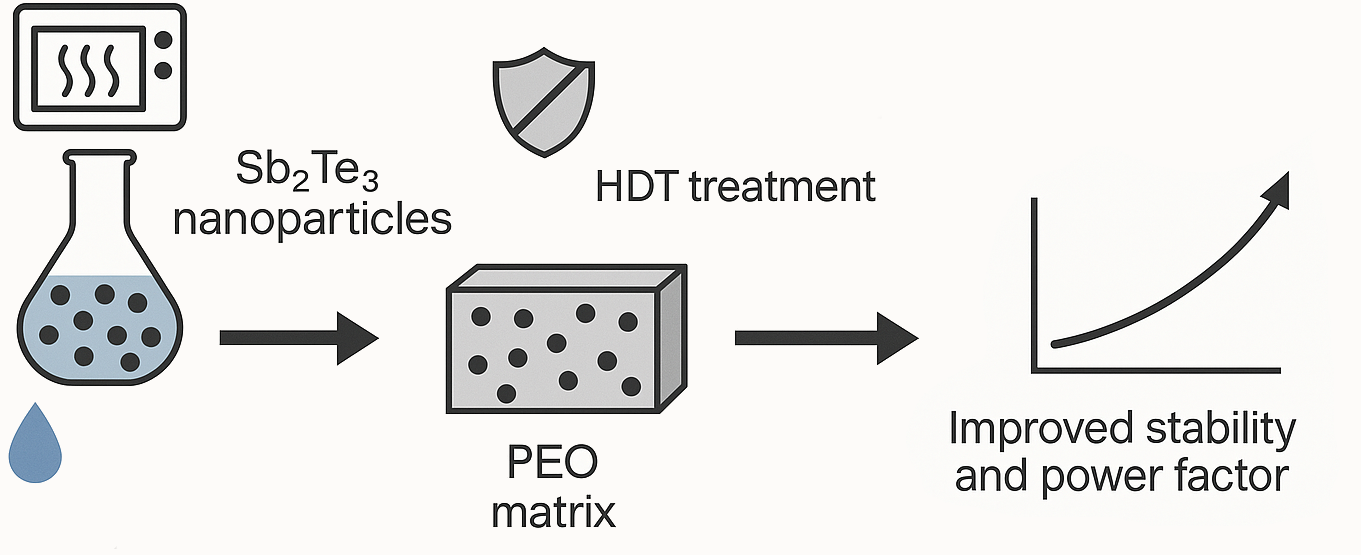
This study explores the development of a water-based hybrid thermoelectric (TE) material composed of Sb₂Te₃ nanoparticles (NPs) synthesized via solution chemistry and microwave-assisted heating, and polyethylene oxide (PEO). X-ray diffraction confirmed the purity and quality of the Sb₂Te₃ NPs. Key properties, including the Seebeck coefficient (S), electrical conductivity (s), power factor (PF), and long-term stability were studied. X-ray photoelectron spectroscopy (XPS) analysis revealed that exposure to water and oxygen leads to NP oxidation, which can be partially mitigated by hydrochloric acid (HCl) treatment, though this does not halt ongoing oxidation. Scanning electron microscopy (SEM) images displayed a percolation network of NPs within the PEO matrix. While the initial s was high, a decline occurred over eight weeks, resulting in similar conductivity among all samples. The effect of surface treatments, such as hexane dithiol (HDT), was evaluated and found to enhance long-term stability. The results highlight both the challenges and potential of Sb₂Te₃/PEO hybrids for TE applications, especially regarding oxidation and durability, and underscore the need for improved synthesis and treatment techniques to optimize their performance. This study provides valuable insights for the design of next-generation flexible TE materials and emphasizes the importance of surface chemistry control in polymer-inorganic nanocomposites.
Keywords:
thermoelectric materials
; Sb₂Te₃ nanoparticles
; polyethylene oxide (PEO) composites
1. Introduction
As fossil resource reserves are being depleted and the risks of climate change are increasing, new renewable energy sources are needed. The most popular renewable energy sources are biomass, hydropower, solar panels, and wind turbines [1]. Waste heat is a form of thermal energy and is abundant but often less prevalent and neglected. In manufacturing industries, temperatures exceeding 1000°C are frequently achieved. It has been reported that up to 24% of waste heat energy can be recovered during the steelmaking process [2]. However, most wasted heat energy occurs below 150°C [3]. Even low-temperature sources like the human body could be used to generate electrical energy [4]. There are many different sources of high and low temperature waste heat thermal energy. Given the growing energy demand, it is crucial to utilize all available renewable energy sources to ensure opportunities for sustainable development. The thermoelectric (TE) effect can be used to convert thermal energy to electricity without any moving parts. The efficiency of TE materials is characterized by the figure of merit
where is the Seebeck coefficient, is the specific electrical conductivity, is the thermal conductivity, and T is the temperature. The multiplication of S2 and s defines the power factor (PF), a common parameter for assessing thermoelectric efficiency in thin films, especially since measuring thermal conductivity in thin films can be challenging. A high Seebeck coefficient, high electrical conductivity, but low thermal conductivity, is desired to obtain an effective TE material.
The specific electrical conductivity can be expressed as a product of three components,
where e is the elementary charge, is the charge carrier mobility, and n is the charge carrier concentration, which also affects the S. As the charge carrier concentration increases, the S decreases [5]. Therefore, the optimal charge carrier concentration for TE materials is 1018 to 1020 cm-3 [6,7]. Consequently, achieving the highest possible charge carrier mobility is essential for maximizing both the figure of merit and the specific electrical conductivity. Several factors affect the mobility of charge carriers, such as material composition, doping level, temperature, nano-structuring, and defects and impurities. For organic materials, molecular structure, material purity, and the concentration of defects and traps play significant roles [8,9]. For example, oxygen in polymers can lead to a reduction in charge carrier mobility [10]. Additionally, oxidation-induced oxide layers on the metal powder particle surface can significantly reduce electrical conductivity [11].
There is active research being conducted on hybrid TE materials [3]. TE composites consist of TE nanoparticles within an organic matrix. Various organic materials, including conducting or insulating polymers and charge transport materials, can be used. For this purpose, various polymers have been studied, such as PANI (polyaniline) [12], P3HT (poly(3-hexylthiophene-2,5-diyl)) [13], PEDOT (poly(3,4-ethylenedioxythiophene)) [14], and PMMA (poly(methyl methacrylate)) [15,16,17]. Hybrid materials have several advantages over traditional TE materials, such as mechanical flexibility, solution processability [18], reduced thermal conductivity, and increased S [19,20,21]. Additionally, composite materials possess reduced density, decreased cost, and environmental impact [22]. While composite materials offer numerous advantages, their performance can be hindered by certain challenges. These materials, composed of NPs, contain numerous interfaces between components. Consequently, optimizing interfacial transport is essential to maintain charge carrier mobility within the nanostructure of composite materials.
A small barrier at the NP and polymer matrix interface can potentially enhance the S by filtering low-energy charge carriers. Ideally, the barrier height should be within the range of 0.04 to 0.10 eV to achieve high electrical conductivity [23]. Nonetheless, empirical observations indicate that the energy filtering effect is minimal [24]. The oxidation of TE NPs may introduce an interfacial barrier impacting charge transfer [23]. Effective control of oxidation in hybrid materials is crucial for improving interfacial transport within these materials [25]. Consequently, increased charge carrier mobility has led to significant improvements in both the S and electrical conductivity [26].
Sb2Te3 is one of the best p-type TE materials with a high S and electrical conductivity at room temperature. Sb2Te3 NPs can be synthesized by various methods, such as thermal decomposition, solvothermal, and hydrothermal synthesis [19,27,28,29]. With these methods, it is possible to fine-tune the morphology of the NPs; however, the synthesis times are lengthy, taking up to 12 hours. An alternative method is microwave-assisted heating, which can produce NPs within minutes [30,31,32,33,34,35]. During the preparation of the hybrid material and the synthesis of the TE material, the NPs are exposed to various solvents and high temperatures. This may lead to oxide formation on the surface of the nanostructures, which can impact the properties of the composite materials.
A detailed study on the bulk Sb2Te3 oxidation process was conducted by Volykhhov et al. [36]. The authors have shown that oxidation is a 3-step process. It starts with molecular adsorption, followed by surface reaction and oxide layer growth. Upon oxidation, the Sb-to-Te ratio changes to approximately 1:1 at the surface, resulting in the formation of a Sb2Te2O7 layer. While oxygen is directly responsible for the oxidation of Sb2Te3, a separate effect is caused by water. Water may cause Sb leaching and enrich the surface with Te. Additionally, it may accelerate the rate of oxidation [36]. Oxidation has also been observed for Sb2Te3 NPs synthesized with microwave-assisted thermolysis. The porous films have a high interface surface between the TE material and voids, which causes charge carrier scattering and trapping [37]. A study by Fang et al. [38] has demonstrated a promising technique for removing surface oxides on Sb2Te3 thin films. Results show that the material can be restored to its original condition by using a 1% hydrochloric acid (HCl) solution etch to remove oxides, followed by annealing at 150°C to reduce the increased Te concentration at the surface [38].
Hybrid TE materials are environmentally friendly, but their manufacturing often involves toxic solvents. There's a lack of research on eco-friendly, water-based alternatives. This study presents a hybrid TE material made from a water-soluble polymer, specifically PEO (polyethylene oxide), combined with Sb2Te3 NPs produced through solution chemistry using microwave-assisted heating.
2. Materials and Methods
2.1. Synthesis of Sb2Te3 Nanoparticles
The chemicals used in the typical synthesis are SbCl3 (99.95%), Te powder (99.8%), ethylene glycol (EG, 99%), thioglycolic acid (TGA, 98%), and tri-octylphosphine (TOP, 90%), thioglycolic acid (TGA, 98%). All the chemicals were purchased from Sigma Aldrich and used directly without any purification.
The synthesis process was carried out using microwave-assisted thermolysis in a SynthWAVE–Milestone system (1500 watts) equipped with a high-pressure rotor capable of handling multiple vessels. This method was conducted in a 70 mL Teflon container across four parallel reaction setups, all of which were run simultaneously. The synthesis began with the creation of two precursor solutions. First, a Te precursor was prepared by heating a mixture consisting of 3.7 mmol of Te and 10 mL of TOP on a hot plate for 10 minutes at 200 °C, with continuous stirring. The Te-TOP complex exhibited an olive-yellowish color before being allowed to cool. 2.5 mmol of SbCl3 was dissolved in 20 mL of ethylene glycol for the Sb precursor. The ratio of the binary components can be readily adjusted by changing SbCl3 with an equivalent quantity of Te precursors. 1 mL of TGA was added as a directing agent into the dissolved precursors and stirred for 10 minutes to achieve a uniform mixture. The Te-TOP complex and the Sb-EG solutions were then combined and placed in a 70 mL Teflon vessel, which underwent microwave processing for 2 minutes at 220 °C under 40 mbar of nitrogen gas and with constant stirring. The particles were washed with isopropanol and acetone several times and dried in an oven at 80°C overnight.
2.2. Sample Preparation
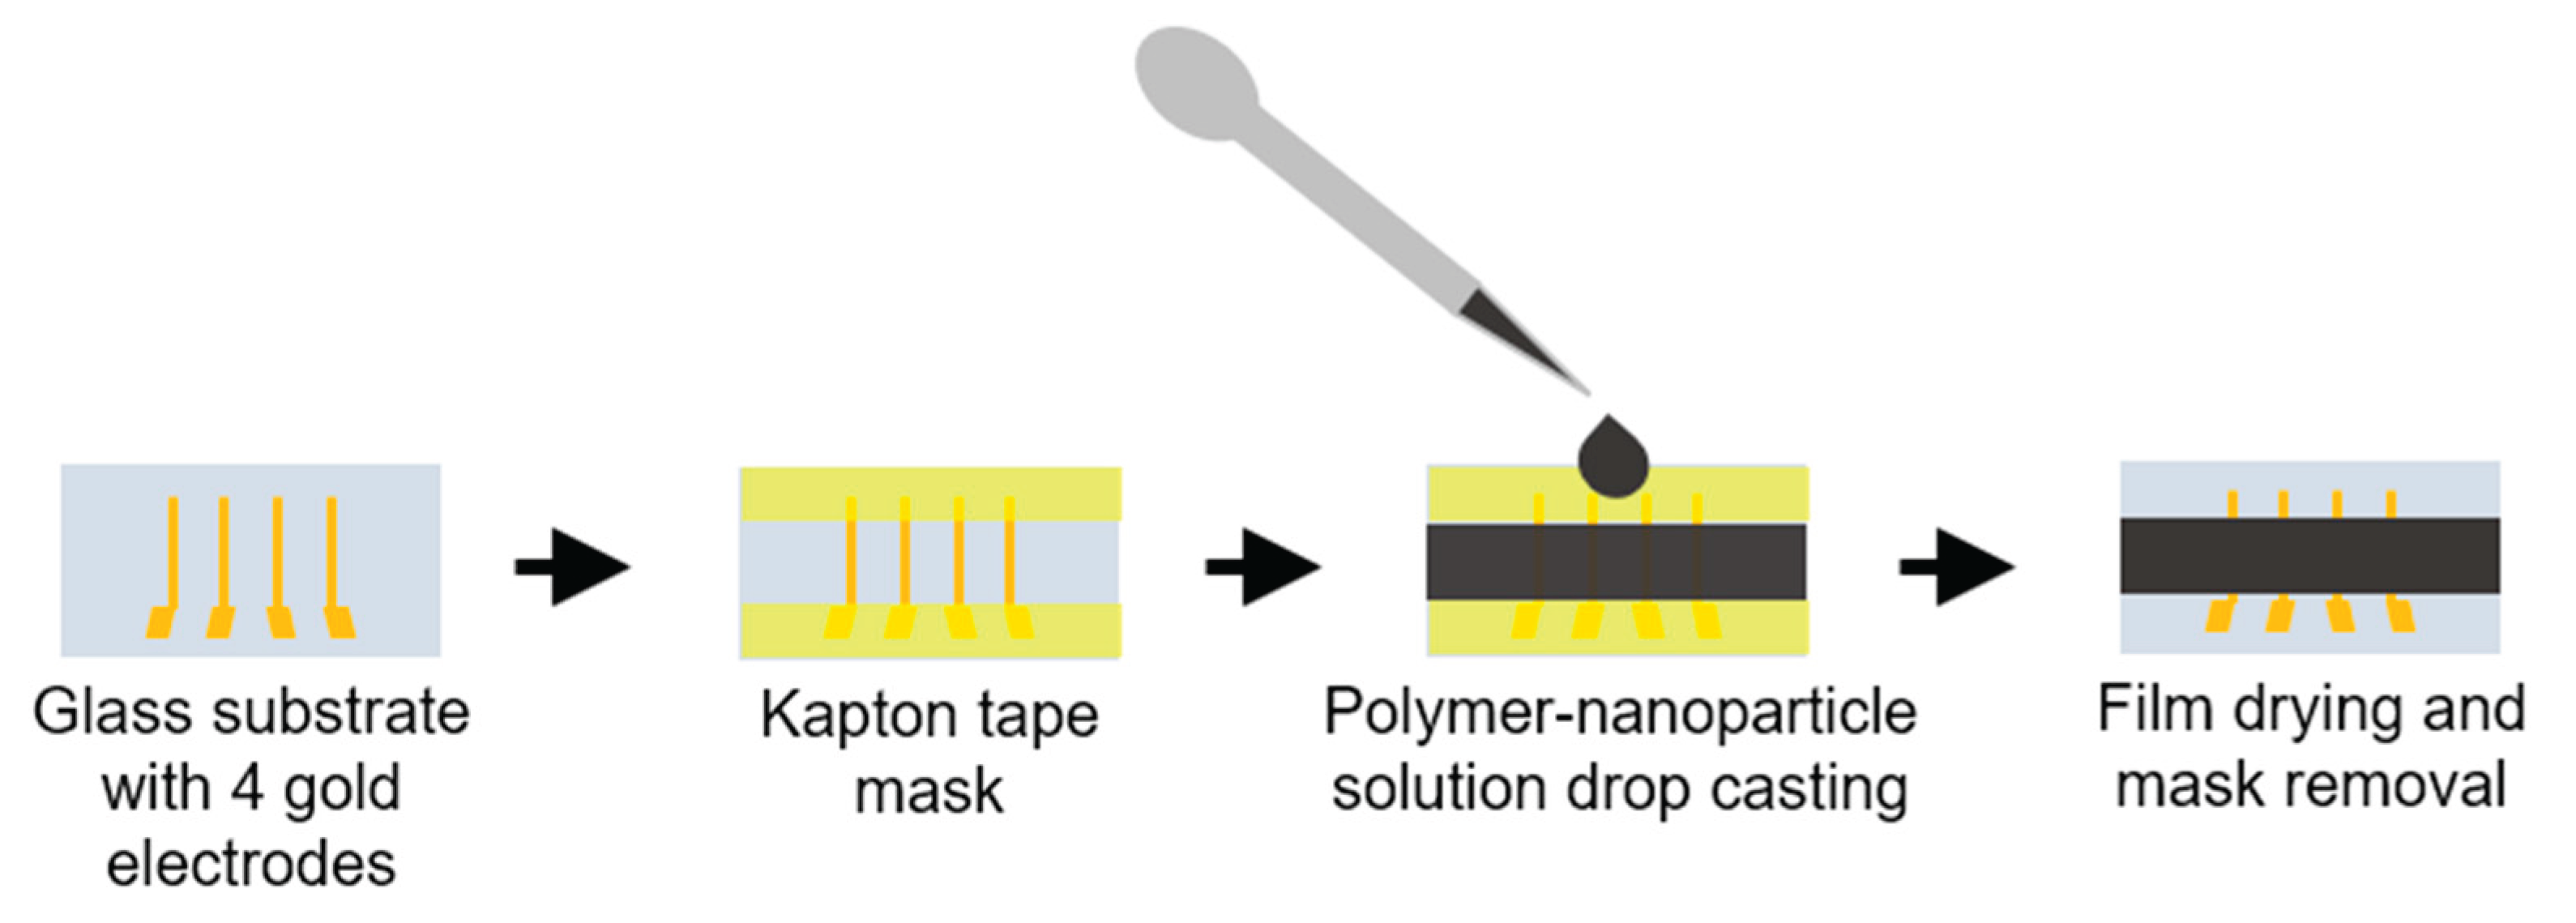
The samples were made on 25x13 mm glass substrates. Substrates were cleaned with acetone, detergent, and isopropanol, followed by plasma cleaning. 10 nm of the chrome adhesion layer and 100 nm of the gold layer were thermally evaporated in a vacuum (Edwards Auto 306) to create 4 gold electrodes 2 mm apart. Substrates were stored in isopropanol after electrode deposition.
Three different sample types, with 80% nanoparticle and 20% polymer concentrations, were made using a mortar. 7.5 mg of PEO (Polysciences, MW = 1,000,000) was dissolved in 200 µl of deionized water for the first sample. Afterwards, 30 mg of Sb2Te3 NPs were added and mixed until a thick, homogeneous paste was obtained. For the second type of samples, 37% HCl (Sigma Aldrich, 1003172500) was diluted to a 5% concentration and used instead of the deionized water. For the third type of samples, nanoparticles were ultrasonicated in the 5% HCl solution for 5 minutes. The treated NPs were rinsed with isopropanol 3 times after removing the excess solvent, and then the particles were dried on a hot plate at 60°C for 30 minutes. Slurry preparation was then repeated the same way as for the first type samples. The TE slurry was drop-cast onto glass substrates with electrodes. The samples were dried on a hot plate at 50°C and then annealed at 90°C for 10 minutes. The two-stage drying process was used to prevent the formation of cracks and defects in the films.
Figure 1.
Schematic drawing of the sample, and film preparation process.
2.3. Sample Characterization
X-ray powder diffraction (XRD) analysis was performed using a MiniFlex X-ray diffractometer, equipped with a copper anode (Cu-Kα1 radiation, λ = 1.5406 Å), to identify the crystalline phase of the synthesized material. A step size of (2θ) = 0.2° and a scan speed of 0.1°/s were set in the continuous scan mode. The crystalline phases of the samples were determined via High-score Pro software.
The sample morphology and microstructure were studied using a scanning electron microscope SEM/FIB Tescan Lyra 3 at an electron accelerating voltage of 20kV. A secondary electron detector was used.
Current-voltage characteristic measurements were carried out using the 4-point probe method with a Keithley SMU 2450 source meter unit. Silver paste was applied between the spring-loaded probes and gold electrodes to improve electrical contact. Measurement currents were set in the range of 10-100 µA. Each measurement was repeated 3 times. Thin film thicknesses were determined with a profilometer Veeco Dektak 150, by measuring the complete thin film profile between the two central electrodes. Thin film thicknesses were in the range from 137 µm to 238 µm. Specific electrical conductivities were calculated from the obtained data.
Seebeck coefficient was measured by placing the samples on 2 Peltier elements at an initial temperature of 20°C. Both Peltier elements were gradually heated and cooled, reaching a maximum temperature difference of 4°C. Heating and cooling were then reversed 3 times, resulting in 4 Seebeck coefficient measurements. The slope factors from measured ΔT/U slopes correspond to the Seebeck coefficients. The Peltier elements were controlled with a temperature controller (Stanford Research Systems PTC10), and the TE voltage was measured with a nanovoltmeter (Keithley 2182A). Two external K-type thermocouples were used to measure the actual temperature difference between electrodes. A more detailed setup description is given in [39].
Electrical conductivities and Seebeck coefficients were remeasured once a week for 8 weeks to study the ageing effect of the materials.
X-ray photoelectron spectroscopy (XPS) was used to study sample oxidation and HCl content. The measurements were carried out with the photoelectron spectrometer ThermoFisher ESCLAB Xi. The first measurement was performed on the unaffected sample surface. Sample surfaces were then etched using a monatomic argon ion beam with an energy of 2000 eV for 30 seconds. The etch and measurement cycle was repeated five times for each sample. The samples were measured immediately after fabrication and eight weeks later.
3. Results
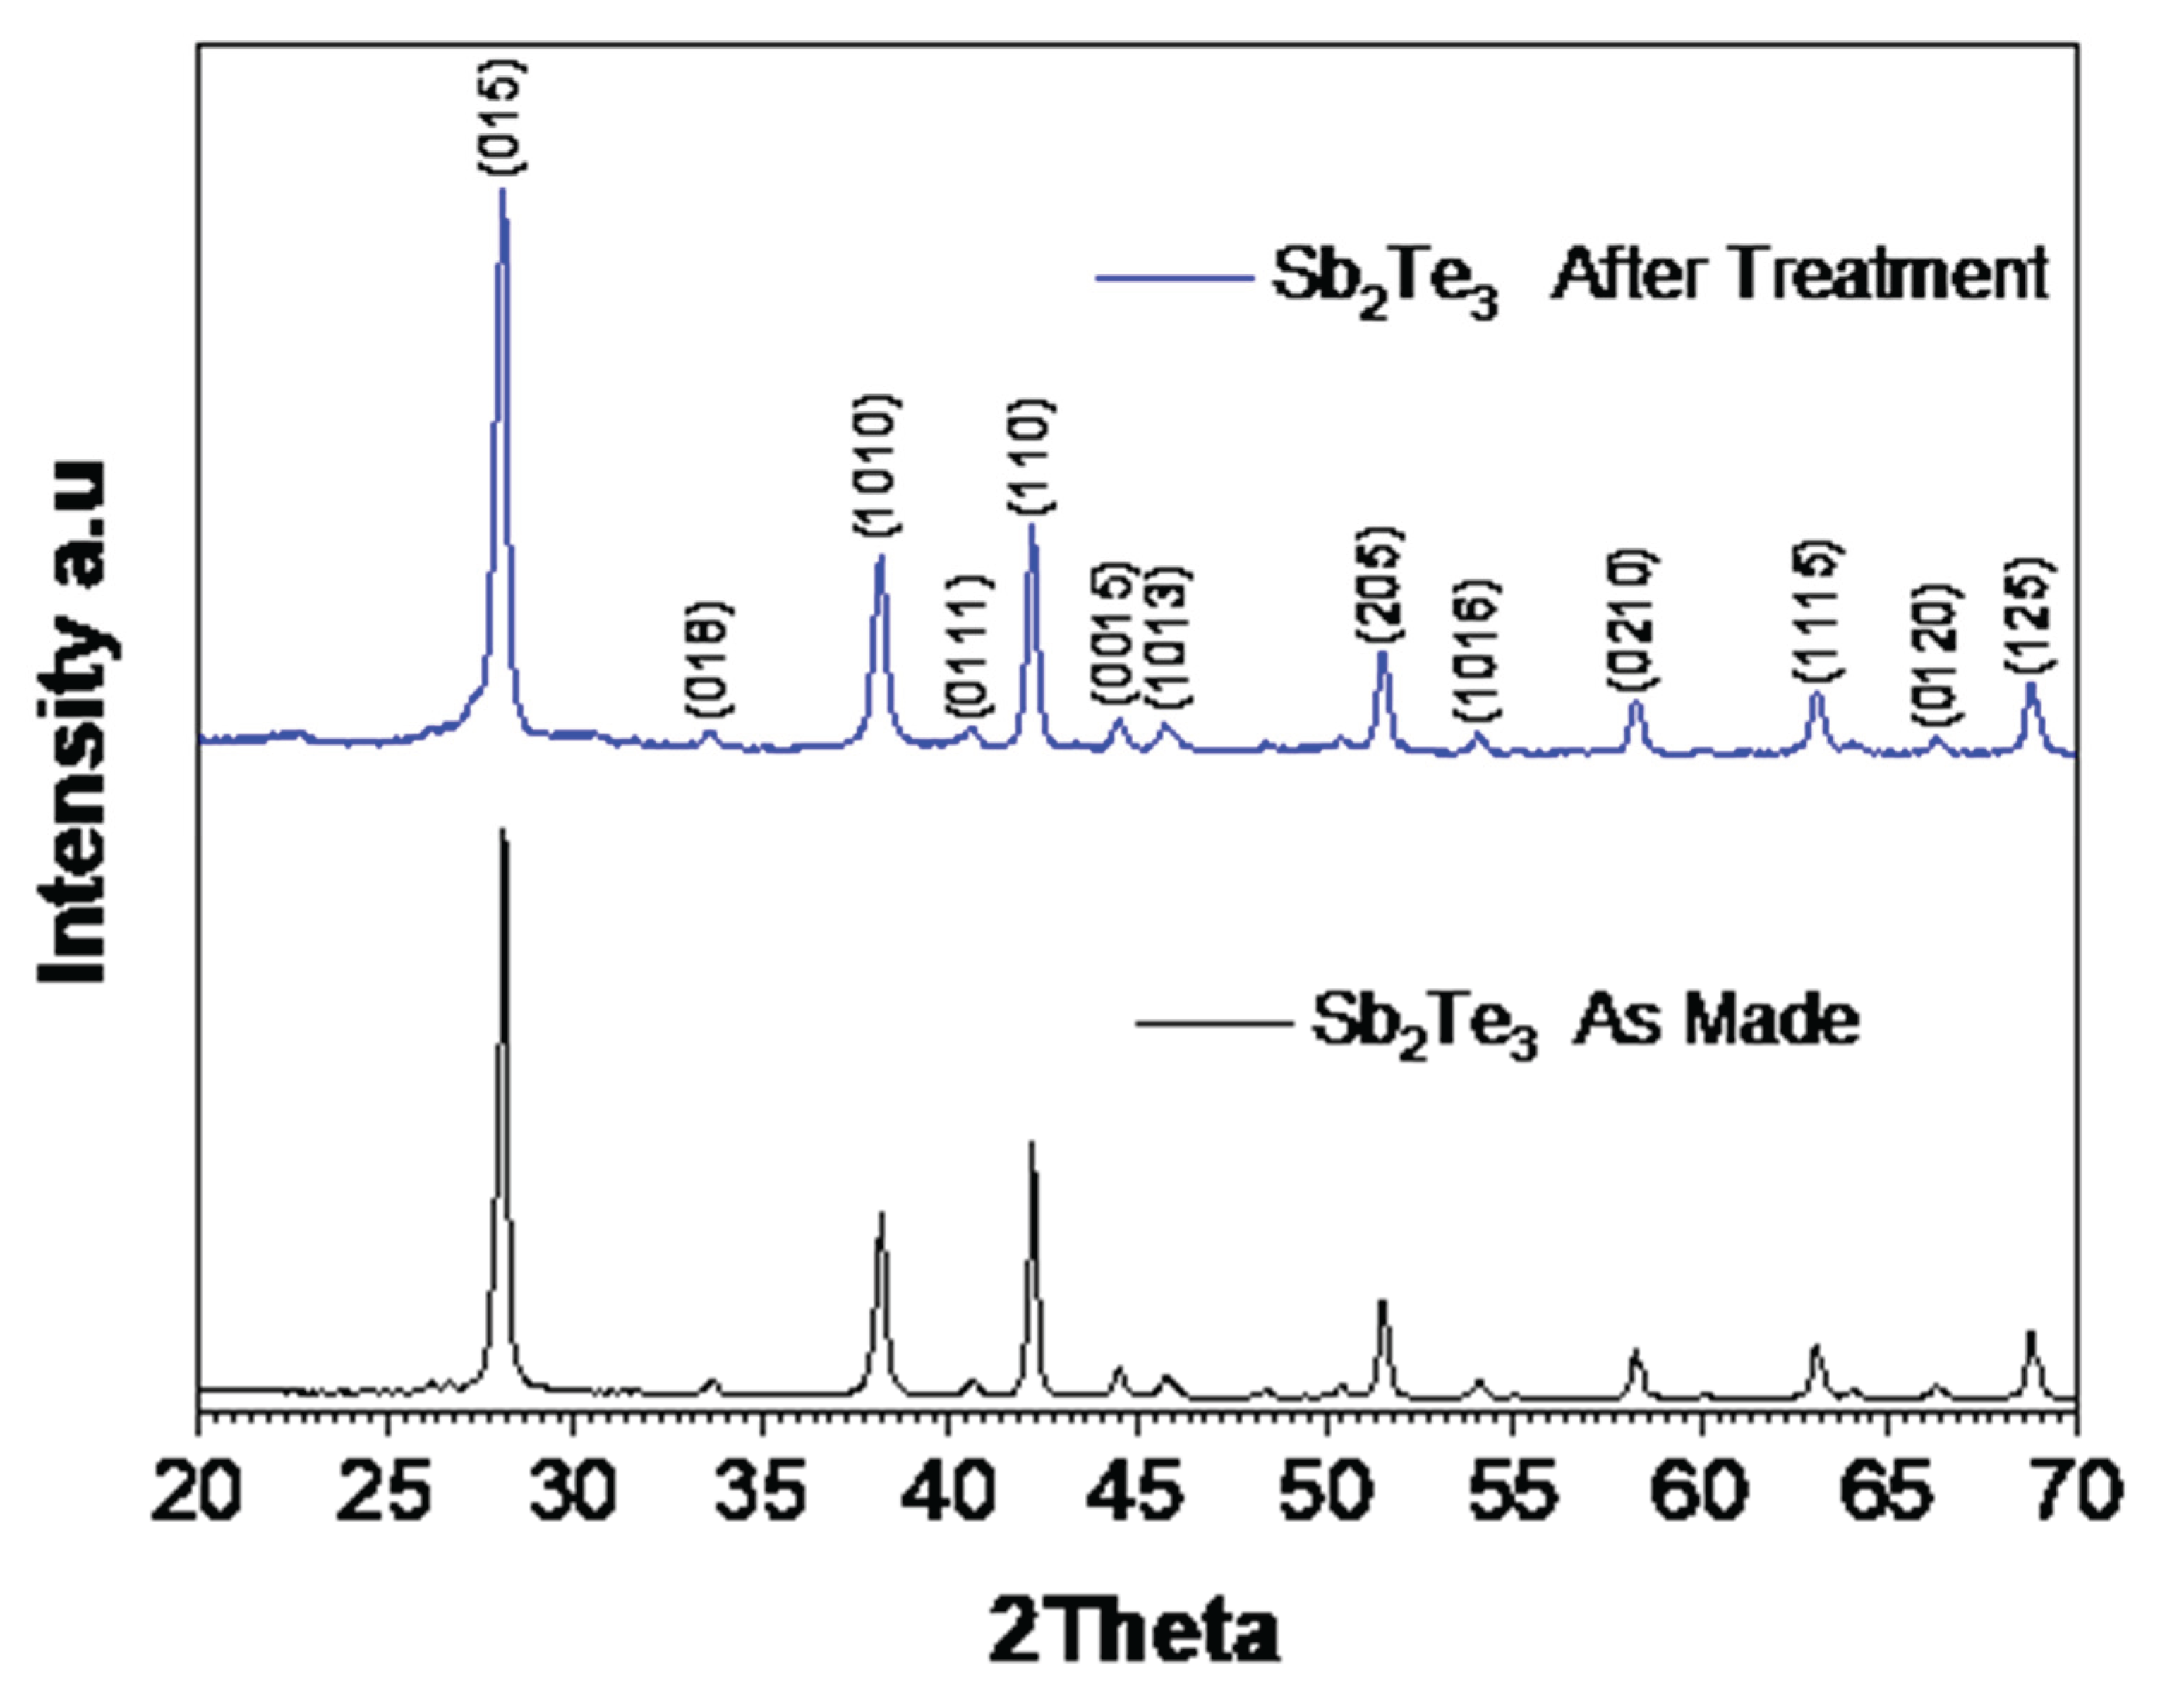
The phase purity of the synthesized Sb2Te3 particles was examined using X-ray diffraction (XRD), with the diffraction patterns indicating high phase purity for Sb2Te3, as illustrated in Figure 2. The main crystalline phases are indexed to Sb2Te3 (ICDD 03-065-3678), which has a rhombohedral crystal structure. Figure A1 in Appendix A.1 compares treated particles with the original ones.
High-resolution XPS scans of Sb 3d and Te 3d were conducted to investigate surface oxidation (see Figure 3). At first, bare Sb2Te3 NPs were studied. In the Sb spectra (top spectra of Figure 3a), we can see the two peaks at 528.7 and 530.0 eV, which correspond to the metallic Sb and the oxidized antimony in the Sb2O3, respectively. After the surface etching, the oxide peak diminished while the peak corresponding to the metallic Sb grew. The Te 3d scans (top spectra of Figure 3b) also show two peaks- at 572.7 eV and 576.1 eV- corresponding to the metallic and oxidized Te, respectively. The peak corresponding to TeO3 (576.1 eV) disappears after surface etching. After 8 weeks in the air, the peaks corresponding to the oxidized states of Sb and Te have grown and remain visible even after the surface etching.
Bottom spectra of Figure 3a,b show that washing nanoparticles in (HCl) and rinsing them in IP is an efficient way to remove the oxide layer at the surface of the particles. Only a tiny amount of Sb2O3 can be detected at the surface of the particles, and it completely disappears after the surface etching. In the Te 3d spectra (Figure 3b), only metallic Te can be observed after washing the NPs with HCl and rinsing them in isopropyl alcohol.
SEM micrographs reveal that most NPs are configured as two-dimensional nanosheets. These NPs exhibit sizes with lengths extending up to 2 µm. The thickness of these nanosheets ranges from 29 nm to 121 nm, with the majority being approximately 60 nm thick for the Sb2Te3 in PEO sample and the treated Sb2Te3 in PEO sample (Figure 4). However, the median NP thickness for Sb2Te3 in HCl/PEO is 46 nm. NPs embedded in pure polymer exhibit a smooth surface, while HCl/PEO and treated NP have a rough surface. SEM images show that the surface of Sb2Te3 NPs has been etched, but the thickness remains unchanged. NPs in HCl/PEO have been exposed to more aggressive etching, which has resulted in an additional reduction in NP thickness. The NPs predominantly orient with their narrower edges protruding from the block or wire-like structures.
The water-based inks were made with untreated particles at various concentrations embedded in PEO (Figure 5). The conductivity of the composite film is very low (<0.03 S/m) below 40% NP concentration due to the lack of a percolation network and low PEO conductivity. From the NP concentration of 40% to 80%, conductivity increases linearly, peaking at 80%. As the Seebeck coefficient remains stable, PF values also follow this linear trend. Therefore, an 80 wt% Sb2Te3/PEO concentration was chosen for detailed study due to its superior properties. Various NP treatment methods were tested to maintain these properties over time.
For stability studies, the time dependence of the specific electrical conductivity and Seebeck coefficient of the samples was measured. The results are presented in Figure 6. The initial measurement was performed immediately after sample fabrication. Subsequently, the samples were stored in the air at room temperature and remeasured weekly for 8 weeks. The highest s observed was 89 ± 1 S/m for the sample with HCl-treated NPs. However, it shows the highest decrease in s over time. This may be due to HCl treatment removing the protective TGA shell, which encapsulated the particles to prevent oxidation. The second most conductive sample, containing pristine NPs, exhibited an s value of 70 ± 1 S/m. The sample treated with a 5% HCl solution shows an initial s of 52 ± 1 S/m. The S for pristine and HCl sonicated NP samples were similar within the margin of error, with measured values of 170 ± 2 µV/K and 173 ± 3 µV/K, respectively.
Over 8 weeks, the s of all samples degraded exponentially (see Figure 6a). Initially, conductivity varied among fresh samples, but all of them converged to the value of around 5 S/m because of Sb2Te3 re-oxidation. The HCl-treated NP sample, initially the most conductive, showed rapid s loss but then exhibited the slowest decrease of s after the second week. Despite starting with the lowest s, the HCl/PEO sample remained the most conductive post-second week due to the presence of HCl which dissolves the oxide layer of Sb2Te3 particles in the polymer. The overall trend of the S dependence on time shows a slight decrease but remains close within the margin of measurement errors for all the samples. The s values for all samples tend to converge to a single value after 7 weeks, indicating that the tested particle treatment methods do not provide a long-term effect on stability, although different methods affect the initial properties and their changes in the first weeks differently.
The power factor values are shown in Figure 6b. The sample with HCl treated NPs has shown the highest PF value of 2.56 ± 0.05 µWm-1K-2, which is attributed to the highest s. The sample with pristine NPs and the HCl-treated sample show similar power factor values of 1.82 ± 0.04 µWm-1K-2 and 1.55 ± 0.05 µWm-1K-2, respectively. After 8 weeks, the power factors are significantly lower at ≈ 0.1 µWm-1K-2.
XPS studies reveal that mixing the NPs in polymer (PEO) introduces an additional peak in Sb high-resolution scan spectra at 532 eV (see Figure 7a). This peak corresponds to the Sb2O5 (Sb-O bond) and also is overlapping with C-O bond peak from PEO polymer. Another peak at 530 eV represents Sb2O3, due to the partial oxidation of the NPs by oxygen, most likely originating from water. When the NPs are mixed with HCl and PEO, the Sb2O5 peak slightly decreases and a new peak appears at 530.9 eV, corresponding to SbCl5, indicating that the oxide on the surface of Sb2Te3 has partially dissolved and SbCl5 has formed (see middle spectra of Figure 7a). After deep profile XPS etching, the peak at 528.8 eV corresponding to the Sb–Te bond becomes more clearly visible. Meanwhile, only metallic Te peaks at 572.7 eV could be observed (Figure 7b). HCl treatment before mixing in the PEO does not hinder the oxidation of the Sb2Te3 NPs. Before the etching (deep profile XPS), most of the obtained signal comes from the oxidized states of the Sb and Te (see bottom spectra of Figure 7a,b).
After 8 weeks in air, the XPS spectra for Sb2Te3 mixed in PEO are similar to the initial samples, but with larger peaks indicating more oxidation of metals (Figure A2). This suggests that particles from aqueous solutions continue to oxidize, leading to low conductivity after 8 weeks, and causing conductivity values to converge over time despite different treatments.
It is known that HDT improves the performance of Sb2Te3 PMMA composites [37]. The stability of water-based solution composite treatment with HDT was tested. In this case, old particles were used and treated with HCl to remove the oxide layer, as previously done. Additionally, in the final rinsing cycle with isopropanol (IP), HDT was added to IP. This method binds the HDT to the Te in the particles. Figure 8 presents the long-term stability comparison between standard-treated samples and HDT-treated samples over 50 days. Untreated old particle composite displays low conductivity values, indicating the significance of oxide removal from the surface of particles. The low s of the untreated samples does not allow us to perform reliable S measurements. The addition of HDT as a surface modification agent demonstrates remarkable effects on the transport performance of Sb₂Te₃ NPs. The HDT-treated samples consistently outperform other treatments, maintaining higher PF (above 0.12 μW m⁻¹ K⁻²) and more stable s throughout the testing period. This superior performance is attributed to the strong chemical bonding between the dithiol groups and the NPs surface, which provides effective protection against oxidation and environmental degradation.
Figure 9 shows XPS spectra of sulfur (S 2p) peaks of nanoparticles with and without the added HDT during the treatment process. The top spectra show that without the addition of HDT, there’s no detectable amount of the sulfur in the nanoparticles. In the spectra of pure nanoparticles and when the nanoparticles are mixed in PEO, the sulfur peak is centered at 163.5 eV which corresponds to the thiol (R-S-H) chemical group (see middle and bottom spectra in Figure 9). After the surface etching, the peak widens and extra shoulder at 161.7 eV can be seen. This extra signal shows that the HDT has been attached to the nanoparticle surface, forming a metal sulfide.
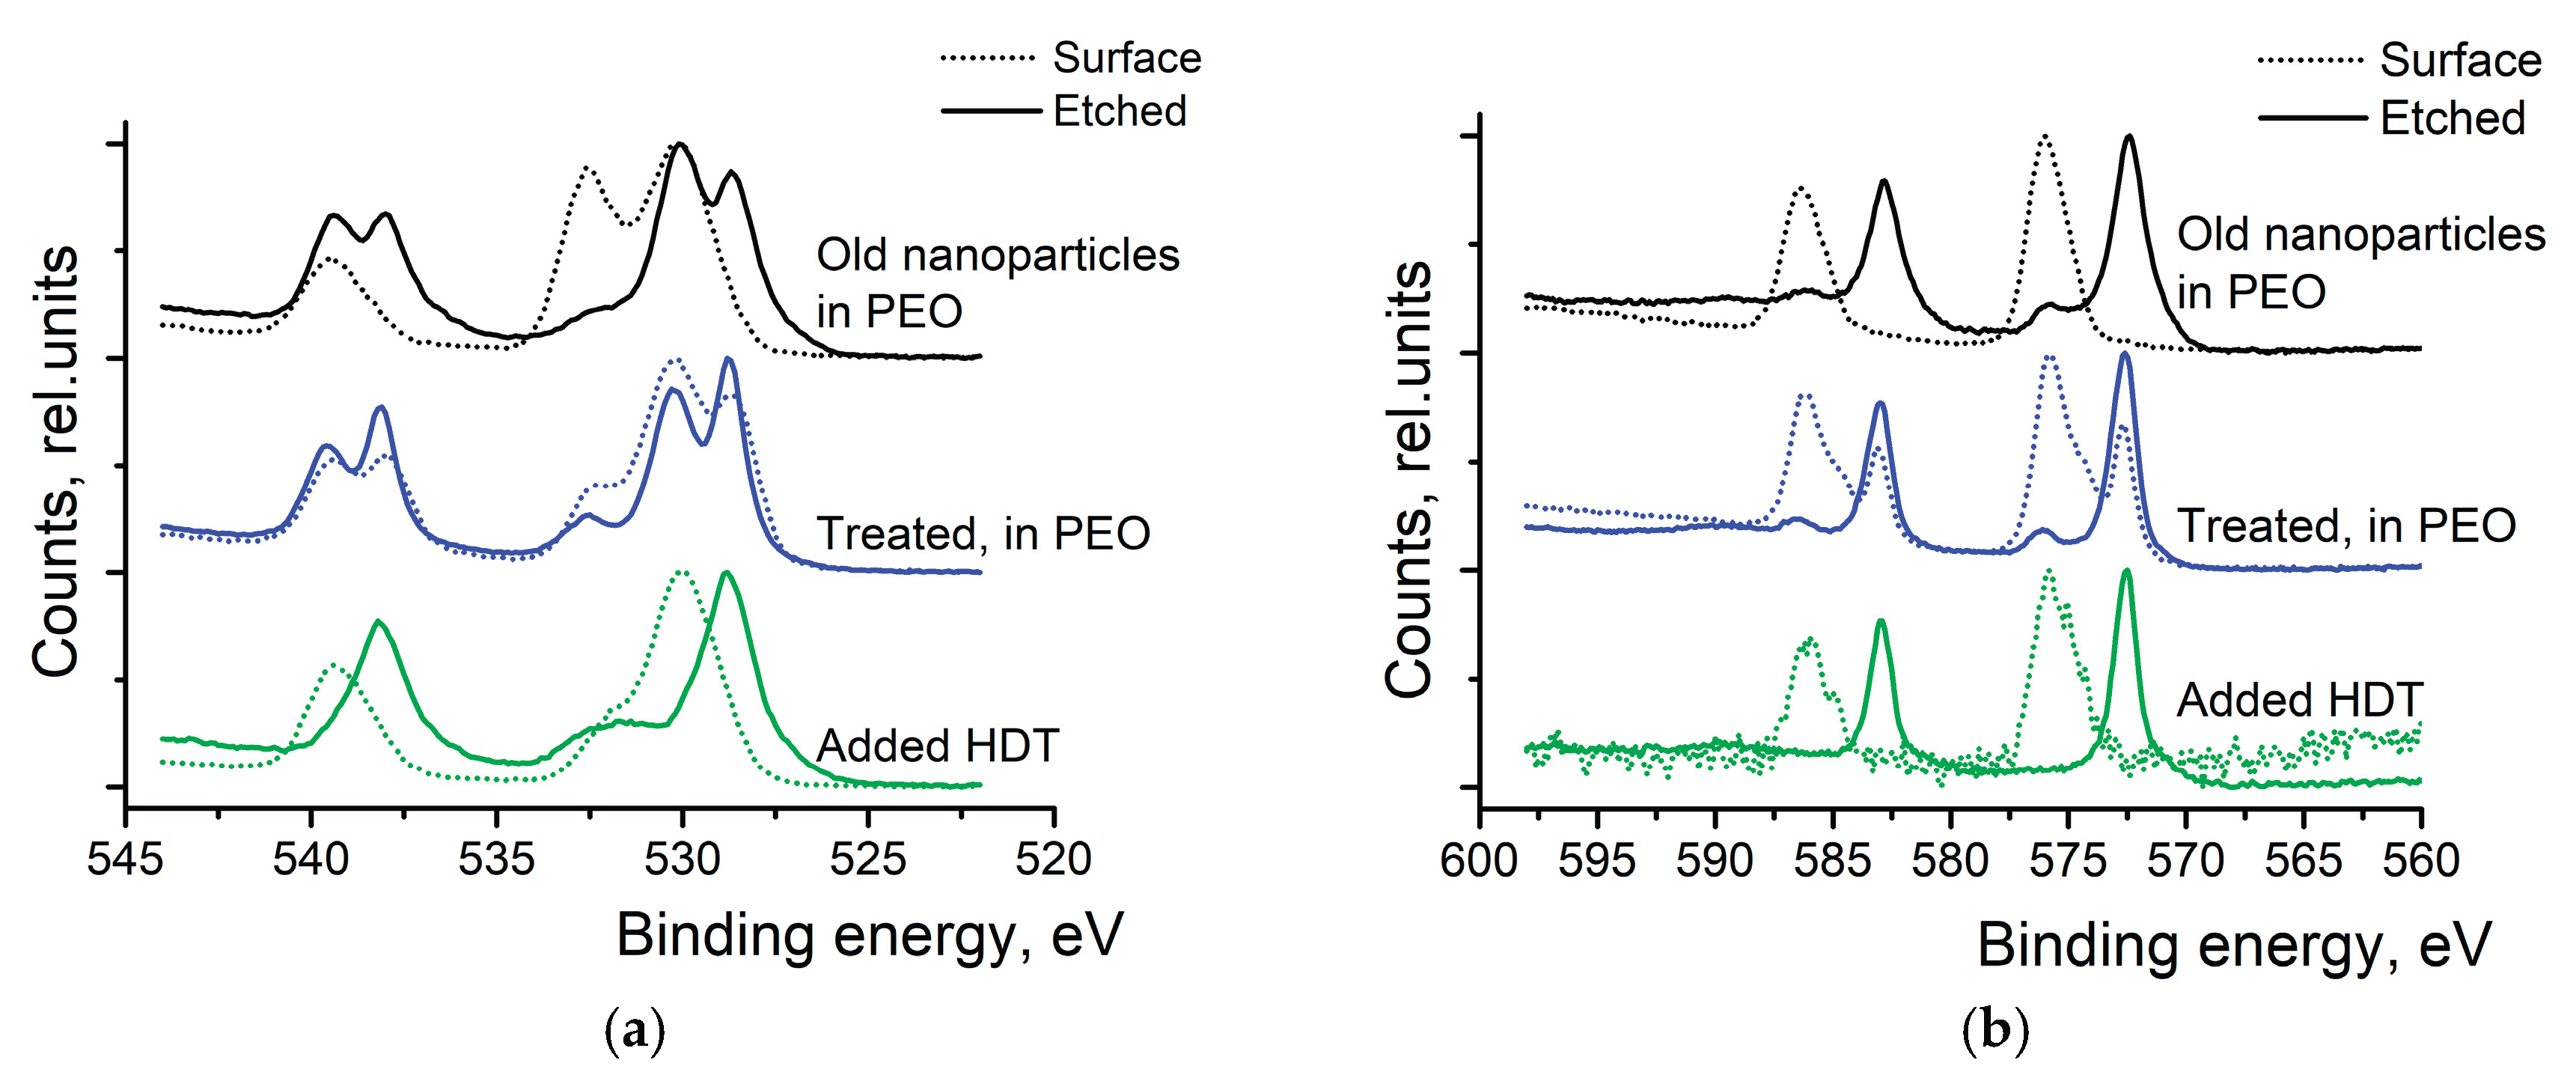
Figure 10 shows the XPS spectra comparison between old NPs in PEO, treated samples in PEO, and HDT-treated samples.
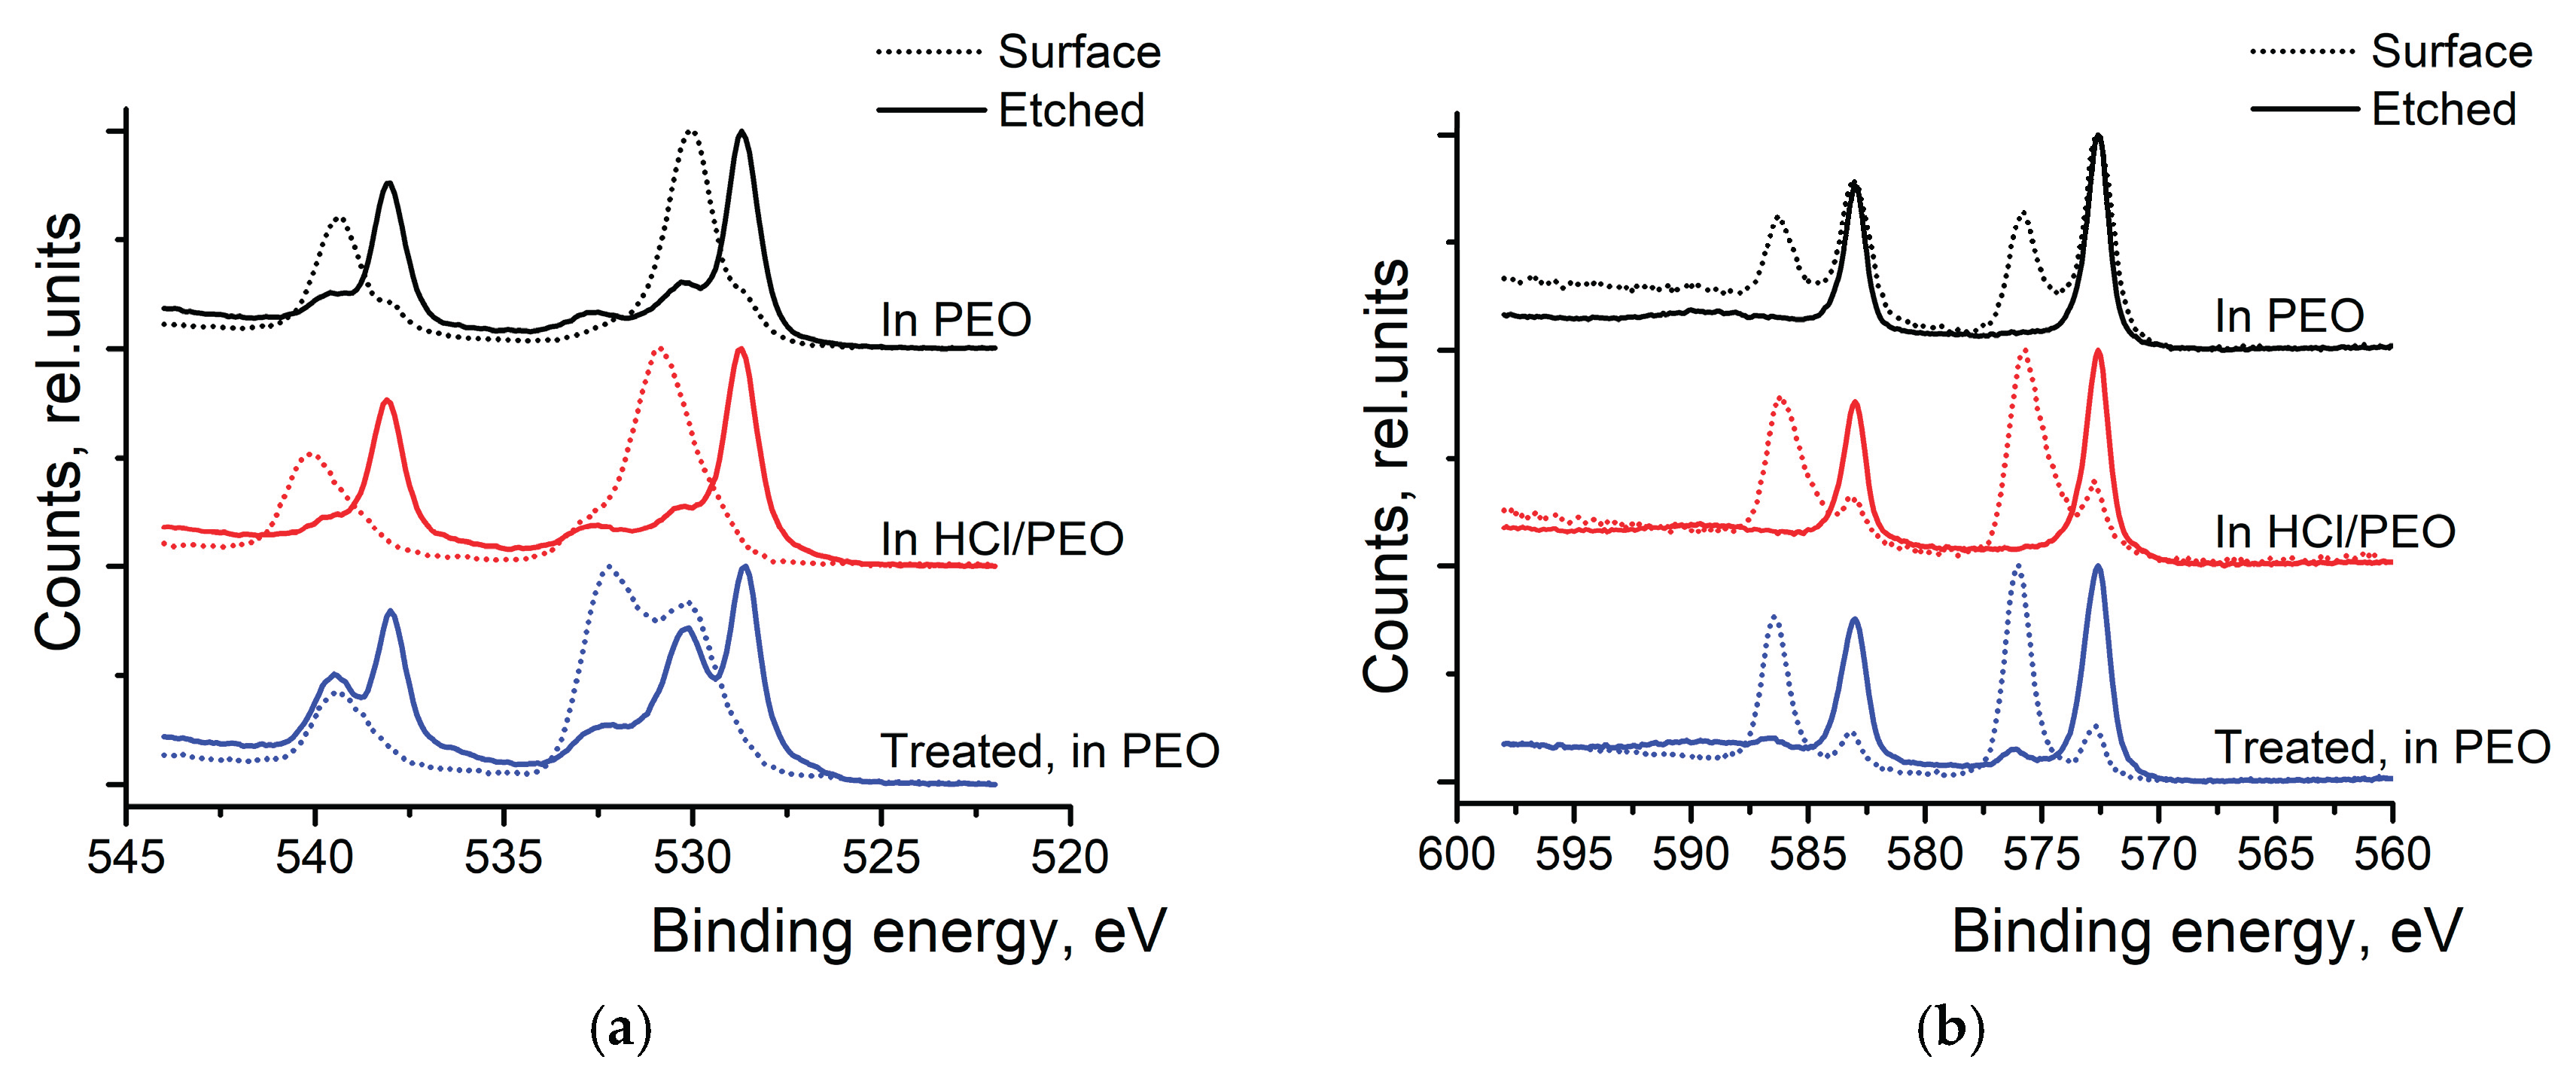
The top spectra of Figure 10a shows 1 year old Sb2Te3 particles mixed in PEO. Here, before the etching, almost all the signal comes from the Sb2O3 (peak at 530.0 eV) and oxygen in the PEO (peak at 532.5 eV)- the signal of metallic Sb is small. Similarly, the top spectra of Figure 10b show only the oxidized states of Te before the surface etching. The asymmetric nature of the peak suggests that there is a mixture of two oxides on the surface of the particles- TeO2 and TeO3. This is even more evident when the NPs are treated with HCl and washed with IP. This treatment has only partially removed the metal oxides from the surface of the particles (see middle spectra of Figure 10a,b).
4. Discussion
The results of this study confirm the high purity and quality of the synthesized Sb₂Te₃ nanoparticles, as evidenced by X-ray diffraction (XRD) analysis. The S, s, PF, and long-term stability of the Sb₂Te₃/PEO hybrid material were thoroughly evaluated. These findings align with previous studies that have highlighted the potential of Sb₂Te₃ as a high-performance TE material due to its high S and s at room temperature.
X-ray photoelectron spectroscopy (XPS) measurements revealed that exposure to water and oxygen leads to oxidation of the NPs, which can be partially mitigated by a 5% hydrochloric acid (HCl) solution. However, this treatment does not completely prevent the ongoing oxidation process. This observation is consistent with the findings of Volykhhov et al. [36], who described the oxidation of Sb₂Te₃ as a multi-step process involving molecular adsorption, surface reaction, and oxide layer growth. The study by Fang et al. [38] also supports the effectiveness of HCl treatment in removing surface oxides, although it does not halt oxidation entirely. XPS analysis indicated that incorporating the nanoparticles into PEO generates an additional peak in the high-resolution antimony spectra at 532 eV. This peak is associated with the oxygen atom in the polymer’s C–O bond, which overlaps with the Sb–O bond peak of Sb₂O₅. Adding HCl to the polymer facilitates the formation of Sb₂O₅, as determined by the peak at 530.9 eV. Meanwhile, only metallic Te peaks at 572.7 eV were observed. HCl treatment before mixing in the PEO does not hinder the oxidation of the Sb₂Te₃ nanoparticles.
The TE transport properties of the Sb₂Te₃/PEO hybrid material investigated in this study are consistent with those reported by Batili et al. [37] for electrophoretically deposited films; however, a long-term stability assessment is not provided.
This study shows that the initial PF of the Sb2Te3/PEO hybrid materials are close to those of plastic ductile SnSe1.95Br0.05 single crystals and outperform AgCySe-based plastic TE materials [40,41]. Hybrid films enable flexible TE materials, and optimizing their porous morphology, as observed in SEM images, could further enhance the power factor.
5. Conclusions
This study underscores the critical importance of surface modification in developing stable, high-performance TE nanocomposites. The key findings indicate that surface modification treatments significantly enhance both the initial TE transport performance and long-term stability of Sb₂Te₃/PEO nanocomposites. Chemical treatments effectively reduce surface oxidation and improve interfacial compatibility, as evidenced by XPS analysis. Treated samples achieve power factors up to 2.6 μW m⁻¹ K⁻² and maintain stable performance over 50 days. Hexane dithiol (HDT) treatment represents the most effective surface modification approach, providing superior chemical stability and maintaining power factors above 0.12 μW m⁻¹ K⁻² for extended periods. These results provide valuable insights for the design of next-generation flexible TE materials and highlight the importance of surface chemistry control in polymer-inorganic nanocomposites.
Author Contributions
Conceptualization, O.B., B. H and K.P.; methodology, K.P and B.H.; investigation, O.B, R.G. B.H. and J.F.S-C; data curation, O.B and R.G.; writing—original draft preparation, O.B., R.G.; writing—review and editing, B.H., K.P. M.S.T.; supervision, K.P.; funding acquisition, K.P. All authors have read and agreed to the published version of the manuscript.
Funding
This research was funded by the Latvian Council of Science, grant number lzp-2023/1-0456 “Advancing Sustainable Thermoelectric Hybrid Systems Utilizing Glass-Forming Low Molecular Weight Compounds”. M.S.T. and J.F.S-C. acknowledges funding from the Olle Engkvist Foundation (SOEB, 226-0113).
Institutional Review Board Statement
Not applicable.
Data Availability Statement
Data associated with this paper are available upon request.
Conflicts of Interest
The authors declare no conflicts of interest.
Abbreviations
The following abbreviations are used in this manuscript:
| EG | ethylene glycol |
| HCl | hydrochloric acid |
| HDT | Hexane dithiol |
| IP | isopropanol |
| P3HT | poly(3-hexylthiophene-2,5-diyl) |
| PANI | polyaniline |
| PEDOT:PSS | poly(3,4-ethylenedioxythiophene) |
| PMMA | poly(methyl methacrylate) |
| PF | Power factor |
| SEM | Scanning Electron Microscopy |
| TE | Thermoelectric |
| TGA | thioglycolic acid |
| TOP | tri-octylphosphine |
| XPS | X-ray Photoelectron Spectroscopy |
Appendix A
Appendix A.1
Figure A1.
X-ray powder diffraction (XRD) patterns of the as-made and HCl treated Sb2Te3 particles.
Appendix A.2
Figure A2.
XPS spectra of (a) Sb 3d peaks and (b) Te 3d peaks of Sb2Te3 nanoparticles in PEO, measured after 8 weeks;.
Figure A2.
XPS spectra of (a) Sb 3d peaks and (b) Te 3d peaks of Sb2Te3 nanoparticles in PEO, measured after 8 weeks;.
References
- Deshmukh, M.K.G.; Sameeroddin, M.; Abdul, D.; Abdul Sattar, M. Renewable Energy in the 21st Century: A Review. Mater. Today Proc. 2023, 80, 1756–1759. [Google Scholar] [CrossRef]
- Miró, L.; Gasia, J.; Cabeza, L.F. Thermal Energy Storage (TES) for Industrial Waste Heat (IWH) Recovery: A Review. Appl. Energy 2016, 179, 284–301. [Google Scholar] [CrossRef]
- Toshima, N. Recent Progress of Organic and Hybrid Thermoelectric Materials. Synth. Met. 2017, 225, 3–21. [Google Scholar] [CrossRef]
- Thielen, M.; Sigrist, L.; Magno, M.; Hierold, C.; Benini, L. Human Body Heat for Powering Wearable Devices: From Thermal Energy to Application. Energy Convers. Manag. 2017, 131, 44–54. [Google Scholar] [CrossRef]
- Levin, E.M. Charge Carrier Effective Mass and Concentration Derived from Combination of Seebeck Coefficient and <math> <mmultiscripts> <mi>Te</Mi> <mprescripts/> <none/> <mn>125</Mn> </Mmultiscripts> </Math> NMR Measurements in Complex Tellurides. Phys. Rev. B 2016, 93, 245202. [Google Scholar] [CrossRef]
- Pei, Y.; LaLonde, A.D.; Heinz, N.A.; Shi, X.; Iwanaga, S.; Wang, H.; Chen, L.; Snyder, G.J. Stabilizing the Optimal Carrier Concentration for High Thermoelectric Efficiency. Adv. Mater. 2011, 23, 5674–5678. [Google Scholar] [CrossRef]
- Mehdizadeh Dehkordi, A.; Zebarjadi, M.; He, J.; Tritt, T.M. Thermoelectric Power Factor: Enhancement Mechanisms and Strategies for Higher Performance Thermoelectric Materials. Mater. Sci. Eng. R Reports 2015, 97, 1–22. [Google Scholar] [CrossRef]
- Schweicher, G.; Olivier, Y.; Lemaur, V.; Geerts, Y.H. What Currently Limits Charge Carrier Mobility in Crystals of Molecular Semiconductors? Isr. J. Chem. 2014, 54, 595–620. [Google Scholar] [CrossRef]
- Li, H.; Tessler, N.; Brédas, J. Assessment of the Factors Influencing Charge-Carrier Mobility Measurements in Organic Field-Effect Transistors. Adv. Funct. Mater. 2018, 28. [Google Scholar] [CrossRef]
- Abdou, M.S.A.; Orfino, F.P.; Son, Y.; Holdcroft, S. Interaction of Oxygen with Conjugated Polymers: Charge Transfer Complex Formation with Poly(3-Alkylthiophenes). J. Am. Chem. Soc. 1997, 119, 4518–4524. [Google Scholar] [CrossRef]
- Li, J.; Li, Y.; Wang, Z.; Bian, H.; Hou, Y.; Wang, F.; Xu, G.; Liu, B.; Liu, Y. Ultrahigh Oxidation Resistance and High Electrical Conductivity in Copper-Silver Powder. Sci. Rep. 2016, 6, 39650. [Google Scholar] [CrossRef]
- Liu, S.; Li, H.; Li, P.; Liu, Y.; He, C. Recent Advances in Polyaniline-Based Thermoelectric Composites. CCS Chem. 2021, 3, 2547–2560. [Google Scholar] [CrossRef]
- Gostkowska-Lekner, N.; Kojda, D.; Hoffmann, J.-E.; May, M.; Huber, P.; Habicht, K.; Hofmann, T. Synthesis of Organic–Inorganic Hybrids Based on the Conjugated Polymer P3HT and Mesoporous Silicon. Microporous Mesoporous Mater. 2022, 343, 112155. [Google Scholar] [CrossRef]
- Wei, Q.; Mukaida, M.; Kirihara, K.; Naitoh, Y.; Ishida, T. Recent Progress on PEDOT-Based Thermoelectric Materials. Materials (Basel). 2015, 8, 732–750. [Google Scholar] [CrossRef] [PubMed]
- Kim, S.; Ryu, S.H.; Kwon, Y.-T.; Lim, H.-R.; Park, K.-R.; Song, Y.; Choa, Y.-H. Synthesis and Thermoelectric Characterization of High Density Ag2Te Nanowire/PMMA Nanocomposites. Mater. Chem. Phys. 2017, 190, 187–193. [Google Scholar] [CrossRef]
- Serrano-Claumarchirant, J.F.; Silva, A.S.-D.; Sánchez-Royo, J.F.; Culebras, M.; Cantarero, A.; Gómez, C.M.; Abargues, R. In Situ Synthesis of Polythiophene and Silver Nanoparticles within a PMMA Matrix: A Nanocomposite Approach to Thermoelectrics. ACS Appl. Energy Mater. 2022, 5, 11067–11076. [Google Scholar] [CrossRef]
- Serrano-Claumarchirant, J.F.; Hamawandi, B.; Ergül, A.B.; Cantarero, A.; Gómez, C.M.; Priyadarshi, P.; Neophytou, N.; Toprak, M.S. Thermoelectric Inks and Power Factor Tunability in Hybrid Films through All Solution Process. ACS Appl. Mater. Interfaces 2022, 14, 19295–19303. [Google Scholar] [CrossRef]
- Liang, J.; Yin, S.; Wan, C. Hybrid Thermoelectrics. Annu. Rev. Mater. Res. 2020, 50, 319–344. [Google Scholar] [CrossRef]
- Jin, R.; Chen, G.; Pei, J.; Xu, H.; Lv, Z.S. Solvothermal Synthesis and Growth Mechanism of Ultrathin Sb2Te3 Hexagonal Nanoplates with Thermoelectric Transport Properties. RSC Adv. 2012, 2, 1450–1456. [Google Scholar] [CrossRef]
- Wang, W.; Yan, X.; Poudel, B.; Ma, Y.; Hao, Q.; Yang, J.; Chen, G.; Ren, Z. Chemical Synthesis of Anisotropic Nanocrystalline Sb 2 Te 3 and Low Thermal Conductivity of the Compacted Dense Bulk. J. Nanosci. Nanotechnol. 2008, 8, 452–456. [Google Scholar] [CrossRef]
- Chen, J.; Sun, T.; Sim, D.; Peng, H.; Wang, H.; Fan, S.; Hng, H.H.; Ma, J.; Boey, F.Y.C.; Li, S.; et al. Sb 2 Te 3 Nanoparticles with Enhanced Seebeck Coefficient and Low Thermal Conductivity. Chem. Mater. 2010, 22, 3086–3092. [Google Scholar] [CrossRef]
- Jin, H.; Li, J.; Iocozzia, J.; Zeng, X.; Wei, P.; Yang, C.; Li, N.; Liu, Z.; He, J.H.; Zhu, T.; et al. Hybrid Organic–Inorganic Thermoelectric Materials and Devices. Angew. Chemie Int. Ed. 2019, 58, 15206–15226. [Google Scholar] [CrossRef]
- He, M.; Ge, J.; Lin, Z.; Feng, X.; Wang, X.; Lu, H.; Yang, Y.; Qiu, F. Thermopower Enhancement in Conducting Polymer Nanocomposites via Carrier Energy Scattering at the Organic–Inorganic Semiconductor Interface. Energy Environ. Sci. 2012, 5, 8351. [Google Scholar] [CrossRef]
- Liang, Z.; Boland, M.J.; Butrouna, K.; Strachan, D.R.; Graham, K.R. Increased Power Factors of Organic–Inorganic Nanocomposite Thermoelectric Materials and the Role of Energy Filtering. J. Mater. Chem. A 2017, 5, 15891–15900. [Google Scholar] [CrossRef]
- Shah, S.Z.H.; Ding, Z.; Aabdin, Z.; Tjiu, W.W.; Recatala-Gomez, J.; Dai, H.; Yang, X.; Maheswar, R.D.V.; Wu, G.; Hippalgaonkar, K.; et al. Oxidation Control to Augment Interfacial Charge Transport in Te-P3HT Hybrid Materials for High Thermoelectric Performance. Adv. Sci. 2024, 11. [Google Scholar] [CrossRef]
- Yao, Q.; Chen, L.D.; Zhang, W.Q.; Liufu, S.C.; Chen, X.H. Enhanced Thermoelectric Performance of Single-Walled Carbon Nanotubes/Polyaniline Hybrid Nanocomposites. ACS Nano 2010, 4, 2445–2451. [Google Scholar] [CrossRef]
- Dong, G.-H.; Zhu, Y.-J.; Cheng, G.-F.; Ruan, Y.-J. Sb2Te3 Nanobelts and Nanosheets: Hydrothermal Synthesis, Morphology Evolution and Thermoelectric Properties. J. Alloys Compd. 2013, 550, 164–168. [Google Scholar] [CrossRef]
- Dharmaiah, P.; Hong, S. Hydrothermal Method for the Synthesis of Sb 2 Te 3, and Bi 0.5 Sb 1.5 Te 3 Nanoplates and Their Thermoelectric Properties. Int. J. Appl. Ceram. Technol. 2018, 15, 132–139. [Google Scholar] [CrossRef]
- Schulz, S.; Heimann, S.; Friedrich, J.; Engenhorst, M.; Schierning, G.; Assenmacher, W. Synthesis of Hexagonal Sb 2 Te 3 Nanoplates by Thermal Decomposition of the Single-Source Precursor (Et 2 Sb) 2 Te. Chem. Mater. 2012, 24, 2228–2234. [Google Scholar] [CrossRef]
- Hamawandi, B.; Parsa, P.; Pudza, I.; Pudzs, K.; Kuzmin, A.; Ballikaya, S.; Welter, E.; Szukiewicz, R.; Kuchowicz, M.; Toprak, M.S. Scalable Solution Chemical Synthesis and Comprehensive Analysis of Bi2Te3 and Sb2Te3. Energy Mater. 2025, 5, 500065. [Google Scholar] [CrossRef]
- Hamawandi, B.; Batili, H.; Paul, M.; Ballikaya, S.; Kilic, N.I.; Szukiewicz, R.; Kuchowicz, M.; Johnsson, M.; Toprak, M.S. Minute-Made, High-Efficiency Nanostructured Bi2Te3 via High-Throughput Green Solution Chemical Synthesis. Nanomaterials 2021, 11, 2053. [Google Scholar] [CrossRef]
- Hamawandi, B.; Mansouri, H.; Ballikaya, S.; Demirci, Y.; Orlovská, M.; Bolghanabadi, N.; Sajjadi, S.A.; Toprak, M.S. A Comparative Study on the Thermoelectric Properties of Bismuth Chalcogenide Alloys Synthesized through Mechanochemical Alloying and Microwave-Assisted Solution Synthesis Routes. Front. Mater. 2020, 7, 1–13. [Google Scholar] [CrossRef]
- Hamawandi, B.; Ballikaya, S.; Batili, H.; Roosmark, V.; Orlovská, M.; Yusuf, A.; Johnsson, M.; Szukiewicz, R.; Kuchowicz, M.; Toprak, M.S. Facile Solution Synthesis, Processing and Characterization of n- and p-Type Binary and Ternary Bi–Sb Tellurides. Appl. Sci. 2020, 10, 1178. [Google Scholar] [CrossRef]
- Zhou, B.; Ji, Y.; Yang, Y.-F.; Li, X.-H.; Zhu, J.-J. Rapid Microwave-Assisted Synthesis of Single-Crystalline Sb 2 Te 3 Hexagonal Nanoplates. Cryst. Growth Des. 2008, 8, 4394–4397. [Google Scholar] [CrossRef]
- Dong, G.-H.; Zhu, Y.-J.; Chen, L.-D. Microwave-Assisted Rapid Synthesis of Sb2Te3 Nanosheets and Thermoelectric Properties of Bulk Samples Prepared by Spark Plasma Sintering. J. Mater. Chem. 2010, 20, 1976. [Google Scholar] [CrossRef]
- Volykhov, A.A.; Sánchez-Barriga, J.; Sirotina, A.P.; Neudachina, V.S.; Frolov, A.S.; Gerber, E.A.; Kataev, E.Y.; Senkovsky, B.; Khmelevsky, N.O.; Aksenenko, A.Y.; et al. Rapid Surface Oxidation of Sb 2 Te 3 as Indication for a Universal Trend in the Chemical Reactivity of Tetradymite Topological Insulators. Chem. Mater. 2016, 28, 8916–8923. [Google Scholar] [CrossRef]
- Batili, H.; Hamawandi, B.; Parsa, P.; Björn Ergül, A.; Szukiewicz, R.; Kuchowicz, M.; Sadaka Toprak, M. Electrophoretic Assembly and Electronic Transport Properties of Rapidly Synthesized Sb2Te3 Nanoparticles. Appl. Surf. Sci. 2023, 637, 157930. [Google Scholar] [CrossRef]
- Fang, F.; Opila, R.L.; Venkatasubramanian, R.; Colpitts, T. Preparation of Clean Bi2Te3 and Sb2Te3 Thin Films to Determine Alignment at Valence Band Maxima. J. Vac. Sci. Technol. A Vacuum, Surfaces, Film. 2011, 29. [Google Scholar] [CrossRef]
- Pudzs, K.; Vembris, A.; Rutkis, M.; Woodward, S. Thin Film Organic Thermoelectric Generator Based on Tetrathiotetracene. Adv. Electron. Mater. 2017, 3, 1600429. [Google Scholar] [CrossRef]
- Basit, A.; Xin, J.; Li, X.; Hussain, T.; Wang, G.; Dai, J.Y.; Zheng, G. A Review on High-Performance Flexible Thermoelectrics: Material, Device, and Applications. Microstructures 2025, 5. [Google Scholar] [CrossRef]
- Deng, T.; Gao, Z.; Qiu, P.; Zhou, Z.; Ming, C.; Liu, Z.; Li, Z.; Yang, S.; Wei, T.; Wang, G.; et al. High Thermoelectric Power Factors in Plastic/Ductile Bulk SnSe 2 -Based Crystals. Adv. Mater. 2024, 36, 1–9. [Google Scholar] [CrossRef]
Figure 2.
X-ray powder diffraction (XRD) pattern of the as-made sample, with Miller indices indexed to rhombohedral Sb2Te3 (ICDD 03-065-3678).
Figure 2.
X-ray powder diffraction (XRD) pattern of the as-made sample, with Miller indices indexed to rhombohedral Sb2Te3 (ICDD 03-065-3678).
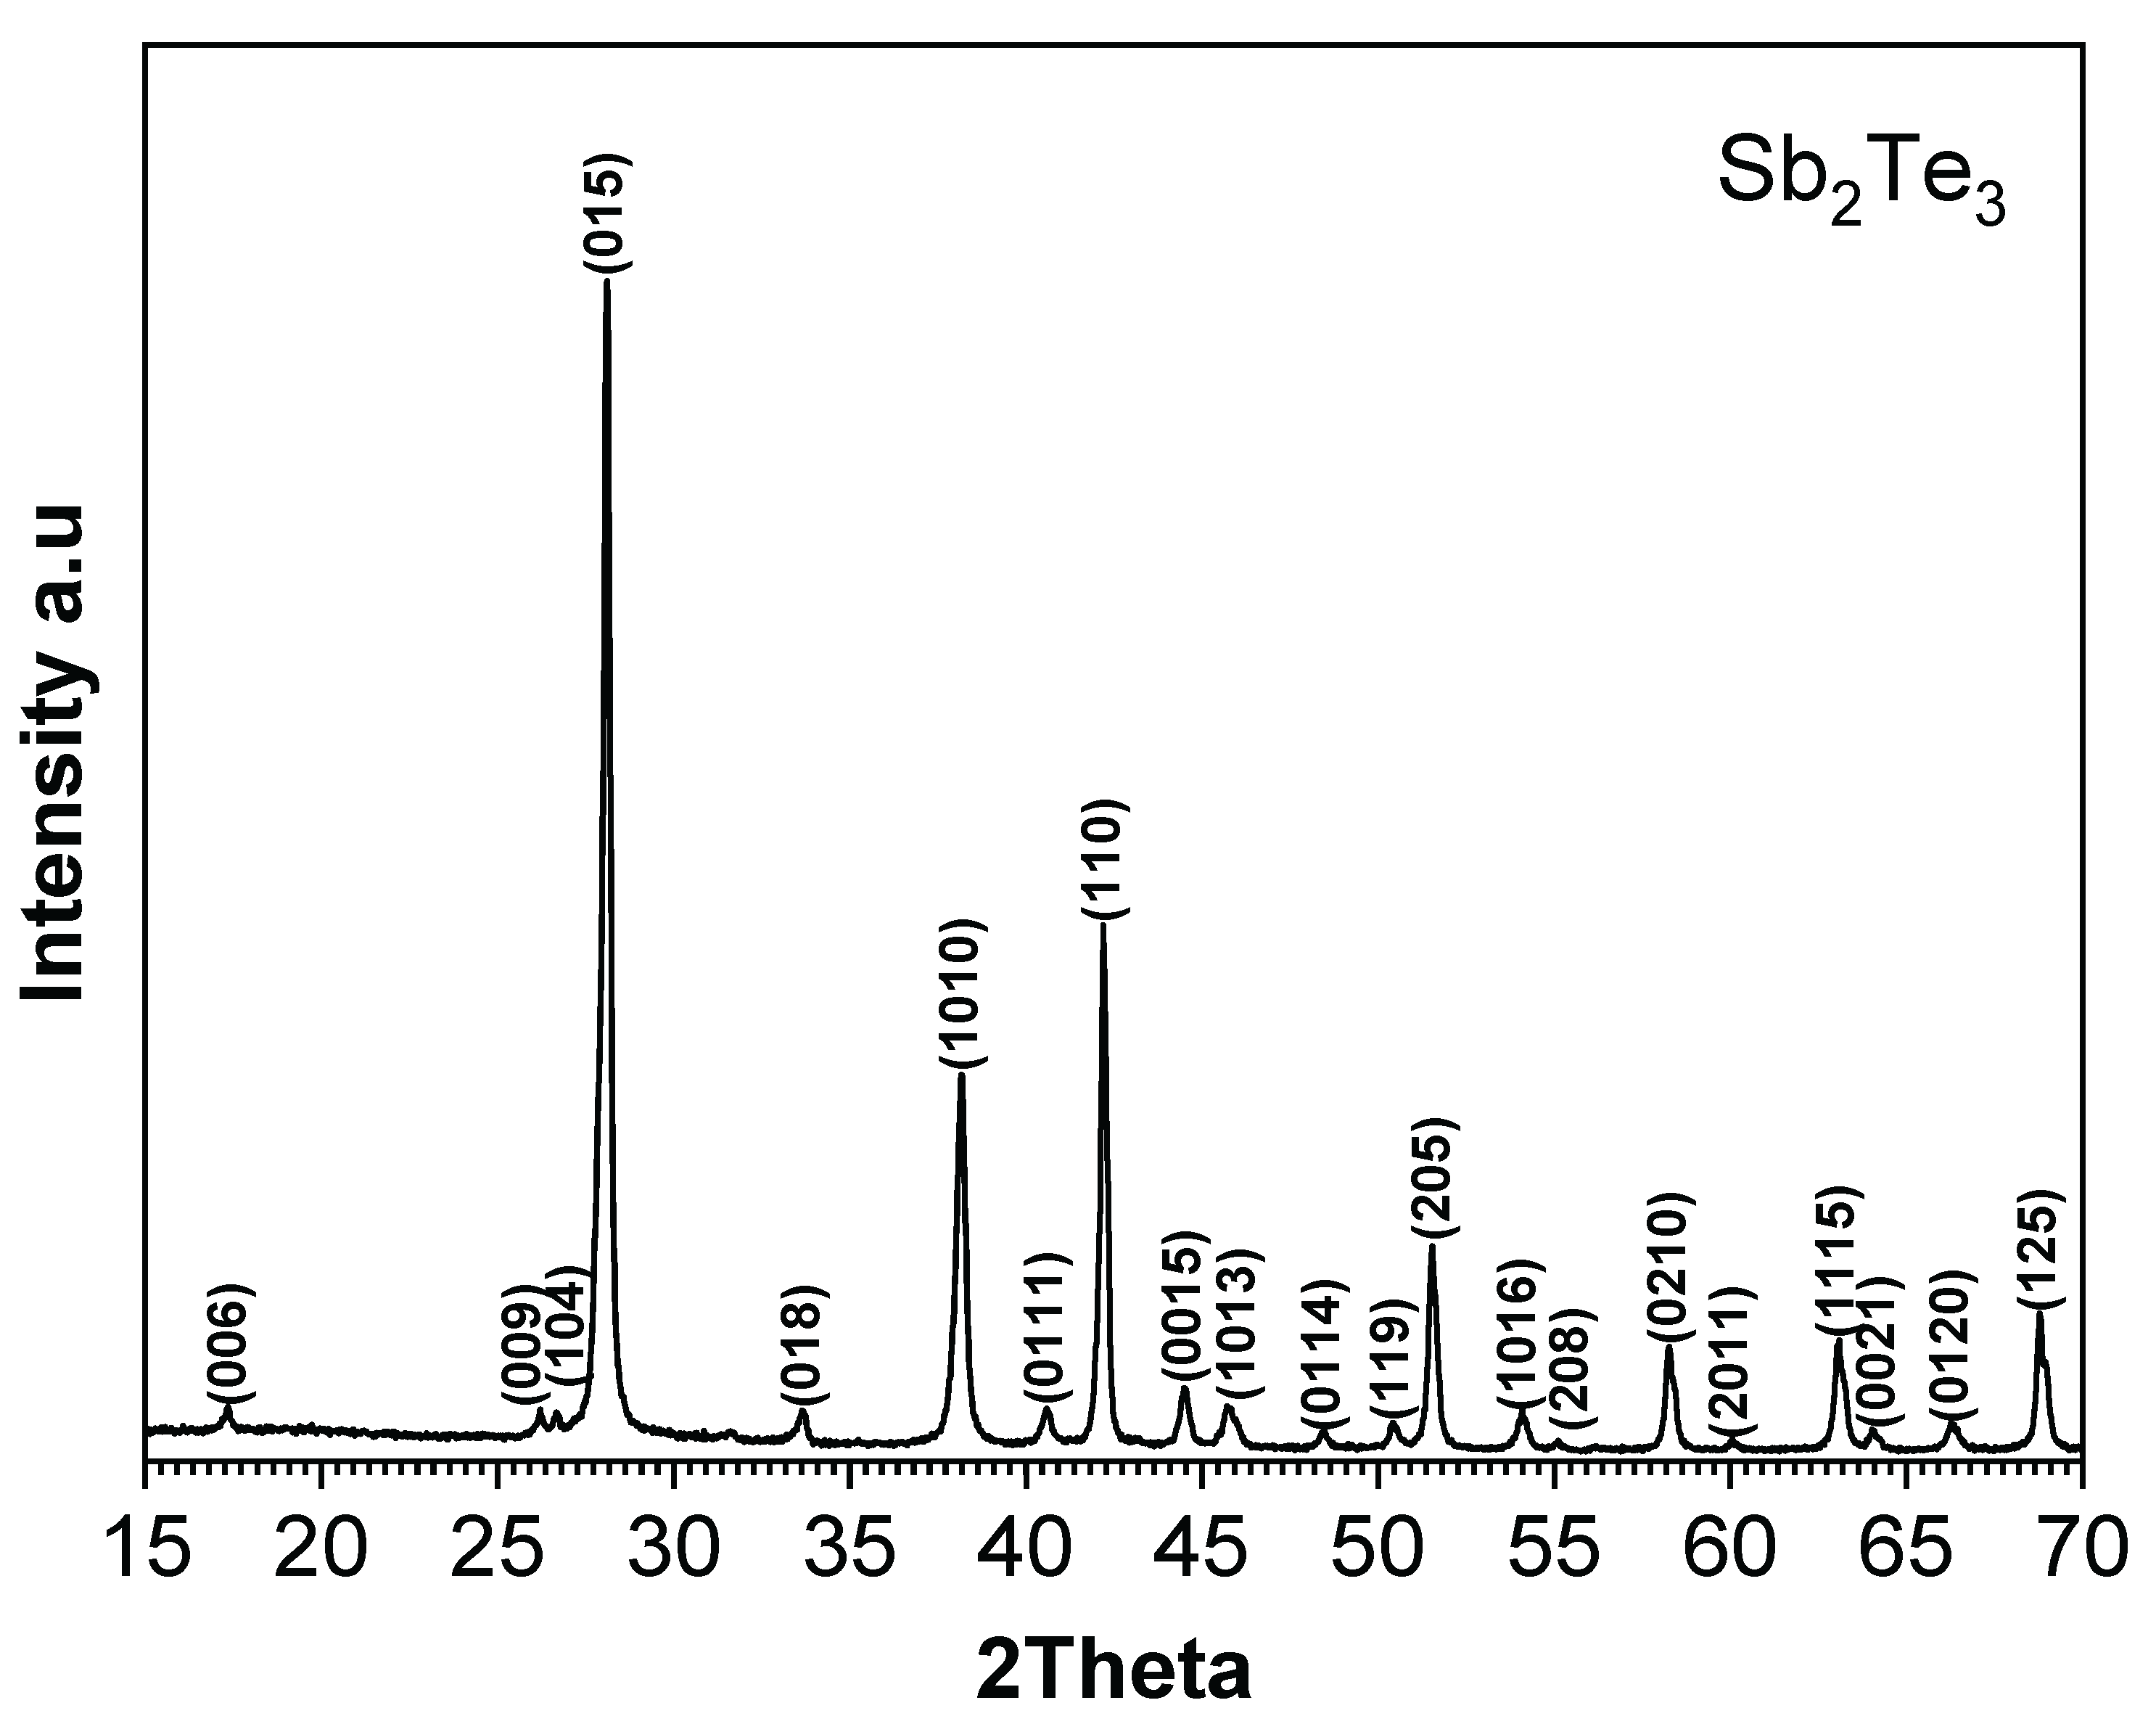
Figure 3.
XPS spectra of (a) Sb 3d peaks and (b) Te 3d peaks of Sb2Te3 nanoparticles.
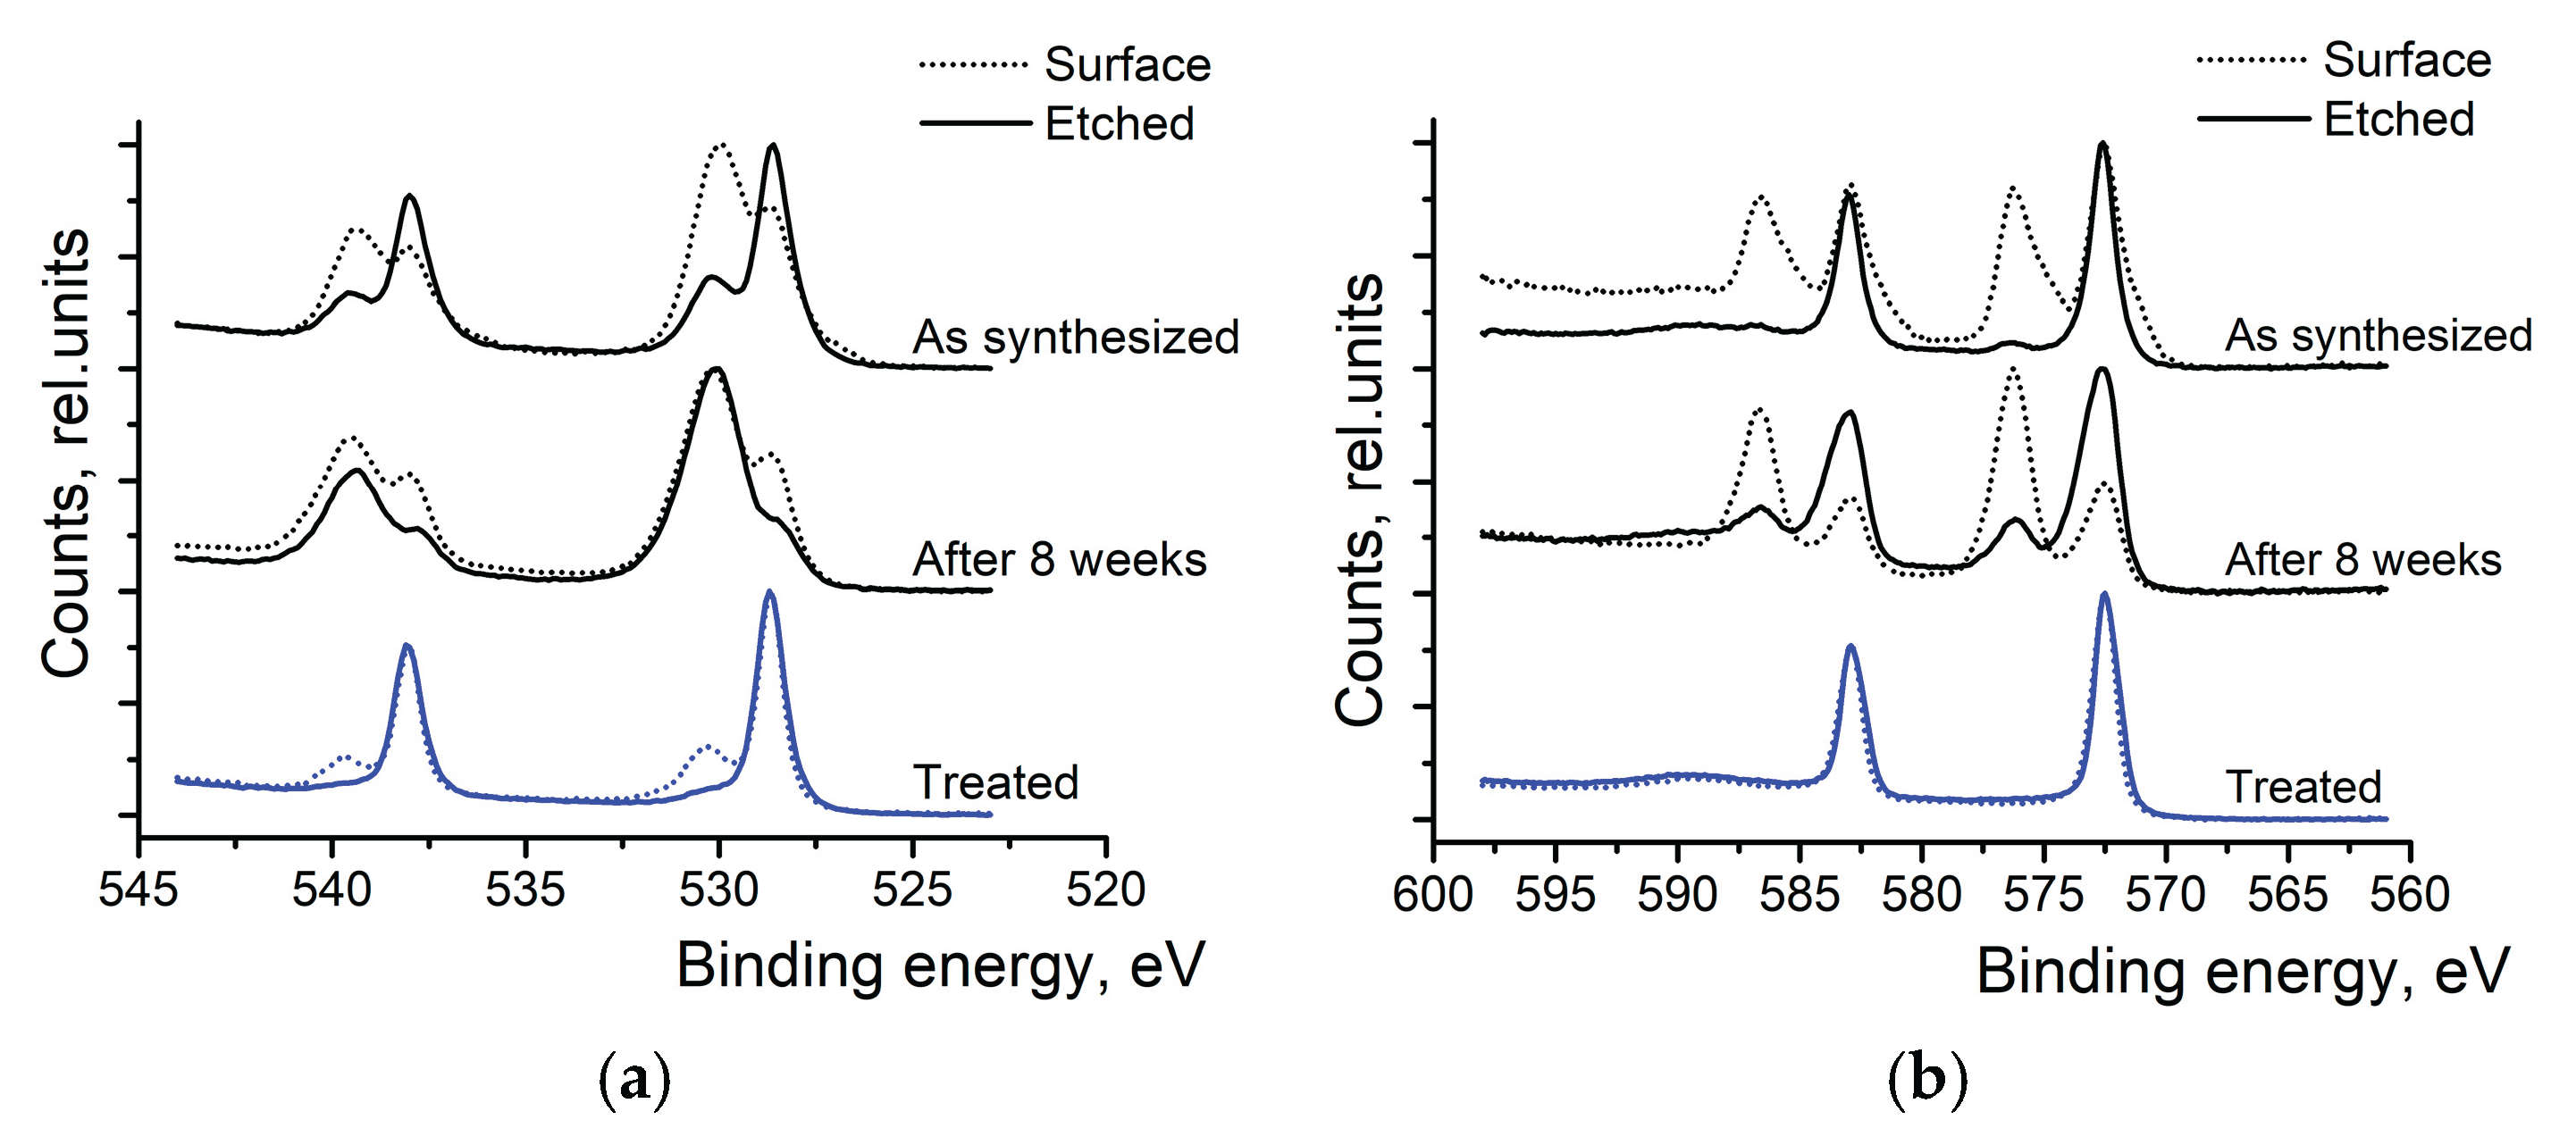
Figure 4.
SEM images of PEO Sb2Te3 hybrids: (a) pristine NPs in deionized water; (b) NPs after exposure to 5% HCl solution; (c) NPs after 5% HCl-ultrasonication in deionized water polymer solution.
Figure 4.
SEM images of PEO Sb2Te3 hybrids: (a) pristine NPs in deionized water; (b) NPs after exposure to 5% HCl solution; (c) NPs after 5% HCl-ultrasonication in deionized water polymer solution.
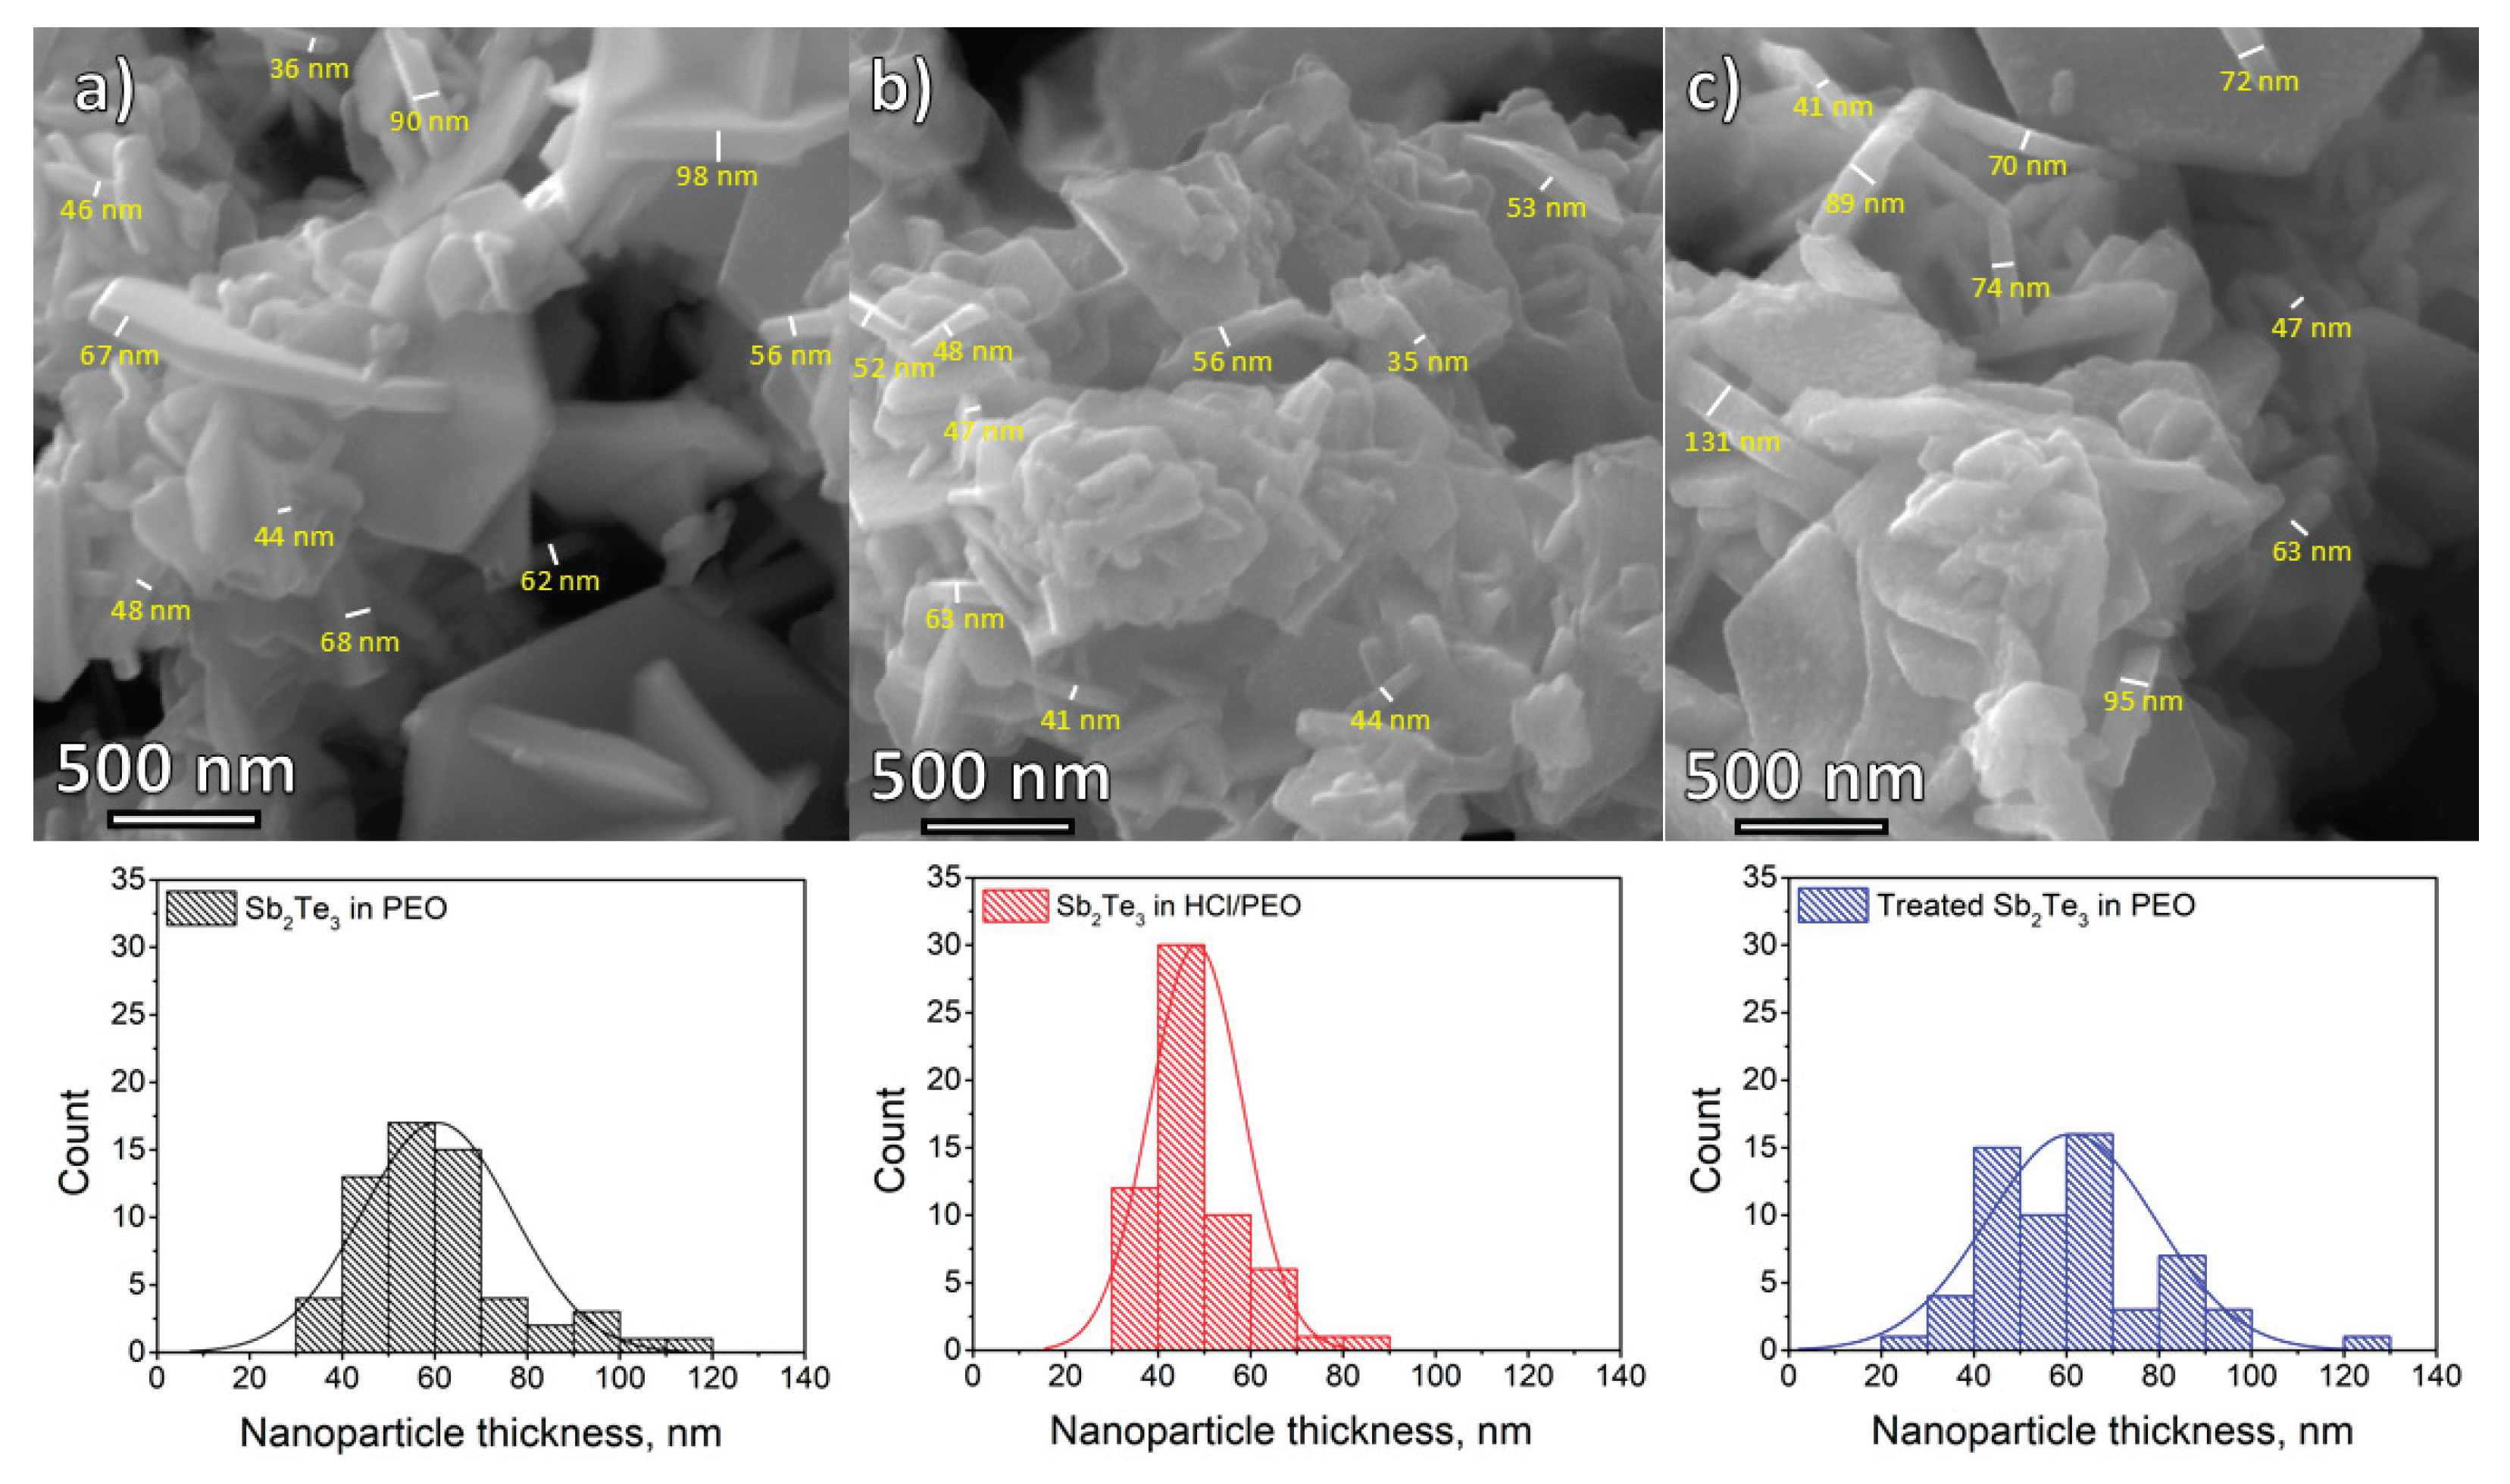
Figure 5.
Electronic transport properties (a) electrical conductivity and Seebeck coefficient, (b) power factor (PF)—of composite films with different Sb2Te3 NP contents in a PEO matrix.
Figure 5.
Electronic transport properties (a) electrical conductivity and Seebeck coefficient, (b) power factor (PF)—of composite films with different Sb2Te3 NP contents in a PEO matrix.
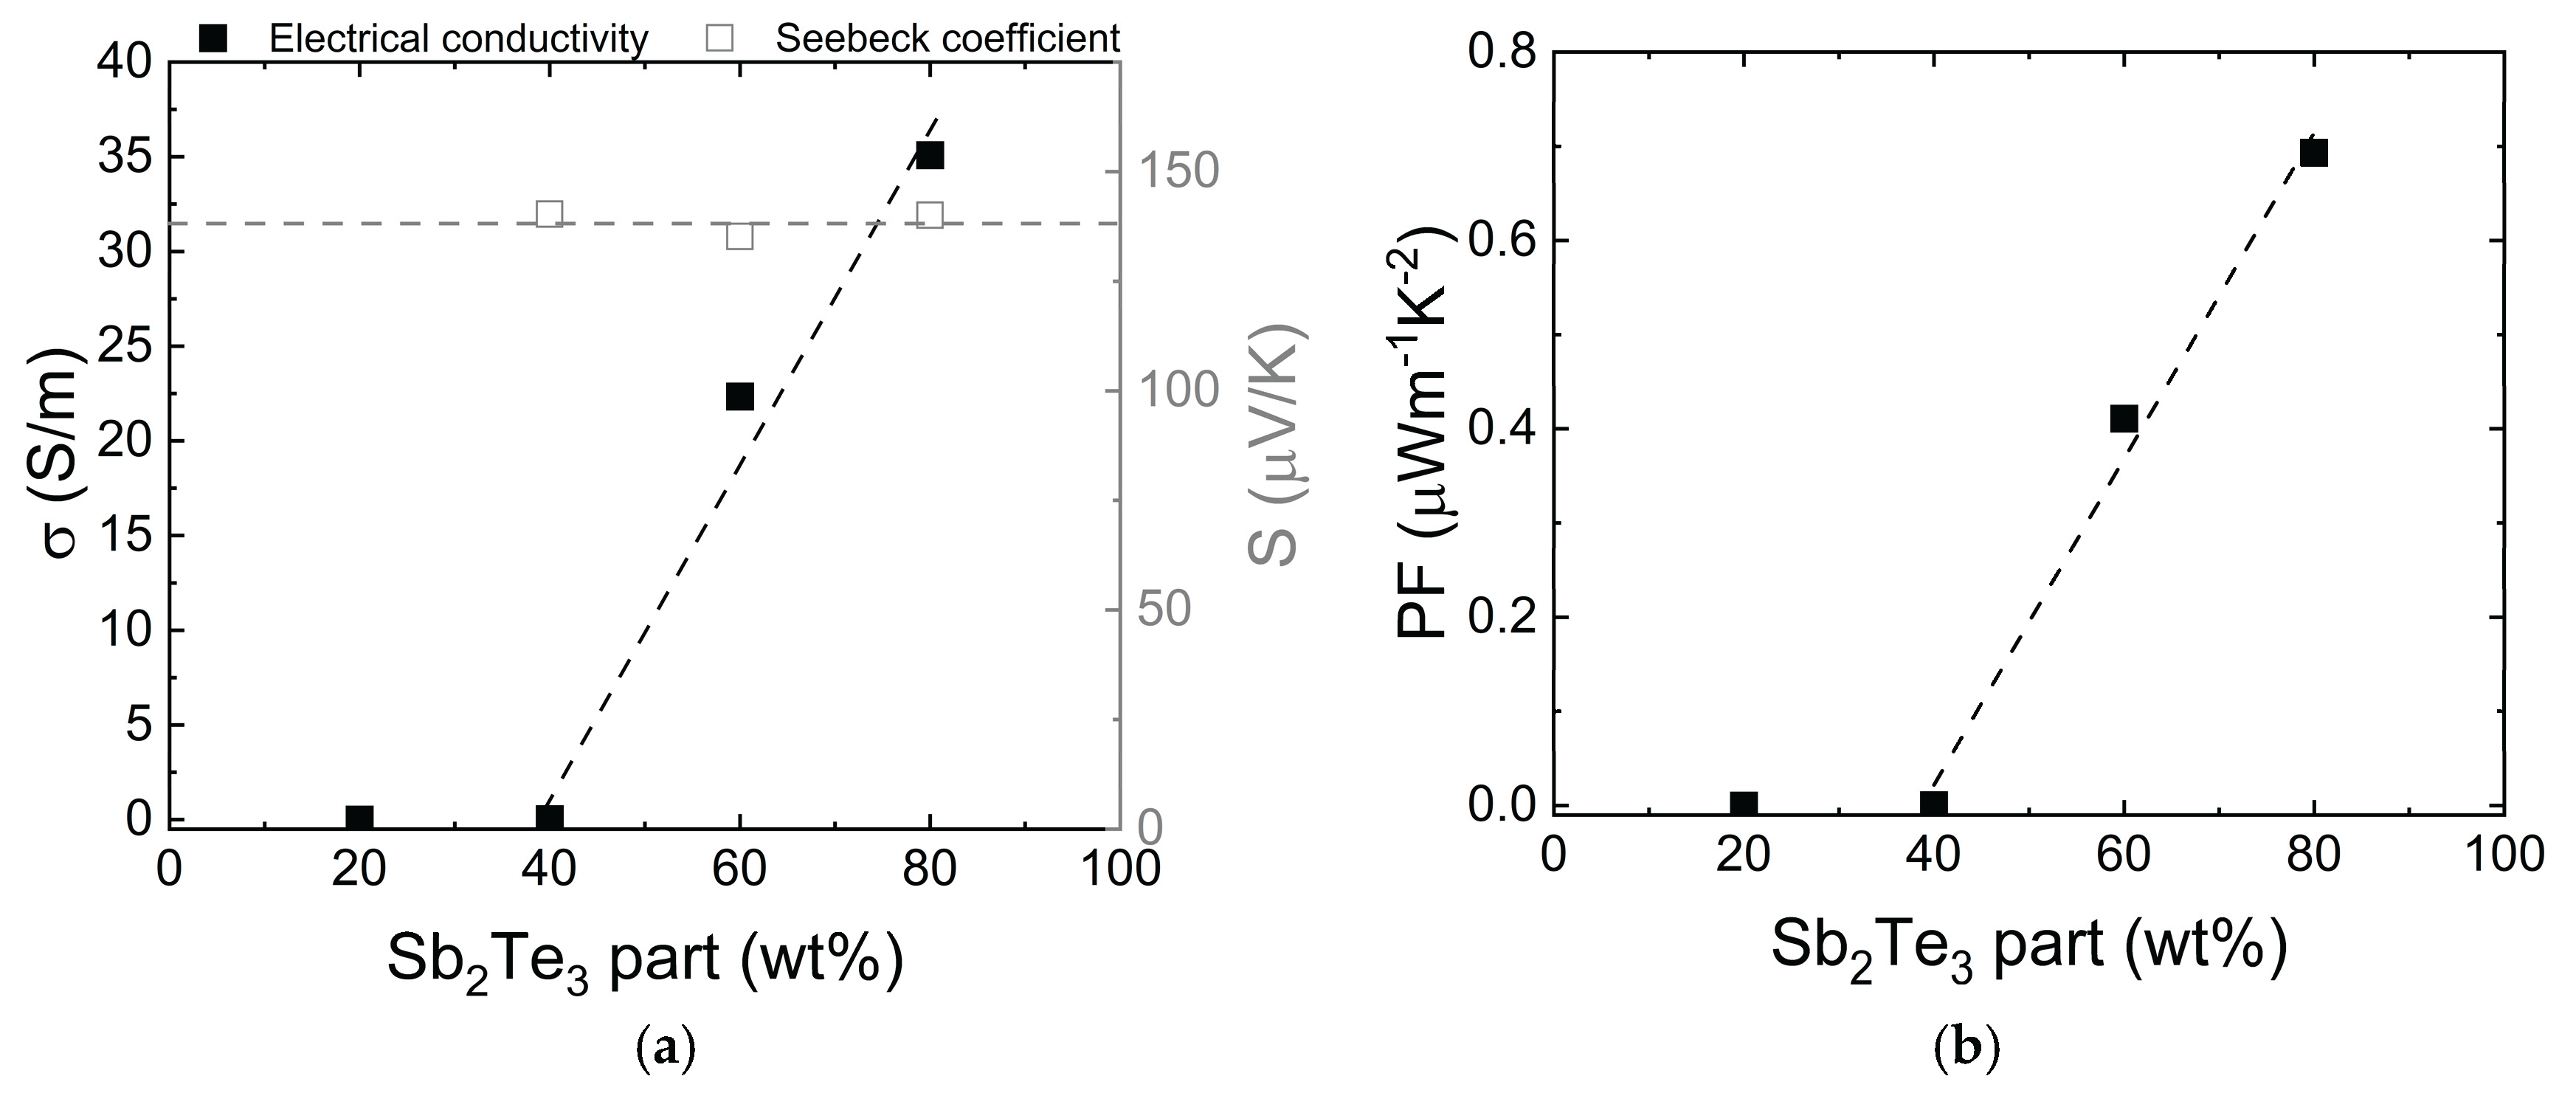
Figure 6.
Stability test of transport properties – (a) s (filled symbols) and S (empty symbols), (b) – power factor (PF).
Figure 6.
Stability test of transport properties – (a) s (filled symbols) and S (empty symbols), (b) – power factor (PF).
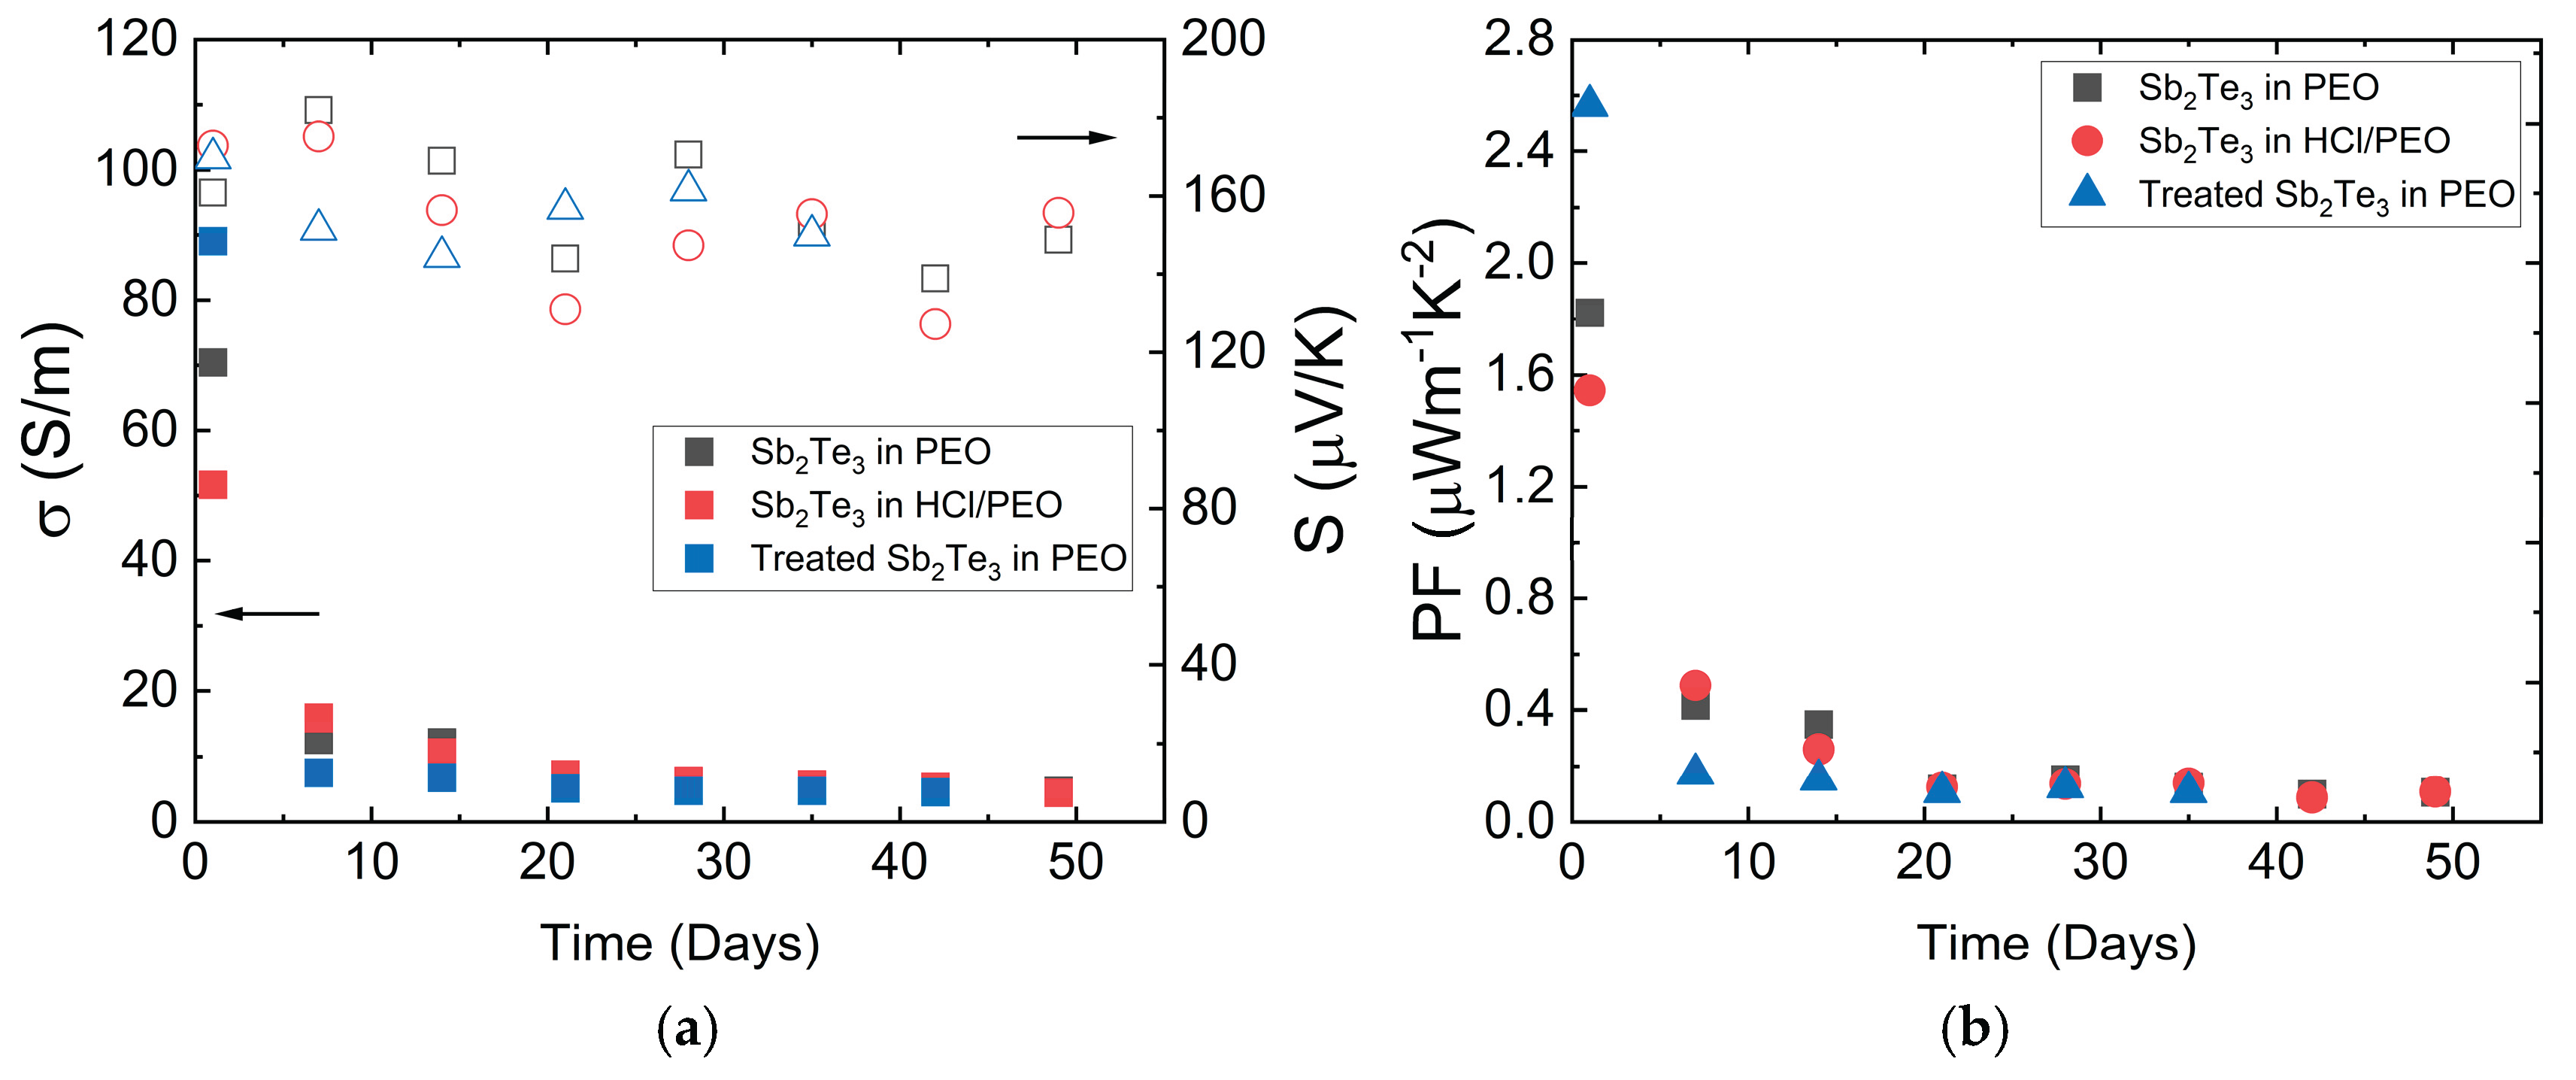
Figure 7.
XPS spectra of a) Sb 3d peaks and b) Te 3d peaks of Sb2Te3 NPs in PEO;.
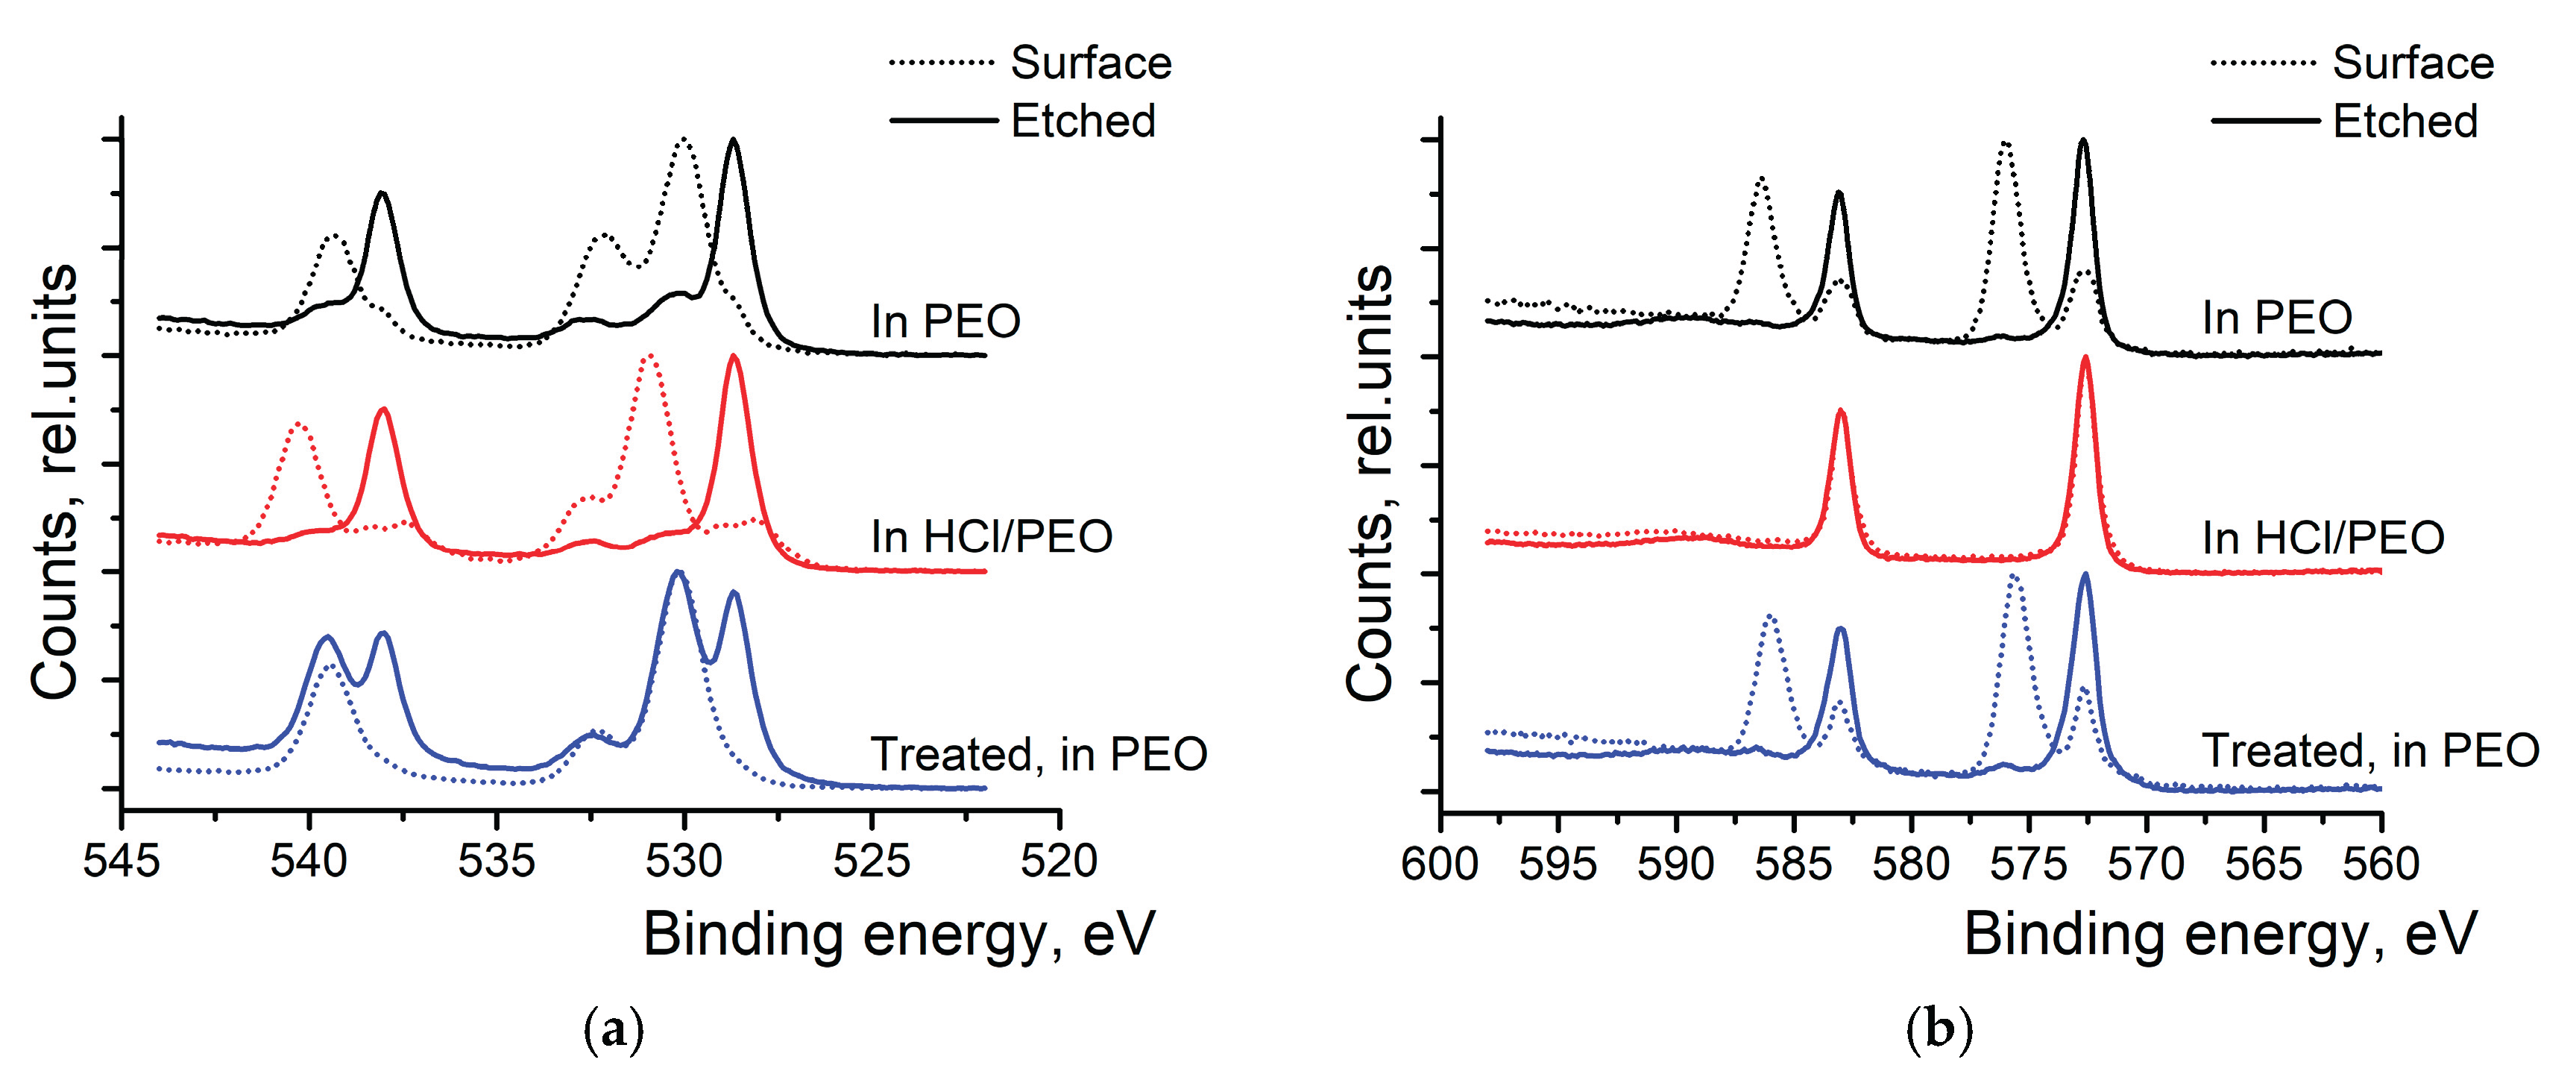
Figure 8.
TE transport properties stability test for samples prepared from 1 year old particles. XPS analysis reveals that HDT treatment leads to significant changes in the surface chemistry, with the appearance of new peaks and shifts in binding energies that indicate successful chemical bonding between the dithiol groups and the NP surface.
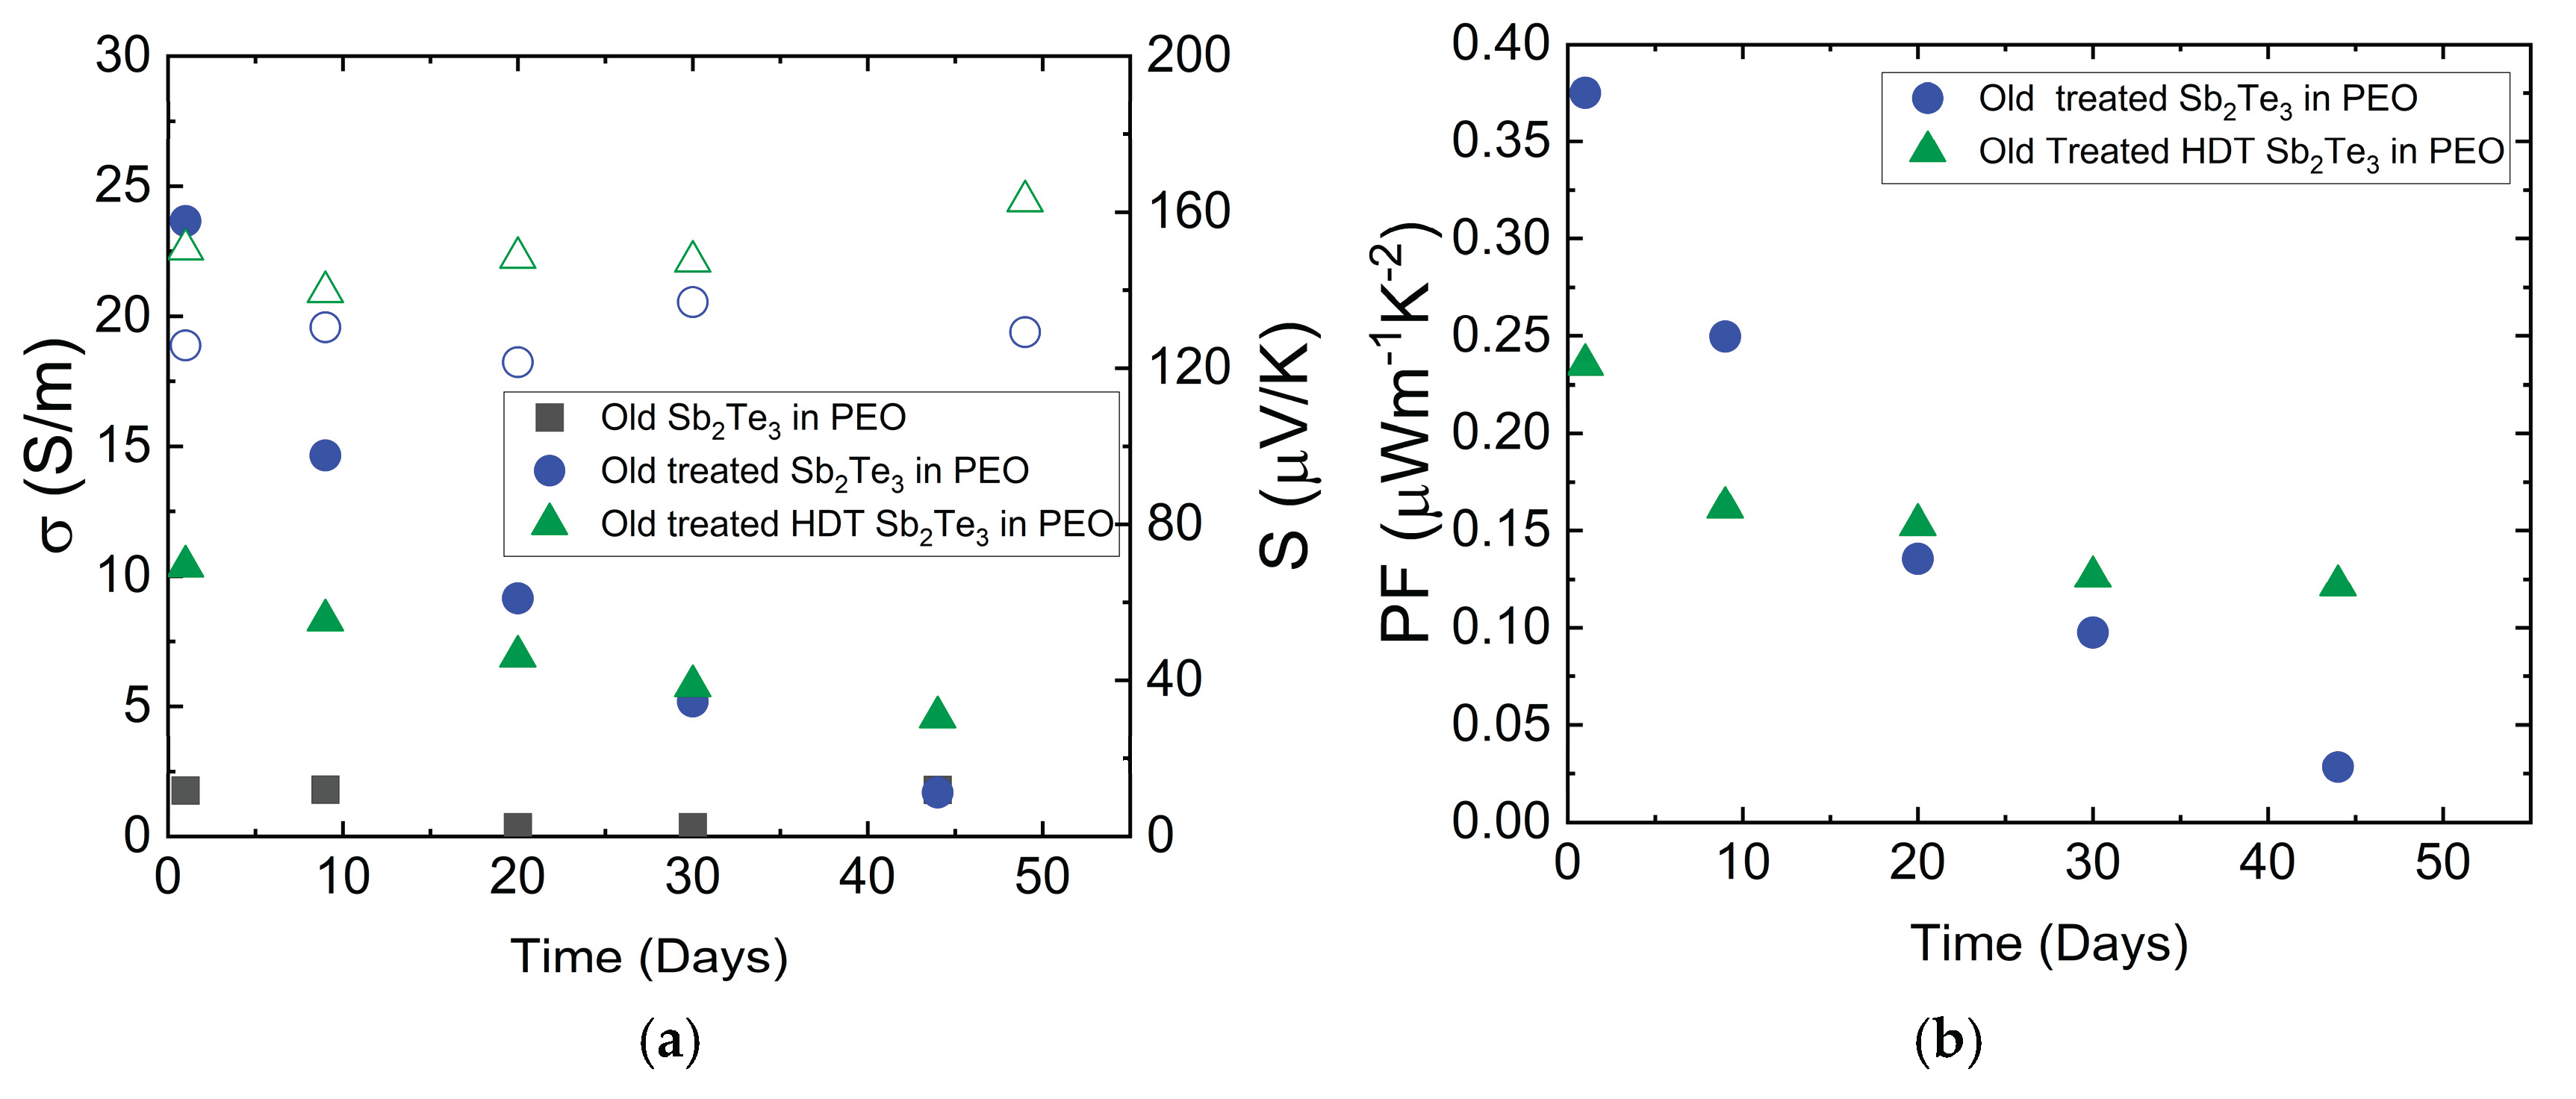
Figure 9.
XPS spectra of S 2p peaks of NPs with the added HDT during their treatment.
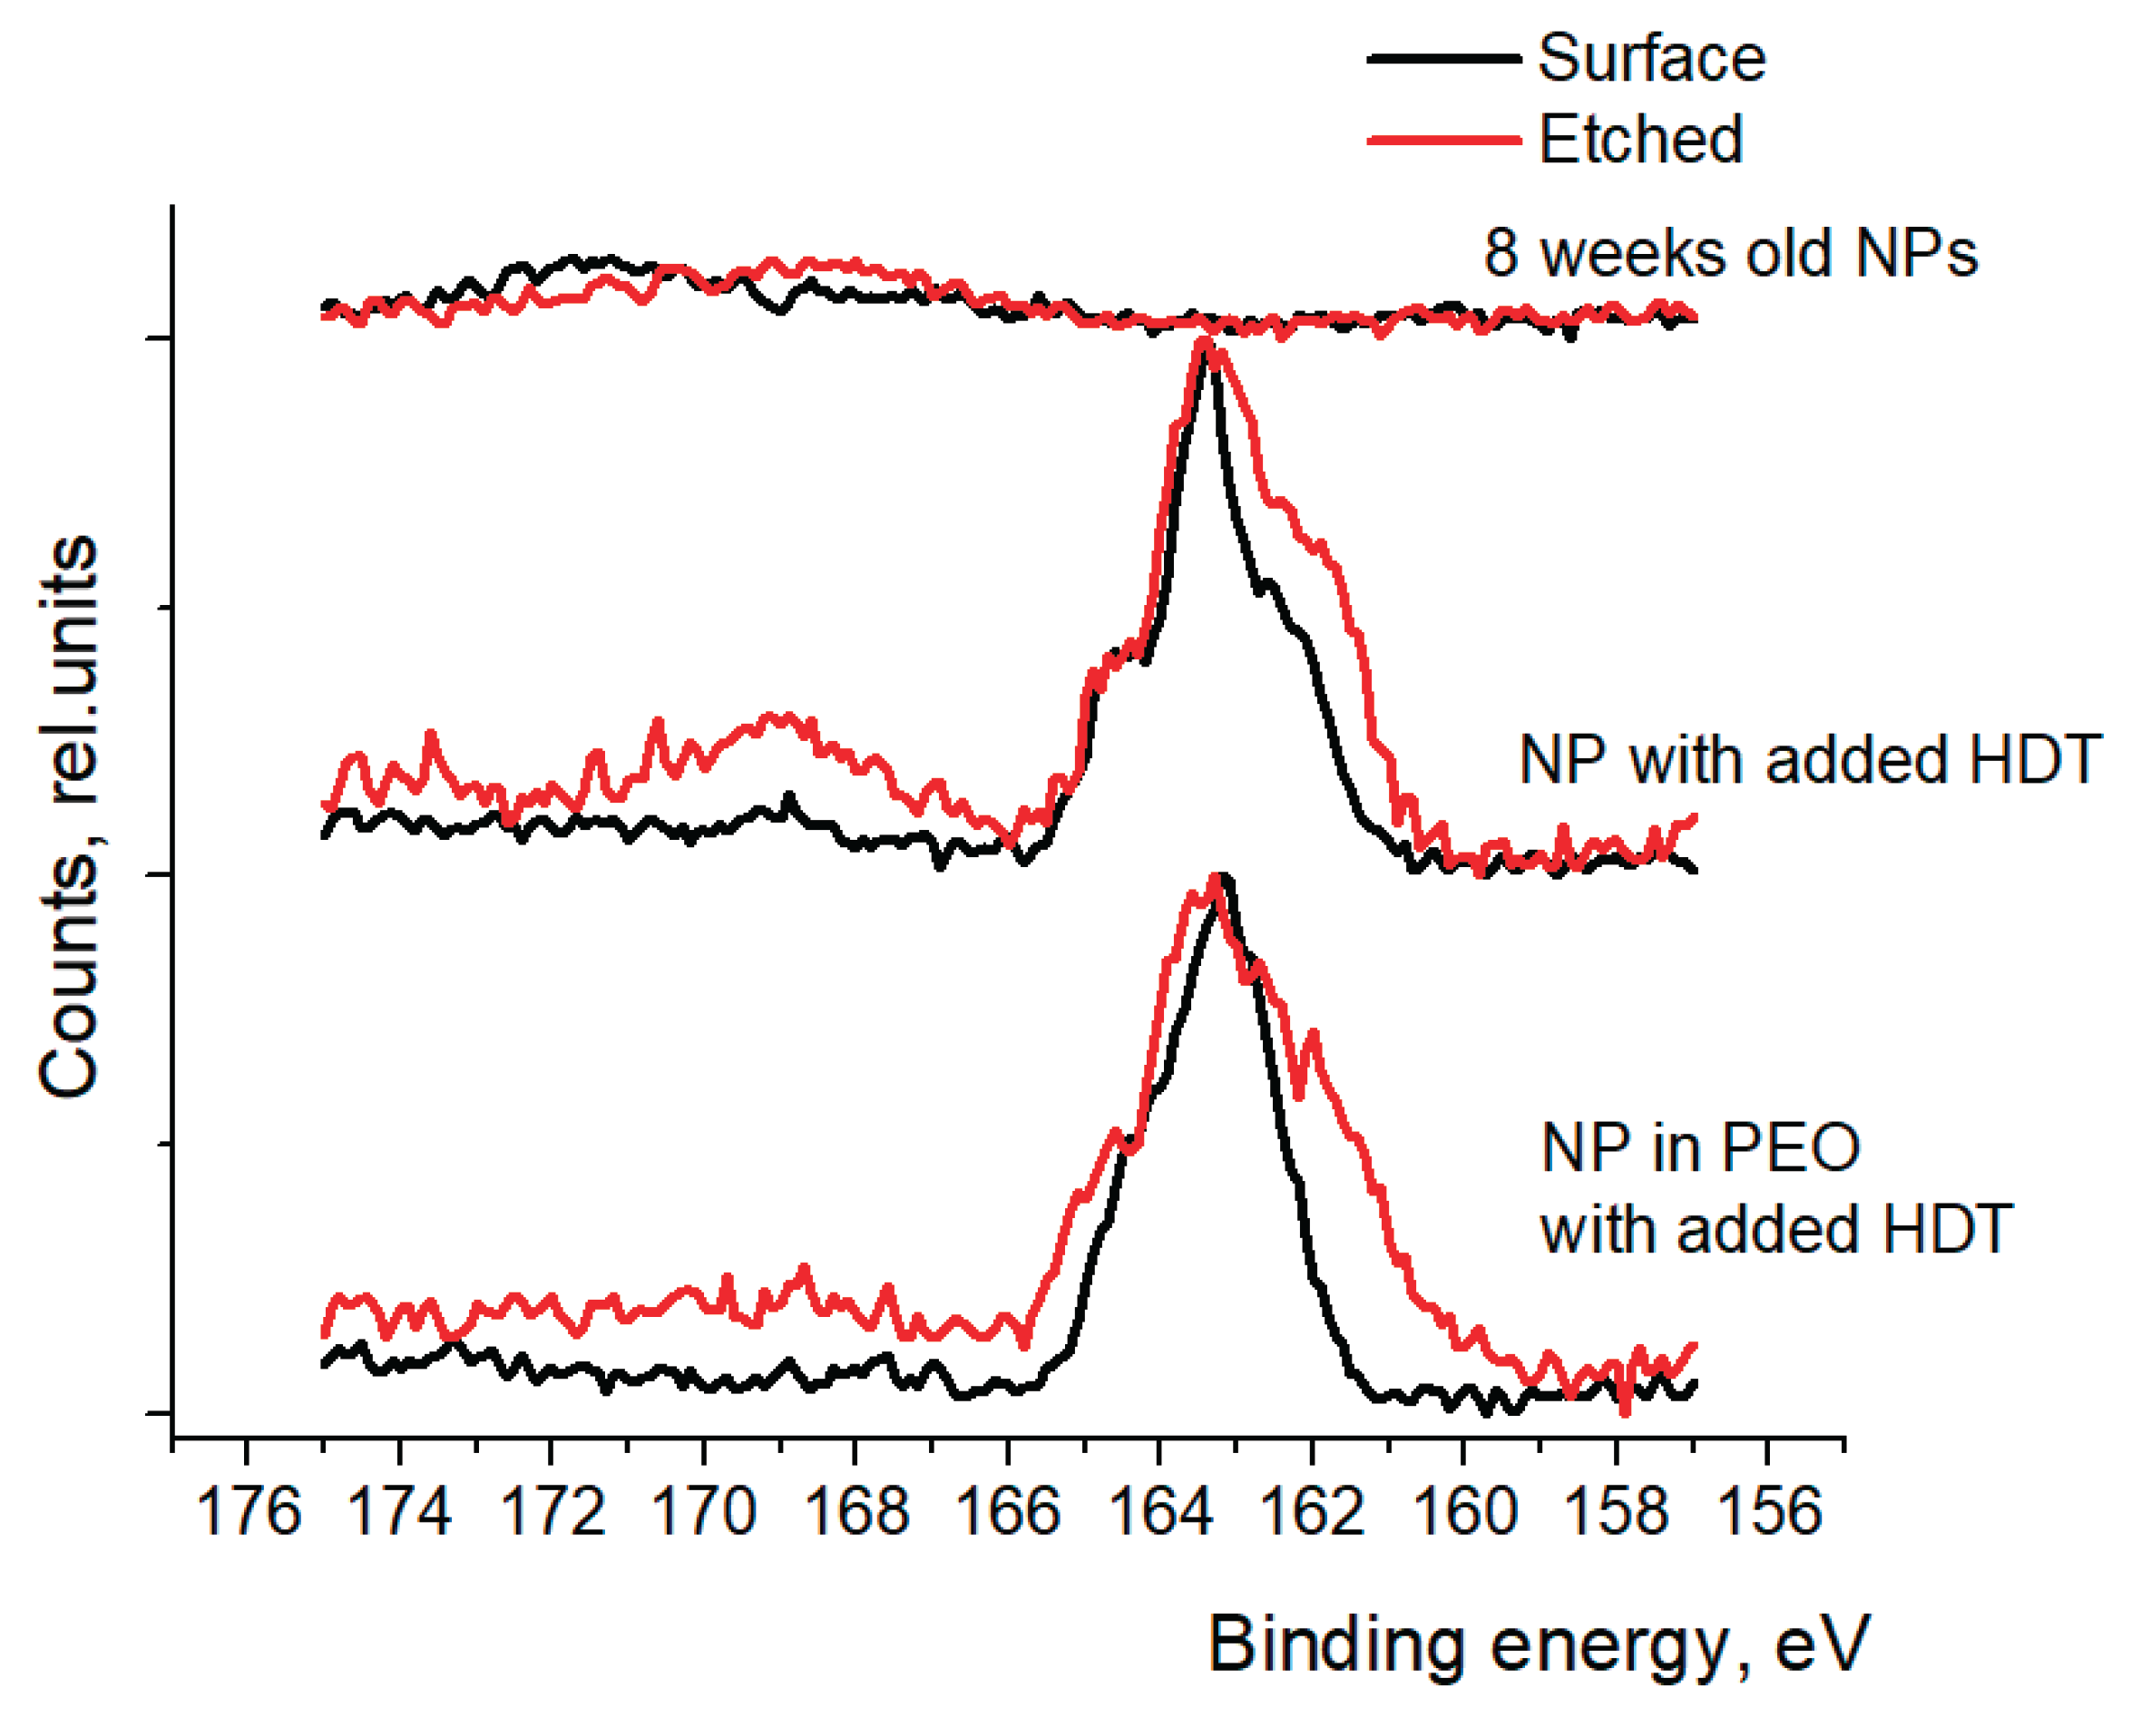
Figure 10.
XPS spectra of (a) Sb 3d peaks and (b) Te 3d peaks of 1 year old Sb2Te3 nanoparticles in PEO after their treatment.
Figure 10.
XPS spectra of (a) Sb 3d peaks and (b) Te 3d peaks of 1 year old Sb2Te3 nanoparticles in PEO after their treatment.
Disclaimer/Publisher’s Note: The statements, opinions and data contained in all publications are solely those of the individual author(s) and contributor(s) and not of MDPI and/or the editor(s). MDPI and/or the editor(s) disclaim responsibility for any injury to people or property resulting from any ideas, methods, instructions or products referred to in the content. |
© 2025 by the authors. Licensee MDPI, Basel, Switzerland. This article is an open access article distributed under the terms and conditions of the Creative Commons Attribution (CC BY) license (http://creativecommons.org/licenses/by/4.0/).
Copyright: This open access article is published under a Creative Commons CC BY 4.0 license, which permit the free download, distribution, and reuse, provided that the author and preprint are cited in any reuse.


