
Submitted:
27 July 2025
Posted:
29 July 2025
You are already at the latest version
Abstract
Natural sand extraction for concrete manufacturing is a global issue for ecological balance and environmental concerns. This study introduced three mixes with 3 newly developed sand types to replace natural sand in concrete manufacturing. Additionally, three more mixes were made by incorporating optimized 10% silica fume. The durability of the prepared mixes was evaluated at high temperatures of (150-750°C) at the interval of 150°C and against a 5% sulphuric acid solution immersion period of 28, 56, 91, and 182 days, respectively. The study's results reported the stability of the samples up to 300°C, and then the fall of the samples started at 450°C. Severe damage in the samples was formed at about 600°C, and finally, a total collapse was seen at 750°C. The mixes with optimized 10% silica fume content showed better resistance against 5% sulphuric acid solution than those without silica fume. The mix with sustainable TYPE 3-Sand combination (50% recycled sand + 45% desert sand + 5% crumb rubber) performed almost the same as the reference mix with TYPE 1-Sand (100% manufactured sand). The mix with TYPE 2-Sand (100% recycled sand) revealed inferior results, low stability, and high damage. Thus, 100% recycled sand is not recommended for structural concrete.
Keywords:
sustainable sand
; desert sand
; crumb rubber
; silica fume
; high temperature
; sulphuric acid
1. Introduction
On a global basis, the amount of solid trash generated each year keeps rising. As per the estimated data, China alone produces about 1.6-2 billion tonnes of Construction & Demolition Waste (CDW) annually. The construction sector is one of the largest waste generators in the European Union (EU), generating approximately 900 million tonnes [1,2], and in the USA and Japan, about 400 and 80 million tonnes annually [3,4]. An estimated 70% of the CDW generated was proposed to be recycled [2,5]. Among the top 10 countries in the world for CDW generation per capita is the Gulf Cooperation Council (GCC) [6,7]. The GCC country, Saudi Arabia, is experiencing rapid economic expansion and exponential population growth. The infrastructure is growing by demolishing old structures and constructing new cities and industries. For this reason, the exponential increment in CDW was seen in the last decade, continuously increasing yearly [8,9,10]. The alarming rise of CDW-related issues in Saudi Arabia necessitates prompt remedial action. For example, Jeddah, the country's second-largest city, produces 8 million tonnes of CDW annually, and other Saudi Arabian cities like Riyadh, Dammam, and the Tabuk region are also affected [11]. The CDW is a problem that requires serious consideration. It could lead to environmental problems, public discomfort, and land use [12,13,14].
The river nations face serious problems with excessive river sand mining for construction activities, especially when using river sand in concrete manufacturing. According to estimates, natural river sand utilization in the construction industry is more than 50 billion tonnes annually. Several adverse effects are noticed by the fast removal of river sand for the construction industry, such as disturbing river ecosystems, harming aquatic life, reducing water levels, and affecting the people living on the riverbank, which are serious environmental concerns [15,16,17]. Many other technical issues raised by mining the river sand include river bed scours, which destroyed the bridges and structures built in the rivers and along the river bank [16,18]. High-quality river sand is the perfect fine aggregate for concrete. For this reason, many river nations export the river sand to many desert nations, and sealing sand is a million-dollar market [18,19,20,21]. So, a serious issue of river sand mining can be addressed by using alternative available materials to replace river sand in the concrete industry without affecting the engineering properties.
Usually, the recycled aggregate from demolished concrete has lower quality and density. Compared to native aggregates, recycled aggregate has a higher water absorption value. Therefore, proper care has been taken to guarantee that concrete created with recycled aggregate has the necessary engineering properties; an appropriate mix design is required to get the required design and target strength [22,23]. Recent studies ascertain that partially adding recycled sand, crumb rubber, and marble waste to new concrete does not impact its mechanical properties [24,25,26,27]. The natural fine aggregate was substituted by recycled sand at the replacement ratios of 20, 50, and 100% studied by Vieira et al. [28]. Another study incorporated replacement ratios of 25, 50, and 100% Carro et al. [29]. In the line published study, the replacement was also noticed by 25, 50, 75, and 100% with natural sand in new concrete Fernández et al. [30]. The published studies found that the replacement level of up to 25% by an equal volume of natural sand showed the same mechanical properties. When the replacement ratio reached 50%, slight variations in strength were noticed, and at 100%, a significant reduction was observed. One pattern is seen in all the studies, where no unique methodology was used to improve the quality of recycled sand. Most of the studies used the recycled sand percentages directly without any treatment. Recycled sand has high water absorption was the main reason of declining mechanical strength at higher replacement ratio. Vacant desert sand and crumb rubber adding with recycled sand could be the option to develop more sustainable sand for concrete manufacturing.
When using or replacing waste resources as sustainable building materials, the most important considerations are safety and the material's usable life. Concrete's durability depends on its capacity to withstand any condition, particularly intense heat and chemical attack. Due to its immediate and long-term devastation, the fire and chemical attack pose a serious risk to buildings and human life. The experimental study tested the design mix concrete at varying elevated temperatures of 25, 250, 500, and 750°C. The study's results reported that recycled sand concrete was inferior to natural sand concrete at elevated temperatures, and at 500°C, the strength was reduced. When the temperature reached 750°C, the samples were found to be wholly damaged, Sarhat and Sherwood [31]. Another study was conducted in experimental research on the temperature range (25-600°C). It has also been shown that concrete made of recycled sand has lower stability than natural sand concrete at elevated temperatures, and the second pattern was also typical, with the rising temperature lowering the strength. At 400°C, almost all the strength of the samples made from recycled sand was gone, and complete damage was seen at [32]. Recycled sand with crumb rubber and steel fiber in new concrete was studied and exposed to high temperatures up to 600 °C. However, increasing the crumb rubber percentages decreased the strength at standard temperature. At higher temperatures, adding crumb rubber resulted in stability in samples and better performance than those without crumb rubber. It could occur due to crumb rubber's ability to absorb heat [33].
According to the thorough literature assessment, many past studies have utilized recycled coarse aggregate in new concrete. However, the use of recycled sand in new concrete is limited. In addition, the durability of the newly papered concrete was not addressed on a large scale to confirm its sustainable life. Furthermore, few experimental investigations on sustainable sand concrete performance are evaluated for durability characteristics. The present study evaluates the durability characteristics of newly prepared concrete samples exposed to high temperatures and acid attacks. This study prepared two types of sand: TYPE 1-Sand (100% Manufactured sand) and TYPE 2-Sand (100% recycled sand). The third TYPE 3-Sand was developed by utilizing the prepared recycled sand (RS), desert sand (DS), along with the crumb rubber (CR) percentages (50% RS+45% DS+5% CR), respectively. The performance of TYPE 1, 2, and 3 sand concrete was evaluated at ambient and elevated temperatures, including axial compressive strength, mass loss, and residual density.
2. Experimental Methodologies of the Study
2.1. Preparation Methodology of Different Sand Types
The manufactured sand (MS) and recycled sand (RS) were crushed at the crushing plant to develop this study's TYPE 1-Sand and TYPE 2-Sand. After several trial observations, the MS and RS particles were separated into three types of fractions (4.75-2.36 mm), (2.36-1.18 mm), and (1.18-0.075 mm), as shown in Table 1. This technique ensures perfect gradation, maintains the fineness modulus (FM), and, most importantly, avoids fine dust particles below 0.075 mm in the developed design mix concrete for this study by TYPE 1-Sand and TYPE 2-Sand. The correct percentages of each fraction are also a matter of concern. Several trials optimized the correct percentage of each fraction to obtain the best combination of MS and RS properties of the sand in concrete, as suggested by [34]. Finally, the best composition was obtained, as mentioned in Table 1. Desert sand (DS) was introduced to develop the green sand combination by adding developed recycled sand (RS) and crumb rubber (CR) fractions. As we know, the DS particles are fine and fail to fulfill the requirement of sand utilization in concrete, as suggested by the [34] code of practice. This study suggests a novel approach to developing green sand by optimizing the fine DS by adding RS and CR in the fraction mentioned in Table 1. After utilizing different fraction combinations, a final combination of (50%RS+45%DS+5%CR) was achieved; at this time, all properties of sand utilization in concrete requirements were maintained [34]. Table 1 shows all the fractions and percentages to develop sand combinations.
2.2. Engineering Properties of Prepared Sand Combinations
The engineering properties of the developed sand combination, such as particle size distribution by gradation curves, and the physical and chemical properties of green sand combination, such as specific gravity and water absorption, sand equivalent value, pH, Sulphate, TDS, and Chloride, were reported as mentioned in Table 2.
2.2.1. Gradation Curves of Prepared Sand Combinations
Figure 1 reports the practice size distribution curves of the three sand TYPES 1, 2, and 3 with the standard limits of gradation set by [35]. TYPE 1-Sand with (100% manufactured sand) showed coarser particles. It can be seen from Figure 1 that the TYPE 1-Sand is close to the lower limits. However, TYPE 1-Sand satisfied the requirement of sand utilization for concrete as the curve lies between the upper and lower bounds [35]. Figure 1 also shows TYPE 2-Sand (100% recycled sand) slightly closer to the lower limit than TYPE 1-Sand. It can be seen from Figure 1 that TYPE 1-Sand and TYPE 2-Sand found almost similar curves. This is because the preparation methodology for both types of sand was the same.
Figure 1 reports the TYPE 3-Sand with the combination (50%recycled sand + 45% desert sand + 5% crumb rubber). The combination of fine desert sand and crumb rubber is part of preparing the TYPE 3-Sand, as shown in Figure 1. The curves of developed TYPE 3-Sand sand were found close to an upper limit. The reason was higher percentages of fine particles in the TYPE-3 Sand. The TYPE 3-Sand falls within the standard limits. Hence, all TYPE 1-Sand, TYPE 2-Sand, and TYPE 3-Sand fall within the standard limits and are suitable for utilization in design mix concrete.
2.2.2. Physical Parameters of Concrete Mix Design
For design, mix concrete using the standard method of [36] with all physical parameters using ACI and ASTM standards listed in Table 2. All physical parameters are evaluated, and each specific parameter must satisfy [36] design mix concrete. A detailed description is given in Table 2. Several methods were used to ensure that the physical material properties met specific requirements, as shown in Table 2. Specific gravity values are essential in calculating the fine aggregate mass for the concrete design mix, and absorption is required to evaluate the extra water. The sand equivalent values developed sand types were also measured. This parameter is measured to identify the sand samples' clay, fine particles, granulated soil, and dust. Over 75% of standard values are acceptable for sand utilization in design mix concrete.
2.3. Design Mix Ingredients and Sample Preparation
In this study, 6 concrete mixes have been prepared. The reference mix has been made with (100% manufactured sand) and TYPE-1 Sand Concrete designated by TYPE-1SC*. The second mix was prepared with TYPE 2-Sand (100% recycled sand), scheduled TYPE-2 Sand Concrete (TYPE-2SC). The combination (50%RS + 45%DS + 5%CR) is used to prepare green sand, which is designated TYPE-3 Sand Concrete (TYPE-3SC). Three additional concrete mixes, TYPE-1SSFC, TYPE-2SSFC, and TYPE-3SSFC, were also prepared by adding 10% optimized silica fume in each designated mix TYPE-1SC*, TYPE-2SC, and TYPE-3SC, respectively.
Table 3 shows the design mix concrete proportion of all 6 prepared mixes of this study. The stepwise detailed methodology for the experimental lab program is described in Figure 2. The detailed experimental process of sample preparation to evaluate the deterioration behavior of newly developed sand concrete by elevated temperatures and submerged in a 5% sulphuric acid (H2SO4) solution is also shown systematically in Figure 2. The sample size of 75 mm diameter and 150 mm of height were placed in electric furnace for evaluated temperature and glass chamber in sulphuric acid (H2SO4) solution. Proper care was taken for each process to avoid errors in the experimental work. Samples were tested for the durability of each mix once the samples were ready after exposure to each selected cycle for the elevated temperature and the sulphuric acid (H2SO4) solution.
2.4. Muffle Furnace
Laboratory equipment of muffle furnace PT-M1200-216L for examination of the performance of concrete specimens at high temperatures, as shown in Figure 2, was utilized in this study. This furnace uses electric wire to increase the inside chamber temperature to a maximum capacity of 1200 °C. The heating rate of the chamber can be adjusted between 0-10°C/min with a continuous working temperature of 1100°C. This study exposed a temperature range of (150-750°C) to each prepared mix. The temperature control program for each temperature range is described in Table 4. The temperature range was designated by (T) in °C and time (t) in min. Each mix was exposed to the required time set in the program, which was 2 hours (120 minutes). The increasing temperature in the program was set at 5 °C per minute, as shown in Table 4. When the cycle of the set program was completed and the temperature reached zero, the furnace was opened for 24 hours. It is because of safety guidelines.
3. Discussion on the Results of the Study
3.1. High Temperature Performance of Newly Developed Concrete
3.1.1. Deterioration of the Samples Under Compressive Strength
The compressive strength of newly developed sand concrete was compared with criteria 1, 2, and 3 selected by [36,37,38]. Criterion 1 stated that the field-cured compressive strength must reach (0.85 f´c = 29.75 MPa). Criterion 2 was the selected design strength (f´c = 35 MPa) for structural concrete, and finally, the target compressive strength (f´cr = 43 MPa) was decided by criterion 3. The deterioration behavior of the prepared mixes TYPE-1SC*, TYPE-2SC, TYPE-3SC with TYPE-1, TYPE-2, and TYPE-3 sand combination and the same mixes with 10% silica fume addition TYPE-1SSFC, TYPE-2SSFC, and TYPE-3SSFC was tested through strength characteristics at ambient temperature (AT) and the elevated temperatures (150-750°C) of interval of each 150°C respectively.
Compare the mix TYPE-1SC* (100% manufactured sand) and the mix TYPE-1SSFC with 10% silica fume optimized, which is reported in Figure 3 (a). The compressive strength at the standard room temperature mixes TYPE-1SC* and TYPE-1SSFC was observed at 35.9 and 42.8 MPa. It can be seen from Figure 3(a) that the addition of silica fume in the mix TYPE-1SSFC showed an increment in the compressive strength, and criteria 1 and 2 successfully passed and almost reached criterion 3 (f´cr = 43 MPa). The compressive strength in the control mix TYPE-1SC* without silica fume at (150-750°C) was reported to be 37.8, 39.6, 29.2, 19.8, and 9.6 MPa, respectively. In the mix, TYPE-1SSFC without 10% silica fume at (150-750°C) was reported to be 43.2, 44.1, 31.4, 23.1, and 12.1 MPa. In the mix, TYPE-2SSFC with 10% silica fume with respect to (w.r.t.) mix TYPE-2SC without silica fume was recorded at 19.2%, 14.3%, 11.4%, 7.5%, 16.6%, and 26% respectively.
Figure 3 (b) compares the mix TYPE-2SC (100% recycled sand) and TYPE-2SSFC with silica fume content of 10%. The mixes TYPE-2SC and TYPE-2SSFC at room temperature were observed at 30.6 and 37.4 MPa. Figure 3 (b) shows that adding silica fume in the mix TYPE-2SSFC showed an increment in the compressive strength, and criteria 1 and 2 successfully passed and failed criterion 3 (f´cr = 43 MPa). The compressive strength in the control mix TYPE-2SC without silica fume (150-750°C) was 32.8, 33.9, 15.9, 10.2, and 3.6 MPa. The compressive strength in the control mix TYPE-2SSFC without 10% silica fume at (150-750°C) was reported to be 38.3, 38.9, 19.6, 13.8, and 4.8 MPa. The increment in the mix TYPE-2SSFC with respect to (w.r.t.) mix TYPE-2SC without silica fume was recorded at 22.2%, 16.8%, 14.7%, 23.3%, 35.2%, and 33.3% respectively.
Compare the mix TYPE-3SC (50% recycled sand + 45% desert sand + 5% crumb rubber) and TYPE-3SSFC with 10% optimized silica fume reported in Figure 3 (c). At the standard room temperature, the compressive strength of the mixes TYPE-3SC and TYPE-3SSFC was observed at 33.9 and 40.9 MPa. The mix TYPE-3SSFC showed an increment in the compressive strength, and criteria 1 and 2 successfully passed and almost reached criterion 3 (f´cr = 43 MPa). The compressive strength in the control mix TYPE-3SC* without silica fume at (150-750°C) was reported to be 35.6, 36.7, 18.8, 13.6, and 8.4 MPa. In the mix, TYPE-3SSFC without 10% silica fume at (150-750°C) was reported to be 41.4, 42.1, 22.8, 17.2, and 10.6 MPa, respectively. The compressive strength increment in the mix TYPE-3SSFC with 10% silica fume with respect to (w.r.t.) mix TYPE-3SC without silica fume was recorded at 20.6%, 16.3%, 14.7%, 21.3%, 26.5%, and 43.2%.
Figure 3 (a-c) shows the compressive strength results of the study. Some patterns were observed in the experimental results. It is seen from the results that newly developed sand concrete TYPE-1SSFC, TYPE-2SSFC, and TYPE-3SSFC with the optimized 10% silica fume performed well at each heating stage (150-750°C) compared to the mixes TYPE-1SC*, TYPE-2SC, and TYPE-3SC. The silica fumes with developed sand help resist temperature, and less deterioration was reported in the samples. Furthermore, it is also pointed out that the design mix TYPE-3SSFC (50% recycled sand+45% desert sand+5% crumb rubber), along with 10% silica fume, performed better than the mix TYPE-2SSFC (100% recycled sand) without silica fume. The rate of strength change at each temperature range in the mix TYPE-3SSFC is less than that of TYPE-2SSFC. It could be because the crumb rubber has high thermal resistance, which was supported by a past published study [44].
3.1.2. Deterioration of the Samples Under Residual Compressive Strength
The estimation of the ratio of the compressive strength at elevated temperatures (150-750°C) w.r.t standard room temperature 25°C is shown in Figure 4. In all mixes, a clear trend was observed that the increment in the strength values was seen in the starting elevated temperatures of 150°C and 300°C. At this temperature range (150-300°C), the free water available in samples starts evaporating. Because of the evaporation of the remaining pores, the concrete mix starts reducing its size. Ultimately, this phenomenon helps to increase the compressive strength at this temperature range (150-300°C) shown in Figure 4. As reported earlier in the materials properties, the maximum amount of water absorption obtained in the TYPE 2-Sand (100% recycled sand) is why more evaporation was found in the mix TYPE-2SC. However, more or less, this instance was found in all the mixes, as shown in Figure 4. Another reason for the increasing strength with temperature is the packing of developed sand in the concrete mixture. The morphology of sand TYPE-1, TYPE-2, and TYPE-3 differs, such as the size and shapes of aggregate distribution affecting the hardened concrete wet density and particle packing. Using different sand combinations in mixes could reveal several reasons for this phenomenon. Furthermore, replacing 10% silica fume with OPC produced additional C-S-H gel, and the decomposition did not start up to 300°C. That is why all mixes showed the same pattern for raising the strength up to 300°C in all samples.
The strength continues to reduce between 450 °C and 600 °C. In all prepared mixes, sudden strength reduction was compared to the strength at standard room temperature at 25 °C. The mix TYPE-1SC* with all-natural ingredients and mix TYPE-1SSFC, when 10% OPC was replaced with silica fume, performed better than other mixes, and the reduction was only about 20% and 27%, respectively. Other mixes reported a 40-50% reduction. At 600°C, more reduction was reported with a similar pattern. TYPE-2SC and TYPE-2SSFC with (100% recycled sand) reported the maximum reduction in the mixes. In the recycled sand mixture, the outer face of the samples was weakened because of the interfacial transition zone (ITZ). Ultimately, more cracks were formed at the early loading. It was continued till the ultimate failure load was reached in the samples. The early formation of cracks helps in reaching early failure, and it was the cause of the reduction in strength.
The mixes TYPE-3SC and TYPE-3SSFC with the sand combination (50% recycled sand + 45% desert sand + 5% crumb rubber) are similar to the reference mix. The crumb rubber resistance against heat was better than that of the samples without crumb rubber, which further caused resistance to concrete breaking. When the temperature reaches above 600 °C, the mixes formed with crumb rubber retain some residual strength, preventing full damage to samples. However, the correct percentage of crumb rubber is a matter of concern; otherwise, it weakens the paste and could further reduce its compressive strength. Therefore, a rubber content of up to 4-8% is recommended for newly developed concrete against higher temperatures. This point of view is supported by a published study [33].
Another important fact is that between 450 °C and 600 °C, the degradation of some siliceous aggregates was found at its peak. As seen in Eq. 1, the dissection of portlandite was the primary reason for decreasing the significant strength in this temperature range (450-600⁰C °C).
At 750⁰C, most of the samples were totally damaged, and the strength evaluation was quite difficult only a few samples were found to be stable, but those that did not fully collapse. The samples with crumb rubber content observed better stability than other mixes, and samples with (100% recycled sand) at 750 °C were almost completely broken. The secondary C-S-H gel formation lost moisture above 300 °C, and the final breakdown was between 600°C and 750°C, responsible for the complete damage of the samples. The thermo-chemical spalling process compromises the structure. Past studies supported this point of view [4,45,46,47,48] and reported similar discussions.
3.2. Performance of the Developed sand Concrete Against Sulphuric Acid
3.2.1. Sulphuric Acid Attack on Prepared Mixes of this Study
Concrete's acid reactivity must be examined in any study on the material's durability characteristics. It is necessary to assess concrete's resistance to acid attacks. Prolonged chemical exposure during the concrete-making process might result in acid corrosion. Rain also contains acids due to air pollution. Rain causes chemical processes that raise the quantities of sulphur dioxide and nitrogen dioxide in the atmosphere and make it more acidic. Carboxylic, sulphuric, and nitric acids make up the majority of rain. The hardened concrete needs to be tested in various acidic solutions to evaluate its resistance to acidic solutions. The present study reported the deterioration of samples against an acid attack (5% H2SO4 solution).
A glass jar was used to evaluate the experimental program to keep the samples at 28, 56, 91, and 182 days in a (5% H2SO4 solution). The purity of sulphuric acid was 97%, and the solution was prepared accordingly. The sulphuric acid solution was agitated 2-3 times per week. The solution pH was measured by a pH meter. After 28 days of the standard curing period of normal water, the samples were transferred to the glass jar with (5% H2SO4 solution) for 28, 56, 91, and 182 days of deterioration of samples against 5% sulphuric acid solution. After completing the duration of each 28, 56, 91, and 182 days, the samples were tested for deterioration against a (5% H2SO4 solution).
3.2.2. Deterioration of Hardened Concrete by Mass
The mass of each mix TYPE-1SC*, TYPE-2SC, TYPE-3SC, TYPE-1SSFC, TYPE-2SSFC, and TYPE-3SSFC samples was taken out from the (5% H2SO4 solution) and measured by Eq. 2 after each duration of 28, 56, 91, and 182 days. After each duration, time was taken by σ2, and before immersion, denoted by σ1. The average change of mass of 3 samples of each mix TYPE-1SC*, TYPE-2SC, TYPE-3SC, TYPE-1SSFC, TYPE-2SSFC, and TYPE-3SSFC after 28, 56, 91, and 182 days in (5% H2SO4 solution) is reported in Figure 5.
The mass loss in the reference mix TYPE-1SC* (100% manufactured sand) and the mix TYPE-1SSFC with 10% optimized silica fume in the reference mix at 28, 56, 91, and 182 days was reported (4.73, 4.78, 4.98, and 4.92) and (4.25, 4.34, 4.25, and 4.12), respectively. Critical observations were obtained from the results of the study. Firstly, the maximum deterioration of samples against a (5% H2SO4 solution) was seen within the first 28 days of immersion, and later on, the rate of deterioration slowed. Secondly, the deterioration was neutralized at 182 days of immersion and did not show further reduction. Finally, it has also been observed that the same mix TYPE-1SSFC with the addition of silica fume has a better resistance against (5% H2SO4 solution) than the mix without silica fume TYPE-1SC*.
The mass loss in the mix TYPE-2SC (100% recycled sand) and TYPE-2SSFC with 10% optimized silica fume in the mix TYPE-2SC at 28, 56, 91, and 182 days was reported (5.49, 5.75, 5.83, and 5.72) and (4.44, 4.46, 4.49, and 4.36) respectively. It has been observed that the pattern of the results is almost similar to the reference mix discussed above. However, the deterioration in samples against a (5% H2SO4 solution) is more than the reference mix. The deterioration was neutralized at 182 days of immersion, similar to the reference mix. It has also been observed that the same mix, TYPE-2SSFC, with the addition of 10% silica fume, has a much better resistance against (5% H2SO4 solution) than the reference mix.
The mass loss in the reference mix TYPE-3SC (50% recycled sand+45% desert sand+5% crumb rubber) and the mix TYPE-3SSFC with 10% optimized silica fume in the mix TYPE-3SC at 28, 56, 91, and 182 days was reported (4.89, 4.92, 5.08 and 5.05) and (4.19, 4.38, 4.16 and 4.08) respectively. The results showed that deterioration in the mix TYPE-3SC and TYPE-3SSFC with and without silica fume was almost similar to the reference mix and found to be better than that with TYPE-2SC (100% recycled sand). However, the pattern of the results was the same in all mixes: the maximum deterioration of samples against a (5% H2SO4 solution) was seen within the first 28 days of immersion, and the rate of deterioration slowed. Secondly, the deterioration was neutralized at 182 days of immersion and did not show further reduction. Finally, it has also been observed that the mix with 10% silica fume has a better resistance against 5% sulphuric acid solution than the mix without silica fume.
It has been concluded from the analysis of the results that the maximum deterioration was reported in the first 28 days when the samples were immersed in a (5% H2SO4 solution). The chemical reaction in the early days was fast because H2SO4 reacted with Ca(OH)2, gypsum precipitated in the solution, and the particles from the samples were removed, which was the reason for reducing the samples' mass. This pattern was similar in all mixes up to 28 days of immersion. However, maximum deterioration was seen in the TYPE-2SC mix (100% recycled sand). It is due to the presence of leftover cement layers in (100% recycled sand) that higher precipitation. Ultimately, more mass reductions were reported. As and when the duration was increased beyond 28 days, the variation in pH was reported, and the neutralization reaction slowed down. A slight variation in mass increment was observed at 56 and 91 days later. This phenomenon was about to be neutralized when the immersion period reached 182 days. Therefore, a negligible reduction was noticed instead of an increase, as seen in Figure 5.
Another interesting fact was that the optimized 10% silica fume incorporation with developed sand found better resistance against (5% H2SO4 solution) than those without silica fume. Because silica fume combines with the calcium hydroxide in the samples to form calcium silicate, its addition reduces mass loss in the hardened concrete. When silica fume dosages mix with water to form a silicate, more C-S-H gel is produced. Eq. 4 illustrates the reaction between gypsum and calcium aluminate to make ettringite, whereas Eq. 3 illustrates gypsum production. Silica fume reacts with calcium hydroxide to form calcium silicate and water, as shown in Eq. 5. Eq. 6 states that these calcium silicates react with water to produce energy, calcium hydroxide, and hydrated calcium silicate. As seen in Eq. 7, silica gel and hydrated calcium sulphate (gypsum) were created when sulphuric acid was introduced to the C-S-H gel from Eq. 6.
Furthermore, the fine particles of silica fume, desert sand, and crumb rubber filled the concrete's micropores, consequently reducing permeability and porosity, thus helping to improve its ability to resist sulphuric acid attack in the mix. In addition, the mix TYPE-3SSFC with a developed sand combination (50% recycled sand + 45% desert sand + 5% crumb rubber) was the best sustainable mix. Due to the fine particles of desert sand, crumb rubber, and silica fume, a cement paste filled the concrete pores of hardened concrete. It helped reduce the porosity of the hardened cement paste, and ultimately, resistance against a (5% H2SO4 solution) was formed. Since the developed concrete utilized different combinations of waste materials, a direct comparison is impossible. However, the results of the most recent investigations substantially resemble those of the published study [49].
3.2.3. Deterioration of Hardened Concrete by Strength
After measuring the mass of samples of each mix, TYPE-1SC* TYPE-2SC, TYPE-3SC, TYPE-1SSFC, TYPE-2SSFC, and TYPE-3SSFC, the compressive strength of the same samples was evaluated. The average of three identical samples reported each mix's compressive strength, and finally, the strength reduction was estimated.
The compressive strength reduction of each mix TYPE-1SC* TYPE-2SC, and TYPE-3SC without silica fume content at 28, 56, 91, and 182 days was reported (5.75, 6.12, 6.61, and 6.8), (6.79, 7.37, 7.6, and 7.94), and (6.09, 6.67, 6.8, and 7.05) respectively. The prepared mixes TYPE-1SSFC, TYPE-2SSFC, and TYPE-3SSFC with 10% optimized silica fume 28, 56, 91, and 182 days were found (4.34, 4.88, 5.47, and 5.56), (5.95, 6.23, 6.36, and 6.14), and (5.05, 5.2, 5.8, and 5.68) as showed in Figure 6.
The lesser the mass loss, the greater the compressive strength reduction. It is also clearly shown by the results from Figure 6 that the mixes TYPE-1SSFC, TYPE-2SSFC, and TYPE-3SSFC with 10% silica fume showed less reduction in compressive strength than the mixes TYPE-1SC* TYPE-2SC, and TYPE-3SC without silica fume content. As per the discussion in the above section on mass loss, the exact utilization of silica fumes helped decrease porosity and happening. The mixes with 10% silica fume content showed better resistance against 5% sulphuric acid solution. The developed mix TYPE-3SSFC with the sand combination (50% recycled sand+45% desert sand+5% crumb rubber), along with 10% silica fume, showed almost the same performance as the reference mix and developed better resistance to acid attack. However, a direct comparison is challenging because the current study is based on recently produced modified sand concrete. The results of this investigation are consistent with past research that used 10% silica fume as a partial substitute for OPC in concrete to prevent sulphuric acid attacks [49,50,51]
3.2.4. Correlation Between Mass Loss and Strength Reduction
Figure 7 shows the correlation of the mixes TYPE-1SC* TYPE-2SC, TYPE-3SC, TYPE-1SSFC, TYPE-2SSFC, and TYPE-3SSFC between mass and compressive strength loss. The correlation in the mixes TYPE-1SC* TYPE-2SC, TYPE-3SC, TYPE-1SSFC, TYPE-2SSFC, and TYPE-3SSFC was examined in (5% H2SO4 solution) at 28, 56, 91, and 182 days. The mass loss in terms of compressive strength reduction in plain concrete was evaluated as a durability factor against acid attack in sustainable concrete performance.
In the mixes TYPE-1SC* TYPE-2SC, TYPE-3SC, TYPE-1SSFC, TYPE-2SSFC, and TYPE-3SSFC with and without silica fume in the 5% sulphuric acid solution at the duration of 28, 56, 91, and 182 days, the coefficient of determination was estimated , , and respectively. Figure 7 also suggests that the correlation coefficient of mass loss regarding compressive strength reduction is high with time because compressive strength reduction decreases with an increase in time in a (5% H2SO4 solution). It also shows that compressive strength reduction decreases with adding silica fume. It can be seen from Figure 7 that the value increased as the duration of the samples increased in a (5% H2SO4 solution). The highest value was reported at an 182-day immersion period . As and when the duration was increased beyond 28 days, the variation in pH was reported, and the neutralization reaction slowed down. A slight variation in mass increment was observed at 56 and 91 days later. This phenomenon was about to be neutralized when the immersion period reached 182 days, and a closed relationship was seen in Figure 7.
4. Morphology of Sustainable Concrete Made by the Different Sand Combinations
The structure of the particle behavior of the prepared mixes TYPE-1SC*, TYPE-2SC, TYPE-3SC, TYPE-1SSFC, TYPE-2SSFC, and TYPE-3SSFC is shown in Figure 8 (a-f). The SEM instrumental analysis was utilized to understand the structural behavior of the prepared mixes. A 5 mm fine powder for each tested mix was used for analysis. The SEM examines a more detailed, enlarged visual depiction of the matrix. The most crucial characterization in concrete mixtures is to search for CSH gel formation, a critical strength formation in the hardened concrete structure. With instrumental SEM analysis, EDS is also employed for elemental analysis of the samples, as shown in Figure 8 (a-f).
TYPE-1SC* with (100% manufactured sand) showed regular voids and some patches of loose CSH and calcite in the mix. In the mix, TYPE-2SC (100% recycled sand) identified the calcite, CSH gel, and traces of Ettringite. TYPE-3SC (50% recycled sand+45% desert sand+5% crumb rubber) calcite crystal, Ettringite grouping, dense CSH formation. The mix TYPE-3SC with crumb rubber content shows denser calcite formation than those without crumb rubber. The crumb rubber found hydroxyl, carbonyl, and sulfonate groups on the surface modification. This surface modification can enhance the interface response between cement matrix materials and crumb rubbers by making the rubber surface hydrophilic and drastically lowering its contact angle with water.
Furthermore, the bond developed between aggregate and SCMs was strengthened by the mineralization process activated by microsilica. In the mix, TYPE-1SSFC with 10% optimized silica fume reported the gypsum mass along with the Ettringite rod and calcite crystal. TYPE-2SSFC (100% recycled sand) and 10% optimized silica fume appear to cause dense CSH and calcite formation in the mix. This is because the leftover cement in recycled aggregate further reacts with silica fume. For the mix, TYPE-3SSFC with (50% recycled sand+45% desert sand+5% crumb rubber) and 10% silica fume content showed that the interface improved by the dense interconnectivity of the concrete mix. It is due to the interface between the paste's crumb rubber and silica fume content. A dense calcite crystal was also seen in the mixture.
The EDS attached with SEM provides the elemental composition of the prepared mixes, as attached in Figure 8 (a-f). The sand with crumb rubber comprises O, Ca, Si, and C, and a minor fraction of Al, Fe, K, and Na, respectively. Furthermore, silica fume in the mixes comprises the main components of O, Ca, C, and Au, with a small quantity of Si with a lesser magnitude of Al, Mg, Fe, and K. Also found a higher magnitude of the main components in terms of O, Ca, and C with getting the lowers range of Si, Mg, Fe, and Al. The mixes TYPE-1SC*, TYPE-2SC, and TYPE-3SC were found to be 23.63%, 21.16%, and 22.07% weight percent, demonstrating that recycled fine aggregate, desert sand, and crumb rubber retain the availability of calcium source. This concrete within microsilica shows better calcium activity of 25.63%, 30.72%, and 31.05% in the mixes TYPE-1SSFC, TYPE-2SSFC, and TYPE-3SSFC. The increased Ca showed unhydrated cementitious elements, mostly leftover cement from recycled sand and freshly added silica fume content.
The instrument XRD-6100 X-ray diffractometer was utilized to examine the X-ray (XRD) and investigate the composition of the complete depth mixes. The samples were crushed into a fine powder to perform an XRD test. The 2θ range in the angle of (5-80º) was assimilated. The all prepared mixes TYPE-1SC*, TYPE-2SC, TYPE-3SC, TYPE-1SSFC, TYPE-2SSFC, and TYPE-3SSFC are presented in Figure 9. The calcite crystal between the angles of (5-80º) of 2θ, numerous peaks were observed. The strong peak was reported at 26º of 2θ. The XRD analysis validated the CaCO3 calcite form, and the pozzolanic activity is consistent [52,53]. The mix TYPE-3SSFC with the combination of (50% recycled sand+45% desert sand+5% crumb rubber) and 10% silica fume content showed an intense peak of calcite in XRD spectra compared to the other mixes. When the microstructure of concrete mixes was improved, the concrete matrix became more resilient due to the higher calcite content. Moreover, higher calcite levels were associated with stronger concrete matrix interconnectivity and higher recovery outcomes regarding compressive strength and temperature resistance. This phenomenon is more active when silica fume is added to the newly developed sand types. It has also been observed that the TYPE 2-Sand (100% recycled sand) added with 10% optimized silica content increases the hydration process because extra leftover layers of recycled sand help increase the hydration and produce secondary CSH gel in the mixes. Furthermore, adding the crumb rubber content provides more dense interconnectivity of the concrete mix. It is due to the interface between crumb rubber and the silica fume content of the paste.
4. Scope and Limitations of the Study
The scope of the study was to replace 100% natural sand with a newly developed sustainable sand combination (recycled sand + desert sand + crumb rubber) to provide sustainable sand for the concrete industry. Most concrete producers prefer using 100% natural sand, such as river sand. The concrete industry benefited from using solid waste as sand for concrete rather than easily accessible natural materials for several reasons, such as river ecological balance, seashore disturbance, and other harmful environmental effects. This study will help evaluate whether the sand produced by this research may be used domestically and abroad to build concrete structures instead of natural sand-based concrete, such as that found in rivers.
There are several limitations of this study. First of all, locally available recycled sand and desert sand were utilized in this study. Using desert sand from other countries may affect its physical and chemical properties. No standard methodology is available for the preparation and utilization of recycled concrete. For this reason, different studies showed variations in results even with the same replacement ratio. That could alter the findings of this study. In addition, standard requirements for measuring the durability of prepared concrete at elevated temperatures and under sulphuric acid solution are not available. All studies are based on past judgments of the published studies. It would affect the validation of results.
5. Conclusions
In this study, three concrete mixes were prepared with newly developed sand: TYPE 1-Sand with (100% manufactured sand), TYPE 2-Sand (100% recycled sand), and TYPE 3-Sand with the combination (50% recycled sand + 45% desert sand + 5% crumb rubber). Three additional mixes were also prepared by adding 10% silica fume content to each mix. The durability of these prepared mixes was evaluated by exposing the samples of prepared mixes to high temperatures. The durability against (5% H2SO4 solution) was also measured at 28, 56, 91, and 182 days of immersion. The gripping conclusions of this study have been listed pointwise as follows.
- It is concluded from the results of the study that newly developed sand concrete TYPE-1SSFC, TYPE-2SSFC, and TYPE-3SSFC with the optimized 10% silica fume showed less deterioration in the samples at each heating stage (150-750°C) compared to the mixes TYPE-1SC*, TYPE-2SC, and TYPE-3SC without silica fume content.
- It is also concluded that the sustainable design mix TYPE-3SSFC with the sand combination (50% recycled sand + 45% desert sand + 5% crumb rubber) performed better than the mix TYPE-2SSFC (100% recycled sand). The rate of strength change at each temperature range in the mix TYPE-3SSFC is less than that of TYPE-2SSFC. It could be because the crumb rubber has high thermal resistance.
- It has been concluded from the analysis of the results that the maximum deterioration was reported in the first 28 days when the samples were immersed in a (5% H2SO4 solution). The chemical reaction in the early days was fast because H2SO4 reacted with Ca(OH)2, gypsum precipitated in the solution, and the particles from the samples were removed, which was the reason for reducing the samples' mass. This pattern was similar in all mixes up to 28 days of immersion. A slight variation in mass increment was observed at 56 and 91 days later. This phenomenon was about to be neutralized when the immersion period reached 182 days.
- A linear correlation coefficient of mass loss for compressive strength reduction was obtained with the duration of immersion. It can be found from the results that the value increased as the duration of samples increased, and the highest value was reported at 182 days of immersion period . As and when the duration was increased beyond 28 days, the variation in pH was reported, and the neutralization reaction slowed down. A slight variation in mass increment was observed at 56 and 91 days later. This phenomenon would be neutralized when the immersion period reached about 182 days.
- The microstructural investigation (SEM-EDS) in the prepared concrete with TYPE 3-Sand combination shows the establishment of CSH gel and calcite crystals, which solidify into a solid mass, creating a more compact and solid matrix microstructure. It was due to the availability of calcite precipitations in recycled sand and silica fume in the mix. Hence, it concluded that it was crucial to stabilize the solid matrix structure, which ensured better stability against high thermal resistance and acid attacks.
- The mix with sustainable TYPE 3-Sand combination (50% recycled sand + 45% desert sand + 5% crumb rubber) performed almost the same as the reference mix with all natural materials. The mix with TYPE 2-Sand (100% recycled sand) revealed inferior results, low stability, and high damage. Thus, 100% recycled sand is not recommended for structural concrete. Finally, it has been concluded that the developed TYPE 3-Sand with optimized 10% silica fume content showed better resistance against high temperatures and (5% H2SO4 solution).
Author Contributions
Conceptualization, JKN and MNA; methodology, MNA; validation, MNA and JKN; formal analysis, MNA; investigation, JKN; resources, MNA; data curation, MNA; writing—original draft preparation, MNA; writing—review and editing, JKN; visualization, JKN; supervision, JKN; funding acquisition, JKN. All authors have read and agreed to the published version of the manuscript.
Funding
No funding.
Data Availability Statement
The data are available in the manuscript.
Conflicts of Interest
No conflicts of interest.
References
- C. Fischer, M. Werge, and A. Reichel, "EU as a Recycling Society," European Topic Centre on Resource Waste Management, Working Paper 2/2009, 2009.
- P. V. Sáez, M. Merino, and C. Porras-Amores, "Managing construction and demolition (C&D) waste–a European perspective," in International Conference on Petroleum and Sustainable Development, 2011, vol. 26, pp. 27-31.
- L. Arpitha, Z. Fathima, G. Dhanyashree, and R. Yeshaswini, "Construction & demolition waste: Overview, insights, management, reviews and its future," Smart Cities and Sustainable Manufacturing, pp. 275-293, 2025.
- M. N. Akhtar, M. Jameel, Z. Ibrahim, and N. M. Bunnori, "Incorporation of recycled aggregates and silica fume in concrete: an environmental savior-a systematic review," Journal of Materials Research and Technology, 2022.
- V. Monier, S. Mudgal, M. Hestin, M. Trarieux, and S. Mimid, "Service contract on management of construction and Demolition Waste–SR1," Final Report Task, vol. 2, p. 240, 2011.
- O. Ouda, H. Peterson, M. Rehan, Y. Sadef, J. Alghazo, and A. Nizami, "A case study of sustainable construction waste management in Saudi Arabia," Waste and Biomass Valorization, vol. 9, no. 12, pp. 2541-2555, 2018.
- M. Mawed, M. S. Al Nuaimi, and G. Kashawni, "Construction and demolition waste management in the uae: Application and obstacles," GEOMATE Journal, vol. 18, no. 70, pp. 235-245, 2020.
- A.-S. Nizam, M. Rehan, I. M. Ismail, T. Almeelbi, and O. Ouda, "Waste Biorefinery in Makkah: A Solution to Convert Waste produced during Hajj and Umrah Seasons into Wealth. pdf," 2015.
- A.-S. Nizami et al., "Waste biorefineries: enabling circular economies in developing countries," Bioresource technology, vol. 241, pp. 1101-1117, 2017.
- A. Nizami et al., "An argument for developing waste-to-energy technologies in Saudi Arabia," Chemical Engineering Transactions, vol. 45, pp. 337-342, 2015.
- A. Alzaydi, "Recycling Potential of Construction and Demolition Waste in GCC Countries," presented at the Scientific Forum in the Recycling of Municipal Solid Waste, Jeddah, Saudi Arabia, 2014.
- S. Kabir, Al-Ismaeel, A.A., Bu Aeshah, A.Y., Al-Sadun, F.S, "Sustainable management program for construction waste," presented at the 9th International Concrete Conference & Exhibition, Manama, 2013.
- S. Nazar, " Recycle construction waste, save mountains: activist.," Accessed on 20 Aug 2017 2010.
- A. M. Halahla, M. Akhtar, and A. H. Almasri, "Utilization of demolished waste as coarse aggregate in concrete," Civil Engineering Journal, vol. 5, no. 3, pp. 540-551, 2019.
- L. Koehnken and M. Rintoul, "Impacts of Sand Mining on Ecosystem Structure," Process & Biodiversity in Rivers WWF, Swiss, 2018.
- M. Bendixen, J. Best, C. Hackney, and L. L. Iversen, "Time is running out for sand," ed: Nature Publishing Group, 2019.
- J. Best, "Anthropogenic stresses on the world’s big rivers," Nature Geoscience, vol. 12, no. 1, pp. 7-21, 2019.
- M. N. Akhtar, A. Alotaibi, and N. I. Shbeeb, "River Sand Replacement with Sustainable Sand in Design Mix Concrete for the Construction Industry," Civil Engineering Journal, vol. 11, no. 1, pp. 201-214, 2025.
- L. Koehnken and M. Rintoul, "Impacts of sand mining on ecosystem structure, process and biodiversity in rivers," World Wildlife Fund International, vol. 159, 2018.
- L. Gallagher and P. Peduzzi, "Sand and sustainability: Finding new solutions for environmental governance of global sand resources," 2019.
- M. N. Akhtar, K. A. Bani-Hani, D. A. H. Malkawi, and O. Albatayneh, "Suitability of sustainable sand for concrete manufacturing-A complete review of recycled and desert sand substitution," Results in Engineering, p. 102478, 2024.
- N. Bairagi, H. Vidyadhara, and K. Ravande, "Mix design procedure for recycled aggregate concrete," Construction and Building Materials, vol. 4, no. 4, pp. 188-193, 1990.
- Y.-H. Lin, Y.-Y. Tyan, T.-P. Chang, and C.-Y. Chang, "An assessment of optimal mixture for concrete made with recycled concrete aggregates," Cement and concrete research, vol. 34, no. 8, pp. 1373-1380, 2004.
- L. Evangelista and J. de Brito, "Mechanical behaviour of concrete made with fine recycled concrete aggregates," Cement and concrete composites, vol. 29, no. 5, pp. 397-401, 2007.
- M. Guendouz, D. Boukhelkhal, L. Benatallah, S. Hamraoui, and M. Hadjadj, "Feasibility of recycling marble waste powder as fine aggregate in self-compacting sand concrete," Studies in Engineering and Exact Sciences, vol. 6, no. 1, pp. e13171-e13171, 2025.
- M. R. Rafi, S. Omary, A. Faqiri, and E. Ghorbel, "Recycling Marble Waste from Afghan Mining Sites as a Replacement for Cement and Sand," Buildings, vol. 15, no. 2, p. 164, 2025.
- G. Mahran, A. B. ElDeeb, M. M. Badawy, and A. I. Anan, "Enhanced mechanical properties of concrete using pre-treated rubber as partial replacement of fine aggregate," Innovative Infrastructure Solutions, vol. 10, no. 3, pp. 1-14, 2025.
- T. Vieira, A. Alves, J. De Brito, J. Correia, and R. Silva, "Durability-related performance of concrete containing fine recycled aggregates from crushed bricks and sanitary ware," Materials & Design, vol. 90, pp. 767-776, 2016.
- D. CarroYLόpez, B. GonzálezYFonteboa, F. MartínezYAbella, I. GonzálezYTaboada, J. de Britob, and F. VarelaYPugaa, "Proportioning, microstructure and fresh properties of selfYcompacting concrete with recycled sand," Procedia engineering, vol. 171, pp. 645-657, 2017.
- E. Fernández-Ledesma, J. Jiménez, J. Ayuso, V. Corinaldesi, and F. Iglesias-Godino, "A proposal for the maximum use of recycled concrete sand in masonry mortar design," Materiales de Construcción, vol. 66, no. 321, p. 075, 2016.
- S. R. Sarhat and E. G. Sherwood, "Residual mechanical response of recycled aggregate concrete after exposure to elevated temperatures," Journal of materials in civil engineering, vol. 25, no. 11, pp. 1721-1730, 2013.
- H. Salahuddin, A. Nawaz, A. Maqsoom, and T. Mehmood, "Effects of elevated temperature on performance of recycled coarse aggregate concrete," Construction and Building Materials, vol. 202, pp. 415-425, 2019.
- Y.-c. Guo, J.-h. Zhang, G.-m. Chen, and Z.-h. Xie, "Compressive behaviour of concrete structures incorporating recycled concrete aggregates, rubber crumb and reinforced with steel fibre, subjected to elevated temperatures," Journal of cleaner production, vol. 72, pp. 193-203, 2014.
- ACI-211.1, "Standard practice for selecting proportions for normal, heavyweight, and mass concrete," in American Concrete Institute, 1991.
- ASTM-C136-06, "Standard Test Method for Sieve Analysis of Fine and Coarse Aggregates," 2006.
- Standard practice for selecting proportions for normal, heavyweight, and mass concrete, ACI-211.1-91, Nov. 1, 1991 1991.
- ACI-318, "Building code requirements for structural concrete (ACI 318-08) and commentary," 2008: American Concrete Institute.
- A. C. Institute, "ACI 214R-11: Guide to evaluation of strength test results of concrete," 2011: American Concrete Institute.
- ASTM-C33, "C33,“Standard Specification for Concrete Aggregates,” ASTM International, vol. i, no," ed: C, 2003.
- A. Standard, "ASTM-C127-07: Standard Test Method for Density, Relative Density (Specific Gravity), and Absorption of Coarse Aggregate," Stand. test method Specif. gravity Absorpt, 2007.
- Standard Test Method for Density, Relative Density (specific gravity), and Absorption of Fine Aggregates," ed, , ASTM-C128-88, 2001.
- Standard Test Method for Sand Equivalent Value of Soils and Fine Aggregate, ASTM-D-2419-74, 2014.
- C. ASTM, "Standard test method for bulk density (“unit weight”) and voids in aggregate," American Society for Testing and Materials, Annual Book: West Conshohocken, PA, USA, 2009.
- A. Fadiel, F. Al Rifaie, T. Abu-Lebdeh, and E. Fini, "Use of crumb rubber to improve thermal efficiency of cement-based materials," American Journal of Engineering and Applied Sciences, vol. 7, no. 1, pp. 1-11, 2014.
- J.-C. Liu, K. H. Tan, and Y. Yao, "A new perspective on nature of fire-induced spalling in concrete," Construction and Building Materials, vol. 184, pp. 581-590, 2018.
- M. Adamu, Y. E. Ibrahim, and H. Alanazi, "Evaluating the Influence of Elevated Temperature on Compressive Strength of Date-Palm-Fiber-Reinforced Concrete Using Response Surface Methodology," Materials, vol. 15, no. 22, p. 8129, 2022.
- M. N. Akhtar, Z. Ibrahim, N. M. Bunnori, M. Jameel, N. Tarannum, and J. Akhtar, "Performance of sustainable sand concrete at ambient and elevated temperature," ed: Elsevier, 2021.
- M. Khan, M. Cao, X. Chaopeng, and M. Ali, "Experimental and analytical study of hybrid fiber reinforced concrete prepared with basalt fiber under high temperature," Fire and Materials, vol. 46, no. 1, pp. 205-226, 2022.
- A. Khodabakhshian, M. Ghalehnovi, J. De Brito, and E. A. Shamsabadi, "Durability performance of structural concrete containing silica fume and marble industry waste powder," Journal of cleaner production, vol. 170, pp. 42-60, 2018.
- B. S. Thomas, R. C. Gupta, and V. J. Panicker, "Recycling of waste tire rubber as aggregate in concrete: durability-related performance," Journal of Cleaner Production, vol. 112, pp. 504-513, 2016.
- E. Hewayde, M. L. Nehdi, E. Allouche, and G. Nakhla, "Using concrete admixtures for sulphuric acid resistance," Proceedings of the Institution of Civil Engineers-Construction Materials, vol. 160, no. 1, pp. 25-35, 2007.
- A. Arivumangai, R. Narayanan, and T. Felixkala, "Study on sulfate resistance behaviour of granite sand as fine aggregate in concrete through material testing and XRD analysis," Materials Today: Proceedings, vol. 43, pp. 1724-1729, 2021.
- V. S. Kashyap, G. Sancheti, J. S. Yadav, and U. Agrawal, "Smart sustainable concrete: enhancing the strength and durability with nano silica," Smart Construction and Sustainable Cities, vol. 1, no. 1, p. 20, 2023.
Figure 1.
Particle size distribution curves.
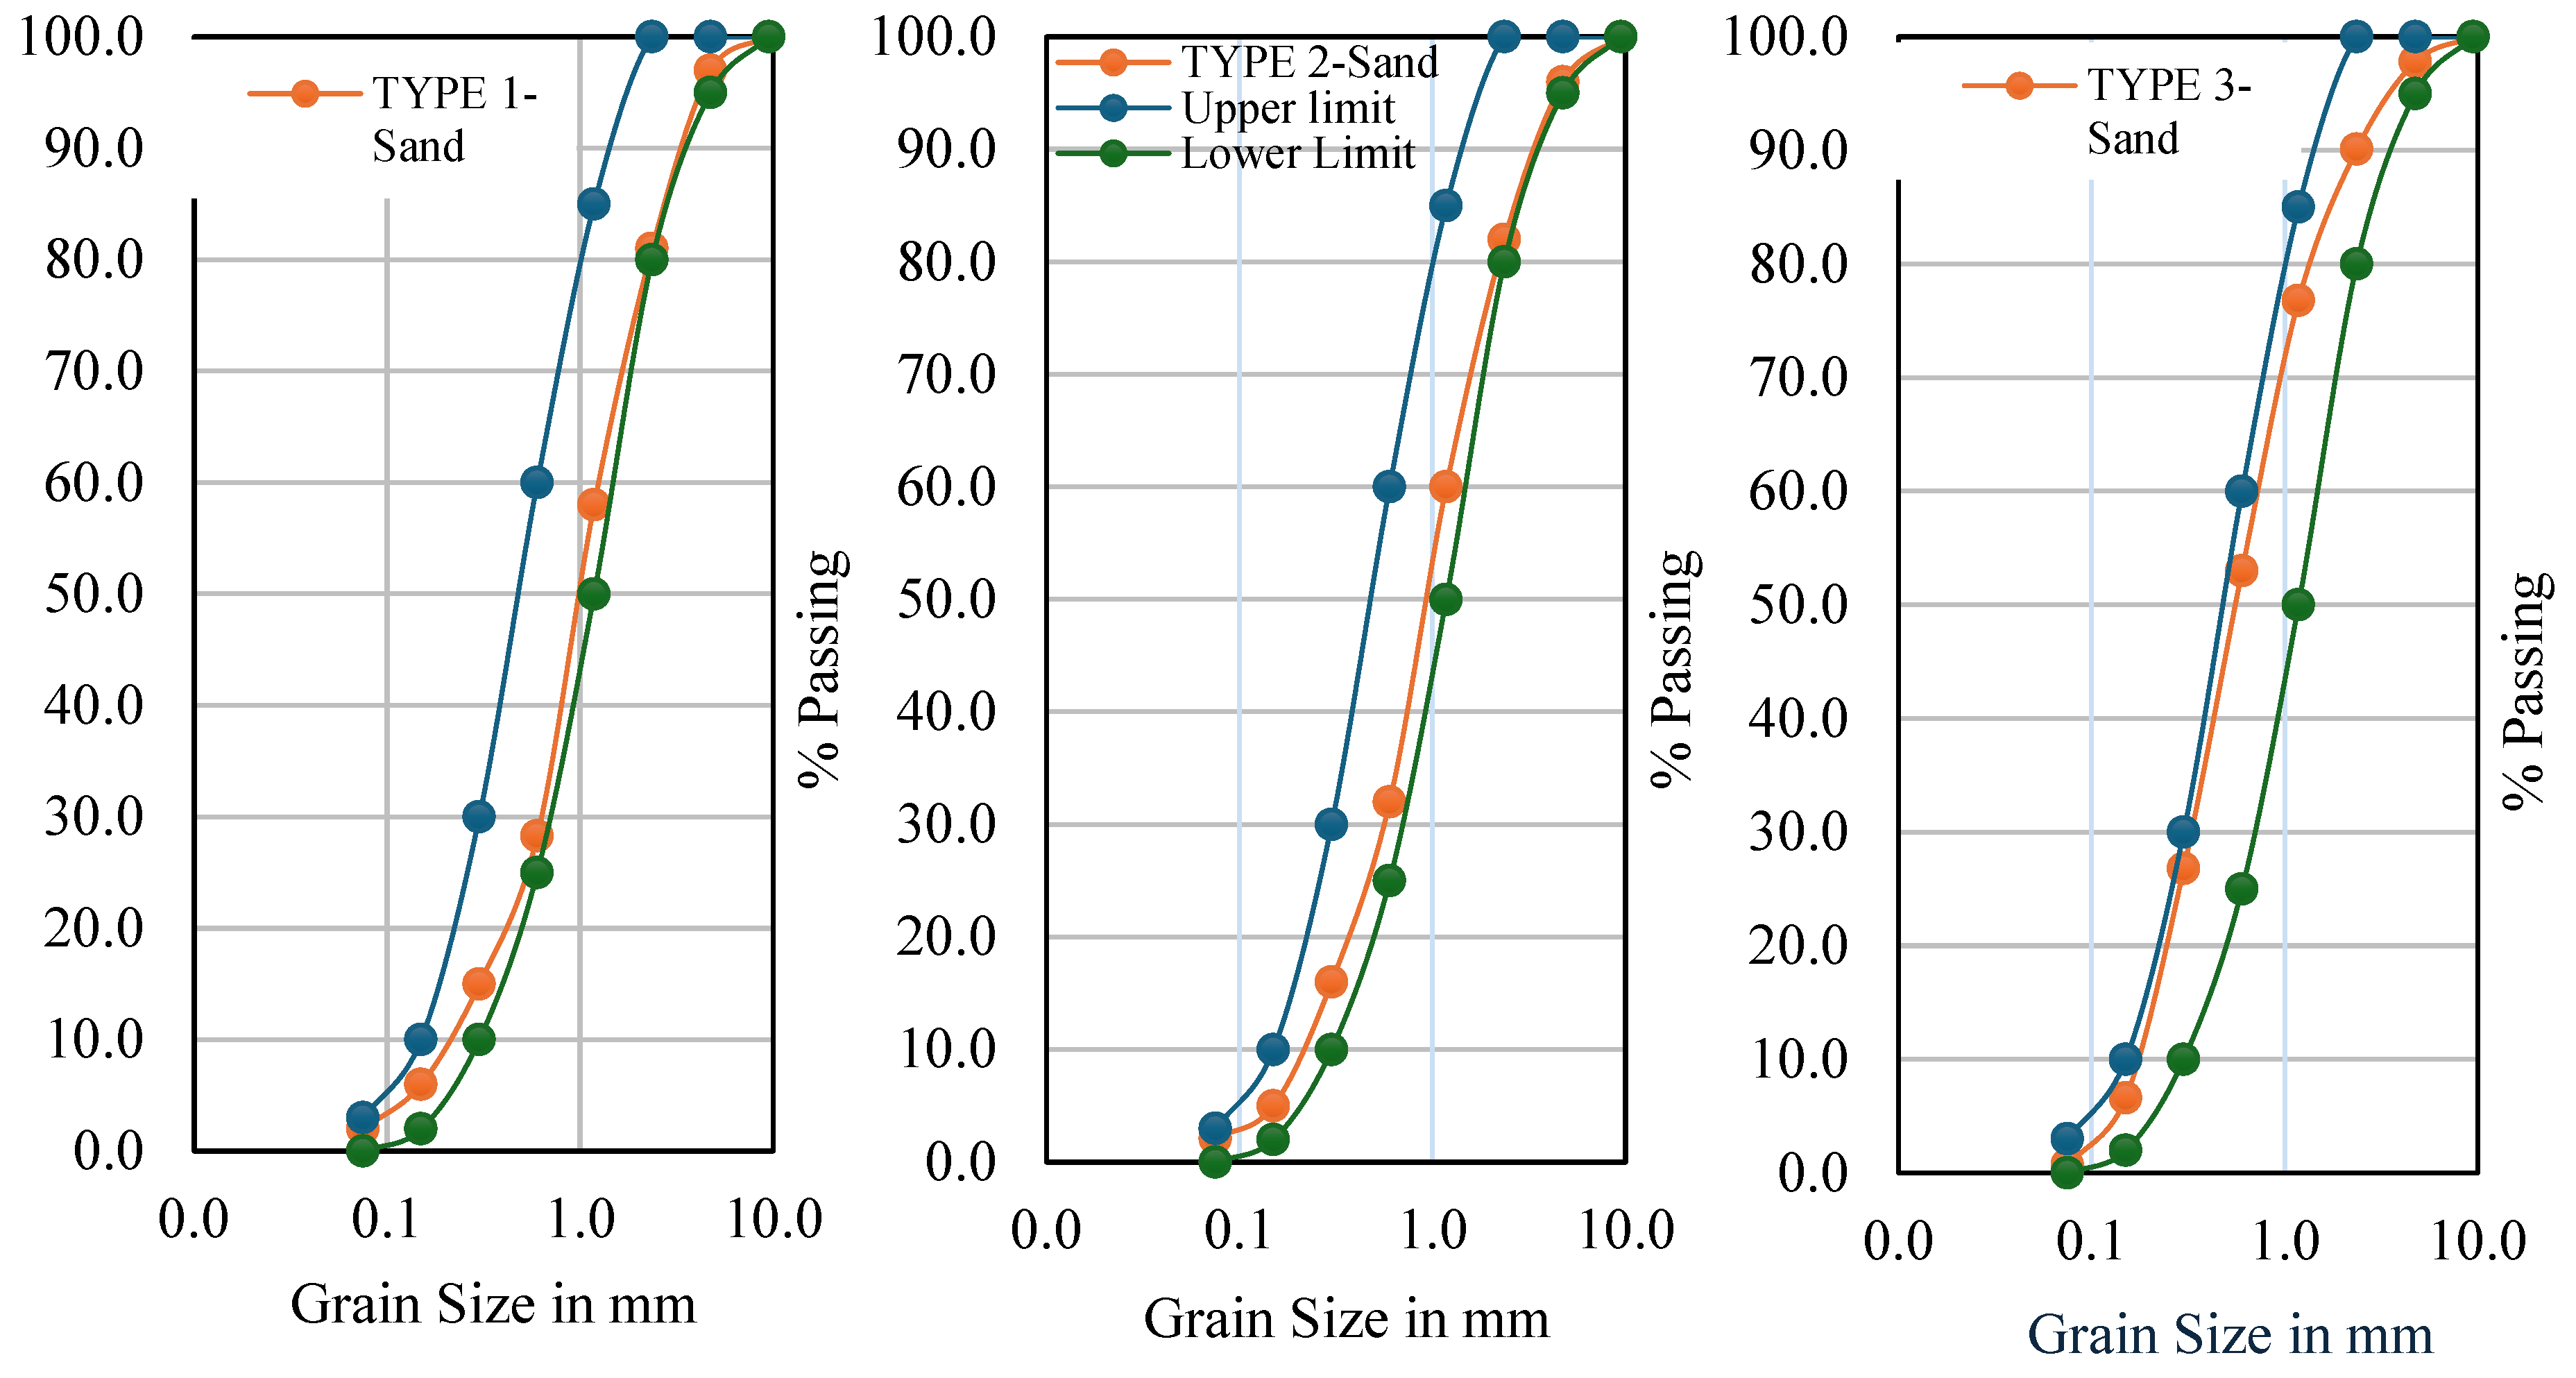
Figure 2.
Detailed setup of lab work for this study.
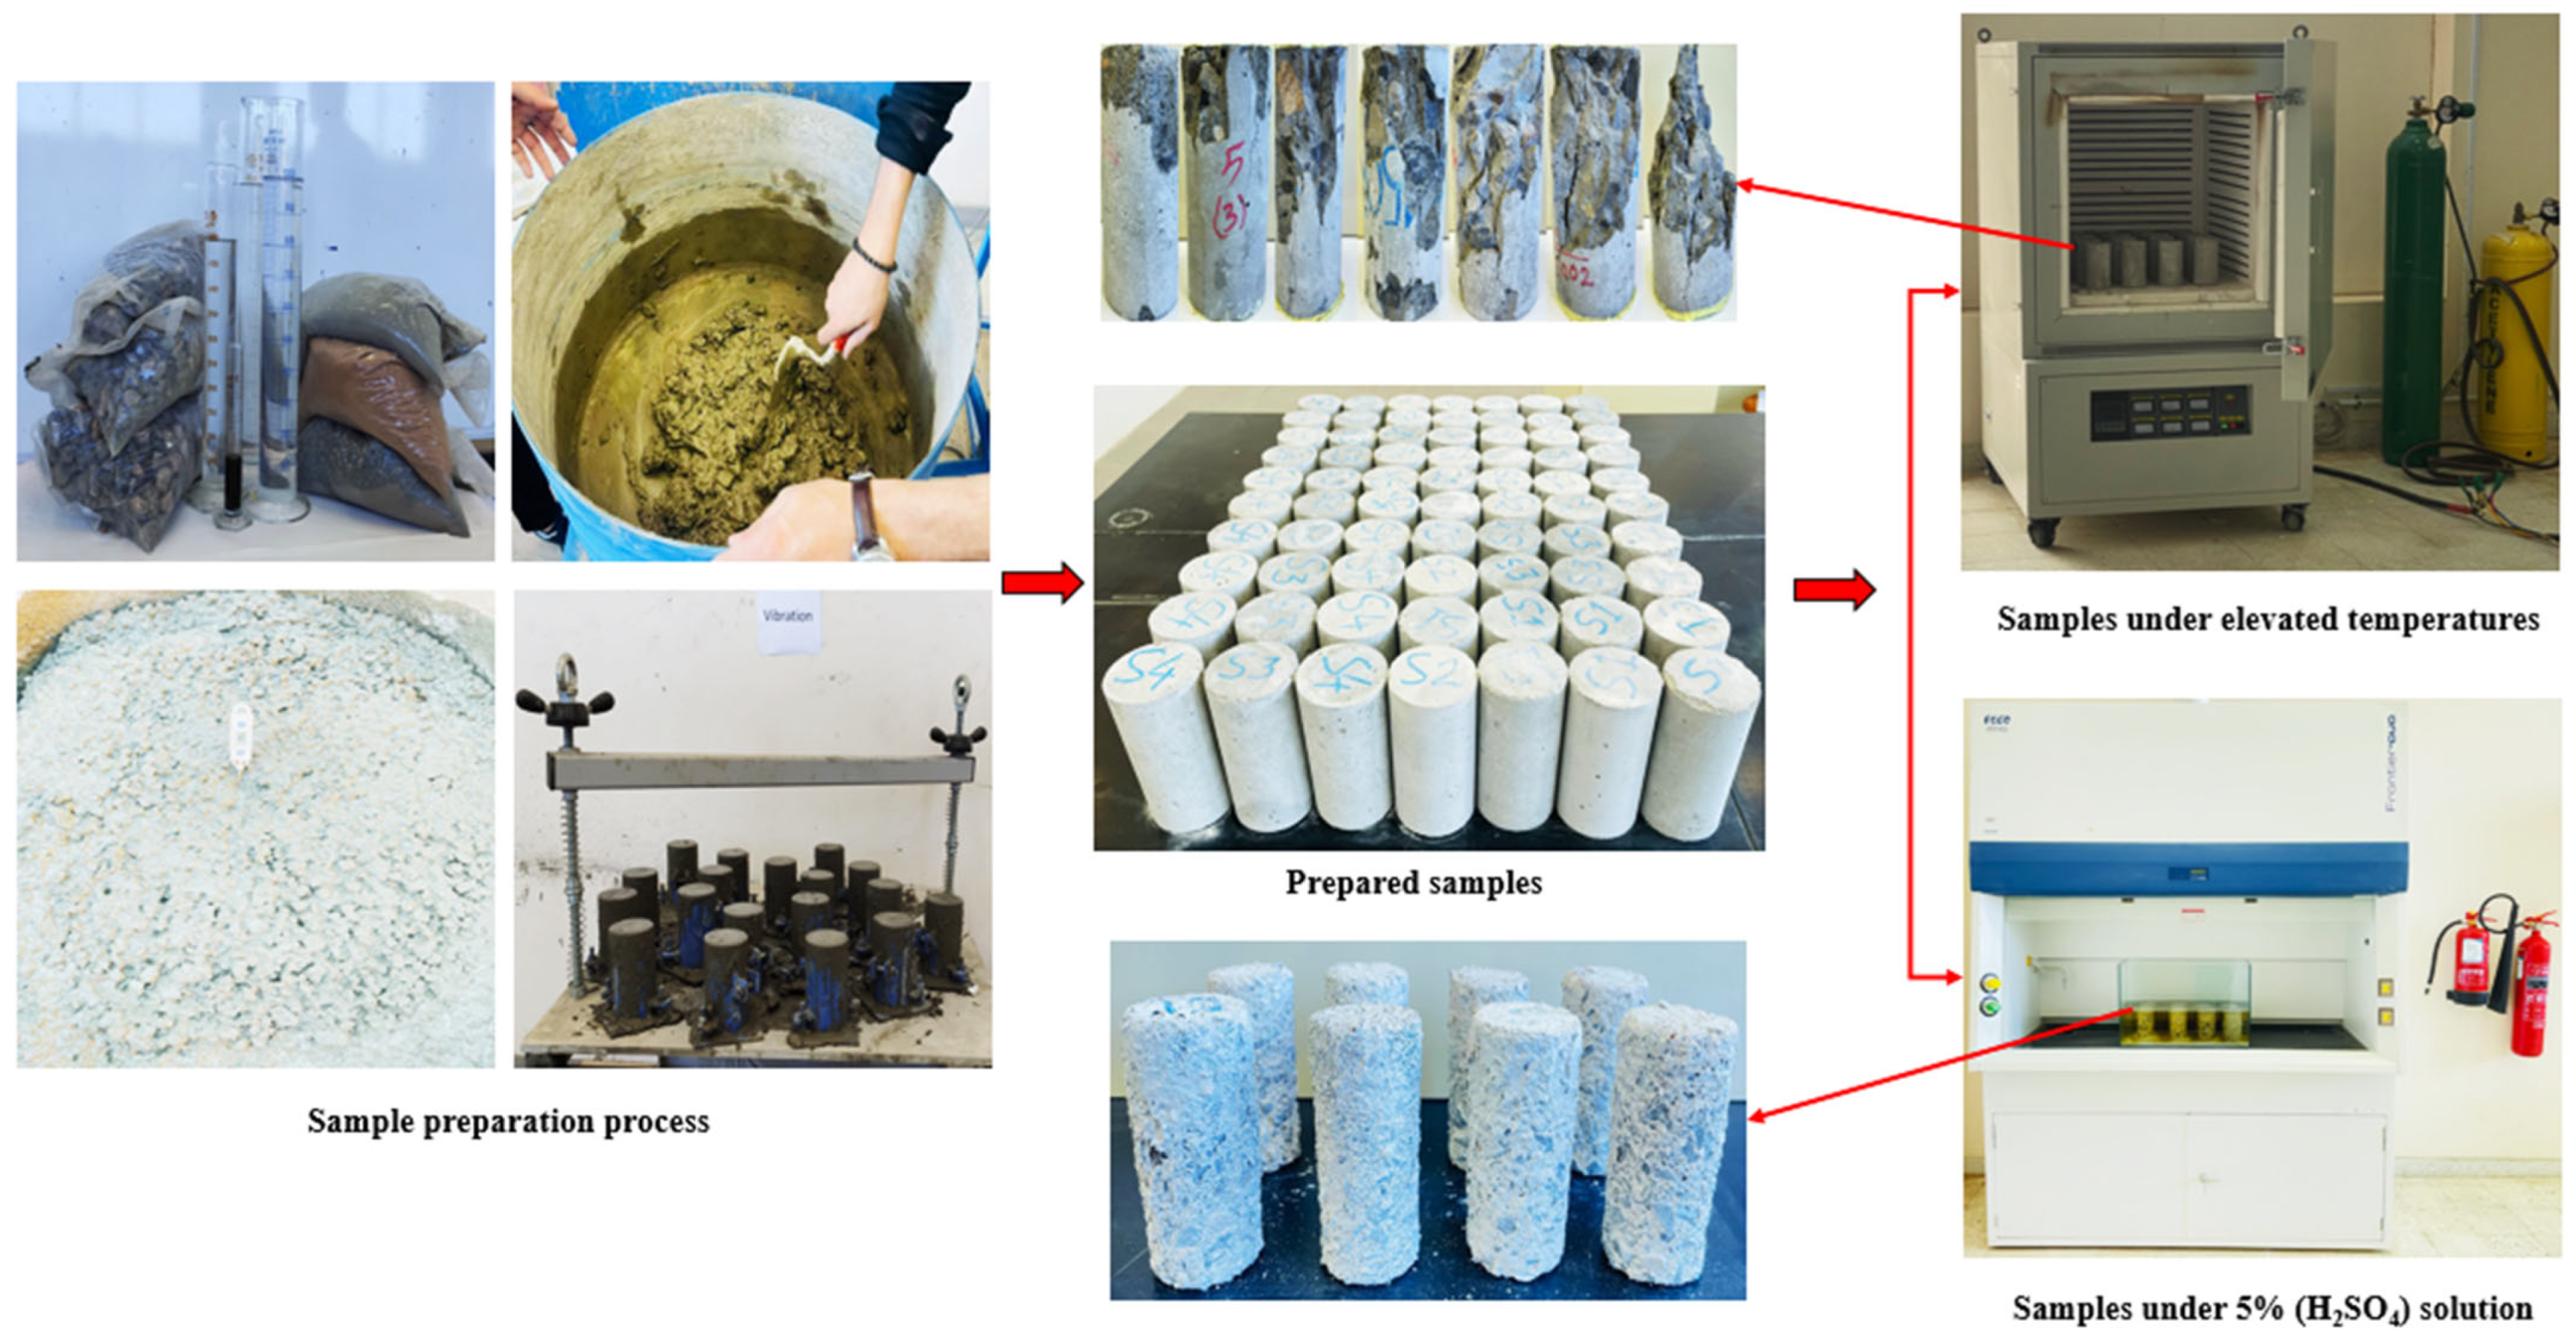
Figure 3.
Compressive strength variation with and without silica fume in developed sand concrete.
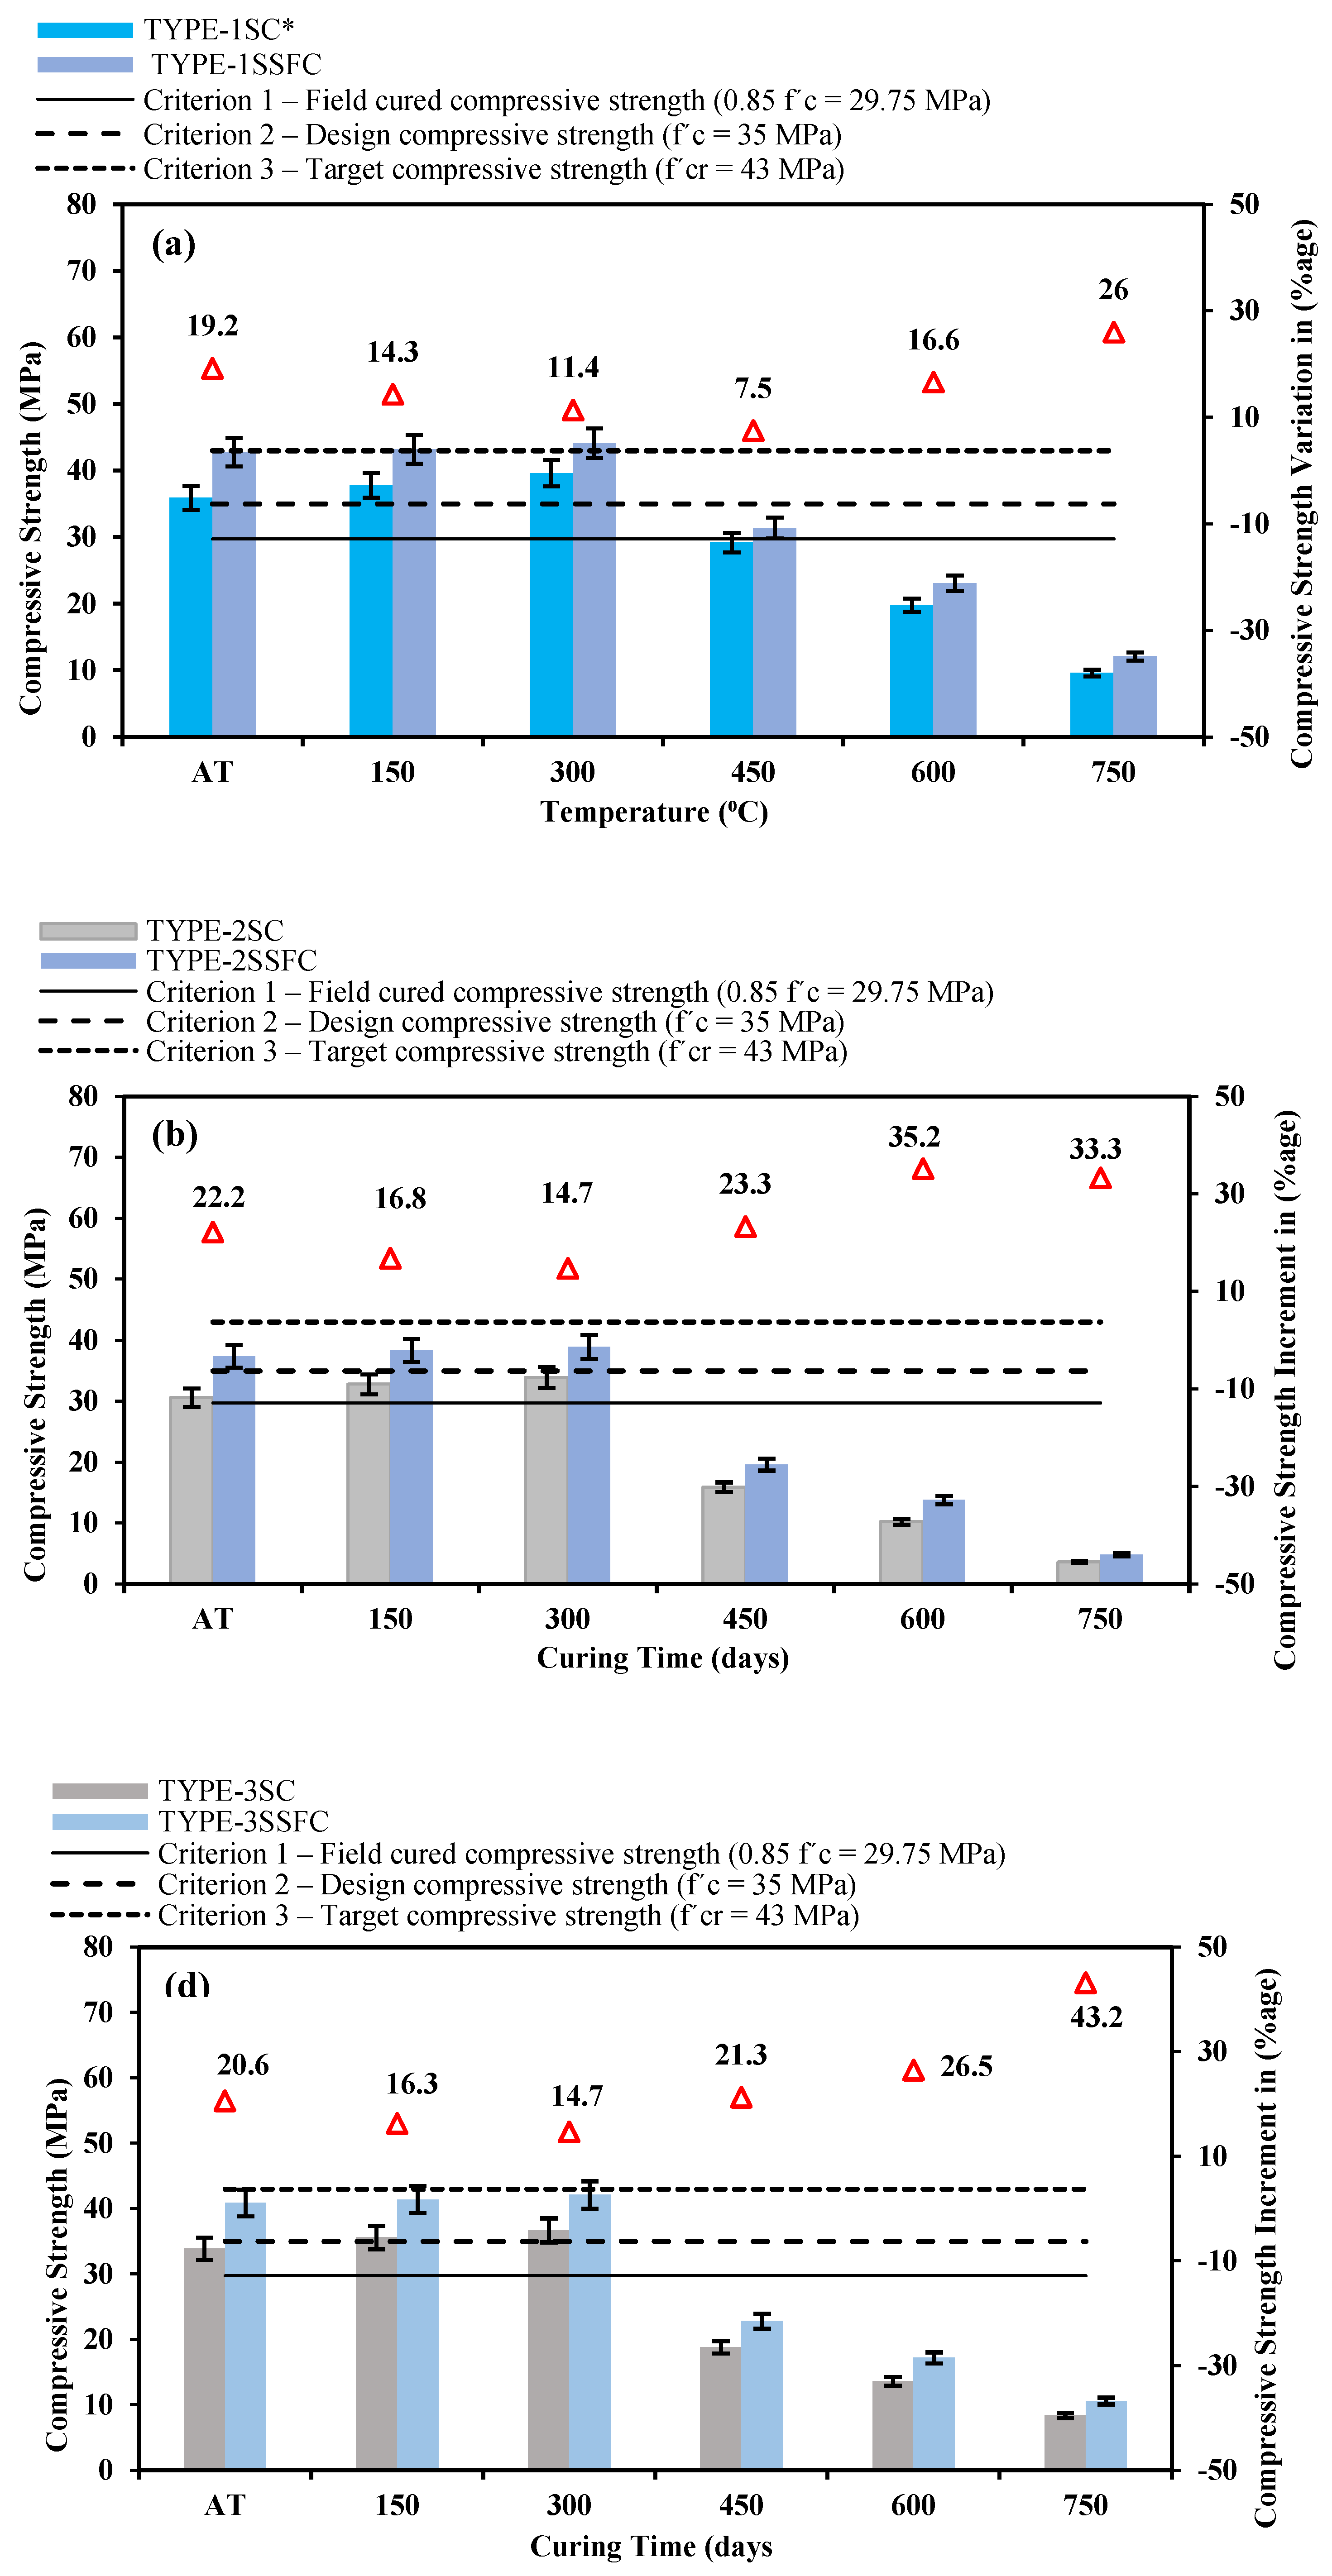
Figure 4.
Strength comparison at high temperatures to the standard room temperature.
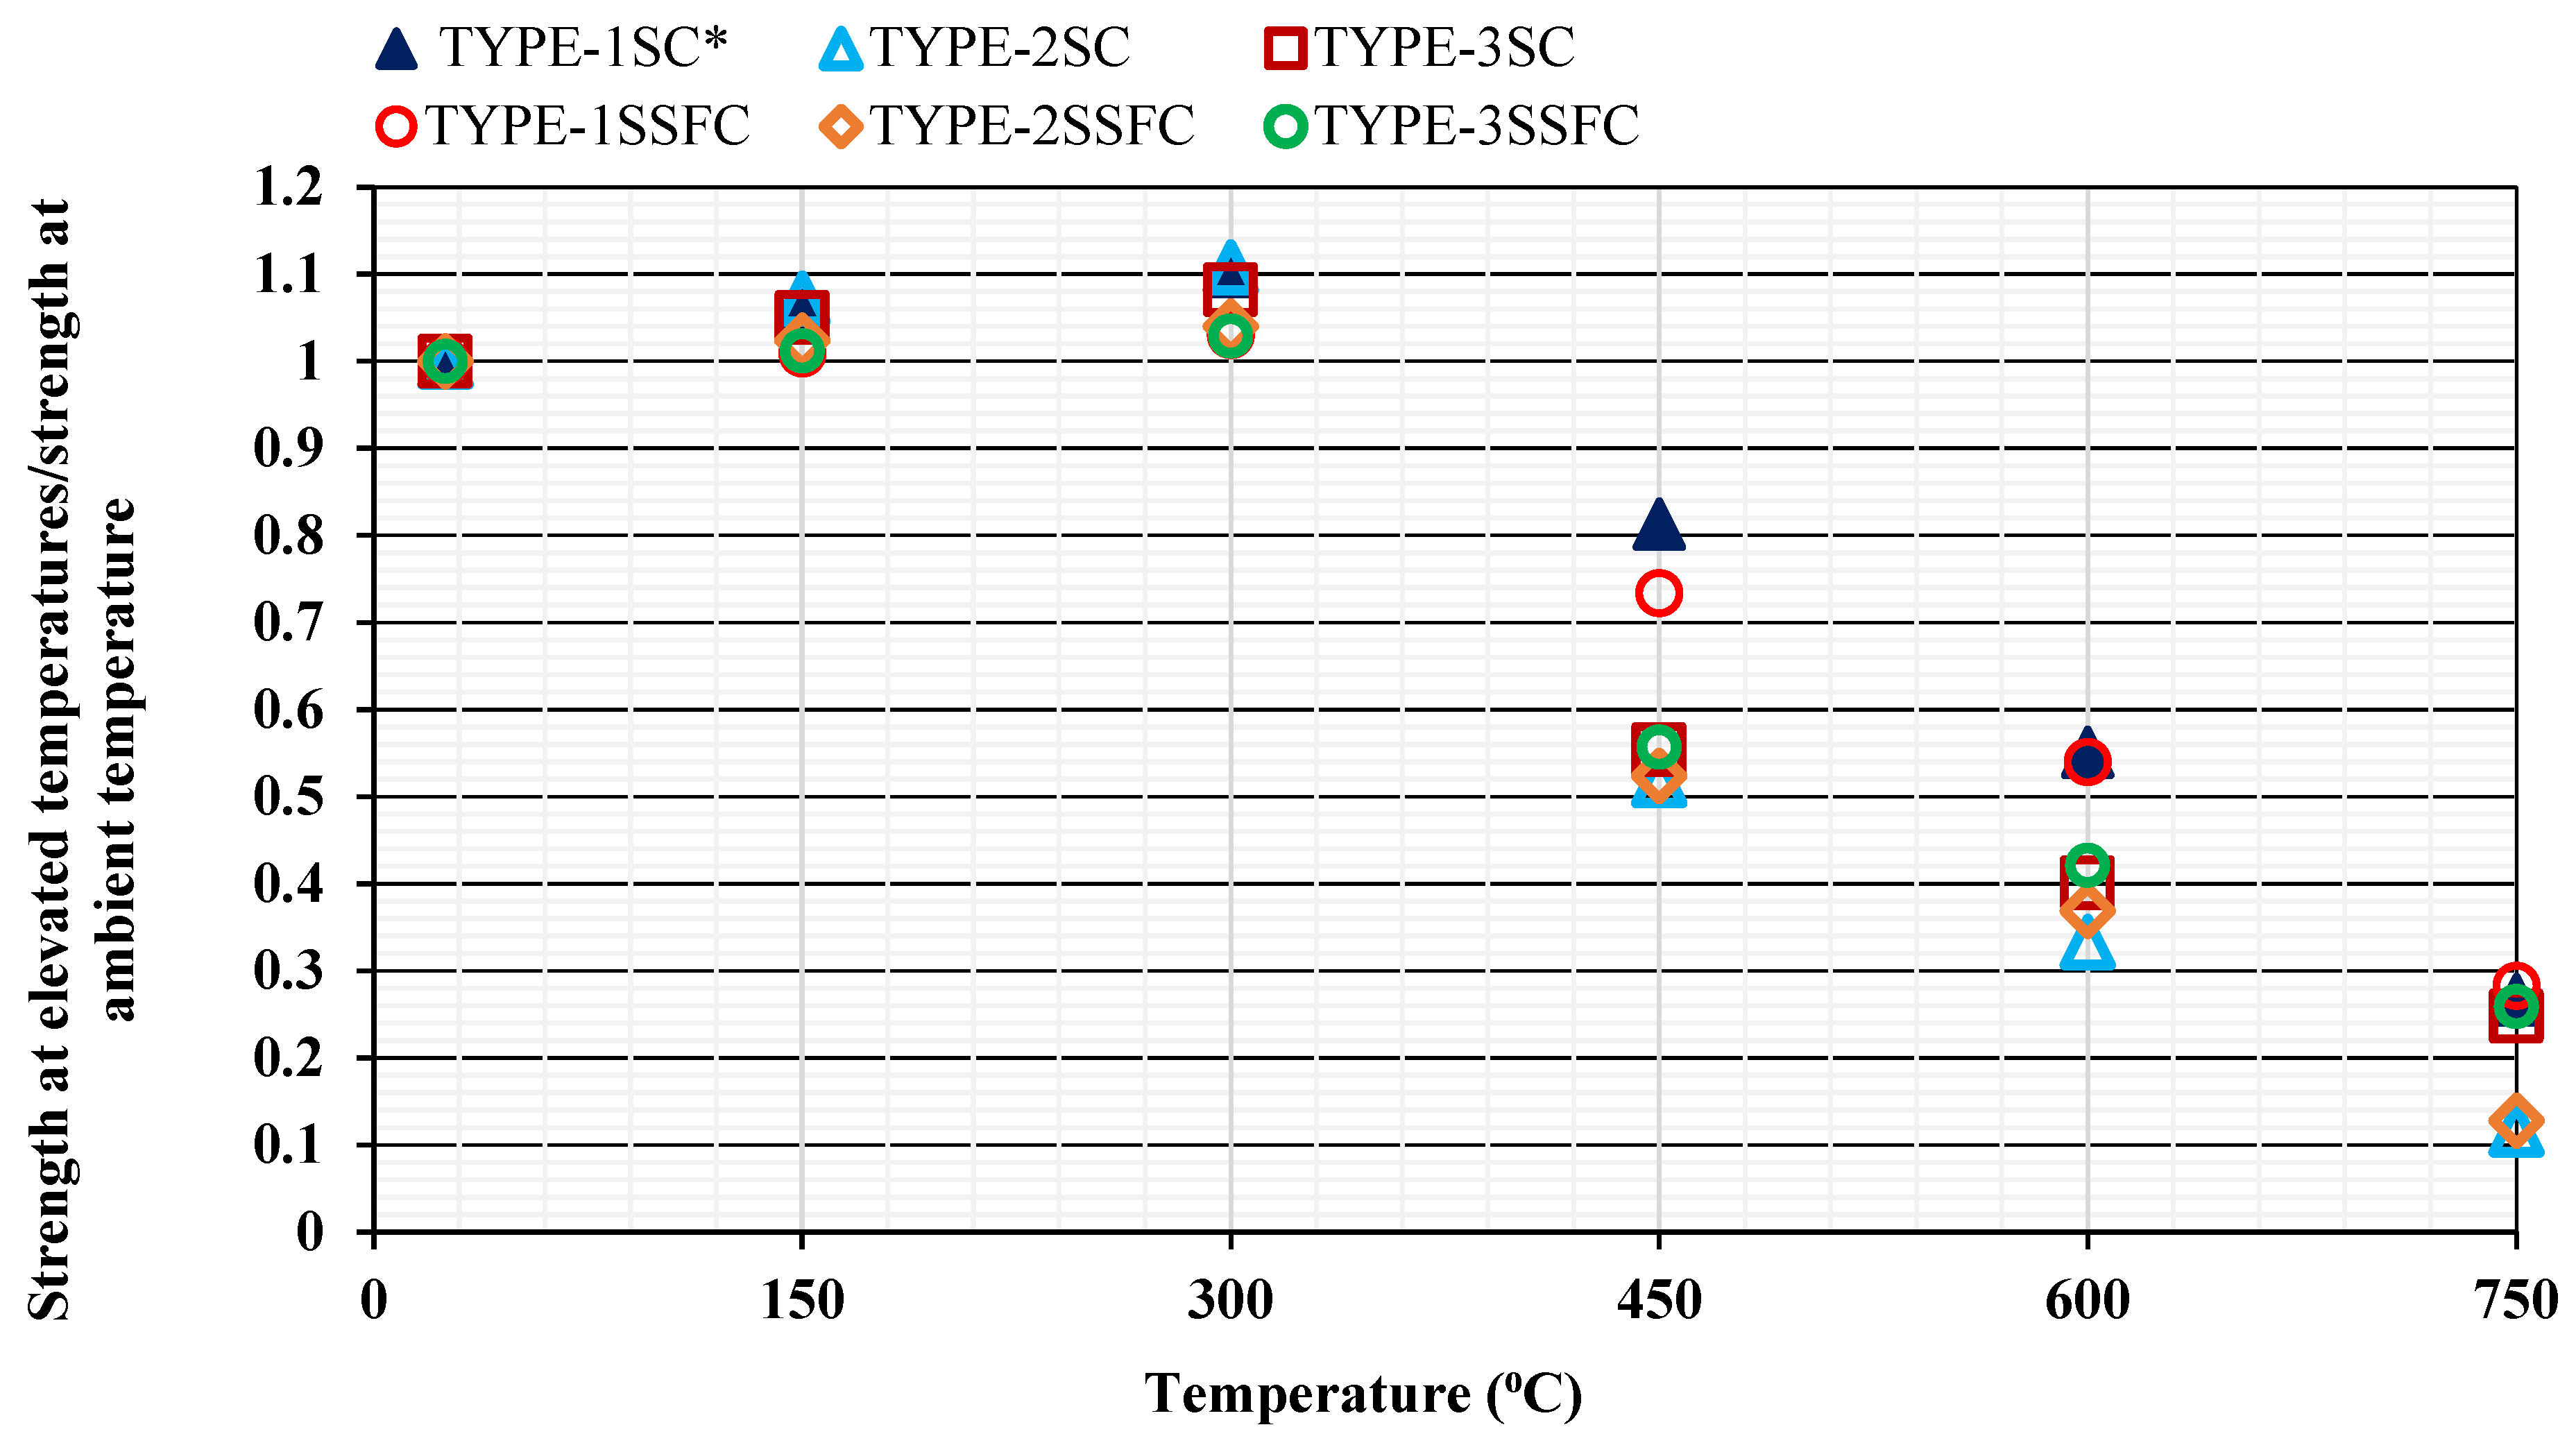
Figure 5.
Mass loss of the hardened concrete in a (5% H2SO4 solution).
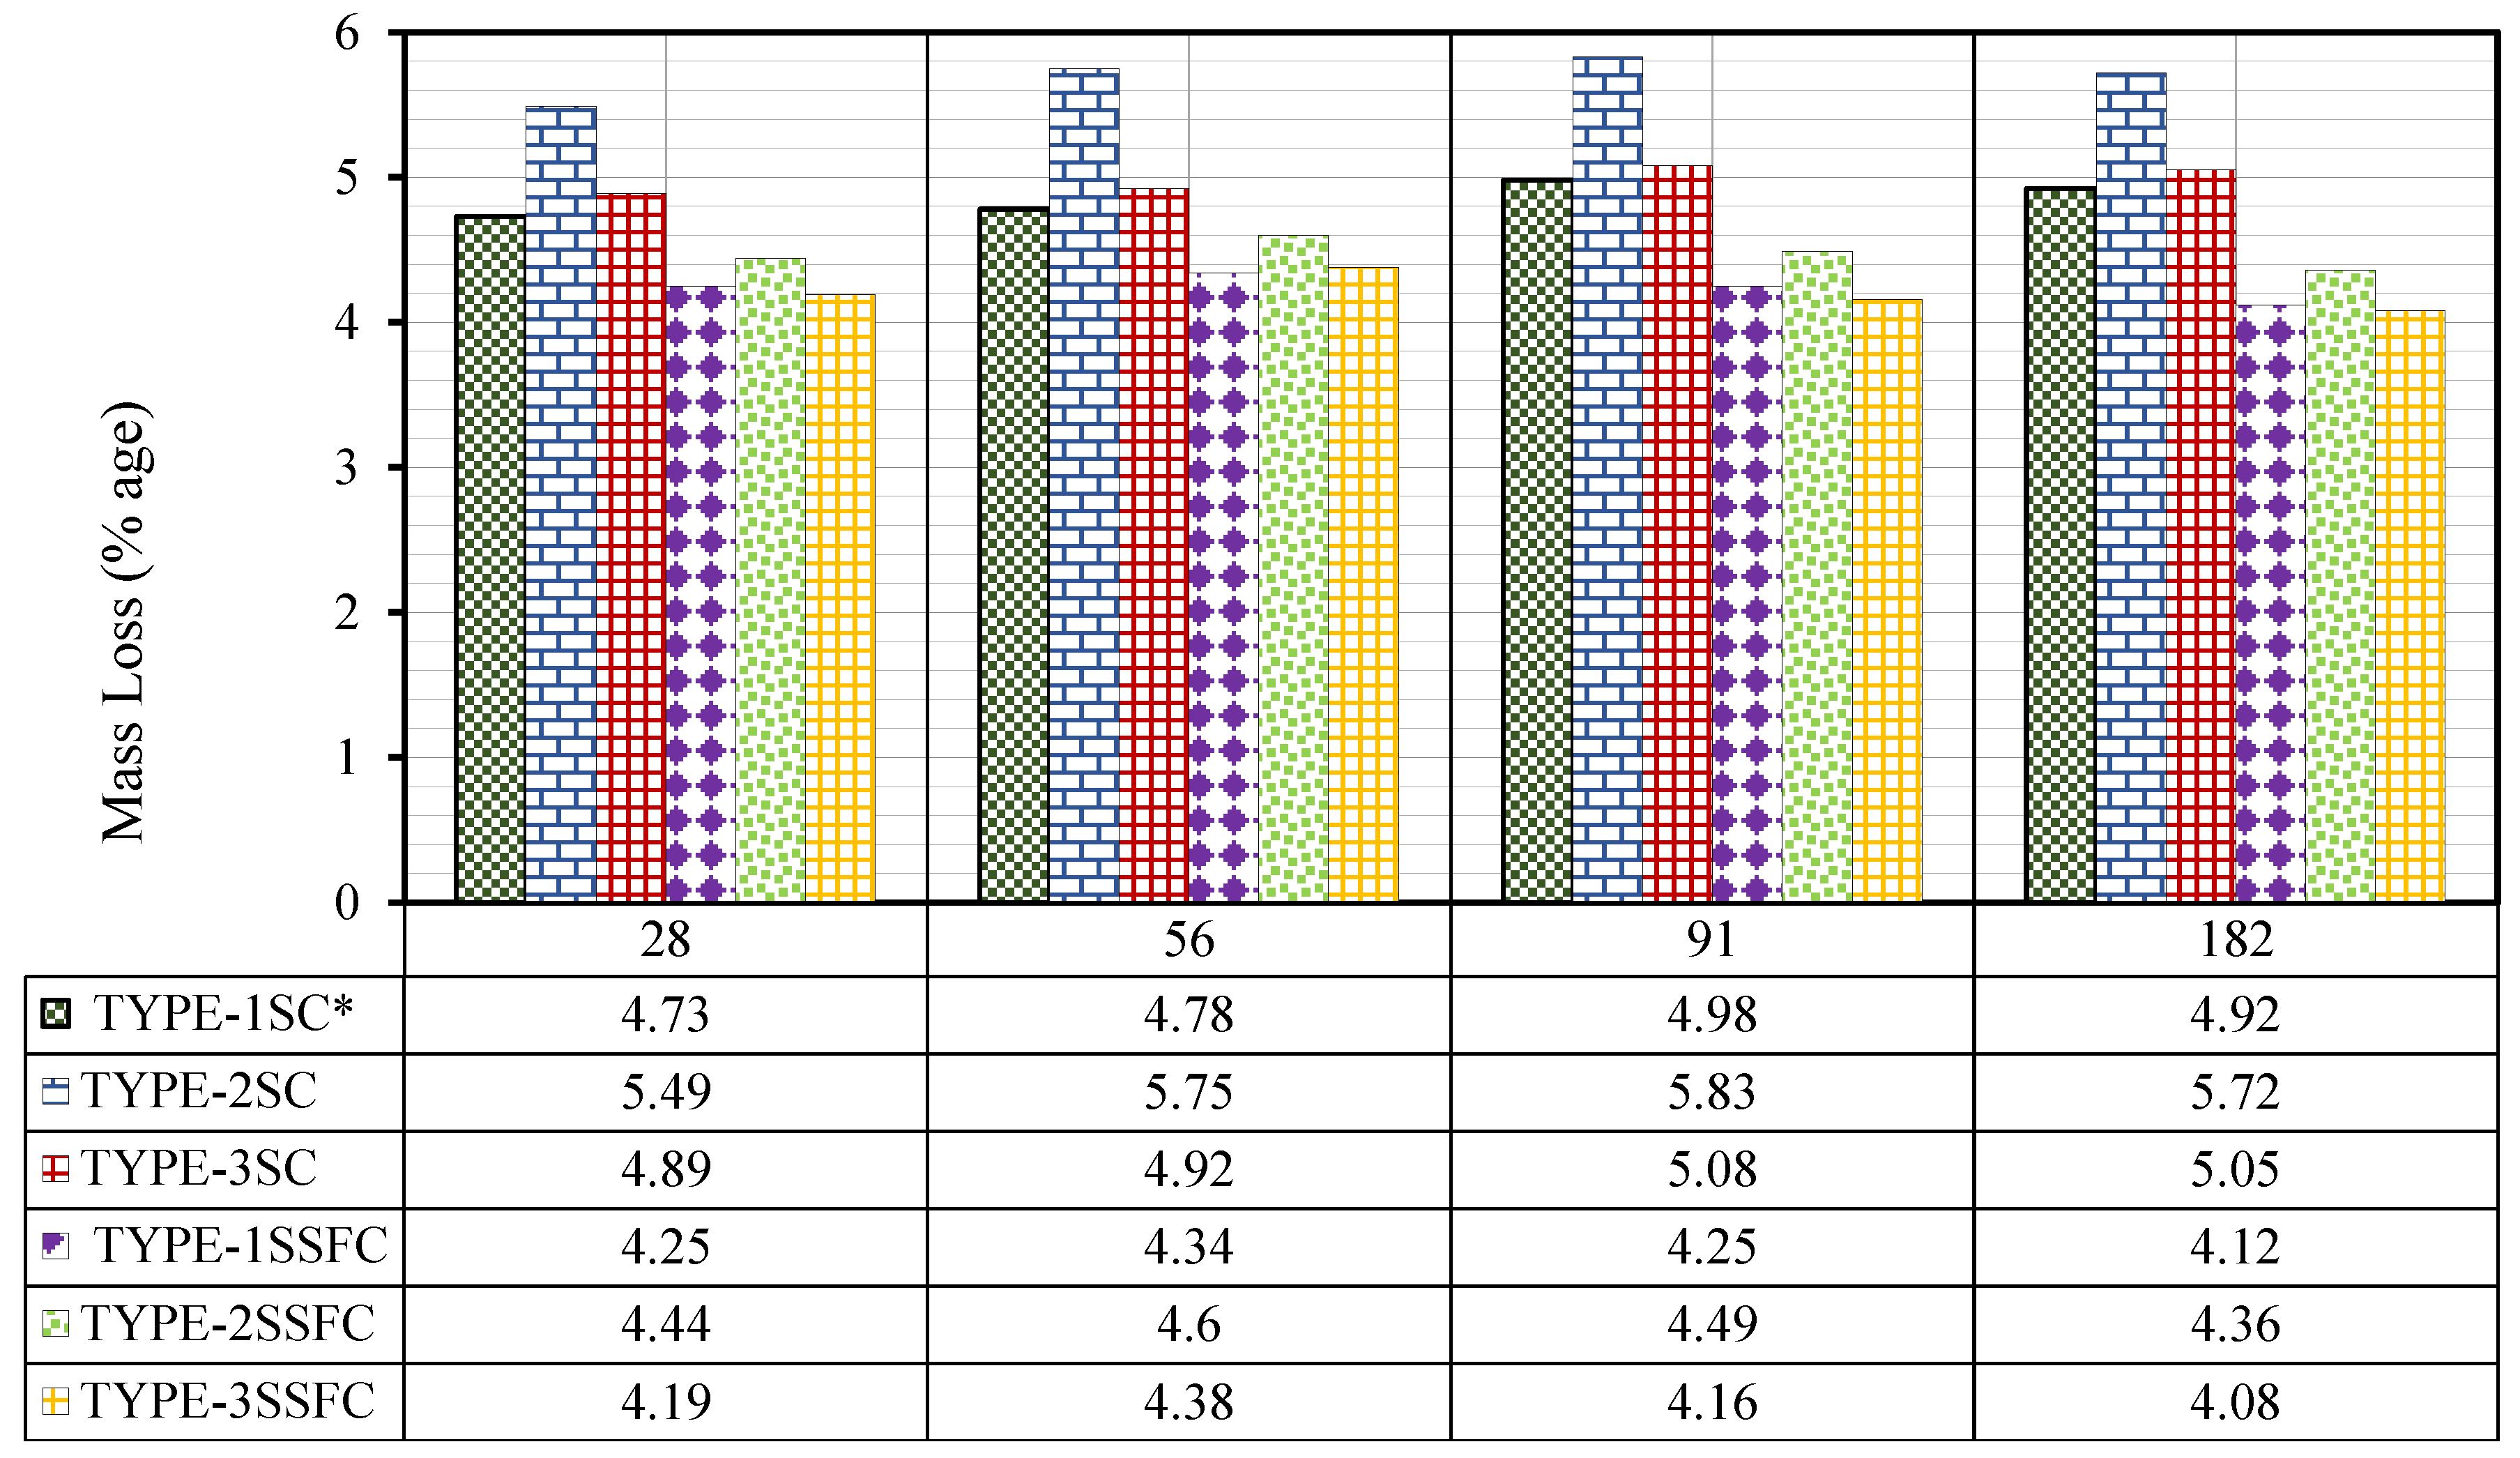
Figure 6.
Strength reduction of hardened concrete in a 5% sulphuric acid solution.
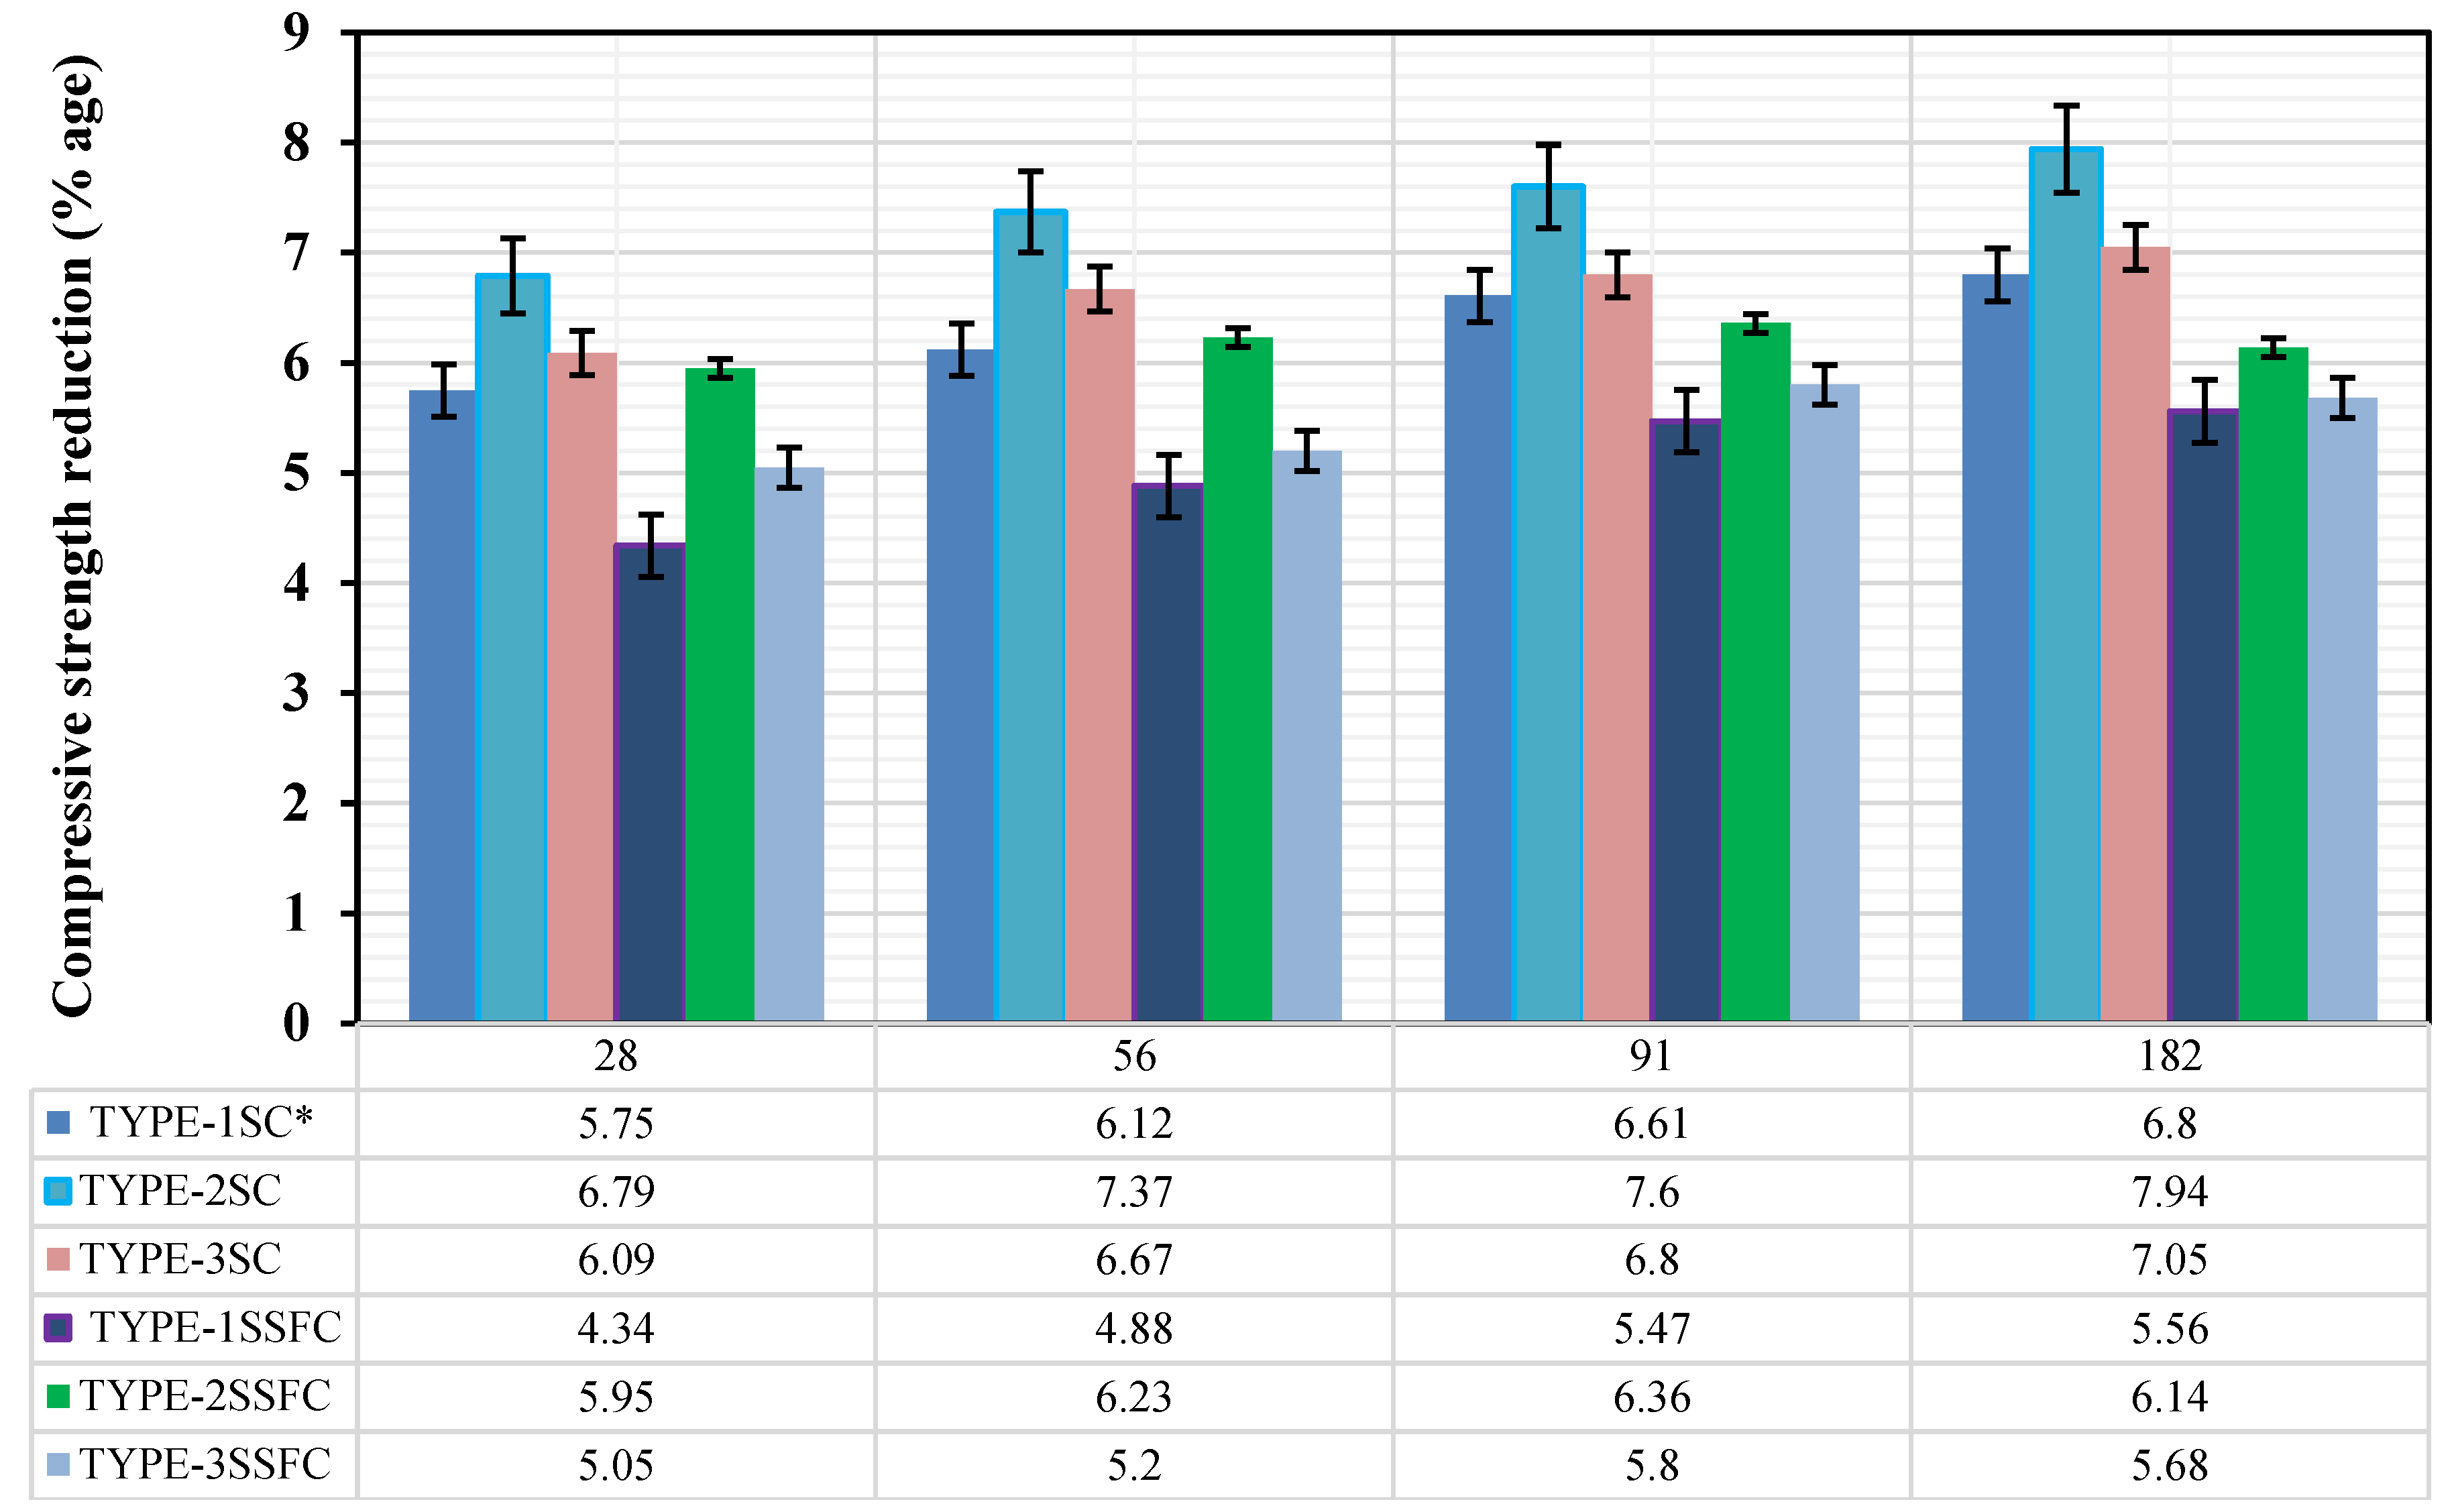
Figure 7.
Correlation of mass loss and compressive strength reduction.
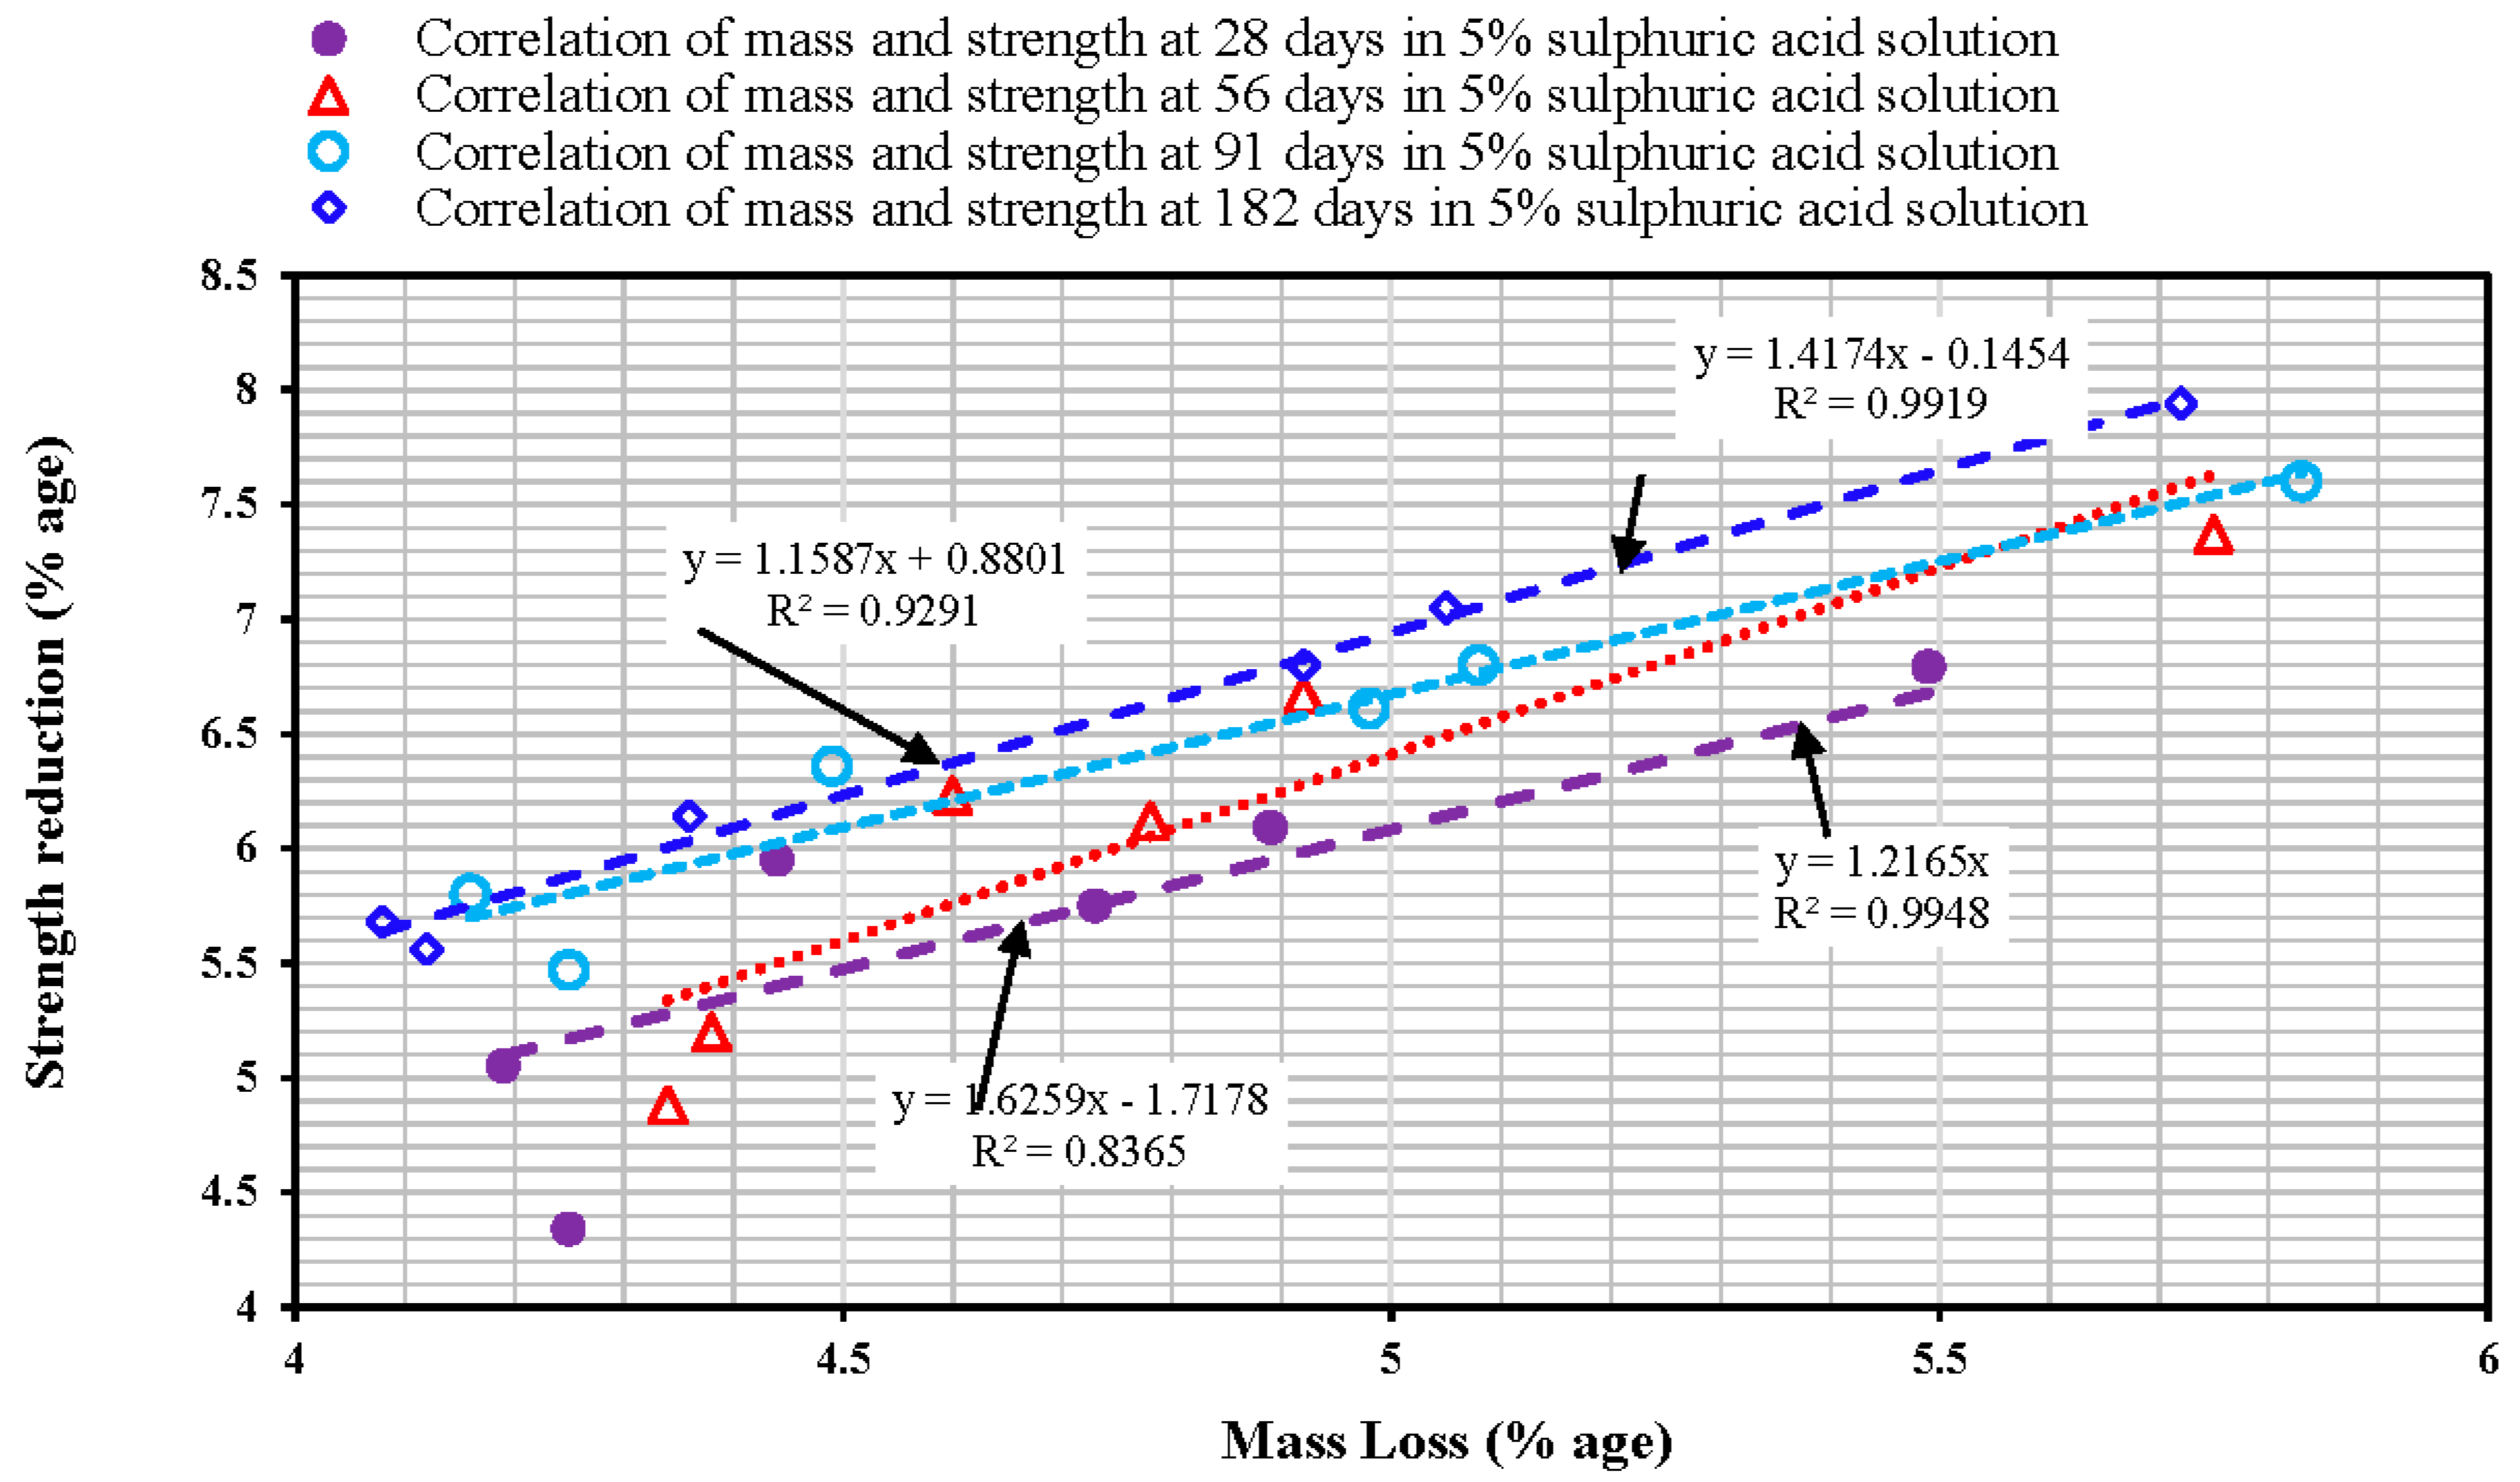
Figure 8.
(a-f). SEM and EDS of different concrete mixes at ambient temperature.


Figure 9.
XRD behavior of different prepared mixes at ambient temperature.
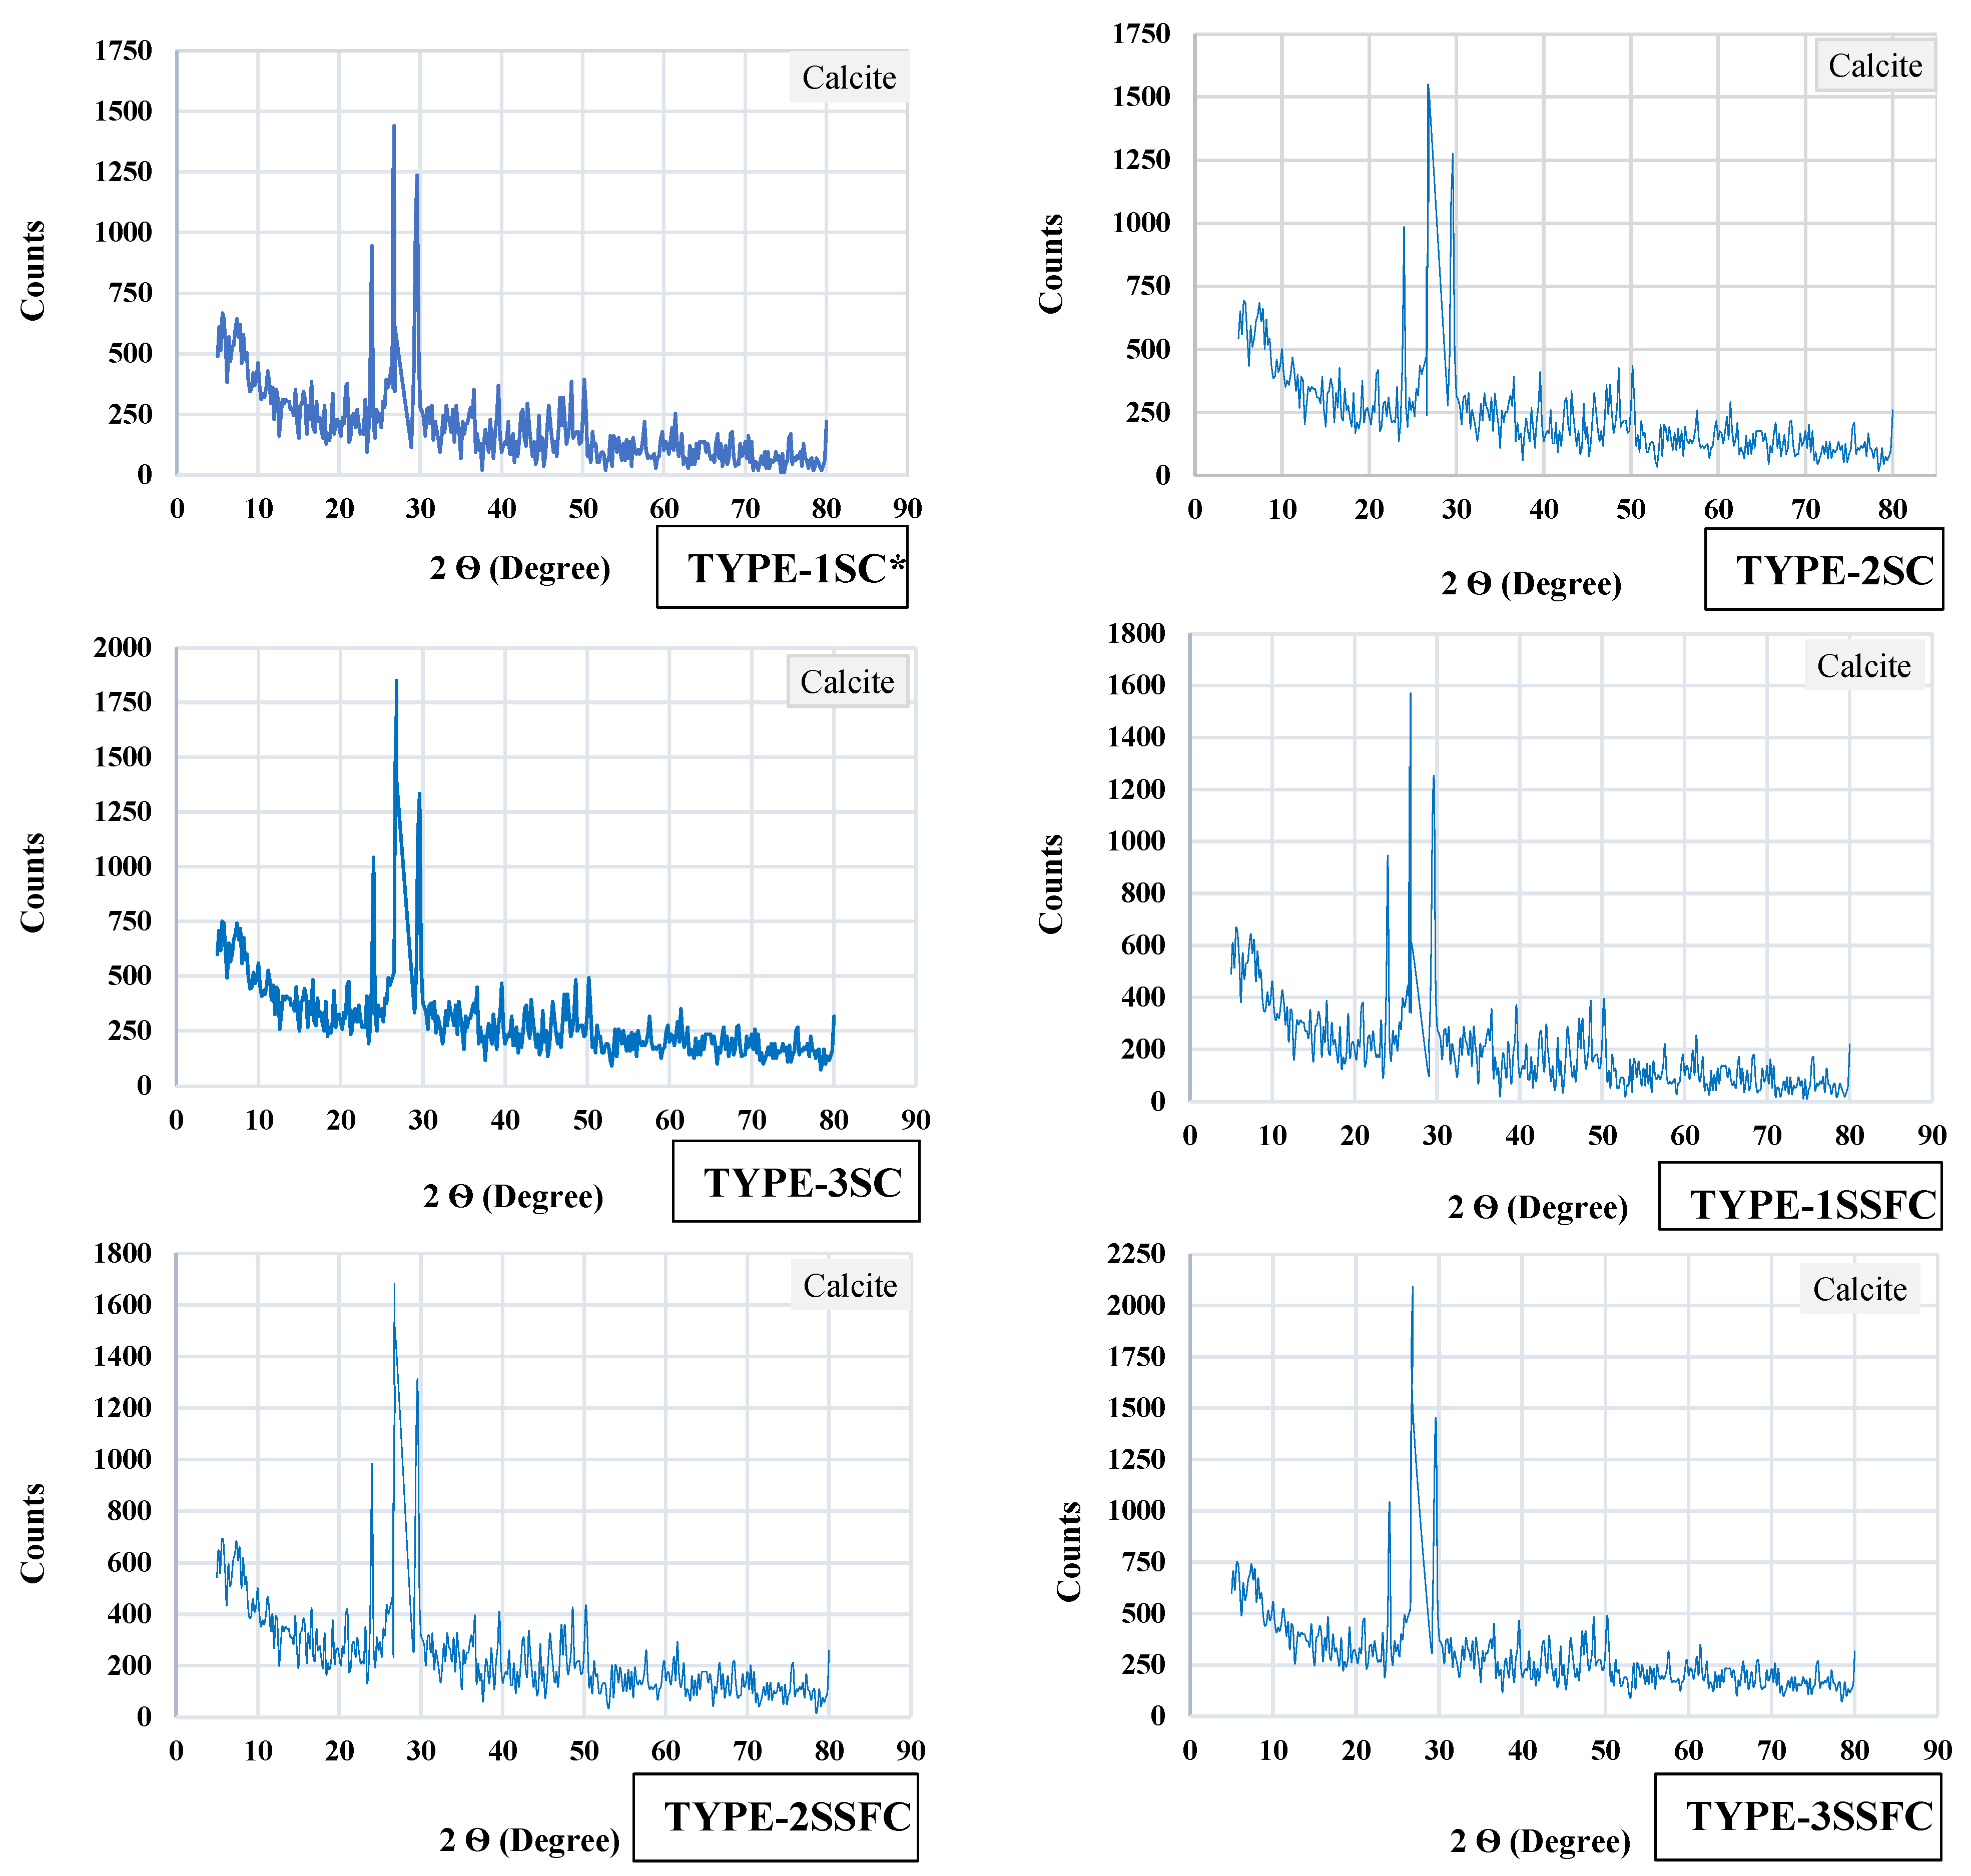

Table 1.
Combination of prepared sand TYPES 1, 2, and 3.
| Sand Designation | Manufactured and recycled sand | Desert sand | Crumb rubber | Total | ||
| Fraction | Fraction | Fraction | ||||
| (4.75-2.36) mm | (2.36-1.18) mm |
(1.18-0.075) mm |
(2.36-0.30) mm |
(1.18-0.150) mm |
||
| TYPE 1-Sand | 20% | 40% | 40% | - | - | 100% |
| TYPE 2-Sand | 20% | 40% | 40% | - | - | 100% |
| TYPE 3-Sand | 20% | 15% | 15% | 45% | 5% | 100% |
Table 2.
Physical parameters of the concrete mix design of this study.
| Physical parameters | Values | Standard |
| Specified compressive strength (f´c) | 35 MPa | [37,38] |
| Required average compressive strength (f´cr) | 43 MPa | [37,38] |
| Required Slump | 75-100 mm | [36] |
| Maximum size of aggregate | 19 mm | [36] |
| Fineness Modulus (FM) of TYPE 1-Sand | 2.8 | [36] |
| Fineness Modulus (FM) of TYPE 2-Sand | 2.7 | [36] |
| Fineness Modulus (FM) of TYPE 3-Sand | 2.6 | [36] |
| Grading of aggregate as satisfied | Within upper and lower limits | [35,39] |
| The bulk specific gravity of natural coarse aggregate | 2.920 | [40] |
| The bulk specific gravity of TYPE 1-Sand | 2.808 | [41] |
| The bulk specific gravity of TYPE 2-Sand | 2.634 | [41] |
| The bulk specific gravity of TYPE 3-Sand | 2.746 | [41] |
| Sand equivalent value of TYPE 1-Sand | 95% | [42] |
| Sand equivalent value of TYPE 2-Sand | 92% | [42] |
| Sand equivalent value of TYPE 3-Sand | 89% | [42] |
| Rodded bulk density of coarse aggregate | 1598 kg/m3 | [43] |
| Absorption capacity of coarse aggregate | 0.88 | [40] |
| Absorption capacity of TYPE 1-Sand | 0.90 | [41] |
| Absorption capacity of TYPE 2-Sand | 6.429 | [41] |
| Absorption capacity of TYPE 3-Sand | 3.806 | [41] |
| Moisture content of fine and coarse aggregate | Zero | [36] |
| Exposure conditions | Normal | [36] |
Table 3.
Concrete component proportions.
|
Mix Designation |
Concrete component proportions | ||||||||||
| Cementitious materials | Combination of fine aggregates | Natural coarse aggregate |
OPC kg/m3 |
Water kg/m3 |
Admixture by weight of cement (%) |
Slump mm |
|||||
|
OPC (%) |
SF (%) |
MS (%) | RS (%) | DS (%) | CR (%) |
NCA % |
|||||
| TYPE-1SC* | 100 | 100 | - | - | - | 100 | 436 | 205 | 0.8 | 100 | |
| TYPE-2SC | 100 | 100 | - | - | 100 | 436 | 205 | 1.8 | 100 | ||
| TYPE-3SC | 100 | 50 | 45 | 5 | 100 | 436 | 205 | 1.3 | 100 | ||
| TYPE-1SSFC | 90 | 10 | 100 | - | - | - | 100 | 392.4 | 205 | 1.1 | 100 |
| TYPE-2SSFC | 90 | 10 | 100 | - | - | 100 | 392.4 | 205 | 2.2 | 100 | |
| TYPE-3SSFC | 90 | 10 | 50 | 45 | 5 | 100 | 392.4 | 205 | 1.6 | 100 | |
Table 4.
Program operating input data.
| Temperature and time input | Input data in the program for 150°C | Input data in the program for 300°C | Input data in the program for 450°C | Input data in the program for 600°C | Input data in the program for 750°C |
Relevance to the program |
| T-01 | 0 | 0 | 0 | 0 | 0 | Initial temperature input |
| t-01 | 30 | 60 | 90 | 120 | 150 | Increasing the temperature at a rate of heating by 5 degrees per minute. |
| T-02 | 150 | 300 | 450 | 600 | 750 | Max temperature heating stage |
| t-02 | 120 | 120 | 120 | 120 | 120 | Temperature flat 120 min @ max temperature heating stage |
| T-03 | 150 | 300 | 450 | 600 | 750 | Max temperature heating stage |
| t-03 | 30 | 60 | 90 | 120 | 150 | Decreasing the temperature with an average heating of 5°C/min |
| T-04 | 0 | 0 | 0 | 0 | 0 | Initial temperature reached |
| t-04 | -121 | -121 | -121 | -121 | -121 | End of program |
Disclaimer/Publisher’s Note: The statements, opinions and data contained in all publications are solely those of the individual author(s) and contributor(s) and not of MDPI and/or the editor(s). MDPI and/or the editor(s) disclaim responsibility for any injury to people or property resulting from any ideas, methods, instructions or products referred to in the content. |
© 2025 by the authors. Licensee MDPI, Basel, Switzerland. This article is an open access article distributed under the terms and conditions of the Creative Commons Attribution (CC BY) license (http://creativecommons.org/licenses/by/4.0/).
Copyright: This open access article is published under a Creative Commons CC BY 4.0 license, which permit the free download, distribution, and reuse, provided that the author and preprint are cited in any reuse.


