
Submitted:
28 July 2025
Posted:
30 July 2025
You are already at the latest version
Abstract
This study utilizes Fama-MacBeth (1973) methodologies on 100 size and value sorted stock portfolios spanning the years 1927 to 2023 to assess the efficacy of the capital asset pricing model (CAPM) and the Fama-French three-factor (FF3) asset pricing model. The assessment indicates that FF3 yields superior outcomes relative to CAPM, suggesting that inclusion of size (SMB) and value (HML) risk factors more effectively capture the cross-sectional volatility in stock returns. The results indicate that CAPM insufficiently accounts for the variability of portfolio returns, leading to significant misprice. Conversely, a substantial risk premium is present in the positive direction with the HML factor, which, along with SMB, offers thorough elucidations for systematic size and value hazards. Furthermore, elevated adjusted R-squared values coupled with diminished root mean square alpha suggest that the FF3 model provides a more comprehensive explanation of returns compared to the CAPM model. We use Fama-MacBeth regression to get consistent and robust estimations of risk premiums for both size and value components, effectively addressing cross-sectional correlation and heteroscedasticity. The temporal stability of the FF3 model's performance is demonstrated in robustness assessments via formal sub-period evaluations. This research demonstrates the enduring relevance of the Fama-French Three-Factor Model in asset pricing and portfolio management, offering valuable insights for contemporary financial market applications. The study advances academic multi-factor model research while providing practical benefits to investors and financial professionals.
Keywords:
CAPM
; market beta
; size factor
; value factor
; portfolio
1. Introduction
The accurate valuation of financial assets has become a critical issue in the present economic landscape as it has implications for investment success, portfolio selection, and risk assessment. Asset pricing models aim to associate the cross-section of anticipated returns with various common risk indicators. Among the existing asset pricing models, the Capital Asset Pricing Model (CAPM) and the Fama-French Three-Factor Model (FF3) are notably prevalent in both academic literature and practical application.
Similar to the indexer, the Capital Asset Pricing Model (CAPM) serves as the fundamental framework for analyzing the risk-return relationship, utilizing market beta as the sole parameter. Nonetheless, the empirical research has uncovered a methodological flaw in CAPM by providing evidence that it fails to sufficiently account for all systematic risks influencing asset returns (Banz, 1981, Basu, 1983). In response, Fama and French develop a three-component model that includes the market beta, the size factor (SMB), and the value factor (HML).
This research aims to evaluate the efficacy of two techniques by utilizing historical return data of 100 Fama-French value-weighted portfolios categorized by size and book-to-market equity (BE/ME). This research employs time series regression analysis using the Fama-MacBeth methodology to evaluate the CAPM and the Fama-French (1993) study across an extended time frame. The comparative performance of these models enhances the asset pricing literature by highlighting the elements that define and elucidate stock returns, hence promoting the ongoing development of more sophisticated theories and practical applications.
Asset pricing models are employed to elucidate and predict market dynamics via factors that affect returns. An extension of the Single Index Model was introduced with the development of the Capital Asset Pricing Model (CAPM) by Sharpe (1964) and Lintner (1965), which illustrates that an asset's projected return is contingent upon its systemic risk. Despite its theoretical idealism, CAPM has faced criticism for its inability to account for the cross-sectional diversification of security returns. Fama and French established the Three-Factor Model, which expands upon the Capital Asset Pricing Model (CAPM) by incorporating additional risk factors such as size (SMB) and value (HML). These factors aim to extract predictable elements related to business characteristics that deviate from the unconditional assumption of average asset returns.
Fama and French (1993) present the size and value factors in "The Cross Section of Expected Stock Returns" paper, fundamentally transforming the scholarly understanding of the market factor. Their research critiqued and expanded the CAPM while presenting new information regarding the FF3 model. The Fama-MacBeth (1973) method similarly analyzes cross-sectional data with a two-step regression analysis addressing critical issues such as cross-sectional correlation and heteroskedasticity. Collectively, these enhancements contribute to the methodological framework of contemporary asset pricing literature, including precise criteria for model assessment and premium estimation.
The objective of this research is to do the Fama-French analysis over a longer time until December 2023, utilizing 100 Fama-French portfolios derived from active portfolios according to Jaffe’s (2018) technique. The concluding regressions are cross-sectional, necessitating the application of the Fama-MacBeth (1973) methodology to evaluate the effectiveness of CAPM and FF3. Therefore, in conjunction with the secondary data, the aim of this study is to evaluate the relevance of the FF3 model to current markets and explore its potential for further advancement.
This study centers on the following significant questions: Does the Fama-French Three-Factor Model outperform the CAPM in explaining cross-sectional volatility in stock returns over an extended period? What is the significance of size (SMB) and value (HML) features in recognizing systemic risks? Can the findings of Fama and French (1993) be validated and extended to December 2023?
The hypotheses for this study are as follows:
- Hypothesis 1: The cross-sectional variation in portfolio returns is more effectively elucidated by the FF3 model compared to the CAPM.
- Hypothesis 2: Stock returns are considerably and positively influenced by the size (SMB) and value (HML) variables.
- Hypothesis 3: The findings of Fama and French (1993) remain pertinent over an extended time frame.
This framework serves as a foundation for a comprehensive evaluation of the asset pricing models, employing enhanced empirical techniques and data to derive pertinent insights.
2. Literature Review
The literature review of this study is focused on how the line of inquiry may be explained and based in the body of knowledge that exists on asset pricing models, specifically in relation to the creation of multifactor models that explain stock returns. Accordingly, this review places the Fama-French Three-Factor Model in the context of the key theories and developments created up to this point.
Size (SMB) and value (HML) are two further parameters that are added to the Capital Asset Pricing Model (CAPM) by the Fama-French Three-Factor Model (FF3), which was first presented by Fama and French (1993). The size effect (Banz, 1981) and the value effect (Basu, 1983) are two examples of empirical regularities derived from cross sections of returns that CAPM was unable to explain. HML calculates the difference in returns between high and low book-to-market equity equities, whereas SMB calculates the difference in returns between small and large stocks. These components, when combined with the market factor (Rm − Rf), provide a far more accurate depiction of the cross-sectional variation of average stock returns. Since then, the FF3 model has solidified its position as a fundamental paradigm in the asset pricing literature while simultaneously offering practitioners practical portfolio management solutions.
Time series regression techniques are used to model the dynamic relationship between the risk factors and the portfolio return. Thus, time series regressions enable measuring for the factor loadings as well as evaluating the capacities of the given model within the framework of FF3. On the other hand, cross-sectional regressions relate expected returns with the factor loadings of portfolios only at one time. Because they allow the researcher to identify the sources of systematic risk that define average returns, these regressions are crucial in the assessment of asset-pricing models.
The Fama-MacBeth (1973) approach gives a good way of conducting cross-sectional regressions. It involves two steps:
- First, time-series regressions are employed to predict factor loadings such as β for each portfolio.
- These loadings are then employed as predictors of cross-sectional regressions in the second step as a means to estimate risk premiums.
This two-step procedure conquers most econometric problems, including cross-sectional correlation and heteroskedasticity; therefore, it is accepted as a standard approach to evaluate asset pricing theories.
The Fama-French Factor Model is probably the most comprehensive that has ever been developed in empirical finance. Additional attempts have been made to incorporate new factor to FF3 model to address other systematic risks. For example: Carhart (1997) includes a fourth factor, the momentum factor (MOM) in an attempt to capture the continuation of trends in stock prices. In order to account for the majority of corporate shocks, Fama and French (2015) expands their initial three-factor model to include two company characteristics: profitability (RMW) and investment (CMA). These extensions do reinforce that asset pricing research is an active field of endeavor by continuing search for more appropriate model structures for actual financial markets. Building upon the FF3 model and applying time-series and cross-sectional methodologies as well as the Fama-MacBeth approach, the goal of this study is to improve the conversation on asset pricing models by revalidating the findings of Fama and French (1993).
3. Data
This study employs the Fama-French 100 Portfolios dataset, which consists of monthly returns on 100 portfolios formed based on two key sorting criteria: size and book-to-market equity (BE/ME). These portfolios have been constructed by separately ranking stocks according to size and BE/ME, generating ten portfolios for each of the two characteristics. This process results in a total of 100 portfolios, with each portfolio's return calculated as a value-weighted average of the returns of the constituent stocks.
The data utilized in this study has been sourced from the Kenneth R. French Data Library, which provides both the portfolio return data and the necessary risk factors for the application of asset pricing models. To examine the validity of asset pricing models, the study tests both the Capital Asset Pricing Model (CAPM), and the Fama-French Three-Factor Model, an extension of CAPM. The FF3 factor model includes three risk factors:
- Market Excess Return (Rm − Rf): The difference between the market return and the risk-free rate.
- SMB (Small Minus Big): The return difference between small-cap and large-cap portfolios, representing the size premium.
- HML (High Minus Low): The return difference between portfolios with high and low BE/ME ratios, reflecting the value premium.
The risk-free rate (Rf) is derived from the monthly yield of a one-month Treasury bill. The dataset spans a total of 1152 months, covering the period from January 1927 to December 2023. Monthly data is available for both the 100 portfolio returns and the risk factors, a frequency commonly used in asset pricing research.
The primary variables utilized in the study are as follows:
- Portfolio Returns (Rit): The monthly excess returns for each of the 100 portfolios.
-
Risk Factors:
- ∘
- Rm − Rf: Market risk premium.
- ∘
- HML: Value factor (comparing high BE/ME versus low BE/ME).
- ∘
- SMB: Size factor (comparing small versus large capitalization).
- ∘
- Rf: Risk-free rate.
These variables are essential for testing the validity of both the CAPM and the Fama-French Three-Factor Model.
3.1. Descriptive Statistics and Visualizations
3.1.1. Descriptive Statistics
- Portfolio Returns: The portfolio returns exhibit a "pond-shaped" distribution, initially decreasing and then increasing. This trend is observed beginning with large firms with low BE/ME ratios and continuing through to small firms with high BE/ME ratios.
-
Risk Factors:
- ∘
- Rm − Rf: The market excess return typically shows a positive mean, indicating the presence of a risk premium.
- ∘
- SMB and HML: Both factors tend to have positive means, suggesting the existence of the size and value premiums, respectively.
3.1.2. Visualizations
- Portfolio Returns Heatmap: A heatmap is used to visualize the average monthly returns of the 100 portfolios, revealing that small-cap portfolios with high BE/ME ratios generally provide the highest returns, while large-cap portfolios with low BE/ME ratios generate the lowest returns.
- Risk Factor Trends: Time-series line plots are utilized to illustrate fluctuations in the market excess return (Rm − Rf), SMB, and HML, highlighting their variations over time.
- Factor Distributions: Histograms of the Rm − Rf, SMB, and HML factors display their distributions, with key statistics such as means, variances, and skewness.
3.2. Data Processing and Analysis
The data is first imported and preprocessed, ensuring consistent time periods across variables through time normalization. The raw returns for each portfolio are calculated by averaging the returns of the individual stocks within the portfolio. These returns are then adjusted for the risk-free rate to obtain the excess portfolio returns (Rit − Rf).
Regression analyses are subsequently conducted, aligning the excess returns of the portfolios with the corresponding risk factors (Rm − Rf, SMB, HML) on both a time-series and cross-sectional basis. This allows for the assessment of the models' fitness and validity.
4. Methodology
This section provides a description of procedures and methods applied to test the CAPM and the FF3 models for analyzing stock returns. We also describe the type of regression frameworks, method of estimation, and statistical tests that are used in the research work. First, 30 month rolling window time-series regressions have been carried out to analyze how well CAPM and FF3 can explain time-series variation in each portfolio's excess returns.
CAPM:
: Portfolio k’s excess return
: Intercept
: Sensitivity of porfolio k’s excess return to market risk premium
: Market risk premium
: Error term
Fama-French Three-Factor Model (FF3):
: Portfolio k’s excess return
: Intercept
: Sensitivity of porfolio k’s excess return to market risk premium
: Market risk premium
Value factor loading
: Return difference between high and low book to market value stocks
Size factor loading
: Return difference between small and large capitalization stocks
: Error term
We estimate the loadings and the intercept () for each portfolio through running time-series regression models. We Use metrics such as and Root Mean Square (RMS) alpha to assess model fit.
Second, Cross-Sectional Regressions (Fama-MacBeth Methodology) have been carried out to find the relationship between average portfolio returns and factor loadings resulting from time-series regressions.
Step 1: Using the time-series regression, obtain factor loadings (β) by each portfolio.
Step 2: It is also necessary to perform the cross-sectional regressions on a month-by-month basis.
: Intercept
, , : Risk premiums for market, size, and value factors
: Error term
Step 3: By averaging , , over time, we perform a regression analysis with the aid of the Newey-West estimators for standard errors taking into account autocorrelation and heteroscedasticity.
We test the relative ability of CAPM and FF3 in explaining returns by using Root Mean Square () alpha score, with lower score favored. Besides, we examine adjusted measures to quantify the percentage of variations in the returns accounted for by the models. Finally, we test the null hypothesis that = 0 against decided level of significance use t-statistic to test the intercept of the time-series regressions. Values of greater than one is correspondingly large and reveal pricing errors, implying that the model does not encompass all systematic risks.
5. Results
Asset pricing models look for factors that provide information about return in an effort to explain the cross-section of asset return. The component or factors in a particular model describe the cross-section of expected returns, according to empirical testing of these models.
Frequently. Although there are alternative methods for assessing asset pricing models, the Fama and MacBeth (1973) technique is popular because it tackles the issue of cross-sectional correlation. This study uses the Fama-MacBeth approach to analyze the CAPM and the Fama-French three-factor model for 100 Fama-French stock portfolios based on size and book-to-market equity (BE/ME). We demonstrate that when it comes to describing the average return cross-section from January 1927 to December 2023, the Fama-French three-factor model performs better than the CAPM.
5.1. Empirical Analysis
According to CAPM, market beta and expected return on assets are proportionate. It displays a linear correlation between beta (β) and risk premium (R − Rf). If this estimate is accurate, the pricing error (α) should be equal to zero.
The average monthly excess returns for 100 Fama-French portfolios are shown in Table 1. These investments' average excess returns per month fall between 0.30% and 1.16%. Additionally, except for the lowest-BE/ME quintile, portfolios of all sizes often have higher average returns. Similarly, the average returns of the portfolios with the highest BE/ME ratio are consistently higher than those of the portfolios with the lowest BE/ME ratio. The BE/ME portfolios with the best and lowest returns had monthly average return differences ranging from 0.23% to 0.86%. If the CAPM is effective on 100 portfolios, then market betas should be able to capture these distinct patterns of systematic variance in returns.
Table 1 displays the CAPM time-series regression estimates. Although market betas are higher for tiny stocks, they are significantly lower for high-BE/ME stocks. It ignores variance in BE/ME-caused returns but implies that betas can explain some of the size fluctuation. Alphas for the smallest-size portfolios beat those for the largest by 0.15% to 0.46% every month, with the exception of the lowest-BE/ME quintile. Additionally, the 18 portfolios' strong alphas show that the CAPM leaves an acceptable return on 100 portfolios that is inexplicable. The joint test of alphas, on the other hand, would provide a trustworthy statistic to assess the significance of price inaccuracy.
3-D bar charts of average excess returns, betas, and alphas are shown in Figure 1. Big stocks yield a poorer return, and low-BE/ME portfolios perform worse than high-BE/ME portfolios. Figure 1(a) shows the comparison with small stocks. Beta should gradually rise from big stock to small stock portfolios and from low-BE/ME portfolios to high-BE/ME portfolios if market beta and return are linearly correlated. It is difficult to observe this intended movement of beta since beta is insufficient to explain the cross-section of returns, as shown in Figure 1(b). The fact that most of the alphas in Figure 1(c) are not zero further indicates that pricing error in CAPM is not insignificant.
Furthermore, Figure 2 shows the CAPM model's goodness-of-fit using a scatter plot of the actual average return and the CAPM-predicted return for 100 portfolios. We cannot assert that sensitivity to market volatility can adequately explain the cross-section of average returns on stock portfolios since the majority of the filled circles fall beyond the 45-degree line. The CAPM is unable to adequately explain the shared variation in average return since the alphas for at least 18 portfolios deviate from 0. According to Banz (1981) and Basu (1983), it implies that there are other elements that are important for asset prices.
The Fama-French three-factor model proposes that three factors—size (SMB), book-to-market equity (HML), and overall market (Rm − Rf)—are responsible for variations in average stock returns. If these three factors are adequate to capture common variance in stock returns, then the intercept (α) in the time-series regression of excess return on these three factors should be equal to 0.
Table 2 displays the t-statistics, alphas, and coefficients from the three-factor Fama-French time-series regression for Fama-French 100 portfolios. The average excess returns of smaller portfolios are frequently higher than those of larger portfolios, while the average excess returns of high-BE/ME portfolios are higher than those of low-BE/ME portfolios.
However, because the relationship between average return and βs for 100 portfolios appears to be flat, market β does not account for this widespread variation in returns. In contrast, coefficients on SMB and HML tend to offer a strong explanation for stock performance variance for these portfolios. In each size quintile, the coefficients on HML, which stand for return for book-to-market equity, increase monotonically from the low- to high BE/ME quintiles. In each BE/ME quintile, the slopes on SMB, the mimicking return for the size component, also climb monotonically, moving from high negative values for the quintiles with the largest size to high positive values for the quintiles of the lowest size. Both HML and SMB clearly capture the systematic volatility in stock returns caused by size and book-to-market equity, which market beta overlooks.
Additionally, alphas for 100 portfolios in three-factor regression range from -0.12% to 0.17% per month. Only six of the 100 alphas depart from 0 by more than 0.14% per month, suggesting that Rm – Rf, SMB, and HML more accurately depict shared variance in stock returns.
The coefficients on Rm – Rf, HML, and SMB are shown in 3-D plots in Figure 3. Although portfolios with higher average returns should have higher market beta, Figure 3(a) does not show this relationship for all quintiles. On the other hand, Figure 3(b) clearly shows a monotonic rise in BE/ME slopes from low- to high-BE/ME (x-axis) portfolios. In relation to book-to-market equity, it suggests that HML records systematic variance in stock returns that the market and SMB do not. Subsequently, Figure 3(c) shows a steady decline in size-related slopes from small- to big-size portfolios (y-axis). Usually, SMB reflects the variation in stock returns in response to size that cannot be explained by market and book-to-market equity.
Figure 3 illustrates how the expected returns from regression on the Fama-French three-factor model are more accurate when both HML and SMB accurately capture typical variation in average returns of portfolios. The Fama-French three-factor model's predicted returns for 100 portfolios closely match the actual returns. Furthermore, the majority of the portfolios' low standard errors of alphas demonstrate the strong explanatory power of the variables in the Fama-French three-factor model for describing average returns.
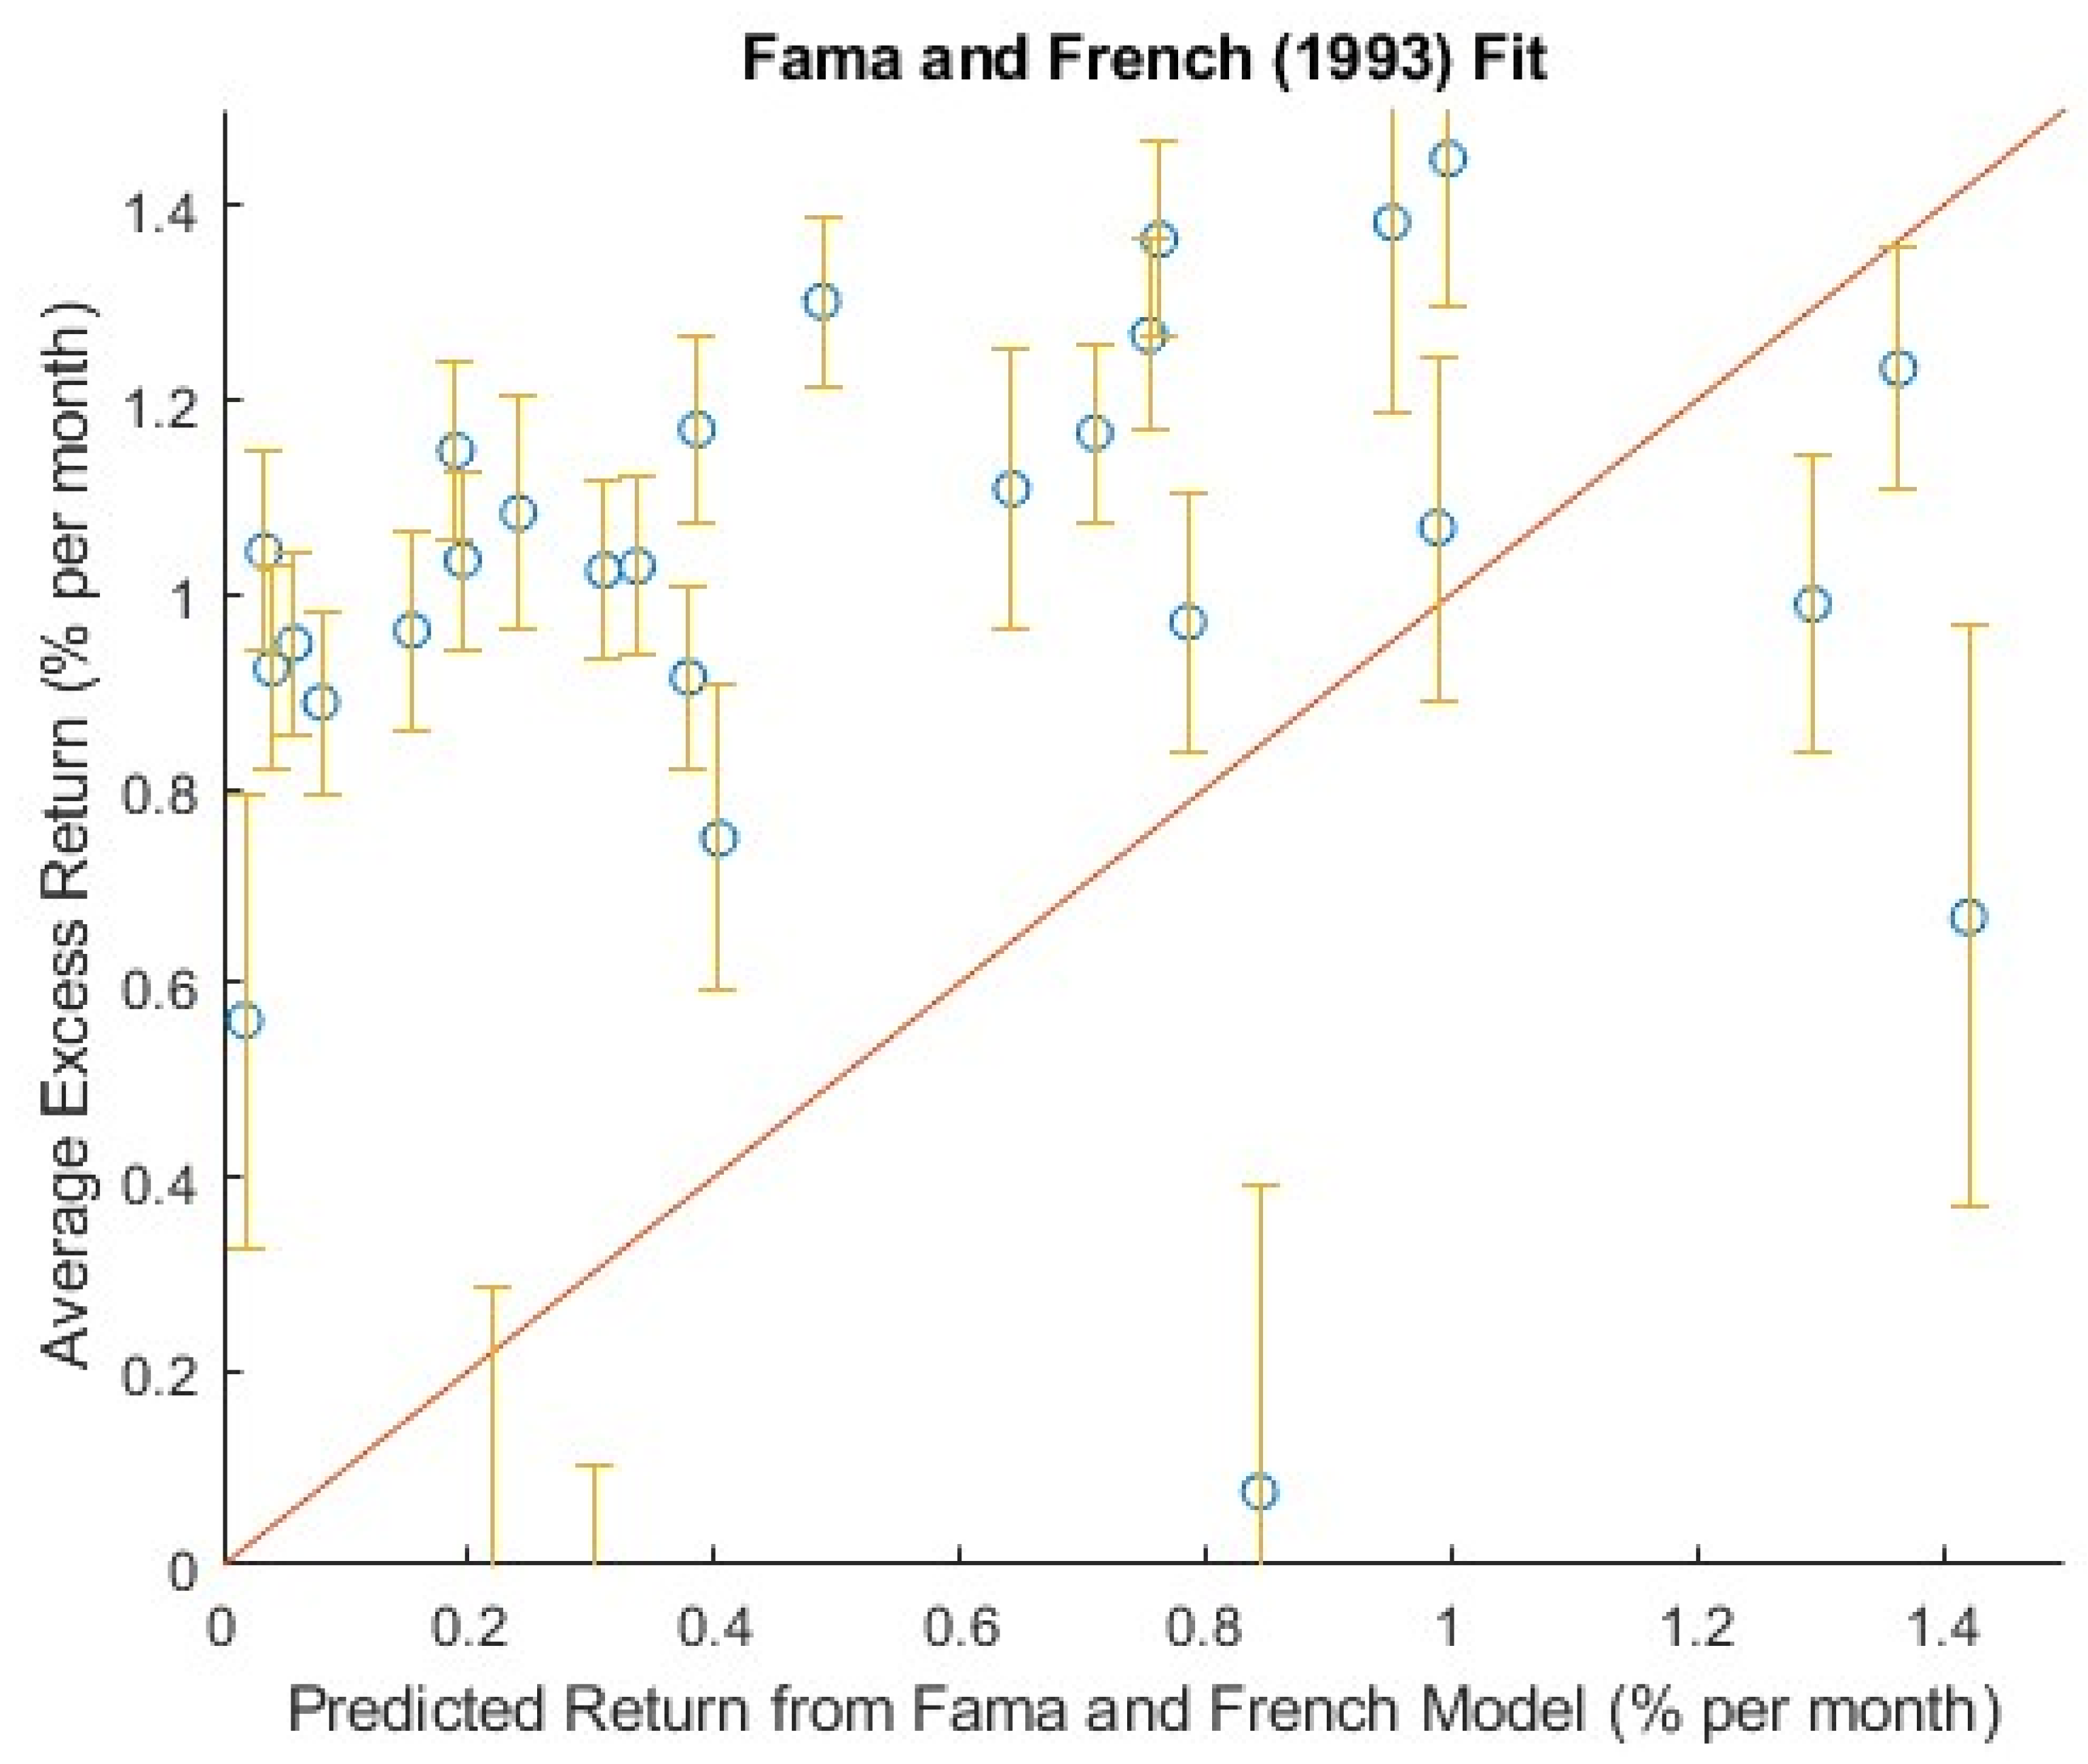
Figure 4.
The relationship between the monthly average excess returns (y-axis) on Fama-French 100 portfolios and the expected excess returns (x-axis) is shown in a scatterplot. Each plot's error bar shows the standard errors of the corresponding alphas. The majority of the filled circles have relatively low standard errors of alphas and sit near the 45° (thick purple) line, indicating that the French and Fama three-factor models have a good ability to explain the cross-section of average returns on stock portfolios.
5.2. Comparison Among Three Models
The drawback of the CAPM that market beta cannot account for all systematic hazards, which define a cross-section of stock return, is addressed by the Fama-French three-factor model. As an alternative, we build a two-factor model using Rm – Rf and HML, presuming that beta accounts for size-related variation. For comparison, Table 3 lists each model's mean and root mean square alpha.
Regression intercepts are used to compare asset pricing models according to a rigorous criterion (Fama and French, 1993). The Fama-French three-factor model has the lowest root mean square (RMS) alpha, which is even lower than half of the RMS alpha of the CAPM. Furthermore, the two-factor model's RMS alpha is lower than the CAPM's. It illustrates how the Fama-French three-factor model performs better than both the CAPM and the two-factor model. RMS alpha ignores the residual distribution, but the Wald or Gibbons-Ross-Shanken tests do.
indicates the extent to which model parameters may be responsible for the typical variation in average returns. As anticipated, the average values of these models agree with the RMS alpha values. Out of the three models, the Fama-French three-factor model has the greatest average value (0.636902). In comparison to the two-factor model and the CAPM, it implies that this model has the best explanatory power for explaining variations in the average return across 100 portfolios. However, the appropriate statistic for comparing models would be adjusted for degrees of freedom.
5.3. Factor Premium
Table 4 presents the slopes of a single cross-sectional regression, indicating that the risk premium for size and book-to-market equity is not zero over the years 1927–2023. The average stock return over the same period cannot be explained by market beta, and the slope for the slope for the slope for the slope for β is negative.
Nevertheless, single cross-sectional regression standard errors have limitations. First of all, because cross-sectional correlation and serial correlation in error terms are not adjusted, these are often underestimated. Second, betas' time-varying nature is not acknowledged.
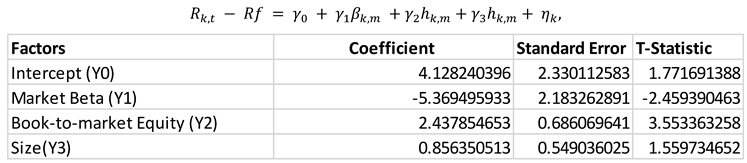
Last but not least, heteroskedasticity weakens OLS standard errors (Petersen, 2009). The updated cross-sectional regression estimates utilizing the Fama-MacBeth technique, which fixes the aforementioned issues, are shown in Table 5.
Compared to OLS regression, Fama-MacBeth regression produces predicted slopes that are lower. Despite the fact that all slopes in the Fama-MacBeth regression have similar signs, the explanatory power of size stops for smaller slopes and larger standard errors. This outcome runs counter to what Fama and French (1992) found. Moreover, the negative slope of the market beta cannot account for average stock returns. However, book-to-market equity alone has a t-statistic of 7.7234.3 and an average risk premium of 0.9229%. This is because high BE/ME equities typically have continuously low earnings that are eventually reversed, according to Fama and French (1995). However, Lakonishok, Shleifer, and Vishny (1994) attribute this risk premium to mispricing. However, Fama-Macbeth regression risk premium estimates are not objective, according to Jagadeesh et al. (2019).
6. Conclusion
A comprehensive comparative analysis addresses how well the Capital Asset Pricing Model (CAPM), and the Fama-French Three-Factor Model (FF3) explain variations in stock returns across sections and over time. The study extends the Fama and French (1993) analysis through the period January 1927 to December 2023 to generate substantial findings regarding the FF3 model's accuracy.
Key findings of this study indicate that the FF3 model demonstrates superior performance in explaining systematic risks together with return variations compared to the CAPM framework. The SMB and HML factors added to CAPM help solve pricing issues which the original model could not explain. Besides, the HML factor persistently generates robust positive premiums whereas SMB reveals varying influence yet maintains its importance in understanding firm size exposures. Finally, Fama-MacBeth regression methods confirm that these factors demonstrate robustness through reliable risk premium estimations despite the presence of heteroscedasticity and cross-sectional correlation.
The research findings validate that the FF3 model represents an ideal structure for analyzing asset prices while conducting portfolio reviews. Traditional single-factor risk models such as CAPM lack sufficient capabilities to detect systematic risks so multi-factor models prove essential for risk detection. Future research requires investigating new systematic risk variables together with profitability and investment factors (following the Fama-French Five-Factor Model model) for improved systematic risk comprehension. Extending research to worldwide markets combined with alternative asset classes would show the FF3 model's universal application for stock evaluation. This research pushes forward asset pricing investigations while proving and expanding the Fama-French Three-Factor Model for important financial research use and investment strategy development.
This research also aims at defining which of the CAPM and the FF3 models has the capacity to explain the cross-sectional stock return better. This paper uses 100 portfolios created according to size and BE/ME characteristics and examines the period of JAN 1927 to NOV 2023. By employing basic time series regression and Fama Macbeth (1973) cross sectional regression our research suggests that the FF3 model outperforms CAPM in explaining systematic risk and volatility of average returns.
Different from CAPM that employs market beta only, the FF3 model adds the size (SMB) and the value (HML) factors which significantly improve the reflectiveness. The evaluation indicates that CAPM exhibits relatively high levels of pricing anomalies, thus supporting the relatively high alphas of many portfolios exhibited in the analysis of the model.
Taking cross-section in regression, we shall be able therefore to confirm conclusions about relevance of the HML factor as reflecting more really the positive risk premium constant, while the role of the SMB factor is rather dubious.
These results suggest that CAPM is unsuitable and the incorporation of size and value factors in the FF3 model as a reasonable model to explain the asset prices. This research allies with the existing literature on factor-based models, and in the process the study posits that the application of multi-factor models can assist in informing on systematic return volatility in the portfolio.
References
- Banz, R. W. (1981). The relationship between return and market value of common stocks. Journal of Financial Economics. [CrossRef]
- Basu, S. (1983). The relationship between earnings’ yield, market value, and return for NYSE common stocks. Further evidence. Journal of Financial Economics. [CrossRef]
- Fama, E. F. , & French, K. R. (1993). Common risk factors in the returns on stocks and bonds. Journal of Financial Economics. [CrossRef]
- Fama, E. F. , & French, K. R. (1995). Size and book-to-market factors in earnings and returns. The Journal of Finance. [CrossRef]
- Fama, E. F. , & MacBeth, J. D. (1973). Risk, return, and equilibrium: Empirical tests. Journal of Political Economy. [CrossRef]
- Jegadeesh, N. , Kim, J., Krische, S. D., & Lee, C. M. C. (2019). Empirical tests of asset pricing models with individual assets: Resolving the errors-in-variables bias in risk premium estimation. Journal of Financial Economics. [CrossRef]
- Lakonishok, J. , Shleifer, A., & Vishny, R. W. (1994). Contrarian investment, extrapolation, and risk. The Journal of Finance. [CrossRef]
- Petersen, M. A. (2009). Estimating standard errors in finance panel data sets: Comparing approaches. Review of Financial Studies. [CrossRef]
Figure 1.
The top panel of Figure 1 shows the average excess returns on the z-axis for the Fama-French 100 portfolios. For each of the 100 Fama-French portfolios on excess market return, time series regression of excess return is used to construct the betas and alphas shown in the left and right parts of the bottom panel, respectively. The CAPM alpha and beta are shown by the Z-axis in the bottom panel's right and left figures, respectively. All plots' X and Y axes display the portfolios sorted by size and book-to-market equity in that order.
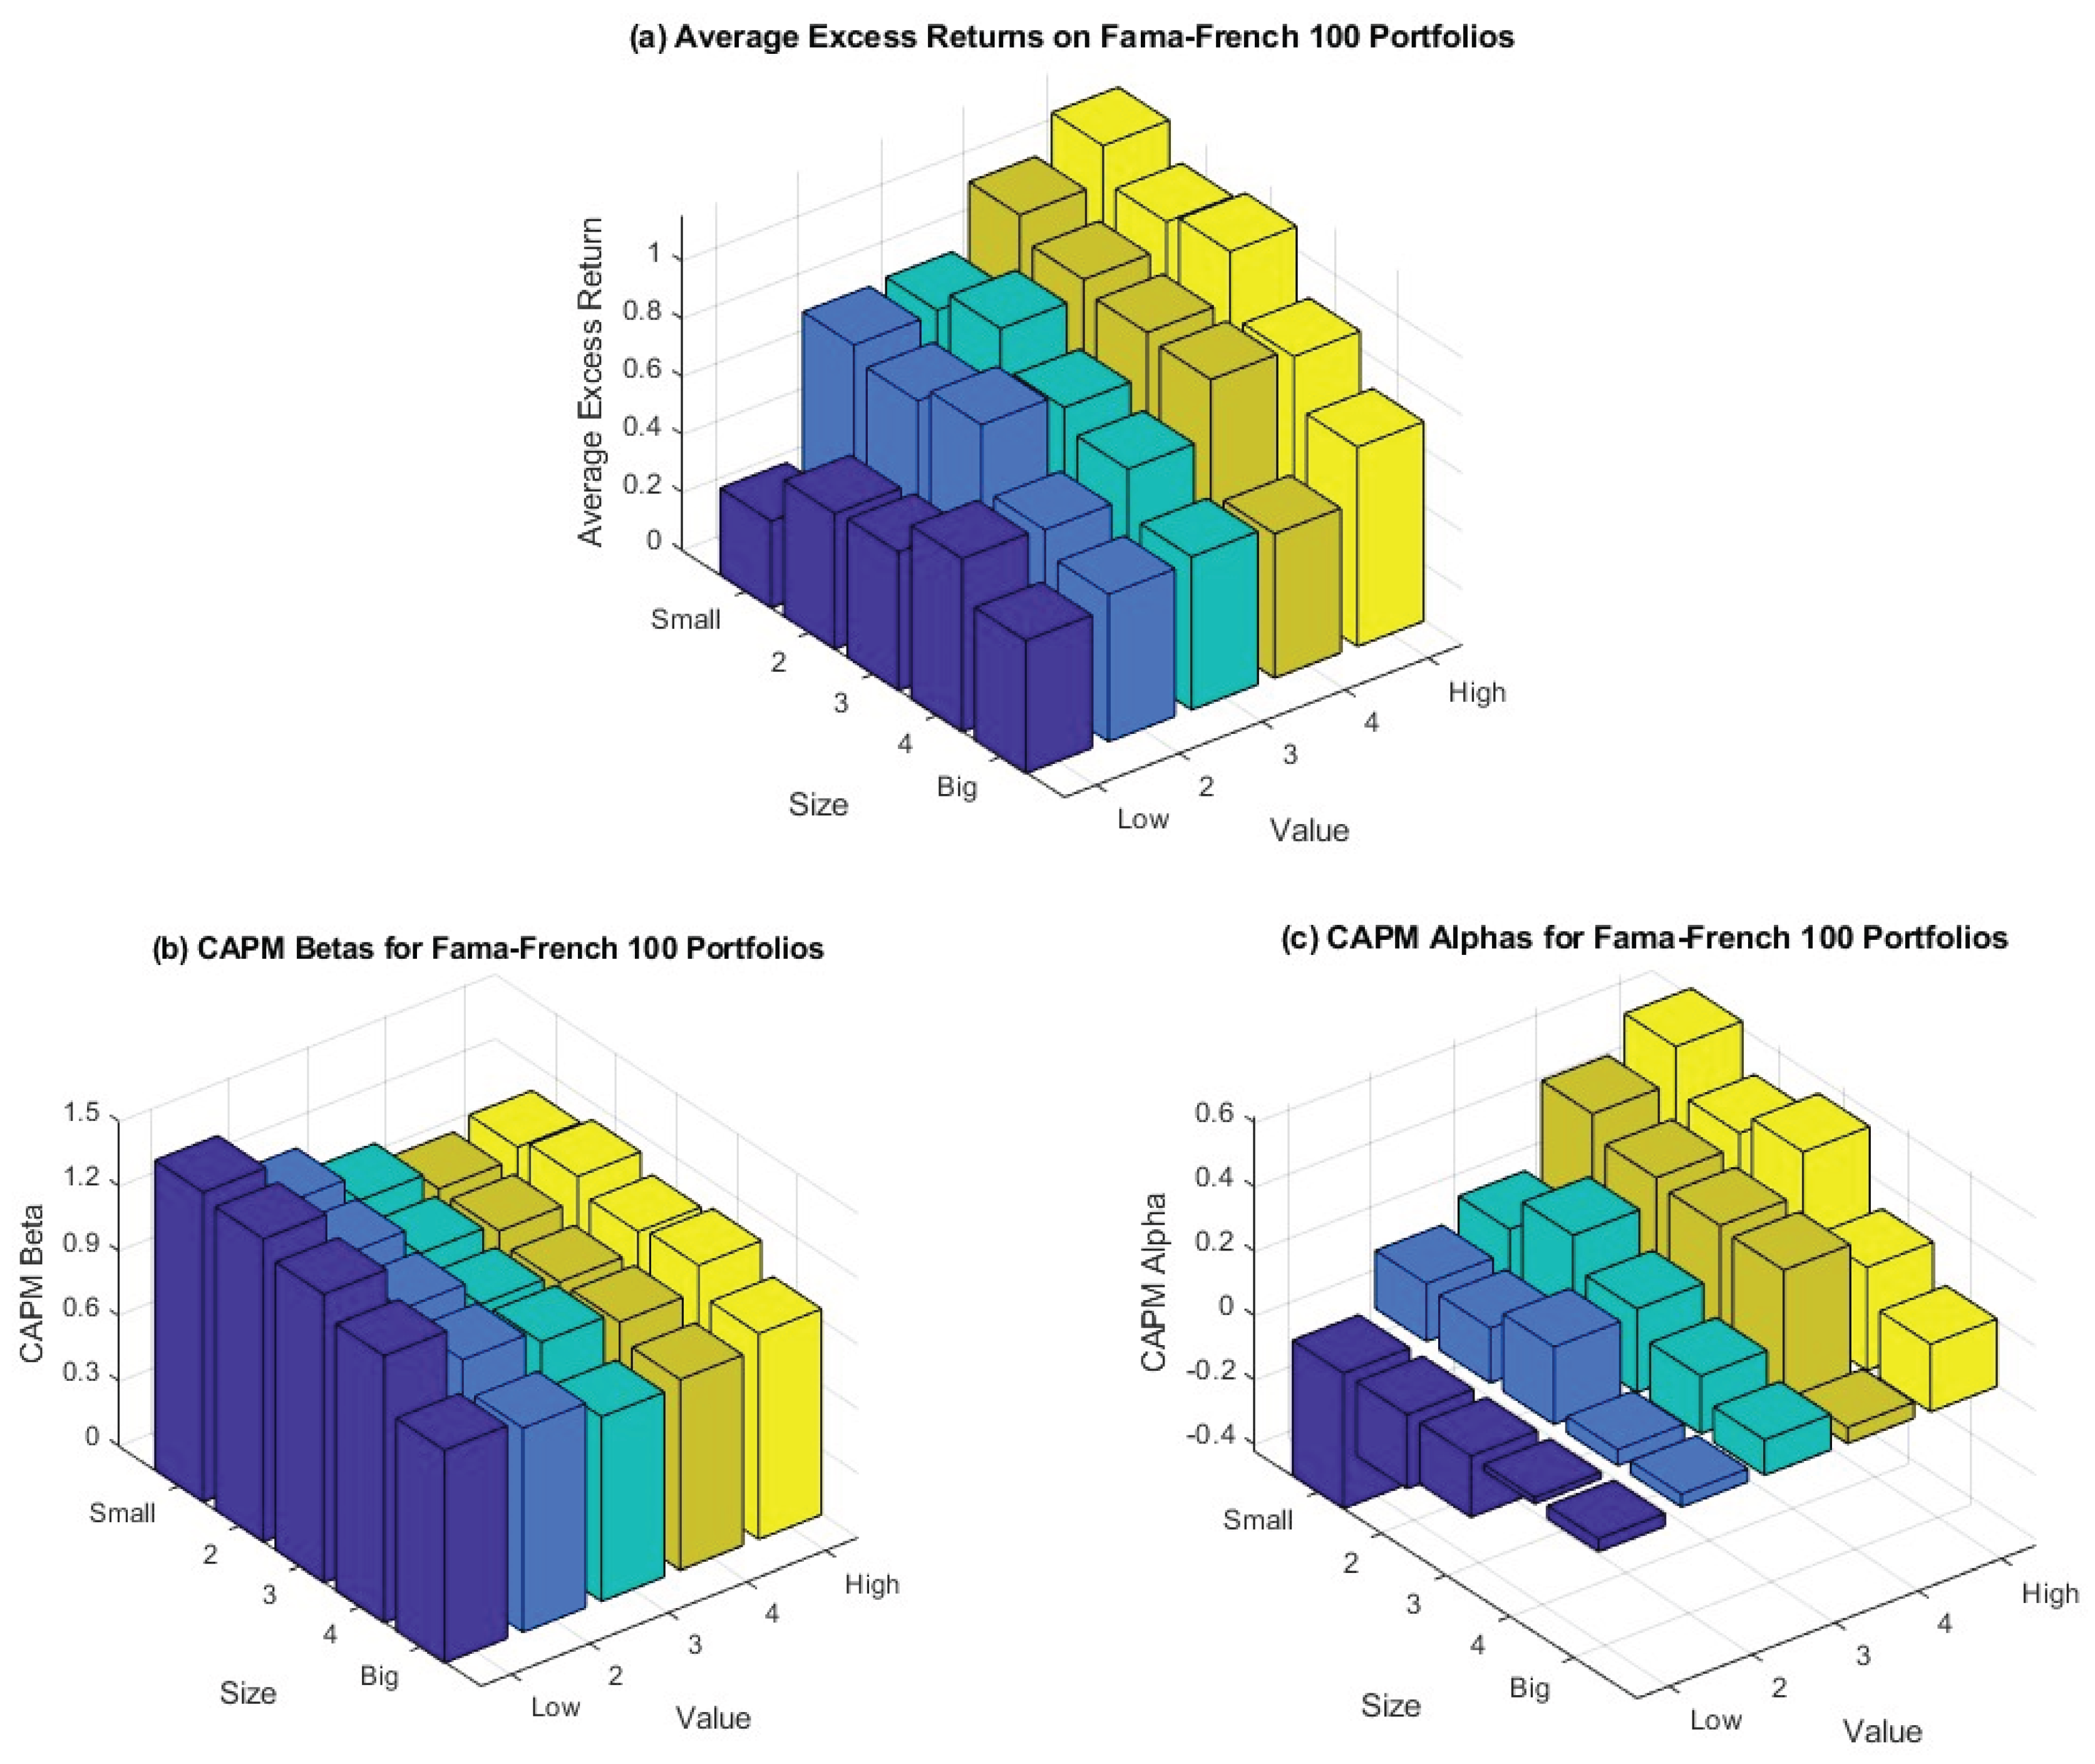
Figure 2.
Figure 2 shows the relationship between the expected excess returns (x-axis) and the monthly average excess returns (y-axis) for Fama-French 100 portfolios. A large deviation of full circles from the 45-degree line indicates that the CAPM has a low explanatory capacity to explain the cross-section of average returns on stock portfolios.
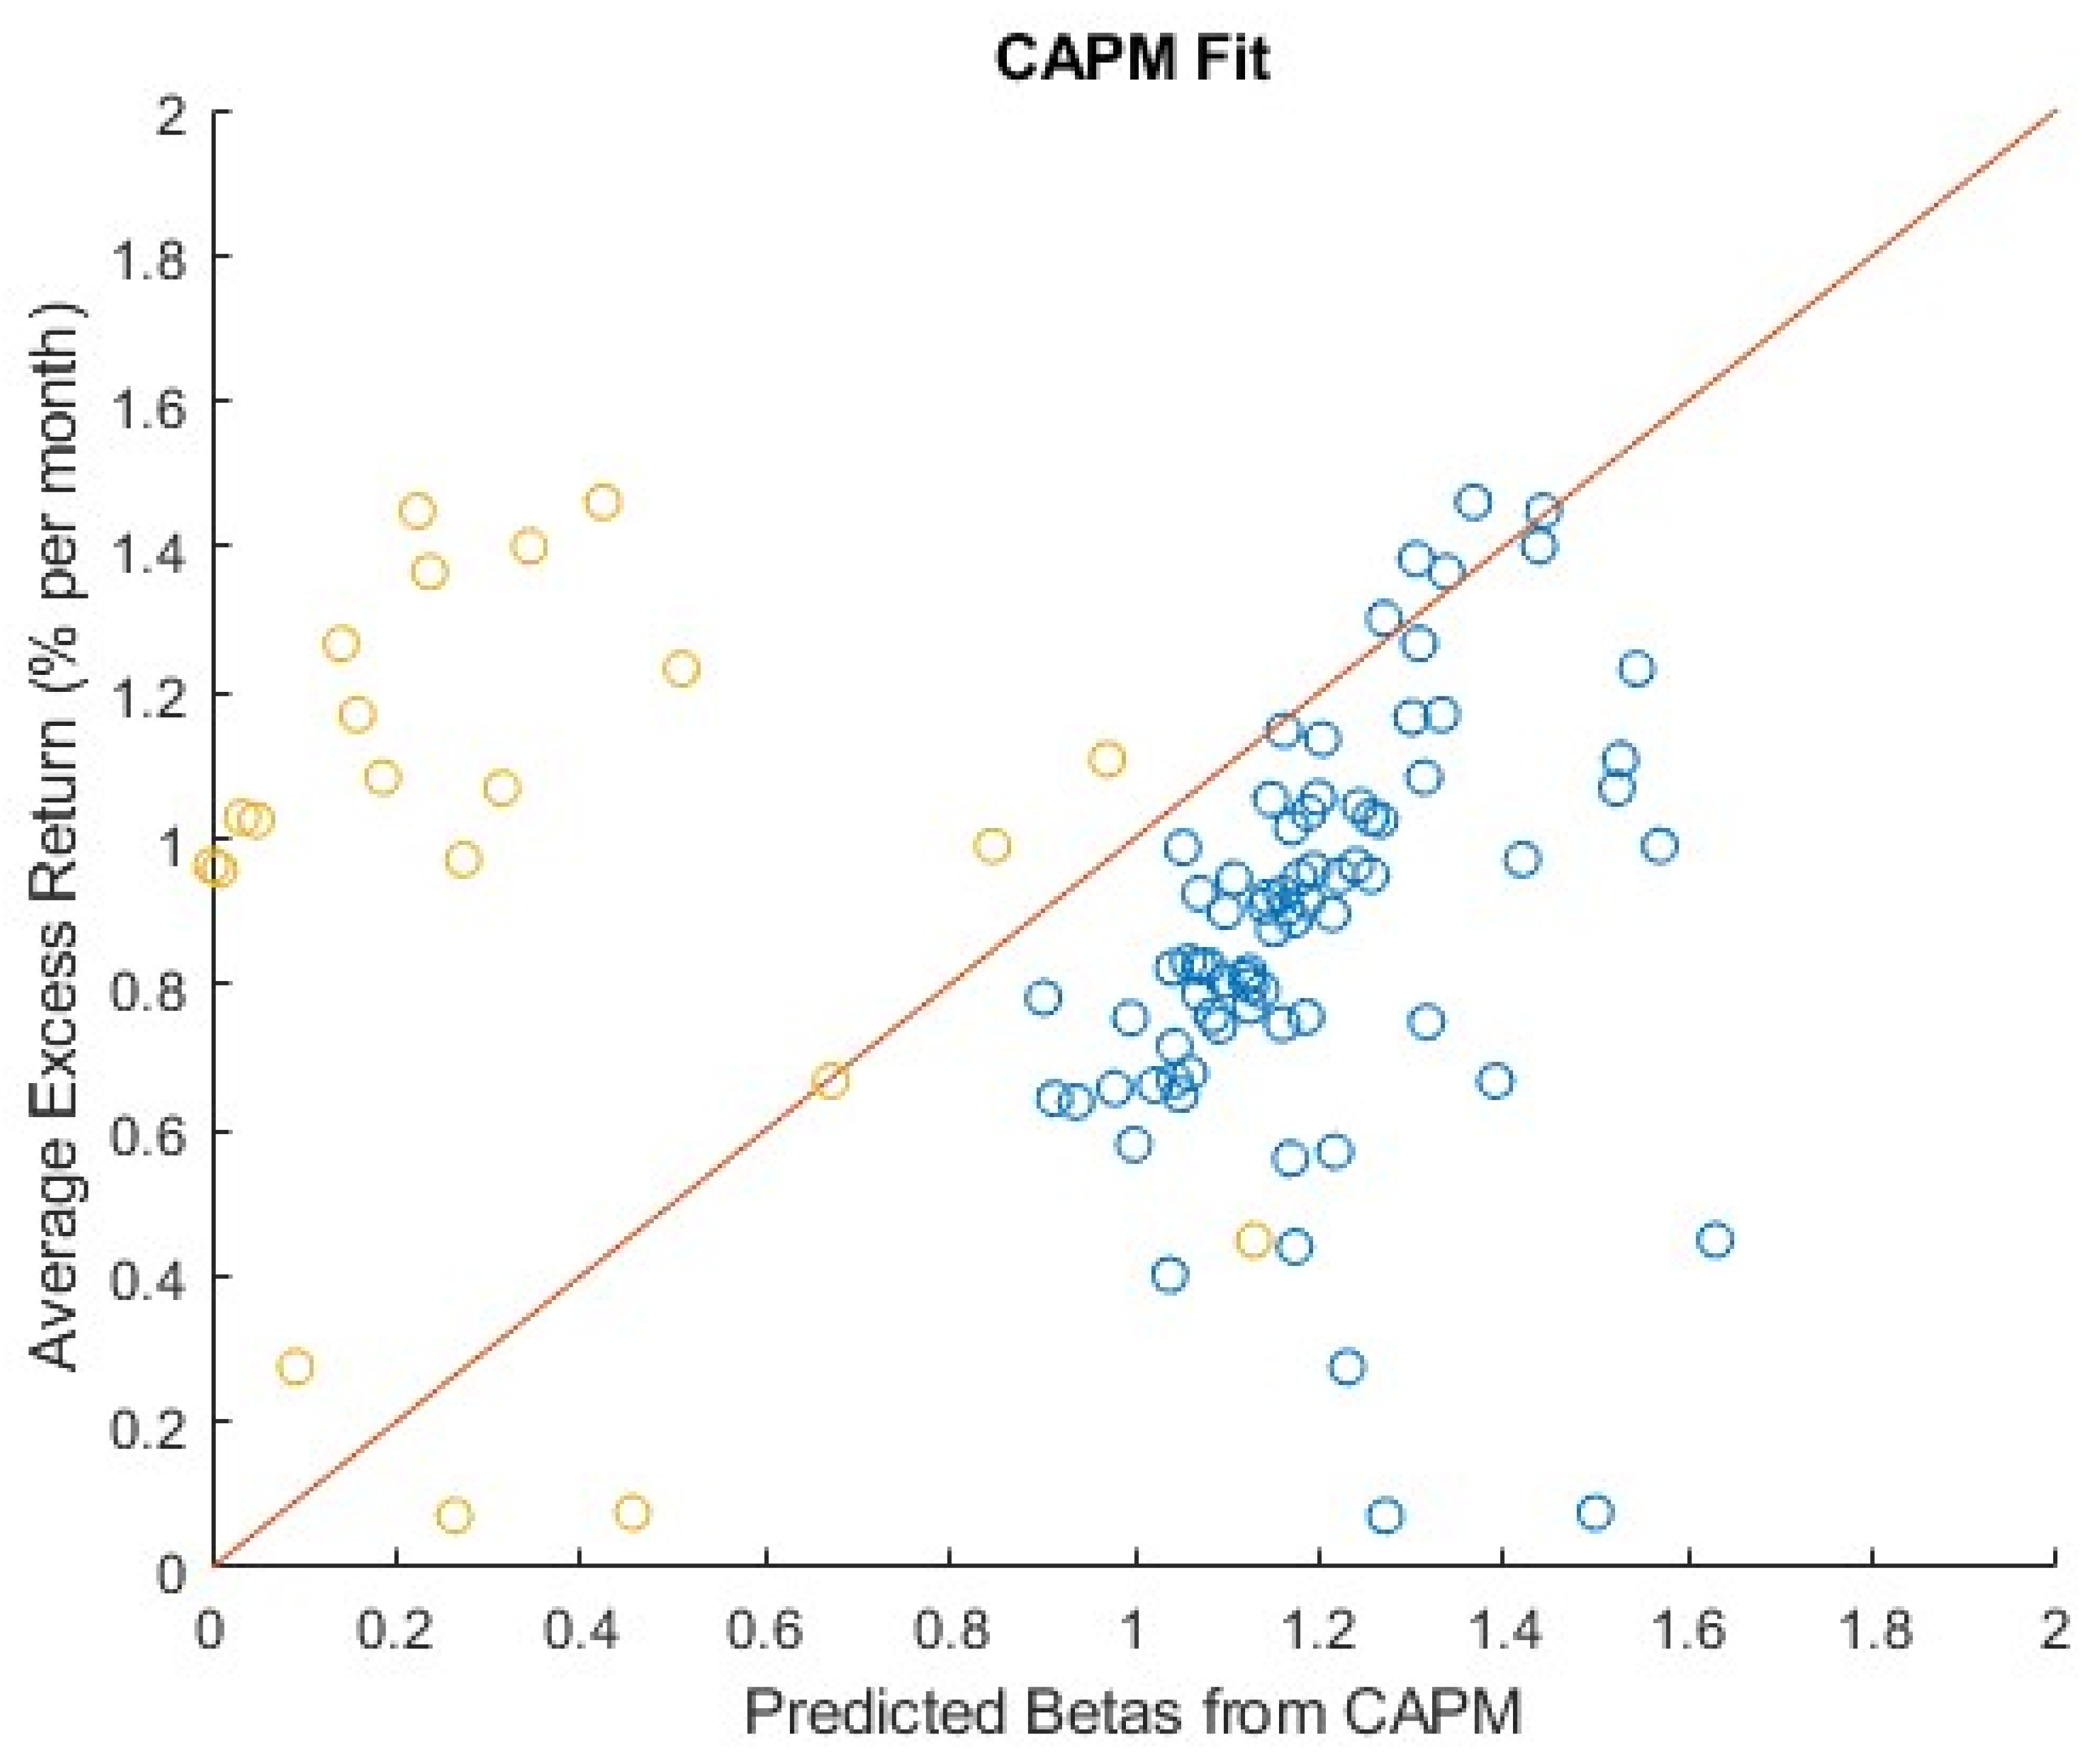
Figure 3.
Figure 3 shows the market betas for the 100 Fama-French portfolios, with the French and Fama market betas on the z-axis. The bottom panel's left and right sections show the book-to-market equity factor and size factor coefficients, respectively. Time series regression of excess return is used to determine all coefficients for each of the 100 Fama-French excess portfolios. Market return, emulating returns for the book-to-market equity (HML) and size (SMB) factors. The Z-axis in the bottom panel's left and right figures represents the French size beta and the Fama value beta (book-to-market equity), respectively. All graphs' X and Y axes display the portfolios sorted consecutively by size and book-to-market equity.
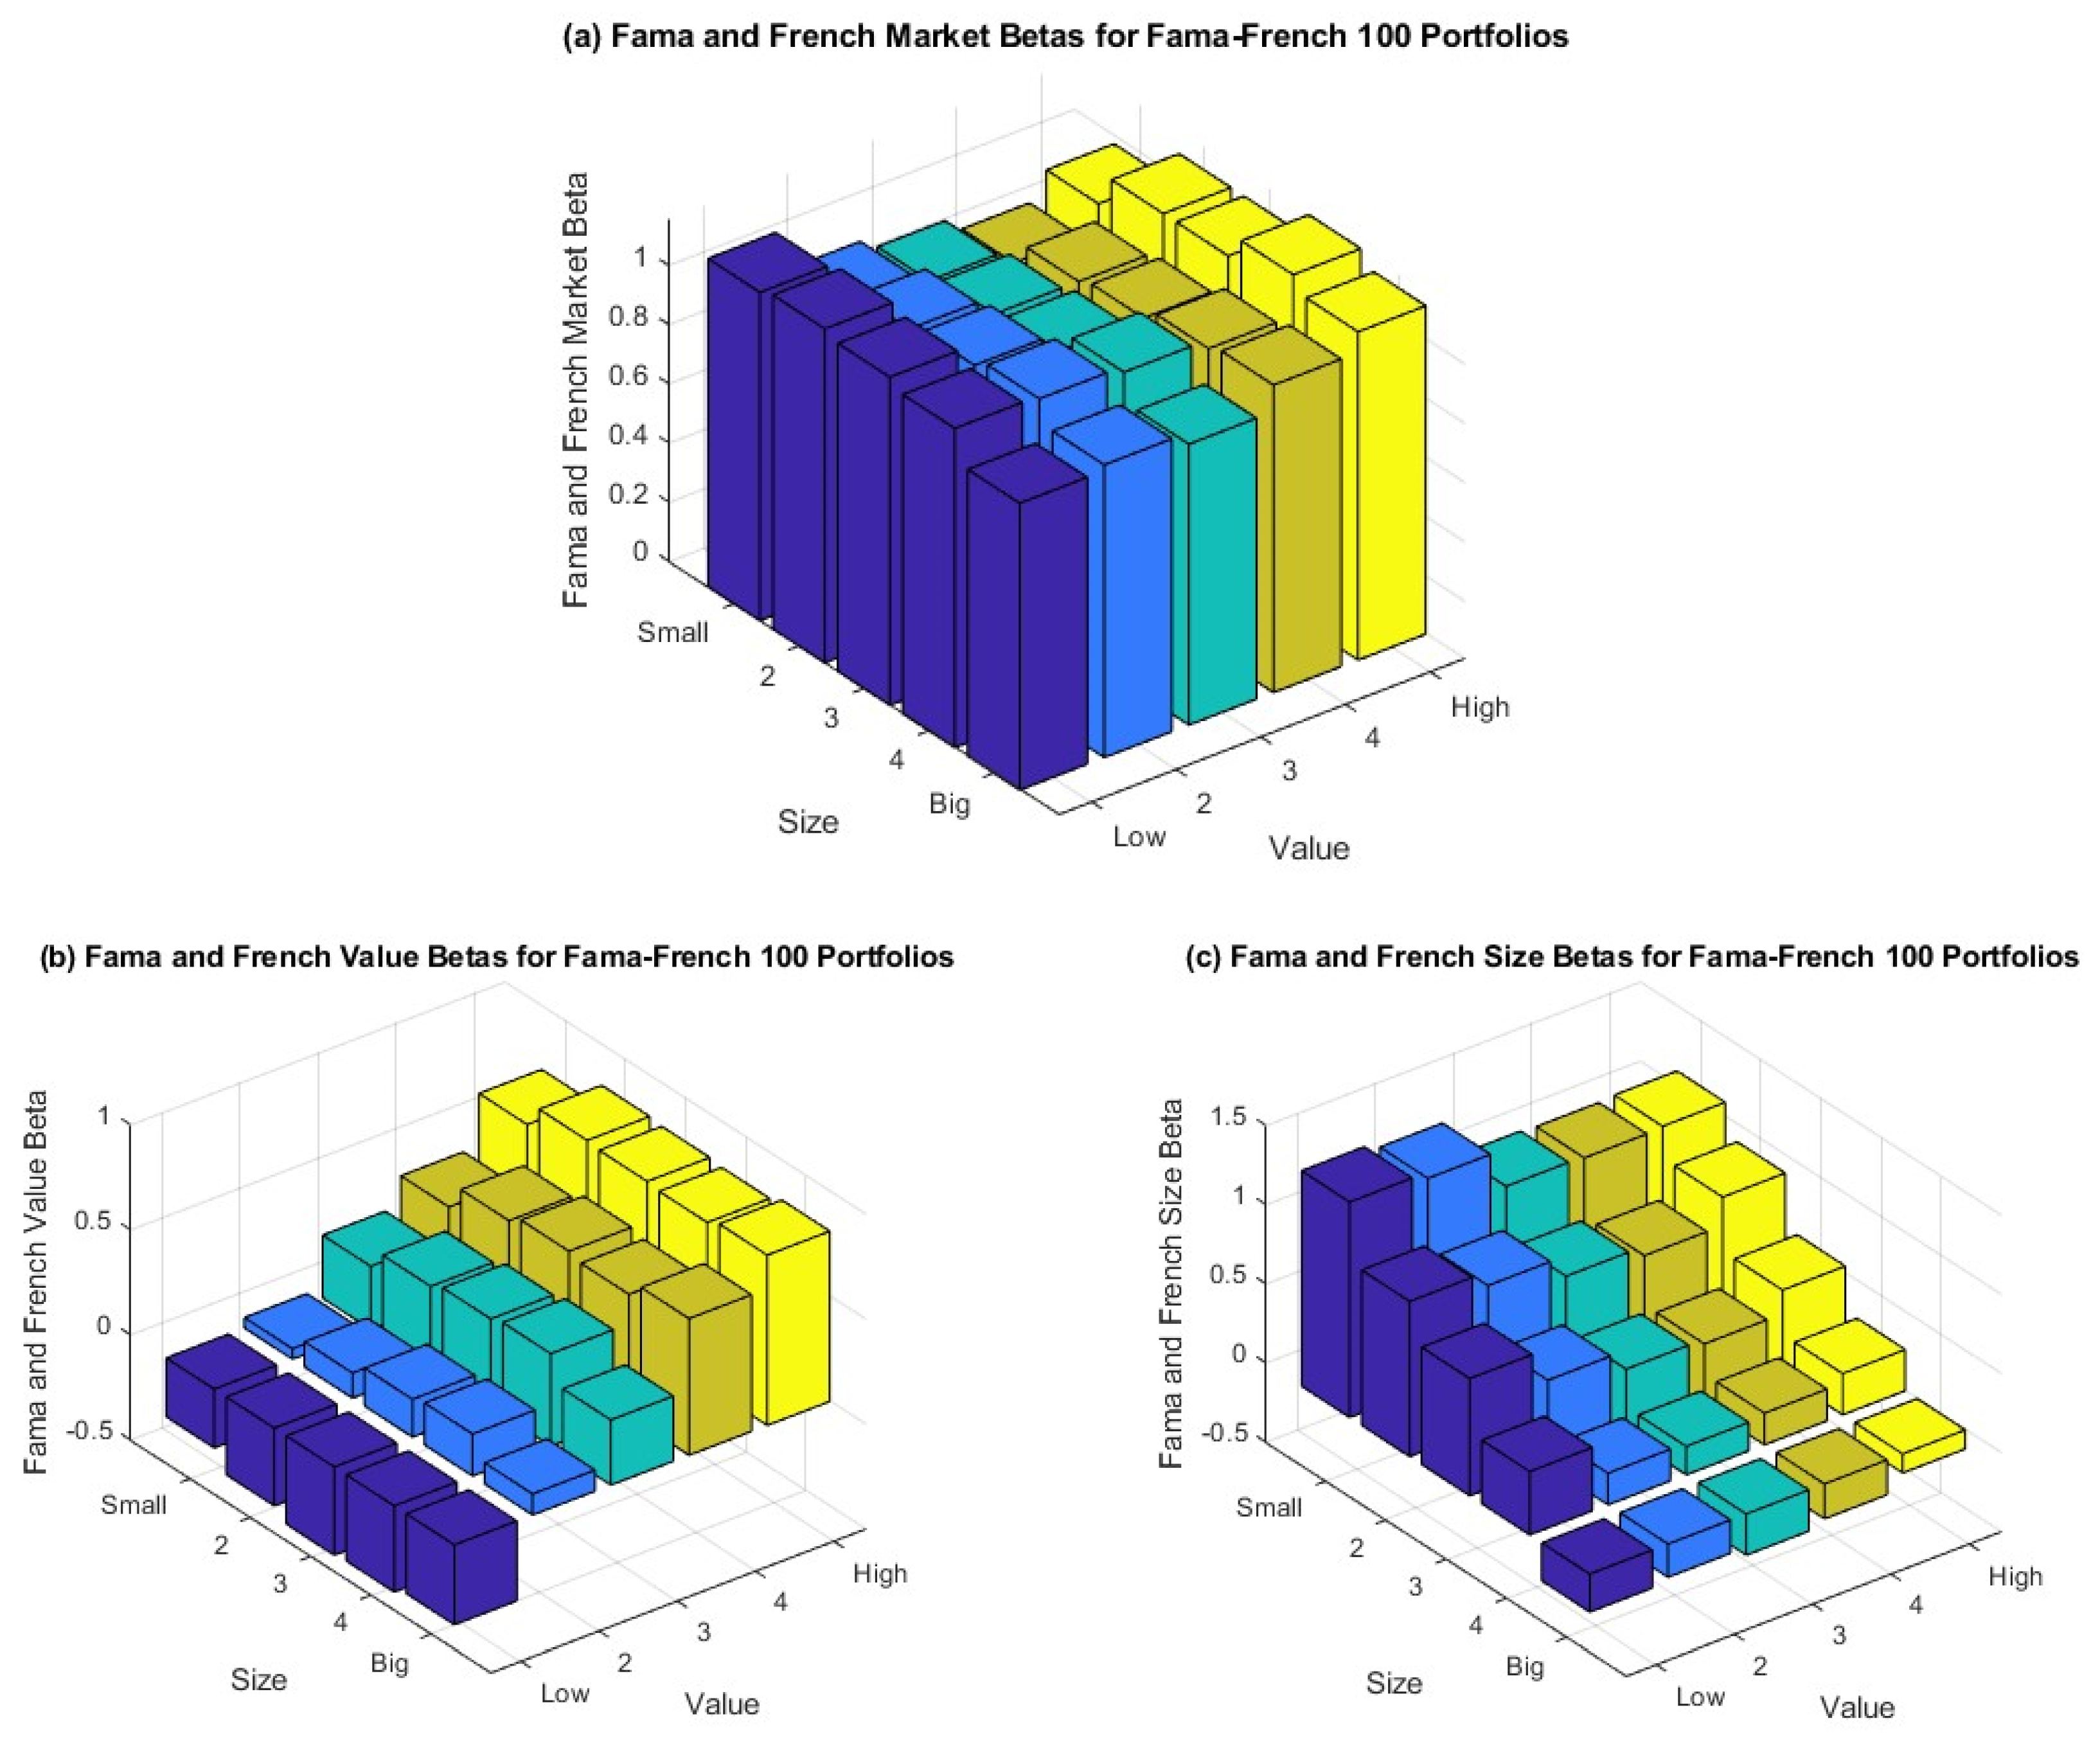

Table 1.
CAPM Regressions and Summary Statistics for Simple Monthly Percent Excess Returns on 100 French and French portfolios based on BE/ME and size: January 1927 to December 2023, 1152, months.
Table 1.
CAPM Regressions and Summary Statistics for Simple Monthly Percent Excess Returns on 100 French and French portfolios based on BE/ME and size: January 1927 to December 2023, 1152, months.
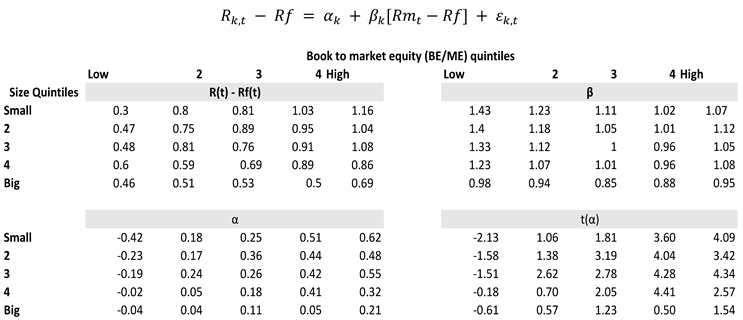 |
Note: For all US-incorporated CRSP companies listed on the NYSE, AMEX, or NASDAQ, Rm is the value-weighted monthly return (%). The one-month Treasury bill rate, or Rf, is noted at the start of each month. Dependent variable: excess returns on 100 stock portfolios based on book-to-market equity and size. For 100 portfolios, α is the intercept from time-series regression, and β is the slope for the market factor. For time-series regression, the rolling window is 60 months.
Table 2.
Simple Monthly Percent Excess Returns for 100 Fama-French Portfolios by Size and BE/ME: 1152 months from January 1927 to December 2023, together with Fama-French Three-Factor Regressions and Summary Statistics.
Table 2.
Simple Monthly Percent Excess Returns for 100 Fama-French Portfolios by Size and BE/ME: 1152 months from January 1927 to December 2023, together with Fama-French Three-Factor Regressions and Summary Statistics.
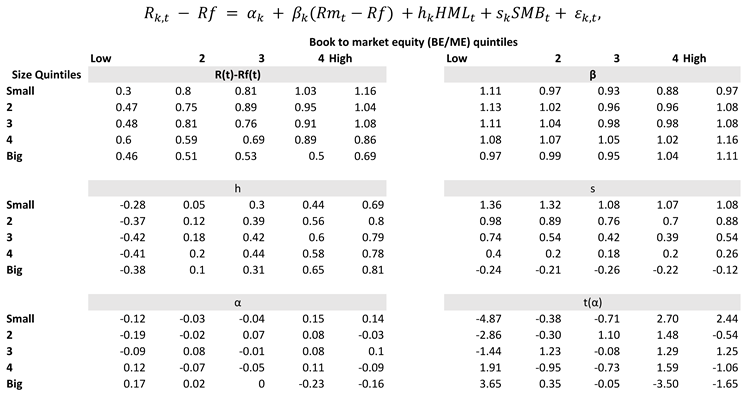 |
Note: All US-incorporated CRSP businesses listed on the NASDAQ, AMEX, or NYSE have a value-weighted monthly return (%) represented by Rm. Rf is the one-month Treasury bill rate at the beginning of each month. The return on the mimicking portfolio is SMB (small minus big), which is the size component in stock returns. HML (high minus low) is the return on the book-to-market factor matching portfolio. Excess returns on 100 stock portfolios based on size and book-to-market equity are the dependent variable. The equivalent slopes for the market factor, book-to-market equity factor, and size factor are β, ℎ, and s, respectively. The time-series regression intercept for 100 portfolios is denoted by α. The rolling window for time-series regression is sixty months.
Table 3.
Comparison of the CAPM, Two-Factor Model, and Fama-French Three-Factor Model.
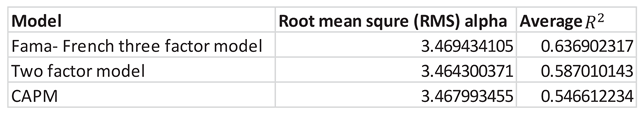 |
For the Fama French 100 stock portfolios based on size and book-to-market equity, the time series regression of each model has been used to evaluate the root mean square alpha and average Market, bookto-market equity, and size factors are all included in the Fama-French three-factor model; market and book-tomarket equity factors are included in the two-factor model; and the market component alone is included in the CAPM: January 1927 to December 2023, 1152 months. For time-series regression, the rolling window is 60 months.
Table 4.
Simple Monthly Percent Excess Returns on Market Value, Book-to-Market Equity, and Size: January 1927 to December 2023, 1152, months, applying single cross-sectional regression.
Table 4.
Simple Monthly Percent Excess Returns on Market Value, Book-to-Market Equity, and Size: January 1927 to December 2023, 1152, months, applying single cross-sectional regression.
 |
Note: For the Fama-French 100 stock portfolios based on size and book-to-market equity, the estimated coefficients β, h, and s are derived from the time series regression of the Fama-French three-factor model. For time-series regression, the rolling window is 60 months.
Table 5.
Month-by-Month Cross-Sectional Regressions for Size, Book-to-Market Equity, and Simple Monthly Percent Excess Returns on Market β: 611 months during January 1927 to December 2023.
Table 5.
Month-by-Month Cross-Sectional Regressions for Size, Book-to-Market Equity, and Simple Monthly Percent Excess Returns on Market β: 611 months during January 1927 to December 2023.
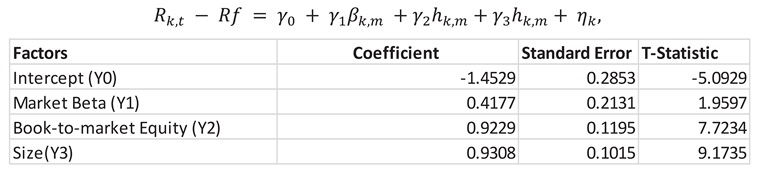 |
Note: Time series regression of the Fama-French three-factor model for Fama-French 100 stock portfolios based on size and book-to-market equity yielded estimated coefficients for market, book-to-market equity, and size factors, respectively, denoted by the symbols β, ℎ, and s. The rolling window for time-series regression is 60 months. The slope parameter estimates (the lambdas) from month-by-month cross-sectional regression are the time-series average of the monthly regression coefficients for January 1927 to December 2023. The t-statistic is calculated by dividing the average slope by its time-series standard error. The standard deviation across time is divided by the square root of the number of time-series estimations of the lambdas to determine the standard error, which is based on the method of Fama and MacBeth (1973).
Disclaimer/Publisher’s Note: The statements, opinions and data contained in all publications are solely those of the individual author(s) and contributor(s) and not of MDPI and/or the editor(s). MDPI and/or the editor(s) disclaim responsibility for any injury to people or property resulting from any ideas, methods, instructions or products referred to in the content. |
© 2025 by the authors. Licensee MDPI, Basel, Switzerland. This article is an open access article distributed under the terms and conditions of the Creative Commons Attribution (CC BY) license (http://creativecommons.org/licenses/by/4.0/).
Copyright: This open access article is published under a Creative Commons CC BY 4.0 license, which permit the free download, distribution, and reuse, provided that the author and preprint are cited in any reuse.


