
Submitted:
26 July 2025
Posted:
28 July 2025
You are already at the latest version
Abstract
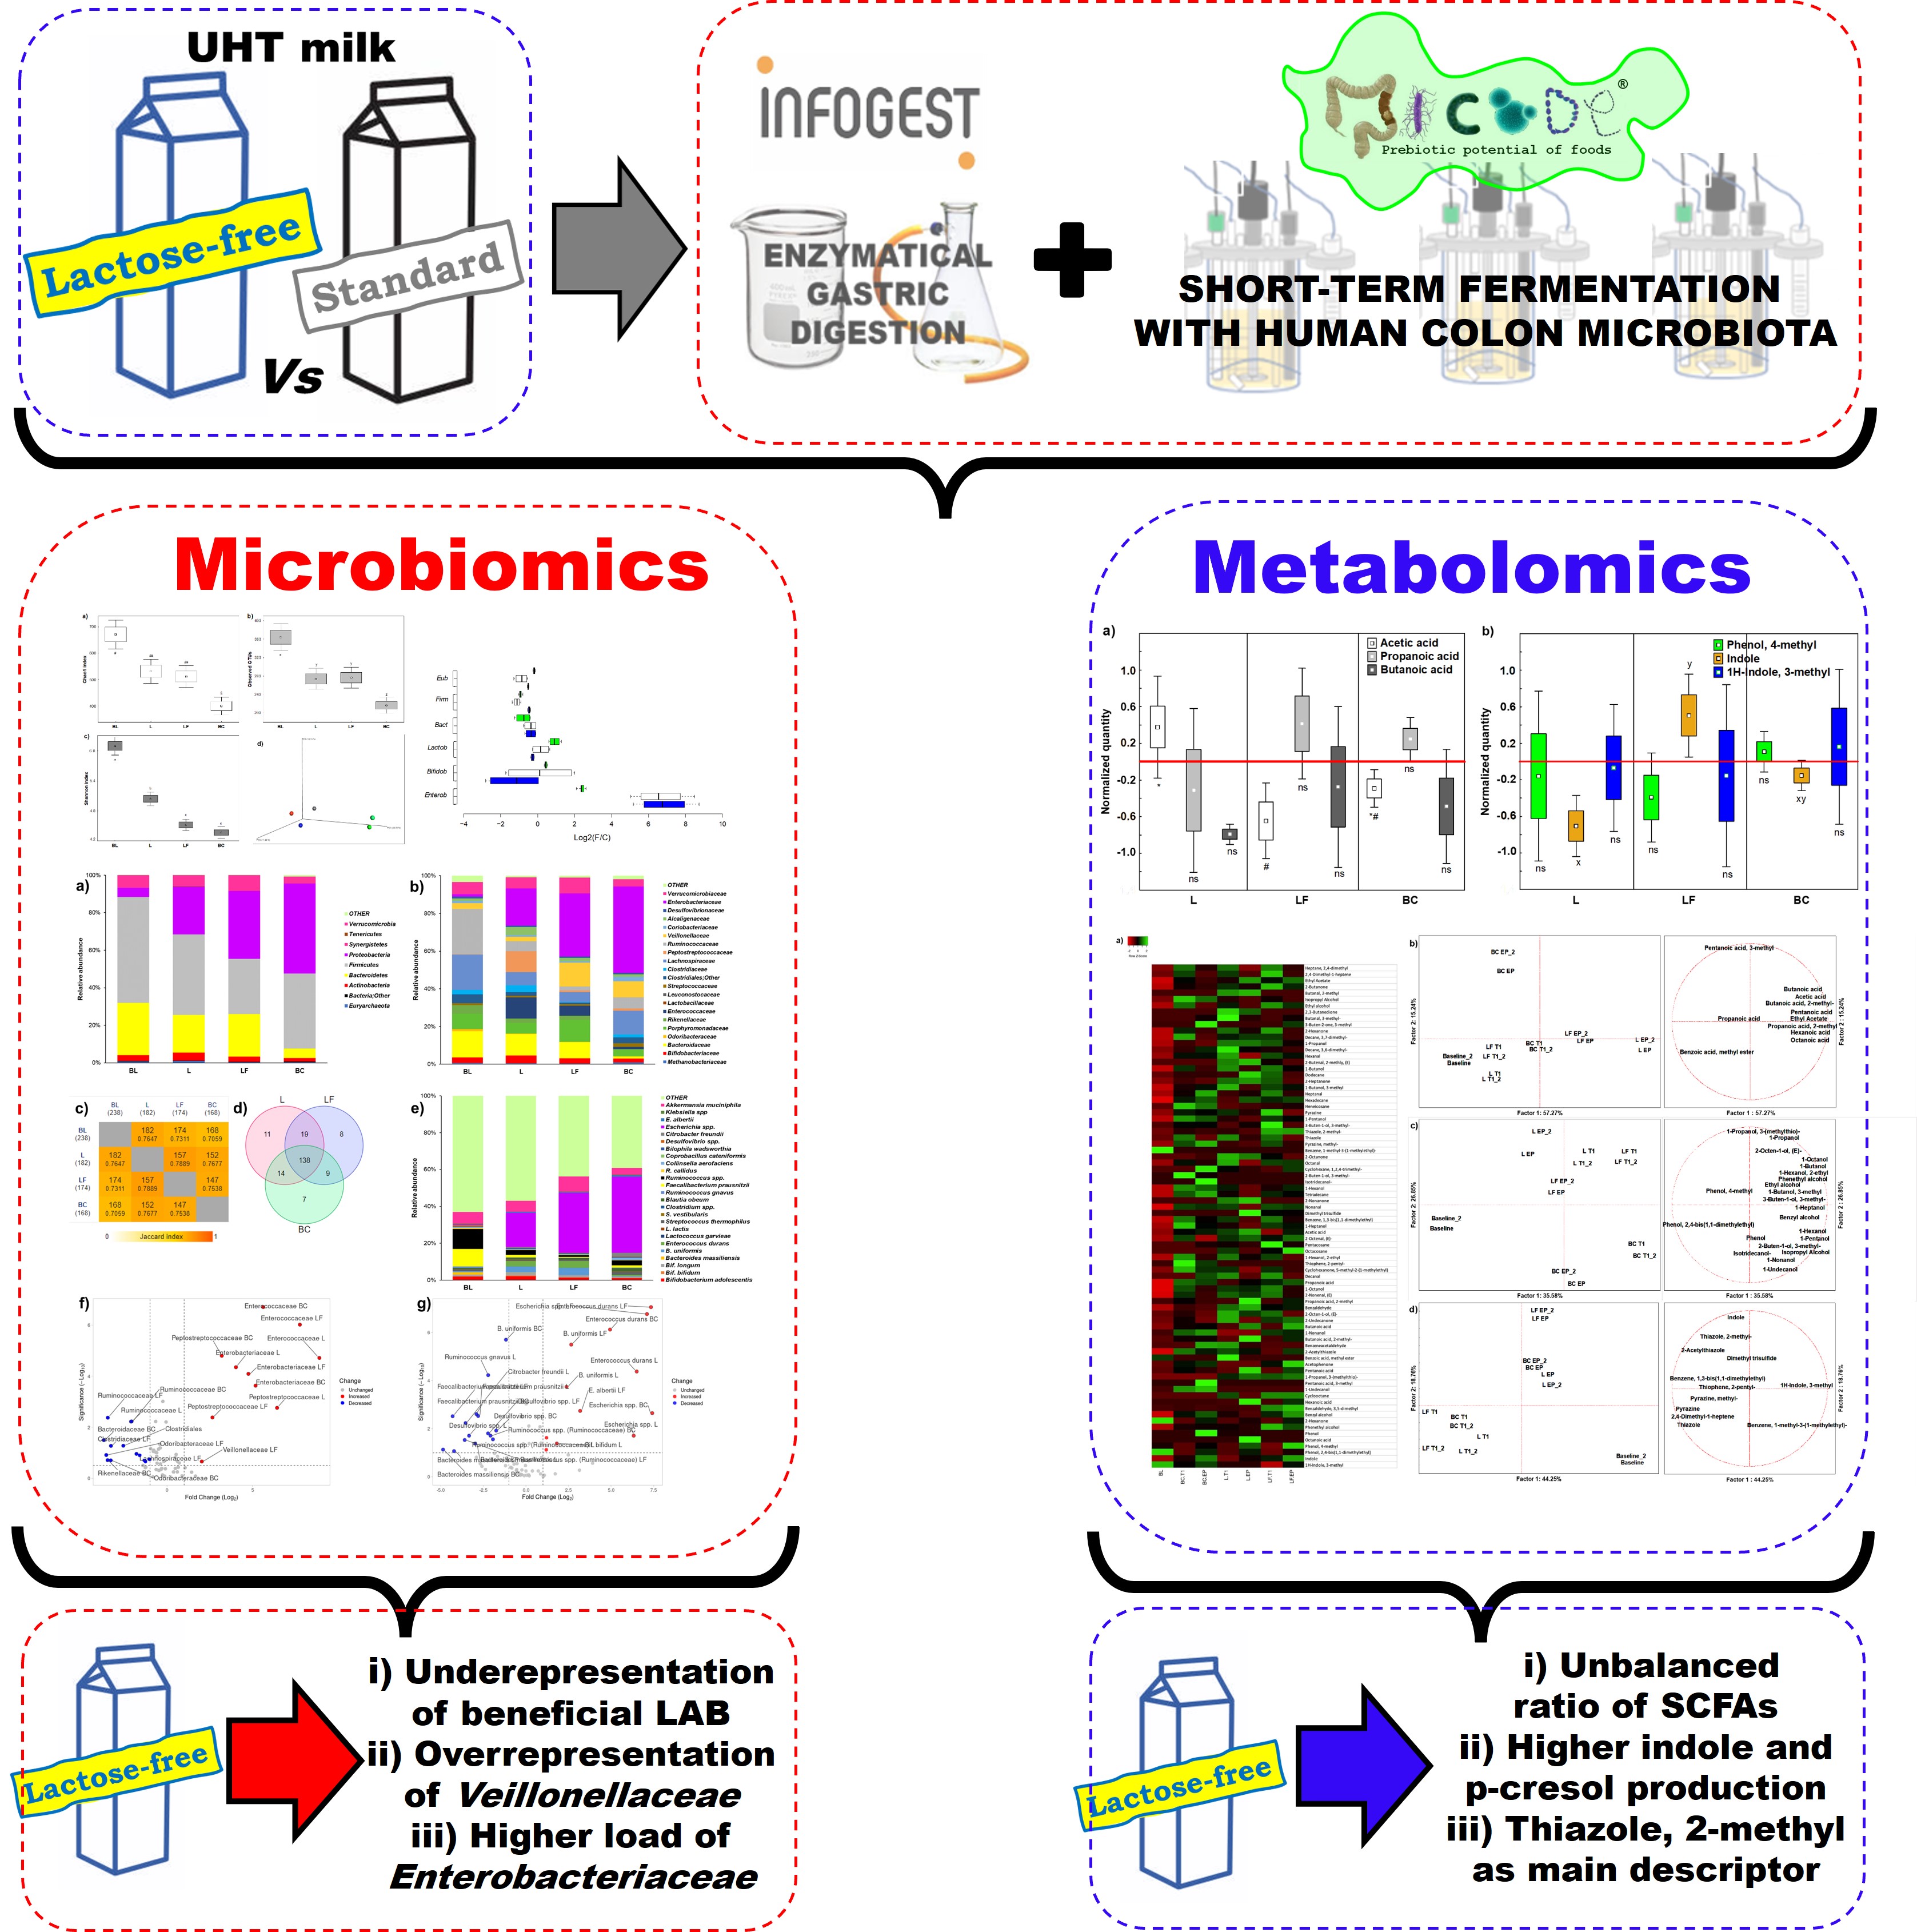
Nowadays, consumption of “free from” foods by non-specific consumers is increasing, also due to misperception of labels that seems that the foods are healthier. These foods are formulated for allergic or diseased consumers, and it is not known if there are more benefits than risks for normal ones. For example, there is no work presenting the interplay of lactose-free milk with the colon microbiome of healthy people. To focus on the eventual modulation of intestinal microbiota of normal subjects by lactose-free milk, we performed an in vitro simulation of digestion and fermentation powered by microbiomics and metabolomics approaches to study changes of gut microbiota in bacterial populations and production of metabolites. Results indicated that lactose-free and lactose-containing milk differently modulated colonic microbiota by several microbiological indicators, including the reduction of Bifidobacteriaceae and Lactobacillales and the reduction of beneficial production of microbial compounds. Such features suggest that lactose-free milk increases the risk of dysbiosis in normal subjects.
Our work scouted the culprits of this dysbiosis among hundreds of molecules and microbes of the gut microbiota, giving names and niches for the first time. It employs an in vitro model which is the new dictate of sustainable research and improves translatability. Our findings support the European Society for Clinical Nutrition and Metabolism (ESPEN) guidelines that do not suggest regular consumption of lactose-free diets if no intolerance is identified.
Keywords:
Dairy
; colon microbiota
; health halo
; bifidobacteria
; Enterobacteriaceae
1. Introduction
The disaccharide lactose, the dominant carbohydrate in dairy products, is hydrolysed by lactase enzyme, which is abundant in proximal jejunum and decreases progressively towards ileum [1]. Resulting galactose and glucose are then actively transferred in the bloodstream. Lactose that is not digested arrives in the colon to be broken down into monosaccharides by gut microbiota. Absence or deficiency of lactase, commonly related to aging, can clue lactose intolerance (LI) [2,3,4]. Excess undigested lactose draws water from the veins into the gut lumen, causing loose stools or watery diarrhoea [5]. The gases produced during bacterial fermentation increase pressure in the large intestine, leading to gut symptoms including gas-emissions, bloating and several types of abdominal pains [6].
Prevention of gastrointestinal symptoms of LI is based on reduction up to elimination of lactose from diet. To enable LI people to consume milk and dairy products, which bring essential macro and micronutrients to the diet, "low lactose" or "lactose-free" (LF) products are industrially [7].
Consumption of LF products by people who are not intolerant is increasing for several reasons: i) families switch completely to LF foods although only one member is intolerant; ii) LI is often self-diagnosed [8]; iii) increasing negative attitude towards milk-derived foods coming by a perception of dangerous consequences in lactose intake [9]. “Free form” diets are in the new trend. In supermarkets, tons of products labeled “lactose-free” can be easily found. Global LF dairy market size was valued at $11.45 billion in 2021, and is predictable to reach $24.36 billion by 2031, growing at a CAGR (Compounded Average Growth Rate) of 8% from 2022 to 2031 [10]. Such value is not only due to the increasing amount of diagnosis of lactose intolerance but is also due to an increasing number of non-specific consumers.
Additional evidence showed that for the onset of eubiosis of the intestinal microbiota, a lactose-free diet is detrimental in infants [11]. Currently, in normal conditions, the benefits to the gut microbiota of consuming lactose from dairy products were defined [12,13,14], otherwise remain shady the impact of consuming LF products. In this vision, our study wants to give highlights on possible variation of the colon microbiota after ingestion of lactose free milk, identifying the possible culprits focusing on microbial species and microbial metabolites.
To study the impact of LF milk on the colon microbiota of lactose tolerant donors, we sequentially applied the protocols of INFOGEST in vitro digestion (Bradkorb, 2029) and MICODE (Multi Unit In vitro Colon Model) Gianotti et al. 2025 [16]colonic fermentation charged with human colon microbiota (HCM) from lactose tolerant adult donors, in this work. Modulations of microbiota populations and production of metabolites were assessed by means of omics and multivariate statistics. Additionally, results were compared to a previous work done on HCM of LI subjects (Casciano et al., 2022) [17].
2. Materials and Methods
2.1. Milk Samples
UHT (Ultra High Temperature) semi-skimmed milk (L) and UHT semi-skimmed lactose-free milk (LF) (Granarolo S.p.A., Bologna, Italy) were purchased at a local market. Lactose concentration in LF was < 0.1 g/L, as declared by the supplier.
2.2. Experimental Workflow
By processing milk samples through gastro-duodenal digestion using the INFOGEST protocol and then transferring the digestates to the MICODE in vitro colon model with human colon microbiota (HCM) [16], we simulate human proximal colonic fermentation. This approach allowed to observe the shifts in the colon microbiota and its metabolites during fermentation, for a comprehensive way to understand how milk components are digested and fermented in the human gut.
2.3. Human Colon Microbiota
Human Colon Microbiota (HCM) was obtained from stools of two healthy donors (one male and one female) aged between 30 and 45 y, respectively. The way for selection of donors by inclusion criteria and the protocols for stool collection were previously published (Casciano et a., 2022; Diotallevi et al., 2021; Nissen et al., 2024; Oba et al, 2020) [17,18,19,20]. HCM was prepared by mixing 2 g of each stool in 36 mL of pre-reduced phosphate buffered saline (PBS) (Wang et al., 2020; Cattivelli et al., 2023) [22,23] and subsequently washed twice with PBS (6 min at 160000 x g).
2.4. In Vitro Intestinal Model
The gut model was created combining the INFOGEST method (Bradkorb et al., 2019) for oro-gastro-duodenal digestion and MICODE model (Gianotti et al., 2025; Casciano et al., 2022; Nissen et al., 2024;) [16,17,19] for colonic fermentation. Milk samples were in vitro digested in triplicate, and a blank digestion without any food was also performed. At the end of duodenal phase of vitro digestion, digestates were collected and kept at -80 °C. Triplicates of L or LF digestion were homogeneously combined and then inoculated in MICODE bioreactors, as reported previously (Casciano et al., 2022; Nissen et al., 2023; Cattivelli et al., 2023) [17,21,23]. 24 hours proximal colonic fermentations were carried out in separate vessels, following published protocols (Casciano et al., 2022; Day-Walsh et al., 2021) [17,24]. Full procedure is described in Nissen et al. (2024) [19]. Once exact ecological settings were obtained, three different bioreactors were added with 9 mL of HCM suspension and: i) 1 mL of digested LF; ii) 1 mL of digested L; or iii) 1 mL of blank control (BC) of digestion. Sampling was performed at the baseline (BL) and after 16 h (T1) and after 24 h, i.e. at endpoint (EP) of fermentation. The BL (i.e., the adaptation of microbiota to in vitro condition) was obtained at 2.26 ± 0.12 h, defined by the first acidification of the medium read by the integrated software Lucullus 3.1 (1 read/10 s) (Securecell AG, Urdorf, Switzerland) which also take a history of all settings during experiments. Fermentations were conducted two times using two different pools of stools. At each time point, aseptic sampling of 4 mL from the volume of each vessel was done and this volume was centrifuged at 16000 × g for 7 min to separate pellets from supernatants. The formers were used for microbiomics and the formers for metabolomics. The pellets were washed twice in O2 reduced PBS to remove stool debris and was used to extract bacterial DNA. Bacterial DNAs and supernatants for metabolite profiling were stocked at -80 °C.
2.5. Metabolomics
2.5.1. Volatilome Analysis
The profiles of volatile organic compounds (VOCs) were obtained with an Intuvo Agilent 7890A Gas Chromatograph (Agilent Technologies, Santa Clara, CA, USA) equipped with a Chrompack CP-Wax 52 CB capillary column (50 m length, 0.32 mm ID) (Chrompack, Middelburg, Netherlands). Methods for SPME–GC-MS analysis, and data processing were done following previous protocols (Casciano et al., 2022; Nissen et al., 2023) [17,21]. The name of VOCs is as reported by NIST 11 MS Library.
2.5.2. Quantification of Main Microbial VOCs
The key bacterial metabolites associated to fermentation of foodstuffs were measured at the BL in mg/kg by SPME GC-MS, employing a standard and specific cutoffs (LOQ = 0.03 mg/kg and LOD = 0.01 mg/kg) (Casciano et al., 2022) [17]. The values from T1 and EP time points were assessed in respect to BL values as changes. Data were calculated in this order; i) normalization of the dataset of each single VOC by the mean centering method; ii) subtraction of the values of BL dataset to the values of dataset of fermentation time points; iii) generation of ANOVA models; iv) each VOC is compared between samples by Tukey’s post-hoc analysis; v) representation by box-plots.
2.6. Microbiomics
2.6.1. Metataxonomy
DNA samples were extracted using Purelink Microbiome DNA Purification Kit (Invitrogen, Thermo Fisher Scientific, Carlsbad, CA, USA). DNA samples of BL and EP were used for metataxonomy analysis by 16S rRNA MiSeq sequencing (Illumina Inc, San Diego, CA, USA). Microbiota diversity was got by library building and sequencing of 16S r-RNA gene. Libraries were obtained in a MiSeq (Illumina Inc, USA) in paired end with 300-bp read length (Marino et al., 2018) [25]. Sequences were examined using QIIME 2.0 (Boylen et al., 2019) [26]. Sequencing was commissioned to IGA Technology Service Srl (Udine, Italy).
2.6.2. Quantitation of Bacterial Groups by qPCR
The shifts in quantity, expressed as Log2(F/C) (Love et al., 2014; Hill et al., 2017) [27,28], were evaluated by qPCR and SYBR Green I chemistry (Modesto et al., 2011; Tanner et al., 2014; Tsitko et al., 2019) [29,30,31] for the following bacterial taxa: Eubacteria, Firmicutes, Bacteroidetes, Lactobacillales, Bifidobacteriaceae, and Enterobacteriaceae (Nissen et al., 2023) [21].
2.7. Data Mining and Statistics
Datasets for metabolomics were processed for normality and homoscedasticity (Granato et al., 2014) one-way ANOVA (p < 0.05), Principal Component Analysis (PCA) and multivariate ANOVA (MANOVA). Datasets for microbiomics were processed to obtain alpha bio-diversities from BIOME files of MiSeq analyses and beta bio-diversities as PCoA (Principal Coordinate of Analysis) using EMPeror tool (Vázquez-Baeza et al., 2013) from QIIME 2. The dataset for metataxonomy was processed for ANOVA for group comparison (BL/EPs), significant variables (p < 0.05) were picked to calculate the shifts in abundance as Log2(F/C) and post hoc Tukey HSD test (p < 0.05) was applied. Multiple List Comparator tool (https://molbiotools.com, last accessed on 27/06/2025) served to generate pair wise intersection maps and Venn diagram. Log2(F/C) results of species level were visualized with Volcano plots, using VolcanosR (Goedhart and Luijsterburg, 2020) [34]. The dataset from qPCR values was computed for MANOVA and Tukey’s post hoc test. Shifts of qPCR values are presented as Log2(F/C) and prepared with BoxPlotR (Spitzer et al., 2014) [35]. Normalization of datasets was done with mean centering method. Statistics and graphics were made with Statistica v.8.0 (Tibco, Palo Alto, CA, USA).
3. Results
3.1. Metabolomics
3.1.1. Volatilome Analysis
From the 18 duplicated profiles of SPME GC-MS, 80 molecules with at least 70% of similarity were identified with NIST 11 MSMS library (NIST, USA) (Figure 1A). A PCA of 11 organic acids easily discriminated samples based on colonic fermentation time and sample type (Figure 1B). Butanoic acid was the main descriptor of gut fermented LF (approximately 35.80% of production) (Table S2). At EP Pentanoic acid and Propanoic acid, 2-methyl were the main descriptors of L (approx. 52.02% and 65.48% of production, respectively) (Table S3). Benzoic acid, methyl ester and Octanoic acid were produced after L fermentation only. Production of alcohols depended on fermentation time, and discriminated BC from two food matrices, which however were not discriminated between each other at any time (Figure 1C). The main descriptors of L were 2-Octen-1-ol, (E) and 1-Propanol (62.75% and 48.33% of production, respectively), while LF was described by 3-Buten-1-ol, 3-methyl-, Benzyl Alcohol, Phenethyl Alcohol and Phenol, 4-methyl (66.9% 42.82%, 51.20% and 33.23% of production, respectively) (Table S2). All these molecules except 1-Propanol and Phenol, 4-methyl were not present at BL (Table S3). A PCA of 11 other VOCs discriminated against samples based on fermentation time rather than matrix (Figure 1D). L was described by Dimethyl trisulfide (67.69%), while LF by Indole (about 38.46%) (Table S2), which was in a physiological concentration (12.29%) at BL and increased throughout fermentation (33.18% and 54.53% at T1 and EP, respectively) (Table S3).
T
3.1.2. Short Chain Fatty Acids
Due to reported positive health effects (Vitellio et al., 2019; Vipperla and O’Keefe, 2012; Tain et al., 2021; Xiong et al., 2022) [36,37,38,39], short chain fatty acids (SCFA) were quantified at BL, T1 and EP (Table S4). Normalized values showed that Acetic acid was significantly produced by L fermentation (p < 0.05) (Figure 2A), shifting the SCFAs ratio to 64:20:16 (Acetic:Propanoic:Butanoic acids), which is close to the optimum ratio 60:20:20, that is considered an indicator of microbiota eubiosis (Xu et al., 2020) [40]. In contrast, LF caused an unbalance in SCFAs production leading approximately to a 31:23:47 SCFAs ratio.
3.1.3. Indoles and Phenols
We selected as key detrimental VOCs; Indole, 1H-indole and 3-methyl (skatole), the main dead-end products by intestinal bacteria (Ma et al., 2021) [41], and Phenol, 4-methyl (p-cresol), which can origin DNA methylation and modify the cell cycle by reducing colonocyte proliferation (Diether and Willing, 2019) [42]. The three detrimental VOCS were quantified at BL, T1 and EP (Table S5). Normalized values evidenced that fermentation of LF increased Indole production, which was reduced after L fermentation (LF vs L = p < 0.05) (Figure 2B).
3.2. Microbiomics
3.2.1. Ecological Biodiversity of Colonic Fermentations
Microbiota diversity indices were affected by both L and LF milk, which perturbated colonic microbial population in terms of stability during fermentation and richness of microbiota composition (Figure 3). Alpha diversity indices included richness by Chao1 index, entropy by Shannon index and abundancy by Observed OTUs. Beta Diversity was instead measured by Bray Curtis Principal Coordinates Analysis (PCoA). Regardless of the type of milk, richness (Figure 3A) and abundancy (Figure 3B) were significantly reduced after fermentation. Entropy was reduced as well, with significant difference among milk samples (p < 0.05) (Figure 3C). About beta diversity, Bray Curtis PCoA (Figure 3D) indicated a clear time-dependent modulation effect. Furthermore, after colonic fermentations of different samples, microbiota was lodged in three different spatial areas of the graphic, demonstrating that modulation was sample-dependent.
3.2.2. Metataxonomy of Colonic Fermentations
Three different datasets relative to taxa abundance at phylum, family, and species levels were prepared. Complete R models of ANOVA of phylum, family, and species levels for MiSeq analysis are reported as supplemental materials. From the larger datasets, OTUs biologically involved in digestion of lactose and dairy products were selected as variables to narrow the discussion. In particular, 9 variables were selected for phylum level (Figure 4a, Table S6), 21 for family level (Figure 4b, Table S7), and 25 for species level (Figure 4C, Table S8). To identify shared taxa among beginning and end of fermentations, species level was also discussed considering cut-offed variables in Venn diagram (Figure 4c, Table S9) and pair-wise intersections map (Figure 4d, S10). To obtain significances in terms of -Log10(p) for Log2 Fold Changes (Log2 (F/C)) of family and species levels for Volcano plots (Figure 4f,g and Tables S7 and S8), p values from ANOVA models were used. At phylum level (Figure 4a and Table S6), L or LF similarly reduced the abundances of Firmicutes and Bacteroidetes. Notwithstanding, LF fermentation fostered an higher abundance of Proteobacteria, a group which includes Gram negative pathogens, than L (Table S6). At family level, LF fermentation reduced the abundances of some commensal taxa, namely fibrolytic Bacteroidaceae and butyrate producers Ruminococcaceae (Figure 4b,f and Table S7). Either L or LF fermentations mildly modulated commensal Enterobacteriaceaceae. L and LF fermentations had an opposite outcome on Veillonellaceae (Figure 4F), which were fostered by LF and reduced by fermentation (Table S7).
LF and L colon fermentations did not significantly modulated lactic acid bacteria (Enterococcaceae, Lactobacillaceae, Streptococcaceae) specialized for fermentation of dairy sugars. Notably, bifidogenic activity (Bifidobacteriaceae to Enterobacteriaceae ratio) had this trend; BL (2.42) > L (0.24) > LF (0.08) > BC (0.04) (Table S7). At the end of fermentation, L shared most of taxa found at BL and showed a slightly higher number of exclusive taxa than LF (Figure 4c,d). Among exclusive taxa (Table S9), L was characterized by two important butyrate producers, Ruminococcus and Faecalibacterium, and LF by Bacteroides fragilis. At species level (Figure 5e,g and Table S8), LF fermentation significantly increased the abundance of Escherichia spp. in a larger extent than L fermentation. In terms of beneficial taxa, L fostered Bifidobacterium bifidum, probably due to its beta-galactosidase activity.
3.2.3. Enumeration of Selected Bacterial Targets
The shifts observed during fermentation time are reported as Log2(F/C) values, where F/C is the ratio time point/baseline (Figure 5). Bacterial enumeration at the BL, values of single time points, and statistics related to shifts are reported in Table S11. Either L and LF fermentations decreased the abundances at BL of Eubacteria (2.24E+09 ± 7.00E+07 cells/mL), Firmicutes (2.04E+09 ± 1.57E+07 cells/mL) and Bacteroidetes (1.47E+08 ± 1.00E+07 cells/mL) but with higher significance for LF fermentation (with p < 0.05 for Bacteroidetes). As for beneficial bacteria, an opposite trend was observed. LF fermentation decreased, and L fermentation increased the abundances at BL of Lactobacillales (7.86E+04 ± 4.74E+03 cells/mL) and Bifidobacteriaceae (6.15E+05 ± 1.64E+04 cells/mL) (Figure 5). Considering opportunistic taxa, LF fermentation increased the abundance of Enterobacteriaceae at BL (2.38E+05 ± 7.60E+03 cells/mL) 3.5 times more than L fermentation (p < 0.05).
4. Discussion
Lactose, a specific component of mammal milk, does not endure entire metabolism and absorption in the jejunum, and a part of dietary lactose might reach the large intestine (Bond, 1976) [43], where it impacts the composition and metabolome of gut microbiota (Forsgard, 2019; Starz et al., 2021) [1,44]. Previous researches have indicated a positive correlation of lactose consumption to the abundance of Bifidobacterium and Lactobacillus in adult (Kurilshikov et al., 2021) and infant (Van den Abbeele et al., 2021) [46] faecal samples. Exclusion of lactose from diet of intolerant subjects is mandatory, but the consequences it can have on microbiota in tolerant subjects are often not considered. To further clarify this aspect, in the present in vitro study the effects on microbiota of tolerant subjects of LF milk were evaluated and compared to control, lactose-containing milk (L).
Our results demonstrated that LF and L milk differently modulate colonic microbiota of lactose-tolerant subjects, and several microbiological indicators suggested that LF milk increases risk of dysbiosis in these subjects. First, although colonic fermentation of both milks caused a reduction of alpha biodiversity related to entropy of microbiota, this reduction was greater after LF fermentation. Second, LF fermentation decreased acetate and butyrate production in concomitance with reduction of beneficial Bifidobacteriaceae and Lactobacillales. Third, LF fermentation featured higher level of Indole in concomitance with overrepresentation of Escherichia spp., resembling an harmful scenario for the host. In fact, Indole is an insult for the mucosa and is generated as a tryptophan catabolist by many species in the Escherichia genus, including pathobionts (Li et al., 2021) [47]. Last, LF fermentation induced overrepresentation of Veillonellaceae, a pro-inflammatory family (Bonder et al., 2016) and exclusive growth of Bacteroides fragilis and Fusobacterium gonidiaformans, two possible pathobionts (Valguarnera and Wardenburg, 2020; Centor et al., 2022) [49,50].
On contrary, L fermentation generated positive outputs. In fact, it determined a reduction in Firmicutes and an increase in Lactobacillales, indicating selective effects, as the inhibition of opportunistic populations and fosterage of beneficial Lactobacillales. Also, L fermentation got to an overrepresentation of beneficial Bifidobacteriaceae and Bifidobacterium bifidum, which is consistent with higher production of health-related SCFAs and medium chain fatty acids (MCFAs), in particular Acetic acid and Octanoic acid. Alike our results, other researchers (Vitellio et al, 2019) in a similar in vitro model have demonstrated that Bifidobacterium spp. is associated to high levels of Acetic acid and Propanoic acid, 2-methyl, while Lactobacillus and Enterococcus spp. are associated with Octanoic acid (Tennoune et al., 2022) [51]. These compounds are generally attributed to dairy products fermentation and in particular to lactose degradation by lactic acid bacteria (Tennoune et al., 2022) [51]. Our results confirmed that normal microbiota is more prone to dysbiosis when lactose is not present in milk. When the results of the present work are compared to those previously obtained in MICODE with colon microbiota from lactose intolerant subjects (Casciano et al., 2022) [17], some differences can be observed (Table 1). LF fermentation by colonic microbiota of LI subjects showed beneficial effects such as the increase in positive metabolites, reduction of some detrimental VOCs, and decrease in Peptostreptococcaceae. Oppositely, LF fermentation by microbiota of normal subjects increased Indole production and the abundance of harmful Peptostreptococcaceae.
5. Conclusions
The consumption of foods with the “free from” attribute is constantly increasing (lactose-free, gluten-free, etc.) although is not recommended for healthy individuals (Sundar and Kardes, 2015) [52]. These foods are tailored for specific consumers and their formulations and processing are different from normal products. Erroneously, the "free-from" symbols influence consumers' perceptions of food products and the absence of an ingredient is believed as a sign of improved healthiness or quality (Castellini et al., 2023) [53]. To date the consequences of this "health halo effect" scenario are little considered and studied, even if no one has ever explicitly excluded negative consequences linked to consumption of these tailored foods by non-specific consumers.
In this study, a negative modulation of lactose-tolerant microbiota by fermentation of LF milk was reported, suggesting the functional role of the disaccharide in healthy individuals and possible concerns related to its exclusion. Our results do not consider the adaptive mechanisms that might occur during prolonged intake of LF milk in normal subjects. In intolerants, colonic microbes adapt to the presence of lactose in the colon lumen, sometimes exhibiting minor and less severe gastrointestinal symptoms. Adaptation could also be present in the opposite situation, and further studies are needed to evaluate this aspect and to validate our findings in vivo. The results that we obtained with L fermentation can look excessive if we consider that the INFOGEST in vitro digestion protocol does not include lactase. Subsequently in our in vitro model an higher level of lactose reached the colon than what happens in vivo. However, our intent was to give focus to the gut microbiota and not to bio-accessibility. In this vision the microbiota of normal subjects that was employed in MICODE was made by several species that naturally express lactases to loads that can easily compensate lactase absence in the INFOGEST digestion system. Considering these limits, results obtained from MICODE in vitro model could be precious to understand the effects of healthy microbiota interactions with foods tailored for skewed microbiota, so as to disprove that what is healthy for one, is healthy for all. This study brings to light that self-made diet restrictions could be harmful in those consumers who do not need them and supports European Society for Clinical Nutrition and Metabolism (ESPEN) guidelines that do not recommend routine use of lactose-free diets if no intolerance is diagnosed (Bischoff et al., 2020) [54].
Supplementary Materials
The following supporting information can be downloaded at: https://www.mdpi.com/article/doi/s1, Table S1. Primers pairs used for PCR and qPCR analyses [55,56,57,58,59] (Lane et al., 1992; Guo et al., 2008; Walter et al., 2001; Masco et al., 2004; Bartosch et al., 2004); Table S2. Fold change and baseline abundance at phylum level by Metataxonomy analysis of colonic microbiota in vitro fermentation; Table S3. Fold change and Baseline abundance at family level by Metataxonomy analysis of colonic microbiota in vitro fermentation; Table S4. Fold change and Baseline abundance at species level by Metataxonomy analysis of colonic microbiota in vitro fermentation; Table S5. Venn diagram exclusive species; Table S6. Venn diagram occurrence of species; Table S7. MANOVA categorical descriptors for volatilome, categorized for matrix; Table S8. MANOVA categorical descriptors for volatilome, categorized for time; Table S9. Baseline values of beneficial VOCs in mM; Table S10. Baseline values of detrimental VOCs in mM; Table S11. qPCR absolute quantifications and shifts over time of selected bacterial taxa.
Author Contributions
Conceptualization, L.N., A.B., and A.G.; methodology, L.N., F.C., A.B., and A.G.; software, L.N., F.C.; validation, L.N., A.B., and A.G.; formal analysis, F.C., and L.N.; investigation, F.C.; L.N., A.B., and A.G.; resources, A.B. and A.G..; data curation, F.C.; L.N., and A.G.; writing—original draft preparation, F.C. and L.N.; writing—review and editing, L.N.; F.C.; A.B., and A.G.; visualization, F.C., L.N.; supervision, L.N. A.B., and A.G.; project administration, A.B. and A.G.; funding acquisition, A.B. and A.G.
Funding
This work was financed by Italian Ministry of University and Research under National Recovery and Resilience Plan (NRRP), CUP D93C22000890001, project “ON Foods - Research and innovation network on food and nutrition Sustainability, Safety and Security – Working ON Foods” (Project code PE00000003).
Institutional Review Board Statement
The work was accomplished agreeing to Bioethics methods required at University of Bologna and was authorized by the Bioethics Committee of University of Bologna.
Informed Consent Statement
Informed consent was obtained from all donors participating in the research.
Data Availability Statement
Data other than those reported in the MS or in the Supplementary Material can be requested to the corresponding authors.
Conflicts of Interest
The authors declare no conflicts of interest.
References
- Forsgard, R.A. Lactose digestion in humans: Intestinal lactase appears to be constitutive whereas colonic microbiome is adaptable. American Journal of Clinical Nutrition 2019, 110, 273–279. [Google Scholar] [CrossRef] [PubMed]
- Campbell, A.K.; Waud, J.P.; Matthews, S.B. The molecular basis of lactose intolerance. Scientific Progress 2005, 88, 157–202. [Google Scholar] [CrossRef] [PubMed]
- Vesa, T.H.; Marteau, P.; Korpela, R. Lactose intolerance. Journal of the American College of Nutrition 2000, 19 (sup2), 165S–175S. [Google Scholar] [CrossRef] [PubMed]
- Canani, R.B.; Pezzella, V.; Amoroso, A.; Cozzolino, T.; Di Scala, C.; Passariello, A. Diagnosing and treating intolerance to carbohydrates in children. Nutrients 2016, 8, 157. [Google Scholar] [CrossRef]
- Misselwitz, B.; Butter, M.; Verbeke, K.; Fox, M.R. Update on lactose malabsorption and intolerance: pathogenesis, diagnosis and clinical management. Gut 2019, 68, 2080–2091. [Google Scholar] [CrossRef]
- Windey, K.; Houben, E.; Deroover, L.; Verbeke, K. Contribution of colonic fermentation and fecal water toxicity to pathophysiology of lactose-intolerance. Nutrients 2015, 7, 7505–7522. [Google Scholar] [CrossRef]
- Dekker, P.J.T.; Koenders, D.; Bruins, M.J. Lactose-Free Dairy Products: Market Developments, Production, Nutrition and Health Benefits. Nutrients 2019, 11, 551. [Google Scholar] [CrossRef]
- Gupta, R.S.; Warren, C.M.; Smith, B.M.; Jiang, J.; Blumenstock, J.A.; Davis, M.M.; Schleimer, R.P.; et al. Prevalence and Severity of Food Allergies Among US Adults. JAMA Netw. Open 2019, 2, e185630. [Google Scholar] [CrossRef]
- Li, X.; Yin, J.; Zhu, Y.; Wang, X.; Hu, X.; Bao, W.; Huang, Y.; et al. Effects of Whole Milk Supplementation on Gut Microbiota and Cardiometabolic Biomarkers in Subjects with and without Lactose Malabsorption. Nutrients 2018, 10, 1403. [Google Scholar] [CrossRef]
- Allied Market Research. Available online: https://www.alliedmarketresearch.com/lactose-free-dairy-market-A18453 (accessed on 9 February 2024).
- Slupsky, C.M.; He, X.; Hernell, O.; Andersson, Y.; Rudolph, C.; Lönnerdal, B.; et al. Postprandial metabolic response of breast-fed infants and infants fed lactose-free vs regular infant formula: A randomized controlled trial. Scientific Reports 2017, 7, 3640. [Google Scholar] [CrossRef]
- Abrams, S.A.; Griffin, I.J.; Davila, P.M. Calcium and zinc absorption from lactose-containing and lactose-free infant formulas. American Journal of Clinical Nutrition 2002, 76, 442–446. [Google Scholar] [CrossRef]
- Szilagyi, A. Lactose – a potential prebiotic. Aliment. Pharmacol. Ther 2002, 16, 1591–1602. [Google Scholar] [CrossRef]
- Szilagyi, A. Redefining lactose as a conditional prebiotic. Canadian Journal of Gastroenterology and Hepatology 2004, 18, 163–167. [Google Scholar] [CrossRef]
- Brodkorb, A.; Egger, L.; Alminger, M.; Alvito, P.; Assunção, R.; Ballance, S. . & Recio, I. INFOGEST static in vitro simulation of gastrointestinal food digestion. Nature protocols. 2019, 14, 991–1014. [Google Scholar]
- Gianotti, A.; Marin, V.; Cardone, G.; Bordoni, A.; Mancini, E.; Magni, M. . & Nissen, L. Personalized and precise functional assessment of innovative flatbreads toward the colon microbiota of people with metabolic syndrome: Results from an in vitro simulation. Food Research International. 2025, 209, 116197. [Google Scholar]
- Casciano, F.; Nissen, L.; Bordoni, A.; Gianotti, A. Colonic in vitro model assessment of effect of lactose-free milk on gut microbiota of lactose intolerant donors. International Journal of Food Science and Technology 2022, 58, 4485–4494. [Google Scholar] [CrossRef]
- Diotallevi, C.; Gaudioso, G.; Fava, F.; Angeli, A.; Lotti, C.; Vrhovsek, U.; Rinott, E.; et al. Measuring effect of Mankai® (Wolffia globosa) on the gut microbiota and its metabolic output using an in vitro colon model. Journal of Functional Foods 2021, 84, 104597. [Google Scholar] [CrossRef]
- Nissen, L.; Casciano, F.; Chiarello, E.; Di Nunzio, M.; Bordoni, A.; Gianotti, A. Sourdough process and spirulina-enrichment can mitigate the limitations of colon fermentation performances of gluten-free breads in non-celiac gut model. Food Chemistry 2024, 436, 137633. [Google Scholar] [CrossRef] [PubMed]
- Oba, S.; Sunagawa, T.; Tanihiro, R.; Awashima, K.; Sugiyama, H.; Odani, T.; Nakamura, Y.; et al. Prebiotic effects of yeast mannan, which selectively promotes Bacteroides thetaiotaomicron and Bacteroides ovatus in a human colonic microbiota model. Scientific Reports 2020, 10, 1–11. [Google Scholar] [CrossRef] [PubMed]
- Nissen, L.; Casciano, F.; Babini, E.; Gianotti, A. Beneficial metabolic transformations, and prebiotic potential of hemp bran and its alcalase hydrolysate, after colonic fermentation in a gut model. Scientific Reports 2023, 13, 1552. [Google Scholar] [CrossRef]
- Wang, X.; Gibson, G.R.; Sailer, M.; Theis, S.; Rastall, R.A. Prebiotics inhibit proteolysis by gut bacteria in a host diet-dependent manner: a three-stage continuous in vitro gut model experiment. Applied and Environmental Microbiology. 2020, 86, 02730–19. [Google Scholar] [CrossRef] [PubMed]
- Cattivelli, A.; Nissen, L.; Casciano, F.; Tagliazucchi, D.; Gianotti, A. Impact of cooking methods of red-skinned onion on metabolic transformation of phenolic compounds and gut microbiota. Food and Function 2023, 14, 3509–3525. [Google Scholar] [CrossRef] [PubMed]
- Day-Walsh, P.; Shehata, E.; Saha, S.; Savva, G.M.; Nemeckova, B.; Speranza, J.; Kellingray, L.; et al. The use of an in vitro batch fermentation (human colon) model for investigating mechanisms of TMA production from choline, l-carnitine, and related precursors by the human gut microbiota. European Journal of Nutrition 2021, 60, 3987–3999. [Google Scholar] [CrossRef] [PubMed]
- Marino, M.; Dubsky de Wittenau, G.; Saccà, E.; Cattonaro, F.; Spadotto, A.; Innocente, N.; et al. Metagenomic profiles of different types of Italian high-moisture Mozzarella cheese. Food Microbiology 2018, 79, 123–131. [Google Scholar] [CrossRef]
- Bolyen, E.; Rideout, J.R.; Dillon, M.R.; Bokulich, N.A.; Abnet, C.C.; Al-Ghalith, G.A.; Alexander, H.; Alm, E.J.; et al. Reproducible, interactive, scalable and extensible microbiome data science using QIIME 2. Nature Biotechnology 2019, 37, 852–857. [Google Scholar] [CrossRef]
- Love, M.I.; Huber, W.; Anders, S. Moderated estimation of fold change and dispersion for RNA-seq data with DESeq2. Genome Biology 2014, 15, 550. [Google Scholar] [CrossRef]
- Hill, C.J.; Lynch, D.B.; Murphy, K.; Ulaszewska, M.; Jeffery, I.B.; O'Shea, C.A.; Watkins, C.; et al. Evolution of gut microbiota composition from birth to 24 weeks in the INFANTMET Cohort. Microbiome 2017, 5, 4. [Google Scholar] [CrossRef]
- Modesto, M.; Stefanini, I.; D’Aimmo, M.R.; Nissen, L.; Tabanelli, D.; Mazzoni, M.; Bosi, P.; et al. Strategies to augment non-immune system based defence mechanisms against gastrointestinal diseases in pigs. NJAS - Wagening Journal of Life Science 2011, 58, 149–156. [Google Scholar] [CrossRef]
- Tanner, S.A.; Zihler Berner, A.; Rigozzi, E.; Grattepanche, F.; Chassard, C.; Lacroix, C. In vitro continuous fermentation model (PolyFermS) of the swine proximal colon for simultaneous testing on the same gut microbiota. PloS one 2014, 9, e94123. [Google Scholar] [CrossRef] [PubMed]
- Tsitko, I.; Wiik-Miettinen, F.; Mattila, O.; Rosa-Sibakov, N.; Seppänen-Laakso, T.; Maukonen, J.; Nordlund, E.; et al. A small in vitro fermentation model for screening the gut microbiota effects of different fiber preparations. International Journal of Molecular Science 2019, 20, 1925. [Google Scholar] [CrossRef]
- Granato, D.; de Araújo Calado, V.M.; Jarvis, B. Observations on the use of statistical methods in food science and technology. Food Research International 2014, 55, 137–149. [Google Scholar] [CrossRef]
- Vázquez-Baeza, Y.; Pirrung, M.; Gonzalez, A.; Knight, R. EMPeror: a tool for visualizing high-throughput microbial community data. Gigascience 2013, 2, 2047–217X. [Google Scholar] [CrossRef]
- Goedhart, J.; Luijsterburg, M.S. VolcaNoseR is a web app for creating, exploring, labeling and sharing volcano plots. Scientific Reports 2020, 10, 20560. [Google Scholar] [CrossRef]
- Spitzer, M.; Wildenhain, J.; Rappsilber, J.; Tyers, M. BoxPlotR: a web tool for generation of box plots. Nature Methods 2014, 11, 121–122. [Google Scholar] [CrossRef] [PubMed]
- Vitellio, P.; Celano, G.; Bonfrate, L.; Gobbetti, M.; Portincasa, P.; De Angelis, M. Effects of Bifidobacterium longum and Lactobacillus rhamnosus on gut microbiota in patients with lactose intolerance and persisting functional gastrointestinal symptoms: A randomised, double-Blind, cross-over study. Nutrients 2019, 11, 886. [Google Scholar] [CrossRef]
- Vipperla, K.; O’Keefe, S.J. The microbiota and its metabolites in colonic mucosal health and cancer risk. Nutrition in Clinical Practice 2012, 27, 624–635. [Google Scholar] [CrossRef]
- Tain, Y.L.; Chang, S.K.C.; Liao, J.W.; Chen, Y.W.; Huang, H.T.; Li, Y.L.; Hou, C.Y. Synthesis of short-chain-fatty-acid resveratrol esters and their antioxidant properties. Antioxidants 2021, 10, 420. [Google Scholar] [CrossRef]
- Xiong, R.G.; Zhou, D.D.; Wu, S.X.; Huang, S.Y.; Saimaiti, A.; Yang, Z.J.; Shang, A.; et al. Health benefits and side effects of short-chain fatty acids. Foods 2022, 11, 2863. [Google Scholar] [CrossRef]
- Xu, Y.; Zhu, Y.; Li, X.; Sun, B. Dynamic balancing of intestinal short-chain fatty acids: The crucial role of bacterial metabolism. Trends in Food Science and Technology 2020, 100, 118–130. [Google Scholar] [CrossRef]
- Ma, Q.; Meng, N.; Li, Y.; Wang, J. Occurrence, impacts, and microbial transformation of 3-methylindole (skole): A critical review. Journal of Hazardous Materials 2021, 416, 126181. [Google Scholar] [CrossRef]
- Diether, N.E.; Willing, B.P. Microbial fermentation of dietary protein: an important factor in diet-microbe-host interaction. Microorganisms 2019, 7, 19. [Google Scholar] [CrossRef]
- Bond, J.H. Quantitative measurement of lactose absorption. Gastroenterology 1976, 70, 1058–1062. [Google Scholar] [CrossRef] [PubMed]
- Starz, E.; Wzorek, K.; Folwarski, M.; Kazmierczak-Siedlecka, K.; Stachowska, L.; Przewlocka, K.; Stachowska, E.; et al. The Modification of the Gut Microbiota via Selected Specific Diets in Patients with Crohn’s Disease. Nutrients 2021, 13, 2125. [Google Scholar] [CrossRef]
- Kurilshikov, A.; Medina-Gomez, C.; Bacigalupe, R.; Radjabzadeh, D.; Wang, J.; Demirkan, A.; Le Roy, C.I.; et al. Large-scale association analyses identify host factors influencing human gut microbiome composition. Nature Genetics 2021, 53, 156–165. [Google Scholar] [CrossRef]
- Van den Abbeele, P.; Sprenger, N.; Ghyselinck, J.; Marsaux, B.; Marzorati, M.; Rochat, F.A. Comparison of the In vitro Effects of 2′Fucosyllactose and Lactose on the Composition and Activity of Gut Microbiota from Infants and Toddlers. Nutrients 2021, 13, 726. [Google Scholar] [CrossRef]
- Li, X.; Zhang, B.; Hu, Y.; Zhao, Y. New insights into gut-bacteria-derived indole and its derivatives in intestinal and liver diseases. Frontiers in Pharmacology 2021, 12. [Google Scholar] [CrossRef]
- Bonder, M.J.; Tigchelaar, E.F.; Cai, X.; Trynka, G.; Cenit, M.C.; Hrdlickova, B.; Zhong, H.; et al. The influence of a short-term gluten-free diet on the human gut microbiome. Genome Medicine 2016, 8, 45. [Google Scholar] [CrossRef]
- Valguarnera, E.; Wardenburg, J.B. Good gone bad: one toxin away from disease for Bacteroides fragilis. Journal of Molecular Biology 2020, 432, 765–785. [Google Scholar] [CrossRef] [PubMed]
- Centor, R.M.; Atkinson, T.P.; Xiao, L. Fusobacterium necrophorum oral infections - A need for guidance. Anaerobe 2022, 75, 102532. [Google Scholar] [CrossRef] [PubMed]
- Tennoune, N.; Andriamihaja, M.; Blachier, F. Production of Indole and Indole-Related Compounds by the Intestinal Microbiota and Consequences for the Host: The Good, the Bad, and the Ugly. Microorganisms 2022, 10, 930. [Google Scholar] [CrossRef]
- Sundar, A.; Kardes, F.R. The role of perceived variability and the health halo effect in nutritional inference and consumption. Psychology and Marketing 2015, 32, 512–521. [Google Scholar] [CrossRef]
- Castellini, G.; Savarese, M.; Graffigna, G. The role of free-from symbols on consumer perceptions of healthiness, quality and intention to buy baked food products. International Journal of Food Science and Nutrition 2023, 74, 395–402. [Google Scholar] [CrossRef]
- Bischoff, S.C.; Escher, J.; Hébuterne, X.; Kłęk, S.; Krznaric, Z.; Schneider, S.; Shamir, R.; et al. Forbes, ESPEN practical guideline: Clinical Nutrition in inflammatory bowel disease. Clinical Nutrition 2020, 39, 632–653. [Google Scholar] [CrossRef] [PubMed]
- Lane, D.J.; Harrison, Jr. A. P.; Stahl, D.; Pace, B.; Giovannoni, S.J.; Olsen, G.J.; Pace, N.R. Evolutionary relationship among sulfur- and iron-oxidizing eubacteria. Journal of Bacteriology 1992, 174, 269–278. [Google Scholar] [CrossRef] [PubMed]
- Guo, X.; Xia, X.; Tang, R.; Zhou, J.; Zhao, H.; Wang, K. Development of a real-time PCR method for Firmicutes and Bacteroidetes in faeces and its application to quantify intestinal population of obese and lean pigs. Letters in Applied Microbiology 2008, 47, 367–73. [Google Scholar] [CrossRef]
- Walter, J.; Hertel, C.; Tannock, G.W.; Lis, C.M.; Munro, K.; Hammes, W.P. Detection of Lactobacillus, Pediococcus, Leuconostoc, and Weissella species in human feces by using group-specific PCR primers and Denaturing Gradient Gel Electrophoresis. Applied and Environmental Microbiology 2001, 67, 2578–2585. [Google Scholar] [CrossRef]
- Masco, L.; Ventura, M.; Zink, R.; X Huys, J.; Swings, V. Polyphasic taxonomic analysis of Bifidobacterium animalis and Bifidobacterium lactis reveals relatedness at the subspecies level: reclassification of Bifidobacterium animalis as Bifidobacterium animalis subsp. animalis subsp. nov. and Bifidobacterium lactis as Bifidobacterium animalis subsp. lactis subsp. nov. International Journal of Systematic and. Evolutionary Microbiology 2004, 54, 1137–1143. [Google Scholar]
- Bartosch, S.; Fite, A.; Macfarlane, G.T.; McMurdo, M.E. Characterization of bacterial communities in feces from healthy elderly volunteers and hospitalized elderly patients by using real-time PCR and effects of antibiotic treatment on the fecal microbiota. Applied and Environmental Microbiology 2004, 70, 3575–3581. [Google Scholar] [CrossRef]
Figure 1.
PCA plots of the volatilome sorted by chemical classes. A) Heatmap of complete volatilome; B) Acids; B) Alcohols; C) Other VOCs. A-C) Left side diagrams are for PCAs of cases; right side diagrams are for PCAs of variables. L = Standard milk; LF = Lactose-free milk; BC = Blank control; BL = baseline; T1 = 16 h; EP = 24 h.
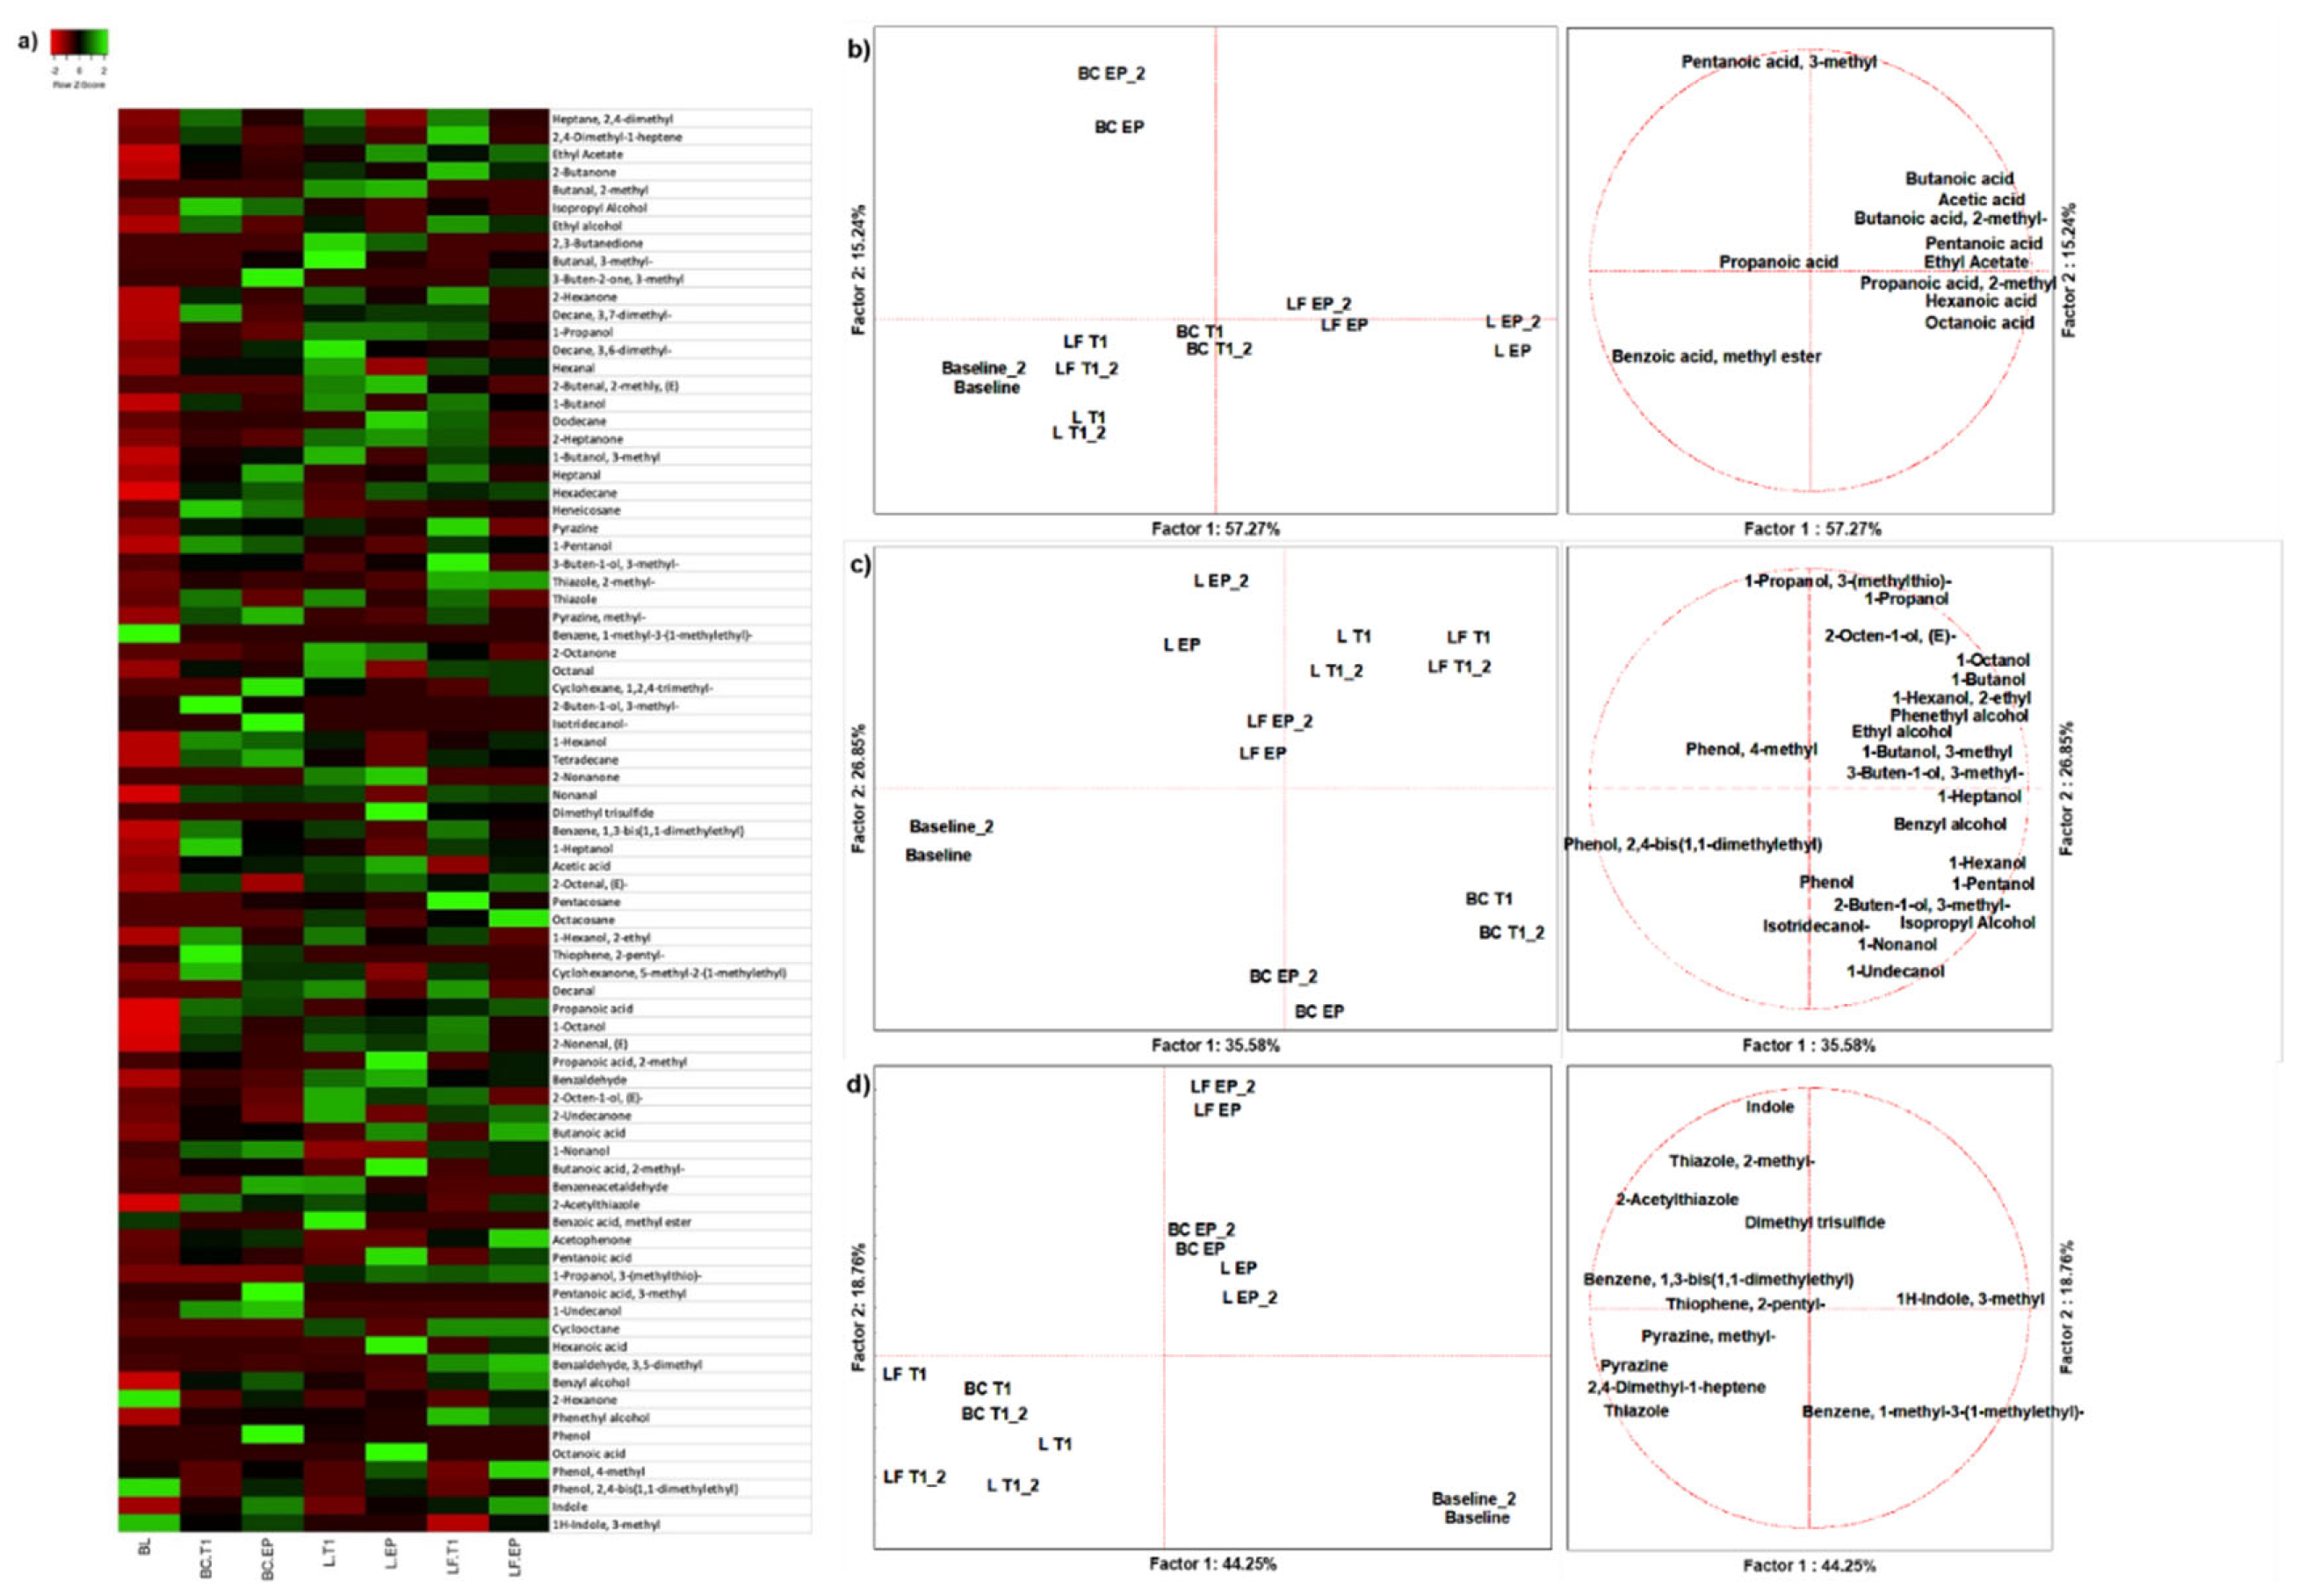
Figure 2.
Changes in abundance of A) beneficial microbial VOCs metabolites and B) detrimental microbial VOCs, expressed as normalized scale from relative abundances with respect to baseline of in vitro fermentation (red line). Box plots are including all replicas of T1 (16 h) and EP (24 h) values. Marker = mean; box = mean ± standard error; whiskers = mean ± standard deviation. Different letters among a single independent variable indicate significant difference according to MANOVA model followed by post hoc Tukey’s HSD test. ns = not significant; L = Standard milk; LF = Lactose-free milk.
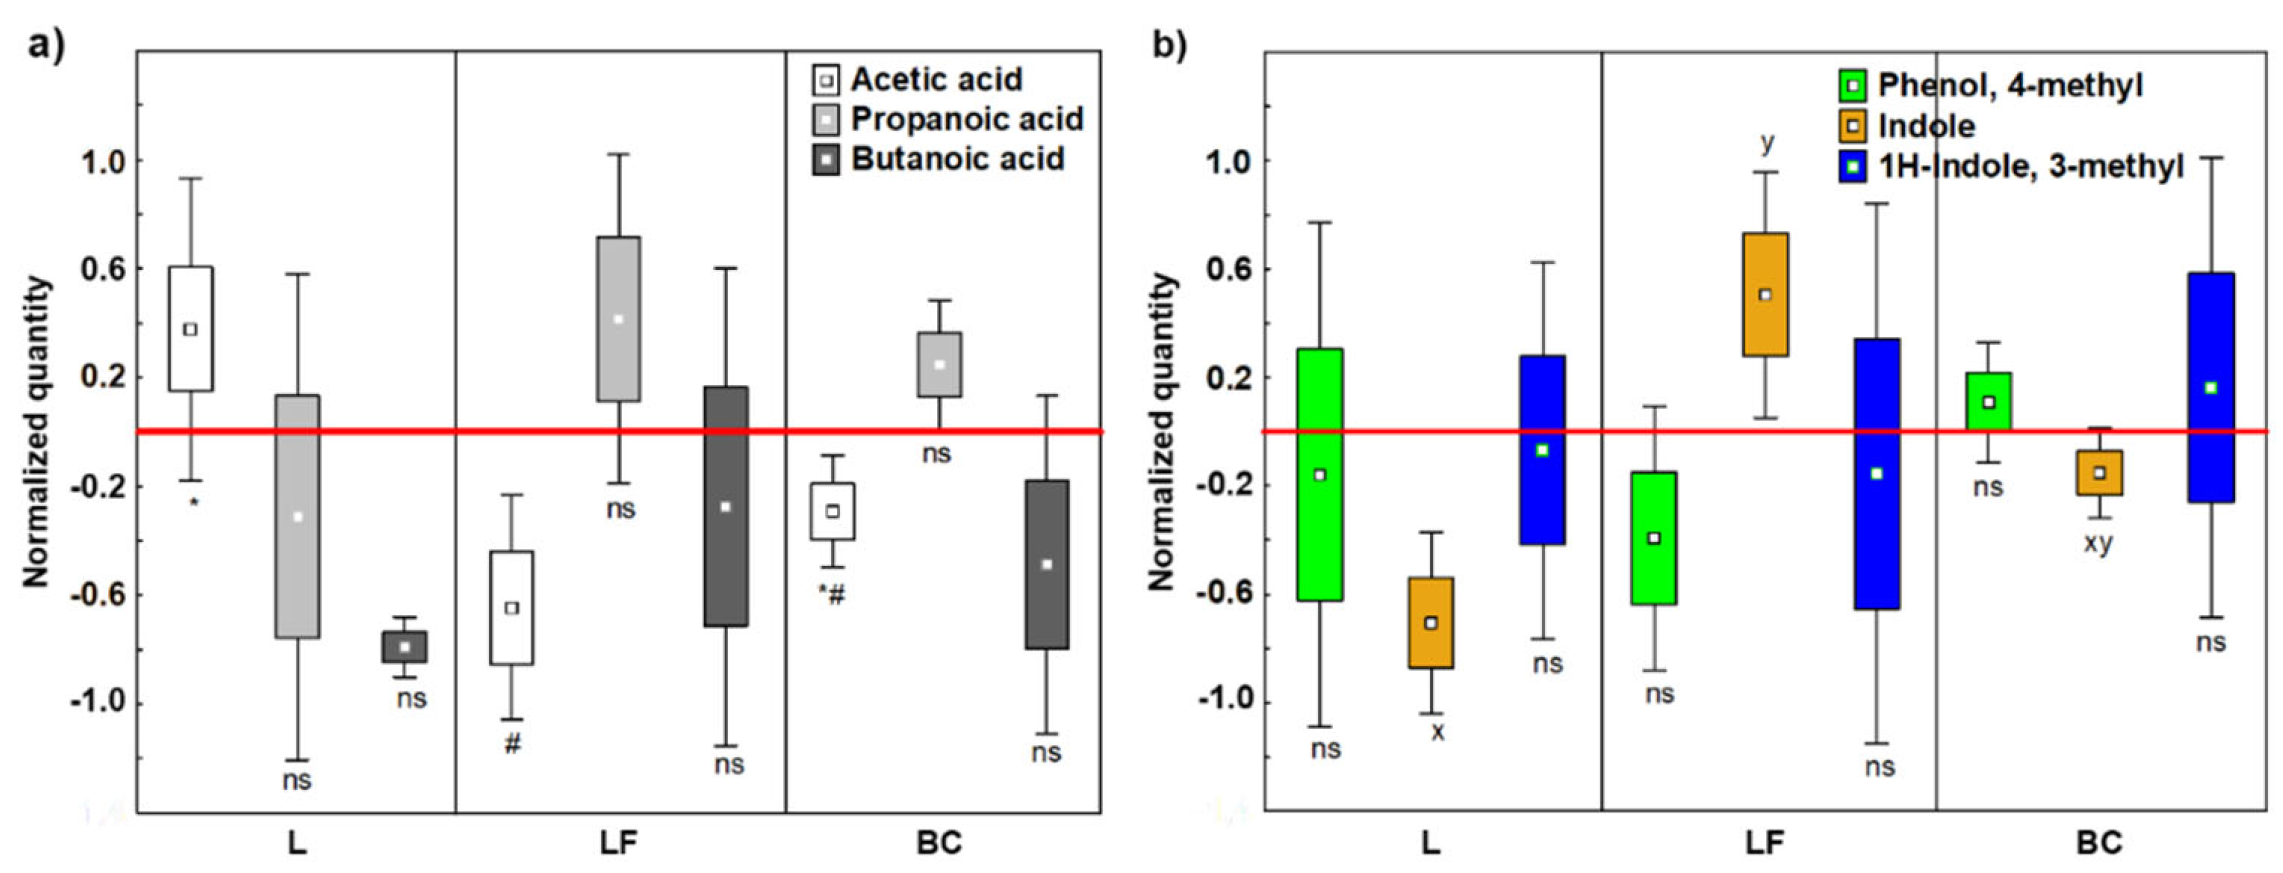
Figure 3.
Ecological diversities representing baseline (BL) and end points of colonic fermentation of human colon microbiota. Values were recorded after in vitro digestion and fermentation of different milk samples. A) Chao1 Index representing abundance; B) Observed OTUs representing richness; C) Shannon Index representing evenness; D) Bray Curtis PCoA of Beta Diversity representing differences among samples. BL = Baseline mean; L = Standard milk; LF = Lactose-free milk; BC = Blank control. Different letters indicate statistical significance. Green spheres = BL values; Blue sphere = L; Red sphere = LF; Grey sphere = BC. .
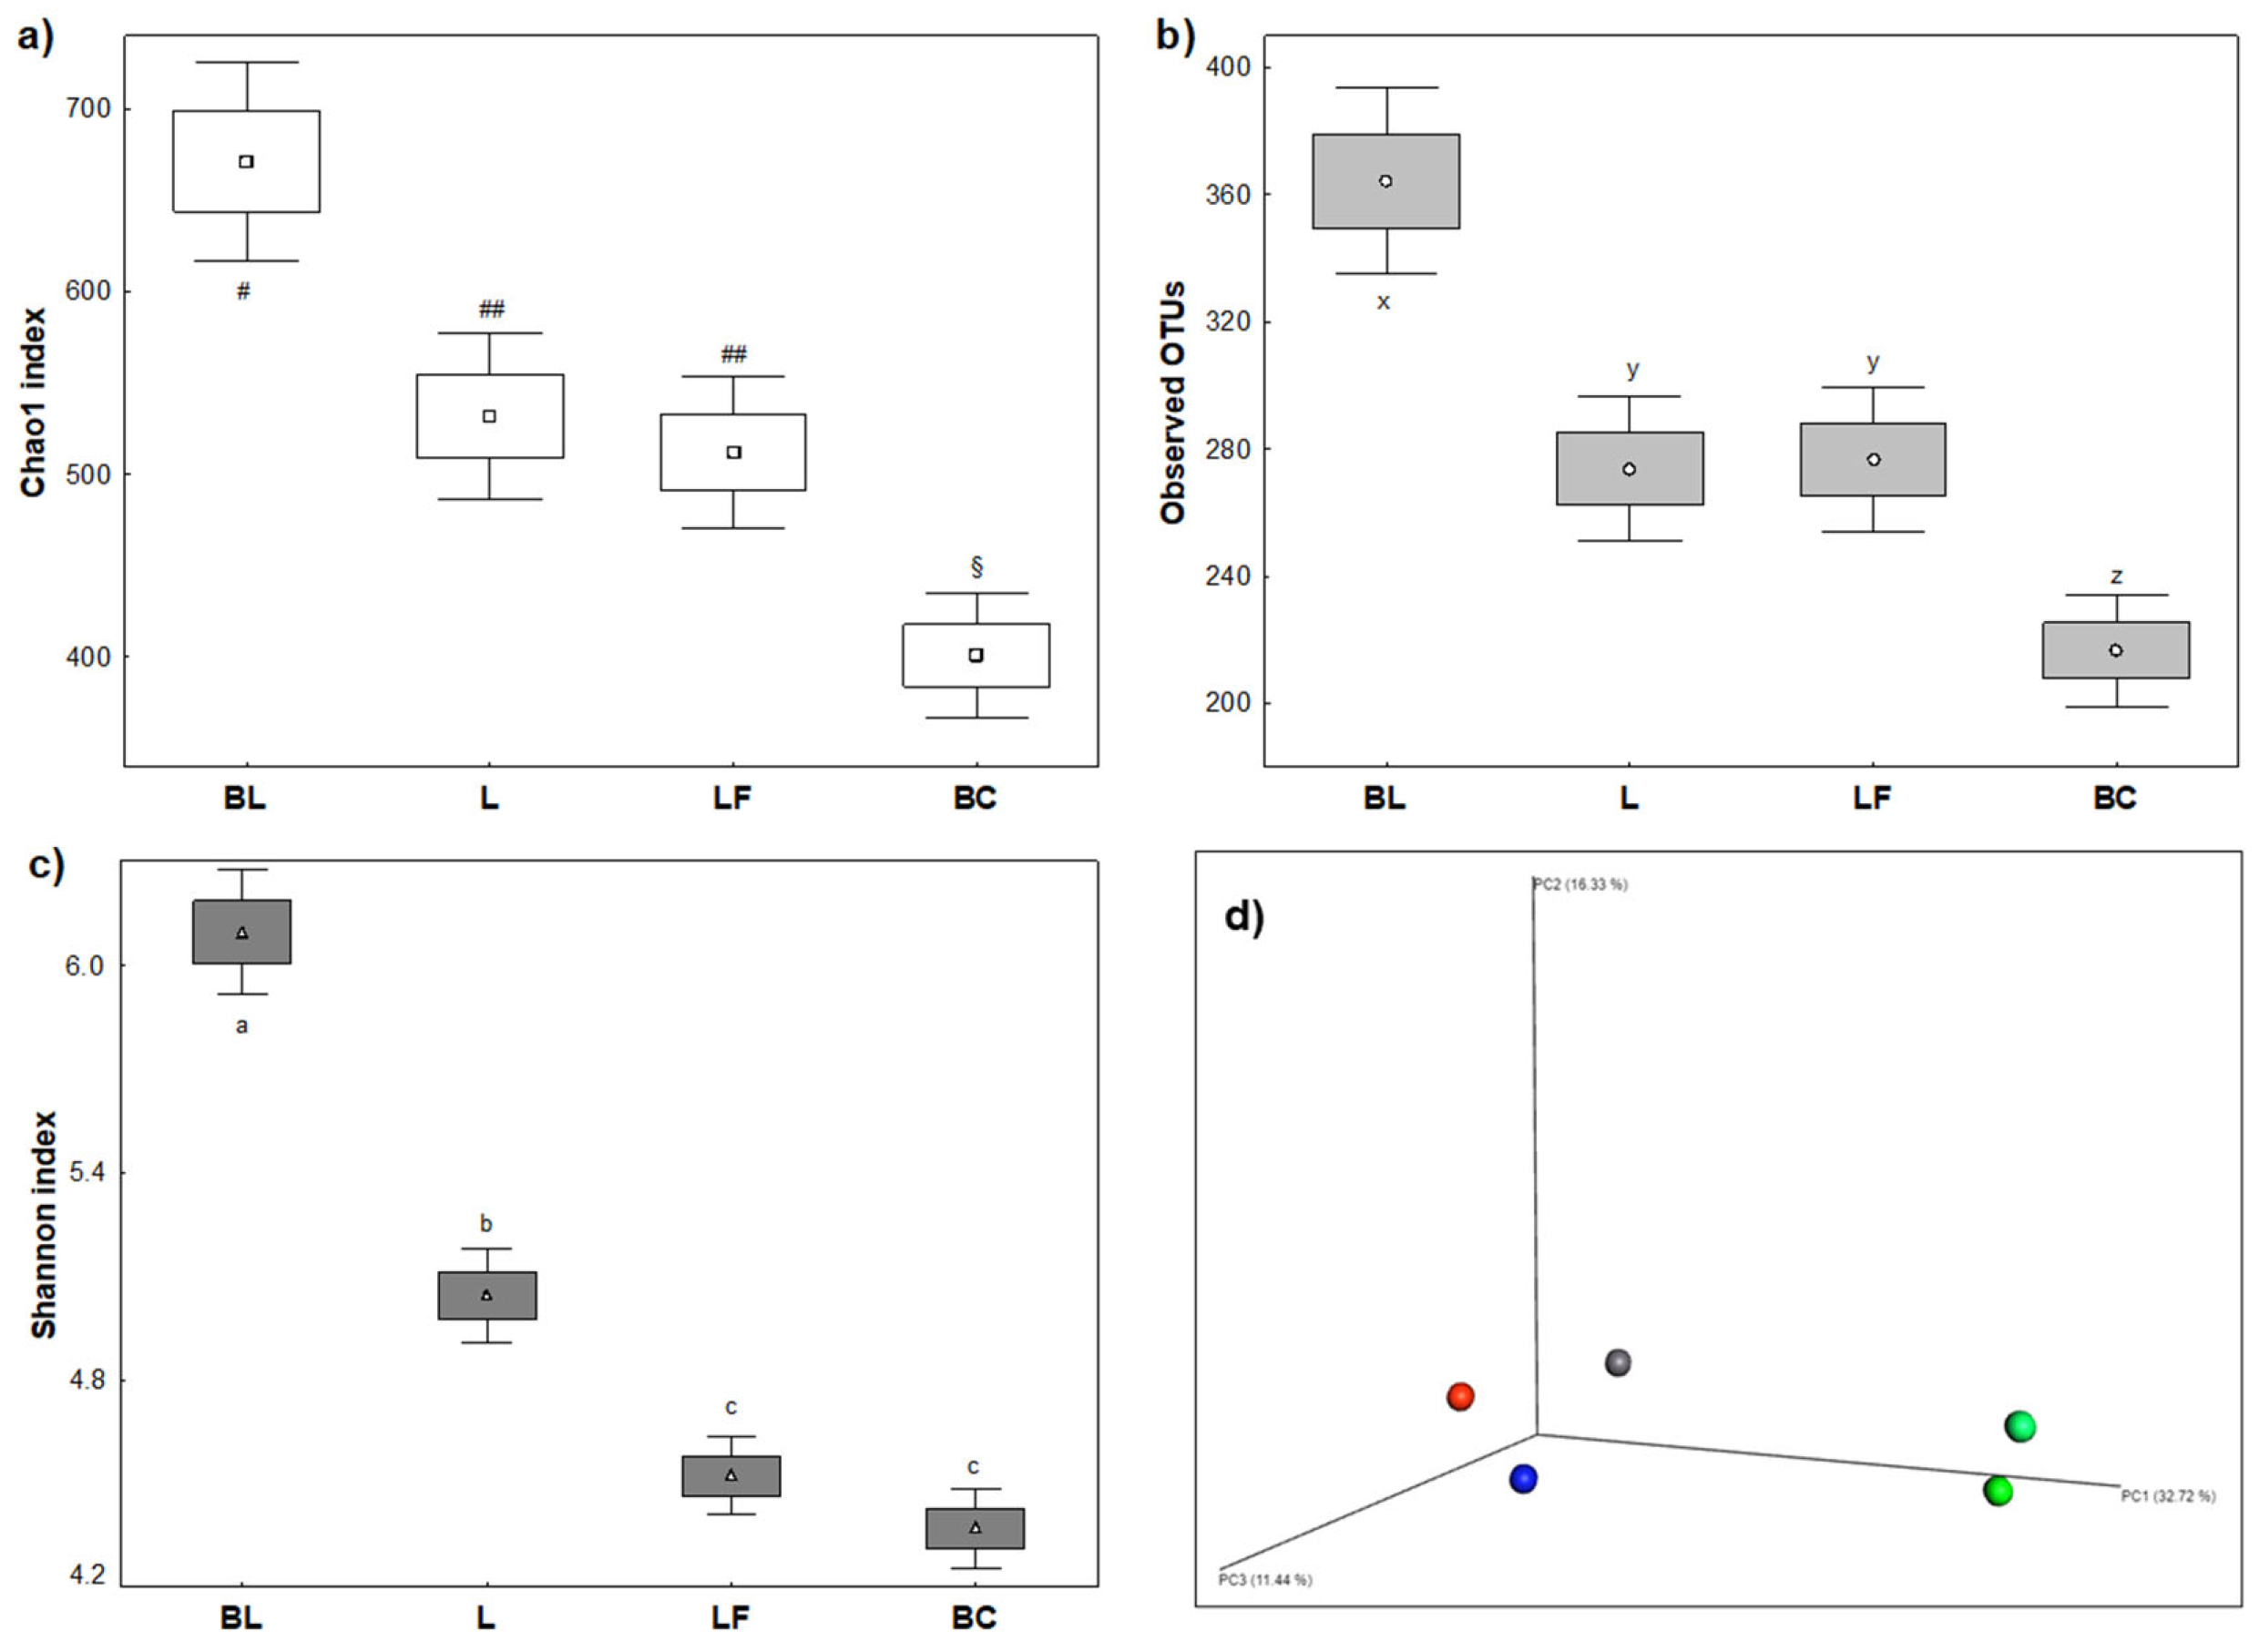
Figure 4.
Microbiota 16S-rRNA analyses of baseline (BL) and samples after colonic fermentation. A) Metataxonomy and relative abundances at phylum level; B) Metataxonomy and relative abundances at family level; C) pairwise intersection map at species level; D) Venn diagram at species level; E) Metataxonomy and relative abundances at species level of selected targets; F) Volcano plots to indicate changes in abundance at family level; G) Volcano plots to indicate changes in abundance at species level of selected taxa. Data were obtained from BIOME file of Qime 2.0. L = Standard milk; LF = Lactose-free milk; BC = Blank control; BL = Baseline.
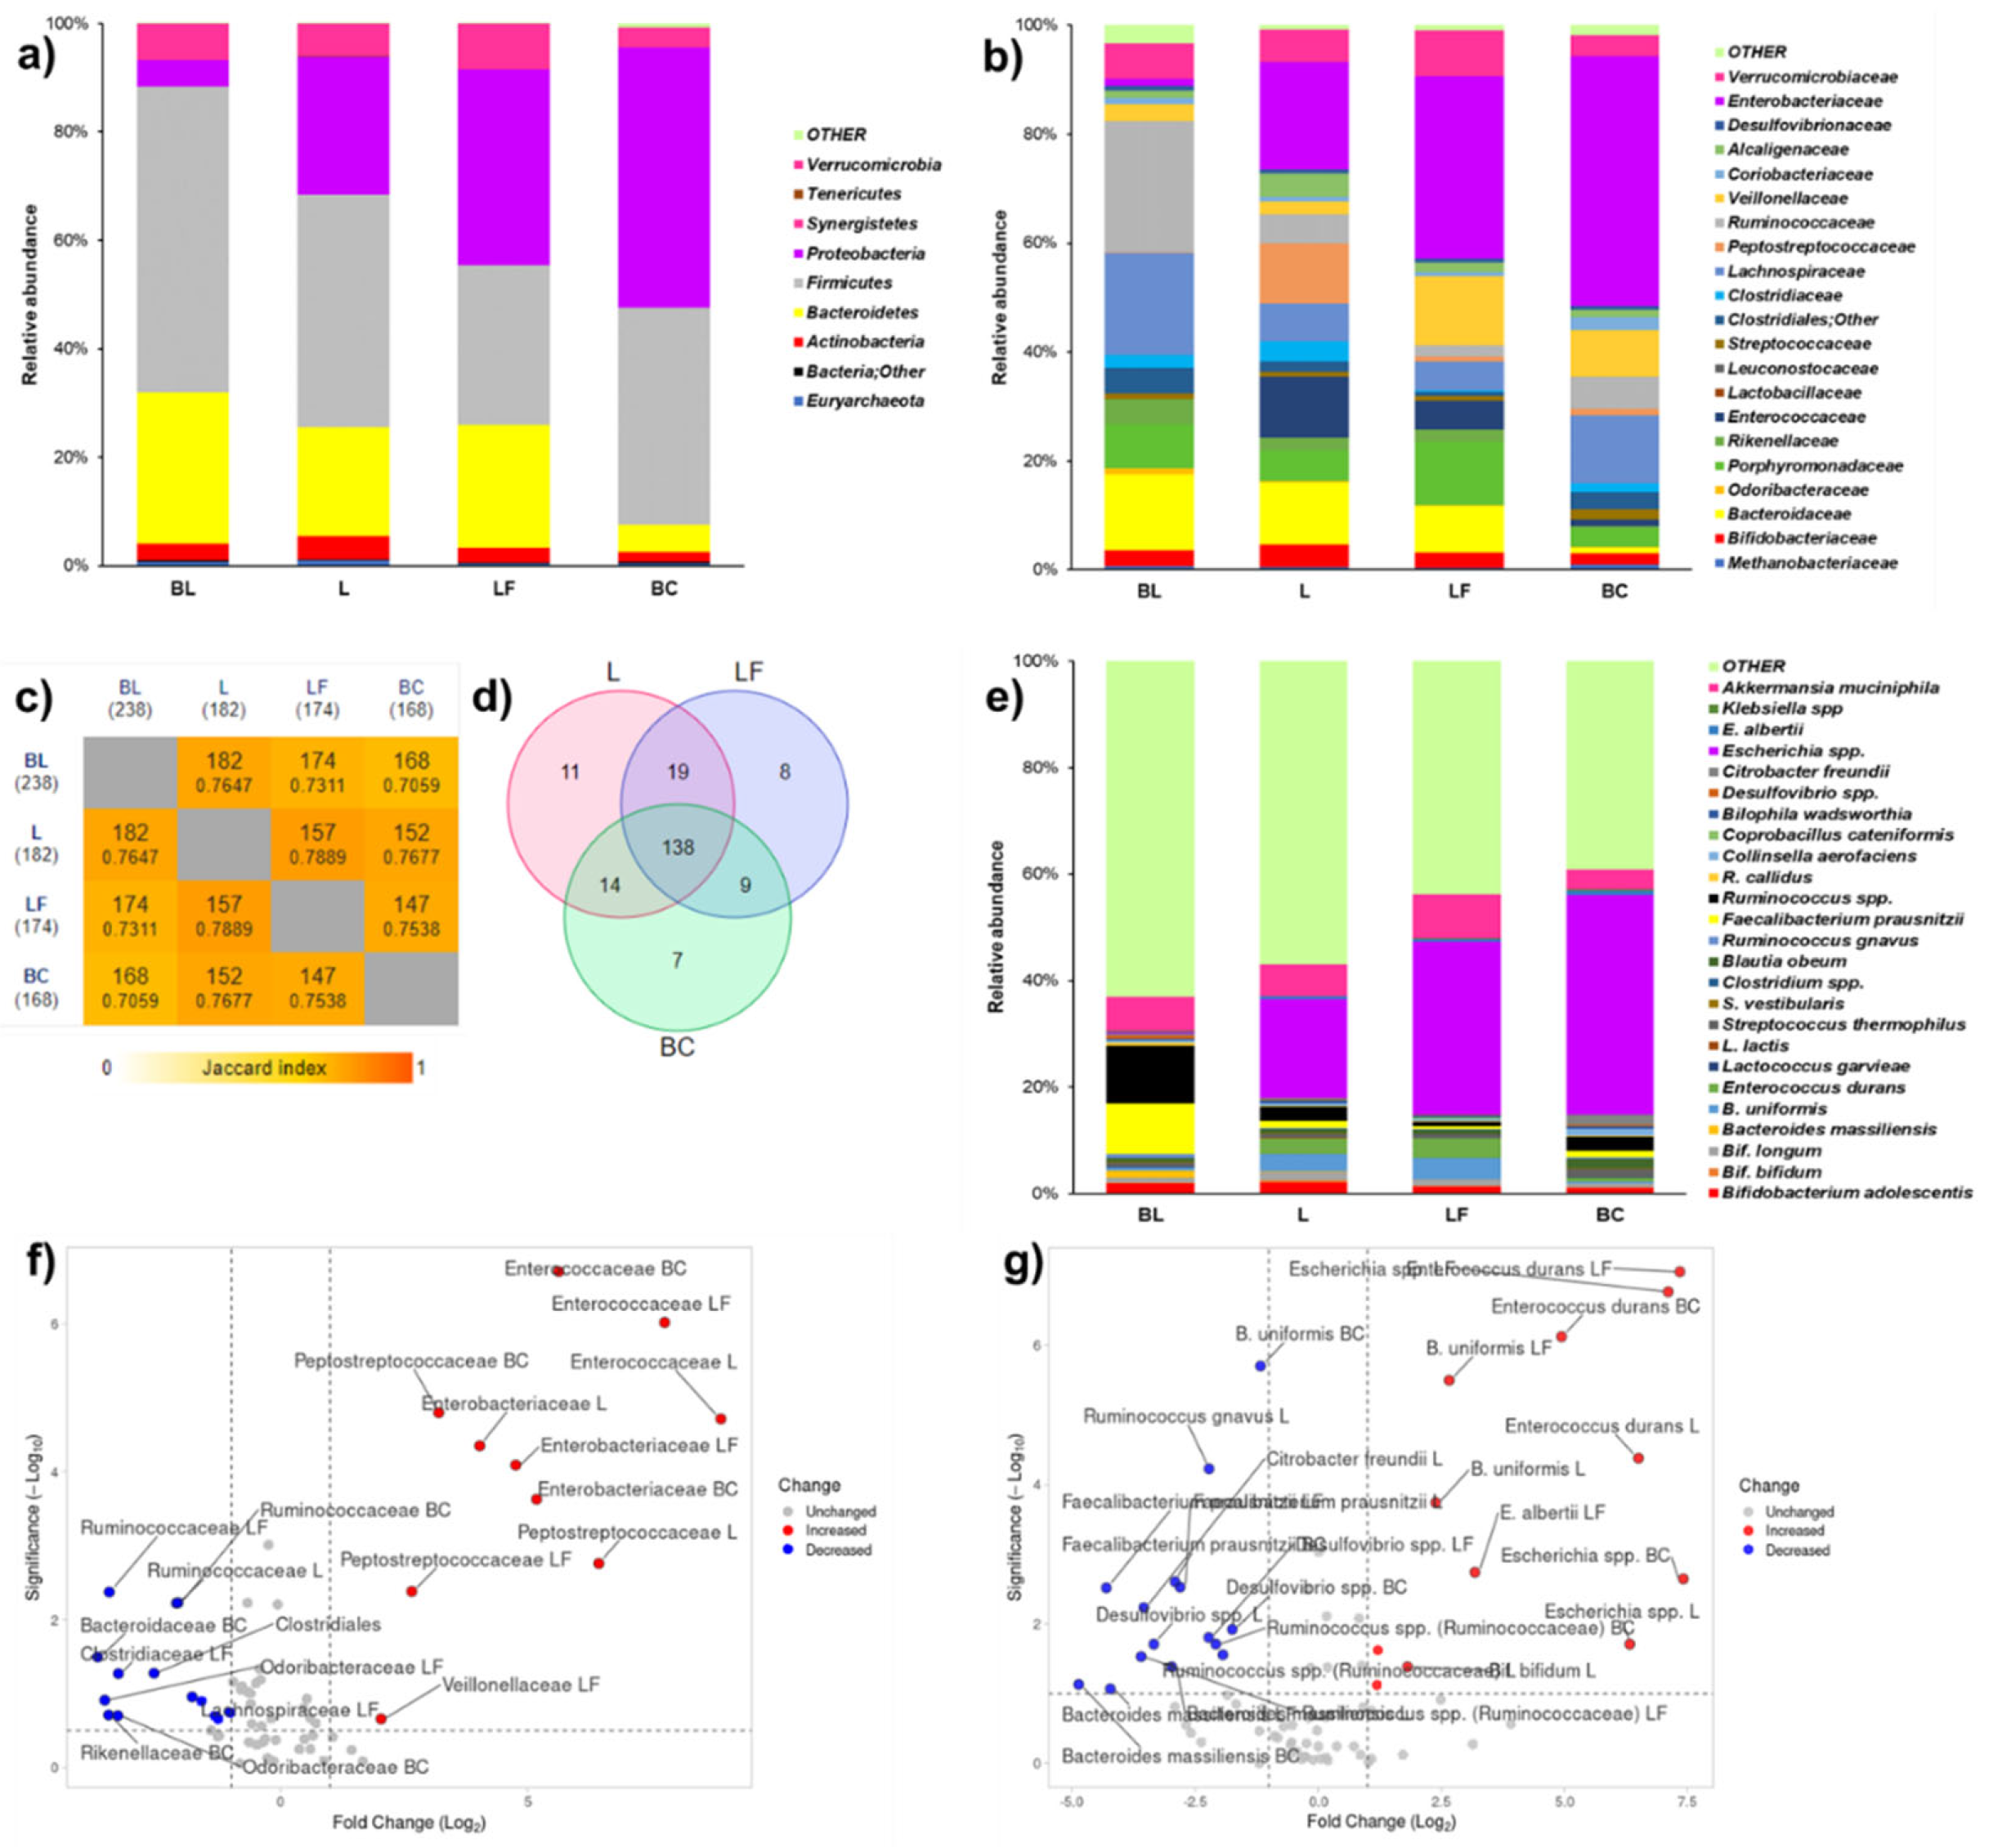
Figure 5.
Changes in respect to baseline of fermentation expressed as Log2(F/C) of core-microbiota taxa measured by qPCR, including data points of 16 h and 24 h during colonic fermentation. Baseline values of absolute abundances, values of shifts and full statistic are reported in Table S11. Green = Standard milk (L), white = Lactose-free milk (LF); blue = Blank control (BC). Results are sorted for different taxa and statistical differences is applied for each taxon. s = significant, ns = not significant by MANOVA and Tukey’s post hoc test for time effect; symbols, letters and numbers are for MANOVA Tukey’s post hoc test for matrix effect.
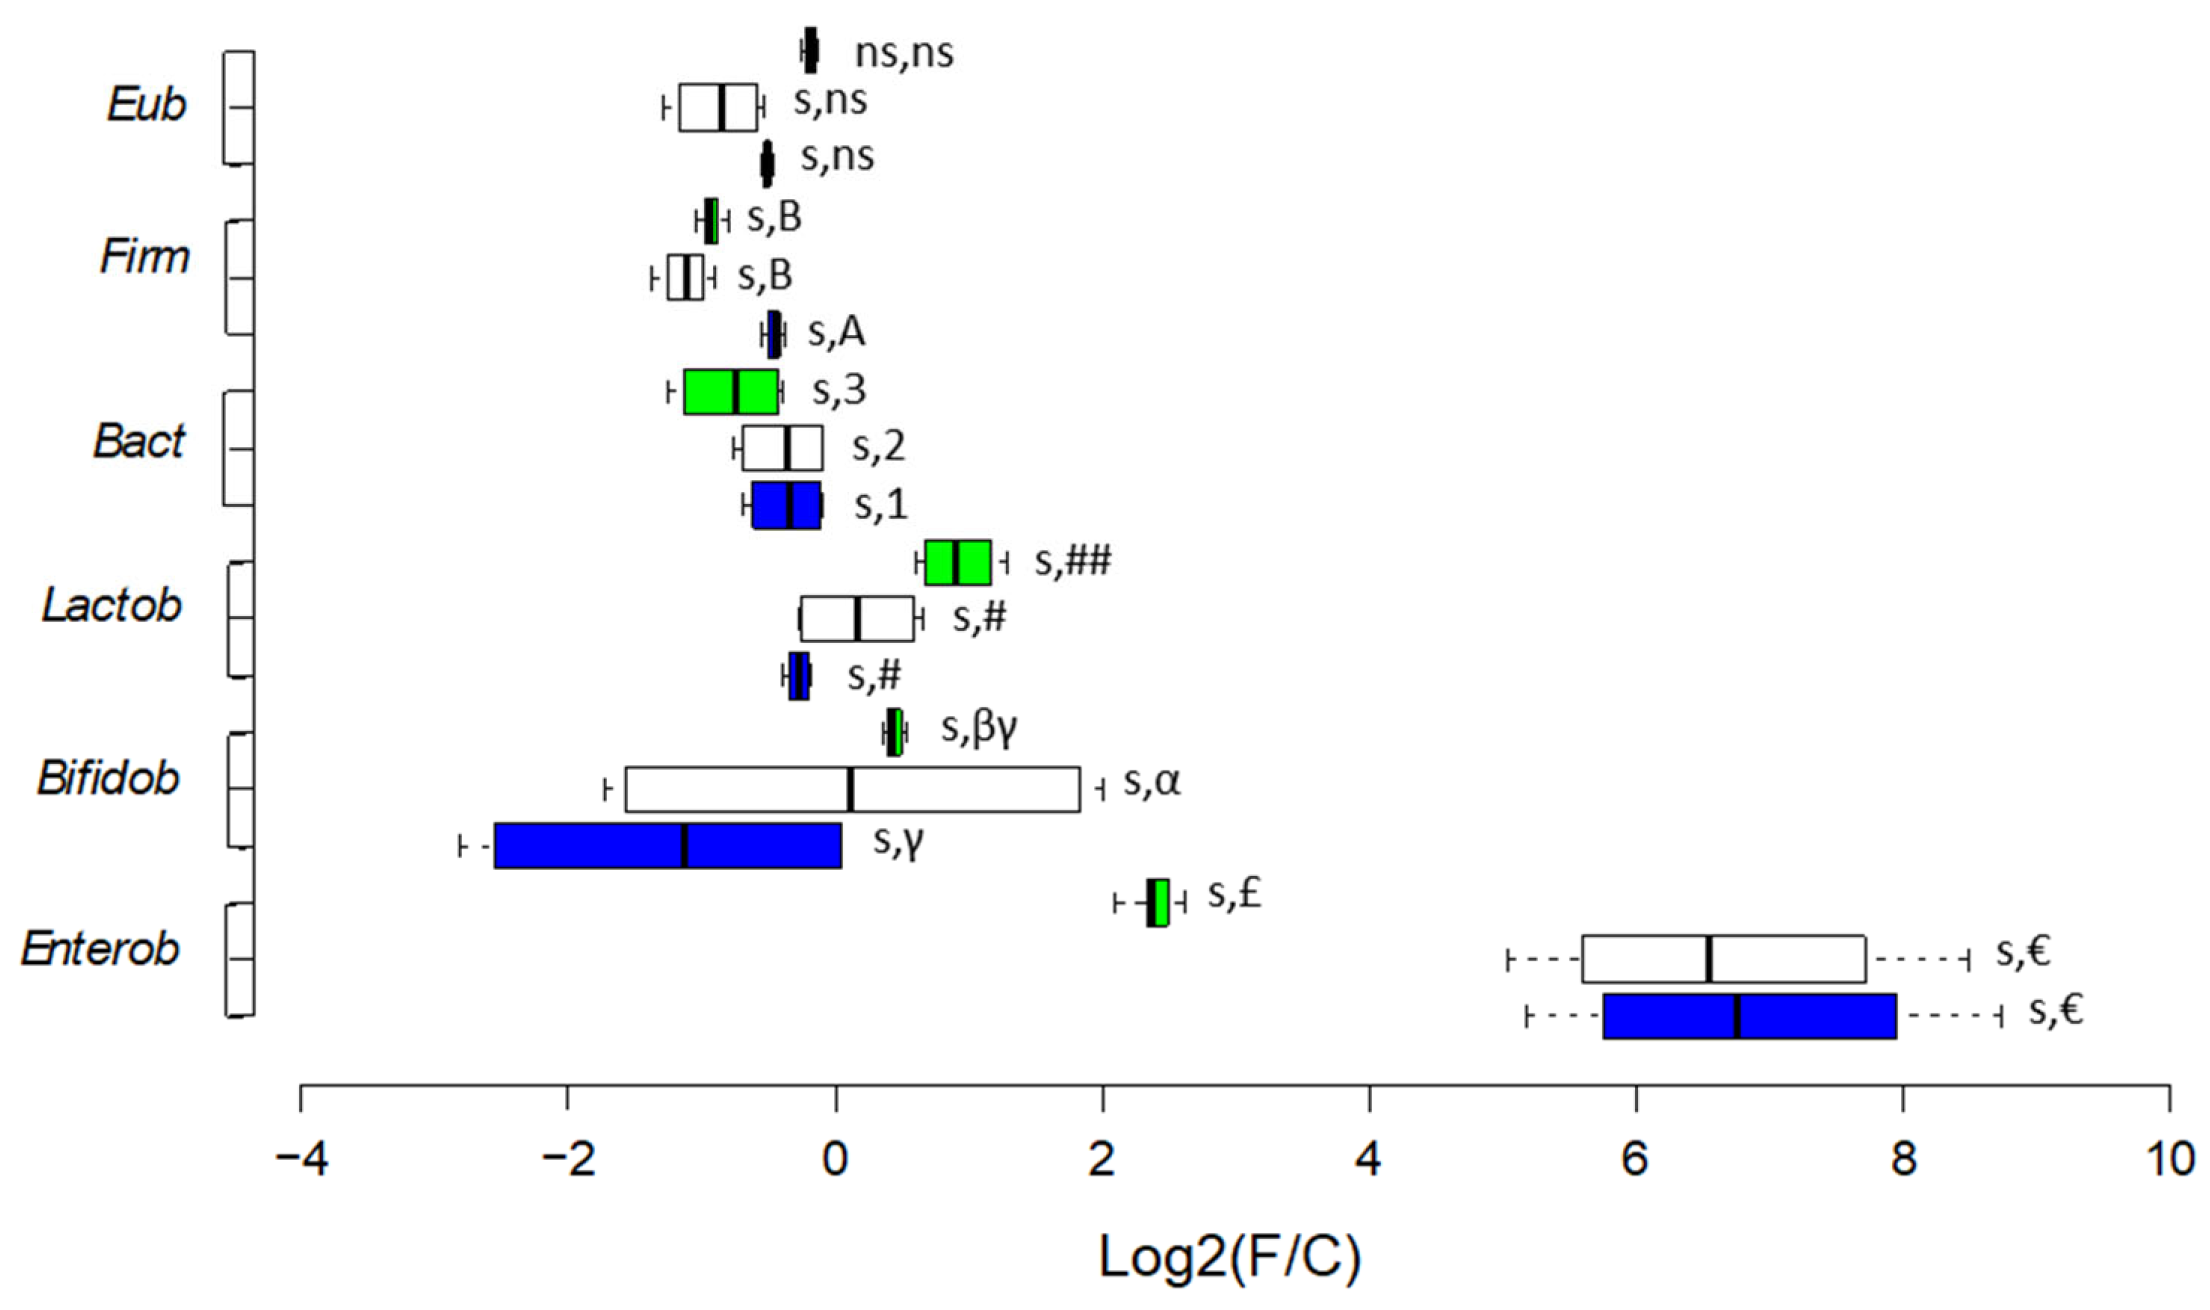

Table 1.
Main changes in human colonic microbiota after in vitro fermentation of milk.
| Outputs | Lactose tolerant | Lactose intolerant [17] | ||
| Metabolomics | UHT semi-skimmed milk (L) | UHT semi-skimmed lactose-free milk (LF) |
UHT semi- skimmed milk (L) |
UHT semi-skimmed lactose-free milk (LF) |
| Organic acids main descriptors | Pentanoic acid and Propanoic acid, 2-methyl | Butanoic acid | Pentanoic acid, Hexanoic acid, Octanoic acid | Butanoic acid |
| Alcohols main descriptors | 2-Octen-1-ol, (E) and 1-Propanol | 3-Buten-1-ol, 3-methyl-, Benzyl Alcohol, Phenethyl Alcohol and Phenol, 4-methyl | 1-Butanol, Phenol | Ethyl alcohol, 1-Octanol, 1-Hexanol, 2-ethyl |
| Other VOCs main descriptors | Dimethyl trisulfide | Thiazole, 2-methyl | 2-Hexanone | 2-Acetylthiazole |
| SCFA production | Increased Acetic acid | Unbalanced production | Increased Acetic acid | Increased Butanoic acid |
| Detrimental VOCs production | All decreased | Increased Indole | Increased p-cresol | All decreased |
| Outputs | Lactose tolerant | Lactose intolerant* | ||
| Microbiomics | UHT semi-skimmed milk (L) | UHT semi-skimmed lactose-free milk (LF) |
UHT semi- skimmed milk (L) |
UHT semi-skimmed lactose-free milk (LF) |
| Metataxonomy (16S-rRNA) |
Increased Bifidobacterium bifidum | Decreased Ruminococcaceae; increased Veillonellaceae and Peptostreptococcaceae |
Increased Klebsiella spp.; decreaed Faecalibacterium prausnitsii, Roseburia faecis. | Unchanged Verrucomicrobia phylum; decreased Peptostreptococcaceae. |
| Selected bacterial taxa (qPCR) |
Increased Lactobacillales and Bifidobacteriaceae | Decreased Lactobacillales and Bifidobacteriaceae | Increased Lactobacillales and Enterobacteriaceae | Decreased Bacteroidetes and Lactobacillales; increased Enterobacteriaceae. |
Disclaimer/Publisher’s Note: The statements, opinions and data contained in all publications are solely those of the individual author(s) and contributor(s) and not of MDPI and/or the editor(s). MDPI and/or the editor(s) disclaim responsibility for any injury to people or property resulting from any ideas, methods, instructions or products referred to in the content. |
© 2025 by the authors. Licensee MDPI, Basel, Switzerland. This article is an open access article distributed under the terms and conditions of the Creative Commons Attribution (CC BY) license (http://creativecommons.org/licenses/by/4.0/).
Copyright: This open access article is published under a Creative Commons CC BY 4.0 license, which permit the free download, distribution, and reuse, provided that the author and preprint are cited in any reuse.


