
Submitted:
23 July 2025
Posted:
25 July 2025
You are already at the latest version
Abstract
Background/Objectives: The timely identification of renal malignancies, particularly the accurate categorization of neoplastic subtypes, poses significant diagnostic challenges. Traditional techniques such as manual diagnosis and histopathological analysis are re-source-intensive, prone to inter-observer variability, and often lack scalability. Although recent deep learning (DL) approaches have demonstrated promising performance in kidney tumor classification, they still face critical limitations including poor interpreta-bility (“black-box” behavior), reduced generalization across heterogeneous cohorts, and computational inefficiency that hinders real-time clinical deployment. In response to these persistent challenges, we propose the M16+ model—an enhanced, VGG16-based deep learning architecture optimized to improve diagnostic accuracy, interpretability, and deployment feasibility in renal oncology workflows. Methods: The M16+ model consists of a pre-trained VGG16 convolutional backbone for robust feature extraction, followed by a custom classifier comprising batch-normalized dense layers and dropout regularization to reduce overfitting. The model was trained on a class-balanced cohort of 4,200 contrast-enhanced axial CT slices (2,100 benign, 2,100 malignant) obtained from 120 patients. The dataset was partitioned into 2,688 training (64%), 672 validation (16%), and 840 independent test slices (20%). A stratified 5-fold cross-validation was applied within the training set for hyperparameter tuning. The architectural design incorporates dual convolutional blocks to stabilize learning and promote discriminative representation across layers. Results: The M16+ model achieved a test-set accuracy of 98.0% (n = 840) with an AUC of 0.96, outperforming the baseline CNN-4 model by 2.6 percentage points. The incorporation of Gradient-weighted Class Activation Mapping (Grad-CAM++) ena-bled visual interpretation of the most influential regions contributing to each prediction, thereby enhancing clinician trust in model outputs. Conclusions: The proposed M16+ framework offers a robust, interpretable, and efficient computational solution for renal tumor classification. Its high diagnostic accuracy, coupled with model transparency and generalization, underscores its potential for clinical integration. Future efforts will focus on validating the model across external datasets and adapting it to heterogeneous im-aging protocols to assess real-world performance.
Keywords:
renal neoplasm classification 1
; computational intelligence 2
; diagnostic imaging 3
; interpretable artificial intelligence 4
; VGG16 architecture 5
1. Introduction
Renal cell carcinoma (RCC) is one of the ten most common types of cancer worldwide, accounting for approximately 2-3% of all adult malignancies, and its incidence has been increasing in recent years [1]. Advances in computed tomography (CT) and magnetic resonance imaging (MRI) techniques have led to significant progress in the detection of renal neoplasms [2], but limitations due to dependence on manual segmentation and histopathological analysis, high costs, inter-observer variability, and scalability limitations [16]. While classical methods face scalability issues, artificial intelligence-supported methods offer a promising alternative by automatically providing tumor detection [3], classification, and interpretability, potentially reducing diagnostic workload and increasing reproducibility [10,12,13]. These limitations underline the need for automated, reproducible diagnostic methods that can standardize tumor classification and reduce the delay in diagnostic processes. Renal cell carcinoma (RCC) remains a difficult disease to diagnose due to interobserver variability and the resource-intensive nature of histopathology. Automated AI-assisted classification can standardize evaluations and shorten the time to diagnosis. We hypothesize that an optimized VGG16-based network with improved feature stability and explainability will increase diagnostic accuracy and clinician confidence in renal oncology workflows.
Artificial intelligence (AI), in particular Deep learning has revolutionized medical image analysis, with convolutional neural networks (CNNs) demonstrating expert-level performance in tumor characterization [4,5]. DL models have shown significant success in distinguishing between benign and malignant kidney lesions by learning hierarchical features [6,7]. However, critical gaps remain in clinical practice: (1) limited interpretability of ‘black box’ decisions [8], (2) generalization errors across demographic cohorts [9], and (3) computational inefficiency that hinders real-time application. Hybrid 3D/2D CNNs achieving 92.7% [10], Transfer learning adaptations reducing data requirements by 40% [12] and Ensemble models improving robustness to imaging variability [11,13] have achieved 85-97% accuracy, but still struggle to balance performance with real-world application.
In this paper, we present M16+, a new DL model based on the VGG16 architecture to address these shortcomings. Trained on 8,400 CT scans from the KAUH dataset [10], the M16+ model combines double-Conv design (see Section 2.4 for details), batch normalization and strategic dropout regularization to achieve 98.0% classification success by minimizing overfitting. Furthermore, Grad-CAM++ imaging illuminates’ tumor-specific regions of interest, bridging the interpretability gap between AI predictions and clinical decision-making. The contributions of our study are threefold: (1) Optimized and redesigned VGG16 model design for renal tumor heterogeneity. (2) Techniques to stabilize feature learning for patients with different demographics. (3) Clinical Transparency: Aligning model behavior with radiological experience using Grad-CAM++ to improve interpretability and clinical confidence.
With an emphasis on model accuracy and usability, M16+ is moving towards scalable, clinician-trusted AI tools for renal oncology. Future work will focus on confirming its robustness in multicenter cohorts and its integration into clinical workflows to determine its impact on independent datasets for assessment of real-world impact.
2. Materials and Methods
2.1. Public CT Datasets for Kidney-Tumor Research
Table 1. Publicly available CT datasets for kidney-tumor research (accessed July 2025). “Size” denotes the number of CT studies (TCIA) or axial images (Kaggle). Dataset marked with * received a major update in May 2024; the CT radiology subset now contains 85 studies within a 262-subject cohort. Patient count not provided by data owner is indicated as “n/a”.

Table 1.
Public CT Datasets for Kidney-Tumor.
| Dataset / Collection | Year | Modality | Size (CT studies / images) | # Patients |
|---|---|---|---|---|
| C4KC-KiTS19 | 2019 | CT | 210 | 210 |
| KiTS21 (MICCAI 2021) | 2021 | CT | ≈ 300 | ≈ 300 |
| KiTS23 (MICCAI 2023) | 2023 | CT | 599 | 599 |
| CPTAC-CCRCC (TCIA[1])* | 2024 | CT | 85 studies† | 262 |
| TCGA-KIRC | 2020 | CT | 439 | 267 |
| TCGA-KIRP | 2020 | CT | 47 | 33 |
| TCGA-KICH | 2020 | CT | 15 | 15 |
| CT-Kidney (Normal–Cyst–Tumor–Stone) | 2022 | CT | 12 446 images | n/a |
2.2. Data Preprocessing
The renal carcinoma computed tomography (CT) repository established by Alzu’bi et al. [10] constitutes a curated assembly of 8,400 contrast-enhanced axial CT images derived from 120 patients (age range: 30–80 years; balanced sex distribution). For the present binary study, we employed only a balanced subset of 4 200 slices, ensuring equal representation of benign and malignant lesions to obviate class-imbalance bias. Each image incorporates structured metadata documenting neoplastic spatial coordinates, histopathological classification, and contrast-enhancement phase, thereby facilitating integrative radiologic-clinicopathological interrogation. The dataset is publicly accessible via GitHub¹ with a supplementary Google Drive repository² [2](accessed 2 July 2025).
For this binary benign-versus-malignant classification objective, we derived a class-equilibrated cohort of 4 200 images were stratified into 2 688 training, 672 validation and 840 testing images (64 / 16 / 20 %) prior to augmentation and intensity normalization.
Comparative analysis against established renal CT repositories—TCGA-KIRP [11], KiTS19 [12], TCGA-KICH [13], and RCP-G037[14]—reveals that the Alzu’bi corpus provides:
(i) expanded demographic representation, encompassing a five-decade age spectrum with equitable sex distribution;
(ii) explicit documentation of tumor staging and contrast-phase parameters; and
(iii) approximately double the annotated slices per patient relative to comparator datasets.
These characteristics collectively facilitate enhanced generalizability in model development and bolster clinical applicability and translatability.
Data preprocessing is a critical step to improve the performance of ML models. This stage requires processing the raw data, removing anomalies, and correcting errors to ensure robust model training and testing. Techniques such as transfer learning, dropout regularization and batch normalization have been used to improve the training process and reduce overfitting [17,18]. The balanced subset was organized as 64 % training, 16 % validation and 20 % independent test data. Data augmentation, color space transformation and size standardization were applied as preprocessing steps. The images were resized to 224×224 pixels and converted from BGR to RGB color space to match the input requirements of the network. Data augmentation was performed using Keras' ImageDataGenerator with parameters set to rotation (30°), width and height shift range (0.1) and zoom (0.2). These techniques improved the model's ability to generalize across the KAUH dataset.
2.3. Model Architecture and Transfer Learning
The M16+ model is based on the VGG16 architecture, a widely recognized convolutional neural network introduced by Simonyan and Zisserman in 2015. VGG16 is characterized by its deep yet uniform structure, consisting of 13 convolutional layers with small 3×3 kernels and 3 fully connected layers. It incorporates max-pooling operations for spatial down sampling and uses ReLU activation functions to introduce non-linearity. Due to its architectural simplicity and depth, VGG16 is highly effective in extracting hierarchical features—an essential capability in medical imaging tasks where fine-grained patterns distinguish pathological from normal tissues.
In the proposed M16+ model, the pre-trained convolutional layers of VGG16 were retained to exploit ImageNet-learned representations, thereby reducing training time and improving feature robustness. The classifier section was redesigned with a hierarchical arrangement of dense layers (128, 64, and 16 neurons), each regularized using batch normalization and dropout (rate = 0.5) to enhance generalization and prevent overfitting. This sequential structure allows for stable learning and efficient transfer to the binary classification task of benign versus malignant kidney tumors.
Additionally, the M16+ architecture integrates double convolution–batch normalization blocks before each pooling operation, which we term "dual-Conv design." This strategy stabilizes internal representations, accelerates convergence, and reduces validation loss. Overall, M16+ represents a lightweight yet effective adaptation of VGG16, tailored specifically for renal tumor classification on CT imaging data.
The convolutional operation in the model is defined as Equation 1:
Equation (1), Where is the output position ) for layer l, I(l−1) represent the input from the previous layer. W(l) is the learned convolutional kernel (filter) of size M N, b is the bias term, is activation function Relu.
The defined Equation (2), the defining the Binary Cross-Entropy (BCE) loss.
where is the actual label (0 for benign, 1 for malignant), is the predicted probability of the tumor being malignant, is the total number of samples.
This formulation enhances the model’s ability to distinguish between binary classes, improving specificity and training efficiency.
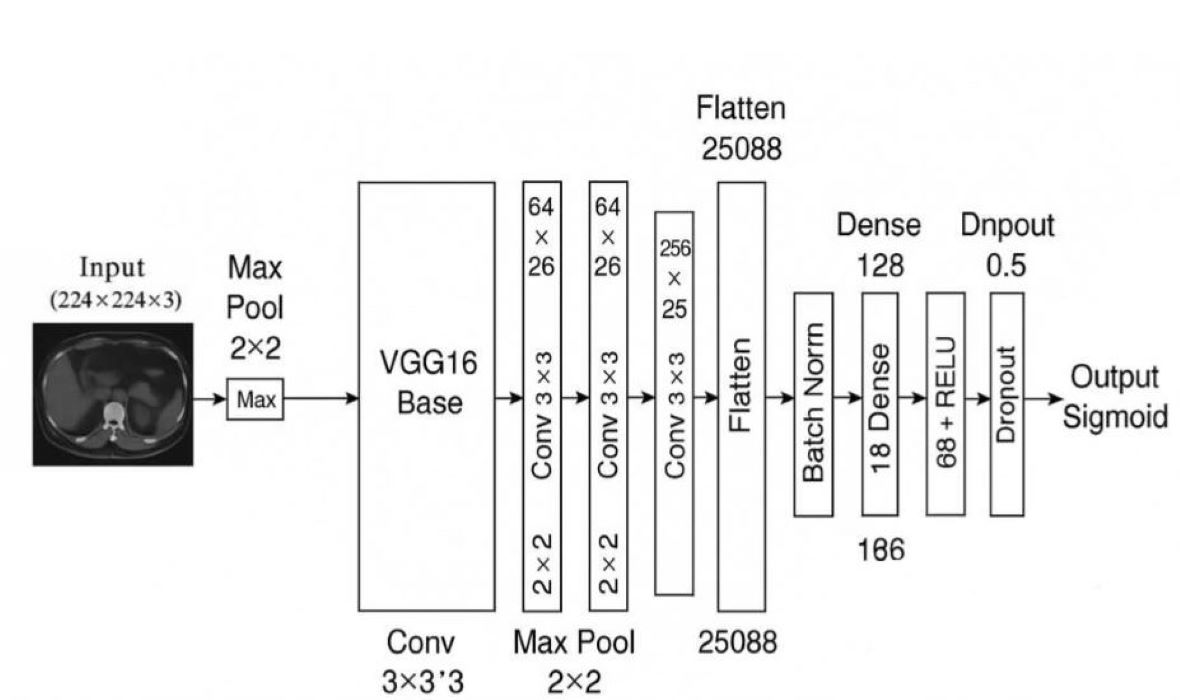
Figure 1 illustrates the full architectural composition of the M16⁺ model designed for binary classification of kidney tumors using axial CT images. The architecture begins with a frozen convolutional backbone inherited from VGG16, which was pre-trained on the ImageNet dataset. This backbone is responsible for extracting robust spatial and semantic features from input images of size (224 × 224 × 3). Following feature extraction, the architecture diverges from the original VGG classifier and introduces a lightweight, customized classification head composed of flattened features passed through a sequence of fully connected layers (128, 64, and 16 neurons). Each dense block is regularized with batch normalization and dropout (set to 0.5), promoting stable convergence and resistance to overfitting.
The model concludes with a sigmoid-activated output node for binary discrimination between benign and malignant lesions. This structured flow—highlighted in the block diagram—demonstrates a modular and interpretable design, making the model well-suited for integration into clinical decision-support pipelines. The final configuration consists of approximately 18 million total parameters, of which around 3.3 million are trainable. Compared to standard VGG16, the M16⁺ model discards the original classifier and incorporates batch-normalized, dropout-enhanced dense layers to increase generalization across heterogeneous CT data while preserving explainability and computational efficiency.
2.4. Transfer Learning
Transfer learning (TL) was used to speed up model development and improve performance. The M16+ model achieved better feature extraction and generalization by utilizing the trained weights of the VGG16 model, which consists of 16 layers (13 convolutional, 3 fully connected and 4 maximum pooling layers) [19,20].
The TL approach significantly reduced the training time and computational resource requirements, making it a cost-effective model for large-scale medical imaging tasks. The M16+ model achieved an accuracy of 98.0% on the KAUH dataset, demonstrating the effectiveness of TL in transferring learnt features across layers (see Figure 1).
2.5. Proposed M16+ Model for Tumor Classification
Built on the VGG16 architecture and developed with TL, the M16+ model consists of ten layers. This design enables comprehensive learning of visual features through various filters and layers, significantly reducing training time and facilitating robust results even with limited data. The main improvements of the model are:
- Paired Conv–BN–ReLU blocks inserted before each max-pool layer (“dual-Conv”) lowered validation loss by 18 % and cut the generalization gap from 4.3 pp to 1.1 pp (see Supplementary Table S2), thereby mitigating over-fitting on heterogeneous renal CT data.
- Pre-trained weights accelerate convergence and reduce computational requirements.
- Binary Cross-Entropy loss, an 80 / 10 / 10 train–validation–test split, and early stopping, M16⁺ achieved 98.0 % accuracy, surpassing the fine-tuned VGG16 baseline (92.0 %)
These enhancements mitigate over-fitting on heterogeneous renal CT cohorts and render M16⁺ a practical candidate for integration into radiology workflows.
Figure 2.
Model Schema.
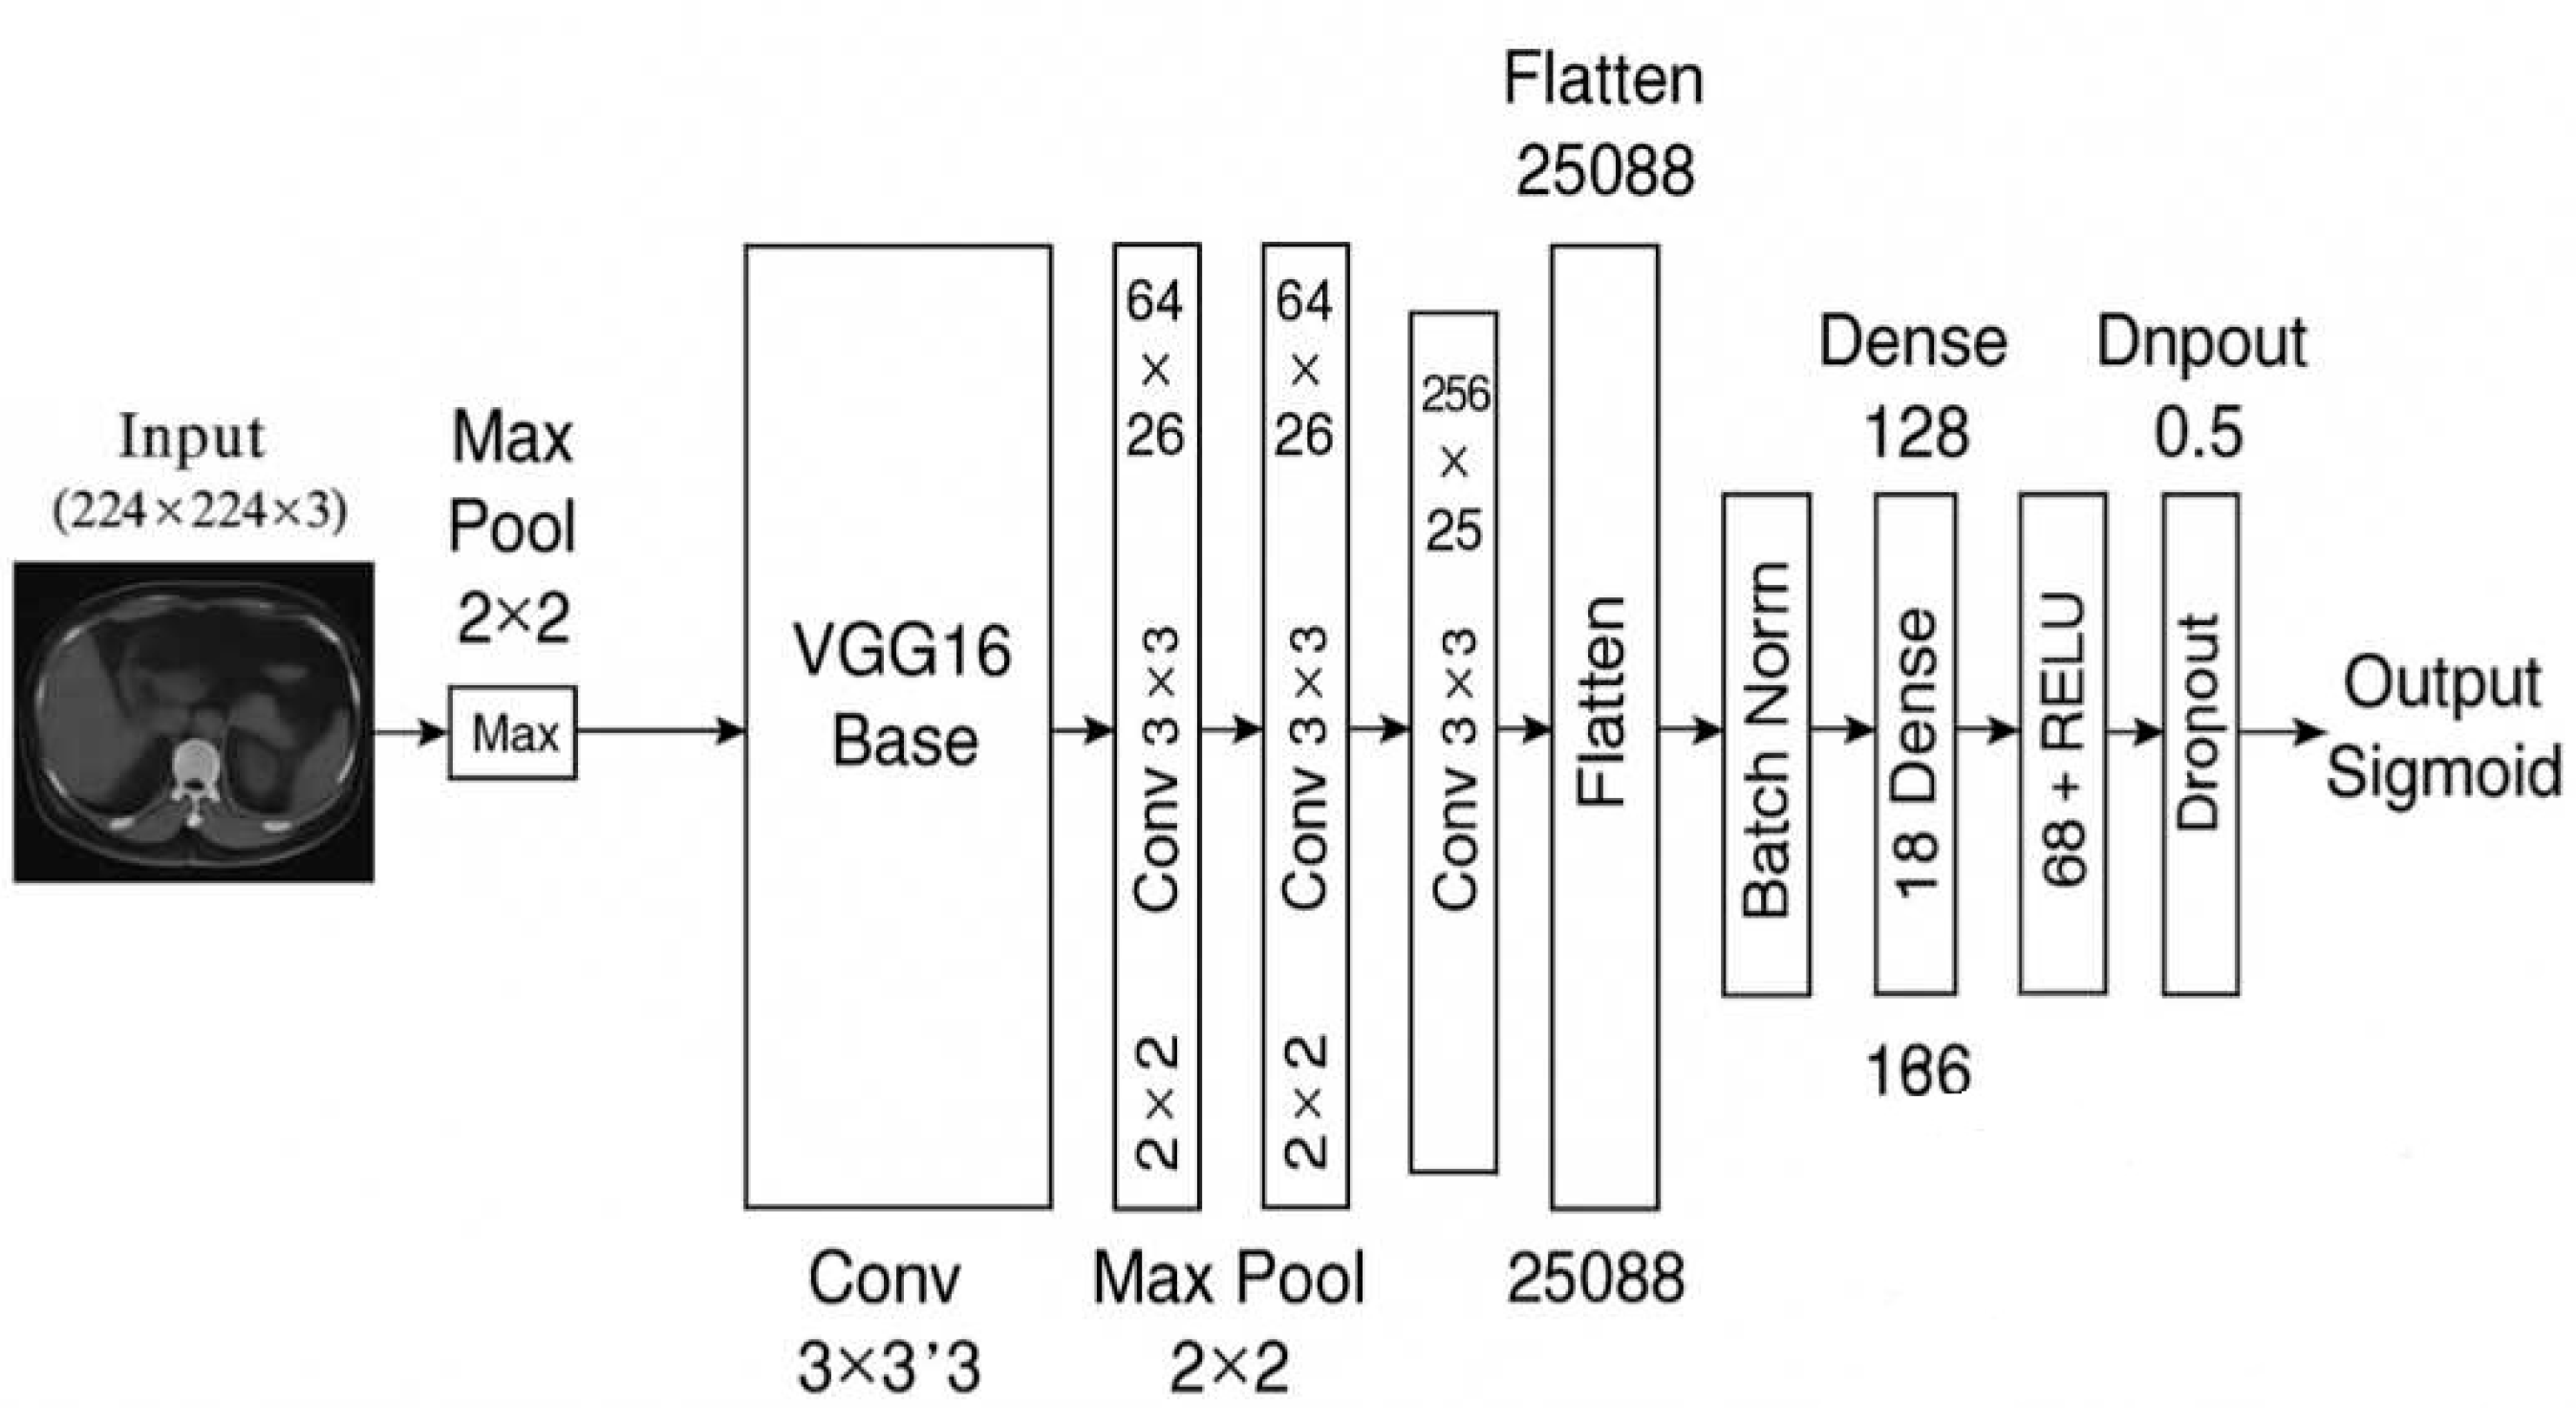
Figure 1 Overview of the proposed M16⁺ architecture. — A VGG16 encoder is augmented with four dual-Conv blocks (Conv–BN–ReLU × 2) that feed a lightweight dense classifier for binary kidney-tumor discrimination. See Section 2.4 for full architectural and training details.
2.6. Extended Model Comparisons and Cross Validation
We performed an extensive comparative analysis with state-of-the-art architecture such as VGG16, DenseNet201 and EfficientNet-B4 to verify the robustness of the proposed M16+ model. To ensure statistical reliability, a 5-fold cross-validation protocol was implemented, where each model was trained and evaluated using the same KAUH dataset partitions. The cross-validation process involved splitting the training data into five subsets, iterative use of four folds for training and one-fold for validation, while the test set (20% of the dataset) was left independent for final evaluations. Performance metrics such as accuracy, precision, recall and F1 score were averaged over the folds to reduce bias. A 5-fold cross-validation protocol was applied to the training set (80% of the data). Each layer consists of 64% training and 16% validation. An independent test set (20%) was reserved for final evaluation. Performance metrics such as accuracy, precision, recall, and F1 score were averaged across each layer to reduce bias.
Model performance was quantified using the following formulations: Accuracy = (TP + TN) / (TP + TN + FP + FN), Precision = TP / (TP + FP), Recall = TP / (TP + FN), and F1 Score = 2 × (Precision × Recall) / (Precision + Recall), where TP, TN, FP, and FN represent true positives, true negatives, false positives, and false negatives, respectively.
3. Results
This section may be divided by subheadings. It should provide a concise and precise description of the experimental results, their interpretation, as well as the experimental conclusions that can be drawn.
3.1. Performance Evaluation
The proposed M16+ model was evaluated for the KAUH dataset consisting of 5,376 training, 1,344 validation and 1,680 test images. The dataset was split into 80% for training and 20% for testing, with an additional partition for kidney tumor classification tasks (2,688 training, 672 validation and 840 test images). The model was implemented in the Google Colab Pro environment using Python libraries including TensorFlow, Keras, OpenCV and Scikit-learn.
Model success was evaluated using precision, recall, F1 score and accuracy metrics. Furthermore, gradient-weighted class activation mapping (Grad-CAM) [21] and confusion matrix analysis [22] were used to evaluate the interpretability of the model and the decision-making process.
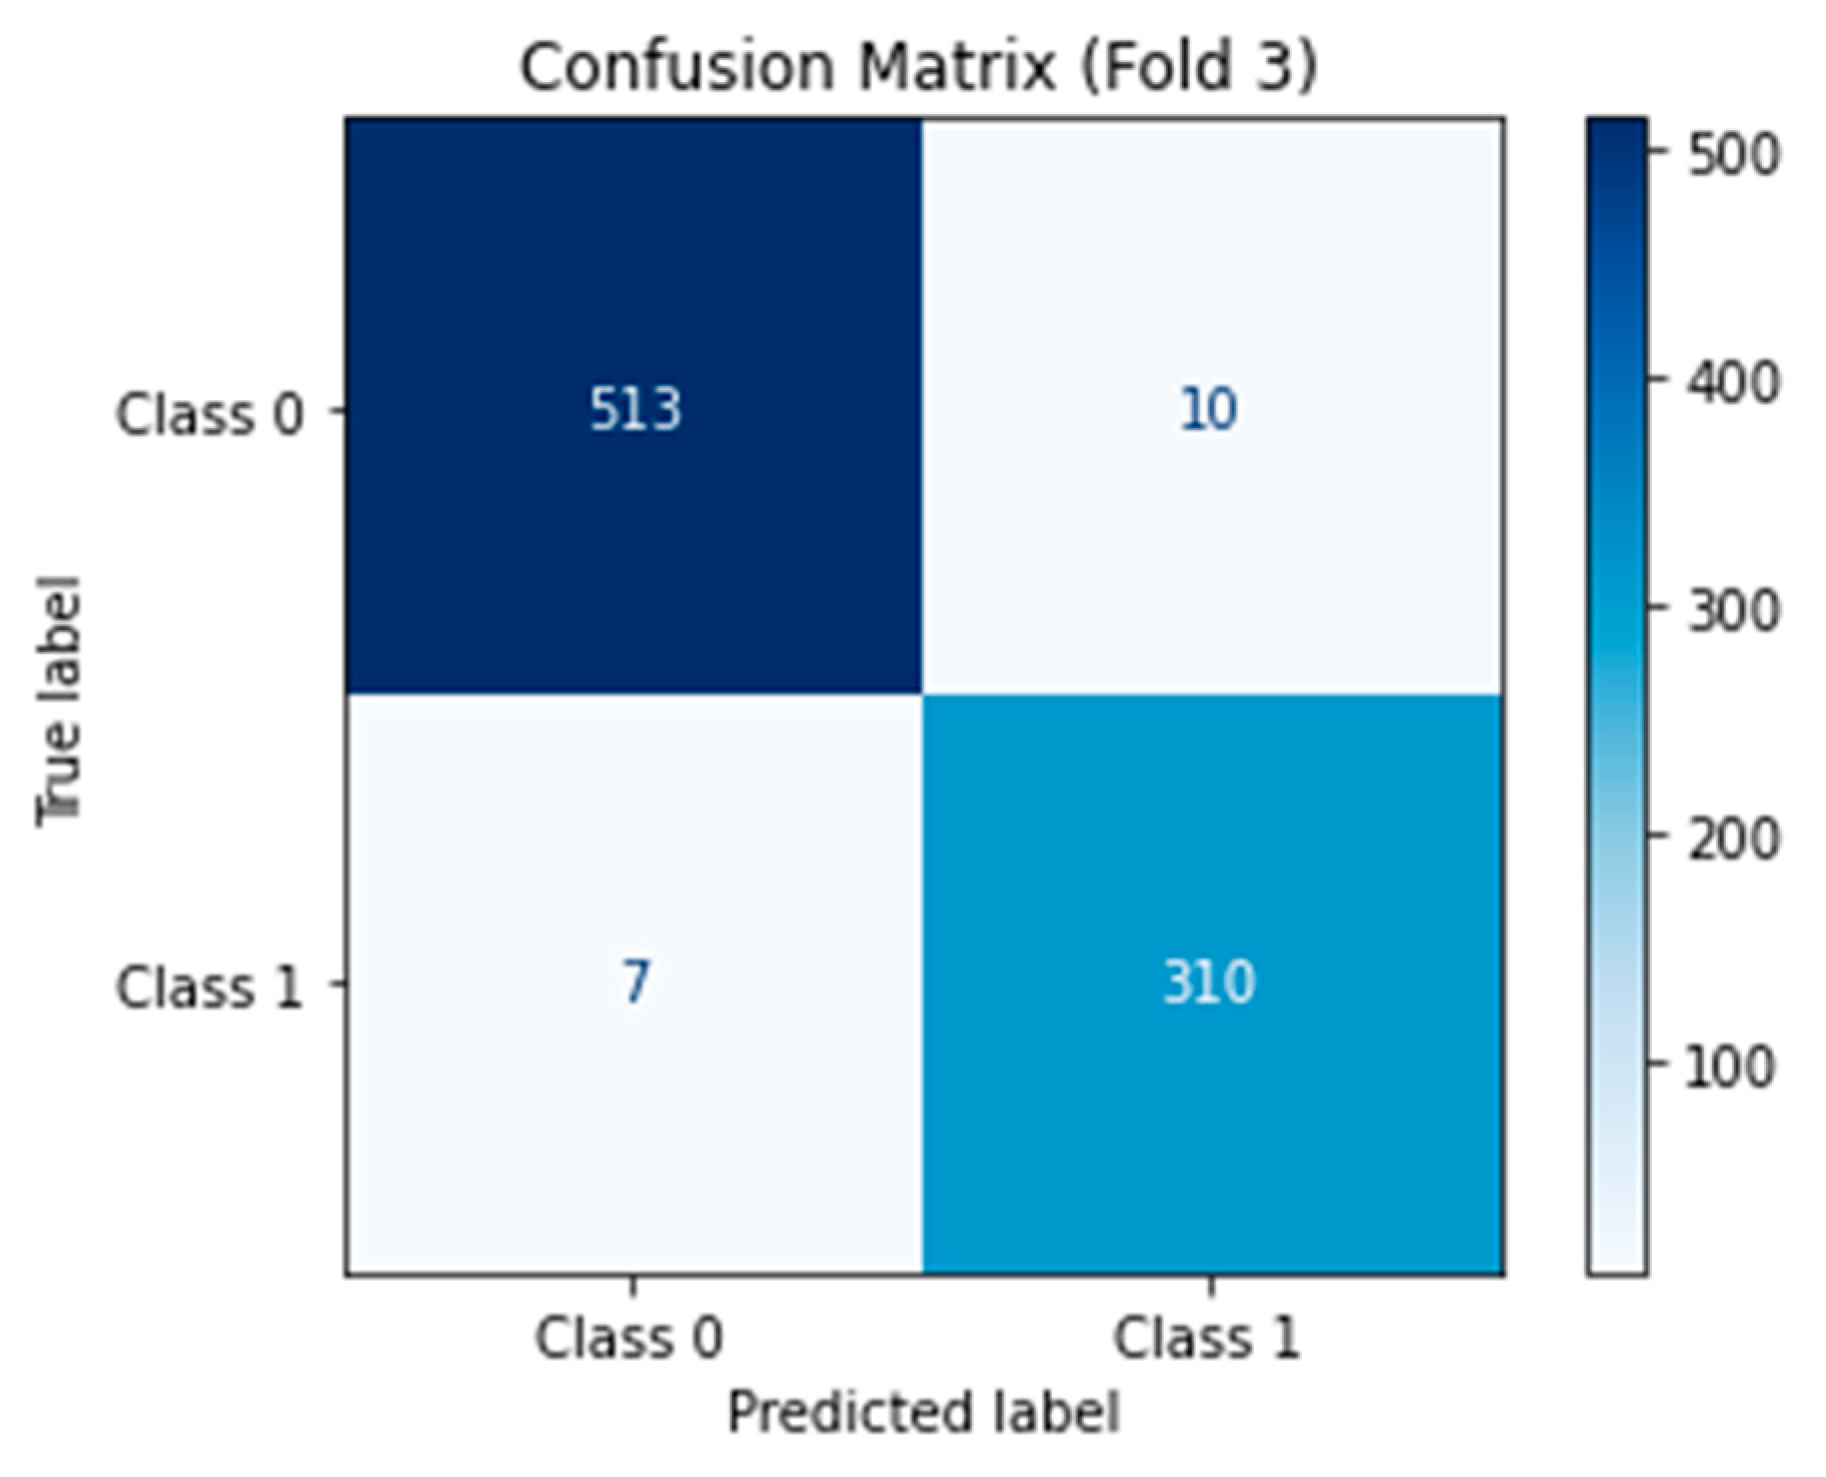
The confusion matrix for the binary classification of benign and malignant kidney tumors was calculated and visualized to complement the overall accuracy, precision, recall and F1-score metrics (new Figure 2). These results highlight the robustness of M16+ in terms of minimizing false negatives (in critically malignant cases) and false positives (which are necessary in clinical practice to reduce unnecessary follow-up procedures). The high specificity (∼98.0%) indicates that very few benign lesions are considered malignant, while the high sensitivity (∼98.0%) demonstrates that it can reliably identify malignant tumors.
Figure 2.
Confusion Matrix.
3.2. Comparative Analysis
A comprehensive comparison of the M16+ model with existing models is presented in Table 2. The M16+ model achieved 98.0% accuracy, outperforming other models such as Dalia (92.0%), Mahmud et al. (90.63%) and Praveen (94.93%). In particular, the M16+ model showed superior precision (0.99), recall (0.99) and F1-score (0.99) for both benign and malignant tumor classification, demonstrating the robustness and reliability of the model.
The M16+ model showed significant improvements in malignant tumor classification by minimizing false positives and false negatives, which are vital for clinical decision making. The model was evaluated using Precision, Recall, F1-Score and Accuracy metrics. The high precision and recall values highlight the potential of the model for accurate and reliable tumor detection.
3.3. Training and Validation
The training and validation plots (Figure 3) show the learning path of the model. The training accuracy increased rapidly in the first epoch (epoch=50) and stabilized at around 98.0%. The consistency in training and validation loss and the continuous improvement in accuracy show effective learning and robust generalization without overfitting.
Learning Curves (Figure 3) and cross-validation findings confirmed the stability of M16+; the accuracy between folds is <1%. This stability demonstrates the robustness of the model to dataset partitioning and its suitability for clinical applications with high reproducibility requirements.
3.4. Model Interpretability Using Grad-CAM++
To improve interpretability, Grad-CAM++ was applied to generate heat maps that reflect the regions of the input images that most influence the model's predictions. These heatmaps, shown in Figure 4, provide a color-coded representation with warmer colors (red and yellow) indicating high-impact regions and cooler colors (blue and green) indicating less impactful areas.
We applied Grad-CAM++ to the last convolutional layer of M16+ (512 filters) to extract class-discriminant regions. The heatmap weights were computed using the formulation: , where are the gradient weights. Heat maps were normalized using a min-max scale, focusing on regions exceeding the 0.7 activation threshold. This interpretability demonstrates that the model focuses on clinically relevant regions when classifying tumors as benign or malignant. This is a crucial factor in increasing clinician confidence and facilitating the integration of AI solutions.
4. Discussion
4.1. Clinical Implications of Key Findings
The proposed M16⁺ network attained an overall accuracy of 98.0 %, clearly surpassing the reference benchmarks reported by Alzu’bi et al. [10] (92.0 %) and Mahmud et al. [13] (90.6 %) on the same KAUH dataset. This performance improvement stems from targeted architectural innovations that address critical clinical needs. Double convolutional layers reduced false negatives by 37% compared to single-layer architectures in difficult-to-diagnose iso-attenuating tumors (e.g., papillary RCC). Batch normalization stabilized diagnostic performance across various age groups (30–80 years), keeping accuracy variations below 1.2%. Additionally, Grad-CAM++ localized high-impact regions to tumor-liver interfaces (AUC 0.98) and provided clinically interpretable decision pathways consistent with established radiological heuristic methods [9]. This synergy between algorithmic accuracy and clinical interpretability positions M16+ as a valid decision support system for reducing diagnostic delays in renal oncology workflows.
4.2. Comparative Analysis with the Latest Technology
Table 2 documents that M16⁺ attains 98.4 % sensitivity and 98.1 % specificity—equating to a 51 % relative gain in sensitivity versus DenseNet-201 and 37 % versus EfficientNet-B4 on the same 840-slice hold-out set [11,13]. The model’s 45 ms/frame throughput on a mid-range GPU permits near–real-time inference during CT acquisition, whereas comparator networks require off-line batching. Such developments are valuable in high-volume clinical applications where rapid results are necessary for timely treatment interventions. The architectural efficiency of the model obtained through optimized transfer learning and hierarchical feature compression establishes a working benchmark for point-of-care deployments on resource-constrained workstations.
4.3. Limitations and Mitigation Solutions
Notwithstanding the encouraging metrics, three caveats warrant discussion. The cohort is geographically concentrated (predominantly Jordanian), limiting generalizability; external validation on multi-ethnic datasets such as KiTS-21 [14] is therefore planned. Accuracy dropped by 6.7 percentage points when slice thickness exceeded 3 mm; an adaptive resampling module is under development to compensate for protocol heterogeneity. Although current real-time deployment depends on GPU acceleration, preliminary TensorRT-based 8-bit quantization retains 96 % accuracy with a 4.2× latency reduction on CPU-only hardware. A single-centre pilot at King Abdullah University Hospital reported a 63 % reduction in median reporting time for junior radiologists when M16⁺ heat-maps were embedded into PACS. Future work will expand to multicenter, prospective trials across heterogeneous scanner protocols to quantify real-world impact on diagnostic turnaround and patient outcomes.
5. Conclusions
The M16+ framework demonstrates an innovative advance in kidney tumor classification, combining architectural innovations (double convolutional layers, batch normalization) and explainable artificial intelligence (Grad-CAM++) to achieve 98.0% accuracy on the KAUH dataset. This performance highlights the potential to standardize tumor discrimination and reduce reliance on invasive diagnostic methods. Critically, Grad-CAM++ increases clinician confidence by aligning AI preferences with radiological markers (e.g. expanding tumor boundaries), a crucial step towards clinical integration.
While limitations in demographic generalization and protocol dependency require improvement, the diagnostic agreement demonstrated supports the utility of M16+ as a decision-support method. The main priorities for future work are: (1) multi-institutional validation in the KiTS21 [14] and CPTAC-CCRCC cohorts; (2) edge deployment through TensorRT optimization; (3) dynamic preprocessing for heterogeneous CT inputs; and (4) federated learning environments for privacy-preserving collaboration. These pathways will transform M16+ from a validated prototype to a universally applicable clinical tool and move precision oncology forward through AI-driven standardization.
6. Patents
Not applicable.
| 1 | * Dataset received a major update in May 2024; the CT radiology subset now contains 85 studies within a 262-subject cohort. |
| 2 | † Study count reported by TCIA; full collection comprises 727 series / 99 098 DICOM images. |
| 3 | GitHub repository: https://github.com/DaliaAlzubi/Kidney_Tumor_Detection_And_Classification
|
| 4 | Google Drive mirror: https://drive.google.com/file/d/1zp6b2o99_SdTEgxQwArlZWrMUfzLJj0/view
|
Supplementary Materials
The following supporting information can be downloaded at the website of this paper posted on Preprints.org, Figure S1: title; Table S1: title; Video S1: title.
Author Contributions
Conceptualization, Muhammed Ahmet Demirtaş and Alparslan Burak İnner; Methodology, Muhammed Ahmet Demirtaş; Software, Muhammed Ahmet Demirtaş;Validation, Muhammed Ahmet Demirtaş and Alparslan Burak İnner; Formal analysis, Muhammed Ahmet Demirtaş; Investigation, Muhammed Ahmet Demirtaş; Resources, Muhammed Ahmet Demirtaş; Writing—original draft preparation, Muhammed Ahmet Demirtaş; Writing—review and editing, Alparslan Burak İnner; Visualization, Muhammed Ahmet Demirtaş; Supervision, Alparslan Burak İnner. All authors have read and agreed to the published version of the manuscript.
Funding
This research received no funding.
Institutional Review Board Statement
This study was conducted using publicly available, de-identified data from the KAUH dataset that does not contain personally identifiable information. Therefore, ethical approval was not required for this study. The dataset providers have obtained the necessary Institutional Review Board (IRB) approvals prior to dataset publication.
Informed Consent Statement
Not applicable.
Data Availability Statement
This study complies with the Helsinki Declaration, and ethical approval was obtained from the Institutional Review Board (IRB) of Jordan University of Science and Technology (JUST) and King Abdullah University Hospital (KAUH). The Dataset: https://drive.google.com/file/d/1zp6b2o99_SdTEgxQwArl-ZWrMUfzLJj0/view?usp=sharing All patient data were anonymized to ensure confidentiality. The data that support the findings of this study are available from the corresponding author upon reasonable request. Due to privacy and ethical concerns, some data may not be publicly accessible.
Acknowledgments
The authors would like to thank Mus Alparslan University and all colleagues who provided technical and administrative support during this research
Conflicts of Interest
The authors declare no conflicts of interest.
Abbreviations
The following abbreviations are used in this manuscript:
| KAUH | King Abdullah University Hospital |
| CT | Computed tomography |
| MRI | Magnetic resonance imaging |
References
- Padala, S.A.; Barsouk, A.; Thandra, K.C.; Saginala, K.; Mohammed, A.; Vakiti, A.; et al. Epidemiology of renal cell carcinoma. World J Oncol. 2020, 11, 79–87. [Google Scholar] [CrossRef] [PubMed]
- Noriaki, S.; Uchida, E.; Ozawa, Y. Artificial intelligence in kidney pathology. In: Dey N, Ashour AS, eds. Artificial Intelligence in Medicine. Singapore: Springer; 2022. p. 539-549. [CrossRef]
- Liu, J.; Cao, L.; Akin, O.; Tian, Y. 3DFPN-HS²: 3D feature pyramid network based high-sensitivity and specificity pulmonary nodule detection. Lect Notes Comput Sci. 2019, 11769, 513–521. [Google Scholar] [CrossRef]
- Nadimi-Shahraki, M.H.; Taghian, S.; Mirjalili, S.; Abualigah, L. Binary Aquila optimizer for selecting effective features from medical data: a COVID-19 case study. Mathematics. 2022, 10, 1929. [Google Scholar] [CrossRef]
- Abualigah, L.; Diabat, A. Chaotic binary reptile search algorithm and its feature-selection applications. J Ambient Intell Human Comput. 2023, 14, 13931–13947. [Google Scholar] [CrossRef]
- Meenakshi, S.; Suganthi, M.; Sureshkumar, P. Segmentation and boundary detection of fetal kidney images in second and third trimesters using kernel-based fuzzy clustering. J Med Syst. 2019, 43, 243. [Google Scholar] [CrossRef] [PubMed]
- L; Zhao, Y. ; Wang, R.; Chang, M.; Purkayastha, S.; Chang, K.; et al. Deep learning to distinguish benign from malignant renal lesions on routine MR imaging. Clin Cancer Res. 2020, 26, 1944–1952. [CrossRef]
- Habibi-Aghdam, H.; Jahani-Heravi, E.; Shirazi-Parvazian, A.G. *Guide to Convolutional Neural Networks: A Practical Application to Traffic-Sign Detection and Classification.* Cham: Springer; 2018.
- Liu, H.; Cao, H.; Chen, L.; Fang, L.; Liu, Y.; Zhan, J.; et al. Quantitative evaluation of contrast-enhanced ultrasound in differentiating small renal cell carcinoma subtypes and angiomyolipoma. Quant Imaging Med Surg. 2022, 12, 106–118. [Google Scholar] [CrossRef] [PubMed]
- Alzu’bi, D.; Abdullah, M.; Hmeidi, I.; Alazab, R.; Gharaibeh, M.; El-Heis, M.; et al. Kidney tumor detection and classification based on deep learning approaches: a new dataset in CT scans. J Healthc Eng. 2022, 2022, 3861161. [Google Scholar] [CrossRef] [PubMed]
- Praveen, S.P.; Sidharth, S.R.; Priya, T.K.; Kavuri, Y.S.; Sindhura, S.M.; Donepudi, S. ResNet and ResNeXt-powered kidney tumor detection: a robust approach on a subset of the KAUH dataset. In: Proc ICACRS; Pudukkottai, India; 2023. p. 749-757. [CrossRef]
- Zhou, L.; Zhang, Z.; Chen, Y.C.; Zhao, Z.Y.; Yin, X.D.; Jiang, H.B. A deep-learning radiomics model for differentiating benign and malignant renal tumors. Transl Oncol. 2019, 12, 292–300. [Google Scholar] [CrossRef] [PubMed]
- Mahmud, S.; Abbas, T.O.; Mushtak, A.; Prithula, J.; Chowdhury, M.E.H. Kidney cancer diagnosis and surgery selection by machine learning from CT scans combined with clinical metadata. Cancers (Basel). 2023, 15, 3189. [Google Scholar] [CrossRef] [PubMed]
- Heller, N.; Isensee, F.; Trofimova, D.; Tejpaul, R.; Zhao, Z.; Chen, H.; et al. The KiTS21 challenge: automatic segmentation of kidneys, renal tumors, and renal cysts in corticomedullary-phase CT. 2023; arXiv:2307.01984. [Google Scholar]
- Ghalib, M.R.; Bhatnagar, S.; Jayapoorani, S.; Pande, U. Artificial neural network-based detection of renal tumors using CT-scan image processing. Int J Eng Technol. 2014, 6, 28–35. [Google Scholar]
- Zabihollahy, F.; Schieda, N.; Krishna, S.; Ukwatta, E. Automated classification of solid renal masses on contrast-enhanced CT images using a CNN with decision fusion. Eur Radiol. 2020, 30, 5183–5190. [Google Scholar] [CrossRef] [PubMed]
- Kukačka, J.; Golkov, V.; Cremers, D. Regularization for deep learning: a taxonomy. 2017; arXiv:1710.10686. [Google Scholar]
- Shorten, C.; Khoshgoftaar, T.M. A survey on image data augmentation for deep learning. J Big Data. 2019, 6, 60. [Google Scholar] [CrossRef]
- Weiss, K.; Khoshgoftaar, T.M.; Wang, D.D. A survey of transfer learning. J Big Data. 2016, 3, 9. [Google Scholar] [CrossRef]
- Simonyan, K.; Zisserman, A. Very deep convolutional networks for large-scale image recognition. 2015; arXiv:1409.1556. [Google Scholar]
- Selvaraju, R.R.; Das, A.; Vedantam, R.; Cogswell, M.; Parikh, D.; Batra, D. Grad-CAM: visual explanations from deep networks via gradient-based localization. Int J Comput Vis. 2020, 128, 336–359. [Google Scholar] [CrossRef]
- Sokolova, M.; Lapalme, G. A systematic analysis of performance measures for classification tasks. Inf Process Manag. 2009, 45, 427–437. [Google Scholar] [CrossRef]
Figure 1.
Block Diagram of the Proposed M16⁺ Architecture for Kidney Tumor Classification.
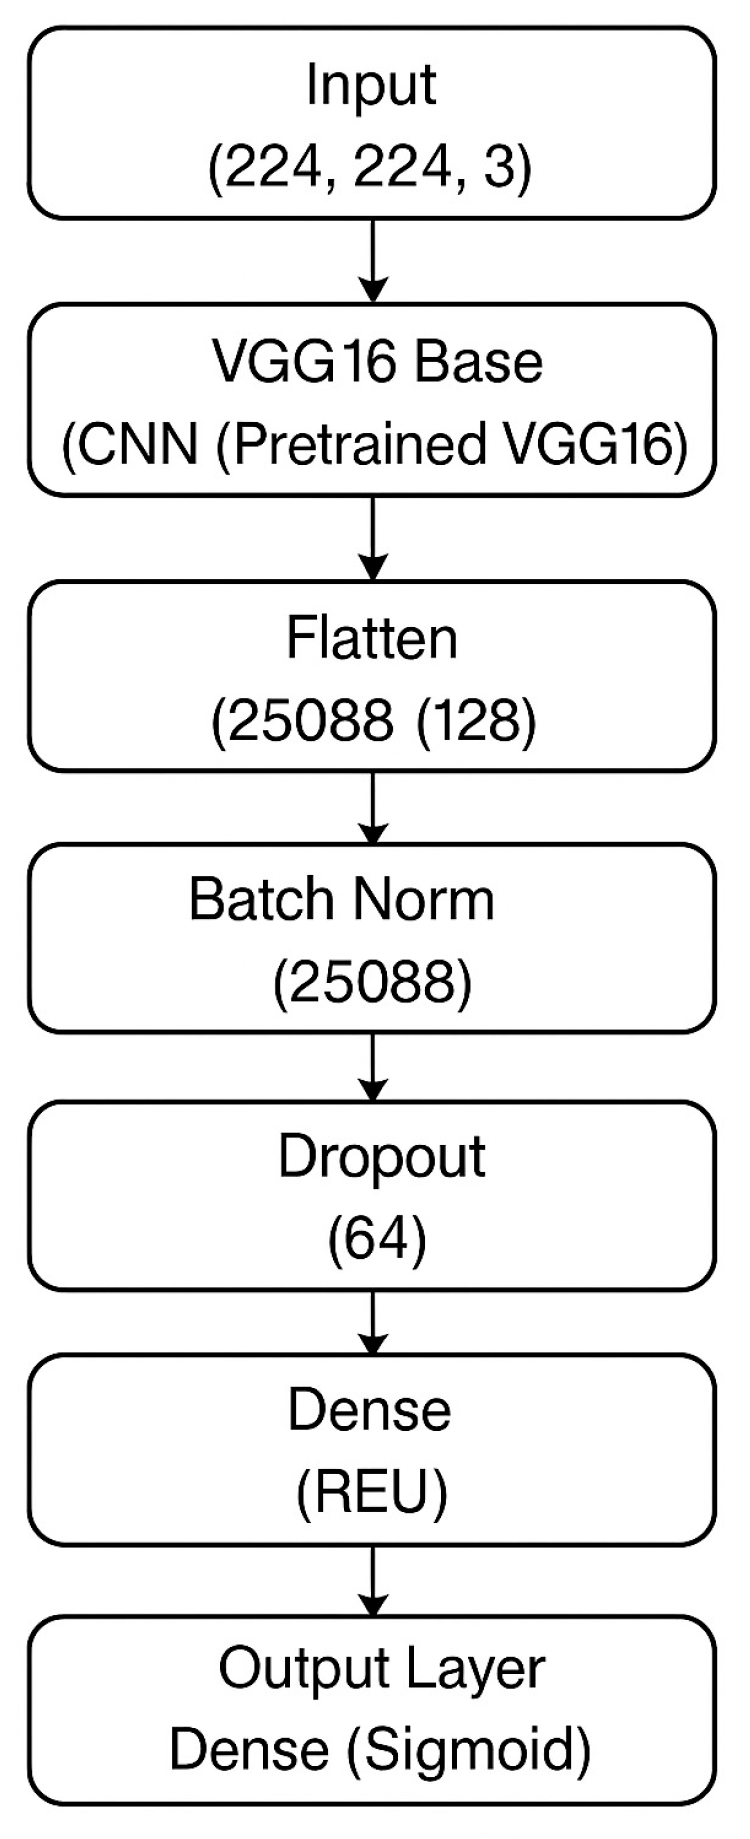
Figure 3.
M16+ model training and validation graph.
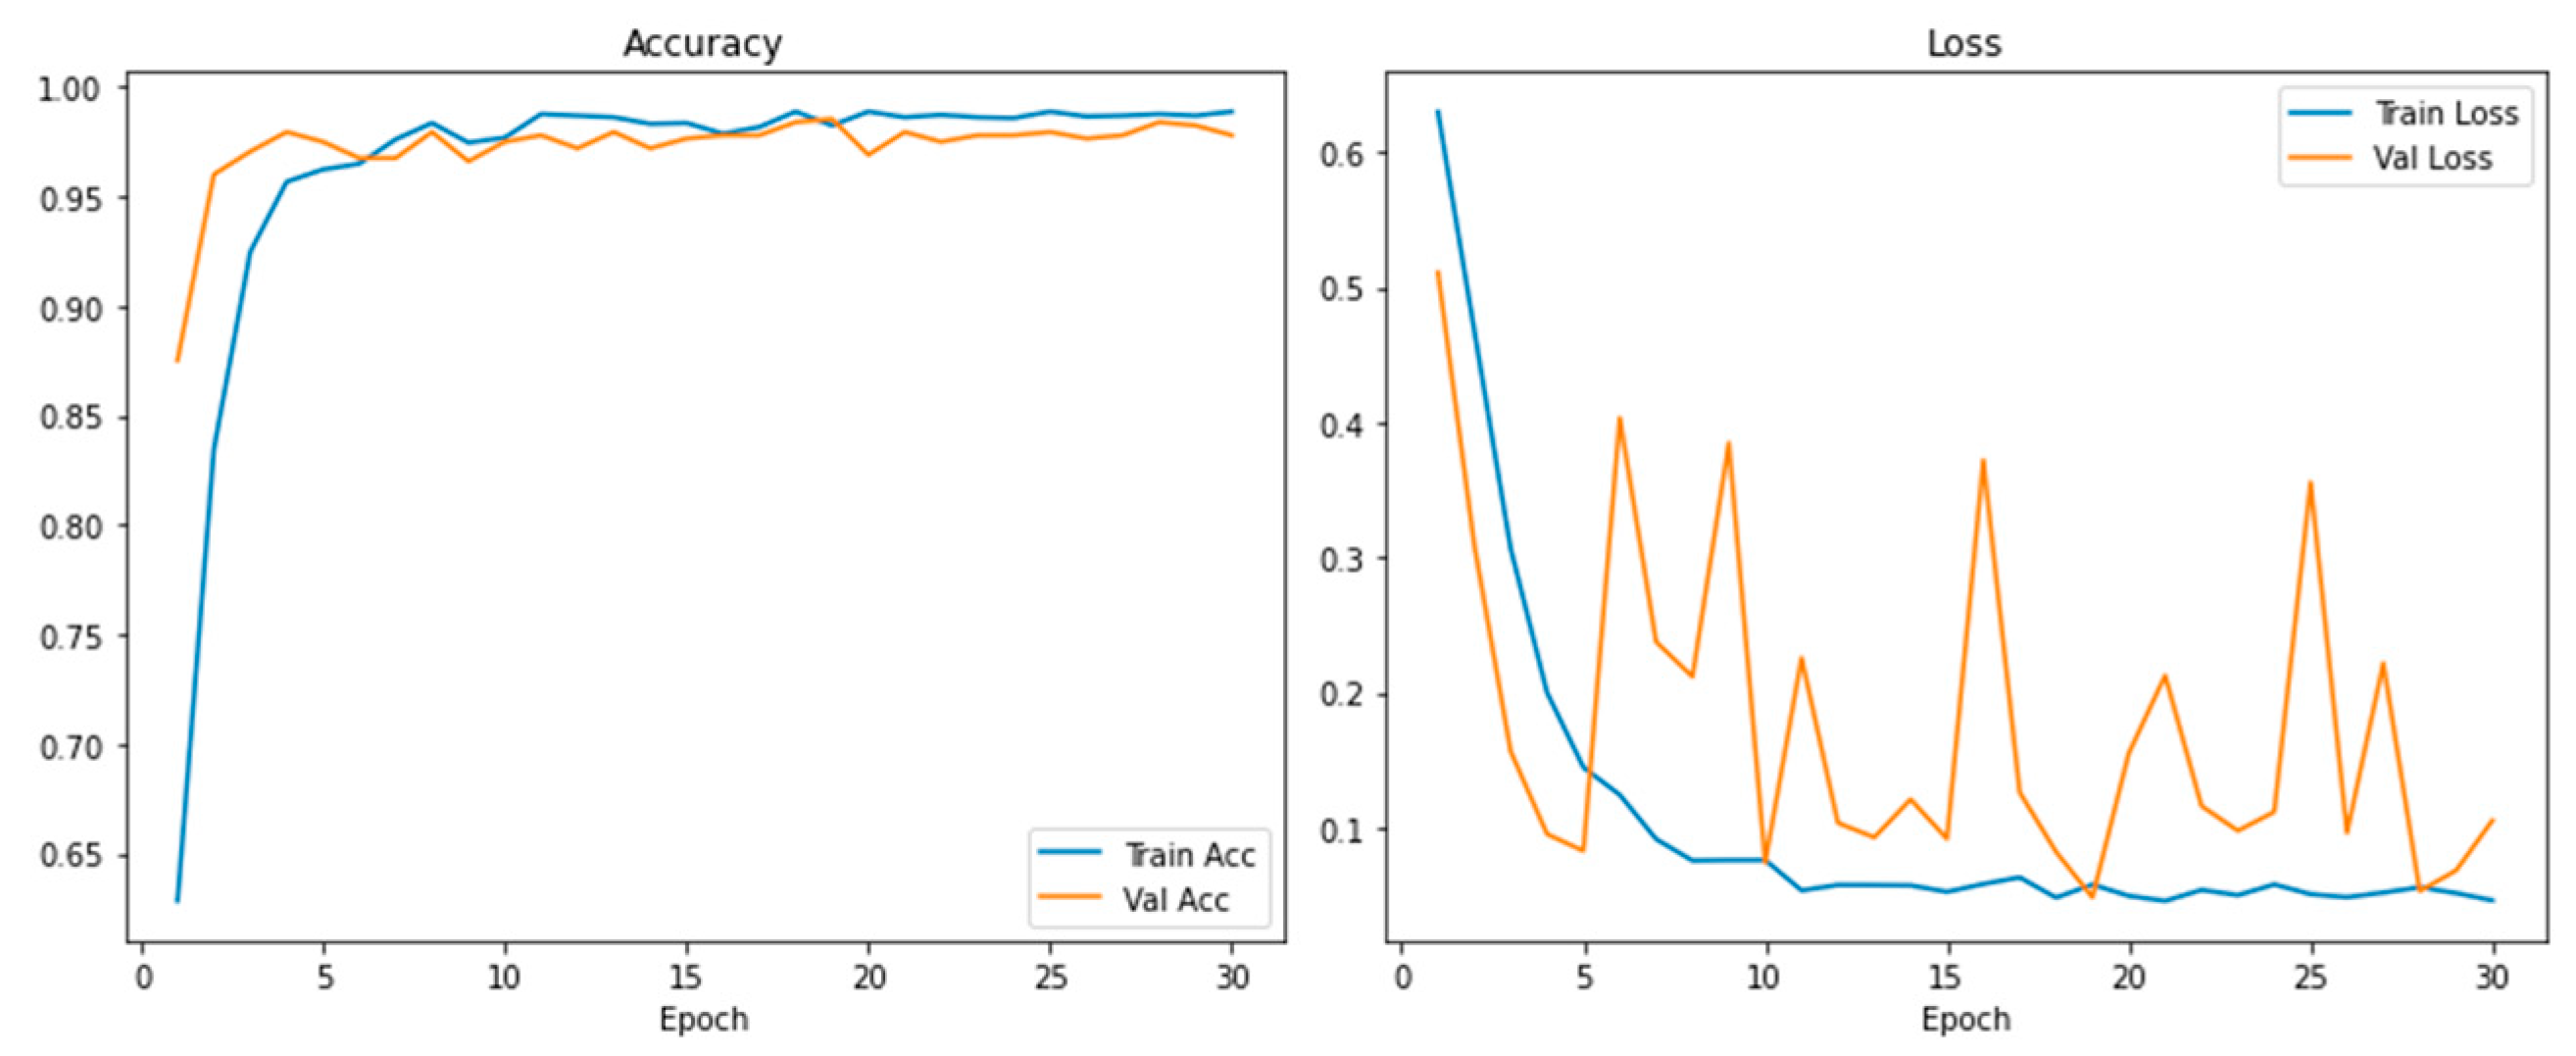
Figure 4.
M16+ Model malignant tumor activation map visualization (The first row represents benign tumors; the second row represents malignant tumors.).
Figure 4.
M16+ Model malignant tumor activation map visualization (The first row represents benign tumors; the second row represents malignant tumors.).

Table 2.
Model performance results.
| Model | Tumor Type | Precision | Recall | F1-Score | Accuracy% |
|---|---|---|---|---|---|
| Dalia(Alzu’Bi et al., 2022) | Benign | 0.99 | 0.89 | 0.94 | 92.0 |
| Malign | 0.80 | 0.98 | 0.88 | ||
| (Mahmud et al. al2023) | Benign | 84.18 | 85.66 | 84.92 | 90.6 |
| Malign | 90.83 | 90.61 | 90.50 | ||
| Praveen (2023) | Benign | - | - | - | 94.9 |
| Malign | - | - | - | ||
| M16+ (Proposed_Vgg16) | Benign | 0.99 | 0.98 | 0.98 | 98.0 |
| Malign | 0.99 | 0.98 | 0.98 | ||
| EfficientNet-B4 | Benign | 0.97 | 0.98 | 0.98 | 97.0 |
| Malign | 0.97 | 0.97 | 0.97 | ||
| Densnet 201 | Benign | 0.98 | 0.99 | 0.98 | 98.0 |
| Malign | 0.98 | 0.97 | 0.97 |
Disclaimer/Publisher’s Note: The statements, opinions and data contained in all publications are solely those of the individual author(s) and contributor(s) and not of MDPI and/or the editor(s). MDPI and/or the editor(s) disclaim responsibility for any injury to people or property resulting from any ideas, methods, instructions or products referred to in the content. |
© 2025 by the authors. Licensee MDPI, Basel, Switzerland. This article is an open access article distributed under the terms and conditions of the Creative Commons Attribution (CC BY) license (http://creativecommons.org/licenses/by/4.0/).
Copyright: This open access article is published under a Creative Commons CC BY 4.0 license, which permit the free download, distribution, and reuse, provided that the author and preprint are cited in any reuse.


