
Submitted:
24 July 2025
Posted:
25 July 2025
You are already at the latest version
Abstract
The influence of surfactants on the steady shear rheology of cellulose nanocrystal (referred to as NCC) suspension was investigated. Two surfactants, anionic sodium lauryl sulfate (referred to as Stepanol) and cationic hexadecyltrimethylammonium bromide (referred to as HTAB), were studied. The NCC concentration was fixed at 1 wt%. The surfactant concentration varied from 0 to 500 ppm. The influence of Stepanol was found to be weak whereas HTAB had a strong influence on the rheology of NCC suspension. The NCC suspension and surfactant-NCC suspensions were highly non-Newtonian shear-thinning. The power-law model described the rheological behavior of NCC suspension and surfactant-NCC suspensions adequately. The consistency and flow behavior indices varied only marginally with the addition of anionic surfactant Stepanol to NCC suspension. With the addition of cationic surfactant HTAB to NCC suspension, however, a large increase in consistency index was observed. The flow behavior index decreased simultaneously with the addition of HTAB to NCC suspension.
Keywords:
cellulose nanocrystals
; nanocrystalline cellulose
; surfactant
; suspension
; rheology
; viscosity
; power law model
; non-Newtonian
; shear thinning
1. Introduction
Nanocrystalline cellulose (NCC), also referred to as cellulose nanocrystals, is an emerging, cost-effective nanomaterial with numerous applications [1,2,3,4,5,6,7,8,9,10,11,12,13,14]. It has recently gained significant attention as a rheology modifier and thickening agent for the matrix phase of emulsions and suspensions, owing to its surface charge and elongated shape with high aspect ratio [3]. NCC is derived from cellulose, the most abundant organic polymer on Earth sourced from plants like wood, cotton, and agricultural residues. It is typically produced through controlled acid hydrolysis of cellulose fibers [10,11,12,13,14]. The cellulose fibers are treated with acids such as sulfuric acid or hydrochloric acid, which preferentially hydrolyze the amorphous regions of the cellulose, leaving behind the crystalline regions. This process of hydrolysis results in the release of nanocrystals, which are then purified to remove excess acid and other by-products. The nanocrystals produced in this manner have widths typically ranging from 3 to 50 nm and lengths up to several hundred nanometers. The nanocrystals exhibit a highly crystalline structure with glucose units aligned parallel along their longitudinal axis, imparting exceptional mechanical properties such as high tensile strength and stiffness that rival or surpass many synthetic fibers and nanomaterials [1,2]. NCC is also notable for its biodegradability and biocompatibility, making it environmentally friendly alternative to petroleum-based materials. Derived from renewable resources, it offers sustainable advantages across various industries. The surface chemistry of nanocrystals allows for facile functionalization, enabling attachment of different functional groups, polymers, or nanoparticles to tailor their properties for specific applications. This versatility extends their compatibility with diverse matrices and enhances their utility in fields ranging from biomedical to industrial applications [4,5,6,7]. NCC is widely employed as a reinforcing agent in composite materials, enhancing mechanical performance in automotive, aerospace, and packaging sectors [8,9]. It contributes to the development of lightweight, high-performance materials crucial for advanced technologies. NCC is also used in biomedical applications such as drug delivery systems, tissue engineering scaffolds, and wound healing materials due to their biocompatibility and ability to facilitate controlled drug release. The unique thickening properties and rheology (shear-thinning non-Newtonian behavior) further broaden their application scope in coatings, films, suspensions, emulsions, and other formulations requiring viscosity control and stability [6,7,8,9].
Rheology plays an important role in the formulation and characterization of numerous consumer products [15,16,17,18,19]. For example, in the food industry rheology is essential for developing products with desired textures and consistencies, such as sauces, dressings, and dairy products. It helps in the development of products that have the right mouthfeel and stability during processing and storage. Likewise, in the pharmaceutical industry, rheology plays a vital role in the formulation of drugs, their processing, administration, and controlled release of active ingredients. In the cosmetics industry, the rheological properties of the product influence the application and feel of the products such as lotions, creams, and gels. Control of the rheology of products ensures that the products can spread easily and feel pleasant on the skin. Overall, rheological characterization bridges fundamental science and practical applications. By understanding the flow and deformation behavior of materials, scientists and engineers can design and optimize products and processes in terms of performance, quality, and user experience.
The addition of NCC can significantly alter the viscous behavior and rheology of liquids, often imparting shear-thinning or pseudoplastic behavior to liquids, where viscosity decreases with an increase of shear rate [3,20]. The shear-thinning behavior of material is beneficial for applications requiring easy processing and stable storage. Note that cellulose nanocrystals generally carry a negative surface charge due to sulfate or carboxylate groups introduced during the hydrolysis process. The electrical repulsion between the nanocrystals prevents them from coming too close to forming aggregates. However, under certain conditions, the high aspect ratio and surface interactions of NCC favor the formation of a network structure in liquids resulting in gel-like behavior even at very low NCC concentrations (0.5 wt%) [21].
In the formulation of many products of commercial importance, both thickeners and surfactants are utilized due to one reason or another. Thus, it is important to understand the interactions between various additives for the robust design and formulation of products. In this work, we explored the interactions between NCC and ionic surfactants (cationic as well as anionic) in the aqueous phase. To our knowledge, this is the first study to report the influence of ionic surfactants on the rheological behavior of NCC suspension. The surface tension and conductivity measurements were simultaneously carried out to see how they are influenced by the addition of surfactants to NCC suspension.
2. Materials and Methods
2.1. Chemicals
Nanocrystalline cellulose, referred to as NCC, was obtained from CelluForce Inc. (Windsor, QC, Canada) in the form of a dry white powder under the trade name of CelluRods 100P. The mean length of the rod-shaped nanocrystals of NCC was 76 nm and the mean width was 3.4 nm [].
Sodium lauryl sulfate, an anionic surfactant, was supplied as a dry white powder under the trade name of Stepanol WA-100 by Stepan Company, Northfield, IL, USA. It is referred to as Stepanol in the paper. The chemical structure of the surfactant is CH3(CH2)10 CH2OSO3Na. It is used as a foaming agent and mouth dispersant in dentifrices. In powdered formulations, it is used as hand cleaner and powdered bath. It is also used in liquid hand soaps and shampoos.
Hexadecyltrimethylammonium bromide, a cationic surfactant, was supplied as a dry white powder by Sigma-Aldrich. The chemical structure of the surfactant is CH3(CH2)15N(Br)(CH3)3. It is referred to as HTAB in the paper. HTAB is mainly used as cosmetics fungicide, softener, emulsifier and antistatic agent.
2.2. Preparation of NCC Dispersion and Surfactant-NCC Mixtures
The NCC dispersion was prepared at room temperature (22 ± 1 °C) at a fixed NCC concentration of 1 wt% in a batch of approximately 1 kg by adding the required amount of NCC to deionized water. The mixing was achieved using a using a variable-speed Gifford-Wood homogenizer (Model 1-L). The mixing was carried out for about 1 hour at appropriate speed to ensure complete dispersion of nanocrystals.
The surfactant-NCC mixtures were prepared at room temperature by adding the known amounts of surfactant to the NCC dispersion and carrying out the mixing using the homogenizer at a gentle speed for about 1 hour. The surfactant-NCC mixtures were prepared in surfactant concentration increments of 50 ppm by adding more surfactant to an existing surfactant-NCC mixture and carrying out the mixing. The surfactant concentration varied in the range of 0-500 ppm. Care was taken not to entrap any air in the dispersion during the homogenization process.
The NCC dispersion and surfactant-NCC mixtures were cooled to room temperature before doing any measurements.
2.3. Measurement of Steady Rheology of NCC Dispersion and Surfactant-NCC Mixtures
A Fann co-axial cylinder viscometer was used to do the rheological measurements. The outer cylinder (rotor) of the viscometer rotated while the inner cylinder (bob) was kept stationary. The inner cylinder had a radius of 1.72 cm and the outer cylinder had a radius of 1.84 cm resulting in a shear gap of width 0.12 cm. The length of the bob was 3.8 cm. The rotational speed could be varied from 0.9 to 600 rpm. Calibration of the viscometer was done using viscosity standards of known viscosities. All measurements of viscosities were carried out at room temperature
2.4. Measurement of Surface Tension of NCC Dispersion and Surfactant-NCC Mixtures
The surface tension of NCC dispersion and surfactant-NCC mixtures was carried out using the pendant drop method with a smartphone-based pendant drop tensiometer manufactured by Droplet Lab, Markham, ON, Canada. A pendant droplet of aqueous phase (NCC or surfactant-NCC mixture) was generated at the tip of a stainless-steel needle (1.8 mm diameter) connected to a 500 µL Hamilton® gastight syringe (Model 1750 TPLT). The droplet was dispensed using a screw-driven plunger for precise control of flow rate and drop formation. The pendant droplet thus formed was imaged at high resolution using a smartphone camera and analyzed using specialized software. From the drop shape analysis, the software was able to calculate the surface tension of each solution numerically by fitting the droplet profile with the Young–Laplace equation [22]. The measurement for each fluid was performed 30 times to ensure precision and reproducibility and an average value was calculated. All measurements were done at room temperature. Figure 1 shows smartphone-based pendant drop tensiometer.
2.5. Measurement of Electrical Conductivity of NCC Dispersion and Surfactant-NCC Mixtures
The electrical conductivity of NCC dispersion and surfactant-NCC mixtures was measured at room temperature using a Thermo Orion 3 Star conductivity meter (Thermo Fischer Scientific Inc., Beverly, MA, USA).
2.6. Size Distribution of Cellulose Nanocrystals (NCC)
To determine the size distribution of cellulose nanocrystals (NCC), dynamic light scattering (DLS) technique was used. The measurements were carried out using a Zetasizer Nano ZS90 instrument manufactured by Malvern Instruments Ltd. For data acquisition and analysis, the Zetasizer 6.20 software was used. The dilute suspensions of NCC in water were tested in ZEN0112 low-volume disposable cuvettes and analyzed at a standard temperature of 25°C. A 120-second period of equilibration was observed prior to analysis to ensure optimal sample stability.
3. Results and Discussion
3.1. Size Distribution of Cellulose Nanocrystals (NCC)
Figure 2 shows the AFM (atomic force microscopy) image of cellulose nanocrystals [3]. Clearly, the nanocrystals are rod-shaped.
Figure 3 shows the DLS data for NCC suspension at NCC concentration of 0.05 wt%. The size distributions are shown for both number and intensity- based measurements. The number distribution (Figure 3a) shows only one peak whereas the intensity distribution (Figure 3b) shows several peaks due to aggregation of nanocrystals. The number distribution of DLS emphasizes the species with the highest number of particles which are the smaller primary particles whereas the intensity distribution of DLS emphasizes the species with the largest scattering intensity which are the larger aggregated nanocrystals. It should be noted that the DLS measurement gives equivalent hydrodynamic diameter of dispersed species not the actual dimensions especially when the dispersed particles are non-spherical in shape as in the case of NCC.
Figure 4 shows the plots of average diameters of cellulose nanocrystals at different NCC concentrations. Figure 4a data are based on the number distributions of DLS whereas Figure 4b data are based on the intensity distributions of DLS. The average diameter of nanocrystals (primary particles) is approximately 9.9 nm, and the average diameter of aggregated nanocrystals is about 555 nm. Note that the actual dimensions of cellulose nanocrystals based on AFM image (see Figure 1) are as follows: mean length of 76 nm and mean width of 3.4 nm [3].
3.2. Rheology of Suspension of Cellulose Nanocrystals (NCC)
Figure 5 shows the rheological behavior of 1 wt% NCC solution. Viscosity decreases with the increase in shear rate indicating that the NCC dispersion in non-Newtonian pseudoplastic or shear-thinning. Both viscosity versus shear rate and shear stress versus shear rate plots are linear on a log-log scale indicating that the NCC dispersion follows a power law model:
where is shear stress, is shear rate, is consistency index, and is flow behavior index. is a measure of consistency of fluid and is a measure of flow behavior (Newtonian versus non-Newtonian) of fluid. Newtonian fluids have whereas non-Newtonian fluids have different from unity. For pseudoplastic shear-thinning fluids, and for dilatant shear-thickening fluids, . It should be noted that the power law model (Equations (1) and (2)) could be recast in the logarithmic form as follows:
Consequently, the power law fluids exhibit a linear relationship of viscosity versus shear rate and shear stress versus shear rate on a log-log scale. The slope of shear stress versus shear rate plot, that is , is positive and the slope of viscosity versus shear rate plot, that is, is negative.
For the 1 wt% NCC dispersion under consideration, and .
3.3. Influence of Surfactants on the Rheology of NCC Suspension
Figure 6 shows the typical rheological behavior of Stepanol-NCC mixture. With the addition of anionic surfactant Stepanol to NCC dispersion, the solution remains non-Newtonian shear-thinning, that is, the viscosity decreases with the increase in shear rate. Furthermore, the solution follows the power-law behavior as illustrated in Figure 6.
A similar behavior was observed at all Stepanol concentrations. The power-law parameters, consistency index and flow behavior index , for the Stepanol-NCC mixtures are
are summarized in Table 1 and plotted in Figure 7. The flow behavior index decreases slightly with the addition of Stepanol to NCC dispersion. However, the consistency index fluctuates with the addition of Stepanol to NCC dispersion with no clear trend. The range of variation in is: mPa.sn over the surfactant concentration span of 0-500 ppm.
Thus, it can be concluded that the interaction between Stepanol and NCC is weak. The addition of Stepanol to NCC has marginal effect on the rheological properties. As both Stepanol and NCC possess the same electric charge (negative), they repel each other resulting in a stable suspension as shown schematically in Figure 8.
Figure 9 shows the typical rheological behavior of HTAB-NCC mixture. Although the HTAB-NCC mixture remains highly non-Newtonian (shear-thinning) and obeys the power-law model with the addition of cationic surfactant to NCC dispersion, the rheological properties are now strongly influenced by the addition of surfactant to NCC. For example, the consistency index of HTAB-NCC mixture shoots up to 2064.3 mPa.sn at 500 ppm HTAB in comparison of 361.35 mPa.sn for NCC dispersion without any surfactant. Furthermore, the degree of shear-thinning of the mixture also increases as indicated by a decrease in flow behavior index from at 0 ppm HTAB to at 500 ppm HTAB. Table 2 summarizes the power-law model parameters ( and ) for all HTAB-NCC mixtures. As shown in Figure 10, the consistency index remains nearly constant up to a surfactant HTAB concentration of about 300 ppm and then shoots up with further increase in HTAB concentration. The flow behavior index is also nearly constant up to HTAB concentration of 300 ppm and then drops significantly with further increase in HTAB concentration making the mixture more shear-thinning. The viscosity versus shear rate plots of HTAB-NCC mixtures are shown in Figure 11 for different HTAB concentrations. As expected, the viscosities increase sharply with the increase in HTAB concentration especially at low shear rates.
The sharp increase in consistency or viscosity of HTAB-NCC mixtures with the addition of HTAB above 300 ppm is indicative of the formation of a three-dimensional network structure of cellulose nanocrystals under the influence of cationic surfactant HTAB. As cellulose nanocrystals (negatively charged) and HTAB (positively charged) possess opposite charges, the surfactant molecules neutralize the charge of nanocrystals and become attached to the surface of the nanocrystals. In the absence of any electric repulsion between the cellulose nanocrystals, they favor the formation of a network structure in liquids resulting in gel-like behavior. The gel-like structure in dispersion of charge-neutralized cellulose nanocrystals is depicted schematically in Figure 12.
Figure 13 compares the rheological behaviors of Stepanol-NCC and HTAB-NCC mixtures. There is relatively negligible change in the rheological properties ( and ) of Stepanol-NCC mixtures with the increase in Stepanol concentration. The rheological properties of HTAB-NCC mixtures are also nearly unchanged with the initial increase in surfactant concentration. However, starting at 300 ppm HTAB, the consistency index shoots up and the flow behavior index decreases significantly with further increase in HTAB concentration. The increase in consistency index and the corresponding decrease in flow behavior index are due to the formation of three-dimensional network structure of nanocrystals. Note that all fluids (NCC dispersion, surfactant-NC mixtures) are highly non-Newtonian shear-thinning as shown in Figure 13b. The range of flow behavior index is: . Thus, is way below the Newtonian fluid value of unity.
3.4. Influence of Surfactants on the Electrical Conductivity and Surface Tension of NCC Suspension
The electrical conductivity plots of Stepanol-NCC and HTAB-NCC mixtures are shown in Figure 14. The conductivity of Stepanol-NCC mixture increases linearly with the increase in Stepanol concentration without any break or change in slope (see Figure 14a). This is consistent with the variation of rheological properties of Stepanol-NCC mixture with the increase in Stepanol concentration. No clear trend was observed in the changes of rheological properties (see Figure 13). However, the conductivity plot of HTAB-NCC mixtures show a different behavior (see Figure 14b). The conductivity of HTAB-NCC mixture increases linearly up to about 350 ppm HTAB. At 350 ppm HTAB, a change in the slope of conductivity plot occurs. At HTAB concentrations higher than 350 ppm, the conductivity increases slowly with the increase in HTAB concentration. This is consistent with the rheological data which exhibited a large change around HTAB concentration of 300 ppm. At HTAB concentrations larger than 300 ppm, some of the surfactant molecules migrate to the surface of nanocrystals resulting in charge neutralization and hence we observe a slower increase in conductivity with the increase in HTAB concentration. It should be noted that the cmc (critical micelle concentration) of pure HTAB solutions is reported to be 0.91 mM [23]. This corresponds to 332 ppm. Thus, the changes in the rheological properties of HTAB-NCC mixtures occur when the surfactant concentration exceeds the cmc of pure surfactant.
The surface tension plots of Stepanol-NCC and HTAB-NCC mixtures are shown in Figure 15. As expected, the surface tension decreases with the increase in surfactant concentration. While no break in the surface tension versus surfactant concentration plot is observed in the case of Stepanol-NCC mixtures, a clear break point is observed for HTAB-NCC mixture around 300 ppm surfactant concentration. The surface tension rises at 300 ppm, indicating that the surfactant is migrating to the surface of the cellulose nanocrystals. This is consistent with the rheology and conductivity measurements.
4. Conclusions
Based on the experimental work of this study, the following conclusions can be made:
- The suspension of NCC (cellulose nanocrystals) at 1 wt% is non-Newtonian shear-thinning. The shear stress versus shear rate and viscosity versus shear rate data follow the power-law model.
- The suspensions of mixtures of anionic surfactant (Stepanol) and NCC are non-Newtonian shear-thinning and they follow the power-law model.
- The suspensions of cationic surfactant (HTAB) and NCC are non-Newtonian shear-thinning and they follow the power-law model.
- The addition of anionic surfactant Stepanol to NCC suspension has a weak effect on the rheology of suspension over a surfactant concentration range of 0-500 ppm. There is a negligible change in the flow behavior index and the consistency index fluctuates with no clear trend with the increase in surfactant concentration.
- The conductivity and surface tension plots do not exhibit any break points with the increase in Stepanol concentration of Stepanol-NCC suspensions.
- The addition cationic surfactant HTAB to NCC suspension has a strong effect on the rheology of suspension when the surfactant concentration is increased above 300 ppm. This concentration of surfactant is close to the critical micelle concentration (cmc) of pure surfactant solution known to be 332 ppm. The consistency index shoots up when the surfactant concentration exceeds the cmc. The flow behavior index also decreases when the surfactant concentration exceeds the cmc making the suspension of HTAB-NCC mixture more shear-thinning.
- The conductivity and surface tension plots clearly exhibit break points around the HTAB surfactant concentration of 300 ppm in agreement with the changes in the rheological properties.
- The sharp changes in the rheological properties of suspensions of HTAB-NCC mixtures above the cmc of the surfactant are due to the formation of a three-dimensional network structure of charge neutralized cellulose nanocrystals.
Author Contributions
Conceptualization, R.P.; methodology, R.P. and A.P.; validation, A.P. and R.P..; formal analysis, R.P.; investigation, A.P. and R.P.; resources, R.P.; data curation, A.P. and R.P.; writing—original draft preparation, R.P.; writing—review and editing, R.P.; visualization, R.P.; supervision, R.P.; project administration, R.P.; funding acquisition, R.P. All authors have read and agreed to the published version of the manuscript.
Funding
This research was funded by NSERC Discovery Grant awarded to R.P.
Data Availability Statement
The raw data supporting the conclusions of this article will be made available by the authors on request.
Conflicts of Interest
The authors declare no conflicts of interest.
References
- Moon, R. J.; Beck, S.; Rudie, A. Cellulose Nanocrystals - A material with unique properties and many potential applications, in Postek, M.T.; Moon, R.J.; Rudie, A.W.; Bilodeau, M.A. (Eds), Production and Applications of Cellulose Nanomaterials, Tappi Press, USA, Peachtree Corners, GA, 2013, Chapter 1.
- Owoyokun, T.; Berumen, C.M.P.; Luevanos, A.M.; Cantu, L.; Ceniceros, A.C.L. Cellulose Nanocrystals: Obtaining and Sources of a Promising Bionanomaterial for Advanced Applications. Biointerface Res. Appl. Chem. 2021, 11, 11797–11816. [Google Scholar]
- Kinra, S.; Pal, R. Rheology of Pickering emulsions stabilized and thickened by cellulose nanocrystals over broad ranges of oil and nanocrystal concentrations. Colloids Interfaces 2023, 7, 36. [Google Scholar] [CrossRef]
- Schramm, L.L. Emulsions, Foams, Suspensions, and Aerosols: Microscience and Applications. John Wiley & Sons, New York, 2014.
- Trache, D.; Tarchoun, A.F.; Derradji, M.; Hamidon, T.S.; Masruchin, N.; Brosse, N.; Hussin, M.H. Nanocellulose: From Fundamentals to Advanced Applications. Frontiers in Chemistry 2020, 8, 392. [Google Scholar] [CrossRef] [PubMed]
- Khalid, M.Y.; Arif, Z.U.; Noroozi, R.; Hossain, M.; Ramakrishna, S.; Umer, R. 3D/4D printing of cellulose nanocrystals-based biomaterials: Additives for sustainable applications. Int. J. Biological Macromolecules 2023, 251, 126287. [Google Scholar] [CrossRef] [PubMed]
- Durairaj, A.; Maruthapandi, M.; Saravanan, A.; Luong, J. H. T.; Gedanken, A. Cellulose Nanocrystals (CNC)-Based Functional Materials for Supercapacitor Applications. Nanomaterials 2022, 12, 1828. [Google Scholar] [CrossRef] [PubMed]
- Laghaei, R.; Hejazi, S.M.; Fashandi, H.; Akbarzadeh, S.; Shaghaghi, S.; Shamaei-Kashani, A.; Jahanara, B.; Shahsavari, E. Reinforcement contribution of cellulose nanocrystals (CNCs) to tensile properties and fracture behavior of triaxial E-glass fabric/epoxy composites. Composites Part A 2023, 164, 107258. [Google Scholar] [CrossRef]
- Shen, R.; Xue, S.; Xu, Y.; Liu, Q.; Feng, Z.; Ren, H.; Zhai, H.; Kong, F. Research progress and development demand of nanocellulose reinforced polymer composites. Polymers 2020, 12, 9. [Google Scholar] [CrossRef] [PubMed]
- Mohomane, S.M.; Motloung, S.V.; Koao, L.F.; Motaung, T.E. Effects of acid hydrolysis on the extraction of cellulose nanocrystals (CNCs): A Review. Cellul. Chem. Technol. 2022, 56, 691–703. [Google Scholar] [CrossRef]
- Tang, Y.; Yang, H.; Vignolini, S. Recent Progress in Production Methods for Cellulose Nanocrystals: Leading to More Sustainable Processes. Advanced Sustainable Systems 2022, 6, 2100100. [Google Scholar] [CrossRef]
- Lorenz, M.; Sattler, S.; Reza, M.; Bismarck, A. ; Kontturi, Cellulose nanocrystals by acid vapor: towards more effortless isolation of nanocrystals. Faraday Discuss. 2017, 202, 315. [Google Scholar] [CrossRef] [PubMed]
- Michelin, M.; Gomes, D.G.; Romaní, A.; Polizeli, M.; Teixeira, J. A. Nanocellulose Production: Exploring the Enzymatic Route and Residues of Pulp and Paper Industry. Molecules 2020, 25, 3411. [Google Scholar] [CrossRef] [PubMed]
- George, J.; Sabapathi, S.N. Cellulose nanocrystals: synthesis, functional properties, and applications. Nanotechnol. Sci. Appl 2015, 8, 45–54. [Google Scholar] [CrossRef] [PubMed]
- Rheometry - an overview. Available online: https://www.sciencedirect.com/topics/agricultural-and-biological-sciences/rheometry (accessed on 15 July 2025).
- Banerjee, R.; Ray, S.S. Role of Rheology in Morphology Development and Advanced Processing of Thermoplastic Polymer Materials: A Review. ACS Omega, 2023, 8, 27969–28001. [Google Scholar] [CrossRef] [PubMed]
- Liang, Y.; Cheng, Y.; Wang, J.; Liang, Y.; Cheng, Y.; Wang, J. Real-Time Rheological Measurement Techniques in Plastics Industry. IntechOpen, 2024.
- Rheology in Food Testing – How a Rheometer Works and What It Can Tell You. Available online: http://www.technologynetworks.com/applied-sciences/articles/rheology-in-food-testing-how-a-rheometer-works-and-what-it-can-tell-you-364448 (accessed on 12 July 2025).
- The Importance of Rheology in Material Science and Food Science: How Rheology Shapes Materials. Available online: https://www.aimil.com/blog/the-importance-of-rheology-in-material-science-and-food-science (accessed on 13 July 2025).
- Alizadeh, H.; Pal, R. Steady shear rheology of suspensions of mixtures of starch nanoparticles and cellulose nanocrystals. Nanomaterials 2025, 15, 966. [Google Scholar] [CrossRef] [PubMed]
- Pal, R.; Pattath, K. Rheology of suspensions thickened by cellulose nanocrystals. Nanomaterials 2024, 14, 1122. [Google Scholar] [CrossRef]
- Chen, H.; Muros-Cobos, J.L.; Holgado-Terriza, J.A.; Amirfazli, A. Surface tension measurement with a smartphone using a pendant drop. Colloids Surfaces A 2017, 533, 213–217. [Google Scholar] [CrossRef]
- Fuguet, E.; Rafols, C.; Roses, M.; Bosch, E. Critical micelle concentration of surfactants in aqueous buffered and unbuffered systems. Analytica Chimica Acta 2005, 548, 95–100. [Google Scholar] [CrossRef]
Figure 1.
Smartphone-based pendant drop tensiometer.
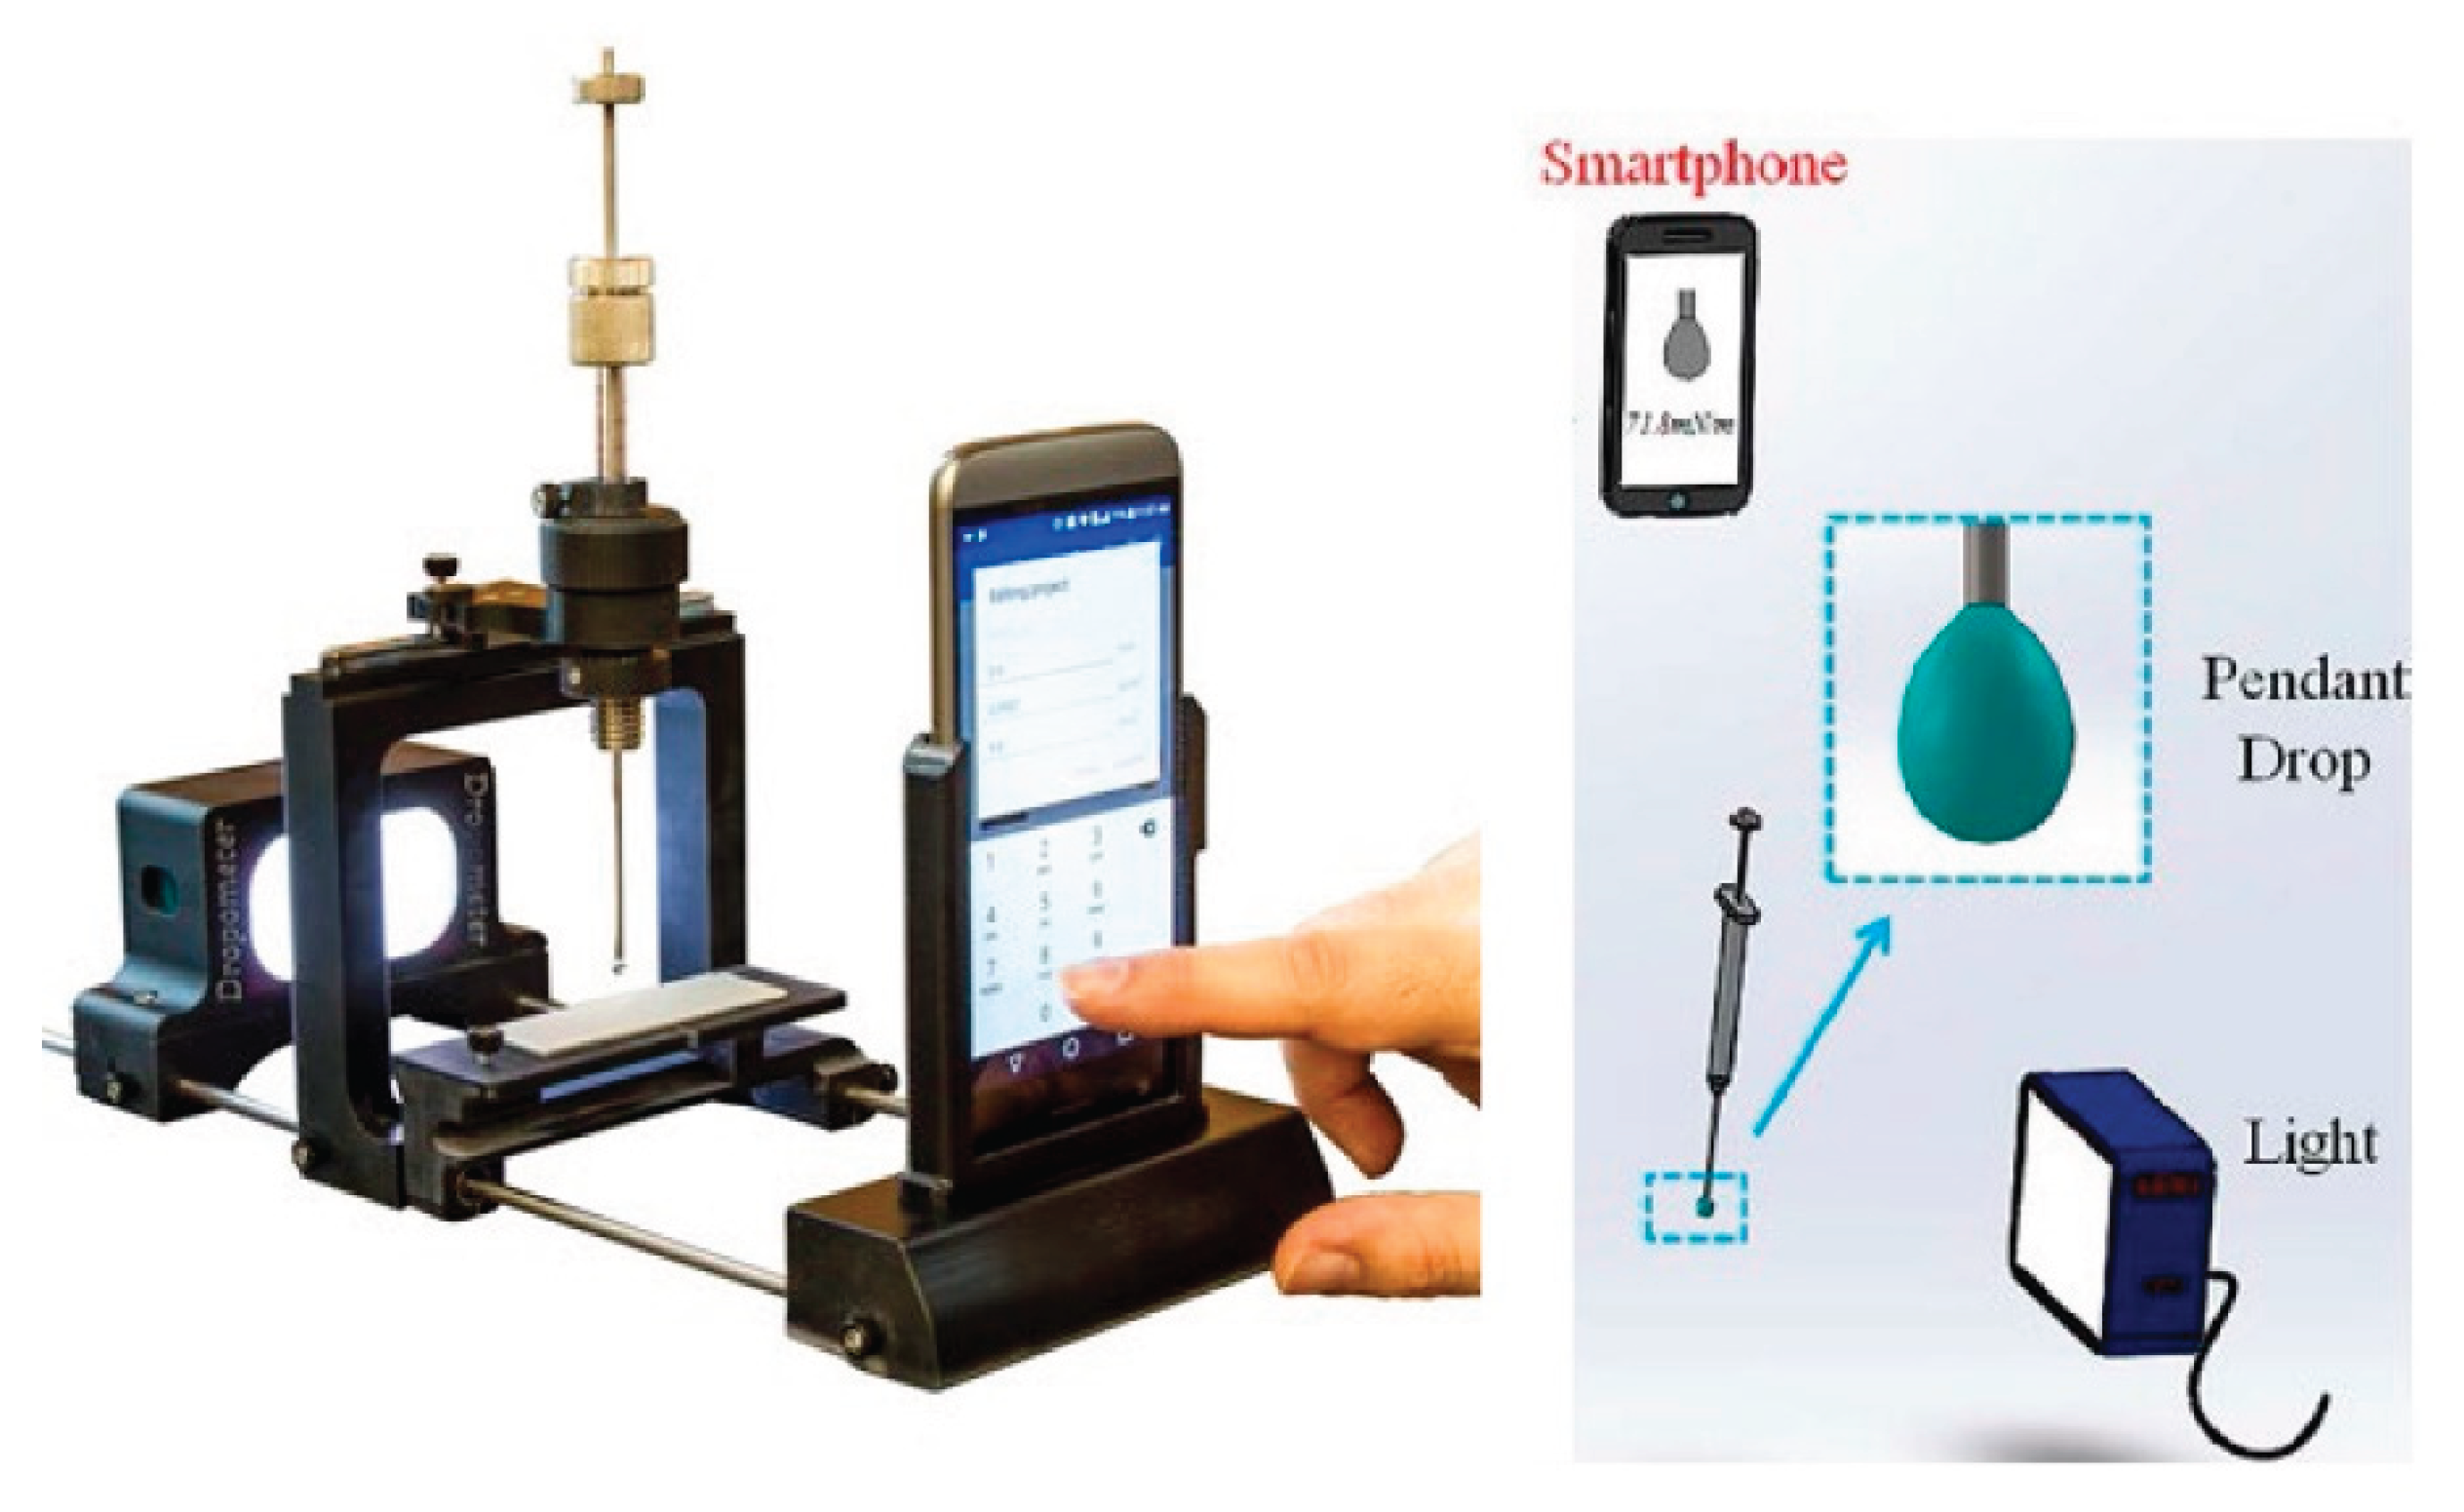
Figure 2.
AFM image of Nanocrystalline cellulose.
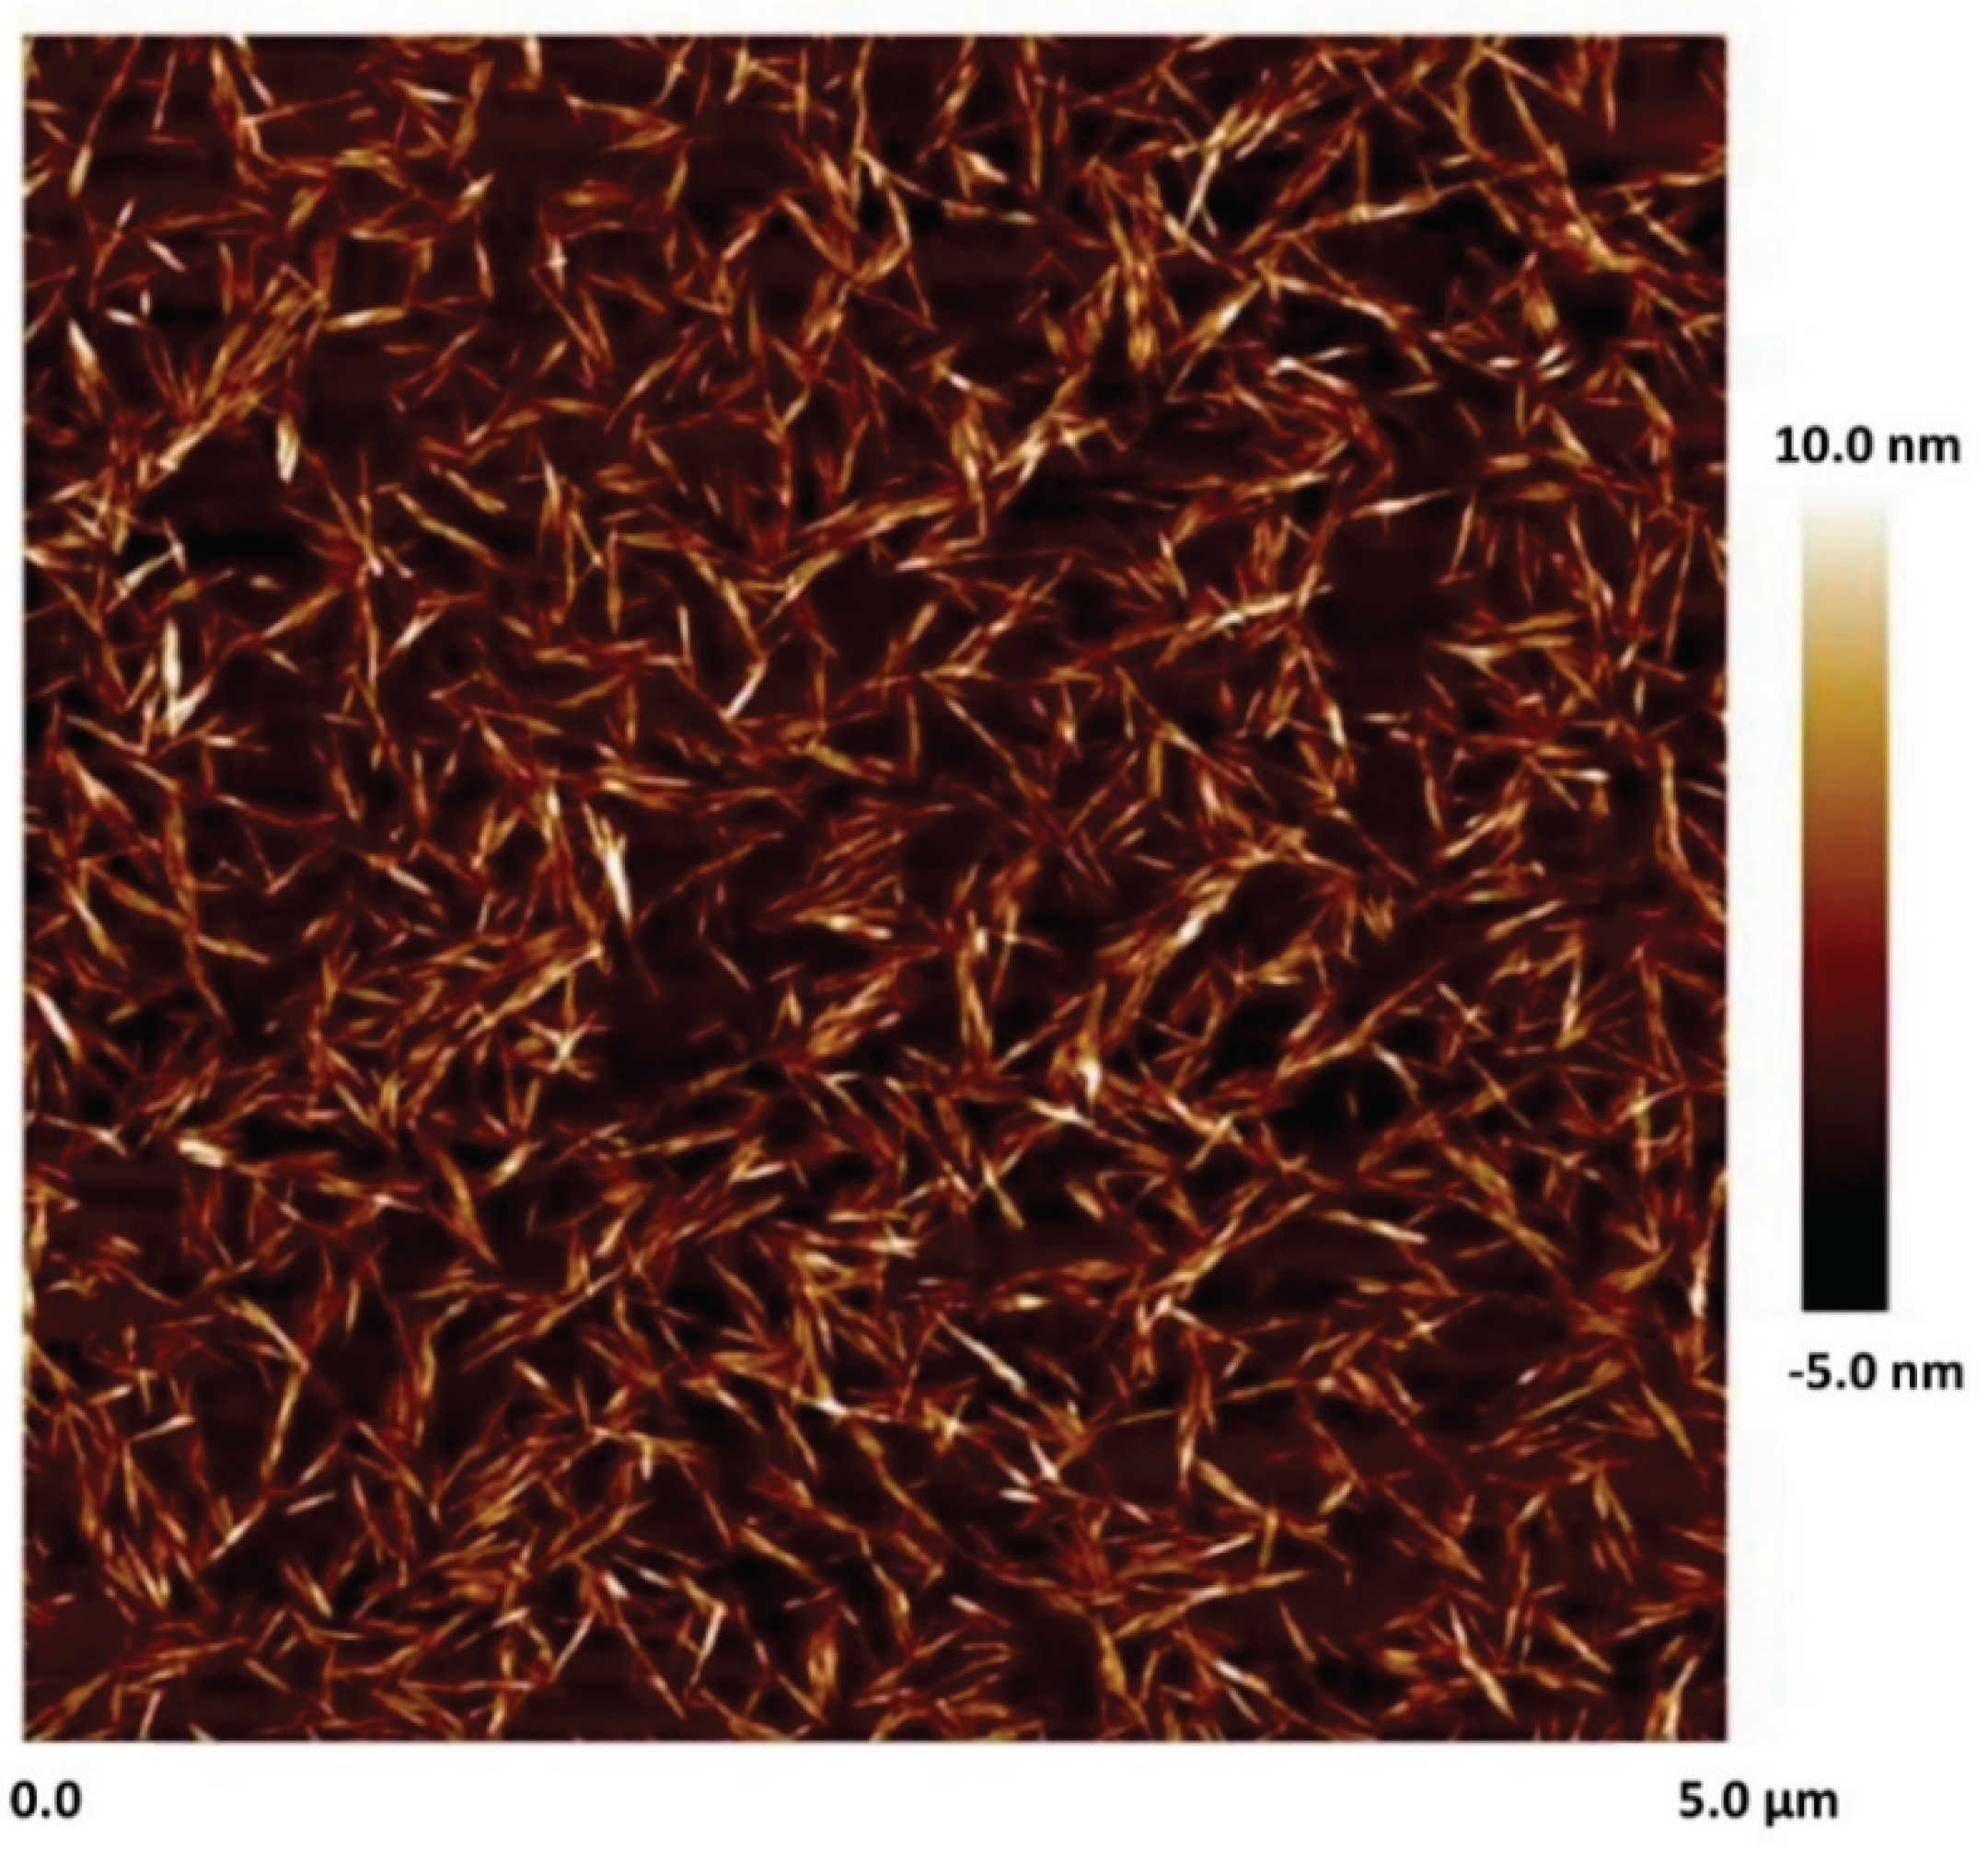
Figure 3.
Size distribution of cellulose nanocrystals at NCC concentration of 0.05 wt%. (a) number distribution of cellulose nanocrystals; (b) intensity distribution of cellulose nanocrystals.
Figure 3.
Size distribution of cellulose nanocrystals at NCC concentration of 0.05 wt%. (a) number distribution of cellulose nanocrystals; (b) intensity distribution of cellulose nanocrystals.
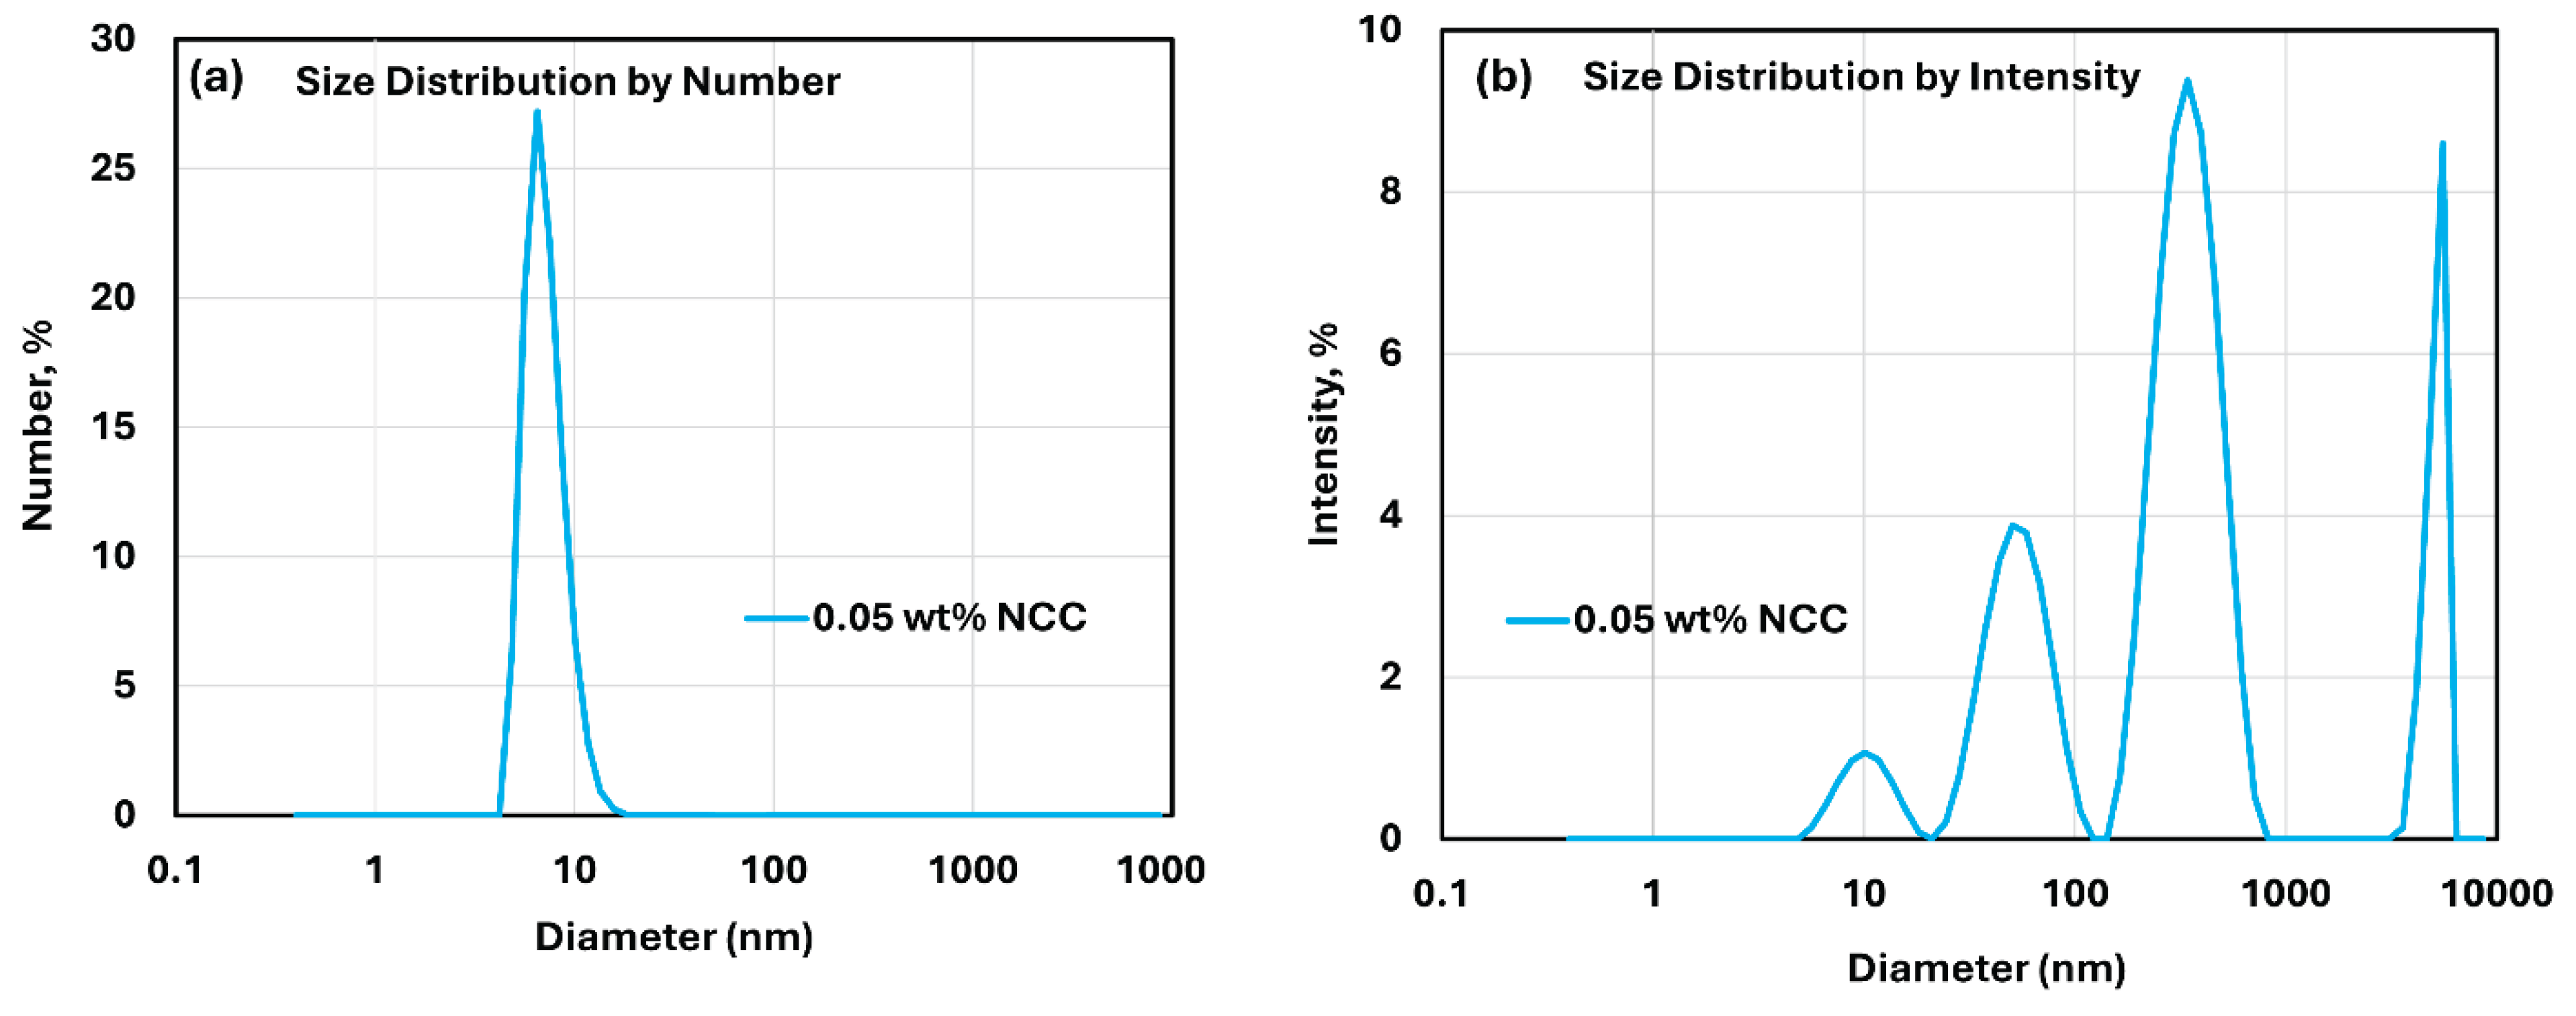
Figure 4.
Variation of average diameter of cellulose nanocrystals with NCC concentration. (a) average diameters based on number distribution of cellulose nanocrystals; (b) average diameters based on intensity distribution of cellulose nanocrystals.
Figure 4.
Variation of average diameter of cellulose nanocrystals with NCC concentration. (a) average diameters based on number distribution of cellulose nanocrystals; (b) average diameters based on intensity distribution of cellulose nanocrystals.
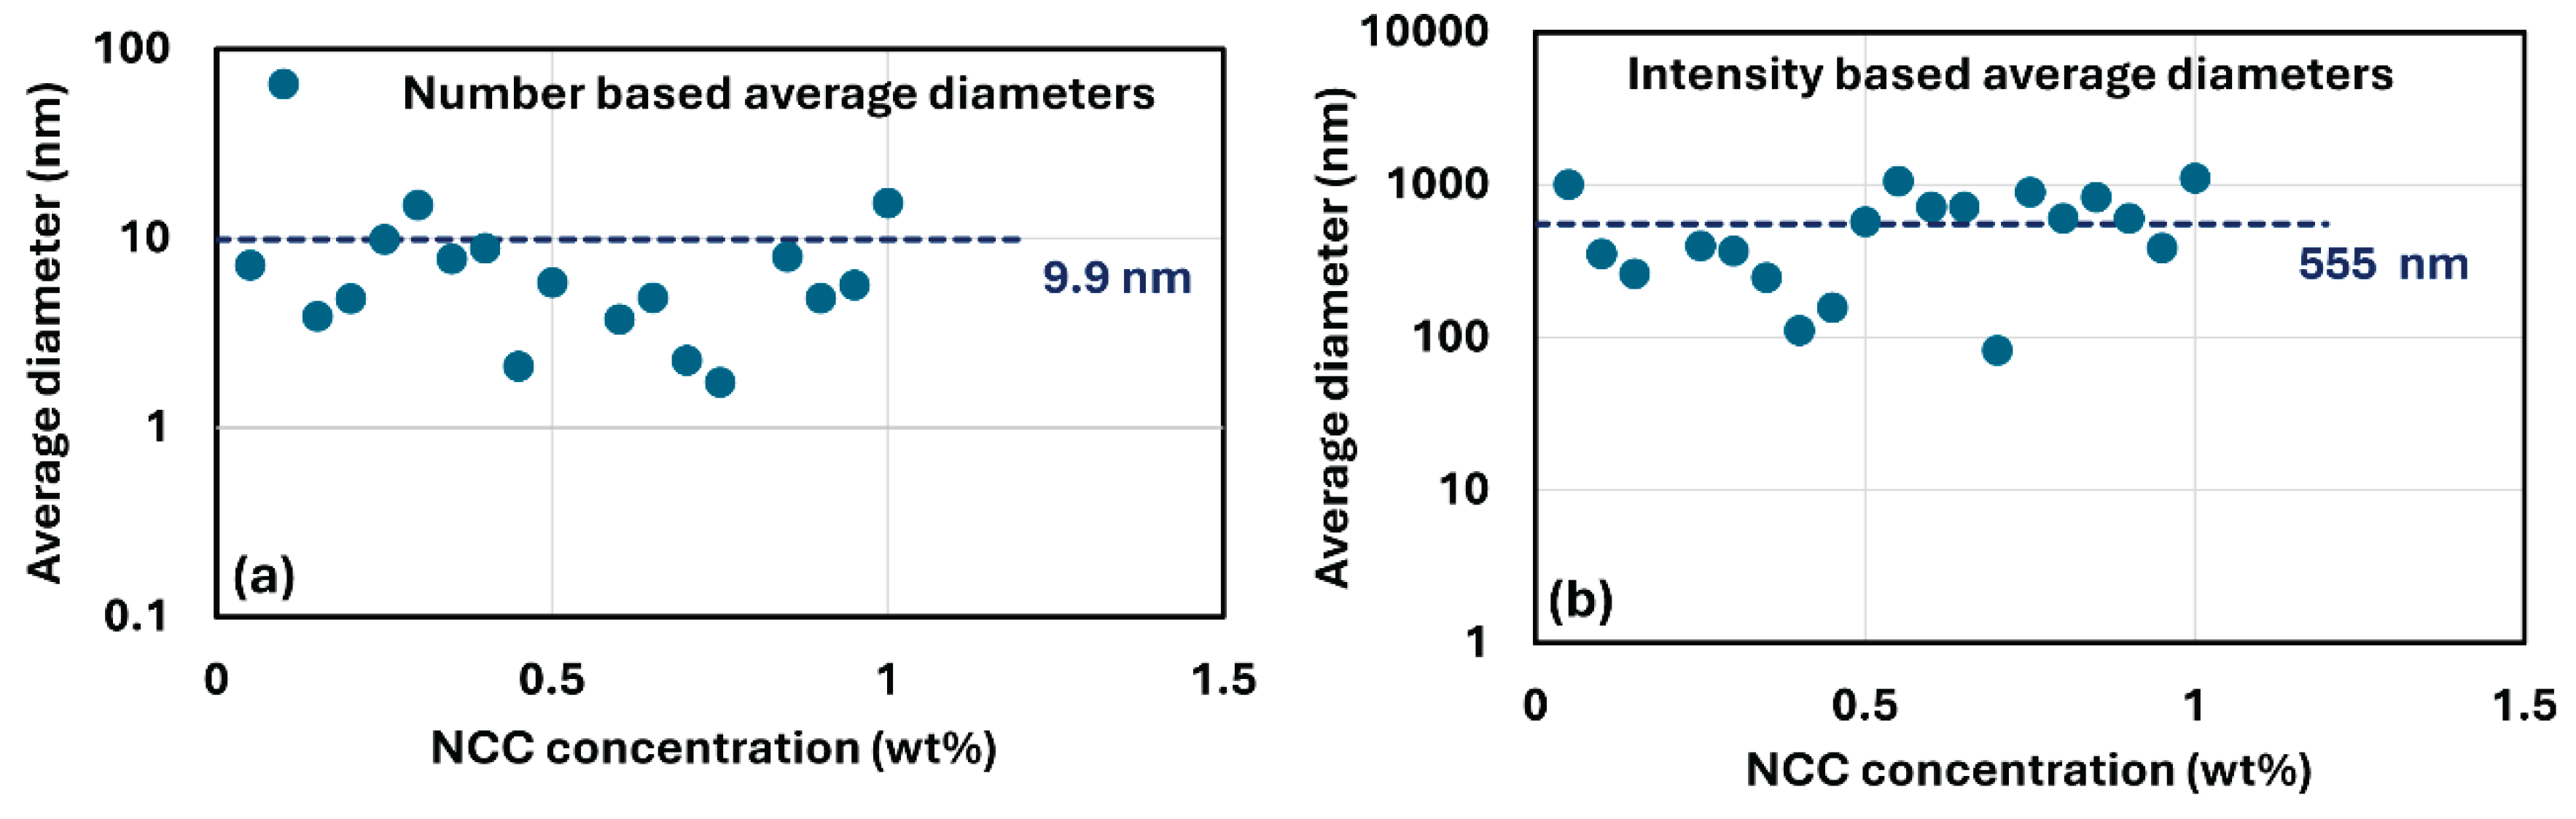
Figure 5.
Rheological behavior of 1 wt% NCC dispersion.
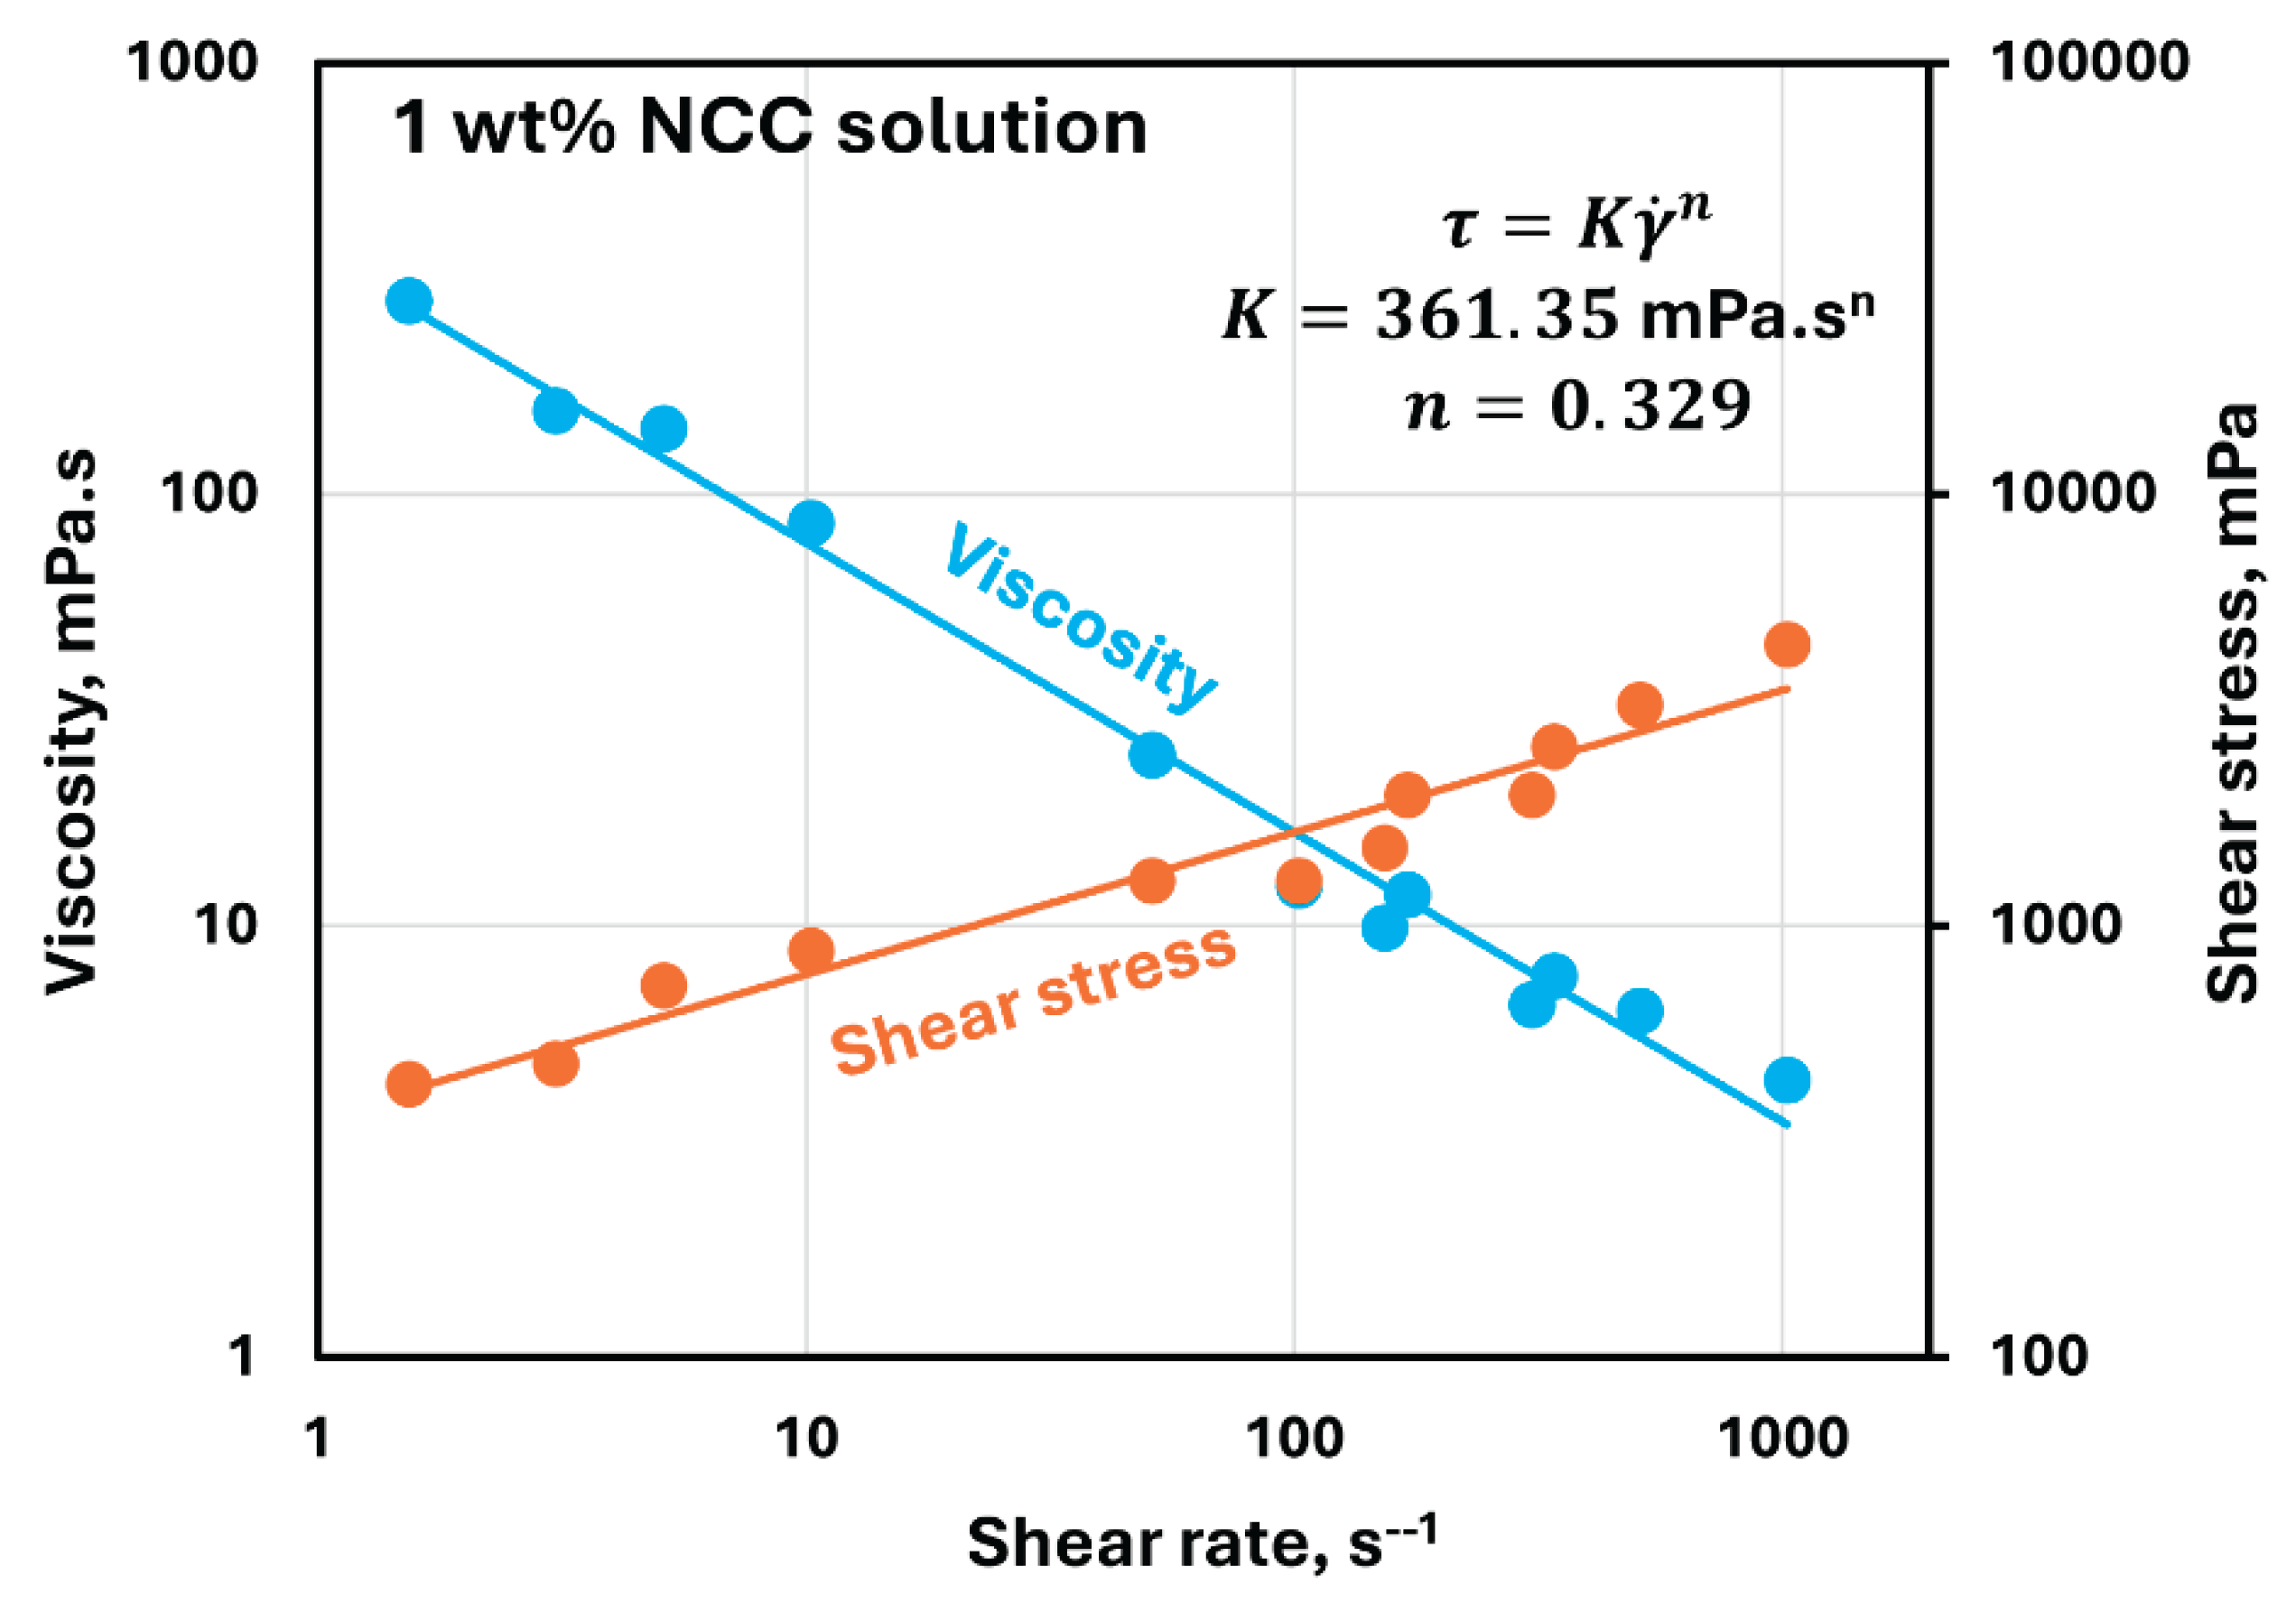
Figure 6.
Rheological behavior of Stepanol-NCC mixture containing 400 ppm Stepanol.
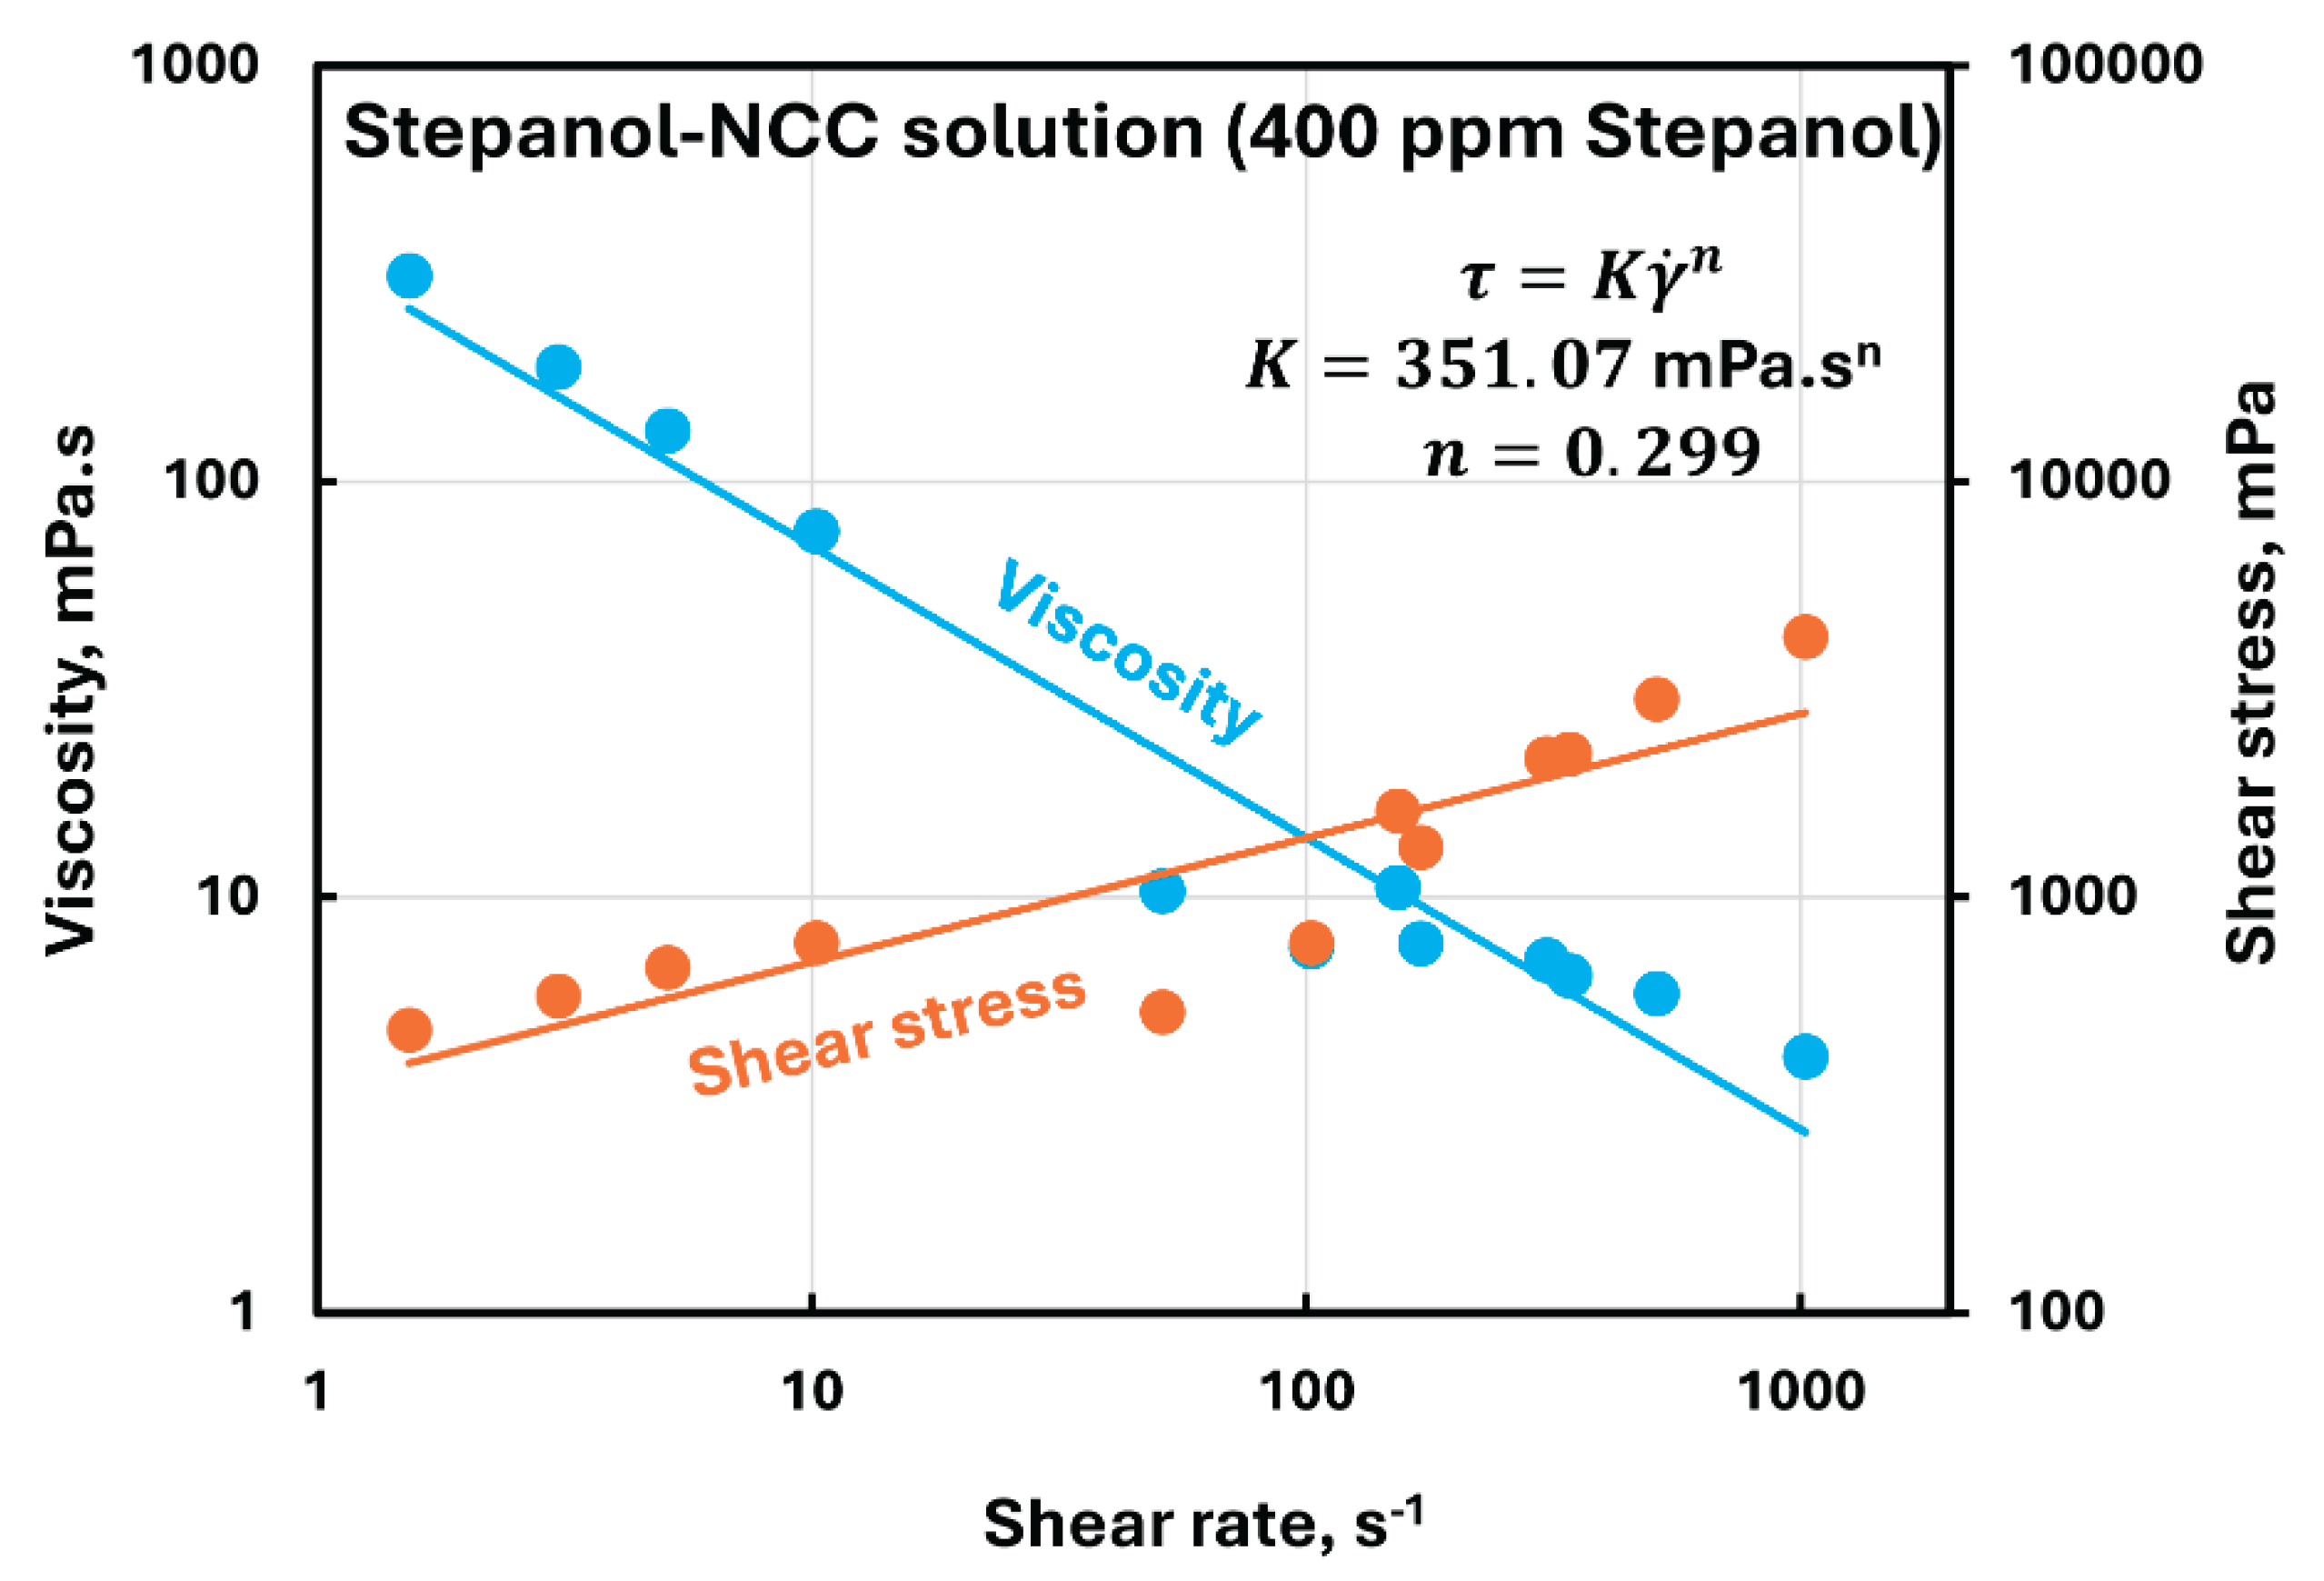
Figure 7.
Variations of consistency and flow behavior indices of Stepanol-NCC mixtures with Stepanol concentration.
Figure 7.
Variations of consistency and flow behavior indices of Stepanol-NCC mixtures with Stepanol concentration.
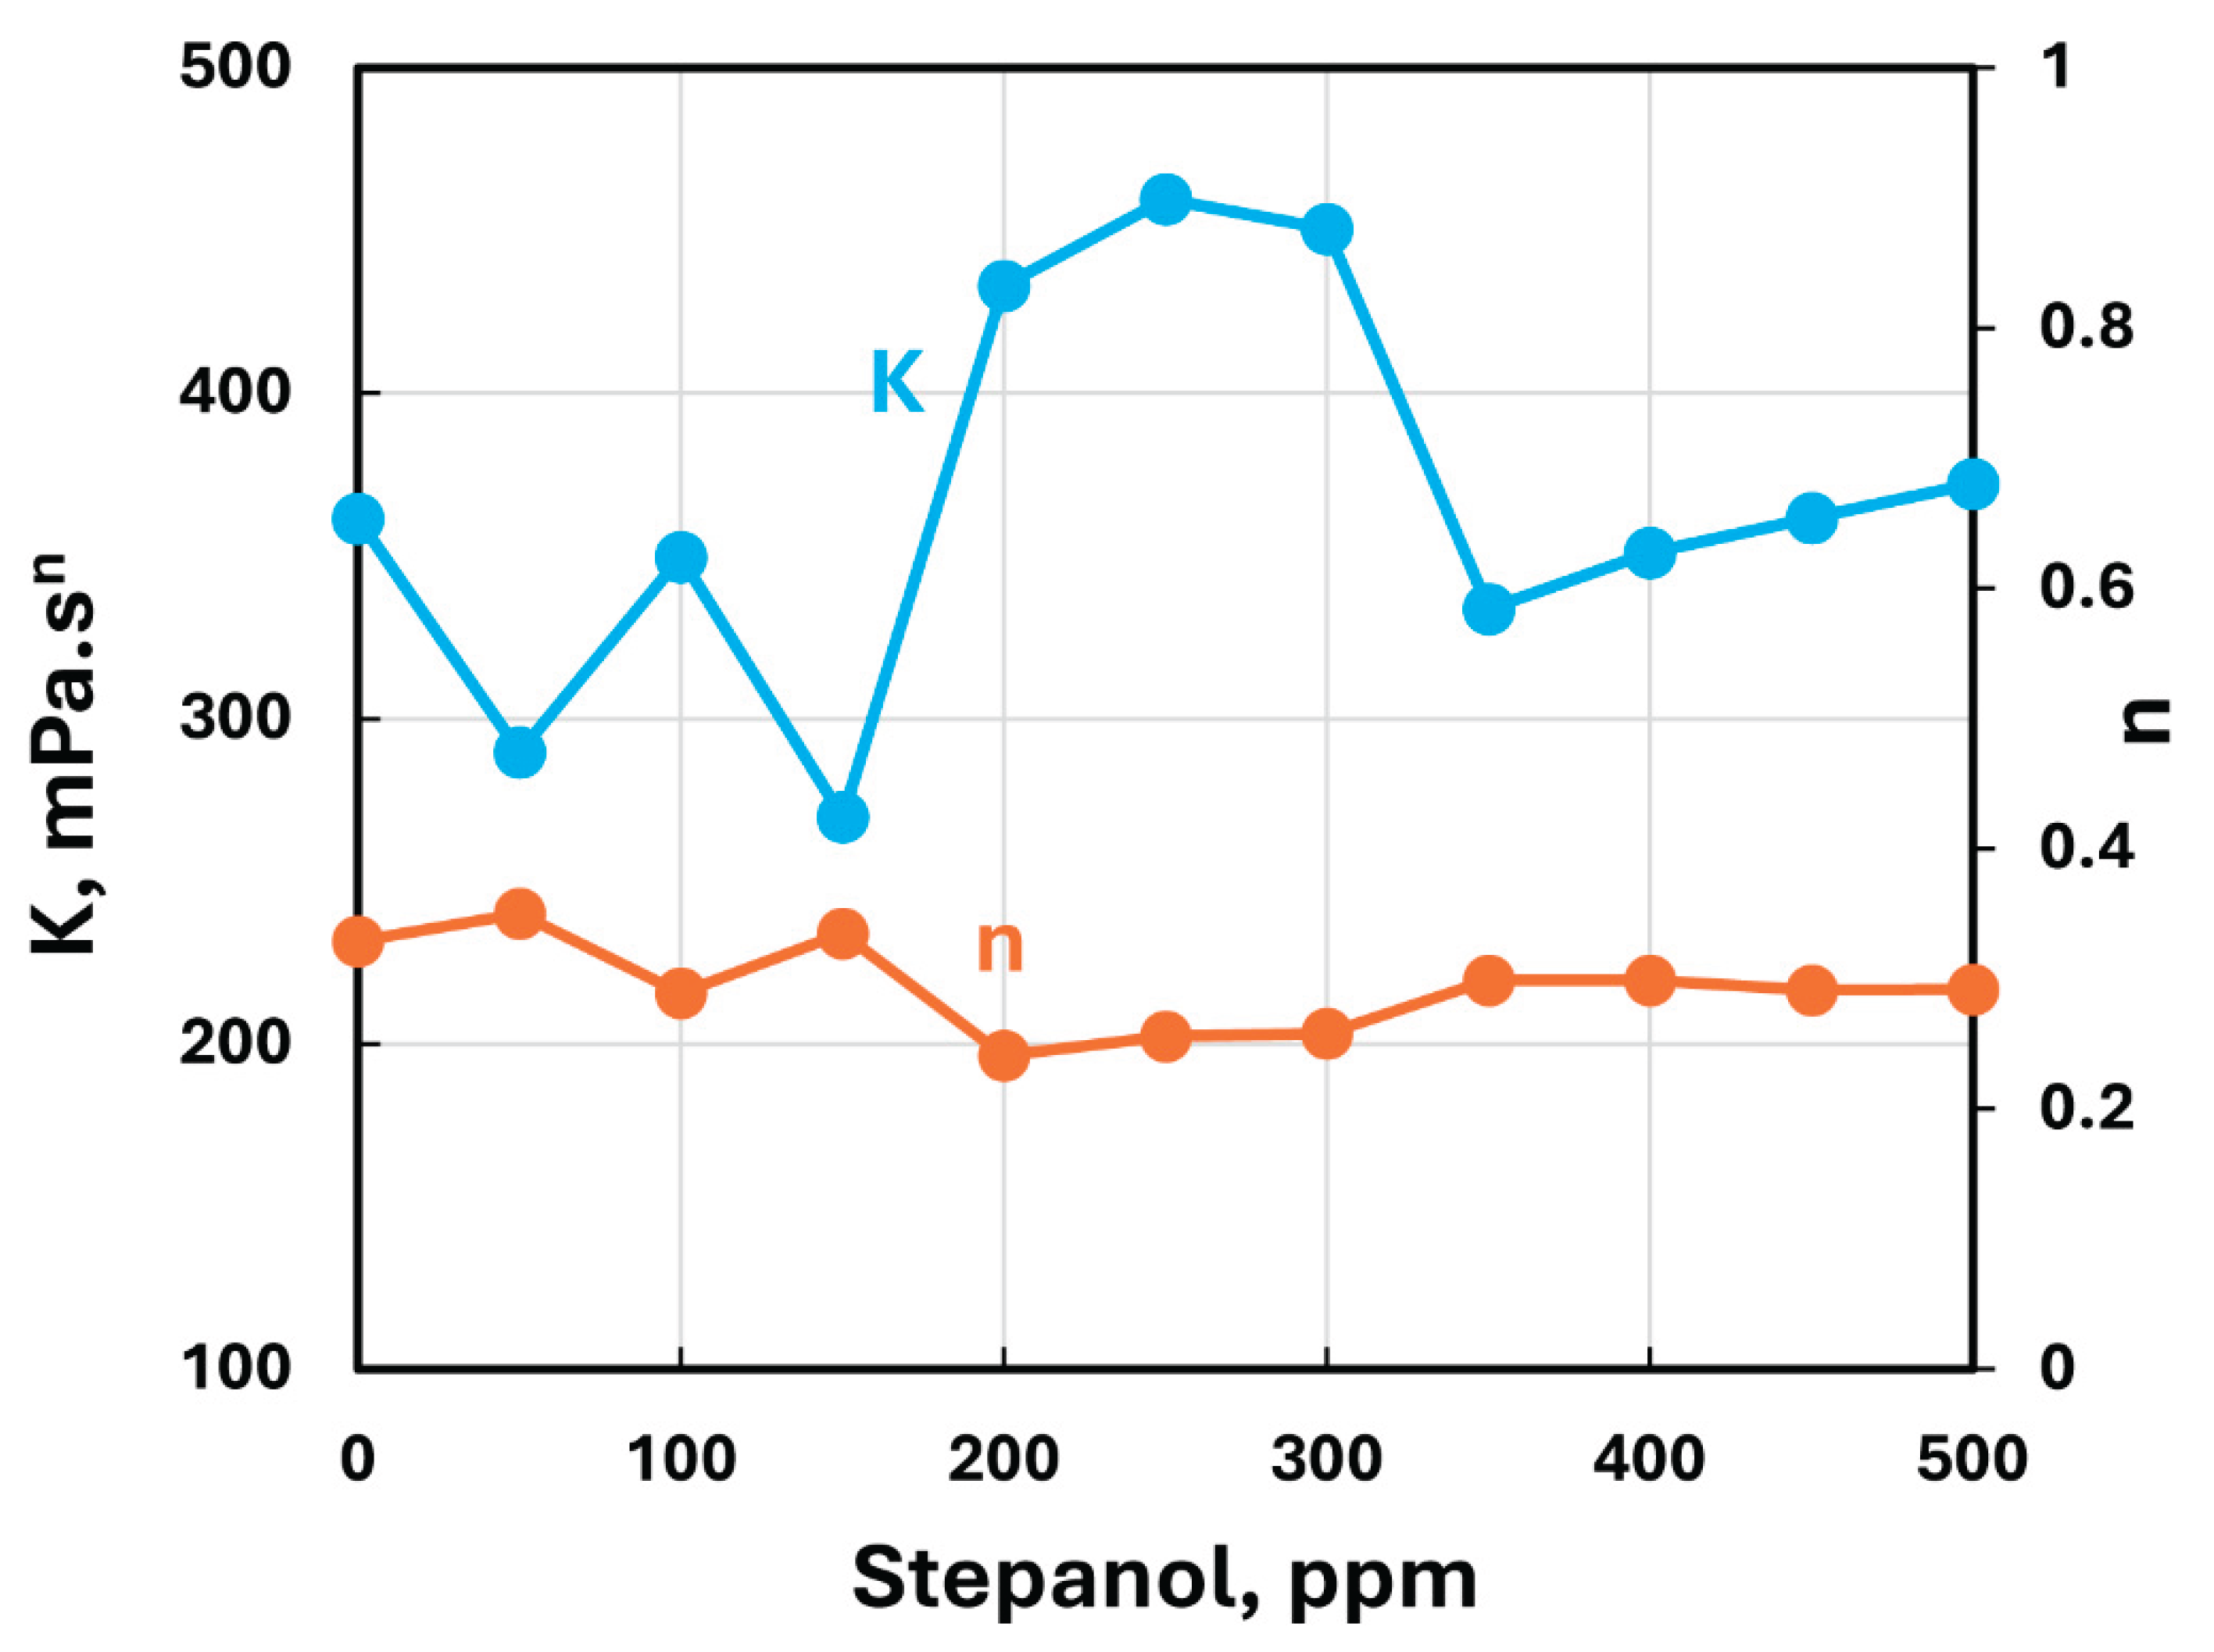
Figure 8.
Stable dispersion of anionic surfactant and cellulose nanocrystals.
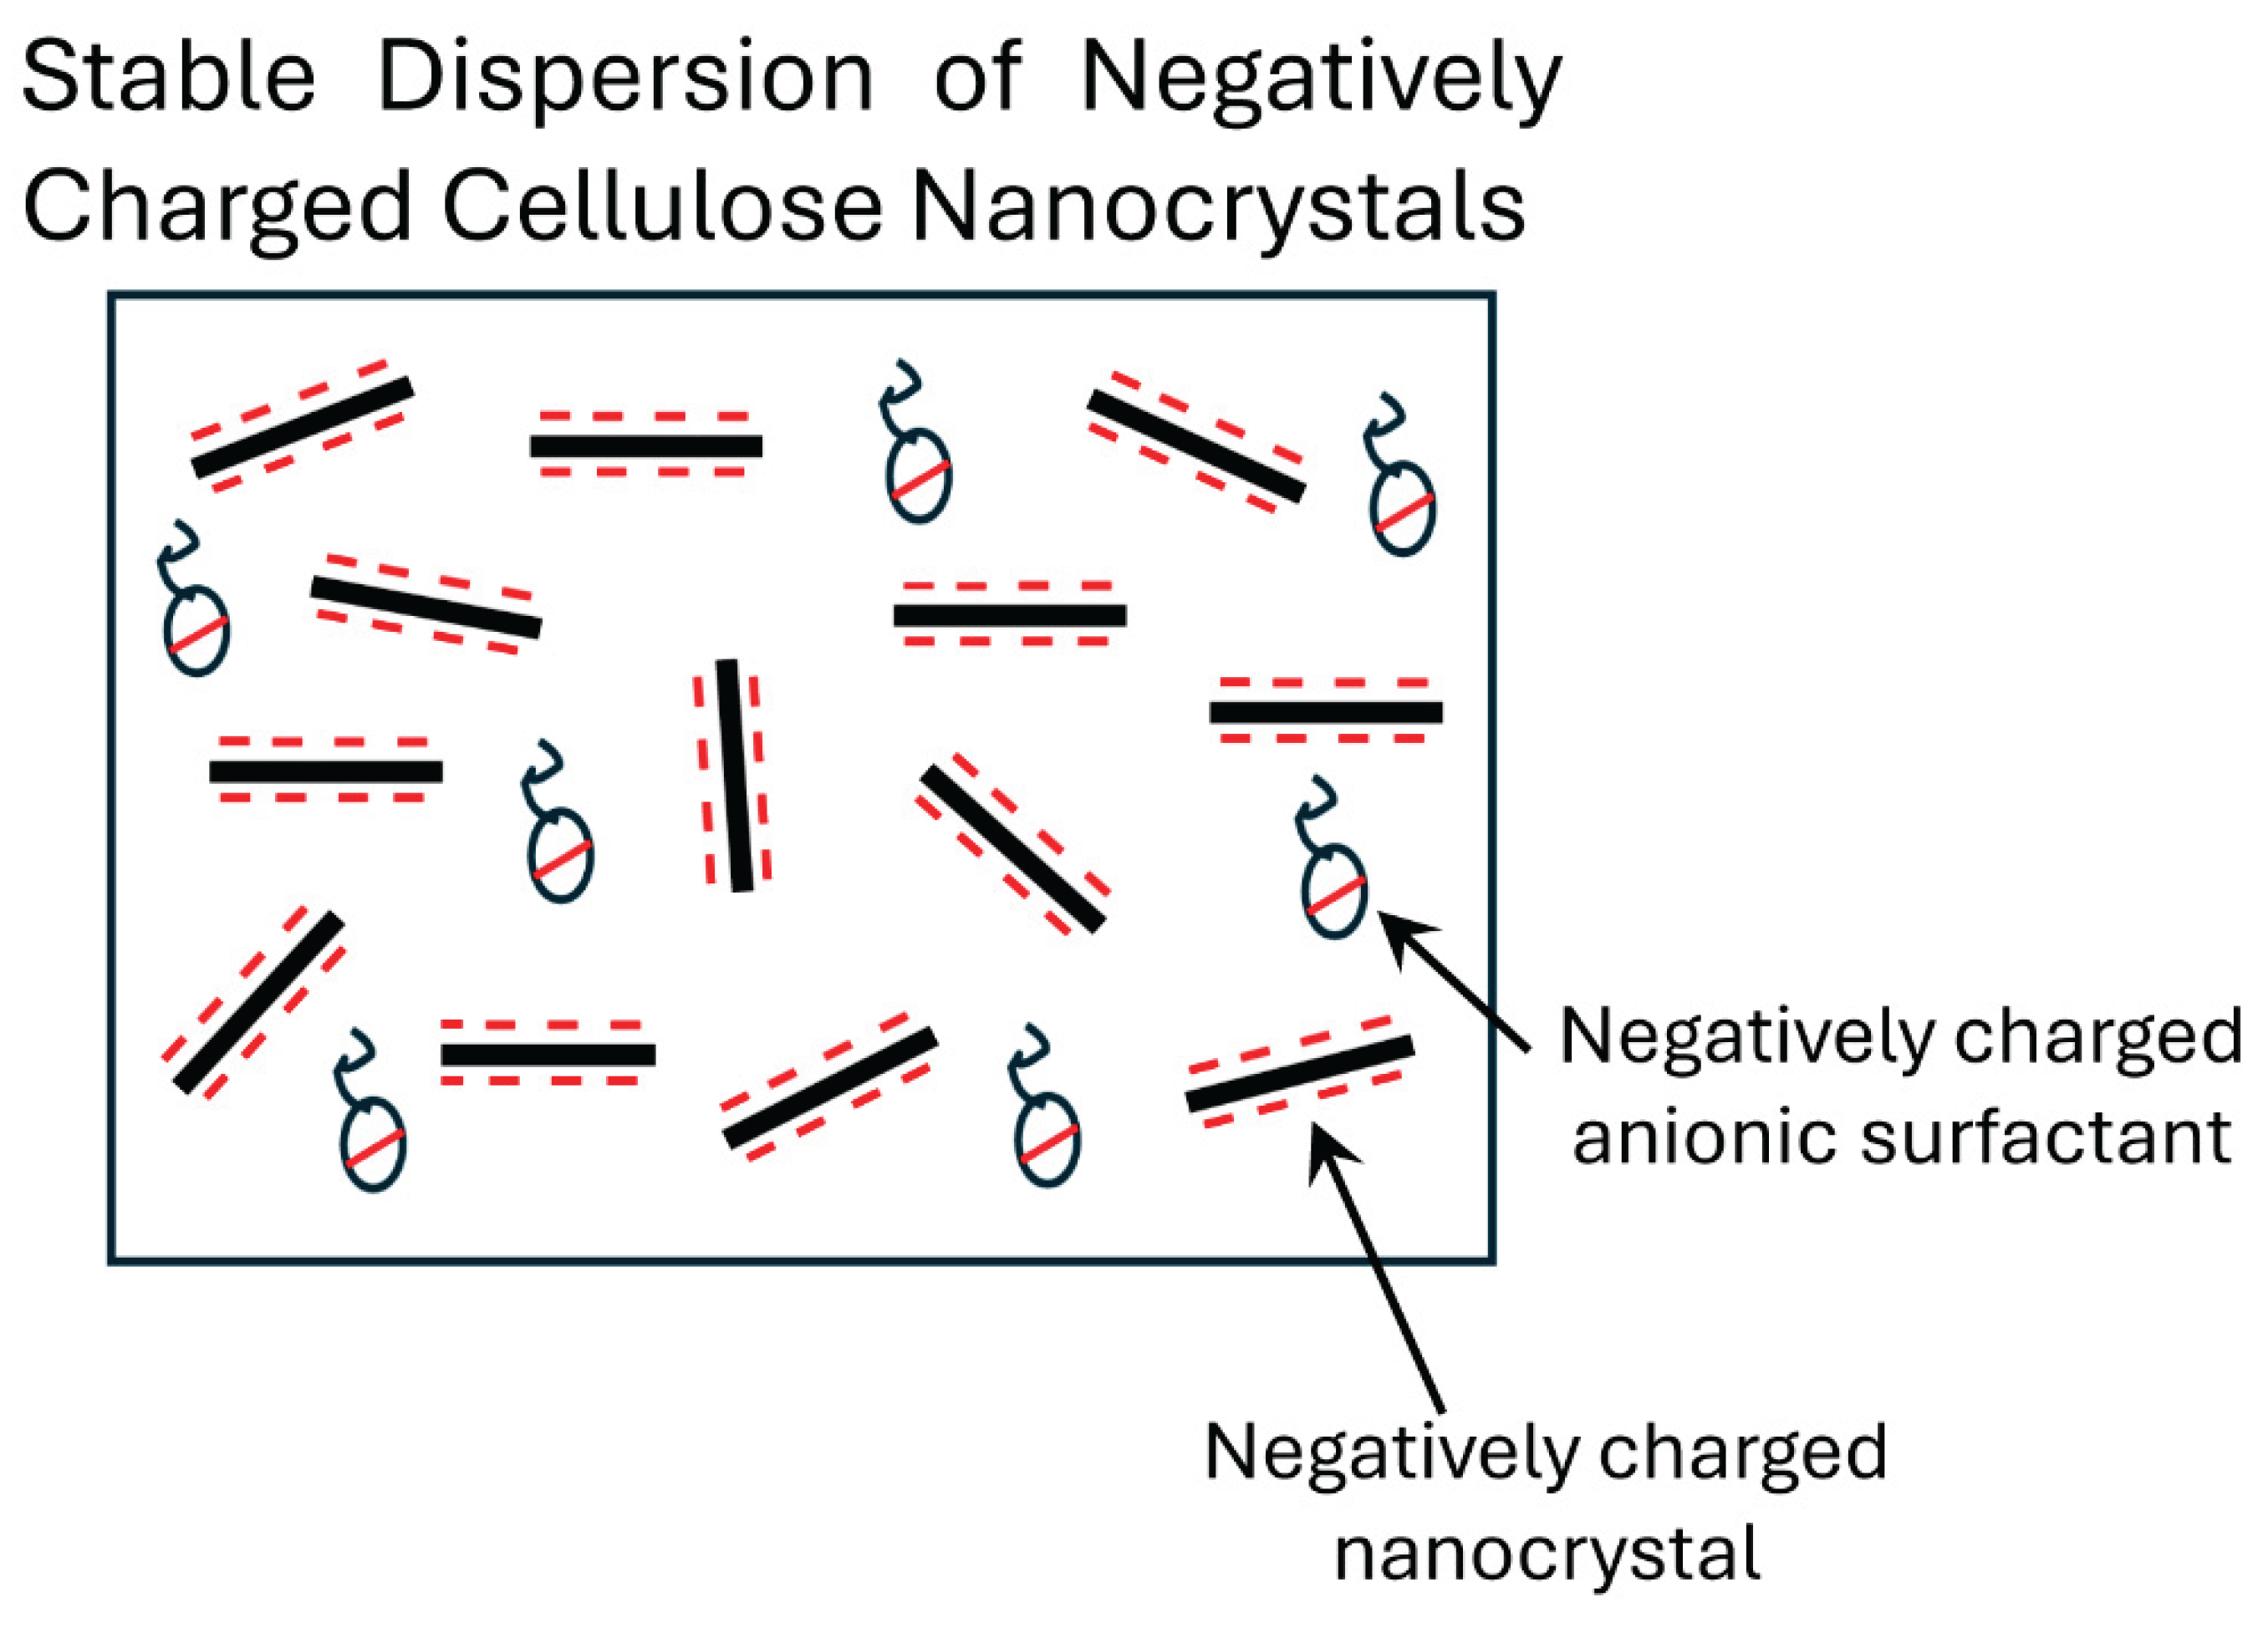
Figure 9.
Rheological behavior of HTAB-NCC mixture containing 500 ppm HTAB.
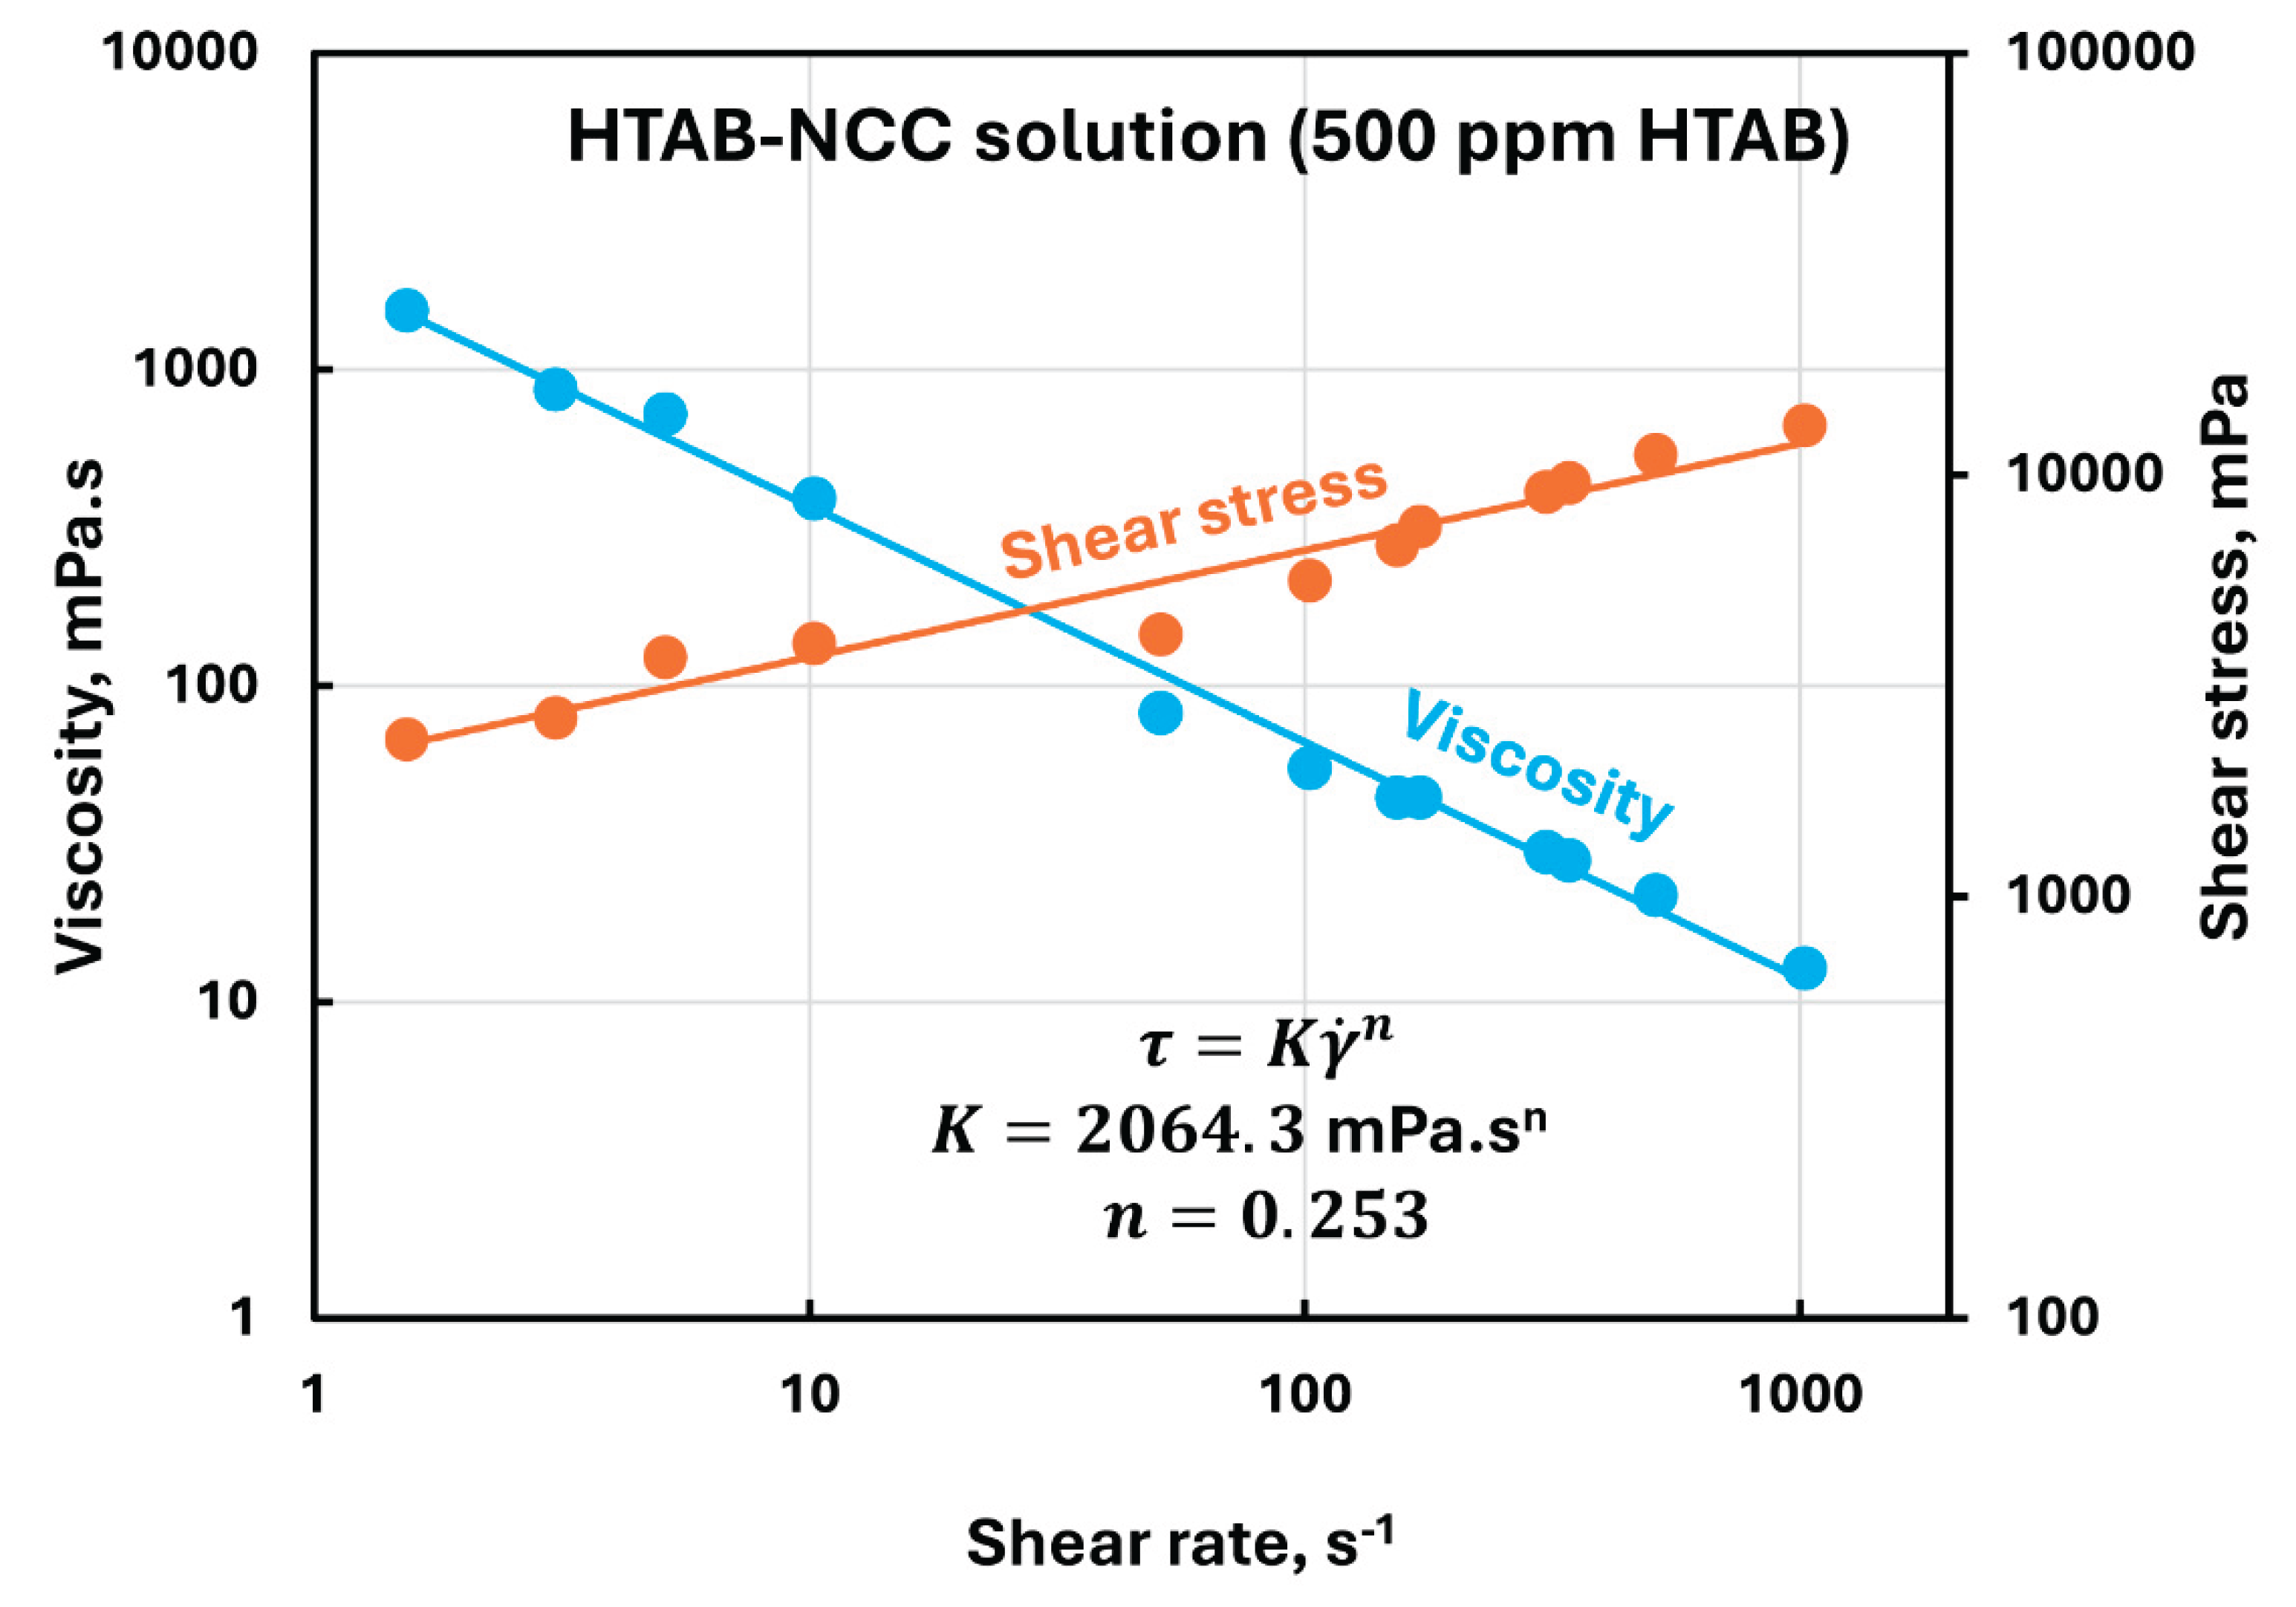
Figure 10.
Variations of consistency and flow behavior indices of HTAB-NCC mixtures with HTAB concentration.
Figure 10.
Variations of consistency and flow behavior indices of HTAB-NCC mixtures with HTAB concentration.
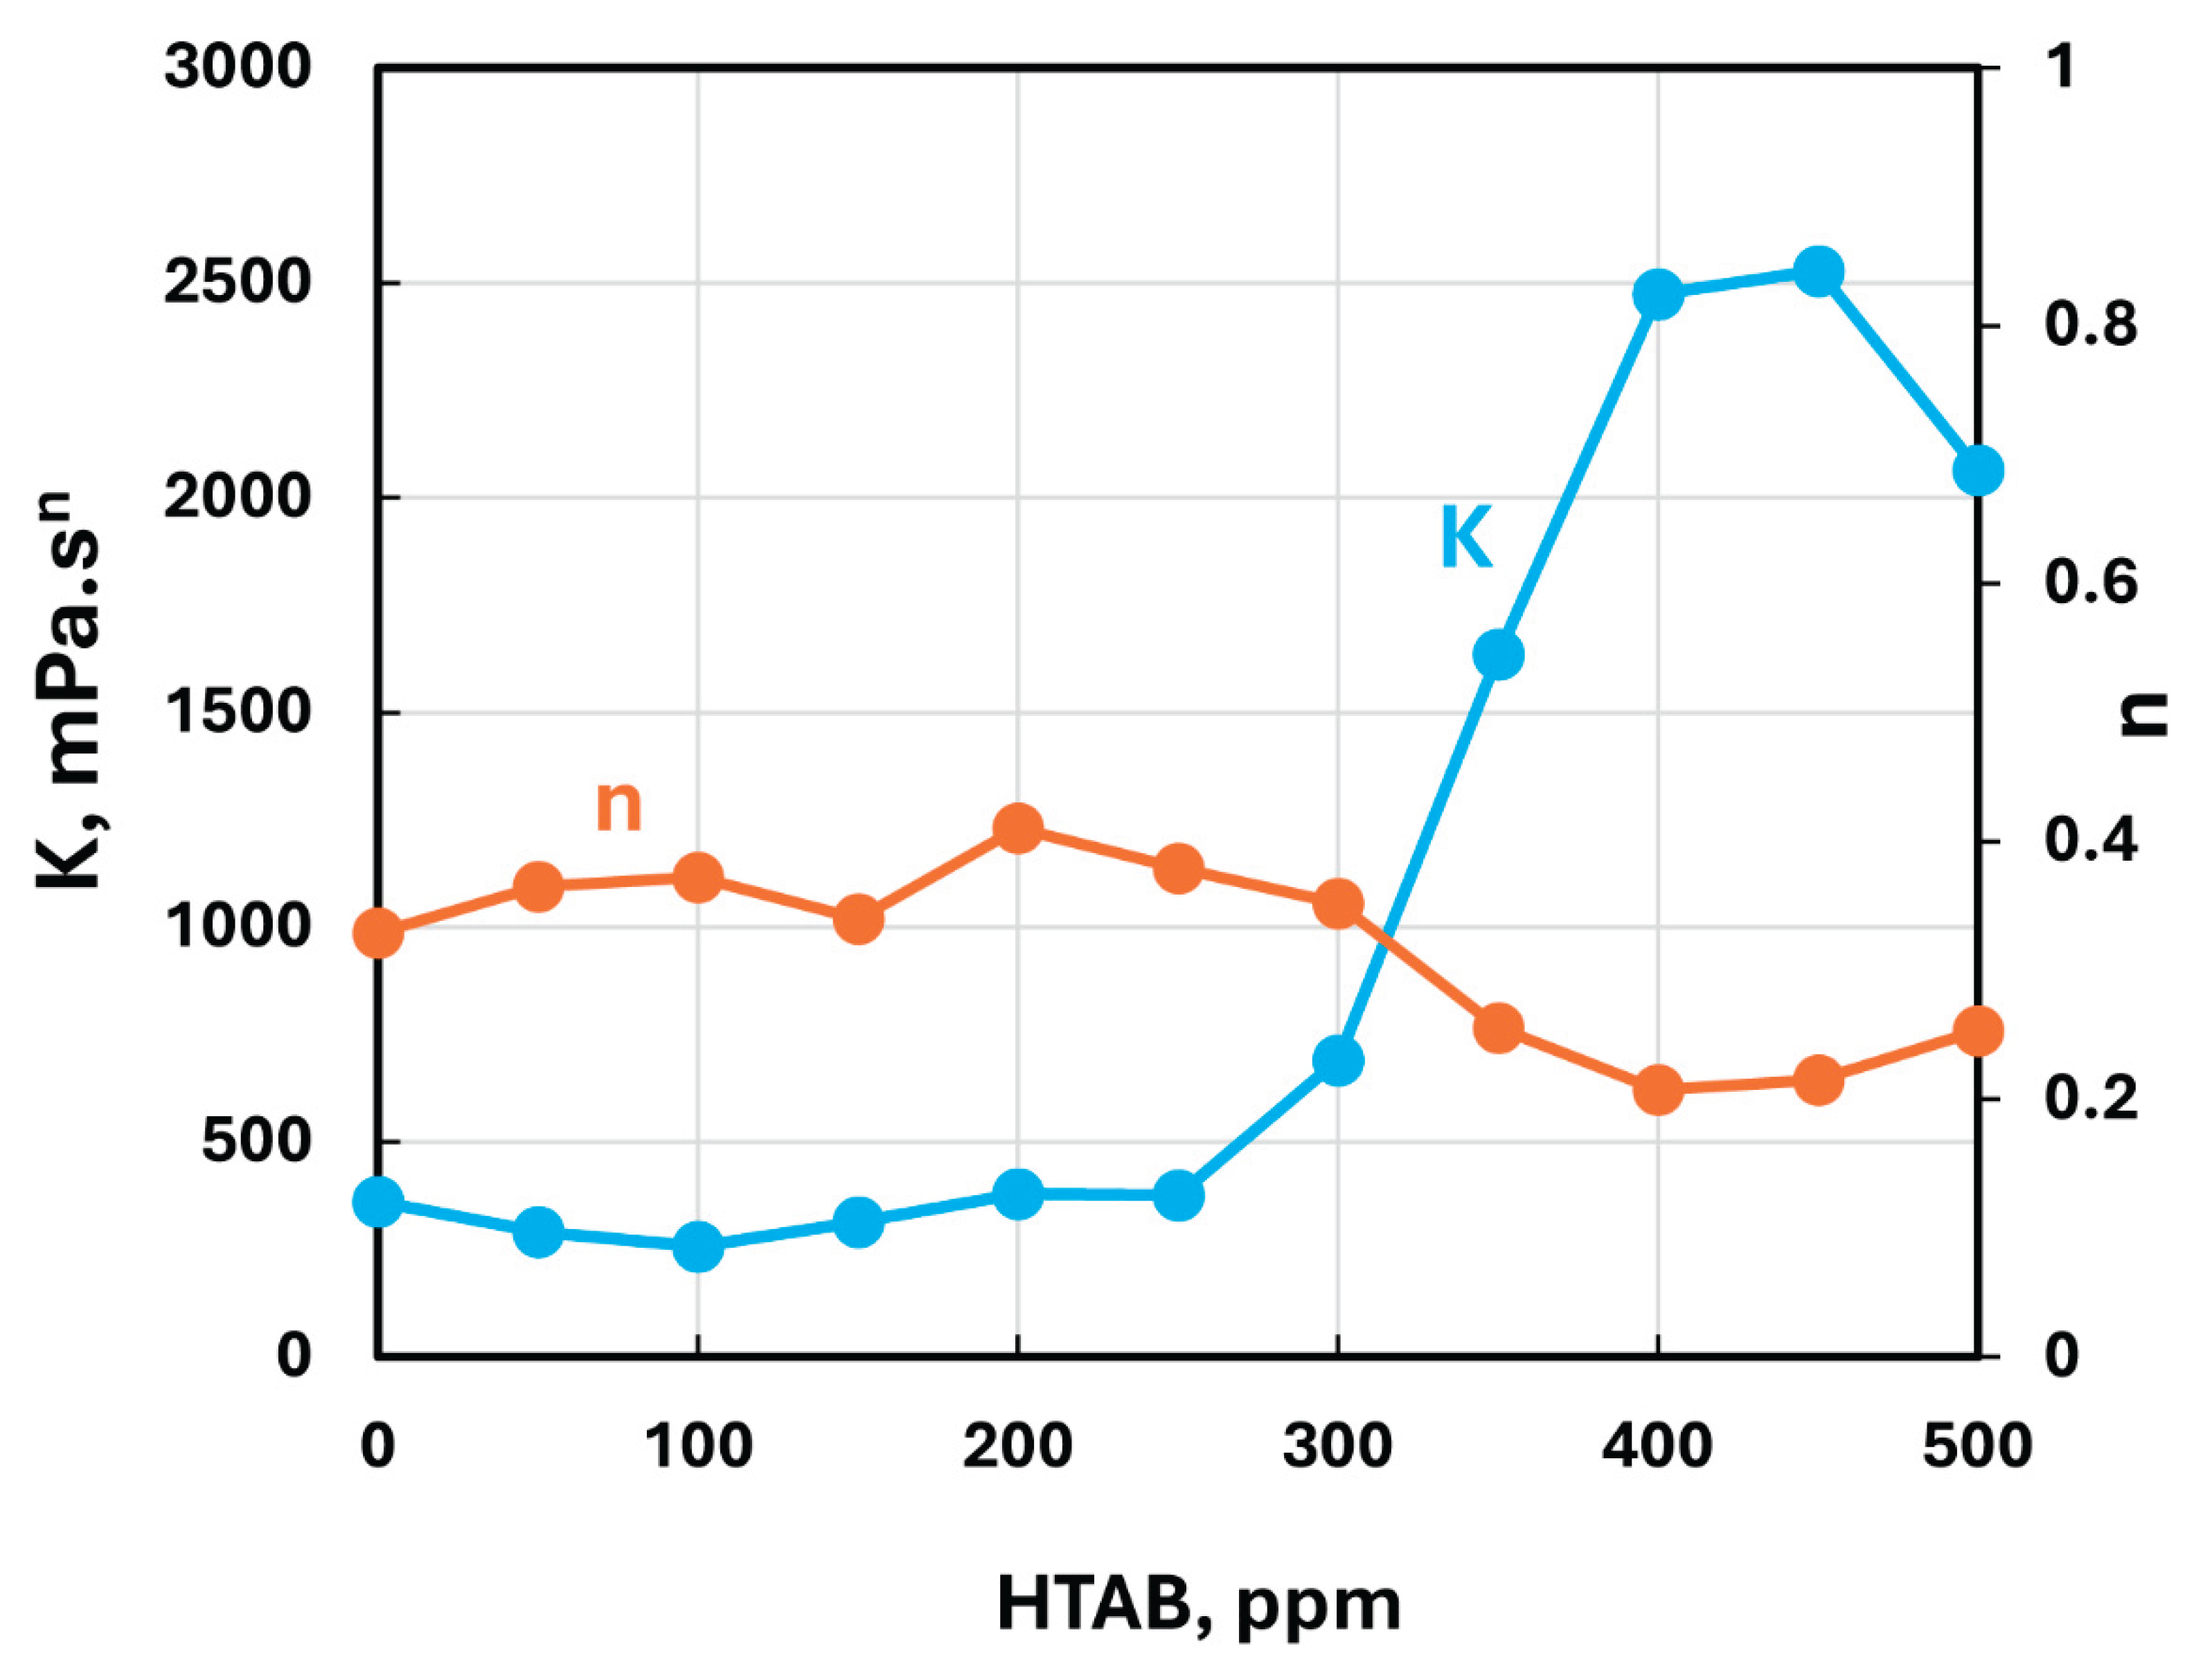
Figure 11.
Viscosity versus shear rate plots of HTAB-NCC mixtures at different HTAB concentrations.
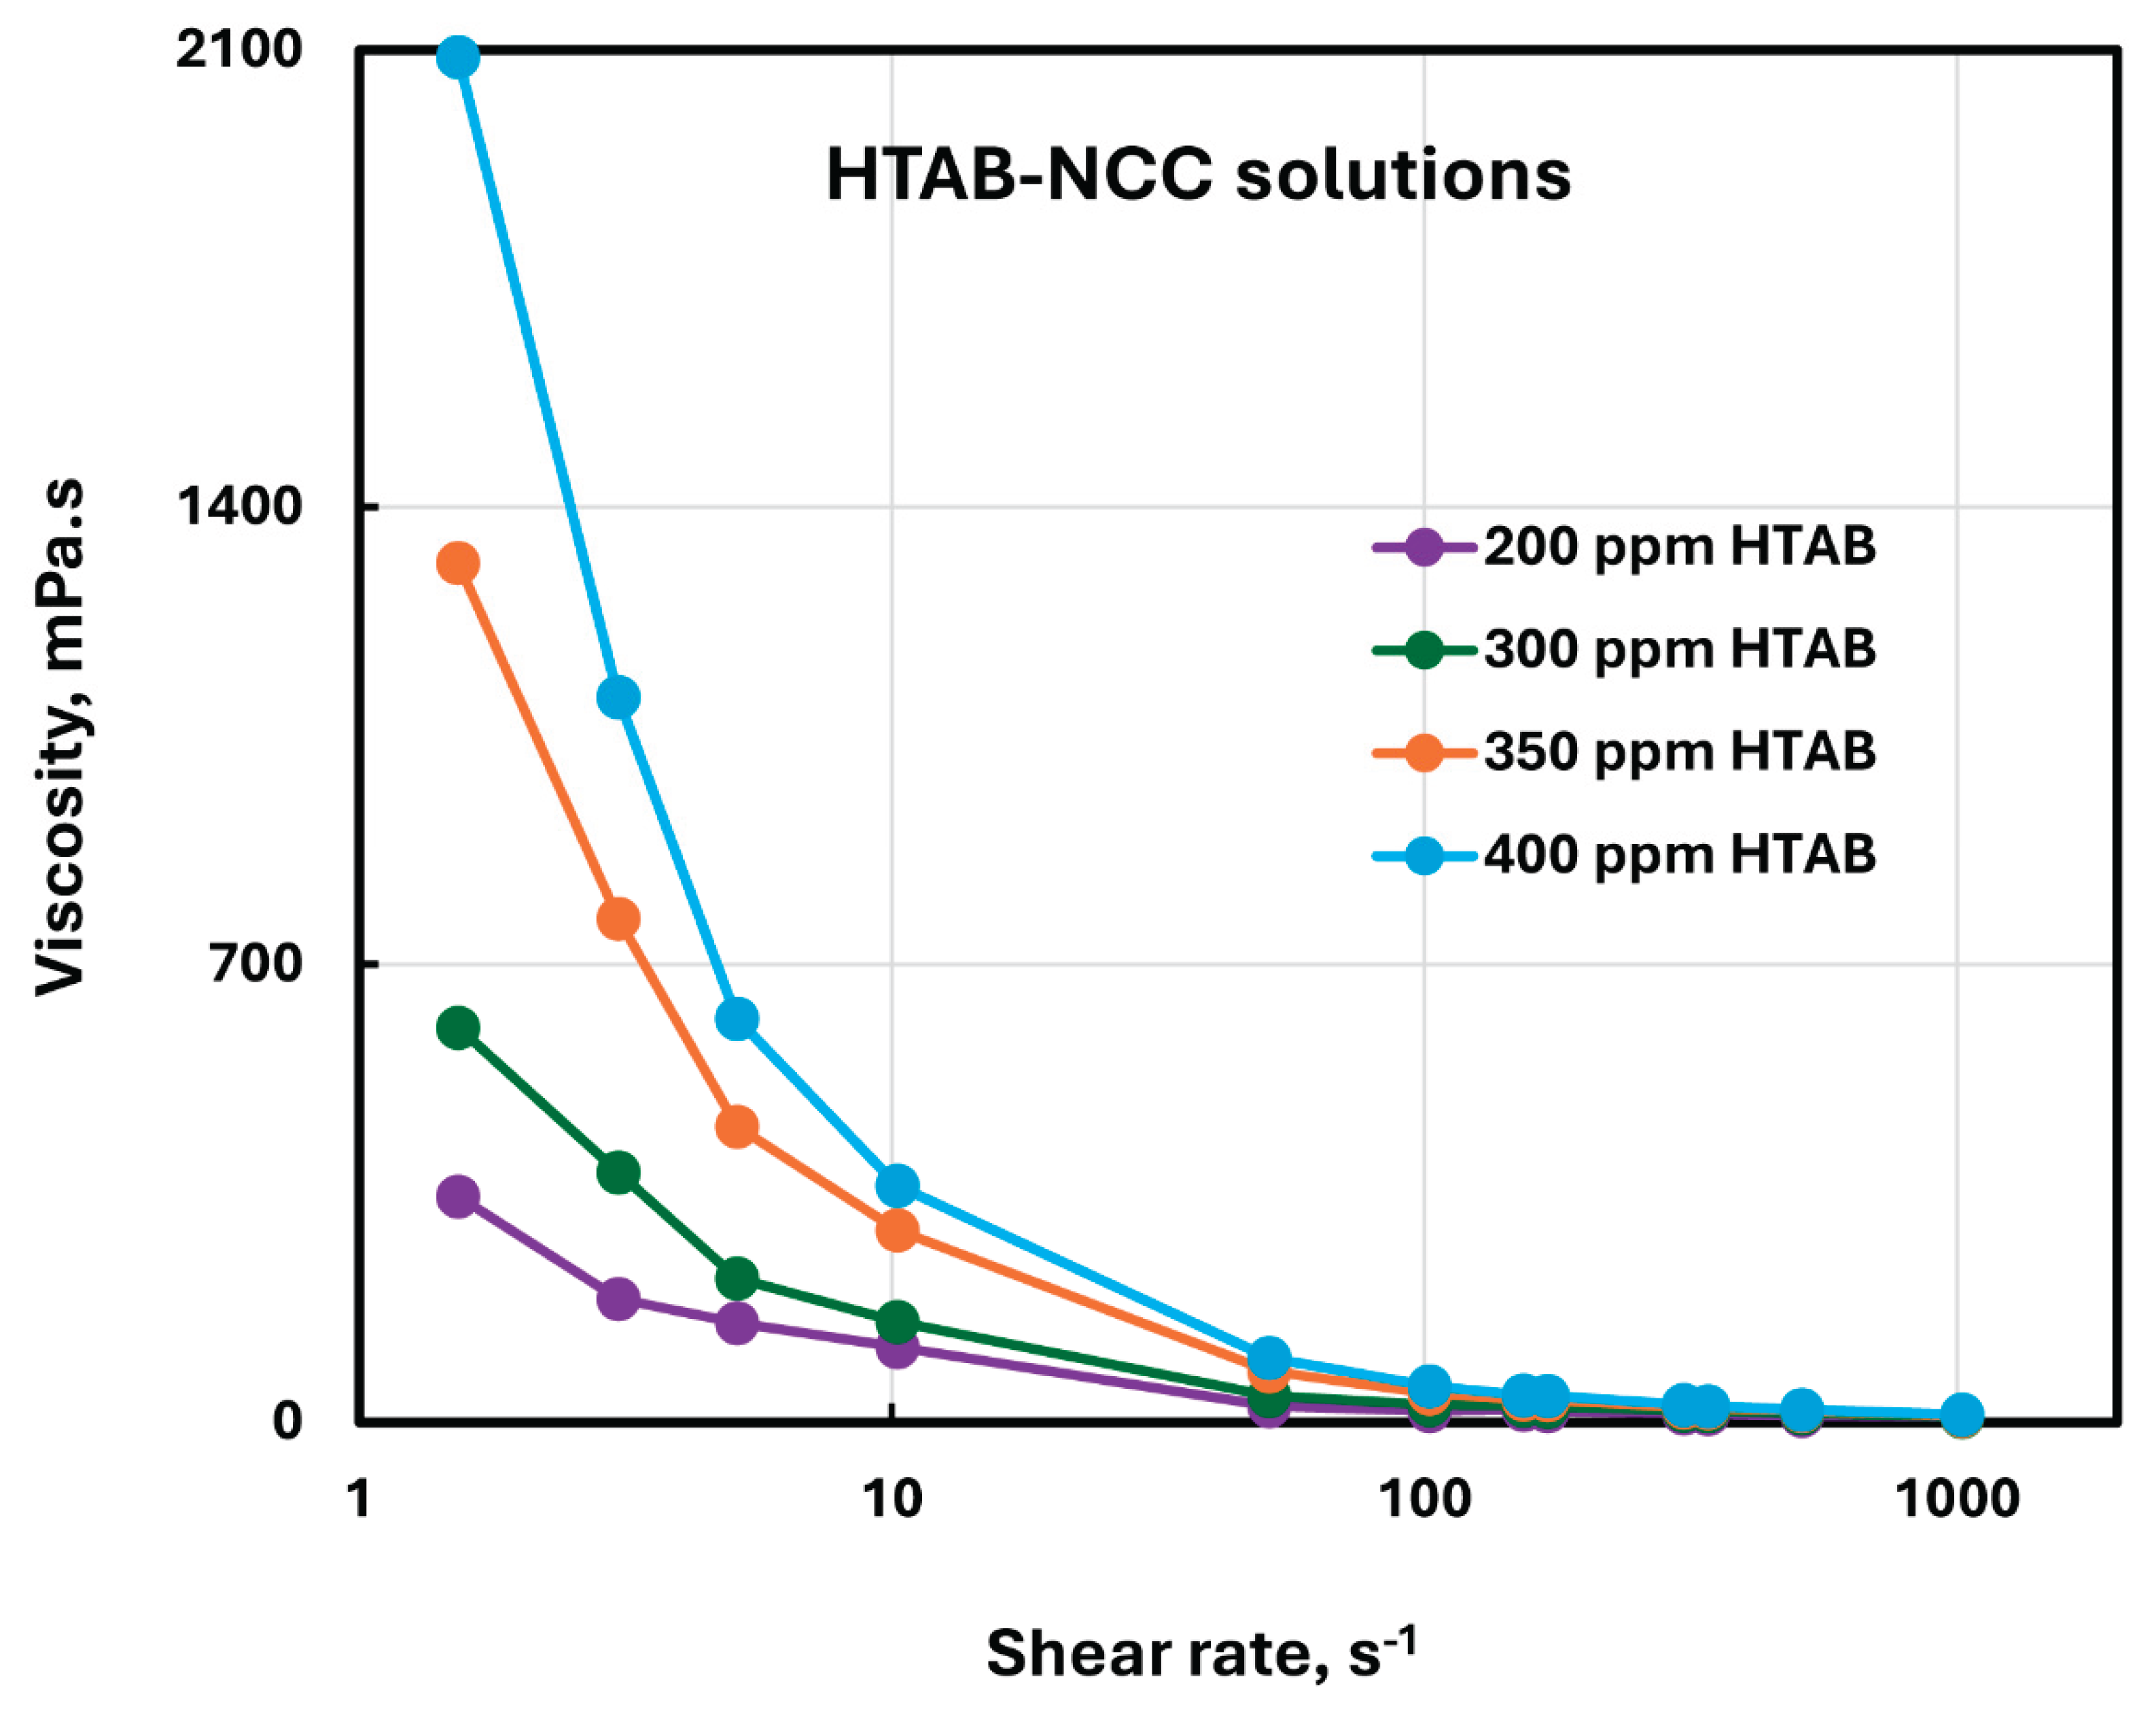
Figure 12.
Aggregation/flocculation of charge-neutralized cellulose nanocrystals in the presence of cationic surfactant.
Figure 12.
Aggregation/flocculation of charge-neutralized cellulose nanocrystals in the presence of cationic surfactant.
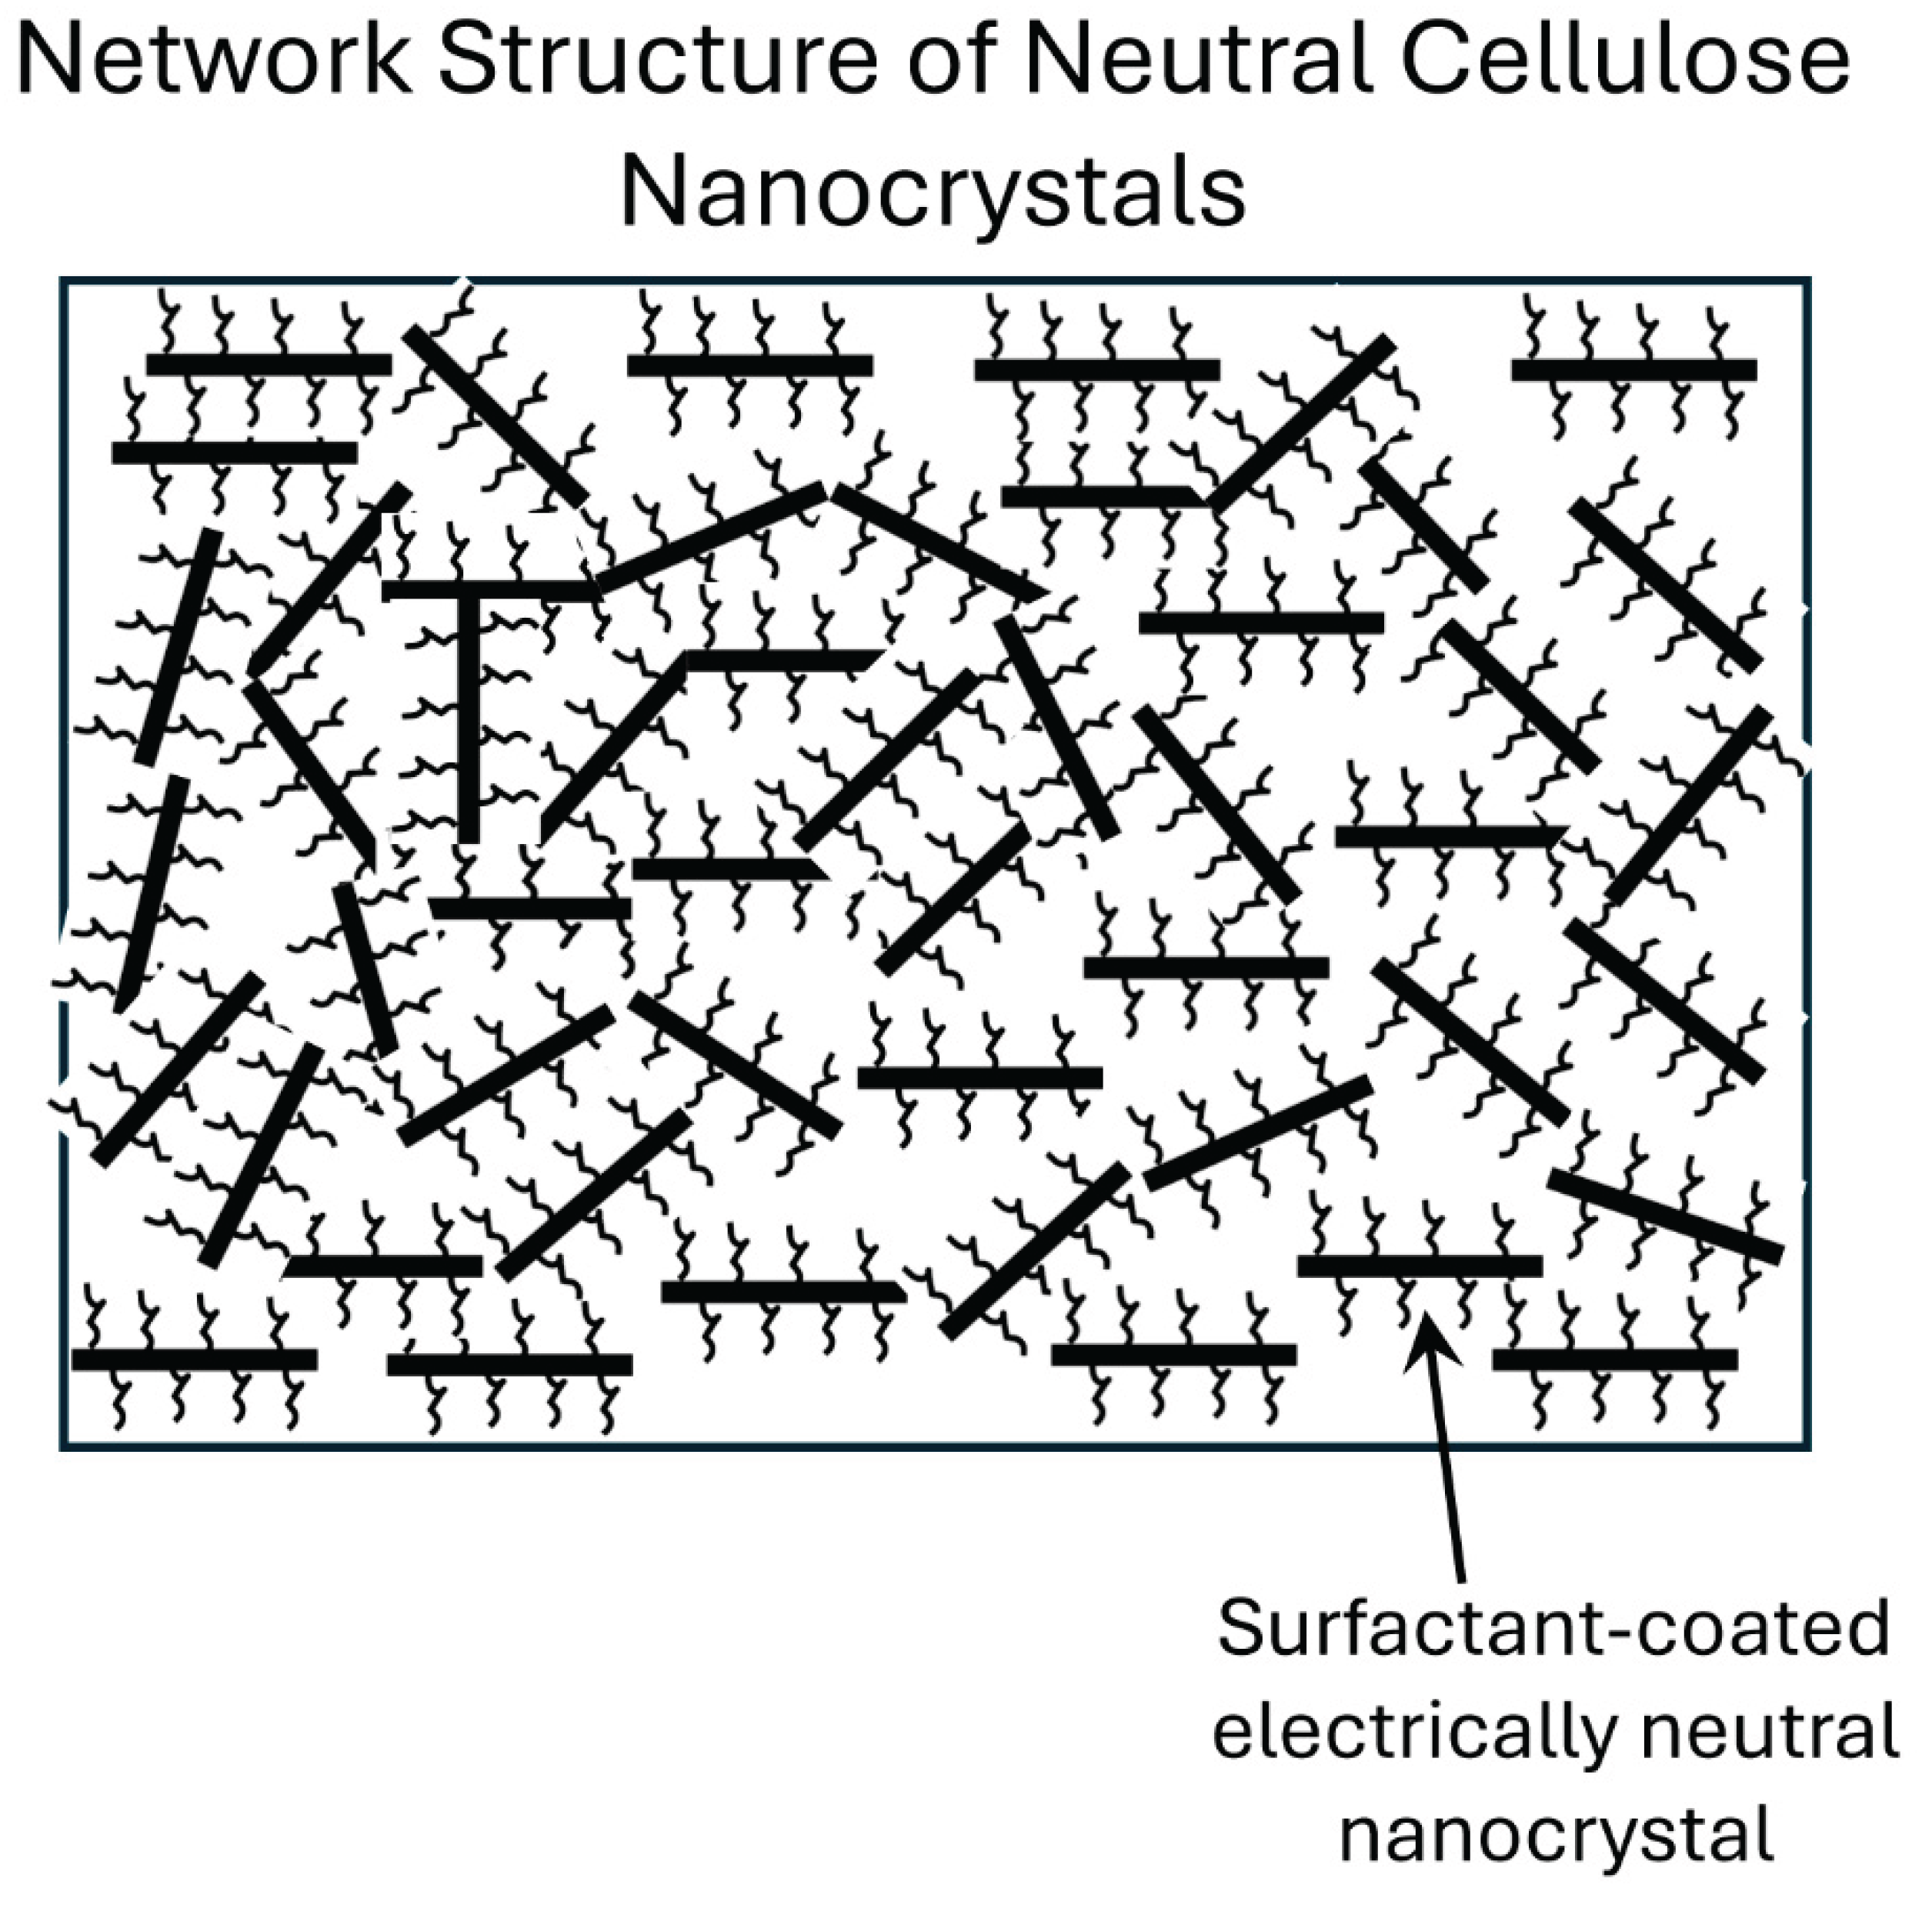
Figure 13.
Comparison of the rheological properties of Stepanol-NCC and HTAB-NCC mixtures. (a) consistency index ; (b) flow behavior index .
Figure 13.
Comparison of the rheological properties of Stepanol-NCC and HTAB-NCC mixtures. (a) consistency index ; (b) flow behavior index .
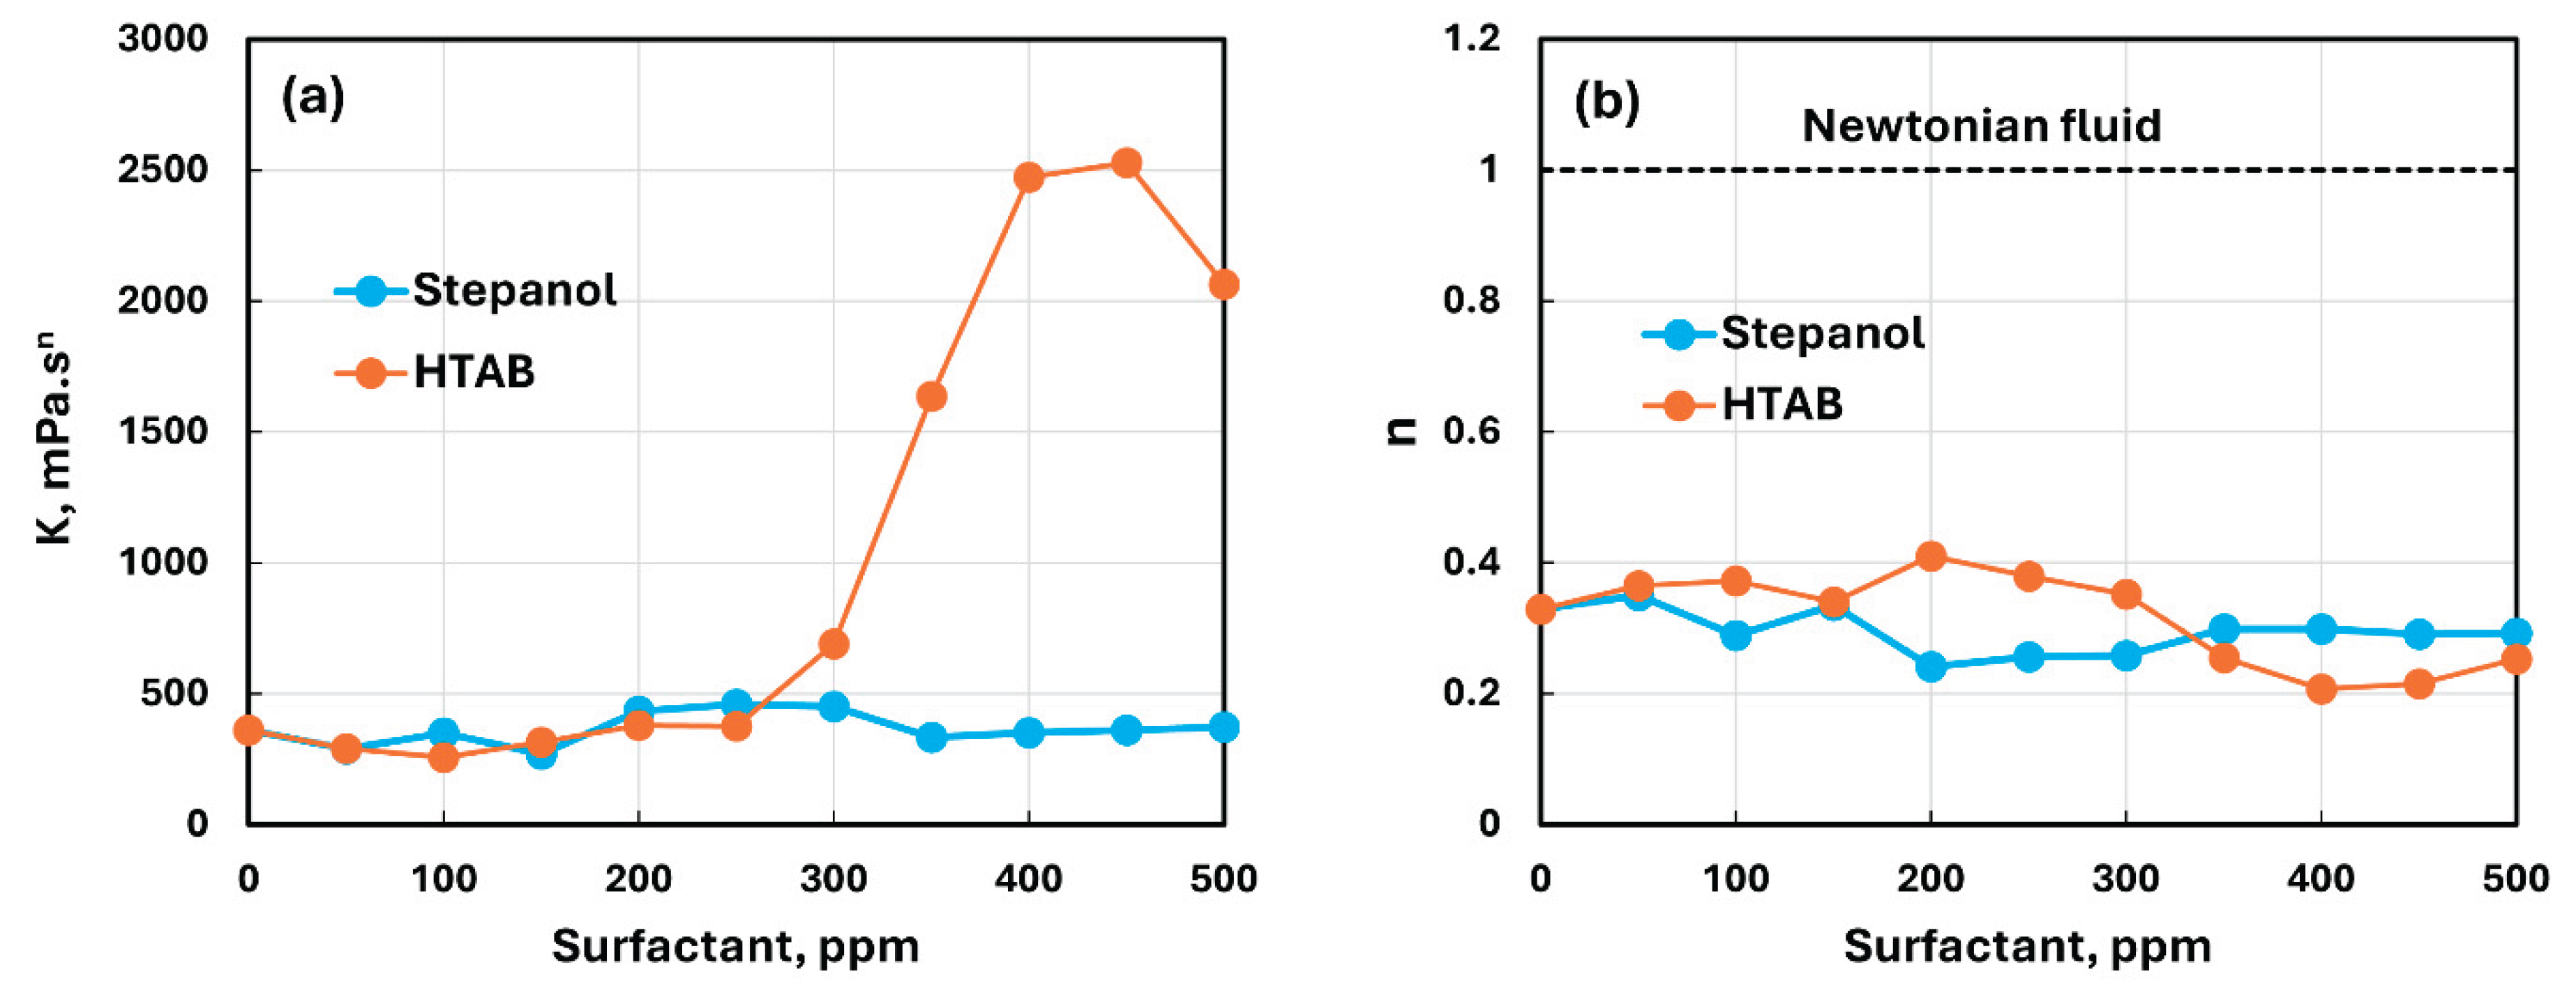
Figure 14.
Electrical conductivity variation of surfactant-NCC mixtures with the increase in surfactant concentration. (a) conductivity of Stepanol-NCC mixtures; (b) conductivity of HTAB-NCC mixtures.
Figure 14.
Electrical conductivity variation of surfactant-NCC mixtures with the increase in surfactant concentration. (a) conductivity of Stepanol-NCC mixtures; (b) conductivity of HTAB-NCC mixtures.
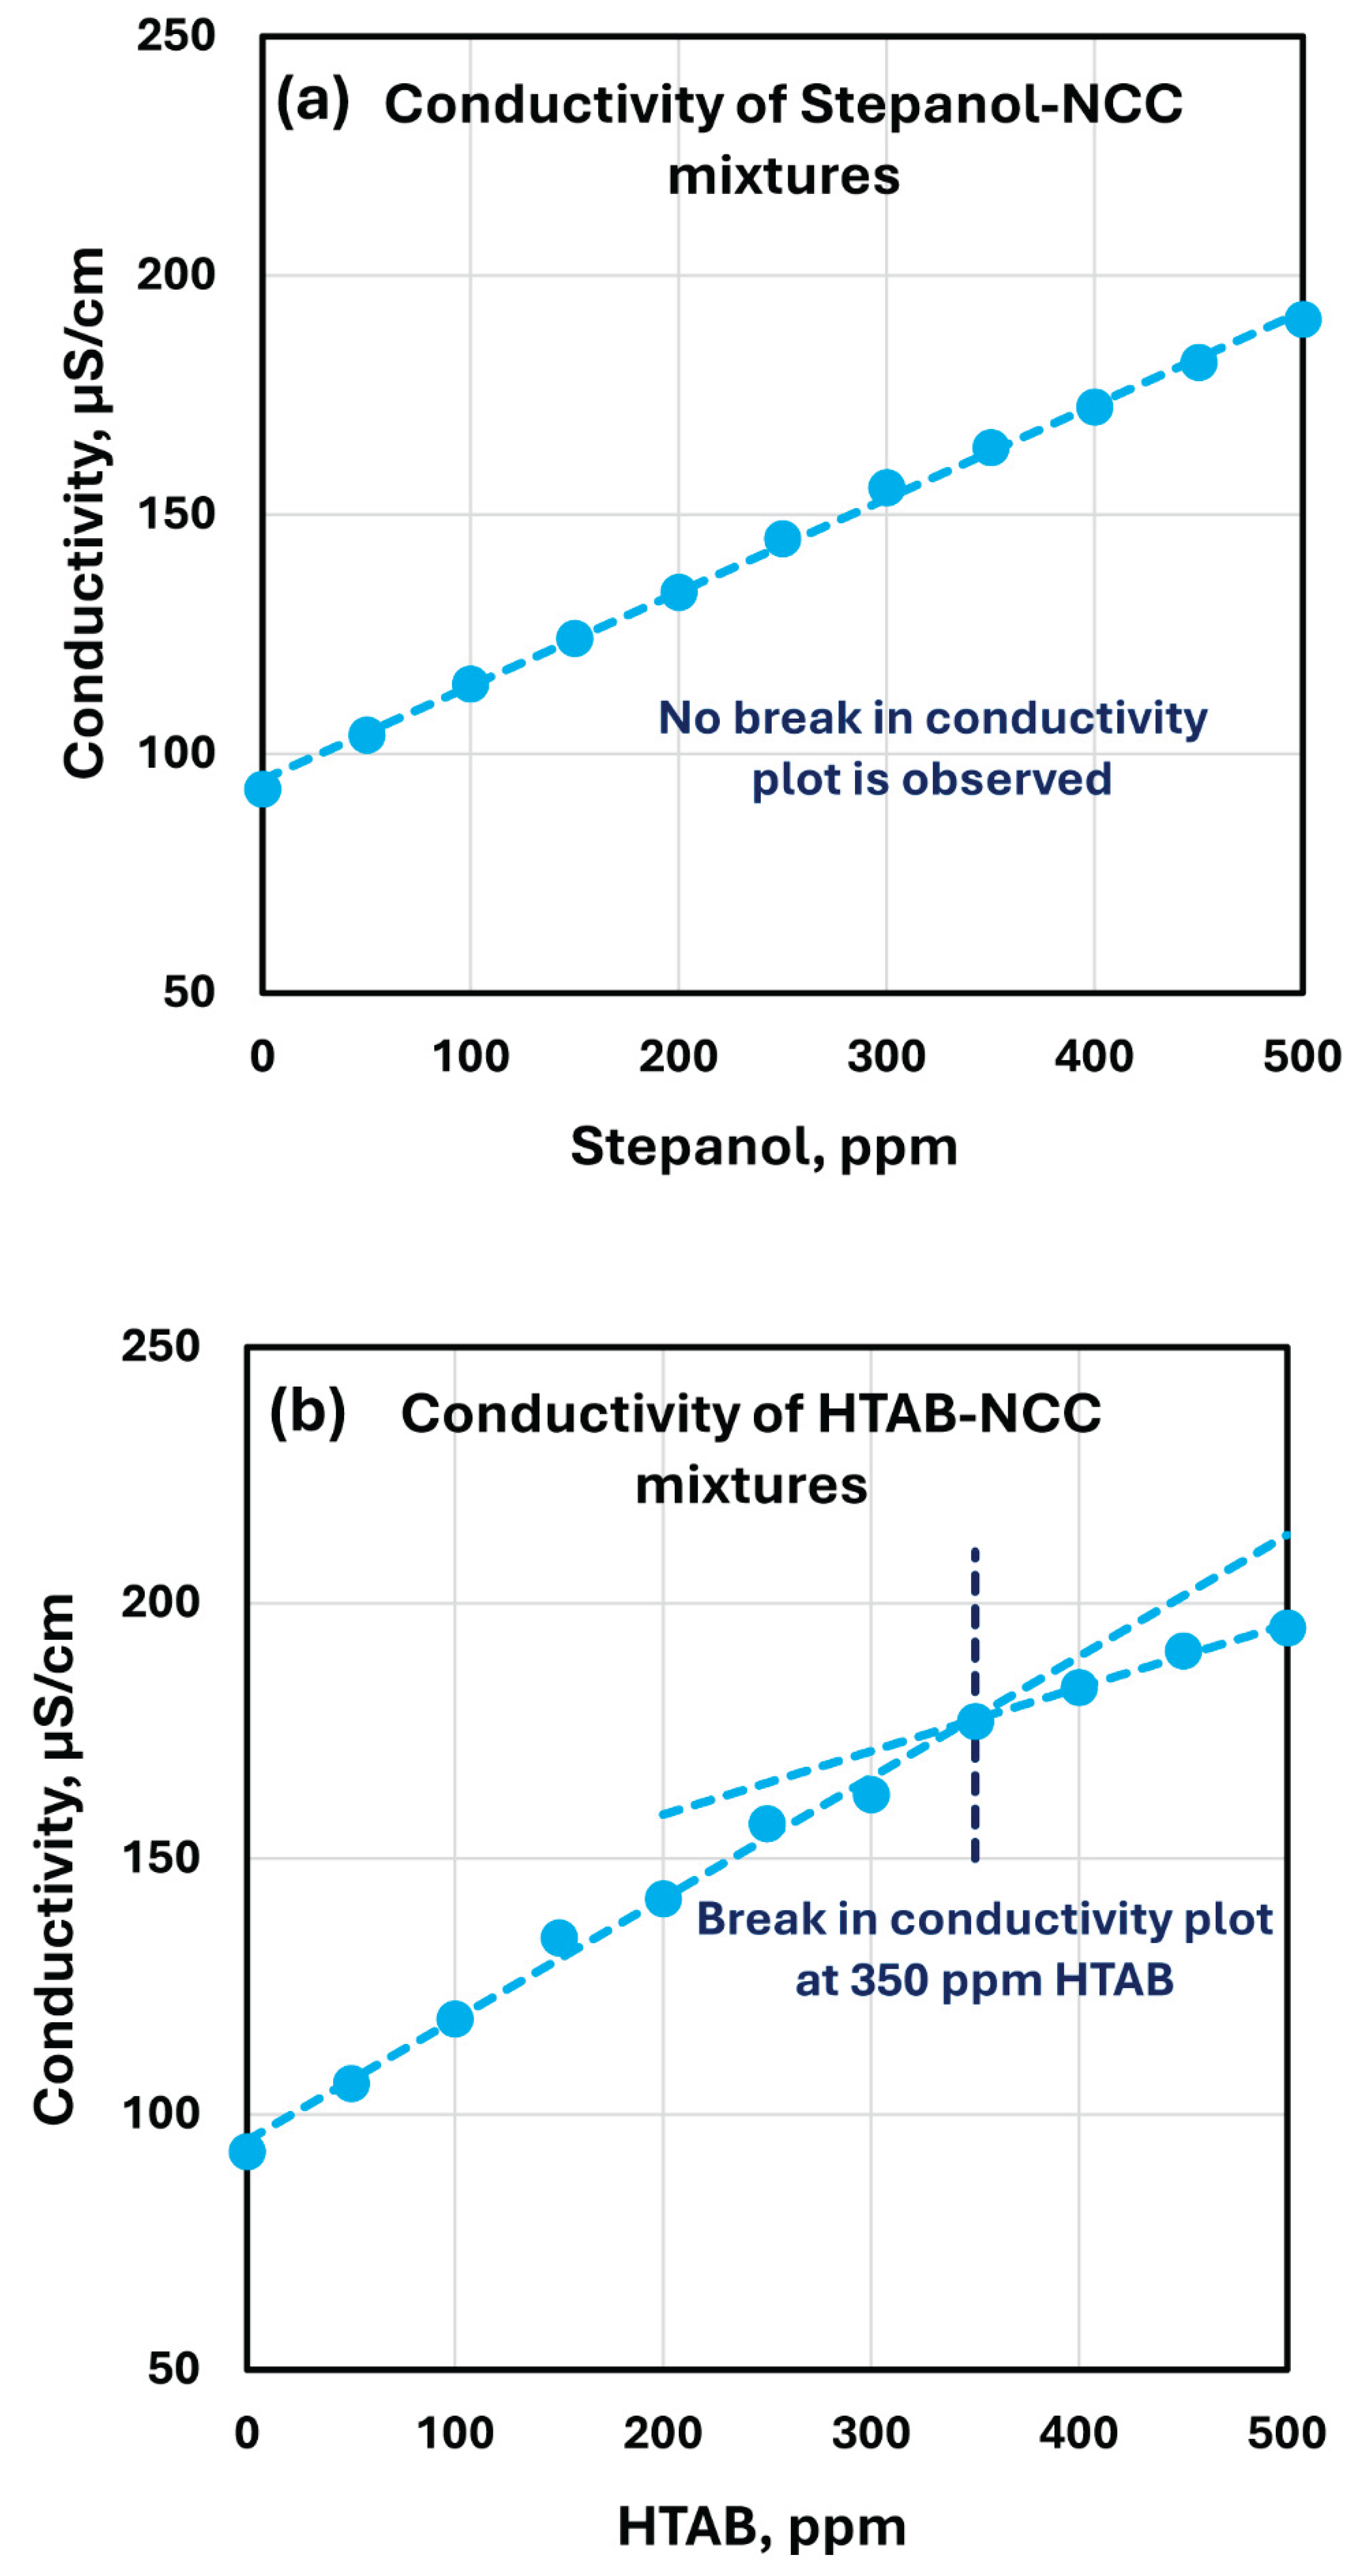
Figure 15.
Surface tension variation of surfactant-NCC mixtures with the increase in surfactant concentration. (a) surface tension of Stepanol-NCC mixtures; (b) surface tension of HTAB-NCC mixtures.
Figure 15.
Surface tension variation of surfactant-NCC mixtures with the increase in surfactant concentration. (a) surface tension of Stepanol-NCC mixtures; (b) surface tension of HTAB-NCC mixtures.
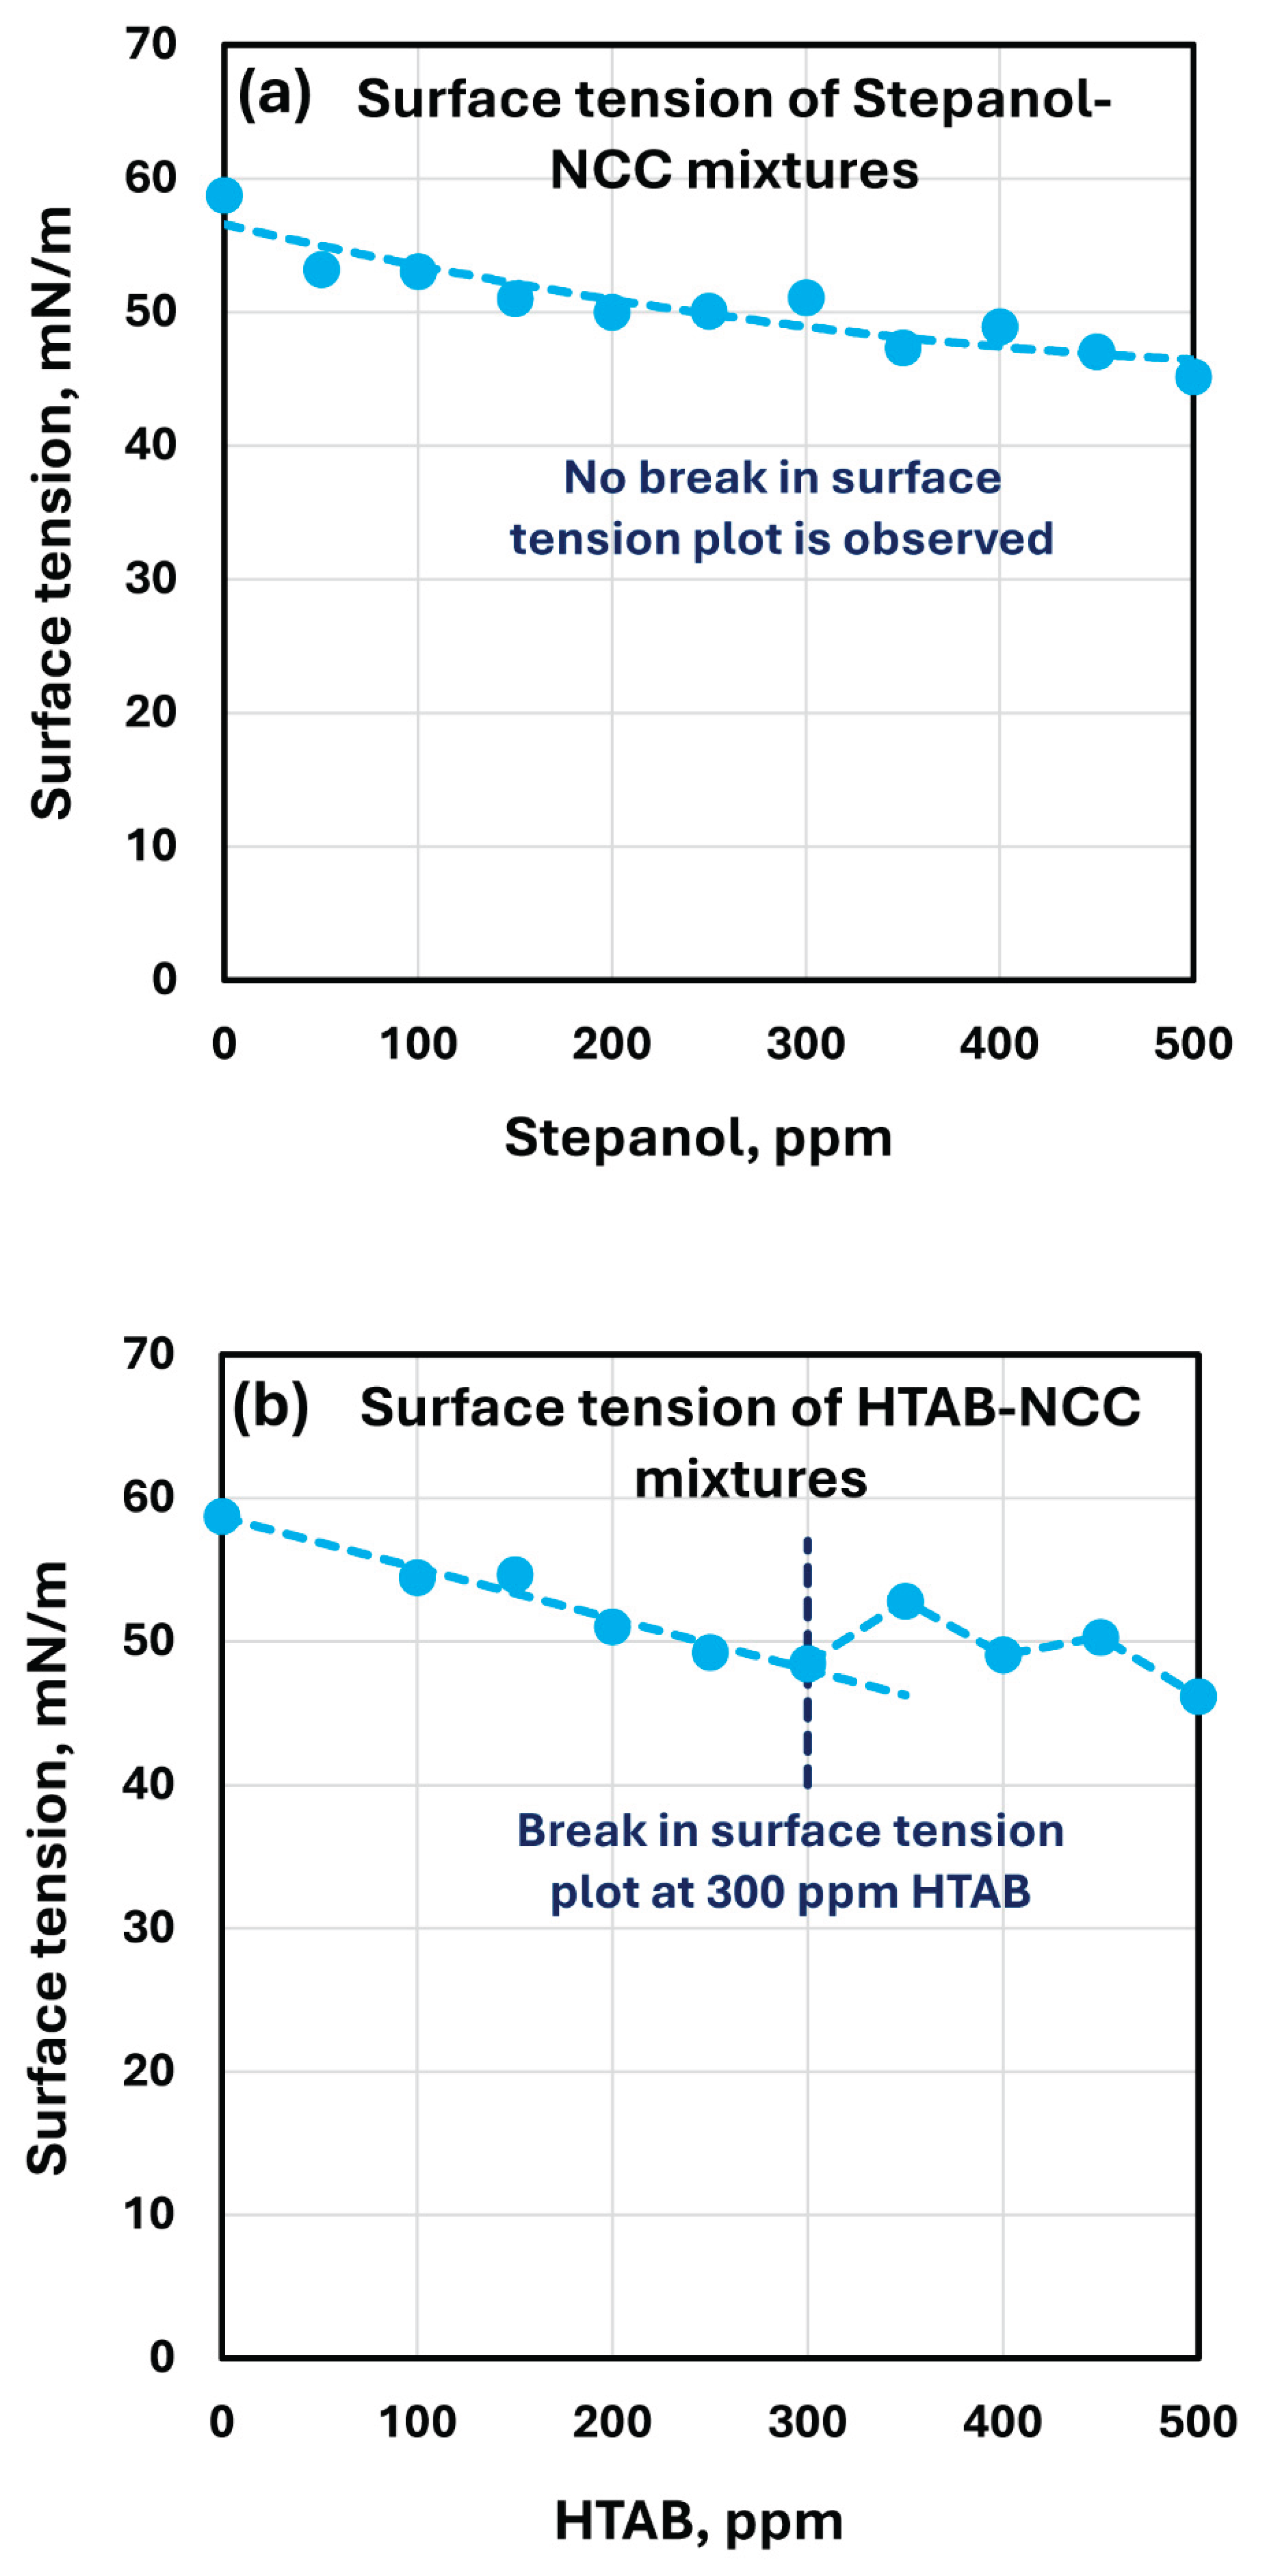

Table 1.
Power-law parameters for Stepanol-NCC mixtures.
| Stepanol, ppm | , mPa.sn | (Correlation coefficient) | |
|---|---|---|---|
| 0 | 361.35 | 0.329 | 0.9911 |
| 50 | 289.58 | 0.35 | 0.9973 |
| 100 | 349.76 | 0.289 | 0.9832 |
| 150 | 269.7 | 0.335 | 0.9701 |
| 200 | 433.13 | 0.241 | 0.9978 |
| 250 | 459.62 | 0.256 | 0.9974 |
| 300 | 450.43 | 0.258 | 0.9964 |
| 350 | 333.76 | 0.299 | 0.9927 |
| 400 | 351.07 | 0.299 | 0.9975 |
| 450 | 361.68 | 0.291 | 0.9861 |
| 500 | 372.07 | 0.292 | 0.982 |
Table 2.
Power-law parameters for HTAB-NCC mixtures.
| HTAB, ppm | , mPa.sn | (Correlation coefficient) | |
|---|---|---|---|
| 0 | 361.35 | 0.329 | 0.9911 |
| 50 | 290.87 | 0.365 | 0.993 |
| 100 | 256.68 | 0.372 | 0.9747 |
| 150 | 314.63 | 0.34 | 0.9858 |
| 200 | 379.74 | 0.41 | 0.9878 |
| 250 | 375.83 | 0.379 | 0.9956 |
| 300 | 690.1 | 0.352 | 0.9923 |
| 350 | 1635.7 | 0.255 | 0.9969 |
| 400 | 2473.1 | 0.207 | 0.9922 |
| 450 | 2528.1 | 0.215 | 0.9966 |
| 500 | 2064.3 | 0.253 | 0.9949 |
Disclaimer/Publisher’s Note: The statements, opinions and data contained in all publications are solely those of the individual author(s) and contributor(s) and not of MDPI and/or the editor(s). MDPI and/or the editor(s) disclaim responsibility for any injury to people or property resulting from any ideas, methods, instructions or products referred to in the content. |
© 2025 by the authors. Licensee MDPI, Basel, Switzerland. This article is an open access article distributed under the terms and conditions of the Creative Commons Attribution (CC BY) license (http://creativecommons.org/licenses/by/4.0/).
Copyright: This open access article is published under a Creative Commons CC BY 4.0 license, which permit the free download, distribution, and reuse, provided that the author and preprint are cited in any reuse.


