Submitted:
24 July 2025
Posted:
25 July 2025
You are already at the latest version
Abstract
The aim of this study, which was conducted on the basis of the convergence hypothesis, is to reveal the convergence problems of Turkey towards the European Union based on the basic indicators of the youth labor market. For this purpose, a large gender-disaggregated data set has been constructed with 29 observation units consisting of the European Union Average, European Union Countries and Turkey, using the basic indicators of the youth labor market that point to the future, within Eurostat and Ilostat data. Clustering method, which is one of the advanced statistical techniques, was preferred to determine which countries are similar to each other and which countries are different from each other within the data set. In this context, in the study where non-hierarchical and hierarchical clustering methods were used together, it was concluded that Turkey diverges from the developed countries of the Euro-pean Union such as Denmark, Germany and the Netherlands, and is similar to countries such as EU(27), Bulgaria, Czechia and Italy. Along with this result, it is among the other remarka-ble results of the study that gender differences in the indicators for young men and young women in the youth labor market in Turkey are quite remarkable, and that Turkey's main convergence problem towards the European Union is realized in NEET rates. In this context, the study is completed with suggestions for various policy measures for convergence prob-lems such as NEET, unemployment of young women, low labor force participation rates of young women in Turkey within the scope of sustainable development goals such as quality education and gender equality.
Keywords:
labor economics
; convergence hypothesis
; youth labor market
; European Union
; cluster analysis
1. Introduction
1.1. Overview and Motivation
Since the beginning of the modern era, employment is an important issue that has been emphasized in order to maintain production efficiently. In line with the sustainable development goals of countries, the continuity of employment and the improvement of its conditions have become the main interest of policy makers [1]. Especially in capitalist societies, individuals are generally evaluated according to their success in material, cultural or individual development [2]. From this point of view, being in working life becomes one of the most important phenomena for participation in social cohesion. According to Weller, employment facilitates network formation by providing opportunities for interpersonal development and enables people to involve themselves in collective action [2]. In this respect, being in employment facilitates social acceptance. Youth employment has become the most important focus of today’s aging societies. In this context, from an individual perspective, the inclusion of young people in the labor force is seen as a key element in the transition to adult life, while from a societal perspective, it is seen as an issue that not only concerns the welfare of young people but also affects the economic development of countries in general [3,4,5]. Accordingly, the aim of this research is to reveal which European Union country or countries Turkey, as a candidate country to the European Union, is similar to or differentiates from within the framework of youth labor force indicators.
1.2. Theoritical Background
The theoretical background of this study, which takes into account the situation of Turkey, which has been a candidate country for the European Union and has been striving to become a member of the union for almost half a century, is the convergence thesis, which is one of the subjects of growth theories within the scope of labor market indicators. The convergence hypothesis, as summarized in Solow and Swan’s neo-classical growth model, argues that developing countries will tend to grow faster than developed countries, which will lead to a reduction in income inequalities over time and that developing countries will eventually catch up with developed countries in the long run [6,7].
Within the scope of the convergence hypothesis, it is seen that convergence problems have become an important research topic in the context of the objectives of balancing the levels of economic development, in other words, reducing the differentiation within the union, since the implementation of the European Union accession and harmonization policies [8]. The focus of the economic development level, which is at the basis of the convergence hypothesis, is undoubtedly the labor market, which is at the intersection of economic and social life. In this framework, unemployment, employment, informality, characteristics of workplaces, sectoral distribution and education level are very important indicators for the labor markets of countries, and the structure of the youth labor market, which is at the dynamics of economic development, is directly affected by these characteristics of countries [9].
It is observed that investigating the current situation of the youth labor market, which is accepted as the reference of a country’s future economic development level, is considered important within the scope of convergence problems and has been the subject of many studies. As a matter of fact, Topçu and Biçimveren found that factors such as per capita income, internal migration, inflation and age at first marriage affect youth unemployment in their study [10]. In addition, education, gender, marital status and household characteristics have also been found to be important variables in the labor market participation of young people [11,12,13]. In this context, it would not be wrong to say that macro and micro policies regarding the youth labor market have a direct and very important impact on the level of economic development of a country.
While analyzing the labor market, discussions are mostly based on the concepts of unemployment and employment. In particular, the theoretical models constructed for the differences in unemployment rates are usually discussed in terms of the balance/imbalance between labor supply and demand. Among the factors that constitute the balance between labor supply and demand, factors such as the demographic characteristics of young people, the characteristics of the labor market and the stock of human capital stand out [14]. Blanchard and Katz emphasize that regions have different average unemployment rates for equilibrium approaches and that asymmetric shocks temporarily push regions apart. However, they state that the effect of these shocks is not permanent and that they bring regions closer to each other after a while [15]. In contrast, Marston argues that the role of trade unions, social security policies implemented by governments, high rates of unemployment insurance, local amenities and climatic conditions play a negative role in the self-correction of regional imbalances [16]. Authors advocating the imbalance approach are similarly of the view that adjustment problems in the labor market are effective in maintaining regional disparities [17,18]. With a similar approach to regional disparities, Fujita and Krugman (2004) talk about a concept called “new economic geography”. They state that the spatial differences between economic growth and unemployment are due to the differences in innovation between developed and undeveloped regions and the migration of skilled labor [19]. Iammarino et al. (2018) argue that the broad wave of economic development has weak spillover mechanisms to spread prosperity to other regions and ensure income convergence. In the mid-twentieth century, diffusion mechanisms were stronger, as technologies developed in the early part of the century needed to be diffused to mature. In this process, there was a long transition period that benefited less developed regions and stimulated interregional convergence. In today’s economies, it is argued, this structural condition is poorly compensated by knowledge spillovers, entrepreneurship and labor migration. Therefore, it is argued that inter-regional inequality has increased and become persistent in today’s EU because economic development does not generate spatial and social mechanisms [20]. For this reason, this research is also expected to point to an important problem. As a matter of fact, a cluster analysis to be conducted within the framework of youth labor force indicators will reveal with which European Union country or countries Turkey is similar to or differentiated from. In this respect, it is important to know with which countries or country groups Turkey is similar to within the EU membership process . For this purpose, NEET, unregistered employment and regional differences must be taken into consideration when analyzing the youth labor force structure.
The labor market in Turkey poses a number of challenges for its young population, especially in terms of unemployment and NEET (Not in Education, Employment or Training) rates. The World Bank report states that the youth unemployment rate in Turkey has fluctuated around 25% in recent years and has become permanent [21]. The NEET rate, a critical indicator of youth participation in the labor market, also raises concerns. Approximately 24% of young people in Turkey fall into the NEET category, meaning that a significant portion of the country’s young population is neither employed nor in education or vocational training [22]. The socio-economic consequences of this trend are serious, as prolonged disengagement from both the education system and the labor market can have long-term effects by reducing future employability and wage prospects [23]. This phenomenon is further complicated by gender inequalities, with young women disproportionately represented among NEETs due to cultural norms and limited access to labor market opportunities [24].
Several factors contribute to Turkey’s challenges in integrating youth into the labor market. First, although the country’s education system has undergone significant reforms, it still faces challenges in aligning educational outcomes with labor market needs. Despite efforts to expand vocational education and training programs, there remains a significant mismatch between the skills provided by the education system and the skills demanded by employers [25]. Various studies have been conducted in the literature on vocational training programs, one of the most important active labor market policies. In general, studies on active and passive labor market policies show that the impact of labor market programs on employment has been examined by different researchers in various countries. Most of the studies focus on active labor market programs, while the effectiveness of passive programs and the comparison of these programs remain limited. Fredriksson and Johansson [26] found that job creation and training programs reduce sustainable employment opportunities in the long run. Jespersen, Munch and Skipper [27] conclude that training programs have positive effects on employment and earnings in Denmark. Carling and Richardson [28] in their study conducted in Sweden stated that employment subsidies and training provided by enterprises are more effective, while Sianesi [29] stated that employment incentives are the most effective program. Kluve [30] conducted a meta-analysis on active labor market programs and concluded that employment incentives are more effective than training and job creation programs are less effective. The literature generally emphasizes the social and economic effects of active labor market programs, but their effectiveness varies by country and context [31]. In addition to the mentioned factors, the rigidity of the Turkish labor market, education and skills mismatches are among the obstacles to youth employment. These factors contribute to a labor market environment where youth are disproportionately affected by economic downturns, as seen during the Covid-19 pandemic, which exacerbates existing vulnerabilities in the labor market [32].
The persistence of unemployment and policies to prevent it are not only a problem of developing or underdeveloped countries. Similarly, unemployment is one of the most important social policy problems in developed countries. Youth unemployment rates, which are about twice as high as the general unemployment rates, are of special interest to policy makers as they point to a much more important problem for the future of countries.
There are different youth labor market characteristics among European Union member countries with different results. According to Eurostat data, youth unemployment rates in Northern European countries such as Germany, Denmark and the Netherlands are relatively low compared to Southern European countries such as Spain, Greece and Italy. Besides youth unemployment, one of the biggest problems of Southern European countries is the high NEET rates, similar to Turkey [33]. It can be stated that the similarities and divergences between the European Union countries are largely due to differences in economic, labor market policies and education systems. According to Ryan, Germany’s success in managing youth unemployment can be attributed to its strong dual education system that combines classroom education with on-the-job training through apprenticeships [34]. The country’s emphasis on vocational training has resulted in a smooth transition from school to work for many young people, significantly reducing the time spent in unemployment or inactive status after graduation [35]. Similarly, the effective alignment of the education system and the labor market in the Netherlands and Denmark seems to be an important actor in ensuring that the young workforce is trained in accordance with the expectations of employers [34,35].
Within the European Union, Southern European countries have more serious problems in their labor markets than Northern countries. For example, Greece’s youth unemployment rates and NEET rates have remained high since the economic crisis in the country. The lack of vocational training programs combined with the rigid structure of the labor market creates a negative structure for the young labor force in Greece [36]. According to Bradley et al., the prevalence of temporary employment contracts and flexible working also condemns a large number of young workers to precarious employment conditions . This situation further increases the vulnerability of the young labor force to economic shocks [18].
Regional differences within the European Union member countries also have an impact on the labor market. As a matter of fact, it is observed that there are significant differences in the labor market outcomes of young people between different regions in countries such as Italy and Spain. Studies have shown that young people in rural and economically disadvantaged areas face particularly high barriers to employment, including limited access to education and vocational training as well as a lack of job opportunities in key sectors [20]. This regional dimension highlights the need for targeted interventions that address the specific challenges faced by young people in different regions of the EU. Cluster analysis in this case, if applied to countries at the micro level, would be important in order to see regional differences or similarities within countries.
A comparison of the youth labor markets in Turkey and the EU reveals some fundamental differences. While both regions face high youth unemployment and NEET rates, the structural factors leading to these outcomes differ significantly. In Turkey, the main challenges stem from mismatches between education and labor market needs, regional differences and labor market rigidities. In contrast, the challenges facing the EU are more closely related to the economic divide and regional differences, especially between Northern and Southern Europe.
1.3. Literature Review
A comprehensive cluster analysis of the youth workforce between Turkey and EU countries based on statistics requires an in-depth examination of various studies that shed light on the employment environment of young people, especially those categorized as NEET (Neither in Employment, Education or Training) and those in informal employment. The findings from these analyses can contribute significantly to understanding the complex dynamics of youth employment and the socio-economic factors affecting these statistics, as well as to understanding where countries converge and diverge.
The issue of youth employment in Turkey is of great interest due to high unemployment rates and the prevalence of NEETs among young people aged 15-34. The report titled “2009-2019 National Report—NEET in Rural Turkey” presents a ten-year analysis of NEET statistics. The findings expressed in the report emphasize that the share of youth in the total population is decreasing. This raises concerns about the future employment opportunities and economic participation of young people [37]. Therefore, there is a great benefit in analyzing the situation of the youth labor force in the process of European Union membership through NEETs.
Yiğit, Çakmak and Çakmak’s study on NEET status among Turkish youth emphasizes the socio-economic determinants of NEET status. They state that parental education and employment are important for NEET status. The results of the study show that higher educational attainment of parents is associated with a lower probability of their children being classified as NEET. It reveals that compulsory education is an important factor in reducing NEET risks, especially among men and married or divorced women, thus demonstrating the interplay of education and family dynamics in shaping the employment trajectories of young people [38].
The phenomenon of informal employment is another critical dimension of youth employment in Turkey. Görmüş’s study [39] sheds light on the prevalence and consequences of informal employment among young people. Informal employment is characterized by a lack of job security, low wages and lack of social rights, and disproportionately affects young men compared to young women. Based on data from the 2021 Turkey Household Labour Force Survey, the study highlights that higher levels of education are associated with an increased likelihood of young individuals being informally employed in low-paid jobs and suggests that educational attainment does not necessarily equate to better employment outcomes [39].
One of the important findings regarding the youth unemployment rate in Turkey is regional disparities. Kurtsal, using quantitative methods to examine regional inequalities, found that youth unemployment rates are higher in regions with lower levels of education and limited job search resources. The negative correlation between education levels and youth unemployment rates reinforces the idea that educational opportunities are crucial in addressing the youth employment crisis in Turkey. The study also states that targeted interventions are necessary to address the disparate challenges faced by youth in different regions [40].
A review of the literature on cluster analysis in the context of this study shows that it has been effectively used to examine labor market statistics in various contexts. Krpan et al. (2023) used hierarchical clustering approach in their study. According to the results of the study, Belgium, Cyprus, Denmark, France, Ireland, Latvia, Lithuania, Luxembourg and the Netherlands are the countries with the highest average percentage of young adults with tertiary education in 2021. On the other hand, Belgium, Bulgaria, Hungary, Ireland, Lithuania, Malta, Malta, Poland and Romania are the countries where higher education generates the highest average employment and income benefits for young adults. According to the researchers, as the level of education increases, unemployment rates decrease and employment rates and income levels increase [41]. The study by Bradley et al. (2020) examines the regional differences in youth unemployment and NEET youth in European Union member countries by cluster analysis methods. The study found that the spatial clustering of youth unemployment and NEET rates is due to regional differences affected by labor market conditions. According to the results of the study, youth unemployment and NEET rates in Spain, Italy and the United Kingdom vary depending on economic cycles, labor force quality and competition in the labor market. In particular, the effects of economic crises on youth unemployment are more pronounced in Spain and Italy [18]. In Kusawanto et al.’s study published in 2024, unemployment data in the Jakarta region were analyzed by age groups using the K-Means Clustering method. Accordingly, the data were divided into three clusters according to age groups, and it was concluded that the unemployment rate among young people is the highest and this group has difficulty in entering the labor market [42]. In another study on cluster analysis, a study on the labor market in the European Union after the economic crisis period used cluster analysis to categorize member states according to the trend of youth unemployment [42]. Paşnicu conducted a study to create clusters according to similar labor market characteristics by using labor market indicators in European Union countries. In this study, hierarchical cluster analysis (HCA) method was used. The data is based on the labor market data of 28 European Union member countries. According to the findings of the study, European Union countries are divided into four clusters. The highest performing cluster was identified as the cluster including Sweden, the Netherlands, Austria, Germany, Denmark and the United Kingdom. The lowest performing cluster was found to be Southern European Countries, similar to other studies. The hierarchical clustering analysis shows that the labor market performance of the European Union countries is quite different from each other and that the source of these differences arises from structural and political factors. It has been found by researchers that young people, who are referred to as vulnerable groups in Southern and Eastern European Countries, have difficulties in entering the labor market and their employment opportunities are lower than in Western and Northern European Countries [43].
Babucea et al. conducted a cluster analysis study to understand the similarities and regional differences of registered unemployment in different provinces of Romania by using cluster analysis to examine the geographical distribution of unemployment rates at the beginning of the economic crisis in Romania (2009). In this study, hierarchical cluster analysis and Squared Euclidean distance calculation metrics were used. The study revealed that the counties in Romania are divided into three main clusters in terms of unemployment rates and that there were significant regional differences in unemployment rates during the economic crisis [44].
In general, it can be stated that the analyses of youth labor force indicators in the literature are based on youth unemployment. Accordingly, in the studies conducted, the problem of youth unemployment should be addressed by taking into account both individual and social dimensions. There are significant differences in youth unemployment rates across countries and regions and these differences are directly affected by labor market policies, economic structures and crises. In this context, it is understood from the studies in the literature that regional and national policies should be harmonized with each other for the integration of young people into the labor market, vulnerable groups should be supported and more targeted strategies should be implemented in the fight against unemployment. Cluster analysis, which is an important method for this, provides important information to countries in developing policy measures.
A cluster analysis of youth labor statistics in Turkey would reveal a multifaceted landscape characterized by demographic changes, gender inequalities, informal employment challenges and socio-economic impacts. Research and policy efforts in this direction need to be directed towards understanding the interactions between factors in order to formulate effective strategies that improve youth employment outcomes. However, although the literature review shows that many studies have been conducted on the Turkish labor market and the situation of young people, there are almost no studies that examine the labor force indicators of young people using cluster analysis. For this reason, this study aims to fill this gap in the literature.
2. Materials and Methods
This study aims to reveal which EU countries and Turkey, as a candidate country for EU membership, show similarities or differences with which EU member countries within the framework of young labor force indicators. Accordingly, Table 1 below shows the variables used in the cluster analysis for EU countries and Turkey. The variables were selected using Eurosatat and Ilosat data to analyze which European Union country(s) Turkey is similar to and different from in terms of indicators such as youth unemployment rates, NEET (young people neither in education nor in employment) rates, temporary employment rates and youth employment rates.
As can be seen from Table 1, there are significant differences between the variables of youth labor force participation rates, youth unemployment rates, NEET rates and employment rates for EU countries and Turkey. It is observed that women and especially young women in Turkey are both disadvantaged in accessing the education system and have difficulties in participating in the labor market. This situation necessitates structural reforms to harmonize with the European Union countries on gender equality and youth employment. At the same time, the fact that NEET rates are quite high compared to European Union countries can be understood from the data in Table 1 that there are problems in the full integration of the young population in Turkey into socio-economic life. In European Union countries, on the other hand, there is a more balanced distribution in terms of NEETs, but in Southern European countries such as Spain, youth unemployment rates are high. In this respect, it would not be wrong to state that there are similarities between Turkey and European Union countries. This research, which aims to reveal the interpretations made based only on these data by using statistical methods, will contribute to the literature in terms of the similarities and differences between Turkey and the European Union countries in terms of the youth labor market by using the cluster analysis method.
Cluster analysis is a method that aims to identify the endogenous groups of unlabeled data in the words of Abonyi and Feil [45]. Cluster analysis is one of the multivariate statistical methods and is a statistical method used to classify groups based on their similarities and differences [46]. It is an objective method that allows the data collected using this method to be classified based on their structural characteristics. The techniques related to clustering analysis are divided into two groups in the literature: hierarchical and non-hierarchical [47]. Hierarchical clustering method is divided into two groups. These are called agglomerative and divisive methods. Agglomerative hierarchical clustering method is one of the most widely used techniques in the literature. In this method, all observations are gathered in a single cluster in the first stage and then new clusters are formed by separating outlier observation values from the cluster. According to this method, “Single Linkage Method, Full Linkage Method, Average Linkage Method, Ward’s Method and Centralized Method” are used to form clusters. These are respectively [47];
- -
- Single Connection Method: It is based on short distances,
- -
- Full Link Method: Based on the distance between the two most distant observations,
- -
- Average Linkage Method: Considers observation values that fall in the middle of the cluster,
- -
- Ward’s Method: Based on the average distances of observation values within the cluster,
- -
- Centralized Method: Based on averages of observations in the data.
In hierarchical clustering methods, the “number of clusters” is determined using criteria such as distance coefficients, dendrogram and aggregation coefficients [48].
Non-hierarchical clustering methods are divided into three. These are sequential initialization, parallel initialization and average separation techniques. The most widely used technique among these is “K-Means” [48]. In the non-hierarchical clustering method, the number of clusters is determined based on the experience of the researcher and knowledge of the literature. In the non-hierarchical clustering technique, the repetition of the process and the convergence criteria being between “0-1” make the results more reliable. Despite this advantage, the interpretation of the method may be more difficult than the other method [48].
In summary, cluster analysis is an important technique widely used in the classification of data collected in social sciences, which can be realized with hierarchical or non-hierarchical approaches. Hierarchical and non-hierarchical techniques have their own advantages and disadvantages. In both methods, the experience of the researcher and the nature of the data set are important in determining which method to use in the analysis.
Based on the information stated regarding the cluster analysis method, the data set to be used in the study was included in the analysis as 4 main variables: youth unemployment rates, NEET (youth neither in education nor in employment) rates, youth labor force participation rates and youth employment rates. The 30 observation units including the European Union (27 countries) and Turkey will be compared through cluster analysis.
In the cluster analysis literature, it is stated that the number of observations should be 3-4 times higher than the number of variables for the required sample size [47]. The data set used in this study easily meets this situation stated in the literature. Since the variables used in the data set are also proportional expressions, Z scores were neglected and direct analysis was started. At the same time, Ward’s method, one of the hierarchical clustering methods, was preferred in accordance with the content of the data set. The reason for this preference is that it minimizes the variance within the clusters [46,49]. In Ward’s method, the sum of error squares is calculated as follows:
In equation (1), “i” in the expression “xi” refers to the observation value. In clustering analysis, the process starts from the step where each observation value is a cluster. Therefore, the ESS expresses the value “0” [50]. Subsequently, the groups resulting in minimum increase are obtained [46]. While calculating the “Square Euclidean” distance is generally preferred when applying Ward’s method, the number of clusters is determined according to the experience and knowledge level of the researcher [49]. In line with these explanations, in the study, 2 and 4 cluster analyses were carried out in the range of 5-25 threshold values and the cluster belonging table, square Euclidean distance and cluster belonging table were created for each observation unit. Accordingly, as a result of the literature research, it was decided that the data set should be collected in 2 clusters. After the number of clusters was determined, comments were made according to the cluster groups. In the last part of the analysis, results were obtained by using the K-Average method to determine the differences between clusters in the context of labor market indicators. Following these results, the study is completed by including various inferences where quantitative findings are explained with qualitative predictions accompanied by scatter graphs in order to interpret all these results from a holistic perspective.
3. Results
There are three methods for determining the number of clusters: distance coefficients, dendrogram and agglomeration table coefficients in order to determine the number of clusters in advance as the first stage of the analysis [48]. Since Ward’s method, one of the hierarchical clustering methods, is preferred in this study, square Euclidean values should be calculated as distance criteria [49]. In order to calculate the square Euclidean distance, the Euclidean distance must first be calculated. The distance between two observations can be calculated from the Pythagorean relation using the formula in equation (2):
The p-variable structure in the equation represents the Euclidean distance between the i. and j. observations. “ “ indicates the kth variable value of the i. observation. “ “ indicates the kth variable value of the jth observation. “ “ indicates the number of variables [49].
Equation (3) is the Square Euclidean distance measure. The following Figure 1 values were obtained by applying the data set through the formula shown in this equation.
As can be seen from Figure 1, the countries with the lowest distance in the square Euclidean distance matrix are more similar to each other in terms of the youth labor market. Accordingly, according to the square Euclidean distance of the basic labor force indicators of the European Union countries and Turkey, it is seen that the distance of countries such as Slovenia, Portugal, Poland, Lithuania, Hungary is shorter than other European Union countries. Accordingly, it would not be wrong to state that Turkey’s youth labor market is similar to Eastern and Southern European countries. On the contrary, the fact that the square Euclidean distance with countries such as the Netherlands, Sweden and Germany is the furthest, it will be possible to state that Turkey differs especially from Northern European countries in this area. On the other hand, it can be stated that the distances between Estonia-Latvia, Latvia-Poland, Spain-Italy country pairs are quite close to each other and therefore have similar characteristics in terms of young labor force. In general, it is possible to say that the decrease in geographical distances between countries creates similar characteristics in their labor markets. If a general comment is made on Turkey’s squared Euclidean values, it is understood from Figure 1 that Turkey cannot be directly included in the clusters formed by the central countries in the European Union. Although Turkey is close to Eastern European countries in terms of geographical location, its long distance to other European Union countries differentiates Turkey in terms of the youth labor market.

Table 2.
Hierarchical Clustering Process Table.
| Phase One | Cluster Coalescence | Coefficients | Clustering First Stage View | Second Phase | ||
|---|---|---|---|---|---|---|
| Cluster 1 | Cluster 2 | Cluster 1 | Cluster 2 | |||
| 1 | 11 | 14 | 14.205 | 0 | 0 | 6 |
| 2 | 8 | 19 | 34.770 | 0 | 0 | 8 |
| 3 | 18 | 22 | 56.225 | 0 | 0 | 11 |
| 4 | 15 | 25 | 85.515 | 0 | 0 | 15 |
| 5 | 17 | 23 | 115.590 | 0 | 0 | 17 |
| 6 | 7 | 11 | 158.438 | 0 | 1 | 9 |
| 7 | 9 | 13 | 205.083 | 0 | 0 | 12 |
| 8 | 6 | 8 | 253.865 | 0 | 2 | 19 |
| 9 | 1 | 7 | 316.839 | 0 | 6 | 24 |
| 10 | 12 | 26 | 382.414 | 0 | 0 | 18 |
| 11 | 2 | 18 | 454.953 | 0 | 3 | 16 |
| 12 | 9 | 24 | 545.174 | 7 | 0 | 20 |
| 13 | 5 | 21 | 636.259 | 0 | 0 | 19 |
| 14 | 27 | 28 | 729.399 | 0 | 0 | 22 |
| 15 | 15 | 16 | 864.276 | 4 | 0 | 16 |
| 16 | 2 | 15 | 1013.606 | 11 | 15 | 21 |
| 17 | 10 | 17 | 1248.524 | 0 | 5 | 23 |
| 18 | 3 | 12 | 1500.323 | 0 | 10 | 20 |
| 19 | 5 | 6 | 1822.963 | 13 | 8 | 22 |
| 20 | 3 | 9 | 2171.315 | 18 | 12 | 23 |
| 21 | 2 | 4 | 2537.462 | 16 | 0 | 25 |
| 22 | 5 | 27 | 3134.518 | 19 | 14 | 26 |
| 23 | 3 | 10 | 3924.302 | 20 | 17 | 27 |
| 24 | 1 | 29 | 4870.983 | 9 | 0 | 25 |
| 25 | 1 | 2 | 6477.891 | 24 | 21 | 27 |
| 26 | 5 | 20 | 8956.026 | 22 | 0 | 28 |
| 27 | 1 | 3 | 12242.528 | 25 | 23 | 28 |
| 28 | 1 | 5 | 35295.201 | 27 | 26 | 0 |
This table shows the hierarchical clustering stages. At each stage, the Coefficients coefficient lists how the two clusters merge and how much difference this merging makes. Since the clusters in the first stage are very similar to each other, the Coefficients (merging distance) is lower. For example, the distance between countries 11 and 14 in the first phase is 14.205, the shortest distance. In the second stage, as more distant clusters merge, the distance between clusters increases, indicating that more disparate groups are becoming similar to each other. In this table, what is important for clustering analysis is the high or low coefficient of coefficients. Because the increase in this coefficient indicates that clusters that are less similar to each other are merged. In other words, the increase in the differences between the clusters in the table above should be interpreted as less similar countries forming a cluster. In particular, the fact that the coefficents coefficient increases rapidly after Stage 20 in the table shows that the clusters after this stage are almost less similar to each other. Therefore, even if the combinations after these stages are statistically significant, it is understood that countries neglect the characteristics of the young labor market.
Another method used to determine the number of clusters is the dendrogram method. According to the data set of the European Union countries and Turkey’s young labor force, a dendrogram was prepared within the framework of 5-10-15-20 thresholds and visualized as follows. The dendrogram method created according to the Ward linkage method reveals the similarities and differences between the clusters by statistically rescaling the distances of the countries from each other. The dendrogram shown in Figure 2 below was created in order to make the similarities and differences between the European Union countries and Turkey more apparent.
The dendrogram shows the clusters of countries that are similar to each other between threshold values 0-25. In this analysis, it is stated that as the similarities between countries increase, they converge at a distance close to 0 (zero), and as the similarities between countries decrease, they converge at a distance of 25 units [51].
Figure 2 shows the dendrogram showing the combined distances between the threshold values 0-25 as mentioned above. When the distance between countries reaches the threshold value of 25, it is understood that a single cluster covers all countries. In this case, it is necessary to select the most efficient level for the data set to be used in the study. When Figure is analyzed in detail, it is seen that when the threshold value is set as 5 distances, smaller and more clusters are formed. Even if the selection of smaller distances enables a tighter definition of the similarities between countries, the fact that countries form clusters on their own is not an appropriate situation in terms of clustering analysis [48]. Therefore, in this clustering analysis, the initial cluster center values of the dataset should be determined in order to understand both geographical effects and the labor market more clearly.
Table 3 shows the initial values with which the data were analyzed before cluster analysis. Accordingly, the data were divided into 2 clusters. Initial averages are given for each variable in the observations. For example, male youth unemployment rate was initialized as 70.80 in the first cluster and 26.60 in the second cluster. This shows how different the clusters are from each other. The table showing which countries are in the 2 clusters formed according to these initial values is shown below.
Table 4 shows which countries are integrated into which cluster. The distance shows the distance of the countries to the cluster center. Accordingly, 8 of the 29 observation units included in the study (Denmark, Germany, Ireland, Malta, Malta, Netherlands, Austria, Finland and Sweden) were included in the first cluster. The other countries and Turkey are included in Cluster 2. As mentioned in the theoretical section, this situation can be attributed to the socio-economic differences between the countries in the north and the countries in the south of the European Union. Similarly, the fact that Turkey is the farthest country from the center in terms of distance among the countries in Cluster 2 can be interpreted as showing similarities in certain points in terms of youth labor market dynamics, but not exactly similar to the European Union countries. As a matter of fact, Greece (28,921), which is the farthest country from the center after Turkey in Cluster group 2, has diverged from the European Union countries in this sense and it can be stated that it has similar youth labor market problems with Turkey. This geographical similarity is also similar to the study of Pashnichu et al. [43].
While the center distances shown in Table 5 show the distances to the centers of the clusters belonging to the observation unit, the final cluster center values shown in Table 6 show the arithmetic averages of the variables according to the clusters. In this context, when the clustering analysis is completed, it would be appropriate to state that the country groups in Cluster 1 are generally more positive in the labor market than the countries in Cluster 2 in terms of the final average values of each cluster. For example, when the variable values for the labor force participation rate of young people are analyzed, while it was 59.44 in Cluster 1, this value decreased to 37.79 in Cluster 2. On the other hand, when unemployment rates and NEET rates are evaluated, it is statistically determined that the values of the countries in Cluster 2 are higher. This situation can undoubtedly be expressed as a result of imbalances in the labor market. The final cluster center values summarize the profiles of the clusters and help to understand the differences between the two clusters more clearly. On the other hand, the Euclidean value showing the distance of the clusters from each other as a result of the analysis was found to be a very high value of 63.082. This situation should be interpreted as the similarities of the clusters to each other are quite different. As a matter of fact, this result reflects a similar situation with the studies in the literature and shows that northern countries have a more balanced youth labor market dynamics than southern countries [13,14,18,20,44].
The results of inter-cluster analyses contain very valuable results for social scientists. The statistical significance values of these results are also of great scientific importance. For this reason, in order to measure whether the differences between the clusters are significant in the studies conducted, normality tests were first performed on the data. According to the results of normality tests, it was determined that the variables were not suitable for normal distribution. Therefore, Mann-Withney U Test [52] , one of the non-parametric tests, was applied to determine whether there are statistically significant differences between the variables. The results of the Mann-Withney U test are presented in Table 6 below.
When Table 6 is examined, it is determined according to the Mann-Withney U test results that there are significant differences between the clusters formed according to the youth labor market variables. Accordingly, it is concluded that there are statistically significant differences between cluster 1 and cluster 2 in all indicators related to labor force participation rates, unemployment rates, NEET rates and employment rates of young people. Accordingly, when the variables and subgroups of youth labor force participation, unemployment, NEET and employment rates are analyzed, it is seen that there is a statistically strong significant difference between the values of the countries belonging to cluster 1 and the values of the countries belonging to cluster 2. This situation can be stated that the labor market dynamics implemented by the countries belonging to cluster 1 for young people are better than the countries in cluster 2. In this respect, as a result of the clustering analysis, it would not be wrong to state that the differences between the two clusters are significant and the two clusters are distinctly differentiated. When the table is evaluated in terms of Turkey, it is curious whether there is a significant divergence between Turkey and the European Union countries in terms of youth unemployment and youth employment rates. In order to examine this situation closely, the scatter plot showing the sum of youth employment and unemployment rates in the observation units is presented in Figure 3.
When Figure 3 is closely analyzed with a focus on Turkey, it is observed that Turkey is above the EU(27) average in terms of youth employment rates but below the average of countries such as the Netherlands, Austria, Denmark and Ireland. On the other hand, it would not be wrong to say that Turkey, which lags behind the EU (27) in terms of youth unemployment rates, is nevertheless in a better position than many European Union countries such as Spain, Italy and Greece. However, within the framework of a general assessment, it should not be overlooked that Turkey in cluster 2 is significantly different from the EU countries in cluster 1 in terms of youth labor market variables.
In terms of NEET rates, which indicate that young people are out of education and employment, Turkey and the European Union countries diverge from each other. It is possible to state that the NEET situation, which is one of the most important problem areas of the labor market along with unemployment, is more negative for young people in Turkey than young people in the European Union countries in terms of labor force or education. In order to examine this situation closely, the scatterplot of the NEET rates in the observation units showing the gender breakdown of male and female NEET rates into male and female is presented in Figure 4.
As can be seen in Figure 4, in terms of both female and male NEET rates, Turkey is positioned at a very distinct negative point, completely diverging from other European countries. This situation indicates that Turkey’s main problem in the youth labor market is NEET and that the future convergence problem towards the EU will also be NEET. However, in order to make an analysis across all indicators, Figure 5 presents the scatter plot matrix across all indicators.
As can be seen in Figure 5, although Turkey is in cluster 2, it differs from many EU countries in terms of the internal dynamics of its labor market. In this framework, first and foremost, gender differences in the youth labor market in Turkey stand out. Accordingly, the most dramatic differences are observed in labor force participation rates, unemployment rates, NEET rates and finally employment rates. In this framework, in comparison with the EU, labor force participation rates for young men are above the EU average, while labor force participation rates for young women are below the EU average. It is observed that there is no significant divergence in the unemployment rate for young men, whereas there is a significant divergence in the unemployment rate for young women. The most dramatic finding is observed in the NEET rates for both men and women. All these observations and statistical results show that Turkey’s youth labor market diverges significantly from the European Union countries in the integration of education and employment and that the main convergence problem in the future will take place within the framework of NEET.
4. Discussion
With the clustering analysis, European Union countries and Turkey are divided into 2 clusters in terms of youth labor market variables. The countries included in the first cluster include countries with better labor market dynamics than the countries included in Cluster 2 in terms of labor market dynamics. The results of the clustering analysis show that the statement that there are similarities and differences between the countries in the two groups in terms of socio-economic characteristics [18,43] is statistically supported in line with the literature.
When Turkey’s position is evaluated in general, it is located in the 2nd cluster as seen in the “Clustering Table”. Even if there are other European Union countries in this cluster, it would not be wrong to state that the closest similarity is with Greece [44]. In general, looking at all countries in the dataset, this situation reveals that the Northern countries in Europe have a more balanced labor market dynamics than the Southern countries [13,14,18,20,45]. As a matter of fact, while Turkey’s distance to the center of cluster 2 is 38,337, Greece’s distance to the center is 28,921, making it the farthest country after Turkey. This should be interpreted as the fact that although these two countries are similar to cluster 2 countries, their distances to the cluster center are relatively high and therefore they differ from other countries in terms of some labor market characteristics. For instance, Belgium (10.151 distances), Spain (21.800 distances) and France (20.391 distances), which are assigned to cluster 2, have lower distances to the cluster center than Turkey.
It is thought that one of the main reasons for this negative picture that Turkey has experienced during the candidacy process is the failures in the robustness of the education-employment pattern. As a matter of fact, Ryan’s study in 2001 concluded that the education model in developed economies more clearly constructs the education-employment pattern [34]. This is seen as the most important reason for the low youth unemployment rates of countries such as Germany, which is included in the cluster of Northern countries in the data set used in the study [35]. On the other hand, it is understood that youth unemployment rates remain higher in countries in the 2nd cluster such as Turkey due to the weakness of the education-employment pattern and the incompatibility between the labor market and education [25]. Another important reason is the structural reform needs of labor markets within the framework of new competencies. In this case, it can be stated that one of the common problems of the countries in cluster 2 is the low rates of women’s participation in employment and high rates of informal employment. In the process of economic convergence with the European Union, countries in this cluster, and especially Turkey, should implement policies that increase women’s labor force participation rates and implement labor market activities that reduce informality [9].
5. Conclusions
The European Union was established to protect and improve the welfare of the countries in the European continent, and its bilateral relations with Turkey have been ongoing since the 1950s. For developing countries such as Turkey, accession to the European Union is one of the priority areas with a high degree of importance in line with sustainable development goals. On the other hand, Turkey’s geographical proximity to the European Union and socio-economic similarities have been effective in bringing Turkey closer to the European Union countries over the years.
The process of full membership to the European Union requires Turkey to be similar to the European Union member states in some aspects. As a matter of fact, certain socio-economic criteria have been set in the membership process for this similarity and full compliance with these criteria has been demanded. It is observed that Turkey is making great efforts both to comply with these criteria and to develop rapidly in line with its sustainable development goals. However, it is understood that this effort has been hindered from time to time due to some problems experienced on a global scale. Therefore, it is important to know to what extent Turkey’s policies for young people in the labor market in line with sustainable development goals are compatible with the policies of the European Union countries in this direction. From this point of view, the aim of this study is to reveal with which European Union country or countries Turkey is similar or differentiated through cluster analysis within the framework of youth labor force indicators.
According to the results of the research, Turkey is in an extreme situation and the differences with the European Union countries are more pronounced and the labor market is more problematic compared to these countries. At the same time, when we look at the average values of the 2nd cluster where Turkey is located:
- Youth Unemployment Rate: In Turkey’s cluster, the average male youth unemployment rate is 37.79% and the average female youth unemployment rate is 29.97%. However, it has been determined that youth unemployment rates in Turkey are quite high compared to the European Union countries, especially for women. While female unemployment in Turkey is as high as 23.4%, the EU average is well below this level.
- NEET (Young People Neither in Education nor Employment): Turkey is in a remarkable situation in terms of its negative divergence from its cluster in terms of NEET rate. While cluster 2 has an average NEET rate of 10.15%, Turkey’s NEET rate is 22.4%, almost twice as high as its cluster. This shows that Turkey’s young population is twice as likely to be out of education and employment compared to the average of European Union countries.
- Temporary Employment Rate: The rate of temporary employment among Turkey’s young population is also high, indicating that Turkey’s young labor force is in a more risky situation in terms of job insecurity compared to the European Union countries.
- The dendrogram graph shows that Turkey is in a group with France, Cyprus, Estonia, Hungary, Hungary and Poland. However, when the distances in the dendrogram are analyzed, Turkey’s distance to these countries is calculated to be higher. Therefore, this shows that Turkey has a different profile in terms of the youth labor market among European Union countries. Although in the dendrogram, Turkey is grouped with mostly medium and low-performing EU countries, it is concluded that Turkey’s labor market is structurally much different from these countries. As a result, it can be stated that Turkey is in a disadvantageous situation when compared to the European Union countries in terms of youth labor market data. Compared to the averages of European Union countries, youth unemployment rates in Turkey are quite high, especially among women, and labor force participation rates of the young labor force are also quite low. At the same time, a significant portion of the young population in Turkey is NEET. The fact that this rate is quite high should be considered as one of the most important social policy problems that Turkey should take measures against due to its long-term consequences.
When the research is evaluated in general terms, it reveals that although Turkey is similar to the European Union countries, it diverges at certain points. It shows that Turkey has some problems in the process of harmonization with the European Union, especially under the theme of sustainability. Among these sustainability themes, the most important problem is experienced in the sub-themes of gender equality in terms of qualified education and employment, where the education-employment pattern is ensured. This situation suggests that young people in Turkey will lead to sustainable life problems in the future, such as healthy and quality life and poverty, leading to an intricate sustainability problem.
Author Contributions
Methodology, A.İ.B., E.E. (Ali İhsan Balcı, Ersin Eraslan); Validation, F.K. (Ferdi Kesikoğlu); Formal analysis, F.K. (Ferdi Kesikoğlu); Investigation, A.İ.B, E.E and F.K.; Resources, A.İ.B, E.E and F.K.. (Ali İhsan Balcı, Ersin Eraslan and Ferdi Kesikoğlu); Data curation, A.İ.B, E.E and F.K. (Ali İhsan Balcı, Ersin Eraslan and Ferdi Kesikoğlu); Writing—original draft, A.İ.B, E.E and F.K. (Ali İhsan Balcı, Ersin Eraslan and Ferdi Kesikoğlu); Writing—review and editing, A.İ.B, E.E and F.K. (Ali İhsan Balcı, Ersin Eraslan and Ferdi Kesikoğlu); Visualization, A.İ.B, E.E and F.K. (Ali İhsan Balcı, Ersin Eraslan and Ferdi Kesikoğlu).
Funding
This research received no external funding.
Data Availability Statement
Data are contained within the article.
Conflicts of Interest
The authors declare no conflicts of interest.
References
- [1] A. Alkaya, «İstihdam ve İşsizlik Açısından Avrupa Bİrliği Üye Ülkeleri ile Türkiye’nin Çok Boyutlu Ölçekleme Analiziyle Değerlendirilmesi,» Avrasya Sosyal ve Ekonomi Araştırmaları Dergisi, cilt 8, no. 4, pp. 257-284, 2021.
- [2] J. Weller, «Youth Employment: Characteristics, Tensions and Challenges,» CEPAL Review, cilt 2007, no. 92, pp. 61-82, 2007. [CrossRef]
- [3] A. Görmüş, «The Micro Determinants of Informal Youth Employment in Turkey,» %1 içinde Unregistered Employment, London, IJOPEC Publication, 2017, pp. 157-169.
- [4] M. Topçu ve L. Biçimveren, «Türkiye’de Bölgesel Genç İşsizlik: Belirleyiciler Cinsiyete Göre Değişken mi?,» İktisat Politikası Araştırmaları Dergisi, cilt 7, no. 2, pp. 51-67, 2020.
- [5] B. Tunçsiper ve E. Z. Rençber, «Türkiye’ de genç işsizlik sorunu ve belirleyicileri üzerine logit model analizi,» International Journal of Social Sciences and Education Research, cilt 6, no. 4, pp. 514-530, 2020. [CrossRef]
- [6] H. Cenger ve İ. Çütcü, «İthalattaki Değişimin Genç İşsizliğe Etkisi: Türkiye Ekonomisi Üzerine Ekonometrik Bir Uygulama,» OPUS Uluslararası Toplum Araştırmaları Dergisi, no. Gençlik Araştırmaları Özel Sayısı, pp. 485-503, 2018. [CrossRef]
- [7] I. Cvecic ve D. Sokolic, «Impact of Public Expenditure in Labour Market Policies and other Selected Factors on Youth Unemployment,» Economic Research, pp. 2060-2080, 2018. [CrossRef]
- [8] E.L. Bazo, T. d. Barrio ve M. Artis, «The Regional Distribution of Spanish Unemployment: A Spatial Analysis,» Papers in Regional Science, cilt 81, no. 3, pp. 365-389, 2002. [CrossRef]
- [9] O.J. Blanchard ve L. F. Katz, «Regional Evolutions,» Brookings Papers on Economic Activity, no. 1, pp. 1-76, 1992.
- [10] S.T. Marston, «Two Views of the Geographic Distribution of Unemployment,» The Quarterly Journal of Economics, cilt 100, no. 1, pp. 57-79, 1985. [CrossRef]
- [11] R. Martin, «Regional Unemployment Disparities and their Dynamics,» Regional Studies, cilt 31, no. 3, pp. 237-252, 1997. [CrossRef]
- [12] S. Bradley, G. Migali ve M. N. Paniagua, «Spatial Variations and Clustering in the Rates of Youth Unemployment and NEET: Analysis of Italy, Spain, and the UK,» Journal of Regional Science, cilt 60, pp. 1074-1107, 2020. [CrossRef]
- [13] M. Fujita ve P. Krugman, «The New Economic Geography: Past, Present and the Future,» Regional Science, cilt 83, p. 139–164, 2004. [CrossRef]
- [14] S. Iammarino, A. Rodriguez-Pose ve M. Storper, «Regional Inequality in Europe: Evidence, Theory and Policy Implications,» Journal of Economic Geography, pp. 1-26, 2018. [CrossRef]
- [15] E. Erdogan ve P. Uyan-Semerci, «COST CA18213 Rural NEETs in Turkey: 2009/2019 Overview,» COST CA18213, 2020.
- [16] A. Görmüş, «Türkiye’de Kayıt Dışı Genç İstihdamı: Hanehalkı İşgücü İstatistiklerinden Cinsiyete Dayalı Bulgular,» Sosyal Güvenlik Dergisi, cilt 13, no. 2, pp. 159-178, 2023. [CrossRef]
- [17] B. Yiğit, Y. B. Çakmak ve E. E. Çakmak, «NEET in Turkey: a Typologyincluding Jobless Youths, Parentaleducation and Employment Status as Determinants,» Education + Trainin, cilt 65, no. 5, pp. 731-748, 2023. [CrossRef]
- [18] Y. Kurtsal, The Problem of Youth Unemployment and Possible Reasons behind It: The Case of Turkey, London: LAP LAMBERT Academic Publishing, 2011.
- [19] World Bank, «Türkiye Economic Monitor,» World Bank, 2024.
- [20] OECD, « OECD Economic Surveys: Türkiye 2023,» OECD Publishing, Paris, 2023.
- [21] E. Tominey ve P. Gregg, «The Wage Scar from Male Youth Unemployment,» Labour Economics, cilt 12, no. 4, pp. 487-509, 2005. [CrossRef]
- [22] P. Redmond ve C. McFadden, «Young People Not in Employment, Education or Training (NEET): Concepts, Consequences and Policy Approaches,» The Economic and Social Review, cilt 54, no. 4, pp. 285-327, 2023.
- [23] Ş. Gökbayrak ve Y. C. Çalışır, «Geleceğin İstihdam Gereksinimlerine Uyumlu Nitelikli İşgücü İhtiyacı ve Beceri Geliştirme Modelleri,» Ankara Üniversitesi Sosyal Bilimler Dergisi, cilt 15, no. 2, pp. 245-257, 2024.
- [24] P. Fredriksson ve P. Johansson, «Employment, mobility, and active labor market programs,», Working Paper, No. 2003:3, Institute for Labour Market Policy Evaluation (IFAU), Uppsala, pp. 1-45, 2003.
- [25] S.T. Jespersen, J. Munch R. ve L. Skipper, «Costs and Benefits of Danish Active Labour Market Programmes,» Labour Economics, cilt 15, no. 5, pp. 859-884, 2008. [CrossRef]
- [26] K. Carling ve K. Richardson, «The Relative Efficiency of Labor Market Programs: Swedish Experience from the 1990s.,» Labour Economics, cilt 11, no. 3, pp. 335-354, 2004. [CrossRef]
- [27] B. Sianesi, «Differential Effects of Active Labour Market Programs for the Unemployed,» Labour Economics, cilt 15, no. 3, pp. 370-399, 2008. [CrossRef]
- [28] J. Kluve, «The Effectiveness of European Active Labor Market Programs,» Labour Economics, cilt 17, no. 6, pp. 904-918, 2010. [CrossRef]
- [29] F. Yeşilkaya, «İşgücü Piyasası Programları ve İstihdam: Seçili Ülkeler Kapsamında Bir Araştırma,» Anadolu Üniversitesi Sosyal Bilimler Dergisi, cilt 24, no. 2, pp. 495-524, 2024. [CrossRef]
- [30] ILO, Youth Employment in Times of COVID, Geneva: International Labour Organization 2021, 2021.
- [31] Eurosatat, «Young people neither in employment nor in education and training by sex, age and citizenship (NEET rates),» 17 10 2024. [Çevrimiçi]. Available: https://ec.europa.eu/eurostat/databrowser/view/edat_lfse_23/default/table?lang=en.
- [32] P. Ryan, «The School-to-Work Transition: A Cross-National Perspective,» JOURNAL OF ECONOMIC LITERATURE, cilt 39, no. 1, pp. 34-92, 2001. [CrossRef]
- [33] W. Eichhorst, H. Hinte ve U. Rinne, «Youth Unemployment in Europe: What to Do about It?,» IZA Policy Papers, pp. 1-21, 2013.
- [34] S. Scarpetta, A. Sonnet ve T. Manfredi, «Rising Youth Unemployment During The Crisis: How to Prevent Negative Long-term Consequences on a Generation?,» OECD Social, Employment and Migration Working Papers, pp. 1-35, 2010.
- [35] M. Krpan, M. G. Kedžo ve B. Žmuk, «Exploring the Link Between Education Length and Employment Outcomes among Youth in Europe: A Hierarchical Clustering Approach,» Business Systems Research Journal, cilt 14, no. 2, pp. 190-213, 2023.
- [36] A.D. Kuswanto, A. N. Fadhila, P. T. Setiawan, M. K. Setiawan ve D. R. Syahputra, «Penerapan K-Means Clustering Untuk Menentukan Jumlah Pengangguran Berdasarkan Umur (Studi Kasus Di Badan Statistik Provinsi DKI Jakarta 2020-2022),» Repeater: Publikasi Teknik Informatika dan Jaringan, cilt 2, no. 3, pp. 135-146, 2024. [CrossRef]
- [37] T. Pavelka ve T. Löster, «The Development of Unemployment in the European Union’s Labour Market Due to the Recent Economic Crisis, Using Cluster Analysis,» %1 içinde Business Challenges in the Changing Economic Landscape, Cham., Springer, 2016. [CrossRef]
- [38] D. Pașnicu, S. Pîrciog, C. Ghinararu ve G. Tudose, «Procedia of Economics and Business Administration,» Procedia of Economics and Business Administration, pp. 222-230, 2014.
- [39] B. Ana-Gabriela ve D. Emanuela-Daniela, «Using Cluster Analysis for Studying the Proximity of Registered Unemployment at the Level of Counties in Romania at the Beginning of the Economic Crisis,» Annals of the Constantin Brâncuşi University of Târgu Jiu, Economy Series, pp. 347-356, 2009.
- [40] J. Abonyi ve B. Feil, Cluster Analysis for Data Mining and System Identification, Basel: Birkhäuser Verlag AG, 2007.
- [41] Z. Çakmak, N. Uzgören ve G. Keçek, «Kümeleme Analizi Teknikleri ile İllerin Kültürel Yapılarına Göre Sınıflandırılması ve Değişimlerinin İncelenmesi,» Dumlupınar Üniversitesi Sosyal Bilimler Dergisi, cilt 12, 2015.
- [42] N. Uçar, «Kümeleme Analizi,» %1 içinde SPSS Uygulamalı Çok Değişkenli İstatistik Teknikleri, Ankara, Dinamik Akademi, 2017, pp. 350-376.
- [43] Y. Karagöz, SPSS ve AMOS23 Uygulamalı istatistiksel analizler, Ankara: Nobel Yayıncılık, 2016.
- [44] N. O’Higgins, «Trends in the Youth Labour Market in Developing and Transition Countries,» Social Protection Discussion Paper Series, pp. 1-52, 2003. [CrossRef]
- [45] H. Lehmann ve A. Muravyev, «Labour Market Institutions and Labour Market Performance,» Economics of Transition, cilt 20, no. 2, p. 235–269, 2012. [CrossRef]
- [46] A. Furlong, J. Goodwin, H. O’Connor, S. Hadfield, S. Hall, K. Lowden ve R. Plugor, Young People in the Labour Market: Past, Present, Future, London: Routledge, 2017.
- [47] R. Alpar, Uygulamalı Çok Değişkenli istatistiki Yöntemler, Ankara: Detay Yayıncılık, 2011.
- [48] M.S. Aldenderfer ve R. K. Blashfield, Cluster analysis, Beverly Hills: SAGE Pub., 1984.
- [49] S. Gürbüz ve F. Şahin, Sosyal Bilimlerde araştırma yöntemleri: Felsefe-Yöntem-Analiz, 3. dü., Ankara: Seçkin Yayıncılık, 2016.
- [50] E.K. Sandal, «Sosyo-Ekonomik Kriterler Bakımından Türkiye, Doğu Avrupa ve Kafkas Ülkelerinin Karşılaştırılması,» Doğu Coğrafya Dergisi, cilt 14, no. 22, pp. 89-105, 2009.
- [51] E. Ahmad ve A. Naz, «An Emprical Analysis of Convergence Hypothesis,» The Pakistan Devolopment Review, cilt 39, no. 4, pp. 729-740, 2000.
- [52] S. Mavroudeas ve C. Siriopoulos, «Τesting Convergence and Divergence: The Data From Greece,» Journal of Applied Business Research, cilt 14, no. 1, pp. 149-157, 1998.
- [53] E. Kusidel, «Convergence in Local Labour Markets,» Acta Unıversıtatıs Lodzıenss Folıa Oeconomıca, no. 252, pp. 61-68, 2011.
Figure 1.
Squared Euclidean Distance Matrix of European Union Countries and Turkey by Key Indicators of Youth Labor Force.
Figure 1.
Squared Euclidean Distance Matrix of European Union Countries and Turkey by Key Indicators of Youth Labor Force.
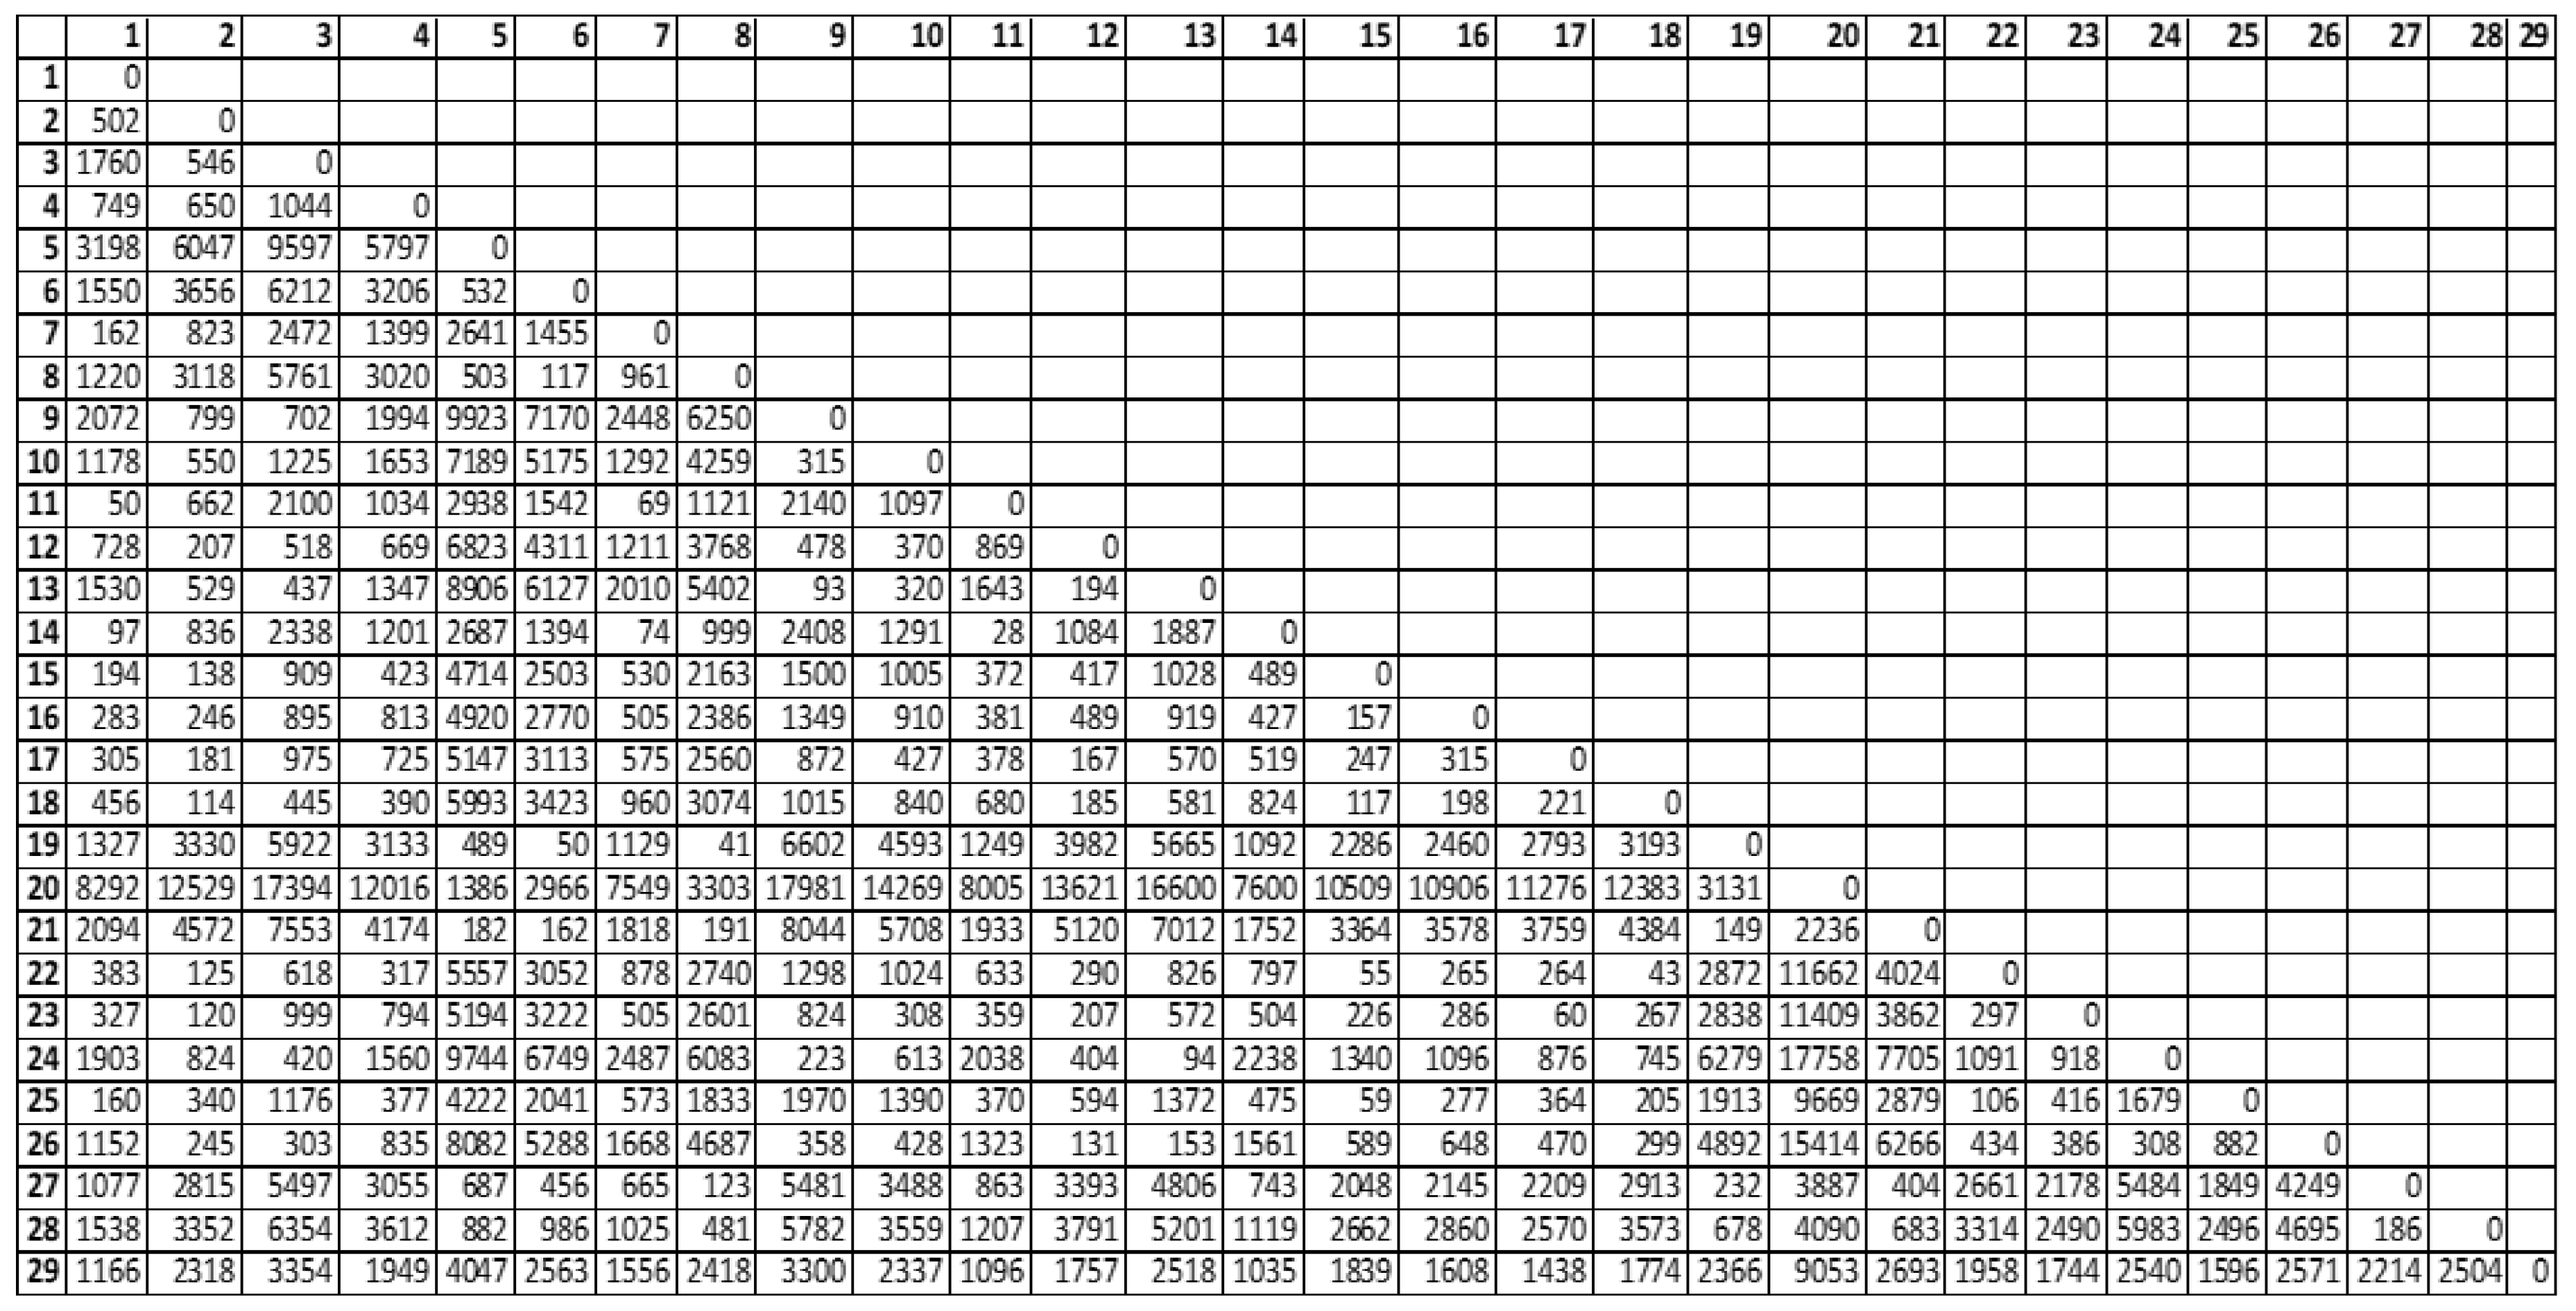
Figure 2.
Dendrogram of Youth Labor Indicators for EU and Turkey.
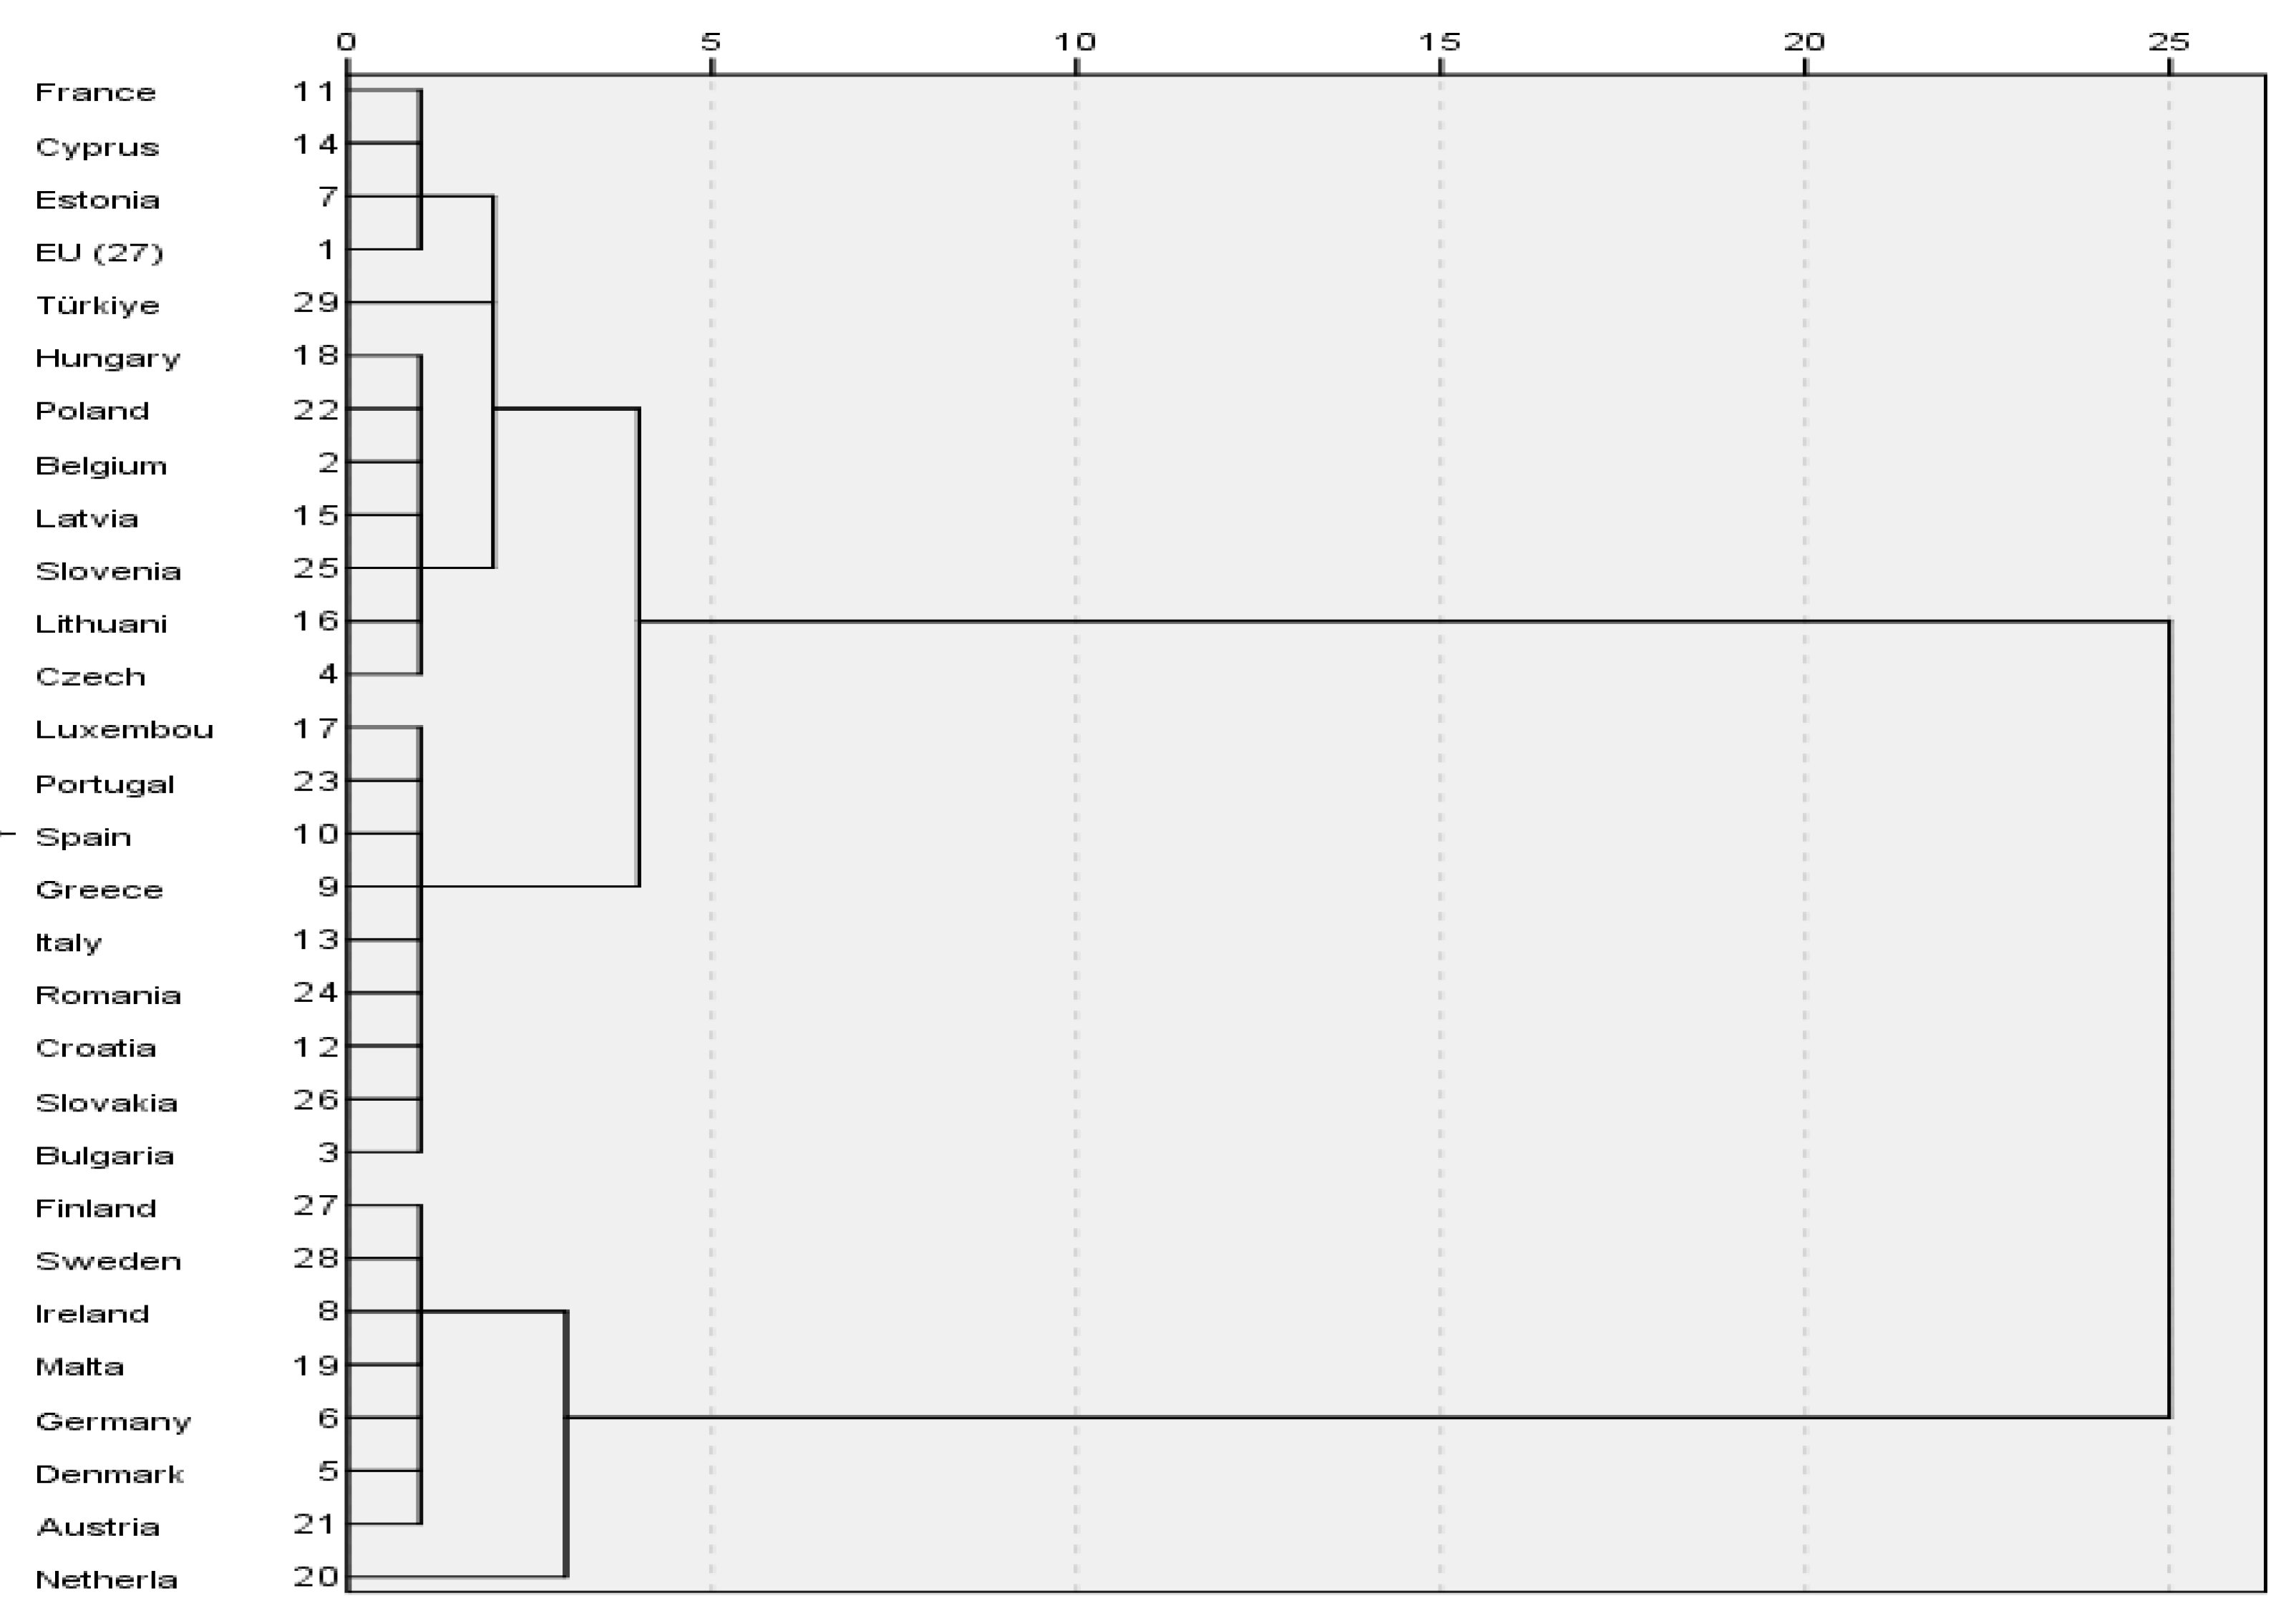
Figure 3.
Scatter Plot of Youth Employment and Unemployment Rates of the European Union and Turkey by Variables.
Figure 3.
Scatter Plot of Youth Employment and Unemployment Rates of the European Union and Turkey by Variables.
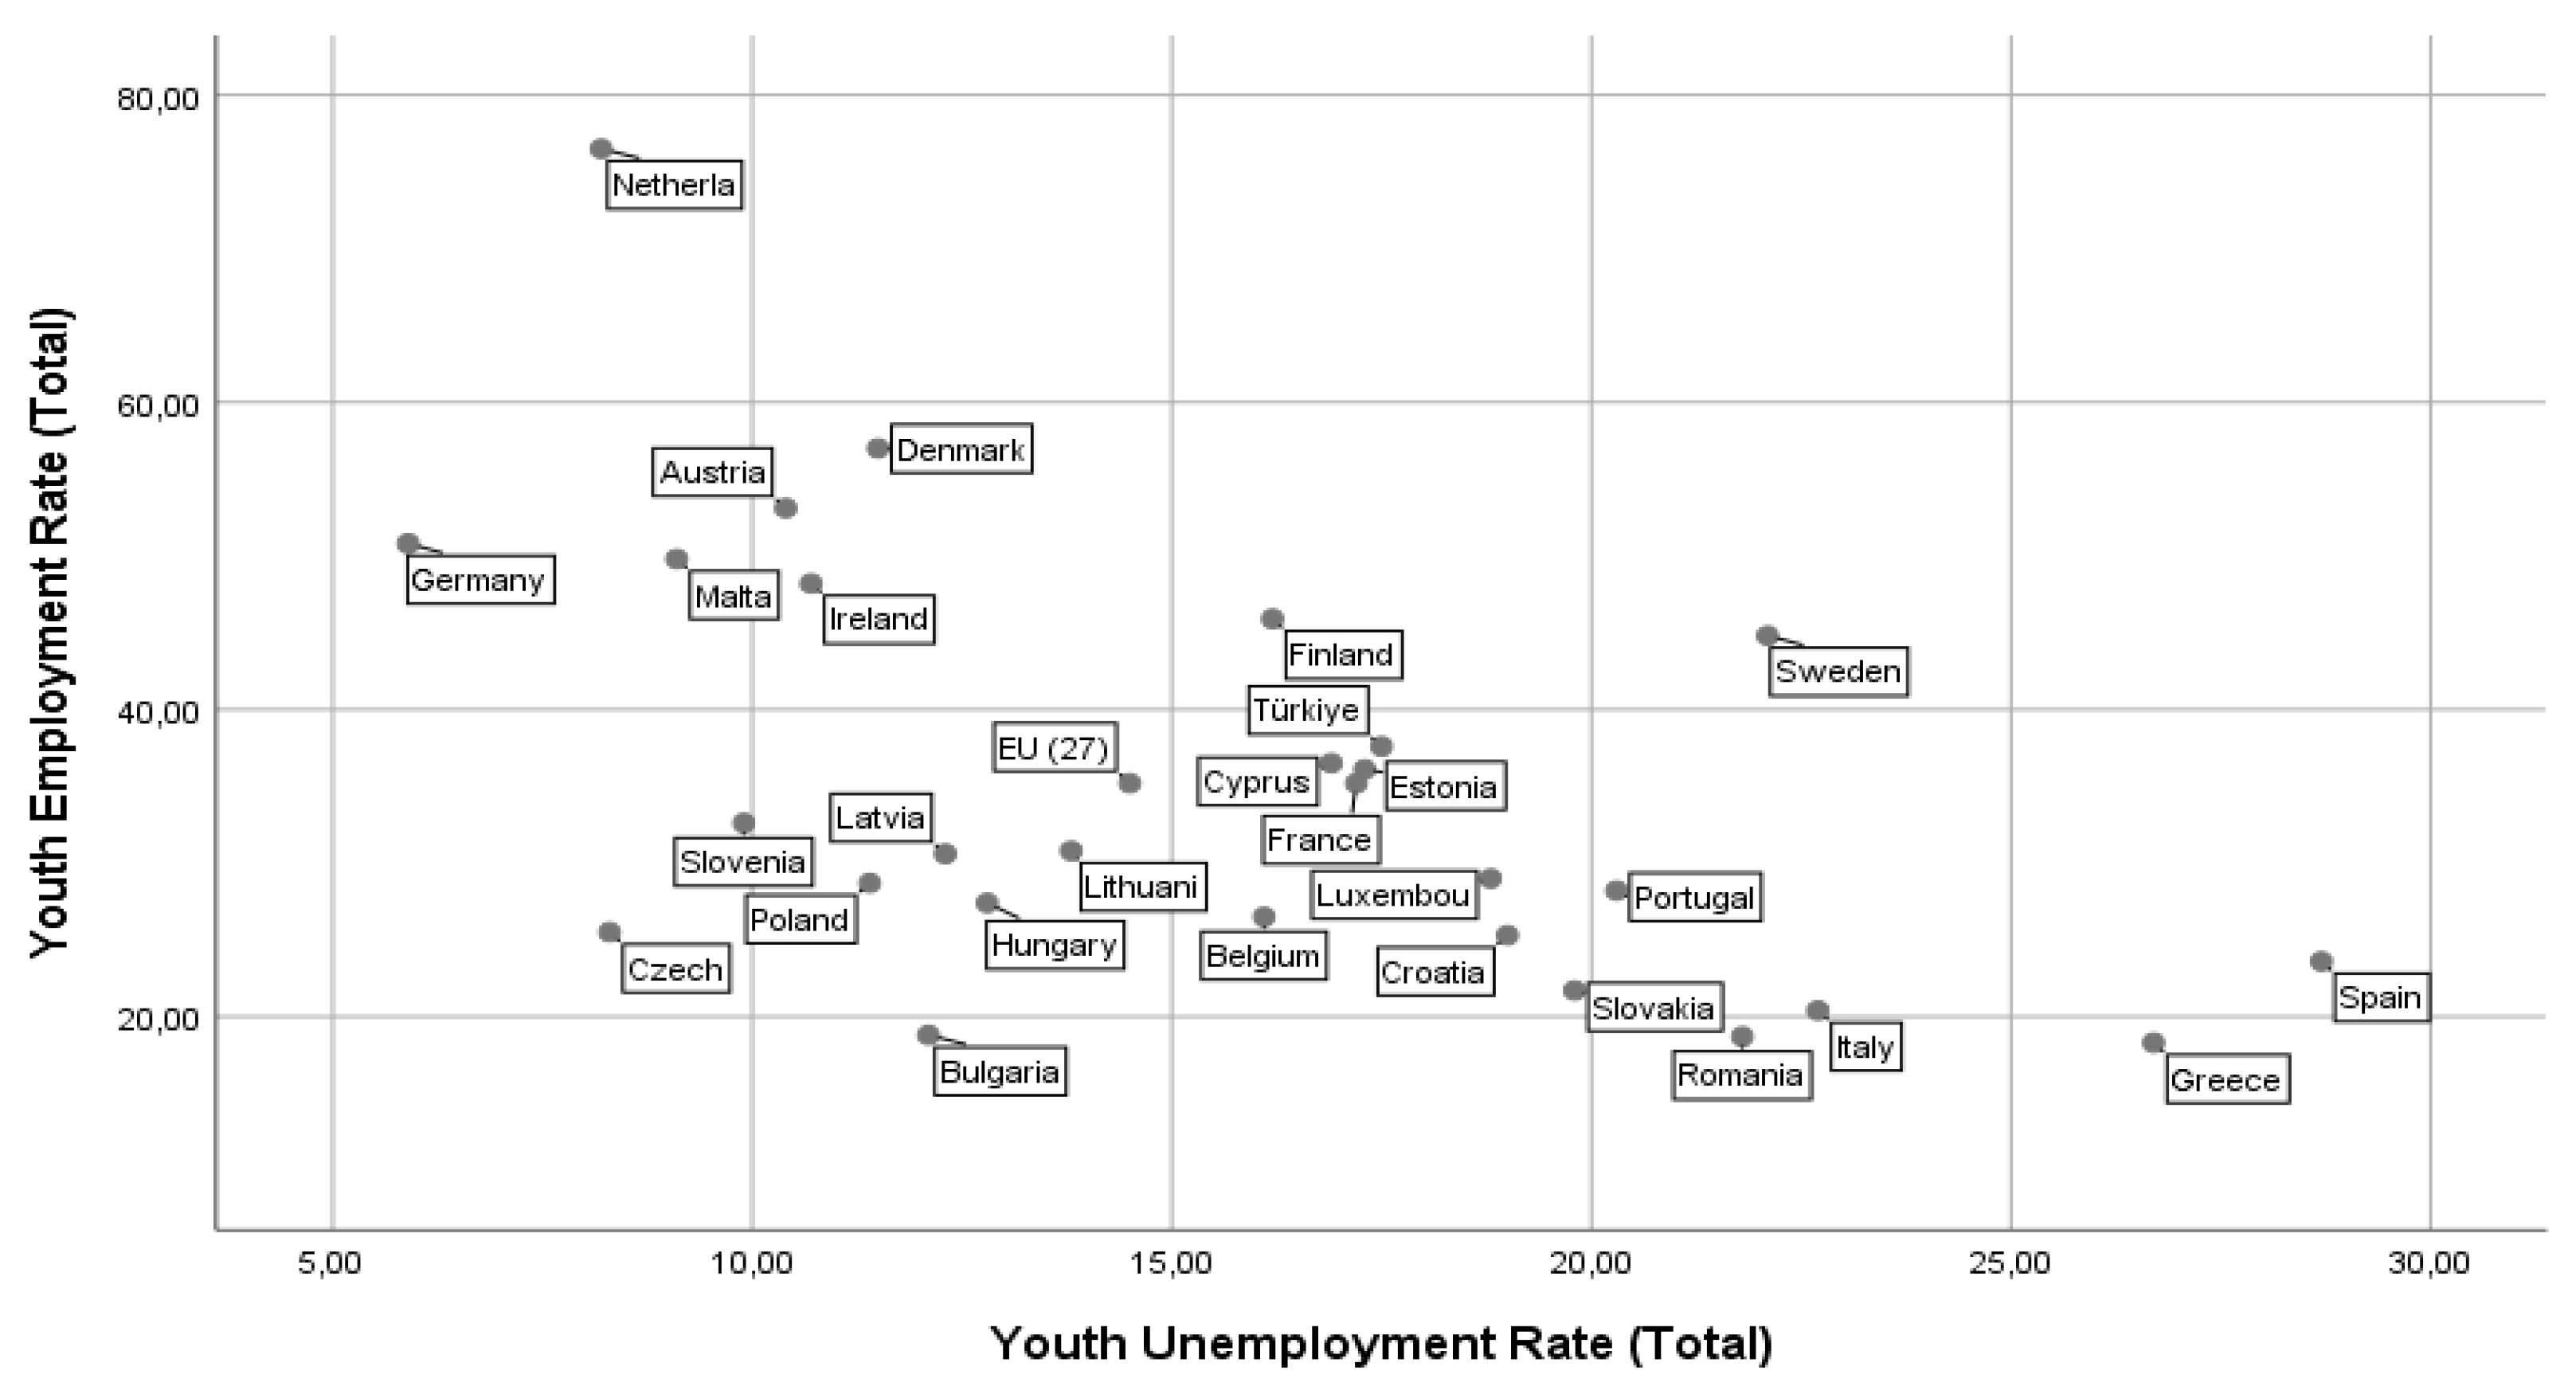
Figure 4.
Scatter Plot of NEET Rates of the European Union and Turkey by Gender Variables.
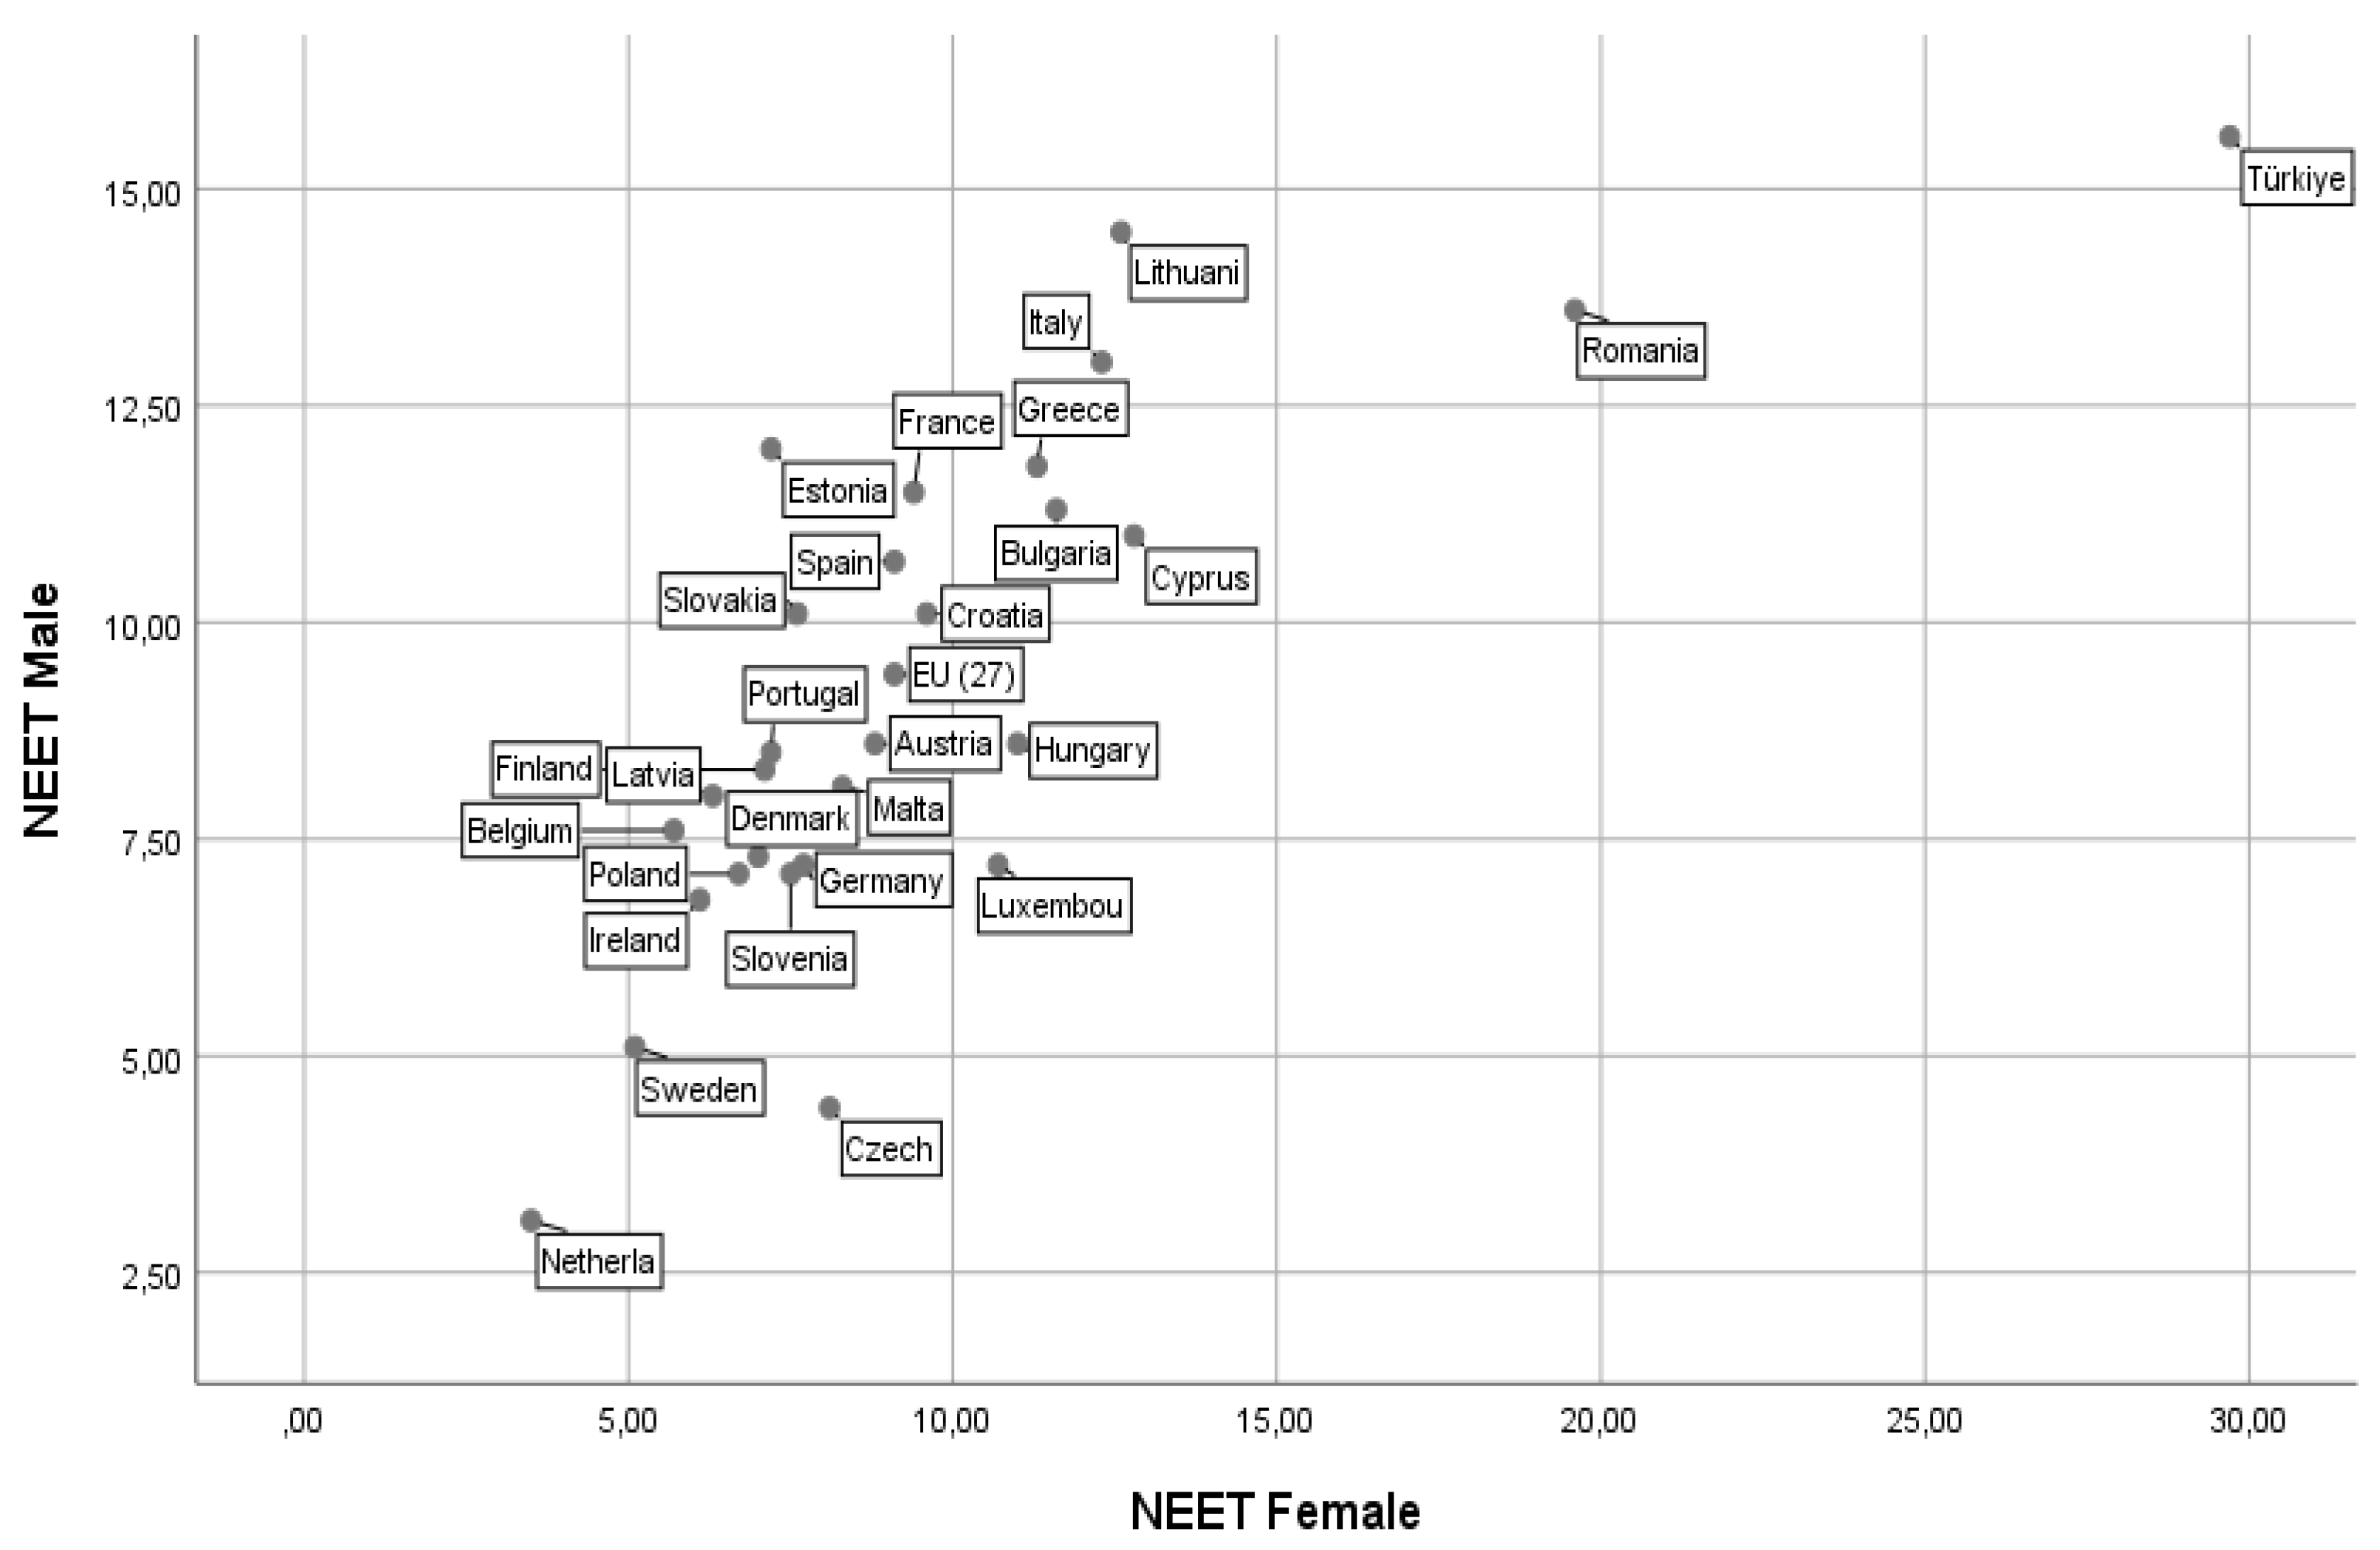
Figure 5.
Scatter Plot Matrix of the European Union and Turkey in terms of All Variables.
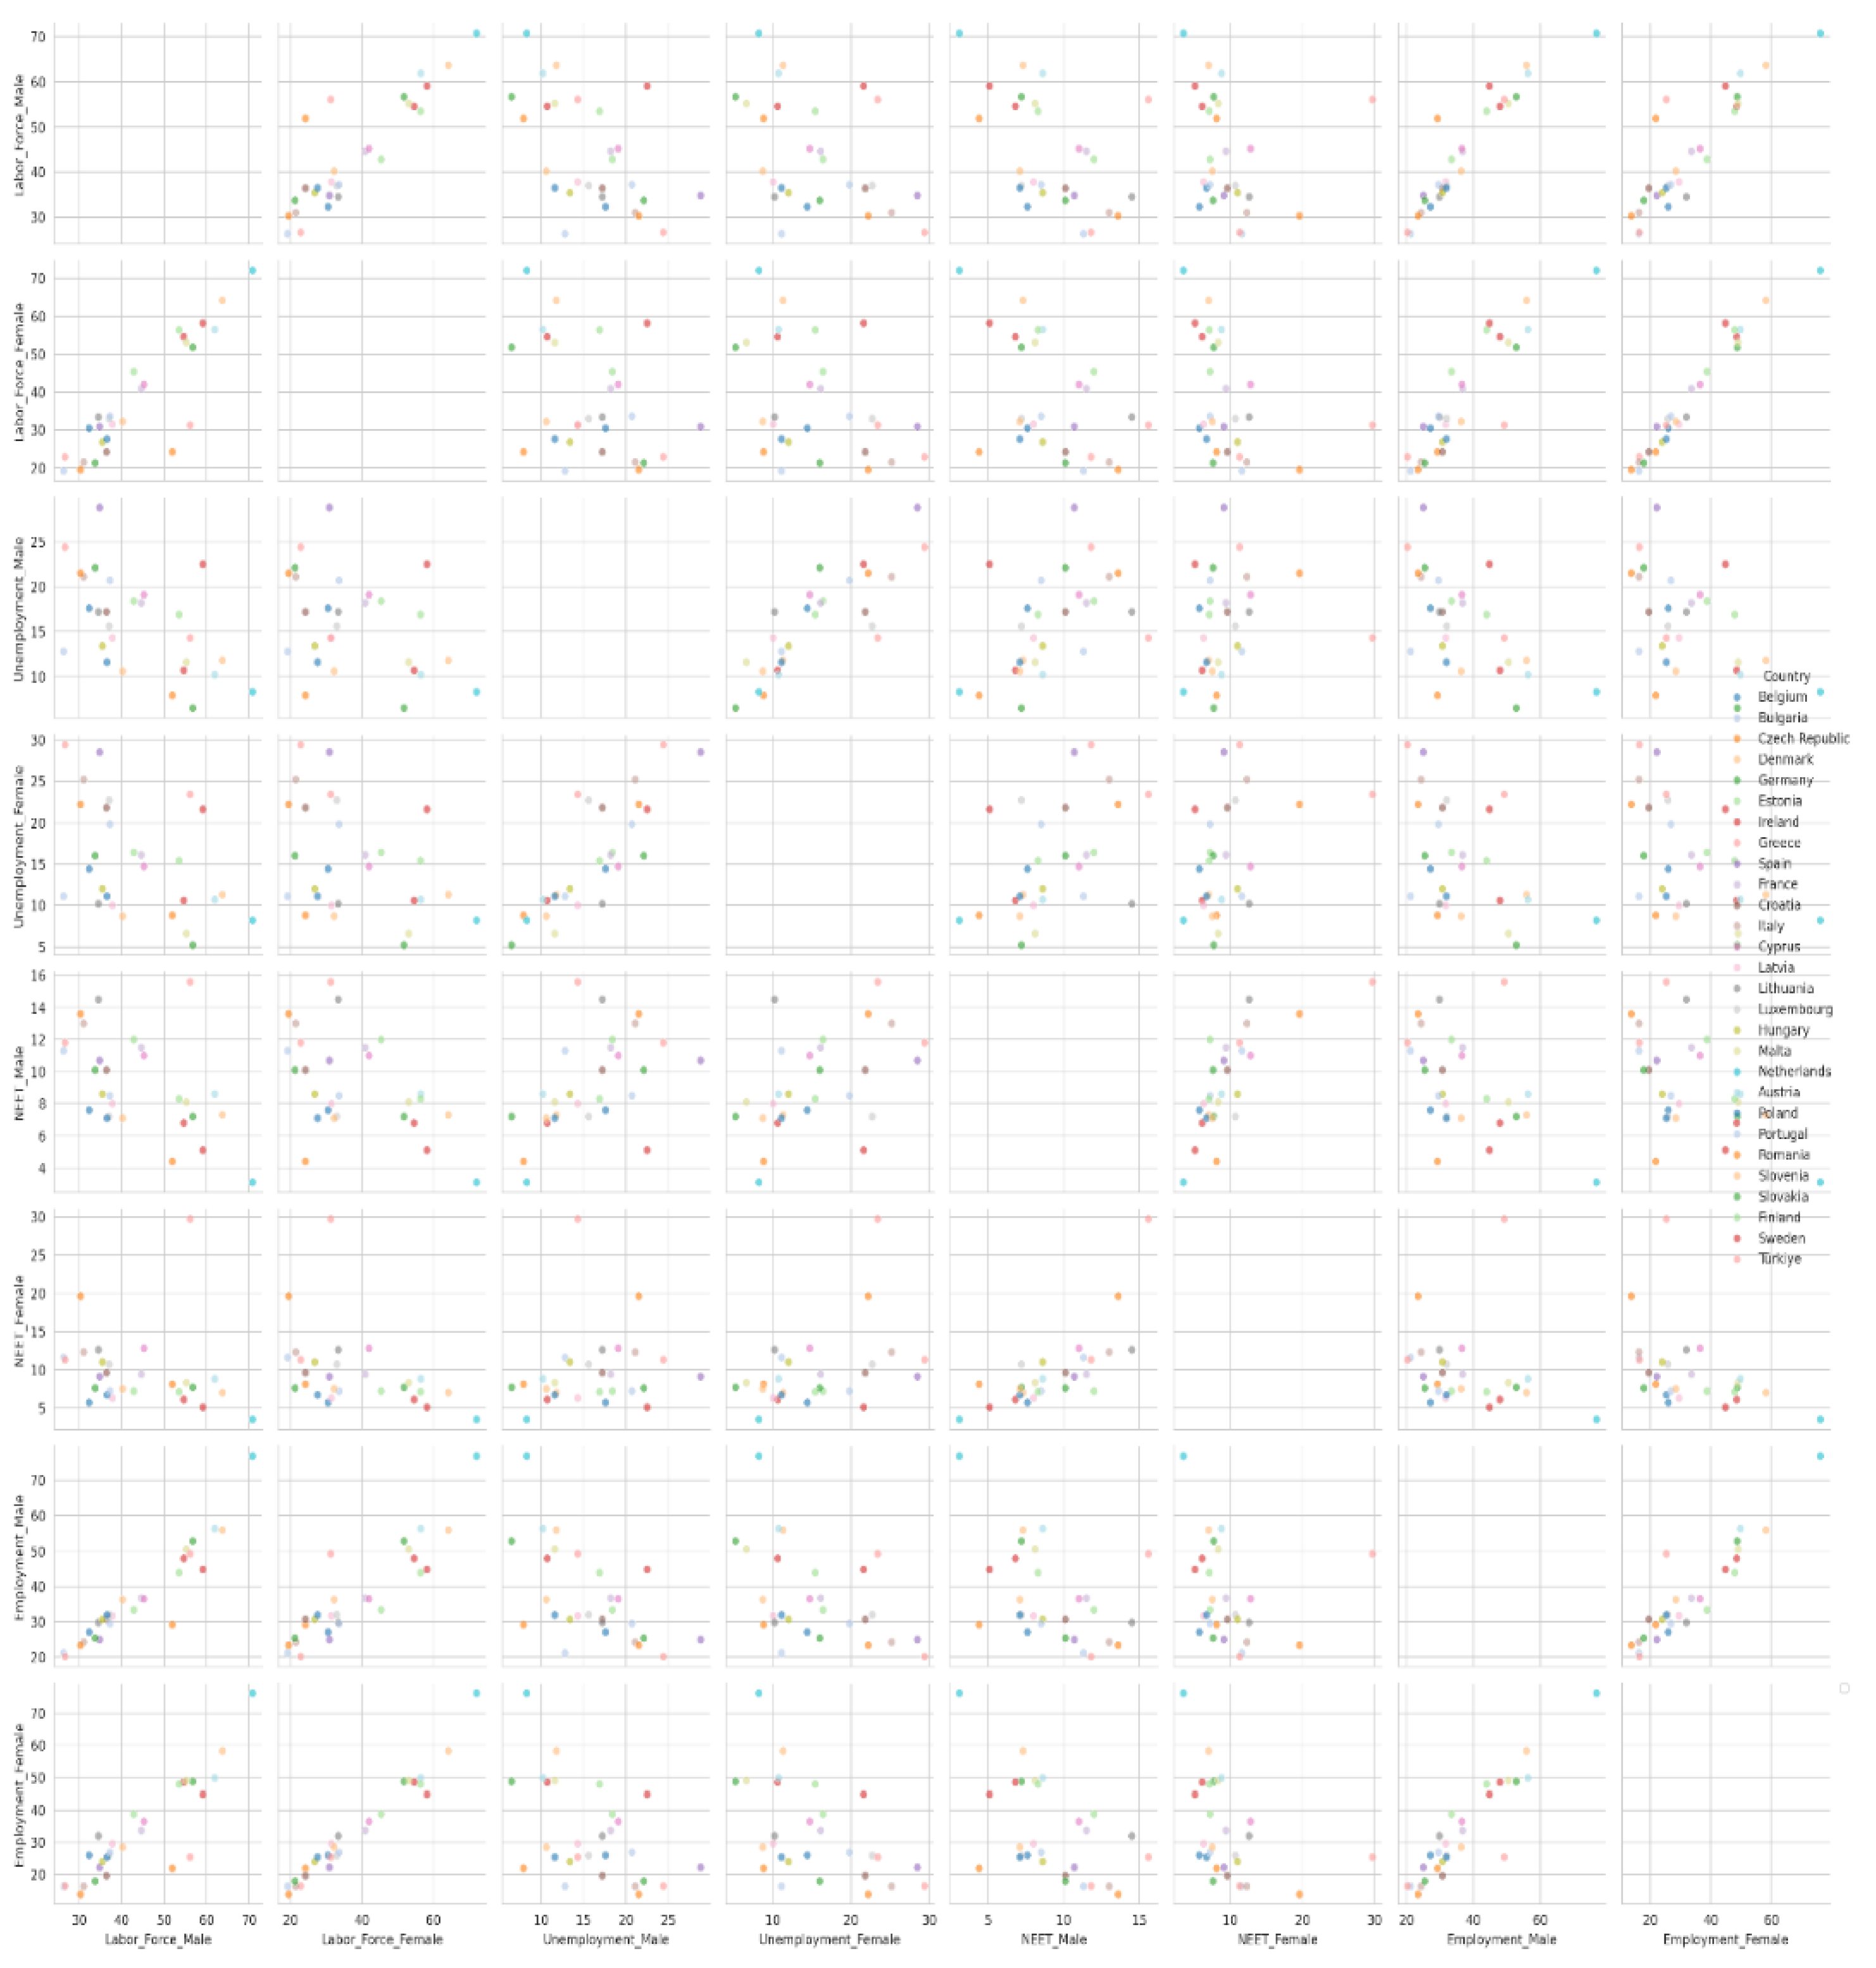
Table 1.
Youth Labor Market Indicators in EU Countries and Turkey.
|
Indicator Units |
Youth Labour Force Participation Rates | Youth Unemployment Rates |
NEET (15-24) |
Youth Employment Rates | |||||||||
| No | Countries | Male | Female | Total | Male | Female | Total | Male | Female | Total | Male | Female | Total |
| 1 | EU (27) | 43 | 37.5 | 40.3 | 14.9 | 14.0 | 14.5 | 9.4 | 9.1 | 9.2 | 37.3 | 33.0 | 35.2 |
| 2 | Belgium | 32.3 | 30.5 | 31.5 | 17.6 | 14.4 | 16.1 | 7.6 | 5.7 | 6.7 | 27.1 | 25.9 | 26.5 |
| 3 | Bulgaria | 26.3 | 19.2 | 22.9 | 12.8 | 11.1 | 12.1 | 11.3 | 11.6 | 11.4 | 21.2 | 16.2 | 18.8 |
| 4 | Czechia | 51.9 | 24.2 | 32.6 | 7.9 | 8.8 | 8.3 | 4.4 | 8.1 | 6.3 | 29.2 | 21.8 | 25.5 |
| 5 | Denmark | 63.7 | 64.2 | 64 | 11.8 | 11.3 | 11.5 | 7.3 | 7.0 | 7.1 | 55.9 | 58.2 | 57.0 |
| 6 | Germany | 56.7 | 51.8 | 54.3 | 6.5 | 5.2 | 5.9 | 7.2 | 7.7 | 7.5 | 52.8 | 48.7 | 50.8 |
| 7 | Estonia | 42.8 | 45.4 | 44.1 | 18.4 | 16.4 | 17.3 | 12.0 | 7.2 | 9.6 | 33.4 | 38.7 | 36.1 |
| 8 | Ireland | 54.6 | 54.6 | 54.6 | 10.7 | 10.6 | 10.7 | 6.8 | 6.1 | 6.5 | 47.9 | 48.5 | 48.2 |
| 9 | Greece | 26.6 | 22.9 | 24.8 | 24.4 | 29.4 | 26.7 | 11.8 | 11.3 | 11.6 | 20.2 | 16.3 | 18.3 |
| 10 | Spain | 34.8 | 30.9 | 32.9 | 28.8 | 28.5 | 28.7 | 10.7 | 9.1 | 9.9 | 25.0 | 22.1 | 23.6 |
| 11 | France | 44.6 | 40.9 | 42.8 | 18.2 | 16.1 | 17.2 | 11.5 | 9.4 | 10.5 | 36.7 | 33.6 | 35.2 |
| 12 | Croatia | 36.4 | 24.2 | 30.5 | 17.2 | 21.8 | 19.0 | 10.1 | 9.6 | 9.8 | 30.7 | 19.5 | 25.3 |
| 13 | Italy | 31 | 21.5 | 26.4 | 21.1 | 25.2 | 22.7 | 13.0 | 12.3 | 12.7 | 24.3 | 16.2 | 20.4 |
| 14 | Cyprus | 45.2 | 42 | 43.6 | 19.1 | 14.7 | 16.9 | 11.0 | 12.8 | 11.9 | 36.5 | 36.4 | 36.5 |
| 15 | Latvia | 37.8 | 31.5 | 34.7 | 14.3 | 10.0 | 12.3 | 8.0 | 6.3 | 7.2 | 31.7 | 29.5 | 30.6 |
| 16 | Lithuania | 34.5 | 33.4 | 34 | 17.2 | 10.2 | 13.8 | 14.5 | 12.6 | 13.5 | 29.8 | 31.9 | 30.8 |
| 17 | Luxembourg | 37 | 33 | 35 | 15.6 | 22.7 | 18.8 | 7.2 | 10.7 | 8.9 | 32.0 | 25.8 | 29.0 |
| 18 | Hungary | 35.4 | 26.8 | 31.2 | 13.4 | 12.0 | 12.8 | 8.6 | 11.0 | 9.8 | 30.7 | 23.9 | 27.4 |
| 19 | Malta | 55.2 | 53.1 | 54.2 | 11.6 | 6.6 | 9.1 | 8.1 | 8.3 | 8.2 | 50.5 | 49.0 | 49.8 |
| 20 | Holanda | 70.8 | 72.1 | 71.4 | 8.3 | 8.2 | 8.2 | 3.1 | 3.5 | 3.3 | 76.8 | 76.2 | 76.5 |
| 21 | Austria | 61.9 | 56.5 | 59.3 | 10.2 | 10.7 | 10.4 | 8.6 | 8.8 | 8.7 | 56.3 | 49.8 | 53.1 |
| 22 | Poland | 36.5 | 27.6 | 32.1 | 11.6 | 11.1 | 11.4 | 7.1 | 6.7 | 6.9 | 31.9 | 25.3 | 28.7 |
| 23 | Portugal | 37.2 | 33.6 | 35.5 | 20.7 | 19.8 | 20.3 | 8.5 | 7.2 | 7.9 | 29.5 | 26.8 | 28.2 |
| 24 | Romania | 30.3 | 19.5 | 25 | 21.5 | 22.2 | 21.8 | 13.6 | 19.6 | 16.5 | 23.4 | 13.7 | 18.7 |
| 25 | Slovenia | 40.2 | 32.2 | 36.3 | 10.6 | 8.7 | 9.9 | 7.1 | 7.5 | 7.3 | 36.3 | 28.4 | 32.6 |
| 26 | Slovakia | 33.7 | 21.3 | 27.6 | 22.1 | 16.0 | 19.8 | 10.1 | 7.6 | 8.9 | 25.4 | 17.8 | 21.7 |
| 27 | Finland | 53.5 | 56.4 | 54.9 | 16.9 | 15.4 | 16.2 | 8.3 | 7.1 | 7.7 | 43.9 | 47.9 | 45.9 |
| 28 | Sweden | 59.1 | 58.2 | 58.7 | 22.5 | 21.6 | 22.1 | 5.1 | 5.1 | 5.1 | 44.8 | 44.8 | 44.8 |
| 29 | Turkey | 56.1 | 31.3 | 44.1 | 14.3 | 23.4 | 17.5 | 15.6 | 29.7 | 22.4 | 49.2 | 25.3 | 37.6 |
Source: Prepared by the authors by collecting data from Eurostat and Ilostat.
Table 3.
Initial Cluster Centers.
| Variables | Clusters | |
|---|---|---|
| 1 | 2 | |
| Youth Labour Force Participation Rates Male | 70,80 | 26,60 |
| Youth Labour Force Participation Rates Female | 72,10 | 22,90 |
| Youth Labour Force Participation Rates Total | 71,40 | 24,80 |
| Youth Unemployment Rates Male | 8,30 | 24,40 |
| Youth Unemployment Rates Female | 8,20 | 29,40 |
| Youth Unemployment Rates Total | 8,20 | 26,70 |
| NEET Male | 3,10 | 11,80 |
| NEET Female | 3,50 | 11,30 |
| NEET Total | 3,30 | 11,60 |
| Youth Employment Rates Male | 76,80 | 20,20 |
| Youth Employment Rates Female | 76,20 | 16,30 |
| Youth Employment Rates Total | 76,50 | 18,30 |
Table 4.
Cluster Memberships.
| Sample Number | Countries | Included Cluster | Distance |
|---|---|---|---|
| 5 | Denmark | 1 | 9,862 |
| 6 | Germany | 1 | 15,703 |
| 8 | Ireland | 1 | 13,229 |
| 19 | Malta | 1 | 11.824 |
| 20 | Netherlands | 1 | 45,318 |
| 21 | Austria | 1 | 7,231 |
| 27 | Finland | 1 | 17,931 |
| 28 | Sweden | 1 | 23,351 |
| 1 | EU (27 ) | 2 | 17,682 |
| 2 | Belgium | 2 | 10,151 |
| 3 | Bulgaria | 2 | 26,409 |
| 4 | Czechia | 2 | 23,232 |
| 7 | Estonia | 2 | 25,452 |
| 9 | Greece | 2 | 28,921 |
| 10 | Spain | 2 | 21,800 |
| 11 | France | 2 | 20,391 |
| 12 | Croatia | 2 | 10,638 |
| 13 | Italy | 2 | 21,856 |
| 14 | Cyprus | 2 | 23,425 |
| 15 | Latvia | 2 | 12,038 |
| 16 | Lithuania | 2 | 12,860 |
| 17 | Luxembourg | 2 | 8,039 |
| 18 | Hungary | 2 | 9,175 |
| 22 | Poland | 2 | 12,172 |
| 23 | Portugal | 2 | 8,529 |
| 24 | Romania | 2 | 26,552 |
| 25 | Slovenia | 2 | 16,604 |
| 26 | Slovakia | 2 | 17,118 |
| 29 | Turkey | 2 | 38,337 |
Table 5.
Final Cluster Centers and Euclidean Distance.
| Variables | Clusters | Euclidean Distance to Last Cluster Centers | ||
| Cluster 1 | Cluster 2 | - | 63,082 | |
| Youth Labour Force Participation Rates Male | 59,44 | 37,79 | ||
| Youth Labour Force Participation Rates Female | 58,36 | 29,97 | ||
| Youth Labour Force Participation Rates Total | 58,93 | 33,71 | ||
| Youth Unemployment Rates Male | 12,31 | 17,22 | ||
| Youth Unemployment Rates Female | 11,20 | 16,98 | ||
| Youth Unemployment Rates Total | 11,76 | 17,04 | ||
| NEET Male | 6,81 | 10,15 | ||
| NEET Female | 6,70 | 10,72 | ||
| NEET Total | 6,76 | 10,42 | ||
| Youth Employment Rates Male | 53,61 | 30,55 | ||
| Youth Employment Rates Female | 52,89 | 25,15 | ||
| Youth Employment Rates Total | 53,26 | 27,94 | ||
Table 6.
Mann-Withney U Test Results for Labor Indicators.
| Labor Force Indicators | Clusters | N | Average | Error Squares | U | P |
|---|---|---|---|---|---|---|
| Youth Labour Force Participation Rates Male | Cluster 1 | 8 | 25,13 | 201,00 | 3,00 | < 0,001 |
| Cluster 2 | 21 | 11,14 | 234,00 | |||
| Youth Labour Force Participation Rates Female | Cluster 1 | 8 | 25,50 | 204,00 | 0,00 | < 0,001 |
| Cluster 2 | 21 | 11,00 | 231,00 | |||
| Youth Labour Force Participation Rates Total | Cluster 1 | 8 | 25,50 | 204,00 | 0,00 | < 0,001 |
| Cluster 2 | 21 | 11,00 | 231,00 | |||
| Youth Unemployment Rates Male | Cluster 1 | 8 | 9,19 | 73,50 | 37,50 | 0,023 |
| Cluster 2 | 21 | 17,21 | 361,50 | |||
| Youth Unemployment Rates Female | Cluster 1 | 8 | 9,25 | 74,00 | 38,00 | 0,025 |
| Cluster 2 | 21 | 17,19 | 361,00 | |||
| Youth Unemployment Rates Total | Cluster 1 | 8 | 8,88 | 71,00 | 35,00 | 0,017 |
| Cluster 2 | 21 | 17,33 | 364,00 | |||
| NEET Male | Cluster 1 | 8 | 8,13 | 65,00 | 29,00 | 0,007 |
| Cluster 2 | 21 | 17,62 | 370,00 | |||
| NEET Female | Cluster 1 | 8 | 8,25 | 66,00 | 30,00 | 0,008 |
| Cluster 2 | 21 | 17,57 | 369,00 | |||
| NEET Total | Cluster 1 | 8 | 7,75 | 62,00 | 26,00 | 0,005 |
| Cluster 2 | 21 | 17,76 | 373,00 | |||
| Youth Employment Rates Male | Cluster 1 | 8 | 25,13 | 201,00 | 3,00 | < 0,001 |
| Cluster 2 | 21 | 11,14 | 234,00 | |||
| Youth Employment Rates Female | Cluster 1 | 8 | 25,50 | 204,00 | 0,00 | < 0,001 |
| Cluster 2 | 21 | 11,00 | 231,00 | |||
| Youth Employment Rates Total | Cluster 1 | 8 | 25,50 | 204,00 | 0,00 | < 0,001 |
| Cluster 2 | 21 | 11,00 | 231,00 |
Disclaimer/Publisher’s Note: The statements, opinions and data contained in all publications are solely those of the individual author(s) and contributor(s) and not of MDPI and/or the editor(s). MDPI and/or the editor(s) disclaim responsibility for any injury to people or property resulting from any ideas, methods, instructions or products referred to in the content. |
© 2025 by the authors. Licensee MDPI, Basel, Switzerland. This article is an open access article distributed under the terms and conditions of the Creative Commons Attribution (CC BY) license (http://creativecommons.org/licenses/by/4.0/).
Copyright: This open access article is published under a Creative Commons CC BY 4.0 license, which permit the free download, distribution, and reuse, provided that the author and preprint are cited in any reuse.


