
Submitted:
24 July 2025
Posted:
25 July 2025
You are already at the latest version
Abstract
This study aimed to characterise and analyse the kinematic parameters and muscle activity of swimmers in Open Waters swimming (OWS). 9 male swimmers (age: 25.4 ± 11.9 years; body mass: 75.9 ± 9.0 kg; height: 180.7 ± 6.7 cm; arm span: 185.6 ± 10.3 cm) were evaluated in an open environment (lake), performing 5 x 1000 m at maximum intensity, with a rest of 30 seconds every 1000 m. For kinematical analyses, stroke rate (SR), swimming velocity (v), stroke length (SL), and stroke index (SI) were calculated. Surface EMG data were recorded in 7 muscles: Upper Trapezius (UP); Latissimus dorsi (LD); Pectoralis Major (PM); Posterior Deltoid (PD); Anterior Deltoid (AD); Triceps Brachii (TB); Biceps Brachii (BB) for underwater and recovery phases of the stroke. SL (F=3.41, p=0.06, η2=0.30) and SI (F=3.29, p=0.08, η2=0.29) changed along the distances covered, SR (F=1.54, p=0.24, η2=0.16) increased, especially in the last 1000 m (32.5 ± 3.0 cycles-min-1). AD was highly activated in recovery, showing statistical differences from the beginning (p≤0.01) to the end of the race (p=0.03). The TB muscle was mostly recruited in the underwater phase, from the start (p≤0.01) to the finish (p=0.03), showing a significant difference in each lap, with a large effect. LD showed significant differences in muscle activation, from 1000 m (p≤0.01) with a huge effect, and 5000 m (p≤0.01), with a large effect. These results suggested that the UT and AD muscles had higher activity in recovery than underwater phase, and TB and LD were higher in the underwater phases.
Keywords:
biomechanics
; open water swimming
; surface electromyography
; freestyle
1. Introduction
The World Aquatics defines Open Water Swimming (OWS) as any competition that takes place in rivers, lakes, oceans, or water channels, as the dynamics of the environment that swimmers may encounter are very varied [1,2].The resurgence of OWS as one of the most recent disciplines of swimming has aroused the curiosity of coaches, swimmers, and all of those involved in the process. The ecological differences between swimming in a pool or swimming in the sea lead to constraints that impose difficulties (weather conditions, water typology, currents, temperature, navigation in the courses) for some swimmers and ease for others [1,2,3].
Research on OWS is increasing with some studies focused on the physiological [2,4,5,6,7] and biomechanics factors, to better understand muscular and kinematic parameters [8,9,10].
The front crawl technique where breathing is unilateral causes measurable differences in factors that are known to significantly impact performance, namely arm kinematics, hydrodynamic flow, structures, hand trajectory, and hand strike angles [11]. For the kinematic parameters the average swimming speed (v), stroke length (SL), and stroke rate (SR) attend as indicators of the kinematic strategies used by each swimmer during a given task [12]. Additionally, the stroke index (SI) is recognized as an indirect measure of swimming efficiency [13,14]. SL can negatively affect swimming performance, while a small increase in stroke rate can cause a significant increase in total race time [15]. In long-duration events (> 30 min), swimmers adopt a uniform profile throughout the race, selecting the swimming speed that they can maintain until the end of the competition, mainly, from the moment there is an accumulated muscular and psychological fatigue that causes the decrease of swimmer's performance [7]. Recently, Puce et al. [9] showed a decrease in SL, which was offset by an increase in SR. These changes can also be explained through other factors associated with OWS, since it was found that wetsuit use during pool training might decrease swimming performance, namely decrease the v and increase the core temperature [4].
Kinematic variables are closely associated with neuromuscular activity, as confirmed by increases in EMG amplitude and frequency, which reflect greater muscular involvement during the swimming stroke [16].
Regarding muscular analysis in OWS, a few studies focused in understand how swimmers maintain peak performance with the appearance of muscular fatigue, namely in swimming pool [9,10], through EMG analysis. Puce et al. [9] aimed to understand the effect of muscle fatigue in three different drafting positions (free, lateral and behind swimming) found that behind swimming condition had lower muscle fatigue and larger swimming efficiency than in free and lateral drafting. The muscle fatigue manifested in decreased frequency (MNF) and increased amplitude of EMG activity (RMS), showing lower increase of RMS and lower decrease of MNF indicate lower fatigue in the drafting configurations in comparison to free swimming. The muscles that showed largest fatigue were the latissimus dorsi and triceps brachii, and the lower fatigue was observed in the lower limbs for the rectus femoris.
Further, for understanding the compensatory mechanisms used by swimmers during the performance of a controlled speed swimming test, they found that that there was a decrease in SL and SI, compensated by an increase in SF, and an increase in muscular activity of almost all muscles, except for the muscle latissimus dorsi [10].
Based on the above reported literature, it seems that the scientific research is still needed to better understand kinematic and muscular activation in OWS environment. Only a few studies have collected data in natural conditions such as lakes or the sea their data collection in lakes or sea, where the open water swimming races are developed, so the main aim of this study was to analyse the kinematic parameters and neuromuscular activity in OWS environment during 5kms. Thus, it was hypothesized that (i) for kinematic parameters such as SL, SI and v will decrease, and SR will increase in the last part of the race; (ii) neuromuscular activity will be higher during the recovery phase of the stroke.
2. Materials and Methods
2.1. Participants
Nine male open water swimmers (age: 25.4 ± 11.9 years; body mass: 75.9 ± 9.0 kg; height: 180.7 ± 6.7 cm; arm span: 185.6 ± 10.3 cm) with 371 ± 123 world aquatic points at 1500m event, volunteered to participate in this study after being instructed about the procedures. Participants were only included if they met the requirements of having at least 7 years of experience and participating in national competitions. In another case, they were excluded if they exhibited any health risk or condition that would affect OWS performance. Before the tests, the participants were informed of the benefits and risks of the investigation and signed an intuitionally approved informed consent document. This study was approved by the University Ethics Committee and all procedures were in accordance with the Helsinki Declaration regarding human research.
2.2. Measures
The muscular activity was assessed on the left side of the body by surface electromyography (EMG) through a wireless EMG system with intergrated accelerometers (Miniwave, Cometa, Milano, Italy; EMGandMotionsTools software 8.7.6.0) and a memory-equipped probes of 7 grams and a sample rate of 2000Hz at 16 bits. For each subject, the skin under the electrodes was shaved, rubbed with sandpaper, and cleaned with alcohol so that the interelectrode impedance did not exceed 5 KOhm [17]. To isolate the electrodes from water we´ve used transparent dressings (Hydrofilm®, 10 cm x 12,5 cm, USA) and adhesive round gasket stickers to isolate the connection between EMG sensor and electrode [18].
The EMG Electrodes (Kendall ™, ECG electrodes, 57x34mm) were placed along the longitudinal midline of the target muscle in accordance with the recommendations of the Surface Electromyography for the Non-invasive Assessment of Muscles project (SENIAM), and the seven muscles analysed were: Upper trapezius (UT); Latissimus Dorsi (LD); Pectoralis Major (PM); Posterior Deltoid (PD); Anterior Deltoid (AD); Triceps Brachii (TB); Biceps Brachii (BB), according to their importance in swimming.
Previously to the test, each subject performed a Maximal Voluntary Contraction (MVC) test on the left side, which is one of the most commonly used methods of EMG signal normalisation [19]. After the initial warming-up sequence, the MVC test consisted of each subject gradually increased the force, reached maximum effort within 3–5 seconds, holds it for 3 seconds, and calms down within 3 seconds. Repeat it at least once, with a rest of 30 to 60 seconds in between [19]. The MVC was compounded with a total of seven test positions, starting with UT. In all the MVC tests were done against a static resistance. When testing UT muscle, the swimmer should try to lift the arm upward against a static resistance that can be arranged by a large enough load to press the shoulder down. Furthermore, it was important to ensure fixation of the elbow and trunk during the BB muscle testing. The same arrangement was used for maximal TB muscle contraction. In the case of LB muscle, adduction pressure was performed against resistance from 90 degrees of arm abduction [18].
Additionally, the swimmers wore their personal long-sleeved custom-made swimming suit, to protect the electrodes and sensors during the tests and to simulate the competition.
The EMG measurement was synchronized with a digital video camera (Panasonic, DC – FZ 1000II) positioned 50 meters of the water level in an elevated position, to record the entire procedure. To synchronize the EMG data with the video, subjects had to stand on the water line in a T-Position for 5 seconds and then tap three times on the sensor located on AD before starting the trials. The same gesture of tapping 3 times on the AD muscle occurred when each subject finished the course.
2.3. Design and Procedures
All the conditions were performed in the same location and before starting. The swimmers needed to swim in a pre-prepared course, the start and finish were on the same buoy. The protocol was made in lake where subjects had to swim on a course marked with four buoys (Figure 1). All procedures were performed in calm water, without current interference. The wind speed (15.7 ± 6.7 km/h), the air temperature (23 ± 4.7 º C) and water temperature (25 ± 0.8 º C) were recorded in each day of the test. These values fall within the acceptable range set by the Fédération Internationale de Natation (FINA), which defines that official open water swimming competitions must take place in water temperatures between 16 °C and 31 °C [37].
Before initiating the official trials, the subjects performed a 10-minute warm-up in which they made a warm-up like they usually do before every OWS race. After, each subject performed 5 x 1000 m respecting their own competition strategies, with a 30 second check the devices and to make hydration. There were four buoys and there were a line connecting the second and third buoy with a length of 45 m.
The final and split times for each swimmer were obtained by manual timing (3x100 m Stopwatch, Finis), from the video recording and were taken on each trial. The mean speed (v) was calculated by the ratio of 45 m distance determined between the floats and the time spent. Stroke length (SL) ([20], was calculated from the ratio between v and the corresponding SR Martens, and stroke index (SI) was calculated by multiplying v by SL [13].
2.4. Design and Procedures
Each video was synchronized with EMG signal in the software (EMG and Motion Tools). In this study, the synchronisation was processed by identifying peaks that were visible in the accelerometer signal, with an accuracy of 33.3 ms in one video frame.
Signal processing started with applying filters to the MVC file. EMG raw data were processed with the following filters: (i) Low Pass filter with cut-off frequency of 400 Hz and a Butterworth filter of fourth order; (ii) High Pass filter with cut-off frequency of 20 Hz and a Butterworth filter of fourth order. After signal rectification, it was used a Smoothing and a Root Mean Square (RMS) envelope with a 50 ms window. The maximum MVC activation values (µV) for each muscle were then calculated and presented in relation to the percentage of MVC (% MVC). Finally, the last processing was applying the same filters for the signal taken from each trial, as well as applying the MVC values to normalise the trial file. We made markings in the EMG files to signal the arms cycles and split the cycles in the underwater and recovery phase. The underwater phase started when the fingers began touching the water and the end of the cycle was when the fingers almost out of the water. For the recovery phase the start was when the fingers exit water, and the end was when the fingers started touching the water.
2.5. Statistical Analysis
SPSS statistical software version 28.0 (IBM Corp., Armonk, NY, USA) was used for statistical analyses. First, the normality plot tests of Shapiro-Wilk were applied, according to the sample size. After checking normality, the parametric ANOVA test for repeated measures was used for the kinematic parameters. Together, the Partial Eta Squared (η2) was calculated as an indicator of the magnitude of the effect, considered η2 < 0.3 as small effect; 0.3 < η2 < 0.5 as a medium effect; and η2 > 0.5 as a large effect [22,23]. In the electromyography data, it was obtained a non-normal distribution which required the use of a non-parametric test. The results were expressed in % MVC. Mann-Whitney U tests were conducted on the non-normally distributed data to evaluate differences between cycle phases, and the Friedman test was used to detect significant differences among the observed parameters. The Cohens’d was calculated as an indicator of the magnitude of the effect, with D considered a small effect if <0.2; a medium effect if <0.5; and a large effect if >0.8. The statistical significance was set to (p ≤ 0.05).
3. Results
Table 1 shows an increase of SR with small effect (F=1.54, p=0.24, η2=0.16), especially in the final lap of the trial; a decrease of SL with medium effect (F=3.41, p=0.06, η2=0.30) and decrease of SI (F=3.29, p=0.08, η2=0.29) from the begin to the end of the trial.
It is noticeable that SL (F=3.41, p=0.06, η2=0.30) and SI (F=3.29, p=0.08, η2=0.29) changed along the distances covered, showing a decrease, essentially between 1000 m and 4000 m. Contrary to SR (F=1.54, p=0.24, η2=0.16) that increased, especially, an increase in the last 1000 m (32.5 ± 3.0 cycles-min-1) when compared to the other laps. Particularly, SR had decreased from 1000 m to 3000 m and showed an increase from 3000 m to 4000 m, with significant differences.
3.1. Eletromyography
Regarding the muscle patterns of the swimming cycle, was observed higher activation in TB, during underwater phase, and UT, during recovery phase. Table 2 presents significant differences in muscular activity, between the phases along the distance.
The muscles AD, TB and LD showed significant differences between phases throughout the distance. UT showed significant differences (p=0.00) with a large effect, between the underwater (13.25% MVC) and recovery phases (31.25% MVC) from 4000 m to 5000 m.
The AD muscle is highly activated in recovery, showing statistical differences from the beginning (p=0.01) to the end of the race (p=0.03), with a large effect. It’s also noted that there is a difference between underwater (6.55% MVC) and recovery (16.46% MVC), with higher activation at 1000 m. Contrary to TB muscle, that are mostly recruited in the underwater phase (22.80% MVC), from the start (p=0.00) to the finish (p=0.03), showing a significant difference in each lap, with a large effect. In terms of the LD, there were significant differences in muscle activation, from 1000 m (p=0.00) with a huge effect, and 5000 m (p=0.01), with a large effect. LD muscle shows a higher recruitment in the underwater phase (10.51% MVC), compared to the recovery (2.96% MVC) at the start of the trial, slowly decreasing throughout the distance.
4. Discussion
The aim of the study was to characterize and analyze the kinematic parameters and the neuromuscular activity of OWS during 5 km.
The key findings of this study indicate that for the kinematics: SR increased through the 5000 m race, with a higher increase at 4000 m, swimming speed decreased at 2000 m and then stabilized at 3000 m and increased in the last 1000 m, the SI was always decreasing until 4000 m with a slight increase in the last 1000 m, there was a tendency for the SL to decrease to maintain performance in the last 1000 m. Regarding the neuromuscular activity, the higher muscle activation were in UT and AD muscles (recovery phase) and TB and LD muscles (underwater phase).The UT in the recovery phase and TB in underwater phase were the muscles with higher muscle activation during all the 5kms. Regarding the stroke phases of the swimming cycle, for the recovery phase the higher muscle activation was observed in the UT, PD, AD, BB and for the underwater phase for TB, PM and LD.
In this way, one of hypotheses of this study (i- kinematic parameters such as SL, SI and v will decrease, and SR will increase in the last part of the race; and ii- neuromuscular activity will be higher in the recovery phase were confirmed.
The kinematical variables v, SR, SL and SI have been used to analyze the swimmer's technical skill level, with the evaluation of these factors considered important for training planning and describing swimmers' performance [12].
Our findings are more near the results presented by [2], that can be due to both studies used a very similar protocol and because of the competitive level of the swimmers are very similar.
In competitive context, swimmers with better swimming technique seem to have a greater capacity to maintain SL [20,26]. According to the results obtained in our study, it is possible to verify that, of the biomechanical variables analyzed, we observed a progressive increase in SR and a decrease in SI, results that are in line with previous studies [2,5,6,25], which can be explained through the biomechanical readjustments made by the swimmer to long-lasting tasks with moderate intensities due to the onset of fatigue.
The attempt to increase stroke length (SL) around 4000 m in order to improve velocity may have paradoxically led to a reduction in SL, triggering increased muscular effort in some muscle groups and compensatory activation in others in response to fatigue.
According to Pelarigo et al. [6], the accumulation of fatigue is related to the intensity and duration of the exercise by causing biomechanical changes in swimmers, leading to readjustments during the race. Furthermore, the stabilization of v stands out, which can be justified by the swimmer adopting a uniform profile throughout the race, selecting the v that he can maintain until the end [7]. However, the competitive nature of swimmers and the objective lead to an increase in SL so that an increase in v occurs, essentially, in the final stages (4000 m). According to Baldassarre et al. [1], where they identified that OW swimmers with better results use the strategy of increasing v in the final part of the competition, which is in line with the results obtained. Not only does increasing SL aim to increase v, but it also reduces SL, as the swimmer tends to perform more stroke cycles to maintain performance [7].
Regarding the analysis of neuromuscular activity, there was higher muscle activation for the UT and AD muscles in the recovery phase of the swimming stroke and in the underwater phase for the TB and LD muscles. When comparing our results with [27], we can observe that LD and TB differ between the underwater and recovery phase, since it was shown that these muscles are mostly recruited in underwater phase. On the other hand, [28] concluded that in front crawl, the muscles with the higher muscle activation during the swimming phases were the PM and LD, which can be considered as the main propulsive muscles of the front crawl. The PM had a muscular activation of 71% of MVC in the initial phase of the underwater phase and LD (peaked at 75% of MVC) in the final phase of underwater when swimming at a moderate pace. In the study [29], the LD was different because in this study an average of 3.2%MVC was obtained, very different from 44.81%MVC.
When analysing other muscles, we observed non-significant differences for the PM, as it presents similar activation patterns in both phases. Once again, for the LD, significant differences were found between the stroke phases, which shows that the LD is highly active, especially in underwater phase. In the study by [30] the AD muscle shows the lowest activity in the final underwater phase of the stroke cycle, showing the same behaviour throughout the test in our study, mainly with a tendency to decrease between each 1000 m. Some changes in muscle participation were detected during the swimming courses, being more evident from 4000 m onwards. Lauer et al. [31] continued the study by [30], and examined the muscle activation patterns of the BB and TB muscles in depth EMG. According to front crawl studies focused on EMG amplitude in muscles [27,29], LD and TB are most involved in the underwater phase. In fact, the LD is known as the due to its important role in the successful completion of each of the swimming strokes [32] and, together with the TB, is considered the key muscle in maintaining speed.
When comparing our results to recent studies, notable similarities emerge, particularly regarding the reduction in LD activity during the underwater phase of the stroke cycle [9,10,33]. The results from [9] and our study showed a strong relationship in terms of muscle recruitment during swimming. For example, [9] entitled the LD as the “swimmer muscle”, due to its crucial role in the successful execution of all swimming styles. Together with TB, LD recruitment was considered crucial for maintaining speed [34]. This clearly aligns with our results, since we observed that TB and LD were more activated during the underwater phase, which can be explained according to the movement stabilization required to overcome water resistance in the underwater technique. Also in our study, we found that UT and AD were the muscles that had higher activation in the recovery phase, with UT being particularly recruited during this phase. Once again, this result is very similar to the findings of [9,10] research, since these muscles contributed significantly to upper limb movement control during recovery phase. Also, the results are in line with the study developed by [33], since the AD muscle is activated in the initial recovery phase of the stroke, swimmers can reduce time in the recovery phase to reach a faster pace with a simultaneous increase in muscle activity. Furthermore, it was reported that participants activated more PD muscle during the Underwater Phase period to swim faster. Our results are very similar to the study of [31] as they obtained results where BB is more recruited during recovery and TB during the final phase of the front crawl.
Environmental conditions are known to influence both physiological strain and biomechanical performance in open water swimming. In this study, the water temperature of approximately 25 °C, along with moderate air temperature and wind speed, provided favorable conditions for long-distance swimming. According to FINA regulations, races must occur within a 16–31 °C water temperature range to minimize thermal stress and ensure athlete safety[37].
Although the observed parameters were within these acceptable limits, recent evidence suggests that water temperatures above 23–25 °C may still impose significant thermoregulatory challenges. Heat-related illnesses—including exertional heat exhaustion and near-syncope—have been documented in open water swimmers under such conditions, particularly when combined with high humidity, low wind, or inadequate hydration [38]. These factors may silently increase physiological strain even in seemingly “safe” environments, especially during prolonged efforts.
Even under moderate thermal conditions, sustained physical exertion can contribute to cumulative neuromuscular fatigue, fluid loss, and compensatory changes in stroke technique. Such fatigue-induced adaptations—particularly in stroke coordination and muscle recruitment—can elevate the risk of overuse injuries, such as impingement syndrome or rotator cuff tendinopathies. Therefore, environmental context must be considered alongside fatigue progression when interpreting performance data and assessing injury risk in both competitive and recreational open water swimmers.
In sum, our study suggests that significant changes in the kinematic parameters of the stroke occurred, particularly after the 4000 m, where swimmers showed a decrease in SL and a slight increase in SI, likely due to the increase in v and SR. This indicates that the distance covered per stroke cycle shortened every 1000 m, potentially linked to the onset of fatigue. As swimmers fatigue, changes in kinematic parameters such as SL and SR may be a result of altered muscle activation patterns aimed at compensating for reduced energy levels. The observed muscle activation patterns, as reflected in the EMG data, seem to align with these kinematic changes. The UT and AD muscles showed higher activity during the recovery phase, which corresponds to the need for more upper limb control, stabilization and overcome water resistance. We assume that increased activations of specific muscles, likely help swimmers maintain stroke efficiency despite the decreasing distance covered per cycle. Thus, the changes in kinematic variables such as SL, SR, and SI appear to be closely linked with specific shifts in muscle activation to adapt to fatigue during prolonged swimming efforts.
4.1. Practical Applications
The findings highlight the need for training programs that prioritize muscle groups most involved during the underwater and recovery phases of the stroke, which are particularly susceptible to overuse injuries due to repetitive loading. In this context, dry-land training focused on strength development and neuromuscular coordination is essential to enhance muscular efficiency and resilience. Such training should also include flexibility, mobility, and scapular stabilization exercises, which are known to reduce the incidence of shoulder-related injuries in swimmers.
Monitoring fatigue through surface electromyography further supports this approach by identifying the most fatigued muscle groups, enabling targeted prevention strategies. Importantly, longitudinal monitoring of fatigue progression—such as changes in EMG amplitude (RMS) and frequency content over time—can help detect early signs of neuromuscular decline, allowing for timely training adjustments and recovery interventions.
Notably, fatigue-related changes in stroke biomechanics and kinematics may elevate the risk of impingement syndrome and other musculoskeletal injuries, particularly in both competitive and recreational open water swimmers [28,35,36]. These findings are not only relevant for elite athletes but can also inform coaching practices and public health recommendations for safe participation in long-distance swimming. Implementing individualized recovery protocols and workload management based on fatigue trends may further reduce injury risk and optimize long-term performance.
4.2. Limitations
Some limitations of this study should be addressed. First, data collection took place on different days due to weather conditions. Additionally, muscular activity in the lower limbs and EMG data for the right side of the body were not measured because of device limitations. Although the study was conducted in a natural environment (lake), where swimmers typically compete, another limitation was the absence of opposing swimmers during each test for each subject.
5. Conclusions
The analysis of EMG and kinematic parameters provided valuable insights into the mechanisms swimmers use to cope with the demands of long-distance open water races. From a kinematic perspective, most changes occurred around 4000 m, including an increase in stroke rate (SR) as swimmers attempted to maintain velocity in the final, decisive stage. Neuromuscular activity also showed significant phase-dependent variations throughout the trial. The differences in muscle recruitment between the recovery and underwater phases reflected the effort required to overcome drag and stabilize body position. Notably, the triceps brachii and latissimus dorsi were more active during the underwater phase, while the upper trapezius and anterior deltoid were more engaged during recovery. These patterns highlight the fundamental role of specific muscle groups in sustaining stroke efficiency under fatigue.
These findings reveal fatigue-related adaptations in both movement and muscle activation, which may contribute to overuse injuries—particularly in the shoulder complex. While the results are relevant for trained swimmers, they also provide valuable guidance for recreational athletes, who may be more vulnerable due to limited technical support. As open water swimming continues to grow in popularity, these insights support the development of safer, evidence-based training approaches that address fatigue and injury risk across all levels of participation.
Author Contributions
Conceptualization, A.C, H.L, C.G, J.S.; methodology, C.G, J.F, H.L..; software, J.S.; validation, J.F., H.N. and A.C.; formal analysis, R.M..; investigation, A.C resources, A.C.; data curation, A.C.; writing—original draft preparation, A.C.; writing—review and editing, A.C, C.G., R.M, H.L.; visualization, A.C.; supervision, D.M..; project administration, D.M., H.L..; funding acquisition, D.M.
Funding
This work is supported by National Funds by FCT - Portuguese Foundation for Science and Technology under the following project UI/04045.
Institutional Review Board Statement
This study was conducted in accordance with the Declaration of Helsinki and approved by Ethics Committee of the University Ethics Committee. Informed consent was obtained from all subjects involved in this study. Written informed consent has been obtained from the swimmers to publish this paper.
Data Availability Statement
The data presented in this study are available on request from the corresponding author due to ethical reasons.
Acknowledgments
In this section, you can acknowledge any support given which is not covered.
Conflicts of Interest
The authors declare no conflicts of interest. The funders had no role in the design of this study; in the collection, analyses, or interpretation of data; in the writing of this manuscript; or in the decision to publish the results.
References
- Baldassarre, R., Bonifazi, M., Zamparo, P., & Piacentini, M. F. (2017). Characteristics and Challenges of Open-Water Swimming Performance: A Review. International Journal of Sports Physiology and Performance, 12(10), 1275–1284. [CrossRef]
- Zacca, R., Neves, V., Da Silva Oliveira, T., Soares, S., Rama, L. M. P. L., De Souza Castro, F. A., Vilas-Boas, J. P., Pyne, D. B., & Fernandes, R. J. (2020). 5 km front crawl in pool and open water swimming: Breath-by-breath energy expenditure and kinematic analysis. European Journal of Applied Physiology, 120(9), 2005–2018. [CrossRef]
- Bonança, M., Rama, L., & Proença, J. (2021). Águas Abertas: Uma Disciplina, Diferentes Variáveis. Boletim SPEF, 35–45.
- Fujimoto, T., Matsuura, Y., Baba, Y., & Hara, R. (2024). Thermal Sensation After the 10-km Open-Water Swimming in Cool Water Depends on the Skin’s Thermal Sensitivity Rather Than Core Temperature. International Journal of Sports Physiology and Performance, 19(1), 28–33. [CrossRef]
- López-Belmonte, Ó., Ruiz-Navarro, J. J., Gay, A., Cuenca-Fernández, F., Cejuela, R., & Arellano, R. (2023). Determinants of 1500-m Front-Crawl Swimming Performance in Triathletes: Influence of Physiological and Biomechanical Variables. International Journal of Sports Physiology and Performance, 18(11), 1328–1335. [CrossRef]
- Pelarigo, J. G., Greco, C. C., Denadai, B. S., Fernandes, R. J., Vilas-Boas, J. P., & Pendergast, D. R. (2016). Do 5% changes around maximal lactate steady state lead to swimming biophysical modifications? Human Movement Science, 49, 258–266. [CrossRef]
- Rodriguez, L., & Veiga, S. (2018). Effect of the Pacing Strategies on the Open-Water 10-km World Swimming Championships Performances. International Journal of Sports Physiology and Performance, 13(6), 694–700. [CrossRef]
- Baldassarre, R., Pennacchi, M., La Torre, A., Bonifazi, M., & Piacentini, M. F. (2019). Do the Fastest Open-Water Swimmers have A Higher Speed in Middle- and Long-Distance Pool Swimming Events? Journal of Functional Morphology and Kinesiology, 4(1), 15. [CrossRef]
- Puce, L., Chamari, K., Marinelli, L., Mori, L., Bove, M., Faelli, E., Fassone, M., Cotellessa, F., Bragazzi, N. L., & Trompetto, C. (2022). Muscle Fatigue and Swimming Efficiency in Behind and Lateral Drafting. Frontiers in Physiology, 13, 835766. [CrossRef]
- Puce, L., Biz, C., Ruaro, A., Mori, F., Bellofiore, A., Nicoletti, P., Bragazzi, N. L., & Ruggieri, P. (2023). Analysis of Kinematic and Muscular Fatigue in Long-Distance Swimmers. Life, 13(11), 2129. [CrossRef]
- Cohen, R. C. Z., Cleary, P. W., Mason, B. R., & Pease, D. L. (2020). Studying the effects of asymmetry on freestyle swimming using smoothed particle hydrodynamics. Computer Methods in Biomechanics and Biomedical Engineering, 23(7), 271–284. [CrossRef]
- Figueiredo, P., Pendergast, D. R., Vilas-Boas, J. P., & Fernandes, R. J. (2013). Interplay of Biomechanical, Energetic, Coordinative, and Muscular Factors in a 200 m Front Crawl Swim. BioMed Research International, 2013, 1–12. [CrossRef]
- Costill, D., Kovaleski, J., Porter, D., Kirwan, J., Fielding, R., & King, D. (1985). Energy Expenditure During Front Crawl Swimming: Predicting Success in Middle-Distance Events. International Journal of Sports Medicine, 06(05), 266–270. [CrossRef]
- Zamparo, P., Cortesi, M., & Gatta, G. (2020). The energy cost of swimming and its determinants. European Journal of Applied Physiology, 120(1), 41–66. [CrossRef]
- Morais, J. E., Barbosa, T. M., Forte, P., Bragada, J. A., Castro, F. A. D. S., & Marinho, D. A. (2023). Stability analysis and prediction of pacing in elite 1500 m freestyle male swimmers. Sports Biomechanics, 22(11), 1496–1513. [CrossRef]
- Conceição, A., Silva, A. J., Barbosa, T., Karsai, I., & Louro, H. (2014). Neuromuscular Fatigue during 200 M Breaststroke. Journal of sports science & medicine, 13(1), 200.
- Afsharipour, B., Soedirdjo, S., & Merletti, R. (2019). Two-dimensional surface EMG: The effects of electrode size, interelectrode distance and image truncation. Biomedical Signal Processing and Control, 49, 298–307. [CrossRef]
- Hermens, H. J., Freriks, B., Disselhorst-Klug, C., & Rau, G. (2000). Development of recommendations for SEMG sensors and sensor placement procedures. Journal of Electromyography and Kinesiology, 10(5), 361–374. [CrossRef]
- Konrad, P. (2005). The ABC of EMG: A Practical Introduction to Kinesiological Electromyography. Noraxon INC. USA.
- Craig, A., & Pendeegast, D. (1979). Relationships of stroke rate, distance per stroke, and velocity in competitive swimming. Medicine and Science in Sports, 11(3), 278–283.
- Maglischo, E. (2003). Swimming fastest. The essential reference on technique, training, and program design. Champaign, IL: Human Kinetics.
- Cohen, J. (1988). Statistical Power Analysis for the Behavioral Sciences (2nd ed.). Lawrence Erlbaum Associates, Publishers.
- Cohen, J. (2013). Statistical Power Analysis for the Behavioral Sciences. Routledge. [CrossRef]
- Zingg, M. A., Rüst, C. A., Rosemann, T., Lepers, R., & Knechtle, B. (2014). Analysis of swimming performance in FINA World Cup long-distance open water races. Extreme Physiology & Medicine, 3(1), 2. [CrossRef]
- Oliveira, T., Fernandes, R., & Vilas-Boas, J. (2018). Caraterização Biofísica dos 5000 m Crol em Águas Abertas. University of Porto.
- Craig, A. B., Skehan, P. L., Pawelczyk, J. A., & Boomer, W. L. (1985). Velocity, stroke rate, and distance per stroke during elite swimming competition: Medicine & Science in Sports & Exercise, 17(6), 625–634. [CrossRef]
- Stirn, I., Jarm, T., Kapus, V. P., & Strojnik, V. (2013). Evaluation of mean power spectral frequency of EMG signal during 100 metre crawl. European Journal of Sport Science, 13(2), 164–173. [CrossRef]
- Pink, M., Perry, J., Browne, A., Scovazzo, M. L., & Kerrigan, J. (1991). The normal shoulder during freestyle swimming: An electromyographic and cinematographic analysis of twelve muscles. The American Journal of Sports Medicine, 19(6), 569–576. [CrossRef]
- Martens, J., Figueiredo, P., & Daly, D. (2015). Electromyography in the four competitive swimming strokes: A systematic review. Journal of Electromyography and Kinesiology, 25(2), 273–291. [CrossRef]
- Rouard, A. H., & Clarys, J. P. (1995). Cocontraction in the elbow and shoulder muscles during rapid cyclic movements in an aquatic environment. Journal of Electromyography and Kinesiology, 5(3), 177–183. [CrossRef]
- Lauer, J., Figueiredo, P., Vilas-Boas, J. P., Fernandes, R. J., & Rouard, A. H. (2013). Phase-dependence of elbow muscle coactivation in front crawl swimming. Journal of Electromyography and Kinesiology, 23(4), 820–825. [CrossRef]
- Laudner, K. G., & Williams, J. G. (2013). The relationship between latissimus dorsi stiffness and altered scapular kinematics among asymptomatic collegiate swimmers. Physical Therapy in Sport, 14(1), 50–53. [CrossRef]
- Lim, B., Swafford, A., Conroy, K., & Mercer, J. (2023). Shoulder Muscle Activity While Swimming in Different Wetsuits and Across Different Paces. International Journal of Exercise Science, 16(1), 172–181.
- Ikuta, Y., Matsuda, Y., Yamada, Y., Kida, N., Oda, S., & Moritani, T. (2012). Relationship between decreased swimming velocity and muscle activity during 200-m front crawl. European Journal of Applied Physiology, 112(9), 3417–3429. [CrossRef]
- Fernández-Galván, L. M., Alcain Sein, J., López-Nuevo, C., Sánchez-Sierra, A., Ladrián-Maestro, A., & Sánchez-Infante, J. (2025). Injury Patterns and Frequency in Swimming: A Systematic Review. Applied Sciences, 15(3), 1643. [CrossRef]
- De Martino, I., & Rodeo, S. A. (2018). The Swimmer's Shoulder: Multi-directional Instability. Current reviews in musculoskeletal medicine, 11(2), 167–171. [CrossRef]
- FINA. (2022). Open Water Swimming Manual (5th ed.). Fédération Internationale de Natation. Available online: https://resources.fina.org/fina/document/2022/04/27/1b20b7df-dd6c-488b-a147-51eae83a1590/FINA-OW-MANUAL-2022.pdf.
- Murphy, M., Polston, K., Carroll, M., & Alm, J. (2021). Heat injury in open-water swimming: A narrative review. Current Sports Medicine Reports, 20(4), 193–198. [CrossRef]
Figure 1.
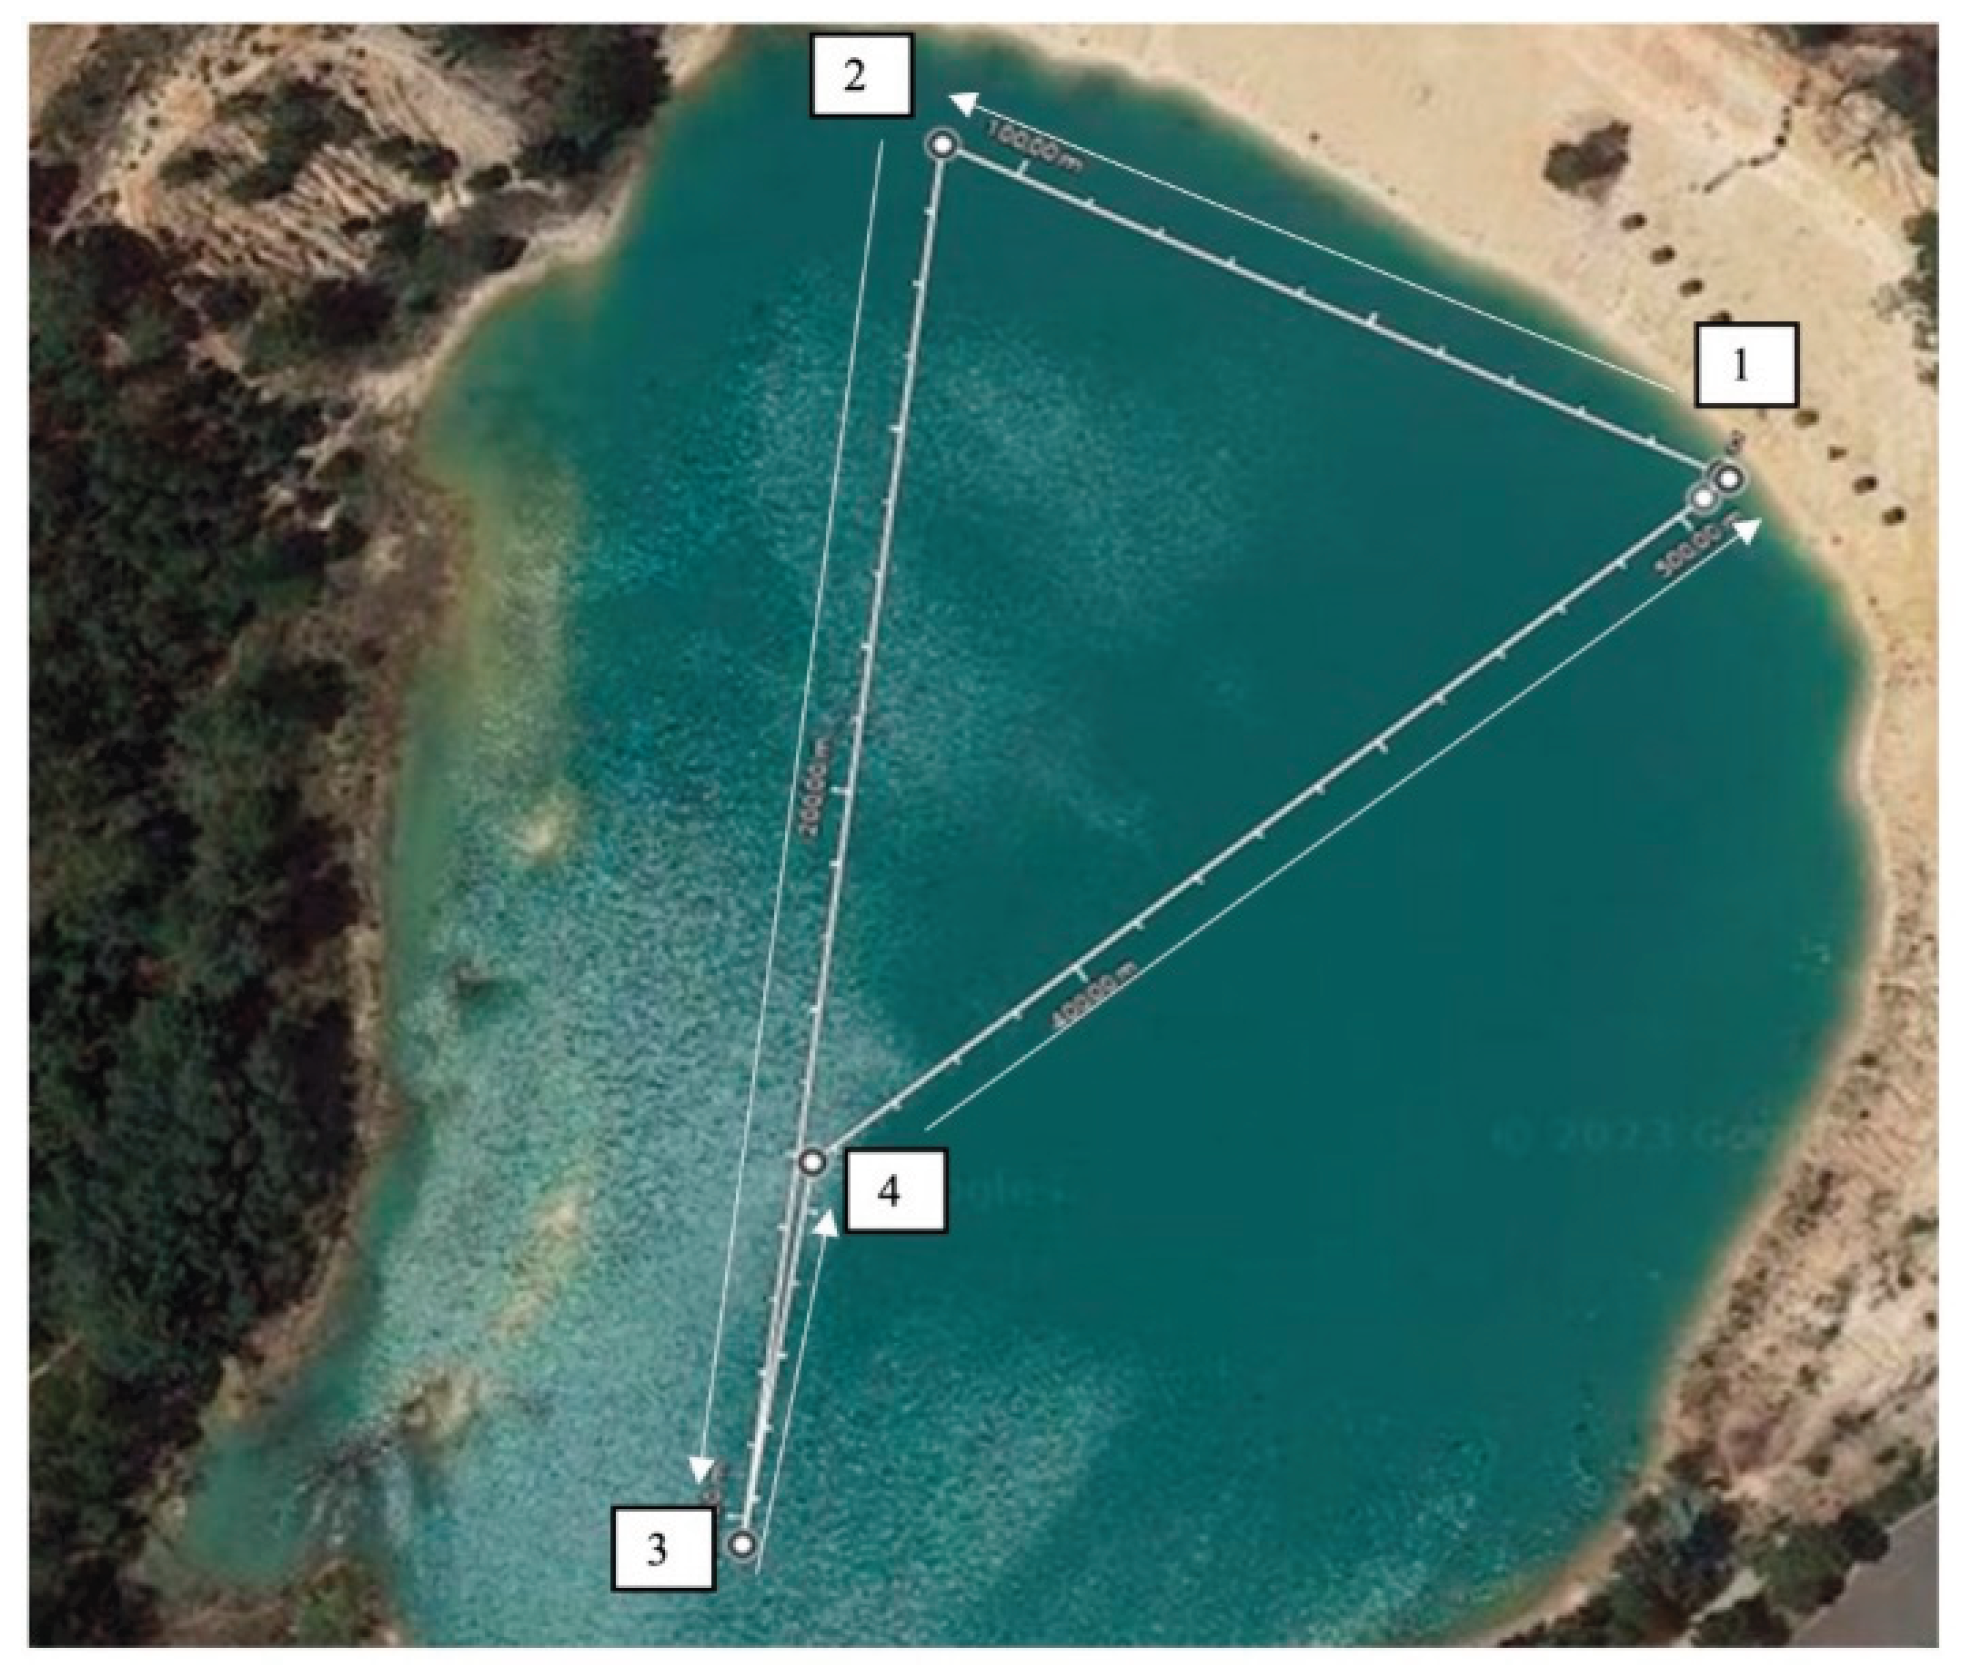

Table 1.
Mean ± standard deviation (Mean ± SD) for kinematic variables (v, SR, SL and SI) through the distance covered by the swimmers. P-values and effect sizes are also shown.
Table 1.
Mean ± standard deviation (Mean ± SD) for kinematic variables (v, SR, SL and SI) through the distance covered by the swimmers. P-values and effect sizes are also shown.
| 1000 m | 2000 m | 3000 m | 4000 m | 5000 m | |||
|---|---|---|---|---|---|---|---|
| Kinematic Variables | Mean±SD | Mean±SD | Mean±SD | Mean±SD | Mean±SD | F-ratio (p) | η2 |
| v [m/s] | 1.39±0.18 | 1.38±0.15 | 1.38±0.14 | 1.37±0.16 | 1.39±0.18 | 1.94 (0.18) | 0.19 |
| SR [cycles-min-1] | 31.4±3,04 | 31.1±3.88 | 31.2±3.29 | 32.1±2,76 | 33.0±3,36 | 1.54 (0.24) | 0.16 |
| SL [m-cycle-1] | 2.72±0.35 | 2.67±0.34 | 2.65±0.33 | 2.60±0.33 | 2.58±0.40 | 3.34 (0.06) * | 0.29 |
| SI [m2s-1cycle-1] | 3.90±0.82 | 3.71±0.78 | 3.68±0.75 | 3.61±0.83 | 3.64±0.94 | 3.29 (0.08) * | 0.29 |
Key: * – The statistical significance was set to (p ≤ 0.05); v – velocity; SR – Stroke Rate; SL – Stroke Length; SI – Stroke Index.*.
Table 2.
Mean ± SD of the %MVC for the comparison between the underwater and recovery phases along the distance, on the left side of the body during all seven studied muscles. p-values and effect sizes are also shown.
Table 2.
Mean ± SD of the %MVC for the comparison between the underwater and recovery phases along the distance, on the left side of the body during all seven studied muscles. p-values and effect sizes are also shown.
| Distance | 1000 m | 2000 m | 3000 m | 4000 m | 5000 m | |||||||||||
|---|---|---|---|---|---|---|---|---|---|---|---|---|---|---|---|---|
| Muscles | Phase | Mean ± SD | p-value | d | Mean ± SD | p-value | d | Mean ± SD | p-value | d | Mean ± SD | p-value | d | Mean ± SD | p-value | d |
| UT | UW | 14.96±15.09 | 0.06 | -0.78 | 14.74±6.78 | 0.02* | -1.15 | 15.44±9.89 | 0.02* | -1.23 | 13.92±9.08 | 0.01* | -1.22 | 13.25±7.32 | 0.00 * | -1.41 |
| REC | 37.46±38.09 | 32.18±20.29 | 34.28±19.28 | 30.73±17.19 | 31.25±16.57 | |||||||||||
| PD | UW | 16.98±4.63 | 0.51 | -0.41 | 12.58±8.59 | 0.89 | 0.31 | 8.93±4.99 | 0.69 | 0.03 | 11.86±6.77 | 0.97 | -0.11 | 11.60±7.80 | 0.97 | -0.16 |
| REC | 19.56±7.52 | 10.41±4.63 | 8.77±6.77 | 12.77±9.29 | 13.13±10.75 | |||||||||||
| AD | UW | 6.55±5.85 | 0.01 * | -1.16 | 4.72±3.79 | 0.04 * | -1.08 | 4.88±3.99 | 0.04 * | 1.07 | 3.49±2.20 | 0.02 * | -0.98 | 3.75±2.58 | 0.03 * | -0.93 |
| REC | 16.46±10.55 | 11.84±8.54 | 12.22±8.89 | 9.47±8.36 | 9.37±8.14 | |||||||||||
| BB | UW | 11.55±3.40 | 0.31 | -0.55 | 11.01±4.15 | 0.31 | -0.49 | 10.43±3.24 | 0.17 | -0.79 | 10.04±2.78 | 0.20 | -0.69 | 10.03±2.61 | 0.27 | -0.67 |
| REC | 15.31±9.09 | 13.84±7.13 | 15.52±9.64 | 14.25±8.11 | 13.19±6.19 | |||||||||||
| TB | UW | 22.80±7.10 | 0.00 * | 2.02 | 21.19±7.53 | 0.00 * | 1.84 | 19.71±6.87 | 0.00 * | 1.74 | 18.80±8.09 | 0.01 * | 1.56 | 19.16±9.09 | 0.03 * | 1.24 |
| REC | 10.22±5.24 | 8.97±5.60 | 9.04±5.26 | 8.52±4.60 | 9.87±5.44 | |||||||||||
| PM | UW | 15.20±8.33 | 0.12 | 0.74 | 13.13±6.14 | 0.06 | 0.93 | 13.30±6.12 | 0.09 | 0.86 | 12.12±5.18 | 0.15 | 0.77 | 12.02±5.26 | 0.45 | 0.30 |
| REC | 9.21±7.97 | 8.28±4.13 | 8.63±4.71 | 8.33±4.63 | 10.12±7.12 | |||||||||||
| LD | UW | 10.51±4.36 | 0.00 * | 2.34 | 9.87±4.67 | 0.00 * | 2.01 | 9.75±4.48 | 0.00 * | 2.10 | 9.00±4.04 | 0.01 * | 1.74 | 8.91±3.91 | 0.01 * | 1.57 |
| REC | 2.96±1.35 | 2.94±1.37 | 2.77±1.50 | 3.30±2.26 | 3.83±2.38 | |||||||||||
Key: * – The statistical significance was set to (p ≤ 0.05); UW – Underwater; REC – Recovery; Mean ± SD – Mean ± Standard Deviation; d – Cohens’d Effect Size.
Disclaimer/Publisher’s Note: The statements, opinions and data contained in all publications are solely those of the individual author(s) and contributor(s) and not of MDPI and/or the editor(s). MDPI and/or the editor(s) disclaim responsibility for any injury to people or property resulting from any ideas, methods, instructions or products referred to in the content. |
© 2025 by the authors. Licensee MDPI, Basel, Switzerland. This article is an open access article distributed under the terms and conditions of the Creative Commons Attribution (CC BY) license (http://creativecommons.org/licenses/by/4.0/).
Copyright: This open access article is published under a Creative Commons CC BY 4.0 license, which permit the free download, distribution, and reuse, provided that the author and preprint are cited in any reuse.


