
Submitted:
23 July 2025
Posted:
25 July 2025
You are already at the latest version
Abstract
The lithium-pilocarpine rat model of status epilepticus (SE) is a well-established paradigm for studying epileptogenesis. Astrocyte reactivity has been implicated in modulating seizure susceptibility and neuroinflammation, yet its functional role in early epileptogenesis remains unclear. Herein, we evaluated the effects of Mdivi-1, a pharmacological inhibitor of mitochondrial fission protein Drp1, for its ability to modulate astrocytic mitochondrial dynamics and for its reported preventive neuroprotective properties. Mdivi-1 was administered shortly after SE onset and we assessed brain glucose metabolism using [¹⁸F]FDG PET, alongside histological markers of neurodegeneration, astrocyte reactivity, and microglial activation, 3 days post-SE. As expected, SE induced widespread brain hypometabolism measured by VOIs analysis, hippocampal neurodegeneration, and glial activation. Post-SE Mdivi-1 administration reduced hippocampal astrocyte reactivity but neither conferred neuroprotection nor rescued glucose metabolism. On the contrary, Mdivi-1 exacerbated cortical hypometabolism when evaluated by SPM normalized by whole brain tracer uptake and exacerbated microglial-mediated neuroinflammation. These findings challenge the assumption that early astrocyte inhibition confers neuroprotection. Furthermore, early suppression of astrocyte reactivity after the damage has occurred may shift the neuroinflammatory response toward a maladaptive microglial activation. Thus, while Mdivi-1 holds promise as a preventive neuroprotective agent, its use post-SE may have unintended adverse effects on early epileptogenic processes.
Keywords:
lithium-pilocarpine model
; status epilepticus
; Mdivi-1
; 2-deoxy-2-[18F]fluoro-D-glucose ([18F]FDG)
; positron emission tomography (PET)
; hypometabolism
; astrocyte
; microglia
; neuroinflammation
1. Introduction
Epilepsy is one of the most prevalent chronic neurological disorders, defined by predisposition to generate spontaneous recurrent seizures (SRS) and often associated with disabling consequences [1]. Among its various forms, temporal lobe epilepsy (TLE) is the most common focal epilepsy in adults and frequently exhibits resistance to conventional antiepileptic pharmacotherapy [2]. TLE is commonly linked to hippocampal sclerosis [3] and interictal glucose hypometabolism localized to the epileptogenic zone [4,5], which can be reliably visualized using 2-deoxy-2-[18F]fluoro-D-glucose positron emission tomography ([18F]FDG-PET). Notably, interictal focal hypometabolism identified via PET imaging is regarded as one of the most robust early biomarkers of TLE [6,7].
The lithium-pilocarpine model of status epilepticus (SE) in rodents is extensively employed to study epileptogenesis, as it replicates many neuropathological and behavioral features of human TLE [8,9,10]. Following pilocarpine-induced SE, animals enter a latent phase characterized by widespread cerebral hypometabolism [11,12,13,14,15,16,17]. This hypometabolic state is a recognized early biomarker of epileptogenesis [15,18] and coincides with key pathological events such as neurodegeneration, neuronal loss, neuroinflammation, and reactive gliosis [13,14,16,17,19]. The metabolic dysfunction underlying this phase is thought to result from a combination of neuronal death, reduced synaptic density [4,5] and impaired cerebral perfusion [20].
Mdivi-1, a selective inhibitor of the mitochondrial fission protein dynamin-related protein 1 (Drp1), has emerged as a promising neuroprotective compound. While originally explored for its anticancer potential, including demonstrated efficacy in various cancer models [21], its application in the context of neurological disorders has garnered growing interest.
Although Mdivi-1 has not yet been approved for clinical use, preclinical studies have consistently shown its neuroprotective efficacy across multiple models of neurological disorders. Thus, Mdivi-1 has been shown to improve neurological outcomes in experimental models of ischemic stroke, traumatic brain injury, and neurodegenerative diseases such as Alzheimer’s and Parkinson’s disease [22] as well as in different animal models of epileptogenesis [23,24,25,26,27,28]. These protective effects are primarily attributed to its modulation of mitochondrial dynamics, particularly through the inhibition of excessive mitochondrial fission, a process often linked to neuronal injury and energy dysfunction.
Beyond fission inhibition, Mdivi-1 also enhances mitochondrial biogenesis and supports energy metabolism, thereby preserving neuronal function in various disease models [29,30,31]. Through these mechanisms, Mdivi-1 helps to maintain mitochondrial integrity, suppress apoptosis-related signaling, and attenuate oxidative stress which are factors critically involved in both acute and chronic neurological damage.
Mdivi-1 is widely employed as a pharmacological tool to investigate mitochondrial-dependent stress responses, particularly in astrocytes through the inhibition of Drp1 [32,33]. However, growing evidence highlights important limitations that warrant caution in interpreting its effects particularly due to its limited cellular and molecular specificity [34,35,36]. Thus, Mdivi-1’s primary mechanism, selective inhibition of Drp1, affects multiple cell types and astrocytes appear particularly sensitive due to their dynamic mitochondrial behavior and central role in neuroinflammation and scar formation. This context-dependent responsiveness positions Mdivi-1 as a promising modulator of astrocyte-driven pathology in central nervous system injuries.
Despite its promising profile, the neuroprotective potential of Mdivi-1 remains underexplored in the context of acquired epilepsy. In particular, its efficacy in the lithium-pilocarpine model of SE has yet to be systematically investigated. Moreover, to our knowledge, no studies have examined the effects of Mdivi-1 on cerebral glucose metabolism, a critical marker of neuronal activity and viability.
However, it is noteworthy that the previously mentioned studies reporting neuroprotective effects of Mdivi-1 have typically involved preventive administration prior to injury onset [23,24,25,26,27,28]. Considering that: (i) this does not reflect the clinical reality where treatment is often initiated after a damaging event has occurred and (ii) in the context of SE, the hours and days following the insult are marked by profound glial activation, oxidative stress, mitochondrial dysfunction, and widespread metabolic disruption, the present study aimed to evaluate the short-term effects of Mdivi-1 when administered immediately following SE. Thus, we studied the effects on brain glucose metabolism, using [18F]FDG-PET imaging. Additionally, we assessed the effects of Midivi-1 on histopathological markers of neuroprotection and neuroinflammation, in order to better understand its therapeutic potential in the early stages of epileptogenesis.
2. Materials and Methods
2.1. Animals
Forty adult male Sprague-Dawley rats (Charles River, France), weighing 378.9 ± 10.5 g at the start of the experiment, were used. Animals were housed in pairs in standard ventilated cages (Tecniplast, Buguggiate, Italy) under controlled temperature (22 ± 2 °C) and a 12 h light/dark cycle (8:00 a.m. to 8:00 p.m.). Rats were allowed at least 5 days to acclimate to the new environment prior to any procedures. Environmental enrichment included chew sticks and plastic tunnels. Food and water were available ad libitum, except for a 12 h fasting period prior to the PET imaging acquisitions.
All procedures complied with European (2010/63/EU) and Spanish (RD53/2013) regulations for animal welfare. The study was approved by the Animal Research Ethics Committee of the Complutense University of Madrid and the Autonomous Community of Madrid (PROEX 222.1/20, July 16, 2020). All efforts were made to minimize animal suffering.
2.2. Lithium-Pilocarpine SE Model and Mdivi-1 Administration
The experimental design is summarized in Figure 1. The lithium–pilocarpine model of SE was induced as previously described [13,14,16,17]. Briefly, rats received lithium chloride (127 mg/kg, i.p.; Sigma–Aldrich) 18–20 h prior to pilocarpine administration (25 mg/kg, i.p.; Sigma–Aldrich). Thirty minutes before pilocarpine injection, animals were pretreated with methyl-scopolamine (2 mg/kg, i.p.) to reduce peripheral cholinergic effects.
SE onset was defined by Racine stage 4 (rearing with forelimb clonus) with continuous seizure activity (Racine, 1972). After 45 min, pentobarbital (25 mg/kg, i.p.) was administered to terminate seizures. Rats that failed to reach stage 4 were excluded from the study. In case seizure behaviour persists 60 min after the pentobarbital injection, a half-dose of pentobarbital was administered. Control rats received the same treatment schedule but with saline (1 ml/kg, i.p.).
Mdivi-1 (1.25 mg/kg, i.p.; Sigma–Aldrich) dissolved in DMSO was administered at two time points: 1 min and 24 h after SE induction. The dose was selected based on a previous report showing protective effects of Mdivi-1 in pilocarpine-induced seizures in rats [24].
Thus, the experimental groups were as follows: (i) SAL+VEH (n = 9); (ii) PILO+VEH (n = 11); (iii) SAL+MDIVI (n = 9) and (iv) PILO+MDIVI (n = 11).
2.3. Body Weight (BW) Measurements
Rats were weighed at five time points throughout the study: 24 h before pilocarpine (before lithium-chloride injection), at pilocarpine injection and 24 h, 48 h and 72 h post-pilocarpine. Following PET scanning, animals were sacrificed by decapitation and brains were collected for histological analysis.
2.4. [18F]FDG PET/CT Imaging
[18F]FDG PET scans were acquired 3 days post-SE, during the silent period, following the protocol established in our lab [13,14,16,17,37]. Briefly, the radiotracer ([18F]FDG; ~13 MBq in 0.2 ml saline; Curium Pharma, Spain) was injected via tail vein. Immediately after the injection, the rats were returned to their cages for a 30-min period, to ensure the brain uptake of the radiotracer. After this awake uptake period, animals were anesthetized with isoflurane/oxygen and scanned using a dual PET/CT scanner (Albira PET/CT, Bruker NMI, Germany). The images acquisitions consisted of a 20-min static PET scan followed by a high-resolution computed tomography (CT) scan. Once acquired, the PET images were reconstructed by using a Maximum Likelihood Expectation Maximization (MLEM) algorithm, applying decay, random and scatter corrections. The CT images were reconstructed by Filtered Back Projection (FBP) algorithm. For both reconstruction procedures the own Albira embedded software was used (Bruker NMI, Germany).
2.4.1. PET Image Analysis by Volumes-of-Interest (VOIs) Analysis
Each individual CT skull image was manually co-registered to a magnetic resonance imaging (MRI) rat brain template [38] to obtain a fitted spatial mathematical transformation. Later, the CT transformation was applied to the corresponding PET image thus correcting and matching the PET image and the MRI template (as previously described [39]. This co-registered PET image was overlayed onto the MRI template (containing the pre-defined brain areas) to quantify the tracer regional uptake values (kBq/ml). Further, the normalization to standardized uptake value (SUV; g/ml) was done correcting by the animal BW, the injected dose and decay of the radiotracer using the following formula: [Tracer uptake (kBq/ml) * BW (g)) / (Tracer dose administered (kBq))]. These procedures were performed by using PMOD 4.1, PMOD Technologies Ltd., Zurich, Switzerland).
2.4.2. PET Evaluation by Statistical Parametric Mapping (SPM)
In experimental PET imaging studies, the regions that eventually show effects are often unknown in advance and they might not correspond to the predefined anatomical VOIs. Thus, different from the traditional quantification using VOIs (see Section 2.5), SPM includes the whole brain in the analysis, without any preconception about the structures involved in the experimental paradigm [40]. This approach might unveil differences in subregions that are not detected by the VOI analysis. Besides, when the regional uptake is normalized to whole brain, it allows us to compare relative regional changes without interferences from changes in blood brain flow and tracer peripheral uptake.
SPM comparisons were performed using MATLAB software (The MathWorks, Natick, Ma, USA) and SPM12 (Wellcome Trust Center for Neuroimaging, UCL, London, UK) as reported [37]. To evaluate the effects of Mdivi-1 treatment on the hypometabolism induced by SE, differences between PILO+VEH and PILO+MDIVI-1 groups were calculated by t-test. The t-value threshold was set to show voxels with a correspondent p<0.05. Parametric t maps resulting from the comparison between both experimental groups were loaded in PMOD and fused to a rat brain T2-MRI template.
2.5. Brain Tissue Collection and Processing for Neurohistochemical Assessments
After PET scans, the animals were sacrificed, and their brains were dissected and divided into two hemispheres. The resulting hemibrains were immediately frozen on dry ice and stored at −80 °C. Coronal sections (25 μm thick) containing the dorsal hippocampus were obtained using a cryostat (Leica CM1850, Leica Biosystems, Germany) and thaw-mounted onto Superfrost Plus slides (Thermo Scientific, Germany). Slices were dried on a hot plate at 37 °C for approximately 5 min and then stored at −80 °C until further analysis.
2.6. Nissl Staining
For qualitative assessment of neuronal viability and hippocampal integrity Nissl staining with cresyl violet was done as previously described [13,16,41]. Briefly, the slices were fixed in 4% formaldehyde in phosphate buffer pH 7.4 (10 min), washed and stained for 30 min in 0.5% cresyl violet acetate solution. Afterwards, the sections were washed and dehydrated in graded ethanol series (70%, 95% and 100%). Finally, the slices were cleared in with xylene (Merck-Sigma), and mounted with DPX (Herter, Barcelona, Spain). Images were captured using a colour digital camera Leica DFC425 (Leica, Germany) coupled to a DM 2000 LED microscope with Leica Application Suite 4.7 software.
2.7. Fluoro-Jade C (FJC) Labeling
Hippocampal neurodegeneration was assessed following the protocol previously described [37,42] using FJC (0.0001% in PBS, 2 min; Millipore, Darmstadt, Germany) which requires unfixed tissue. After collecting from the freezer, slides were dried and mounted with DPX (Herter, Barcelona, Spain). Images were collected with a Leica DFC3000G camera using a fluorescein isothiocyanate (FITC) filter and coupled to a microscope (Leica DM 2000 LED). Neurodegeneration was evaluated by counting the number of FJC positive-neurons in the following hippocampal subregions CA1, CA3 and hilus by using the semi-automatic “Analyze Particles Function” available in the ImageJ 1.54g software (developed at the National Institutes of Health -NIH- and freely available at http://rsb.info.nih.gov/ij/download.html).
2.8. Reactive Astrogliosis by Glial Fibrillary Acidic Protein (GFAP) Immunofluorescence
Astrogliosis was assessed by one step GFAP immunofluorescence following a previously reported protocol [13,14,16,17,37]. Briefly, sections were fixed in 4% formaldehyde, blocked/permeabilized with 3% BSA and 0.1% Triton X-100 in TBS (60 minutes), and incubated overnight with anti-GFAP-Cy3 (1:500, Sigma–Aldrich) in 1% BSA in TBS at 4 °C. After washing in 0.1% Tween 20 dissolved in TBS (3 x 5 minutes), slides were mounted with Mowiol. Images were captured and evaluated using the same optical systems used for FJC but using a tetramethylrhodamine (TRITC) filter. GFAP fluorescence intensity in the dorsal hippocampus was quantified with ImageJ 1.54g software and expressed as a percentage relative to the SAL+VEH control group.
2.9. Microglia-Mediated Neuroinflammation by [3H]PK11195 Autoradiography
To evaluate microglial activation, the translocator protein (TSPO; 18 kDa) expression was assessed using [3H]PK11195 (Perkin Elmer) autoradiography following a modified protocol as previously reported [14,16,17,37]. Slides were dried (37 °C, 10 min), preincubated in 50 mM Tris-HCl (pH 7.4, 15 min), then incubated in 1 nM [3H]PK11195 for 60 min. After ice cold distilled water washing (2x5 minutes), slides were dried and exposed to autoradiographic film (Kodak BioMax MR, Carestream, U.S.A.) for approximately 2 months. Developed films were placed on a light box (Kaiser Prolite 5000, Kaiser Fototechnik, Germany) and the autoradiographic images were captured with a Leica DFC425 camera coupled to a Leica MZ6 stereomicroscope. Delimitation and quantification steps were performed with ImageJ software version 1.54g. Optical density (O.D.) values were used to estimate neuroinflammation levels.
2.10. Statistical Analyses
Data are shown as mean ± standard error of the mean (SEM). Analyses were performed with SigmaPlot 11 software (Systat Software Inc.). Mortality rate was only analysed comparing PILO+VEH vs PILO+MDIVI by a z-test for rates and proportions. BW, PET and neurohistochemical data were analysed by two-way analysis of variance (ANOVA) with pilocarpine and Mdivi-1 treatments as the two main factors. When interaction between factors was significant, further post hoc Tukey tests were performed. Statistical significance was considered when p < 0.05.
3. Results
3.1. Mortality Rate
The mortality rate following SE was 33,4% (4 out of 11 rats) in the PILO+VEH group and 18.1% (2 out of 11 rats) in the PILO+MDIVI group. However, the z-test for rates and proportions revealed no statistically significant difference between the groups (p = 0.739), indicating that Mdivi-1 administration did not significantly affects-associated mortality.
3.2. Overall BW Changes
The percentage of BW changes is presented in Figure 2. When compared to BW of experimental day -1, and as expected, SE induced a significant loss of approximately 15-20% of BW in both PILO+VEH and PILO+MDIVI-1 groups (p = 0.004 for both). When BW changes from the two pilocarpine-injected groups (PILO+VEH vs PILO+MDIVI-1) were compared between them, no significant statistical differences were found, suggesting that the weight loss induced by SE was not affected by Mdivi-1 administrations. Likewise, in non-insulted rats, Mdivi-1 had no effects on BW.
3.3. Brain Glucose Metabolism Assessed by [18F]FDG PET
3.3.1. VOI-Based Quantitative Analysis (SUV Measurements)
Analysis of SUV data from [18F]FDG PET imaging revealed that SE induced by pilocarpine led to significant glucose hypometabolism in multiple brain regions, regardless of Mdivi-1 treatment. In the PILO+VEH group, significant reductions in [18F]FDG uptake were observed in the hippocampus (p = 0.04), cortex (p = 0.018), amygdala (p = 0.014), and striatum (p = 0.012). Similarly, the PILO+MDIVI-1 group showed significant hypometabolism in the hippocampus (p = 0.002), cortex (p < 0.001), thalamus (p = 0.003), amygdala (p = 0.02), and striatum (p < 0.001) (Figure 3A-B). No significant differences were observed between the PILO+VEH and PILO+MDIVI-1 groups across any of the regions studied via VOI-based analysis.
3.3.2. Voxel-Wise Analysis (SPM)
However, the SPM analysis of [18F]FDG uptake normalized to whole-brain revealed that Mdivi-1 administration exacerbated SE-induced hypometabolism compared to the vehicle-treated group. Noticeably, the brain regions showing enhanced hypometabolism were the cortical areas, predominantly within the frontal, parietal, and occipital lobes (Figure 4).
3.4. Histopathological Evaluation: Neurodegeneration
Cresyl violet staining revealed visible neuronal loss in the hippocampal subregions CA1, CA3, and the hilus in both SE groups. No apparent neuroprotective effect of Mdivi-1 was observed (Figure 5).
The Nissl findings were further supported by FJC staining. Quantification of FJC-positive neurons demonstrated significant neuronal degeneration in PILO+VEH rats: CA1 (206.3 ± 41.1), CA3 (50.3 ± 14.7), and hilus (42.3 ± 6.8). As shown, similar patterns were observed in PILO+MDIVI-1 rats: CA1 (150.9 ± 24.2), CA3 (50.1 ± 17.2), and hilus (63.0 ± 15.9), with no statistically significant differences between the SE groups (Figure 6A-C). As expected, no neurodegeneration was detected in the hippocampus of control SAL+VEH or SAL+MDIVI-1 rats.
3.5. Astrocyte Reactivity (GFAP Immunofluorescence)
SE resulted in a marked increase (~70%, p<0.001) in GFAP fluorescence intensity in the hippocampus of PILO+VEH rats compared to SAL+VEH, indicating robust astrocyte activation (Figure 7A-C). While Mdivi-1 did not prevent the GFAP increase, it significantly attenuated the magnitude of astrogliosis. Specifically, GFAP intensity in PILO+MDIVI-1 rats was approximately 50% higher than SAL+MDIVI-1 (p<0.001), but ~20% lower than in PILO+VEH rats (p<0.05). Morphologically, SE induced astrocyte hypertrophy, including thickened cell bodies and processes, which were slightly less pronounced in the MDIVI-1-treated group.
3.6. Microglia-Mediated Neuroinflammation ([3H]PK11195 Autoradiography)
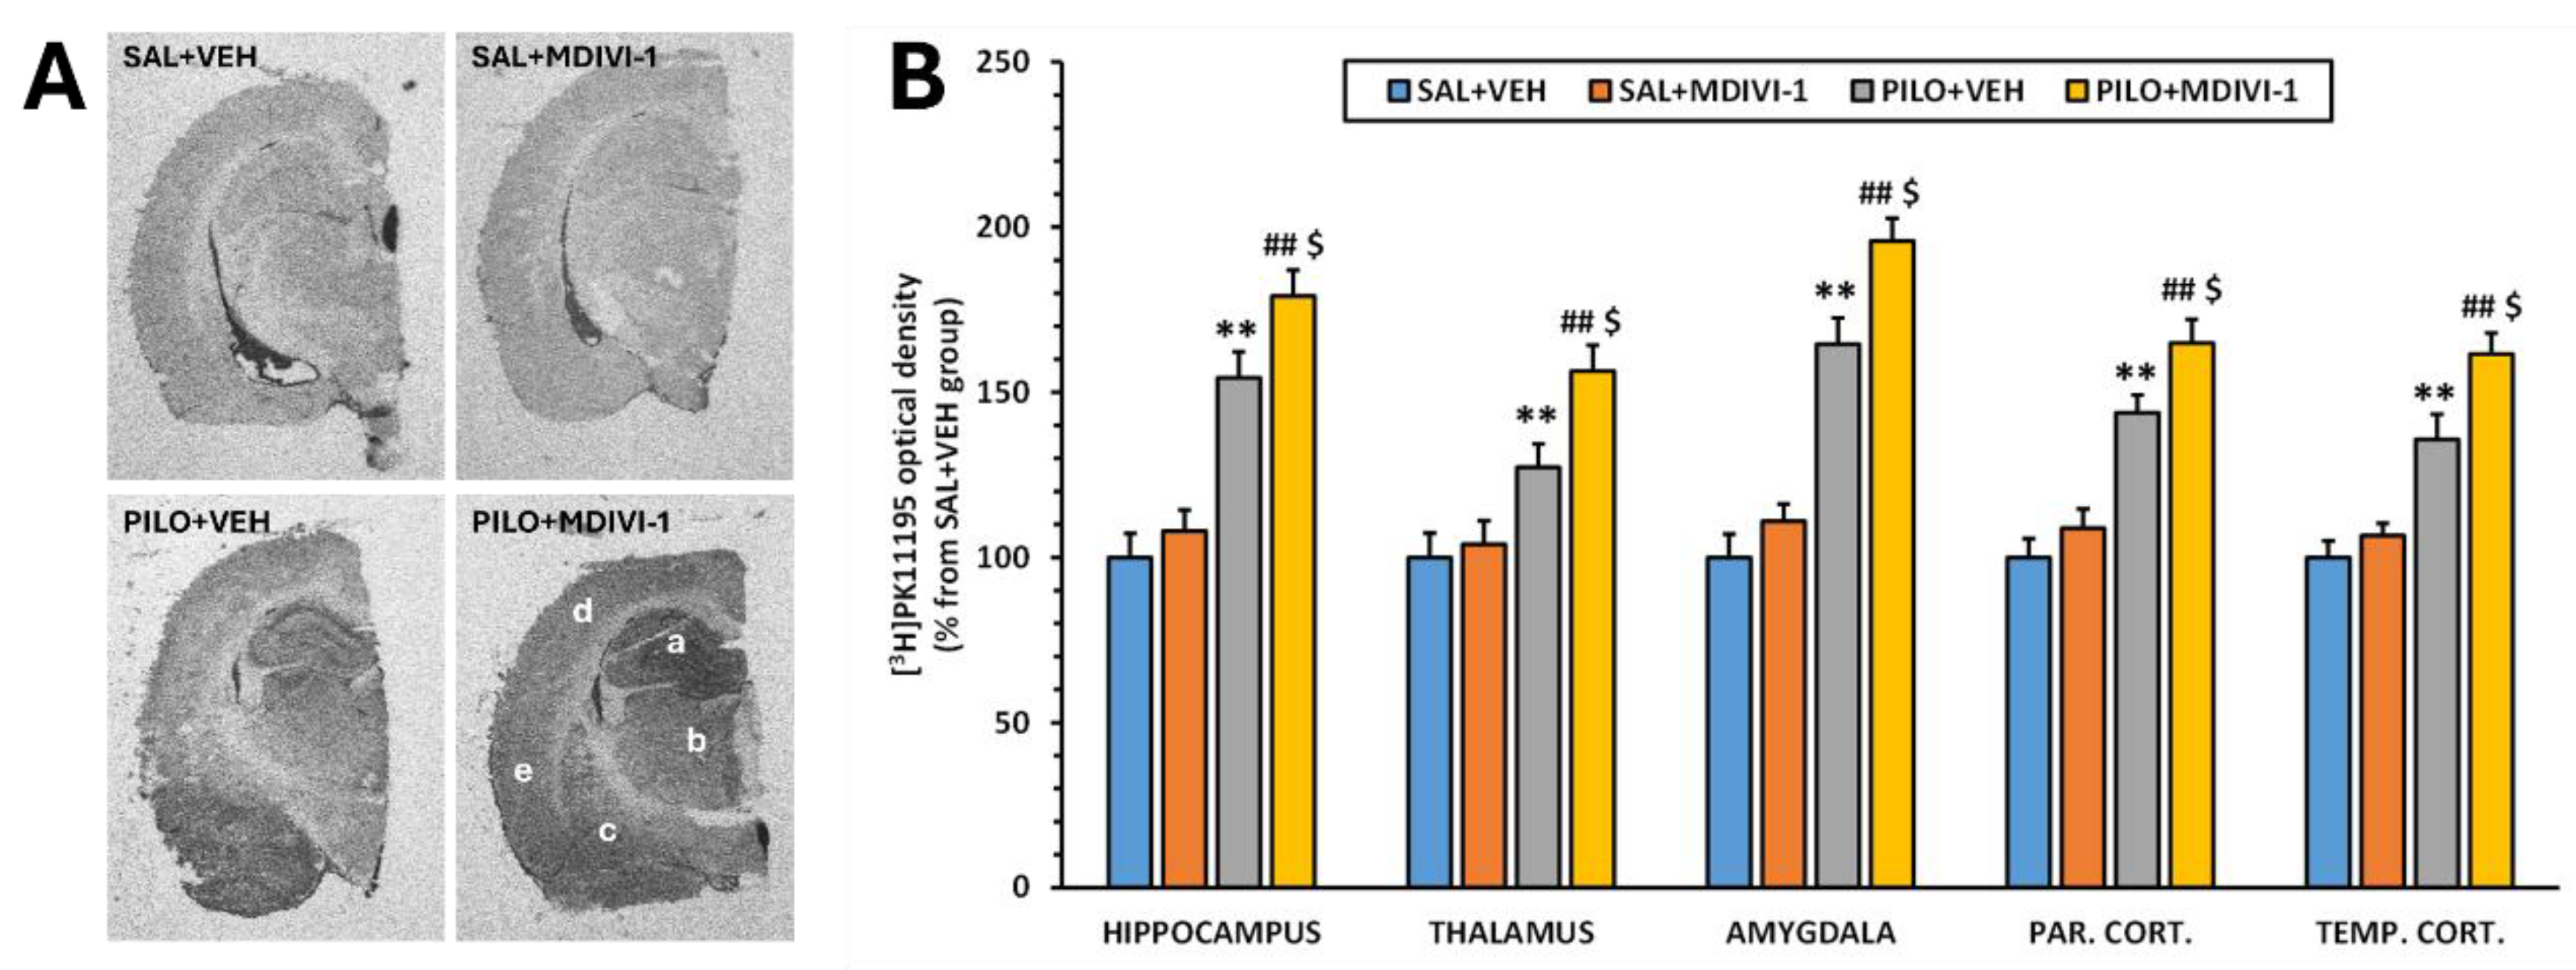
Autoradiographic analysis using [3H]PK11195 as a marker of microglial activation revealed that Mdivi-1 had no effect on basal neuroinflammatory levels in non-injured rats. In contrast, SE caused a significant increase in optical density (O.D.) across all examined regions compared to SAL+VEH (p<0.001; Figure 8A-B). This increase was also observed in the PILO+MDIVI-1 group (p<0.001). Notably, Mdivi-1 treatment further exacerbated SE-induced neuroinflammation compared to PILO+VEH (p < 0.05), suggesting that in this context, Mdivi-1 may intensify the neuroinflammatory response mediated by microglia.
4. Discussion
The present study has investigated the impact of Mdivi-1 administration following pilocarpine-induced SE on early brain glucose metabolism, hippocampal neuronal death and neurodegeneration and glial-mediated neuroinflammation responses.
The lithium-pilocarpine rat model of SE is a widely used and well-characterized experimental paradigm to study TLE and epileptogenesis [10]. It resembles many, but not all, pathological features of human TLE [8,9]. In so far, to date few reports have attempted to study the effects of Mdivi-1 or the altered Drp1 mitochondrial dynamics on the lithium-pilocarpine model of SE in rats, and in all cases Mdivi-1 was administered before SE [23,24,25,26,27].
In the lithium-pilocarpine model, SE is followed by a silent latency period during which generalized glucose hypometabolism occurs, being considered as an early biomarker of epileptogenesis [15,43,44,45]. This hypometabolism occurs concomitantly with severe neurodegeneration and neuronal death, neuroinflammation and intense reactive gliosis, affecting both astroglia and microglia [13,14,16,17,19,46], and ultimately leading to a chronic epileptic state characterized by SRS. Therefore, we chose this silent period (3 days after SE) to study the [18F]FDG PET and neurohistochemical changes. Consistent with prior work, our results confirm the characteristically described features, further reinforcing the reliability of the lithium-pilocarpine model in mimicking early epileptogenic processes.
Surprisingly, Mdivi-1 treatment, despite effectively reducing GFAP expression, failed to mitigate metabolic or histological damage, and instead exacerbated cortical hypometabolism and microglia-mediated neuroinflammation. These findings suggest that acute suppression of astrocyte reactivity, though generally considered beneficial, may in fact be detrimental when mistimed or applied without cell-type specificity.
Mdivi-1 is widely used as a pharmacological tool particularly effective in modulating mitochondrial-dependent stress responses in astrocytes by inhibiting Drp1 [32,33,47]. Inhibition of excessive mitochondrial fission by Mdivi-1 has been shown to exert cytoprotective effects in age-related diseases [48], animal models of neurodegenerative diseases, such as Alzheimer’s disease, Parkinson’s disease, and multiple sclerosis [22] as well as in different animal models of epileptogenesis [23,24,25,26,27,28]. However, herein it is important to notice that in those studies, Mdivi-1 was always administered preventively before the insult. Furthermore, accumulating evidence indicates significant limitations that warrant some caution when interpreting the effects of Mdivi-1. Regarding the latter, Mdivi-1 lacks cellular selectivity. It affects not only astrocytes but also neurons, microglia, and peripheral cell types [34]. Its molecular specificity has been challenged. Thus, although initially described as a selective Drp1 inhibitor [35], subsequent studies have shown that Mdivi-1 can exert Drp1-independent effects, including direct inhibition of mitochondrial complex I, leading to decreased mitochondrial respiration and altered redox status [34,36]. Moreover, not only does the effective range of Mdivi-1 dose varies widely across different models but the in vivo pharmacokinetics are yet to be well defined. At high concentrations, Mdivi-1 may induce off-target effects, including mitochondrial depolarization or apoptosis, depending on the cell type and context [49,50]. In the case of astrocytes, which rely on mitochondrial dynamics to support metabolic and homeostatic functions, non-specific mitochondrial perturbations may inadvertently disrupt astrocytic metabolism and signaling pathways, potentially confounding interpretations that attribute changes in astrocyte reactivity solely to Drp1 inhibition [32]. Altogether, the lack of cellular and molecular specificity, the timing, doses and routes of administration might be crucial determining the overall effects of Mdivi-1.
In our study, Mdivi-1 was i.p. administered, 1 min and 24 h after the SE onset, at a dose of 1,25 mg/kg. Herein, it is worth noting that the dose and route of administration was chosen based on previously reported data showing neuroprotective effects of Mdivi-1 in the lithium-pilocarpine model of SE. Thus, Mdivi-1 administered at a dose of 1.2 mg/kg, i.p., 30 minutes before pilocarpine showed to be effective reducing Drp1 expression and improving mitochondrial ultrastructure in CA1 neurons, delaying the seizure onset and reducing the severity of the seizures [25] Besides, i.v. bolus of mdivi-1 (1.25 mg/kg) given 15 min before pilocarpine administration significantly attenuated hippocampal neuronal death measured 3 days after SE [24]. Furthermore, the authors showed that this neuroprotective effect was dose-dependent, not being observed when Mdivi-1 was administered at a dose of 0.25 mg/kg.
In the current study, Mdivi-1 administration neither significantly affected the mortality rate nor the overall BW loss that typically are observed as consequences of the severity of the SE induced by pilocarpine. Likewise, we did not find any significant neuroprotective effect based on hippocampal signs of neurodegeneration and neuronal death (Figure 5 and Figure 6). These results suggest that the timing of Mdivi-1 administration either before or after SE, is key in determining its potential protective effects.
The present study provides novel insights into the metabolic consequences of Mdivi-1 administration following SE induced by lithium-pilocarpine in rats. Mdivi-1 administered shortly after SE onset (1 min and 24 h later) failed to attenuate SE-induced metabolic impairment when the analysis of PET imaging data was conducted by the conventional VOIs method (Figure 3). Furthermore, the voxel-by-voxel analysis by SPM normalized to whole brain [18F]FDG uptake revealed that Mdivi-1 induced a more pronounced and spatially distinct glucose hypometabolism, particularly in some cortical and hippocampal areas (Figure 4). This difference between both methods of analysis highlights the ability of SPM for detecting regional changes without requiring a priori anatomical assumptions. Unlike VOI-based analysis, SPM evaluates the whole brain voxel-by-voxel, allowing for the detection of subtle or unexpected effects. In addition, normalization to whole brain activity reduces confounding from peripheral tracer uptake and global cerebral blood flow alterations.
The marked hypometabolism observed in limbic-cortical regions is of particular relevance, given that the functional connectivity of these areas, involved in executive, cognitive, sensory and emotional processing, is disrupted in epilepsy [51,52]. Several mechanisms may be associated with this effect. For example, mitochondrial dysfunction in the cortical surviving neurons due to impaired fission and turnover of damaged organelles by Mdivi-1 might have led to bioenergetic deficits. Besides, differential effects of Mdivi-1 on neurons vs glial cells might have altered the overall [18F]FDG uptake profile masking or amplifying specific metabolic patterns. It is also interesting that the exacerbated hypometabolism particularly in hippocampal and cortical areas might indicate perturbed synaptic activity and connectivity in these areas [53]. In this context, Mdivi-1 administered by i.p. injection before SE induction in rats has been shown to increase latency to first seizure, to reduce the number of epileptic seizures and to reduce the effects of SE increasing Drp1 in hippocampus and cortex [25]. Furthermore, there’s robust and consistent evidence that Mdivi-1, when administered before damage, protects cortical neurons, not only in epilepsy models including the pilocarpine model of SE [25,54] but also preserving mitochondrial health and reducing neuronal cell death across different types of brain injury such as ischemia/stroke [55] glutamate-mediated neurotoxicity [29,56] and traumatic brain injury [57,58]. Thus, Mdivi-1 clearly confers protective and restorative effects in both cortex and hippocampus by inhibiting Drp1-mediated mitochondrial fission. While neuronal benefits of Mdivi-1 are well-documented in cortical neurons, astrocyte-specific effects in cortex remain understudied.
To our knowledge, this is the first study employing [18F]FDG-PET to assess the impact of Mdivi-1 administration on brain glucose metabolism. Considering that cerebral glucose hypometabolism has been proposed as an early biomarker of epileptogenesis in several models [15,59], our current findings raise important questions. The lack of effects of Mdivi-1 improving the metabolic deficits and/or its effect intensifying the hypometabolism in cortical areas might indicate either no beneficial effects or potential deleterious ones, at least when administered during the early post-SE period. However, it is essential to acknowledge that this study did not evaluate long-term outcomes such as the frequency or severity of SRS, neurocognitive function, or chronic metabolic profiles. Consequently, while the data suggests that Mdivi-1 may disrupt early metabolic recovery after SE, we cannot conclude whether these effects might have a predictive value in epileptogenesis or simply reflect altered acute-phase response.
In the lithium-pilocarpine model, glial cells—particularly astrocytes and microglia— not only respond to the initial SE insult but play crucial and tightly interconnected active roles in the initiation and progression of neuroinflammation, neurodegeneration, and network reorganization [60,61,62]. Astrocyte–microglia reciprocal interactions are emerging as critical regulators of the neuroinflammatory cascade and circuit remodeling during epileptogenesis.
Previously reported studies have shown that Mdivi-1 treatment is effective in reducing astrocyte reactivity under different types of neurological injury [32,33,63]. Thus, one of our main objectives was to evaluate the contribution of astrocytes on SE-induced damage by inhibiting its reactivity using Mdivi-1. Our results clearly showed that Mdivi-1 reduced astrocyte reactivity in response to SE as evidenced by the reduced GFAP expression by (Figure 7). However, as previously indicated, this reduction was neither translated into neuroprotection nor did it rescue the overall brain metabolic deficits but, based on SPM analysis, it might have exacerbated cortical hypometabolism. Furthermore, inhibition of astrocyte reactivity by Mdivi-1 exacerbated the microglial activation in SE-insulted rats.
Following SE, astrocytes are among the first cells to respond, exhibiting rapid morphological and transcriptional changes commonly referred to as reactive astrogliosis. This reactive state including upregulation of GFAP is also accompanied by altered potassium and glutamate buffering, and by the release of cytokines and ATP, which in turn modulate microglial activity [64,65]. In the lithium-pilocarpine model, astrocyte activation occurs rapidly after the SE, with upregulation of GFAP within the first 72 hours post-SE [13,14,16,17,19]. Astrocyte reactivity generally precedes or coincides with microglial activation, suggesting a temporal hierarchy in glial responses [66]. Several studies have shown that astrocyte-derived signals can functionally regulate microglial activation, either promoting or limiting inflammatory responses depending on timing and context [67]. Microglial cells, in turn, secrete cytokines that further influence astrocyte reactivity, establishing a reciprocal regulatory loop [68,69]. This temporal sequence is critical.
In this context, our current results show that when acute astrocyte reactivity is pharmacologically attenuated by Mdivi-1, microglia activation measured 3 days after the SE become hyperactive, suggesting a complex and possibly inhibitory role of astrocytes over microglia during the early post-SE phase. As previously reported [32,33], this is likely due to the loss of astrocyte-derived anti-inflammatory or homeostatic signals in the early stages of epileptogenesis. Thus, our results reinforce the hypothesis that astrocytes might exert an acute regulatory “braking” effect on microglial activation.
In the lithium-pilocarpine model, astrocyte and microglial reactivity remain elevated weeks to months post-SE, particularly in hippocampal and limbic regions [15,66]. Astrocytic dysfunction may drive ongoing microglial activation, and vice versa, with astrocyte-derived mediators serving as long-term microglial stimuli [70,71,72,73]. Recent evidence suggests that glial communication becomes increasingly dysregulated in chronic epilepsy, potentially establishing a positive feedback loop of gliosis and inflammation [74]. This includes epigenetic modifications in astrocytes and microglia that maintain their reactive states independent of external stimuli [75].
Herein, it is interesting to notice that the astrocyte–microglia crosstalk is a shared feature of epileptogenesis found in other chemical models of SE such as the kainic acid [15,68,76,77,78,79] and in the electrically-induced model of SE [80]. Nevertheless, the directionality, timing, and functional consequences of this interaction are model-dependent.
Then, our results in the lithium-pilocarpine model of SE align with reports showing that astrocyte-microglia crosstalk is temporally dynamic and supports the context-dependent factor [74]. Thus, in the early epileptogenic window, astrocytes seem to act restraining microglial responses and consequently the early inhibitory intervention with Mdivi-1 may have disrupted the neuro-astrocyte-microglia homeostasis resulting in worse outcomes.
Our results provide novel insights showing that Mdivi-1 failed to attenuate SE-induced metabolic impairment; on the contrary, it exacerbated the glucose hypometabolism, especially in cortical regions. Cerebral glucose hypometabolism has been proposed as an early biomarker of epileptogenesis in various animal models [12,44,45,59,81], and the fact that Mdivi-1 intensified cortical hypometabolism could indicate a deleterious effect—at least when administered during the early post-SE period. However, it is essential to acknowledge that this study did not evaluate other long-term outcomes such as the frequency or severity of spontaneous seizures, neurocognitive function, or chronic metabolic profiles.
In summary, our data did not show neuroprotective effects of Mdivi-1 when administered shortly after SE. Besides, Mdivi-1 not only did not rescue brain glucose hypometabolism but, when analyzed by SPM, it showed disruptive effects after SE, particularly in cortical regions. Furthermore, Mdivi-1 reduced astrocyte reactivity and exacerbated microglia activation supporting the potential regulatory role of astrocytes inhibiting early microglia-mediated neuroinflammation. Thus, our study suggests that the acute blocking of astrocyte reactivity may lead to an unintended short-term pro-inflammatory state mediated by hyperactive microglia in the early phase of epileptogenesis. This shift might counteract any potential neuroprotective effect and the ability of Mdivi-1 to rescue brain metabolic deficits. Even though these effects might simply reflect altered acute-phase responses, we cannot discard that they might have long-term deleterious consequences exacerbating epileptogenesis in later phases.
5. Conclusions
In sum, astrocyte and microglia interactions in the lithium-pilocarpine rat model of SE are functionally interdependent and temporally coordinated, shaping the inflammatory milieu. While Mdivi-1 has shown promise in preventing brain damage in different types of neurological disorders including epilepsy, our findings challenge the assumption that inhibition of mitochondrial fission is always beneficial in post-SE models. Furthermore, our results reflect the need for determining the temporally precise conditions of Mdivi-1 administration and they also emphasize the complexity of targeting mitochondrial dynamics in epilepsy.
Future studies using conditional astrocyte-specific genetic models to determine whether astrocyte reactivity might be highly interesting for early containment of microglial activation. Longitudinal profiling of astrocytic modulation beyond the acute phase might be essential to determine how early glial interventions shape long-term neuroprotection, seizure susceptibility and cognitive outcomes.
Author Contributions
Conceptualization, F.G.-O., L.G.-G. and M.A.P.; methodology, L.G.-G.; formal analysis, L.G.-G. and F.G-O.; investigation, L.G.-G., R.F.-R and P.B.; data curation, F.G.-O., L.G.-G., M.B. and P.B.; writing—original draft preparation, F.G.-O. and L.G.-G.; writing and editing, F.G.-O. and L.G.-G.; review, F.G.-O., L. G.-G. M.B, P.B. and M.A.P; funding acquisition, M.A.P; project administration: M.A.P.. All authors have read and agreed to the published version of the manuscript.
Funding
This research was funded by the Spanish Ministerio de Ciencia e Innovación, grant number Retos PID2019-106968RB-100. PB position is funded by the Spanish Health Institute Carlos III through the “Miguel Servet” program (CP21/00020).
Institutional Review Board Statement
The animal study protocol was approved by the Ethics Committee of the Complutense University of Madrid, being ratified by the Autonomous Community of Madrid (PROEX 222.1/20).
Informed Consent Statement
Not applicable.
Data Availability Statement
Data will be available upon reasonable request to the corresponding author.
Conflicts of Interest
The authors declare no conflicts of interest.
Abbreviations
The following abbreviations are used in this manuscript:
| [18F]FDG | 2-deoxy-2-[18F]Fluoro-D-Glucose |
| BW | Body weight |
| CT | Computed tomography |
| Drp1 | Dynamin-related protein 1 |
| FBP | Filtered back projection |
| FJC | Fluoro Jade C |
| GFAP | Glial fibrillary acidic protein |
| Mdivi-1 | Mitochondrial division inhibitor-1 |
| MLEM | Maximum likelihood expectation maximization |
| MRI | Magnetic resonance imaging |
| O.D. | Optical density |
| PET | Positron emission tomography |
| SE | Status epilepticus |
| SEM | Standard error of the mean |
| SPM | Statistical parametric mapping |
| SRS | Spontaneous recurrent seizures |
| SUV | Standardized uptake value |
| TLE | Temporal lobe epilepsy |
| TSPO | 18 kDa translocator protein |
| VOI | Volume of interest |
References
- Fisher, R.S.; Cross, J.H.; French, J.A.; Higurashi, N.; Hirsch, E.; Jansen, F.E.; Lagae, L.; Moshé, S.L.; Peltola, J.; Roulet Perez, E.; et al. Operational Classification of Seizure Types by the International League Against Epilepsy: Position Paper of the ILAE Commission for Classification and Terminology. Epilepsia 2017, 58, 522–530. [Google Scholar] [CrossRef] [PubMed]
- Tang, F.; Hartz, A.M.S.; Bauer, B. Drug-Resistant Epilepsy: Multiple Hypotheses, Few Answers. Front Neurol 2017, 8. [Google Scholar] [CrossRef] [PubMed]
- Janszky, J.; Janszky, I.; Schulz, R.; Hoppe, M.; Behne, F.; Pannek, H.W.; Ebner, A. Temporal Lobe Epilepsy with Hippocampal Sclerosis: Predictors for Long-Term Surgical Outcome. Brain 2005, 128, 395–404. [Google Scholar] [CrossRef]
- Kumar, A.; Chugani, H.T. The Role of Radionuclide Imaging in Epilepsy, Part 1: Sporadic Temporal and Extratemporal Lobe Epilepsy. J Nucl Med Technol 2017, 45, 286–293. [Google Scholar] [CrossRef]
- Kumar, A.; Chugani, H.T. The Role of Radionuclide Imaging in Epilepsy, Part 2: Epilepsy Syndromes. J Nucl Med Technol 2017, 45, 294–301. [Google Scholar] [CrossRef]
- O’Brien, T.J.; Miles, K.; Ware, R.; Cook, M.J.; Binns, D.S.; Hicks, R.J. The Cost-Effective Use of 18F-FDG PET in the Presurgical Evaluation of Medically Refractory Focal Epilepsy. Journal of Nuclear Medicine 2008, 49, 931–937. [Google Scholar] [CrossRef]
- Verger, A.; Lagarde, S.; Maillard, L.; Bartolomei, F.; Guedj, E. Brain Molecular Imaging in Pharmacoresistant Focal Epilepsy: Current Practice and Perspectives. Rev Neurol (Paris) 2018, 174, 16–27. [Google Scholar] [CrossRef]
- Turski, W.A.; Cavalheiro, E.A.; Schwarz, M.; Czuczwar, S.J.; Kleinrok, Z.; Turski, L. Limbic Seizures Produced by Pilocarpine in Rats: Behavioural, Electroencephalographic and Neuropathological Study. Behavioural Brain Research 1983, 9, 315–335. [Google Scholar] [CrossRef]
- Brandt, C.; Töllner, K.; Klee, R.; Bröer, S.; Löscher, W. Effective Termination of Status Epilepticus by Rational Polypharmacy in the Lithium–Pilocarpine Model in Rats: Window of Opportunity to Prevent Epilepsy and Prediction of Epilepsy by Biomarkers. Neurobiol Dis 2015, 75, 78–90. [Google Scholar] [CrossRef]
- Ahmed Juvale, I.I.; Che Has, A.T. The Evolution of the Pilocarpine Animal Model of Status Epilepticus. Heliyon 2020, 6. [Google Scholar] [CrossRef]
- Pitkänen, A. Drug-Mediated Neuroprotection and Antiepileptogenesis: Animal Data. Neurology 2002, 59. [Google Scholar] [CrossRef] [PubMed]
- Lee, E.M.; Park, G.Y.; Im, K.C.; Kim, S.T.; Woo, C.W.; Chung, J.H.; Kim, K.S.; Kim, J.S.; Shon, Y.M.; Kim, Y.I.; et al. Changes in Glucose Metabolism and Metabolites during the Epileptogenic Process in the Lithium-Pilocarpine Model of Epilepsy. Epilepsia 2012, 53, 860–869. [Google Scholar] [CrossRef] [PubMed]
- Hernández-Martín, N.; Gomez, F.; Silván, Á.; de la Rosa, R.F.; Delgado, M.; Bascuñana, P.; Pozo, M.Á.; García-García, L. A Single High Dose of Flufenamic Acid in Rats Does Not Reduce the Damage Associated with the Rat Lithium-Pilocarpine Model of Status Epilepticus but Leads to Deleterious Outcomes. J Integr Neurosci 2023, 22, 75. [Google Scholar] [CrossRef] [PubMed]
- García-García, L.; Shiha, A.A.; Fernández de la Rosa, R.; Delgado, M.; Silván, Á.; Bascuñana, P.; Bankstahl, J.P.; Gomez, F.; Pozo, M.A. Metyrapone Prevents Brain Damage Induced by Status Epilepticus in the Rat Lithium-Pilocarpine Model. Neuropharmacology 2017, 123, 261–273. [Google Scholar] [CrossRef]
- Hernández-Martín, N.; Pozo-Cabanell, I.; Fernández de la Rosa, R.; García-García, L.; Gómez-Oliver, F.; Pozo, M.Á.; Brackhan, M.; Bascuñana, P. Preclinical PET Imaging in Epileptogenesis: Towards Identification of Biomarkers and Therapeutic Targets. EJNMMI Res 2025, 15. [Google Scholar] [CrossRef]
- García-García, L.; Gomez, F.; Delgado, M.; Fernández de la Rosa, R.; Pozo, M.Á. The Vasodilator Naftidrofuryl Attenuates Short-Term Brain Glucose Hypometabolism in the Lithium-Pilocarpine Rat Model of Status Epilepticus without Providing Neuroprotection. Eur J Pharmacol 2023, 939. [Google Scholar] [CrossRef]
- García-García, L.; Gómez-Oliver, F.; Fernández de la Rosa, R.; Pozo, M.Á. Dantrolene Paradoxically Exacerbates Short-Term Brain Glucose Hypometabolism, Hippocampal Damage and Neuroinflammation Induced by Status Epilepticus in the Rat Lithium-Pilocarpine Model. Eur J Pharmacol 2024, 985. [Google Scholar] [CrossRef]
- Zhang, L.; Guo, Y.; Hu, H.; Wang, J.; Liu, Z.; Gao, F. FDG-PET and NeuN-GFAP Immunohistochemistry of Hippocampus at Different Phases of the Pilocarpine Model of Temporal Lobe Epilepsy. Int J Med Sci 2015, 12, 288–294. [Google Scholar] [CrossRef]
- Rossi, A.R.; Angelo, M.F.; Villarreal, A.; Lukin, J.; Ramos, A.J. Gabapentin Administration Reduces Reactive Gliosis and Neurodegeneration after Pilocarpine-Induced Status Epilepticus. PLoS ONE 2013, 8. [Google Scholar] [CrossRef]
- Bascuñana, P.; Wolf, B.J.; Jahreis, I.; Brackhan, M.; García-García, L.; Ross, T.L.; Bengel, F.M.; Bankstahl, M.; Bankstahl, J.P. 99mTc-HMPAO SPECT Imaging Reveals Brain Hypoperfusion during Status Epilepticus. Metab Brain Dis 2021, 36, 2597–2602. [Google Scholar] [CrossRef]
- Sami Alkafaas, S.; Obeid, O.K.; Ali Radwan, M.; Elsalahaty, M.I.; Samy ElKaffas, S.; Hafez, W.; Janković, N.; Hessien, M. Novel Insight into Mitochondrial Dynamin-Related Protein-1 as a New Chemo-Sensitizing Target in Resistant Cancer Cells. Bioorg Chem 2024, 150, 107574. [Google Scholar] [CrossRef] [PubMed]
- Liu, X.; Song, L.; Yu, J.; Huang, F.; Li, Y.; Ma, C. Mdivi-1: A Promising Drug and Its Underlying Mechanisms in the Treatment of Neurodegenerative Diseases. Histol Histopathol 2022, 37, 505–512. [Google Scholar] [CrossRef] [PubMed]
- Chen, T.; Yang, J.; Zheng, Y.; Zhou, X.; Huang, H.; Zhang, H.; Xu, Z. ERK1/2 Regulates Epileptic Seizures by Modulating the DRP1-Mediated Mitochondrial Dynamic. Synapse 2024, 78. [Google Scholar] [CrossRef] [PubMed]
- Xie, N.; Wang, C.; Lian, Y.; Zhang, H.; Wu, C.; Zhang, Q. A Selective Inhibitor of Drp1, Mdivi-1, Protects against Cell Death of Hippocampal Neurons in Pilocarpine-Induced Seizures in Rats. Neurosci Lett 2013, 545, 64–68. [Google Scholar] [CrossRef]
- Luo, Z.; Wang, J.; Tang, S.; Zheng, Y.; Zhou, X.; Tian, F.; Xu, Z. Dynamic-Related Protein 1 Inhibitor Eases Epileptic Seizures and Can Regulate Equilibrative Nucleoside Transporter 1 Expression. BMC Neurol 2020, 20. [Google Scholar] [CrossRef]
- Qiu, X.; Cao, L.; Yang, X.; Zhao, X.; Liu, X.; Han, Y.; Xue, Y.; Jiang, H.; Chi, Z. Role of Mitochondrial Fission in Neuronal Injury in Pilocarpine-Induced Epileptic Rats. Neuroscience 2013, 245, 157–165. [Google Scholar] [CrossRef]
- Córdova-Dávalos, L.; Carrera-Calvo, D.; Solís-Navarrete, J.; Mercado-Gómez, O.F.; Arriaga-Ávila, V.; Agredano-Moreno, L.T.; Jiménez-García, L.F.; Guevara-Guzmán, R. Status Epilepticus Triggers Early Mitochondrial Fusion in the Rat Hippocampus in a Lithium-Pilocarpine Model. Epilepsy Res 2016, 123, 11–19. [Google Scholar] [CrossRef]
- Fang, Q.; Zheng, S.; Chen, Q.; Chen, L.; Yang, Y.; Wang, Y.; Zhang, H.; Chen, J. The Protective Effect of Inhibiting Mitochondrial Fission on the Juvenile Rat Brain Following PTZ Kindling through Inhibiting the BCL2L13/LC3 Mitophagy Pathway. Metab Brain Dis 2023, 38, 453–466. [Google Scholar] [CrossRef]
- Ruiz, A.; Alberdi, E.; Matute, C. Mitochondrial Division Inhibitor 1 (Mdivi-1) Protects Neurons against Excitotoxicity through the Modulation of Mitochondrial Function and Intracellular Ca2+ Signaling. Front Mol Neurosci 2018, 11. [Google Scholar] [CrossRef]
- Zhang, Y.; Rui, T.; Luo, C.; Li, Q. Mdivi-1 Alleviates Brain Damage and Synaptic Dysfunction after Intracerebral Hemorrhage in Mice. Exp Brain Res 2021, 239, 1581–1593. [Google Scholar] [CrossRef]
- Reddy, P.H.; Manczak, M.; Yin, X. Mitochondria-Division Inhibitor 1 Protects Against Amyloid-β Induced Mitochondrial Fragmentation and Synaptic Damage in Alzheimer’s Disease. Journal of Alzheimer’s Disease 2017, 58, 147–162. [Google Scholar] [CrossRef]
- Motori, E.; Puyal, J.; Toni, N.; Ghanem, A.; Angeloni, C.; Malaguti, M.; Cantelli-Forti, G.; Berninger, B.; Conzelmann, K.K.; Götz, M.; et al. Inflammation-Induced Alteration of Astrocyte Mitochondrial Dynamics Requires Autophagy for Mitochondrial Network Maintenance. Cell Metab 2013, 18, 844–859. [Google Scholar] [CrossRef]
- Joshi, A.U.; Mochly-Rosen, D. Mortal Engines: Mitochondrial Bioenergetics and Dysfunction in Neurodegenerative Diseases. Pharmacol Res 2018, 138, 2–15. [Google Scholar] [CrossRef] [PubMed]
- Bordt, E.A.; Clerc, P.; Roelofs, B.A.; Saladino, A.J.; Tretter, L.; Adam-Vizi, V.; Cherok, E.; Khalil, A.; Yadava, N.; Ge, S.X.; et al. The Putative Drp1 Inhibitor Mdivi-1 Is a Reversible Mitochondrial Complex I Inhibitor That Modulates Reactive Oxygen Species. Dev Cell 2017, 40, 583–594.e6. [Google Scholar] [CrossRef] [PubMed]
- Cassidy-Stone, A.; Chipuk, J.E.; Ingerman, E.; Song, C.; Yoo, C.; Kuwana, T.; Kurth, M.J.; Shaw, J.T.; Hinshaw, J.E.; Green, D.R.; et al. Chemical Inhibition of the Mitochondrial Division Dynamin Reveals Its Role in Bax/Bak-Dependent Mitochondrial Outer Membrane Permeabilization. Dev Cell 2008, 14, 193–204. [Google Scholar] [CrossRef] [PubMed]
- Lackner, L.L.; Nunnari, J. Small Molecule Inhibitors of Mitochondrial Division: Tools That Translate Basic Biological Research into Medicine. Chem Biol 2010, 17, 578–583. [Google Scholar] [CrossRef]
- Gómez-Oliver, F.; Fernández de la Rosa, R.; Brackhan, M.; Bascuñana, P.; Pozo, M.Á.; García-García, L. Seizures Triggered by Systemic Administration of 4-Aminopyridine in Rats Lead to Acute Brain Glucose Hypometabolism, as Assessed by [18F]FDG PET Neuroimaging. Int J Mol Sci 2024, 25. [Google Scholar] [CrossRef]
- Mirrione, M.M.; Schiffer, W.K.; Fowler, J.S.; Alexoff, D.L.; Dewey, S.L.; Tsirka, S.E. A Novel Approach for Imaging Brain–Behavior Relationships in Mice Reveals Unexpected Metabolic Patterns during Seizures in the Absence of Tissue Plasminogen Activator. Neuroimage 2007, 38, 34–42. [Google Scholar] [CrossRef]
- Jupp, B.; O’Brien, T.J. Application of Coregistration for Imaging of Animal Models of Epilepsy. Epilepsia 2007, 48, 82–89. [Google Scholar] [CrossRef]
- Prieto, E.; Collantes, M.; Delgado, M.; Juri, C.; García-García, L.; Molinet, F.; Fernández-Valle, M.E.; Pozo, M.A.; Gago, B.; Martí-Climent, J.M.; et al. Statistical Parametric Maps of 18F-FDG PET and 3-D Autoradiography in the Rat Brain: A Cross-Validation Study. Eur J Nucl Med Mol Imaging 2011, 38, 2228–2237. [Google Scholar] [CrossRef]
- Shiha, A.A.; de la Rosa, R.F.; Delgado, M.; Pozo, M.A.; García-García, L. Subacute Fluoxetine Reduces Signs of Hippocampal Damage Induced by a Single Convulsant Dose of 4-Aminopyridine in Rats. CNS Neurol Disord Drug Targets 2017, 16. [Google Scholar] [CrossRef] [PubMed]
- Gu, Q.; Schmued, L.C.; Sarkar, S.; Paule, M.G.; Raymick, B. One-Step Labeling of Degenerative Neurons in Unfixed Brain Tissue Samples Using Fluoro-Jade C. J Neurosci Methods 2012, 208, 40–43. [Google Scholar] [CrossRef] [PubMed]
- Pitkänen, A.; Engel, J. Past and Present Definitions of Epileptogenesis and Its Biomarkers. Neurotherapeutics 2014, 11, 231–241. [Google Scholar] [CrossRef] [PubMed]
- Goffin, K.; Paesschen, W.V.; Dupont, P.; Laere, K. Van Longitudinal MicroPET Imaging of Brain Glucose Metabolism in Rat Lithium-Pilocarpine Model of Epilepsy. Exp Neurol 2009, 217, 205–209. [Google Scholar] [CrossRef]
- Guo, Y.; Gao, F.; Wang, S.; Ding, Y.; Zhang, H.; Wang, J.; Ding, M.P. In Vivo Mapping of Temporospatial Changes in Glucose Utilization in Rat Brain during Epileptogenesis: An 18F-Fluorodeoxyglucose-Small Animal Positron Emission Tomography Study. Neuroscience 2009, 162, 972–979. [Google Scholar] [CrossRef]
- Shapiro, L.A.; Wang, L.; Ribak, C.E. Rapid Astrocyte and Microglial Activation Following Pilocarpine-Induced Seizures in Rats. Epilepsia 2008, 49, 33–41. [Google Scholar] [CrossRef]
- Gu, X.; Chen, W.; Li, Z.; Wang, X.; Su, Q.; Zhou, F. Drp1 Mitochondrial Fission in Astrocyte Modulates Behavior and Neuroinflammation during Morphine Addiction. Journal of Neuroinflammation 2025, 22. [Google Scholar] [CrossRef]
- Liu, Y.J.; McIntyre, R.L.; Janssens, G.E.; Houtkooper, R.H. Mitochondrial Fission and Fusion: A Dynamic Role in Aging and Potential Target for Age-Related Disease. Mech Ageing Dev 2020, 186, 111212. [Google Scholar] [CrossRef]
- Qian, W.; Wang, J.; Roginskaya, V.; McDermott, L.A.; Edwards, R.P.; Stolz, D.B.; Llambi, F.; Green, D.R.; Van Houten, B. Novel Combination of Mitochondrial Division Inhibitor 1 (Mdivi-1) and Platinum Agents Produces Synergistic pro-Apoptotic Effect in Drug Resistant Tumor Cells. Oncotarget 2014, 5, 4180–4194. [Google Scholar] [CrossRef]
- Smith, G.; Gallo, G. To Mdivi-1 or Not to Mdivi-1: Is That the Question? Dev Neurobiol 2017, 77, 1260–1268. [Google Scholar] [CrossRef]
- Seo, J.; Jung, S.; Lee, S.Y.; Yang, H.; Kim, B.S.; Choi, J.; Bang, M.; Shin, H.S.; Jeon, D. Early Deficits in Social Behavior and Cortical Rhythms in Pilocarpine-Induced Mouse Model of Temporal Lobe Epilepsy. Exp Neurol 2013, 241, 38–44. [Google Scholar] [CrossRef]
- Assenza, G.; Lanzone, J.; Insola, A.; Amatori, G.; Ricci, L.; Tombini, M.; Di Lazzaro, V. Thalamo-Cortical Network Dysfunction in Temporal Lobe Epilepsy. Clinical Neurophysiology 2020, 131, 548–554. [Google Scholar] [CrossRef] [PubMed]
- Marx, N.; Ritter, N.; Disse, P.; Seebohm, G.; Busch, K.B. Detailed Analysis of Mdivi-1 Effects on Complex I and Respiratory Supercomplex Assembly. Sci Rep 2024, 14. [Google Scholar] [CrossRef] [PubMed]
- Kim, H.; Lee, J.Y.; Park, K.J.; Kim, W.H.; Roh, G.S. A Mitochondrial Division Inhibitor, Mdivi-1, Inhibits Mitochondrial Fragmentation and Attenuates Kainic Acid-Induced Hippocampal Cell Death. BMC Neurosci 2016, 17. [Google Scholar] [CrossRef] [PubMed]
- Nhu, N.T.; Li, Q.; Liu, Y.; Xu, J.; Xiao, S.Y.; Lee, S. Da Effects of Mdivi-1 on Neural Mitochondrial Dysfunction and Mitochondria-Mediated Apoptosis in Ischemia-Reperfusion Injury After Stroke: A Systematic Review of Preclinical Studies. Front Mol Neurosci 2021, 14. [Google Scholar] [CrossRef]
- Zhou, K.; Yang, H.Y.; Tang, P.Y.; Liu, W.; Luo, Y.J.; Lv, B.; Yin, J.; Jiang, T.; Chen, J.; Cai, W.H.; et al. Mitochondrial Division Inhibitor 1 Protects Cortical Neurons from Excitotoxicity: A Mechanistic Pathway. Neural Regen Res 2018, 13, 1552–1560. [Google Scholar] [CrossRef]
- Wu, Q.; Gao, C.; Wang, H.; Zhang, X.; Li, Q.; Gu, Z.; Shi, X.; Cui, Y.; Wang, T.; Chen, X.; et al. Mdivi-1 Alleviates Blood-Brain Barrier Disruption and Cell Death in Experimental Traumatic Brain Injury by Mitigating Autophagy Dysfunction and Mitophagy Activation. International Journal of Biochemistry and Cell Biology 2018, 94, 44–55. [Google Scholar] [CrossRef]
- Song, Y.; Li, T.; Liu, Z.; Xu, Z.; Zhang, Z.; Chi, L.; Liu, Y. Inhibition of Drp1 after Traumatic Brain Injury Provides Brain Protection and Improves Behavioral Performance in Rats. Chem Biol Interact 2019, 304, 173–185. [Google Scholar] [CrossRef]
- Bascuñana, P.; Javela, J.; Delgado, M.; Fernández de la Rosa, R.; Shiha, A.A.; García-García, L.; Pozo, M.Á. [18F]FDG PET Neuroimaging Predicts Pentylenetetrazole (PTZ) Kindling Outcome in Rats. Mol Imaging Biol 2016, 18, 733–740. [Google Scholar] [CrossRef]
- Devinsky, O.; Vezzani, A.; Najjar, S.; De Lanerolle, N.C.; Rogawski, M.A. Glia and Epilepsy: Excitability and Inflammation. Trends Neurosci 2013, 36, 174–184. [Google Scholar] [CrossRef]
- Vezzani, A.; Aronica, E.; Mazarati, A.; Pittman, Q.J. Epilepsy and Brain Inflammation. Exp Neurol 2013, 244, 11–21. [Google Scholar] [CrossRef] [PubMed]
- Vezzani, A.; French, J.; Bartfai, T.; Baram, T.Z. The Role of Inflammation in Epilepsy. Nat Rev Neurol 2011, 7, 31–40. [Google Scholar] [CrossRef]
- Li, G.; Cao, Y.; Shen, F.; Wang, Y.; Bai, L.; Guo, W.; Bi, Y.; Lv, G.; Fan, Z. Mdivi-1. Inhibits Astrocyte Activation and Astroglial Scar Formation and Enhances Axonal Regeneration after Spinal Cord Injury in Rats. Front Cell Neurosci 2016, 10, 216062. [Google Scholar] [CrossRef] [PubMed]
- Sofroniew, M.V. Molecular Dissection of Reactive Astrogliosis and Glial Scar Formation. Trends Neurosci 2009, 32, 638–647. [Google Scholar] [CrossRef] [PubMed]
- Burda, J.E.; Sofroniew, M.V. Reactive Gliosis and the Multicellular Response to CNS Damage and Disease. Neuron 2014, 81, 229–248. [Google Scholar] [CrossRef]
- Brackhan, M.; Bascun ana, P.; Postema, J.M.; Ross, T.L.; Bengel, F.M.; Bankstahl, M.; Bankstahl, J.P. Serial Quantitative TSPO-Targeted PET Reveals Peak Microglial Activation up to 2 Weeks after an Epileptogenic Brain Insult. Journal of Nuclear Medicine 2016, 57, 1302–1308. [Google Scholar] [CrossRef]
- Escartin, C.; Galea, E.; Lakatos, A.; O’Callaghan, J.P.; Petzold, G.C.; Serrano-Pozo, A.; Steinhäuser, C.; Volterra, A.; Carmignoto, G.; Agarwal, A.; et al. Reactive Astrocyte Nomenclature, Definitions, and Future Directions. Nat Neurosci 2021, 24, 312–325. [Google Scholar] [CrossRef]
- Liddelow, S.A.; Guttenplan, K.A.; Clarke, L.E.; Bennett, F.C.; Bohlen, C.J.; Schirmer, L.; Bennett, M.L.; Münch, A.E.; Chung, W.S.; Peterson, T.C.; et al. Neurotoxic Reactive Astrocytes Are Induced by Activated Microglia. Nature 2017, 541, 481–487. [Google Scholar] [CrossRef]
- Liddelow, S.A.; Barres, B.A. Reactive Astrocytes: Production, Function, and Therapeutic Potential. Immunity 2017, 46, 957–967. [Google Scholar] [CrossRef]
- Akin, D.; Ravizza, T.; Maroso, M.; Carcak, N.; Eryigit, T.; Vanzulli, I.; Aker, R.G.; Vezzani, A.; Onat, F.Y. IL-1β Is Induced in Reactive Astrocytes in the Somatosensory Cortex of Rats with Genetic Absence Epilepsy at the Onset of Spike-and-Wave Discharges, and Contributes to Their Occurrence. Neurobiol Dis 2011, 44, 259–269. [Google Scholar] [CrossRef]
- Binder, D.K.; Steinhäuser, C. Functional Changes in Astroglial Cells in Epilepsy. Glia 2006, 54, 358–368. [Google Scholar] [CrossRef] [PubMed]
- Wetherington, J.; Serrano, G.; Dingledine, R. Astrocytes in the Epileptic Brain. Neuron 2008, 58, 168–178. [Google Scholar] [CrossRef]
- Avignone, E.; Ulmann, L.; Levavasseur, F.; Rassendren, F.; Audinat, E. Status Epilepticus Induces a Particular Microglial Activation State Characterized by Enhanced Purinergic Signaling. Journal of Neuroscience 2008, 28, 9133–9144. [Google Scholar] [CrossRef] [PubMed]
- Eyo, U.B.; Murugan, M.; Wu, L.J. Microglia–Neuron Communication in Epilepsy. Glia 2017, 65, 5–18. [Google Scholar] [CrossRef] [PubMed]
- Pernhorst, K.; Herms, S.; Hoffmann, P.; Cichon, S.; Schulz, H.; Sander, T.; Schoch, S.; Becker, A.J.; Grote, A. TLR4, ATF-3 and IL8 Inflammation Mediator Expression Correlates with Seizure Frequency in Human Epileptic Brain Tissue. Seizure 2013, 22, 675–678. [Google Scholar] [CrossRef]
- Wei, Y.; Chen, T.; Bosco, D.B.; Xie, M.; Zheng, J.; Dheer, A.; Ying, Y.; Wu, Q.; Lennon, V.A.; Wu, L.J. The Complement C3-C3aR Pathway Mediates Microglia–Astrocyte Interaction Following Status Epilepticus. Glia 2021, 69, 1155–1169. [Google Scholar] [CrossRef]
- Henning, L.; Antony, H.; Breuer, A.; Müller, J.; Seifert, G.; Audinat, E.; Singh, P.; Brosseron, F.; Heneka, M.T.; Steinhäuser, C.; et al. Reactive Microglia Are the Major Source of Tumor Necrosis Factor Alpha and Contribute to Astrocyte Dysfunction and Acute Seizures in Experimental Temporal Lobe Epilepsy. Glia 2023, 71, 168–186. [Google Scholar] [CrossRef]
- Zattoni, M.; Mura, M.L.; Deprez, F.; Schwendener, R.A.; Engelhardt, B.; Frei, K.; Fritschy, J.M. Brain Infiltration of Leukocytes Contributes to the Pathophysiology of Temporal Lobe Epilepsy. Journal of Neuroscience 2011, 31, 4037–4050. [Google Scholar] [CrossRef]
- Hernández-Martín, N.; Martínez, M.G.; Bascuñana, P.; Fernández de la Rosa, R.; García-García, L.; Gómez, F.; Solas, M.; Martín, E.D.; Pozo, M.A. Astrocytic Ca2+ Activation by Chemogenetics Mitigates the Effect of Kainic Acid-Induced Excitotoxicity on the Hippocampus. Glia 2024, 72, 2217–2230. [Google Scholar] [CrossRef]
- Thergarajan, P.; Hudson, M.R.; Carmichael, I.; Clasadonte, J.; Dedeurwaerdere, S.; O’Brien, T.J.; Jones, N.C.; Ali, I. Characterising Seizure Development, Behavioural Comorbidities and Neuroinflammation in a Self-Sustained Electrical Status Epilepticus Model of Mesial Temporal Lobe Epilepsy in C57BL/6J Mice. Neurobiol Dis 2022, 168. [Google Scholar] [CrossRef]
- Jupp, B.; Williams, J.; Binns, D.; Hicks, R.J.; Cardamone, L.; Jones, N.; Rees, S.; O’Brien, T.J. Hypometabolism Precedes Limbic Atrophy and Spontaneous Recurrent Seizures in a Rat Model of TLE. Epilepsia 2012, 53, 1233–1244. [Google Scholar] [CrossRef]
Figure 1.
Schematic representation depicting the experimental design and procedures.
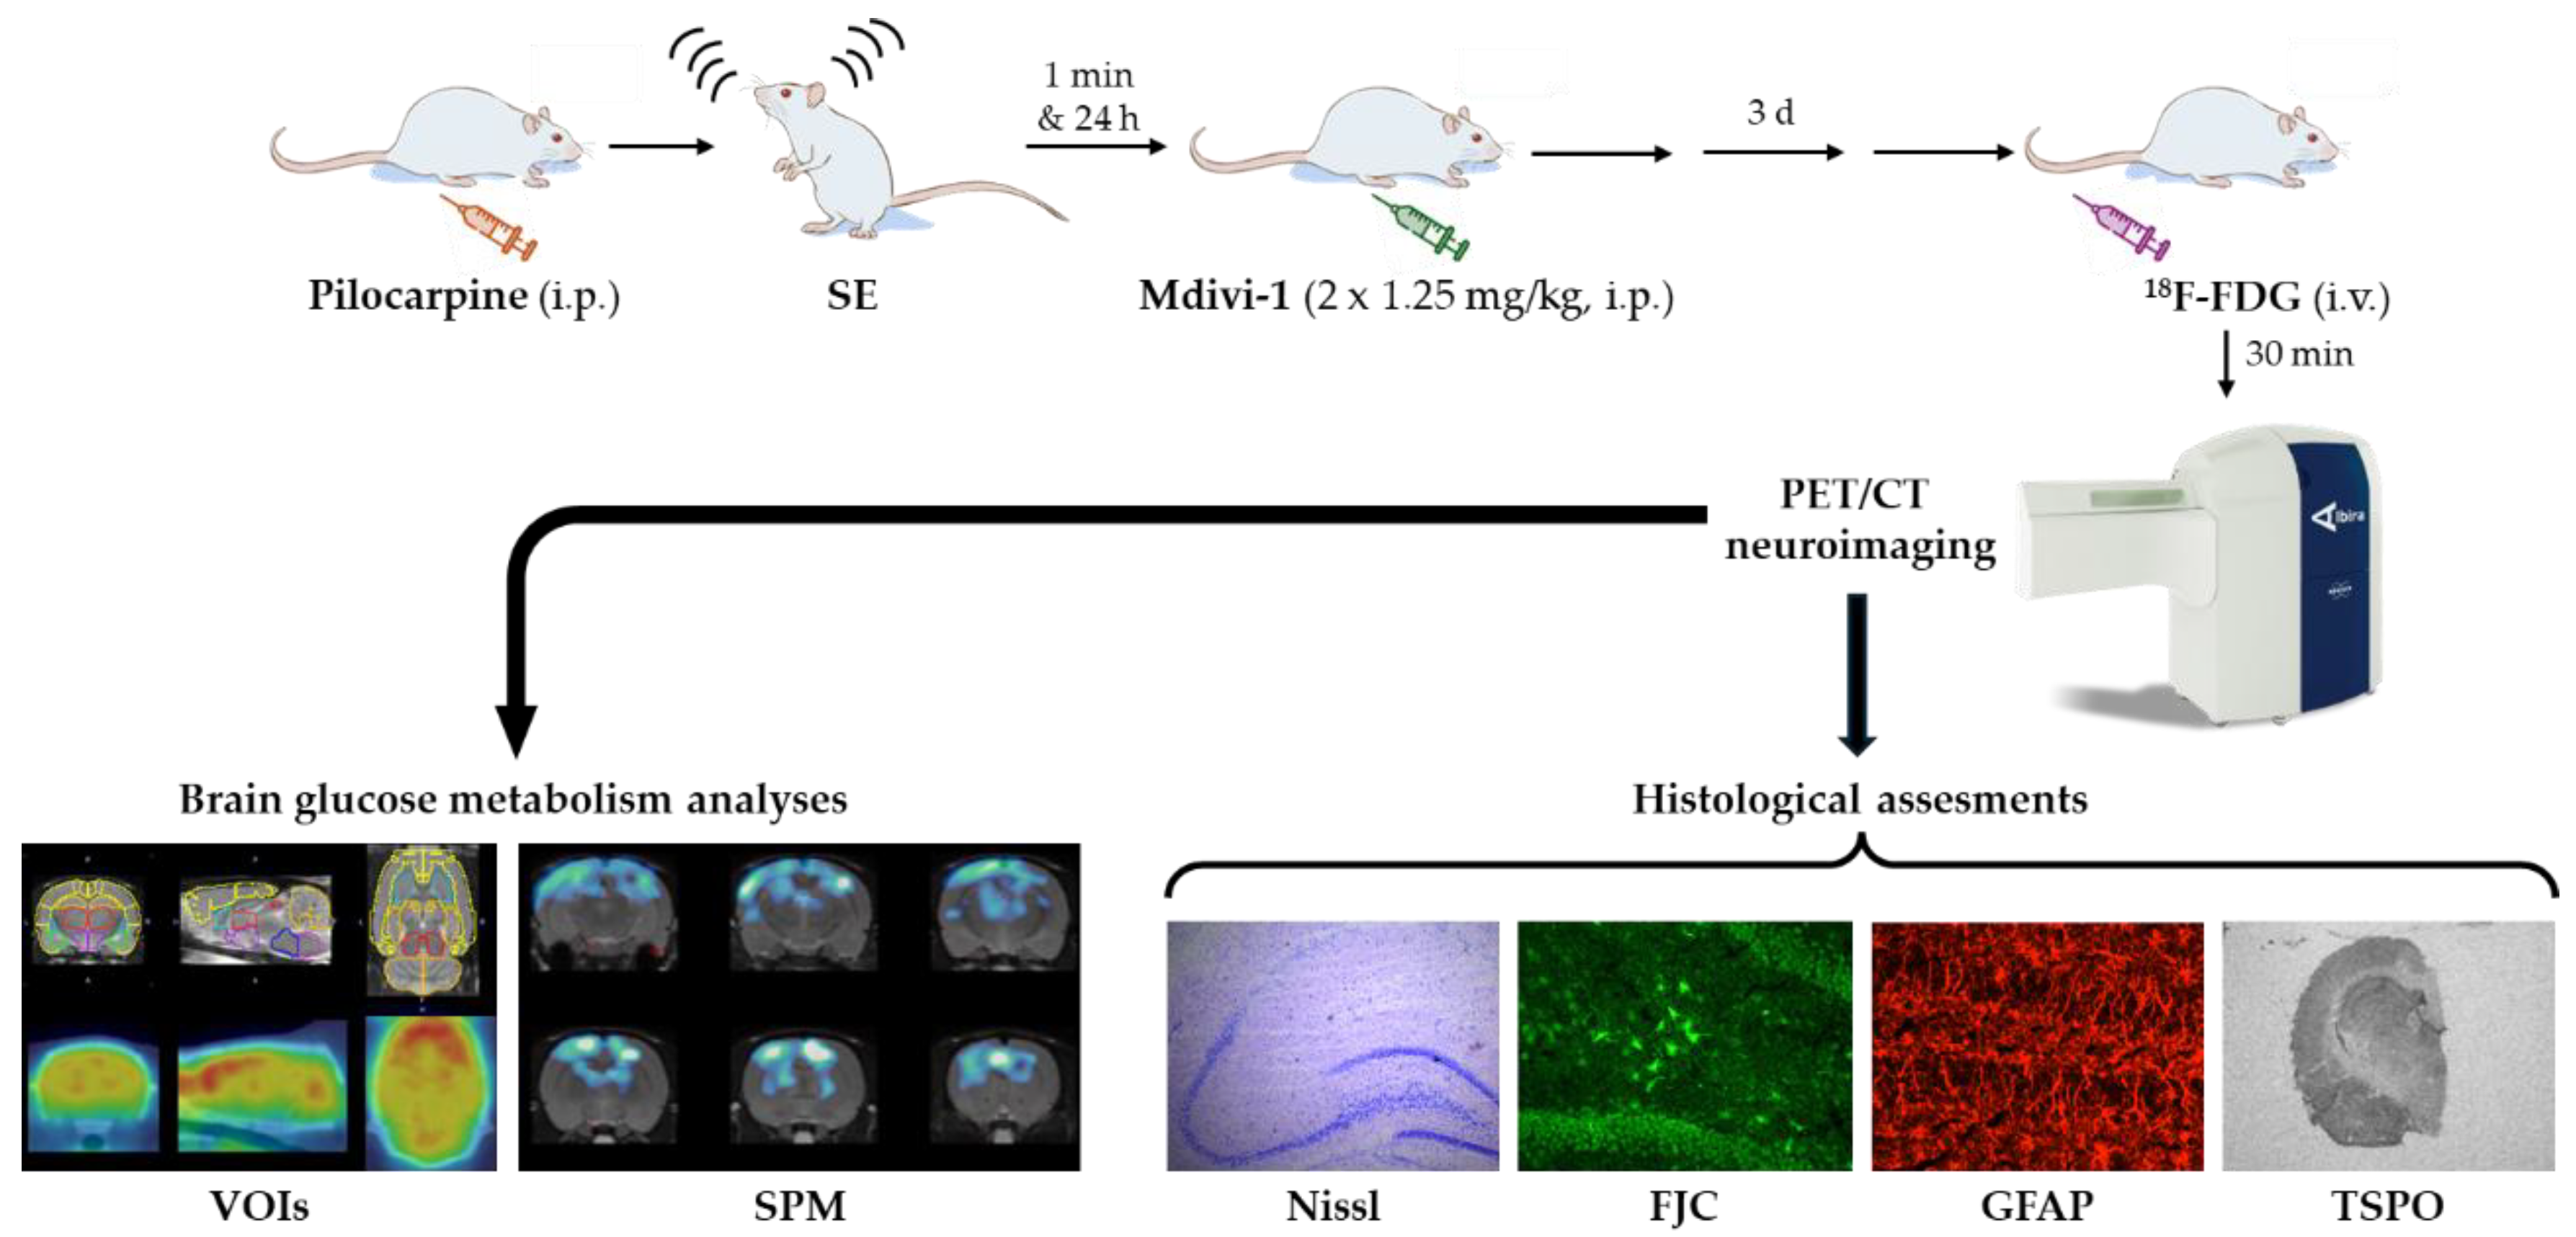
Figure 2.
Mdivi-1 administrations 1 min and 24h after SE did not modify the BW loss induced by lithium-pilocarpine. Cumulative BW changes throughout the experimental period ranging from the day of LiCl administration (day -1) to the day of sacrifice (day 3) are depicted. BW changes were calculated as a percentage of initial BW (day -1). Shaded area reflects the 12h fasting period before [18F]FDG PET/CT procedures. Data are shown as mean ± SEM (n = 7-10 rats/group, rats that survived the experimental procedure). Significant differences are depicted as: *p<0.05 different from PILO+VEH, two-way ANOVA followed by post-hoc Tukey tests.
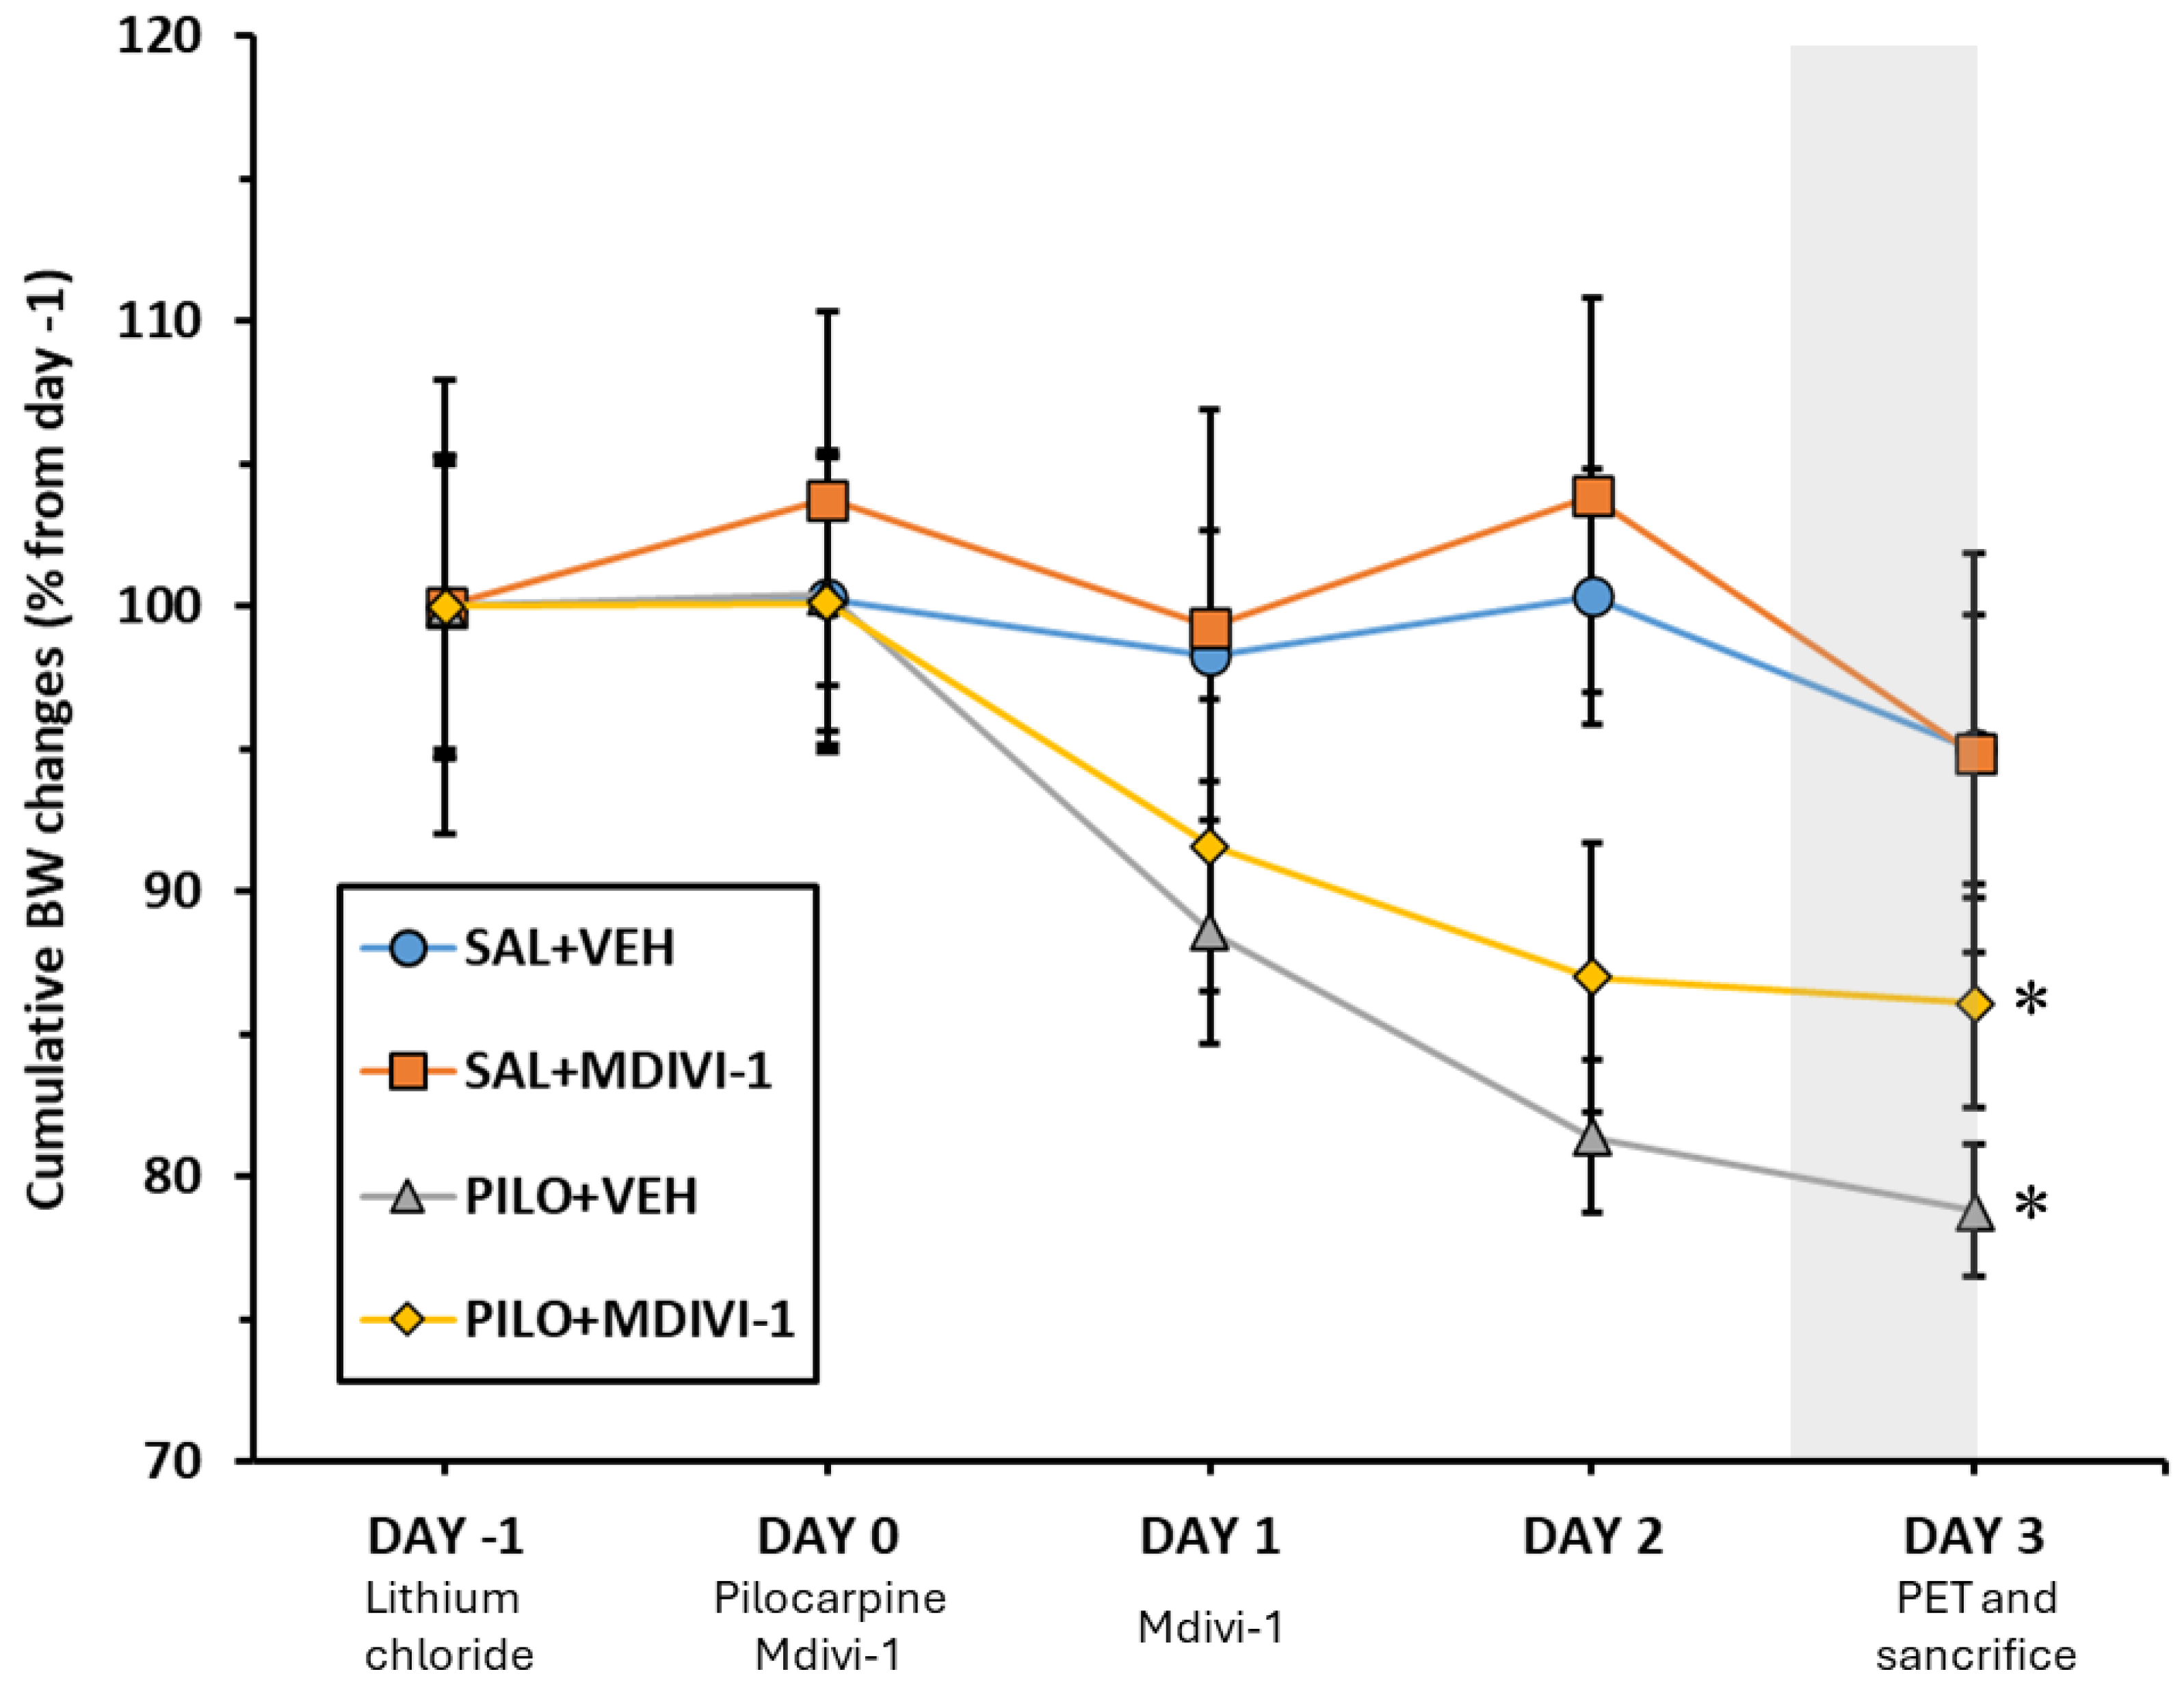
Figure 3.
Three days after SE induced by lithium-pilocarpine an acute brain hypometabolism was significant in all areas measured except in hypothalamus, cerebellum and pons. Mdivi-1 had no effects. (A). Representative images in coronal, sagittal and trans-axial views showing [18F]FDG uptake of the four experimental groups. First row: representative CT images; Second row: [18F]FDG PET images; Third row: [18F]FDG PET/CT fused images. (B) [18F]FDG uptake by the different brain is shown as SUV units (mean ± SEM, n=7-10 rats/group); *p<0.05 vs SAL+VEH; #p<0.05 vs SAL+MDIVI-1; ##p<0.001 vs SAL+MDIVI-1.
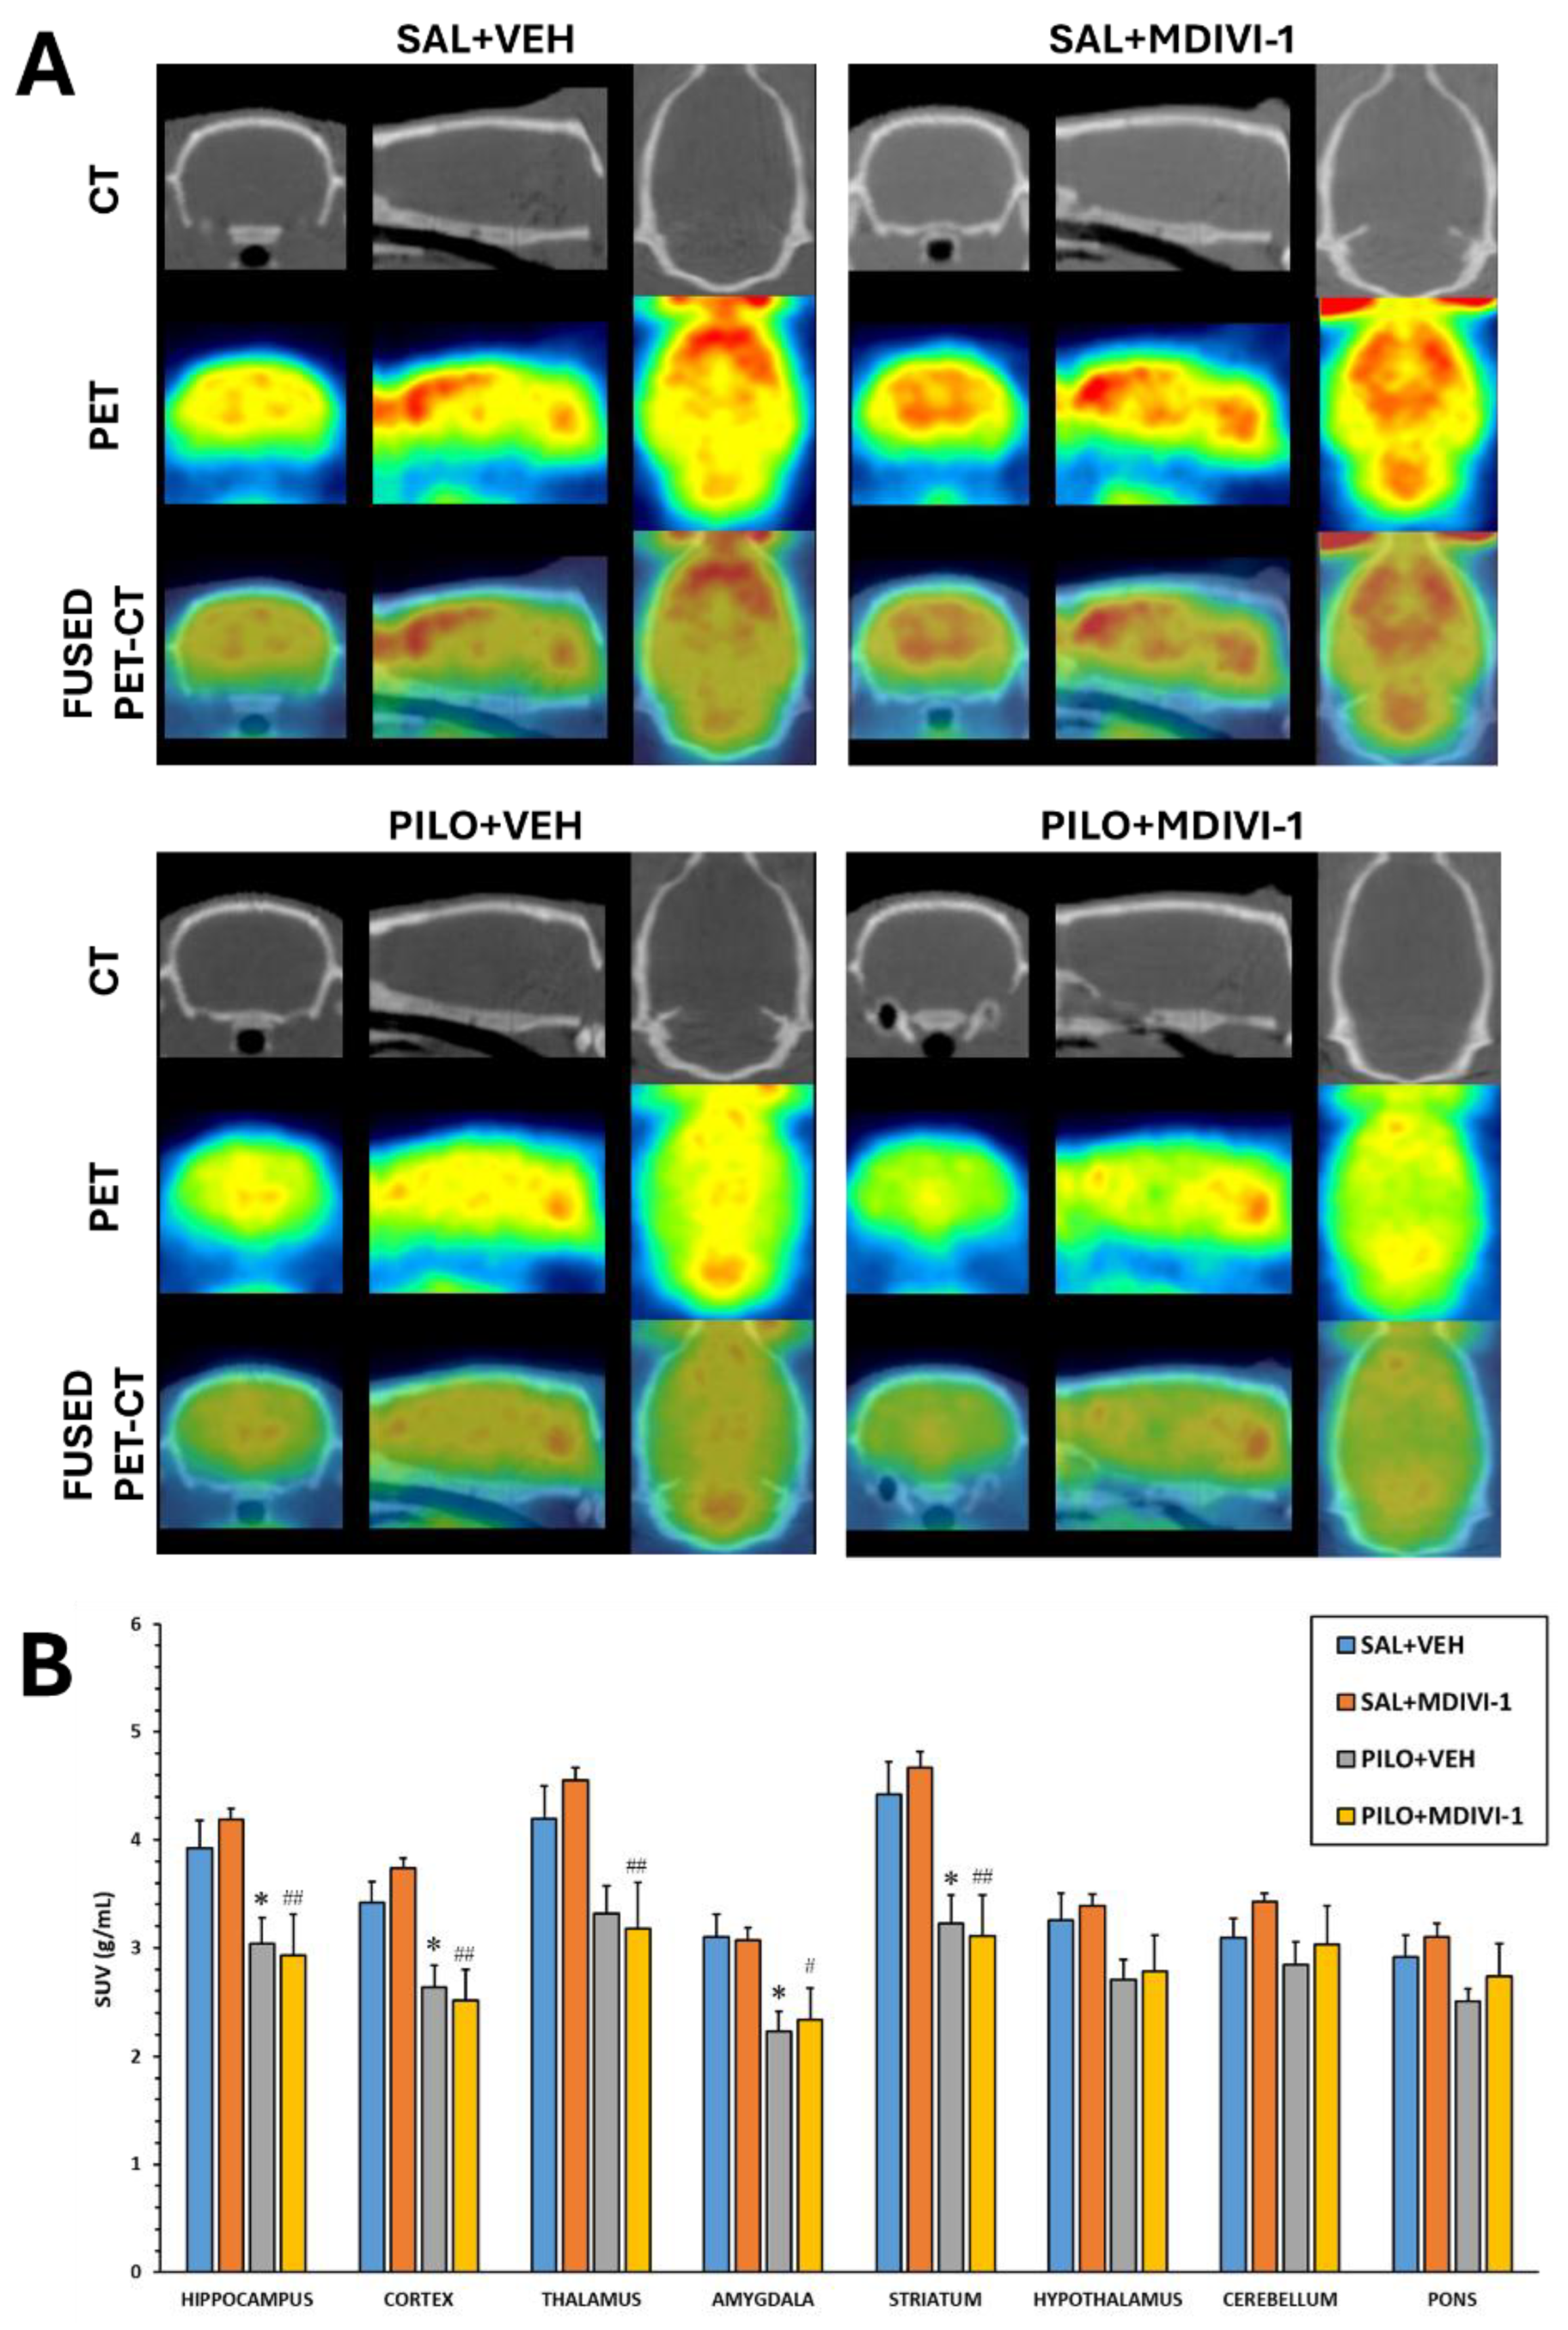
Figure 4.
SPM images obtained after normalization to whole brain [18F]FDG uptake comparing the PILO+VEH group with the PILO+MDIVI-1 group. The corresponding images are shown overlaid on a rat T2-MRI template in coronal view from the striatum (bottom right) to the cerebellum (upper left). As observed in SPM images, Mdivi-1 treatment significantly enhanced the hypometabolism in some hippocampal and cortical areas. Color scale: color code bar for clusters showing statistically significant hypometabolism. Results are shown at p<0.05 (uncorrected for multiple comparisons).
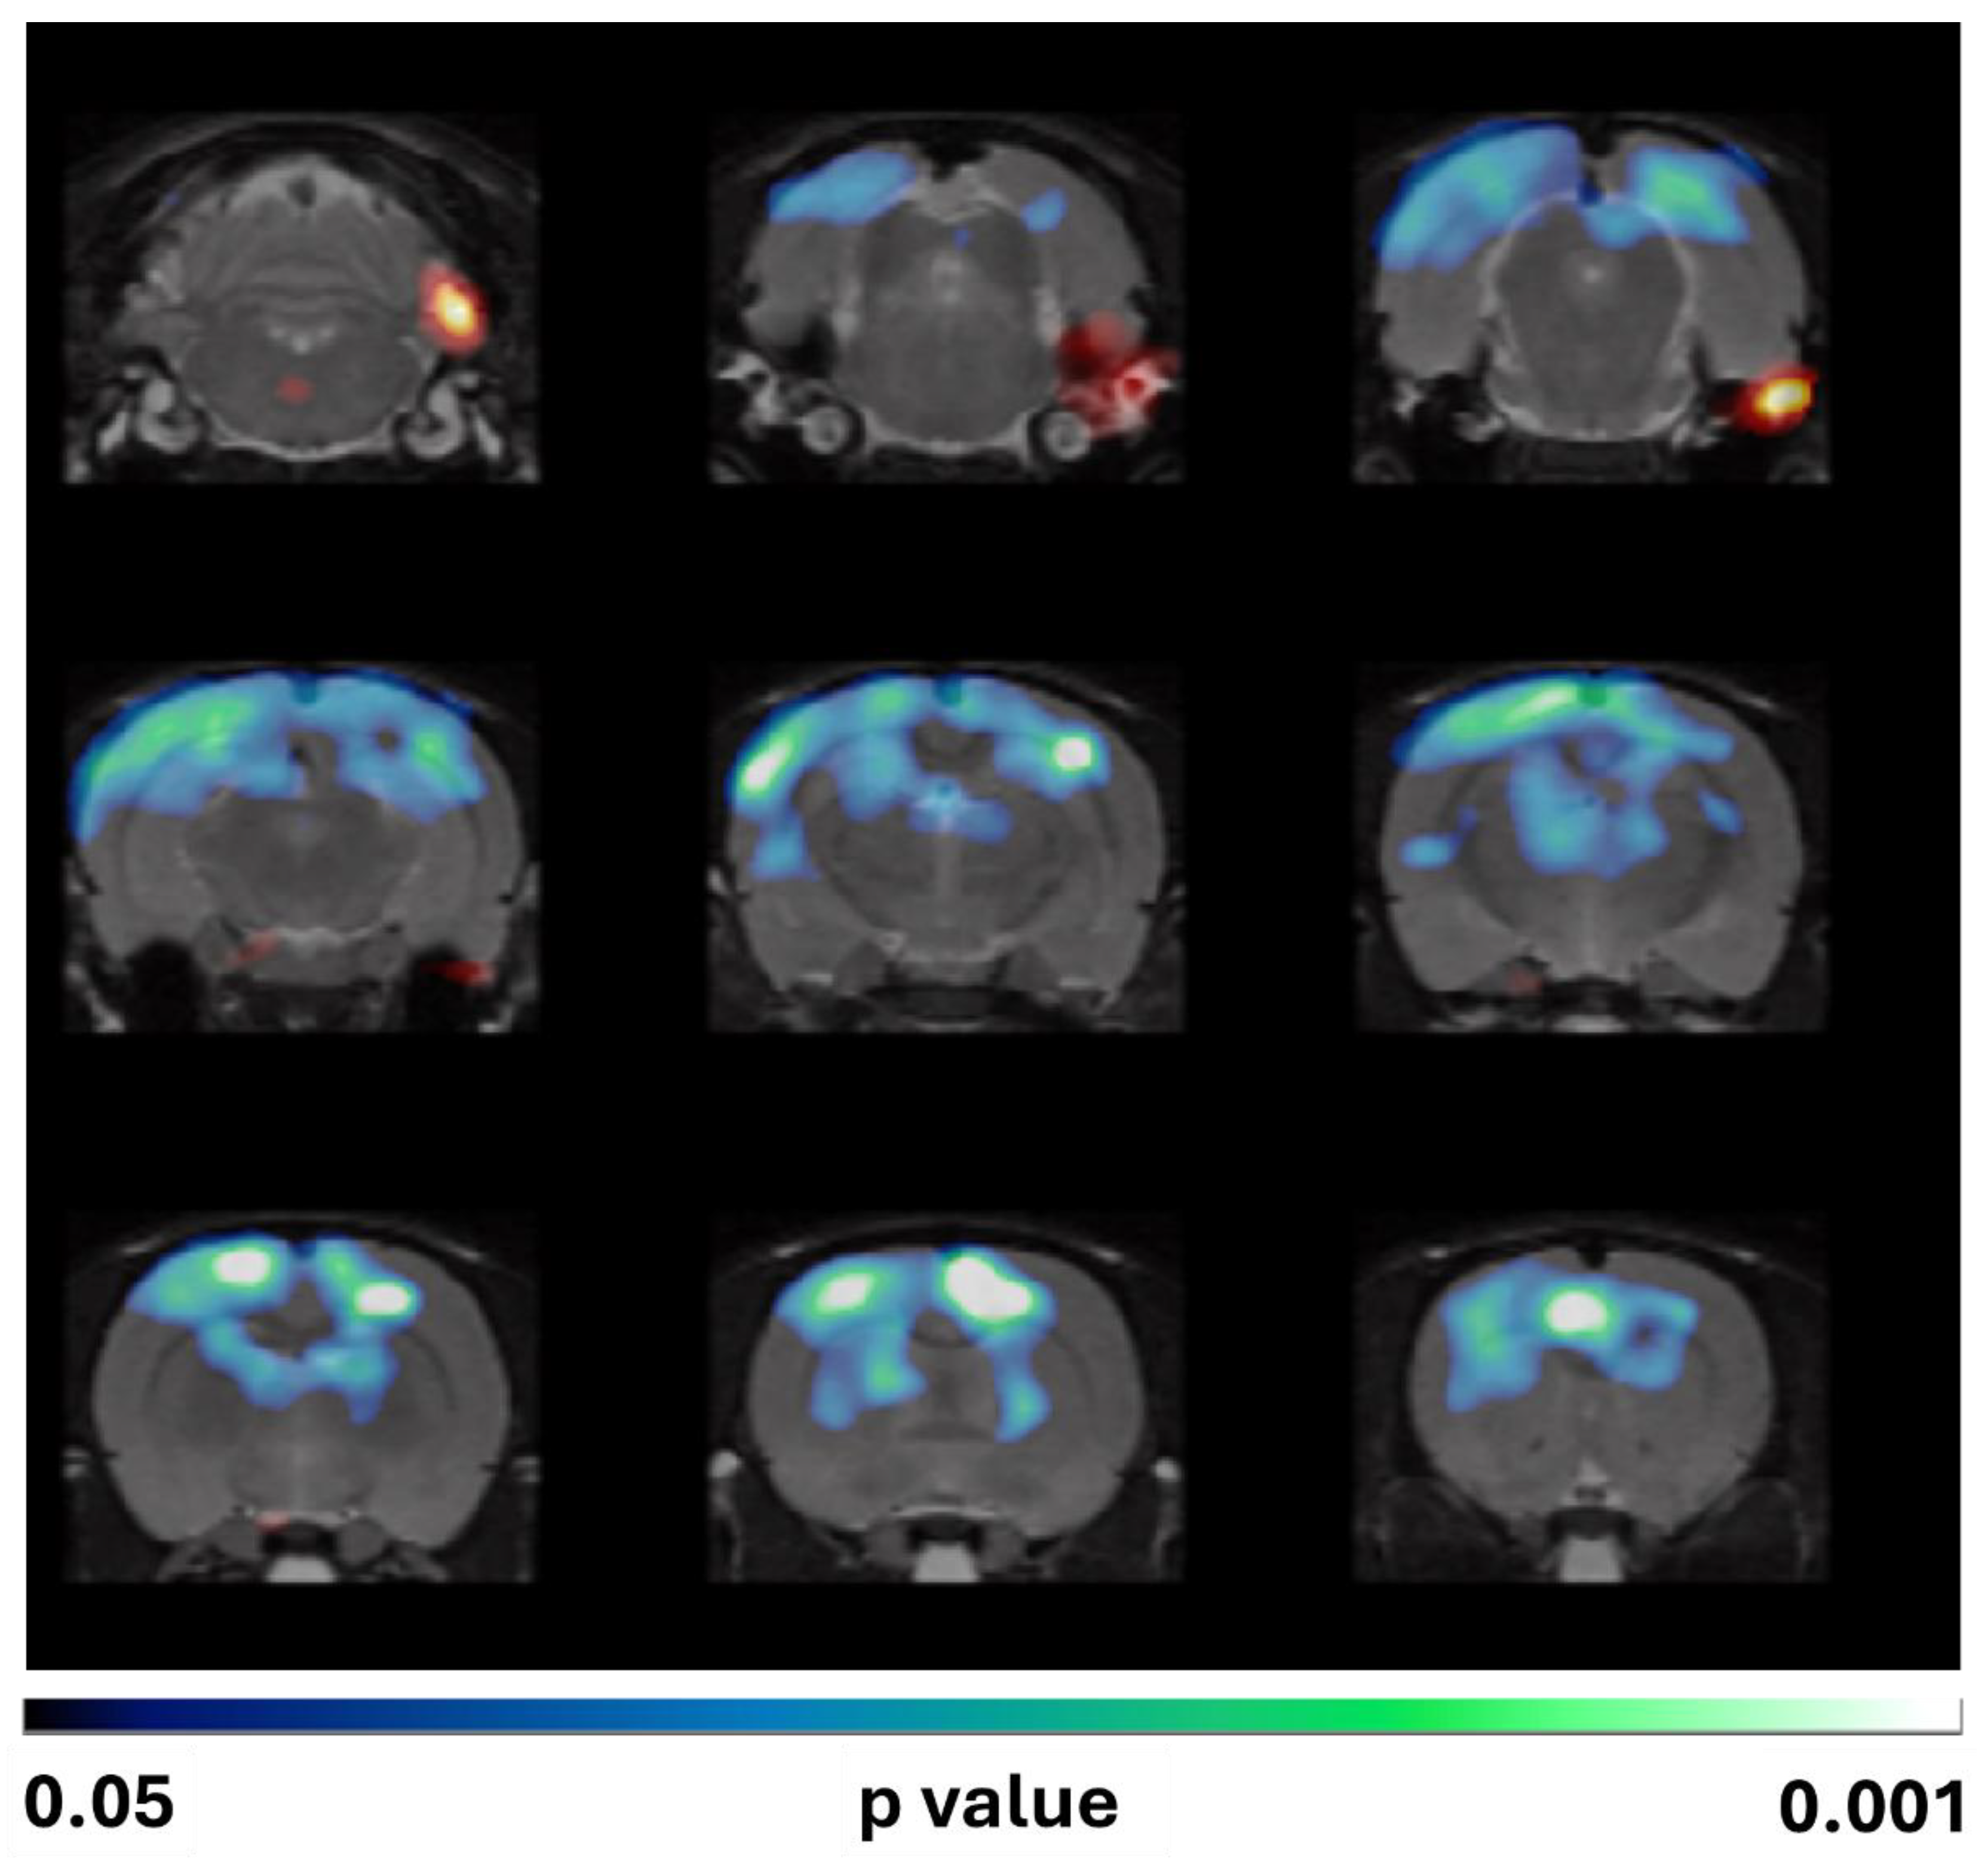
Figure 5.
Representative Nissl (cresyl violet) staining micrographs illustrating the damage induced by SE induced by lithium-pilocarpine on the anterior hippocampal areas CA1, CA3 and hilus 3 days after the insult. As qualitatively observed the hippocampal integrity disruption was not affected by Mdivi-1 administration. Bar scale: 500 µm.
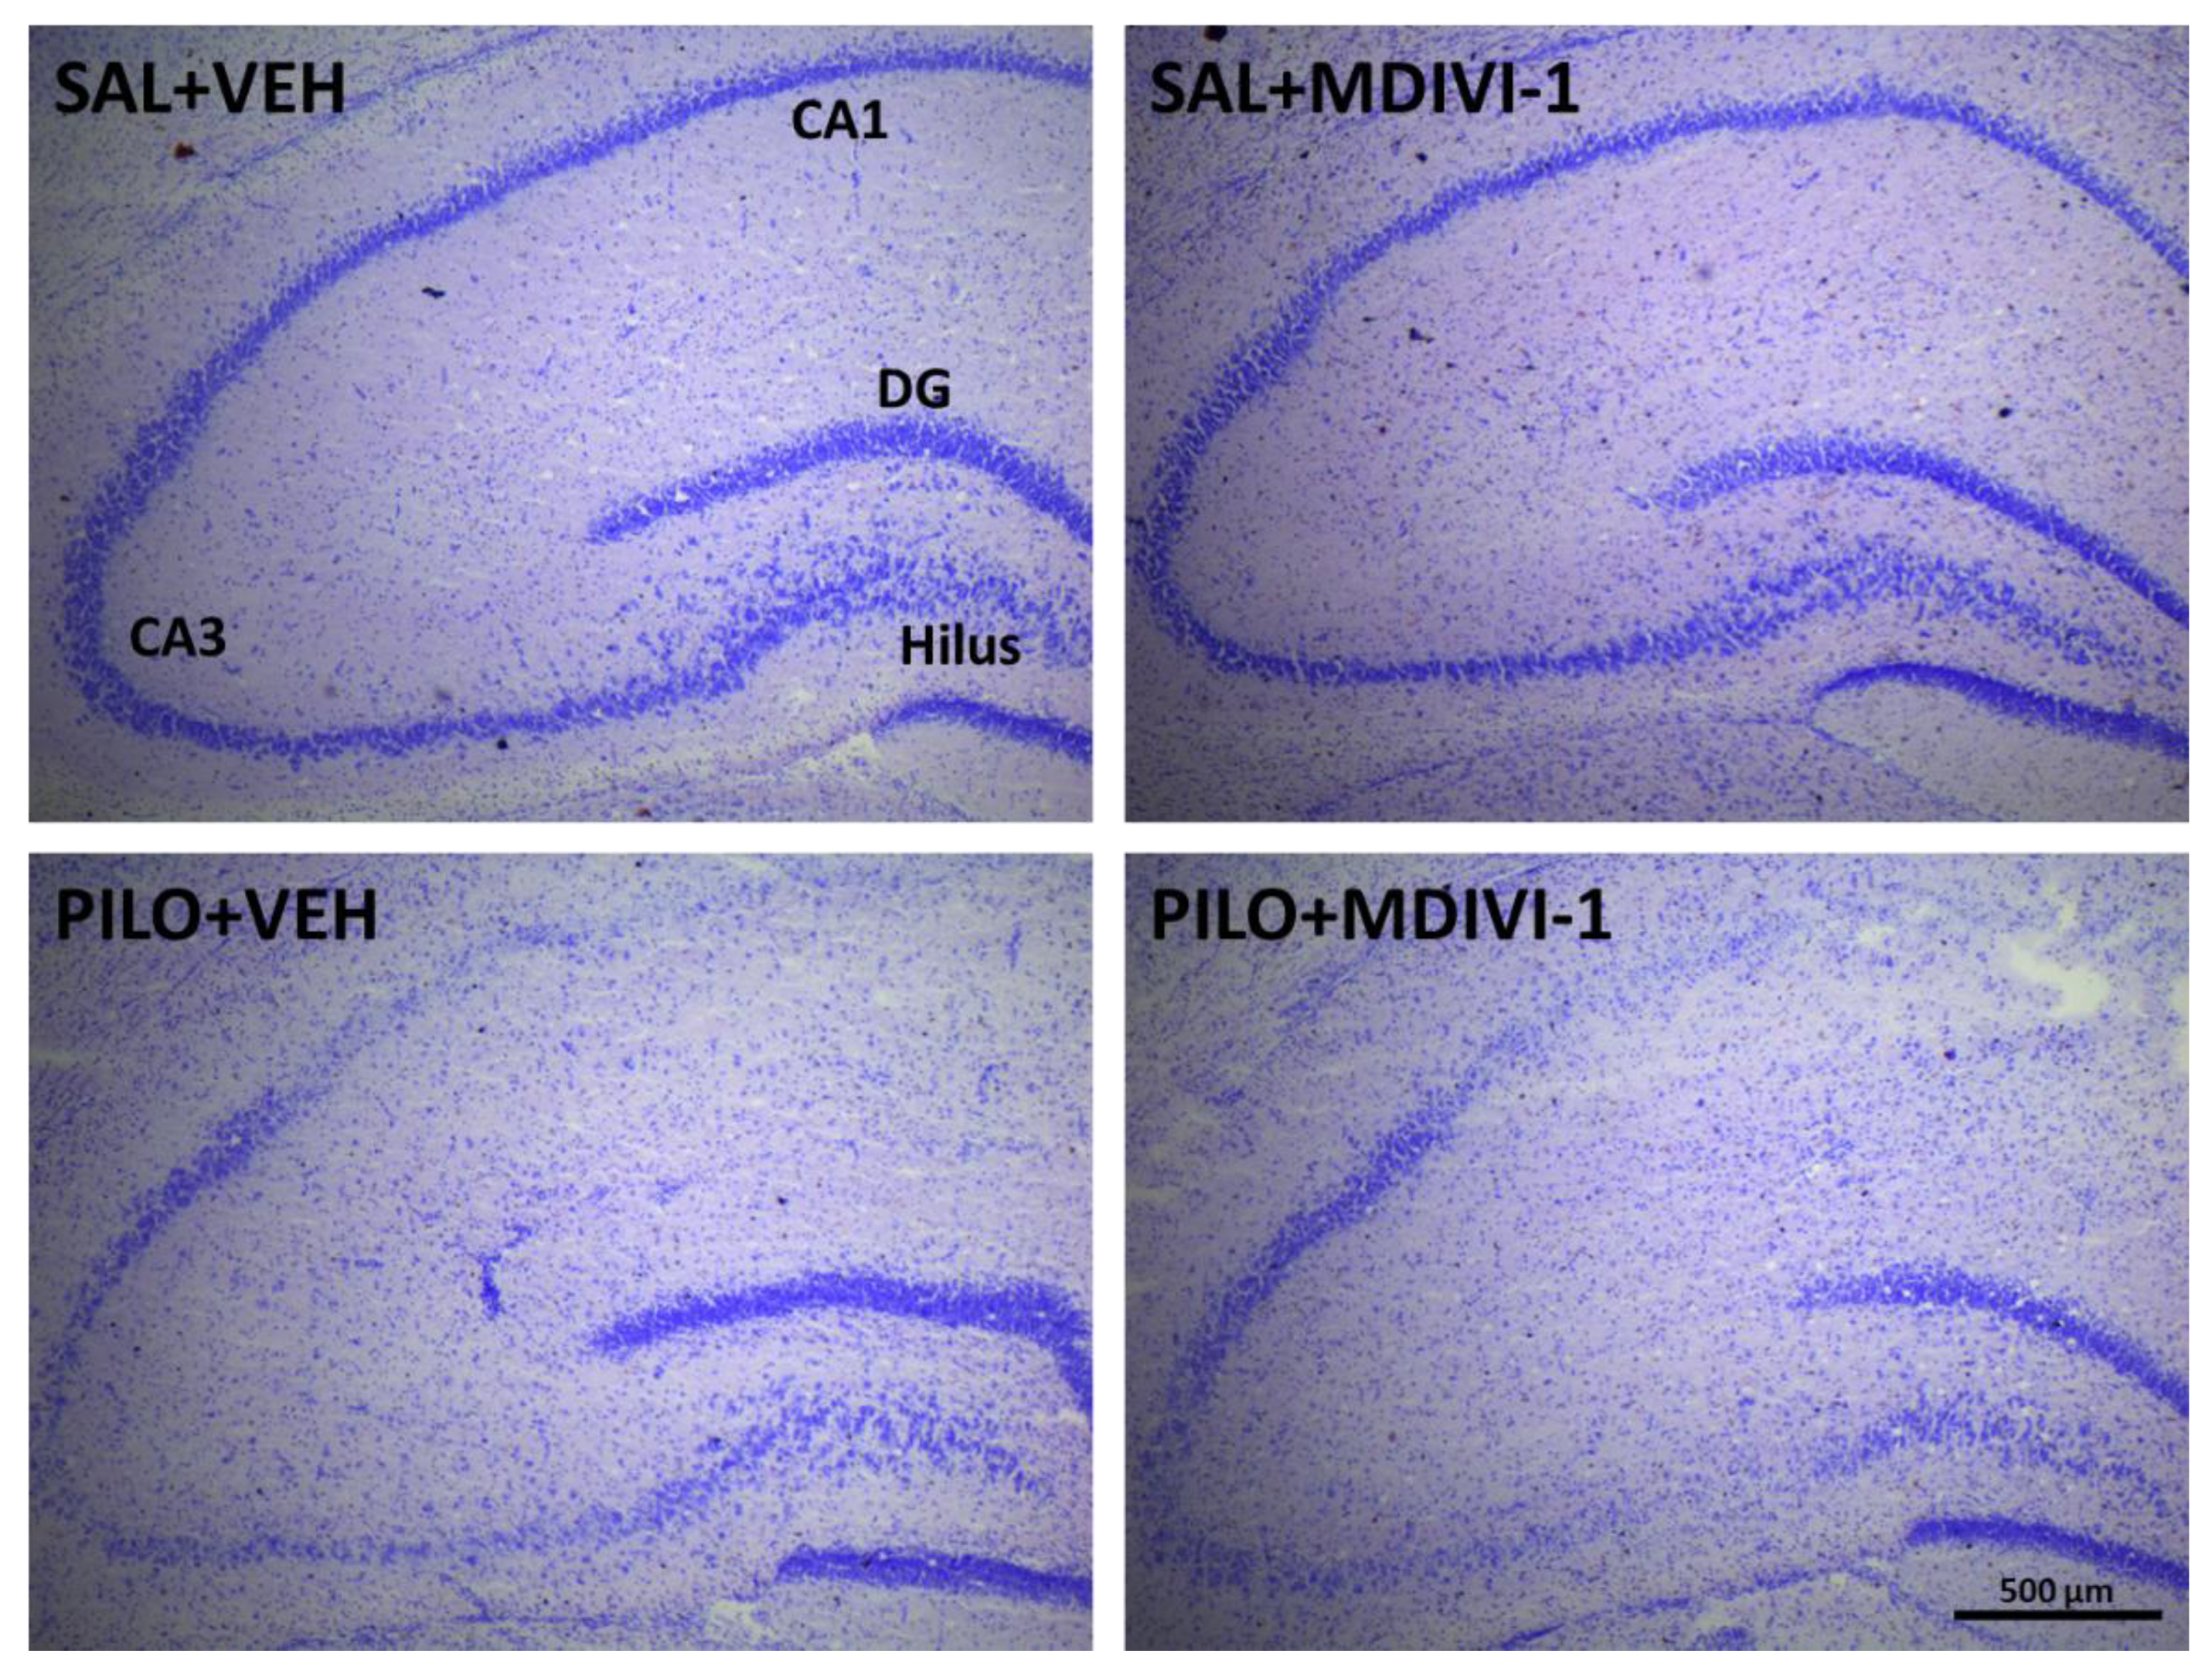
Figure 6.
Hippocampal neurodegeneration 3 days after SE was not affected by Mdivi-1. (A) Representative images (10x) at the level of the CA1 (top row), CA3 (mid row) and dentate gyrus/hilus (bottom row) of the 4 experimental groups. Bar scale: 200 µm. (B) Magnified images (20x) showing FJC-labeled neurons induced by pilocarpine in the 3 hippocampal subregions. Bar scale: 100 µm. (C) Bar plot corresponding to the number of neurodegenerating neurons in the hippocampus of SE-insulted rats (mean ± SEM; n=7-10 rats/group; rats that survived the experimental procedure). No significant differences between PILO+VEH and PILO+MDIVI-1 were found.
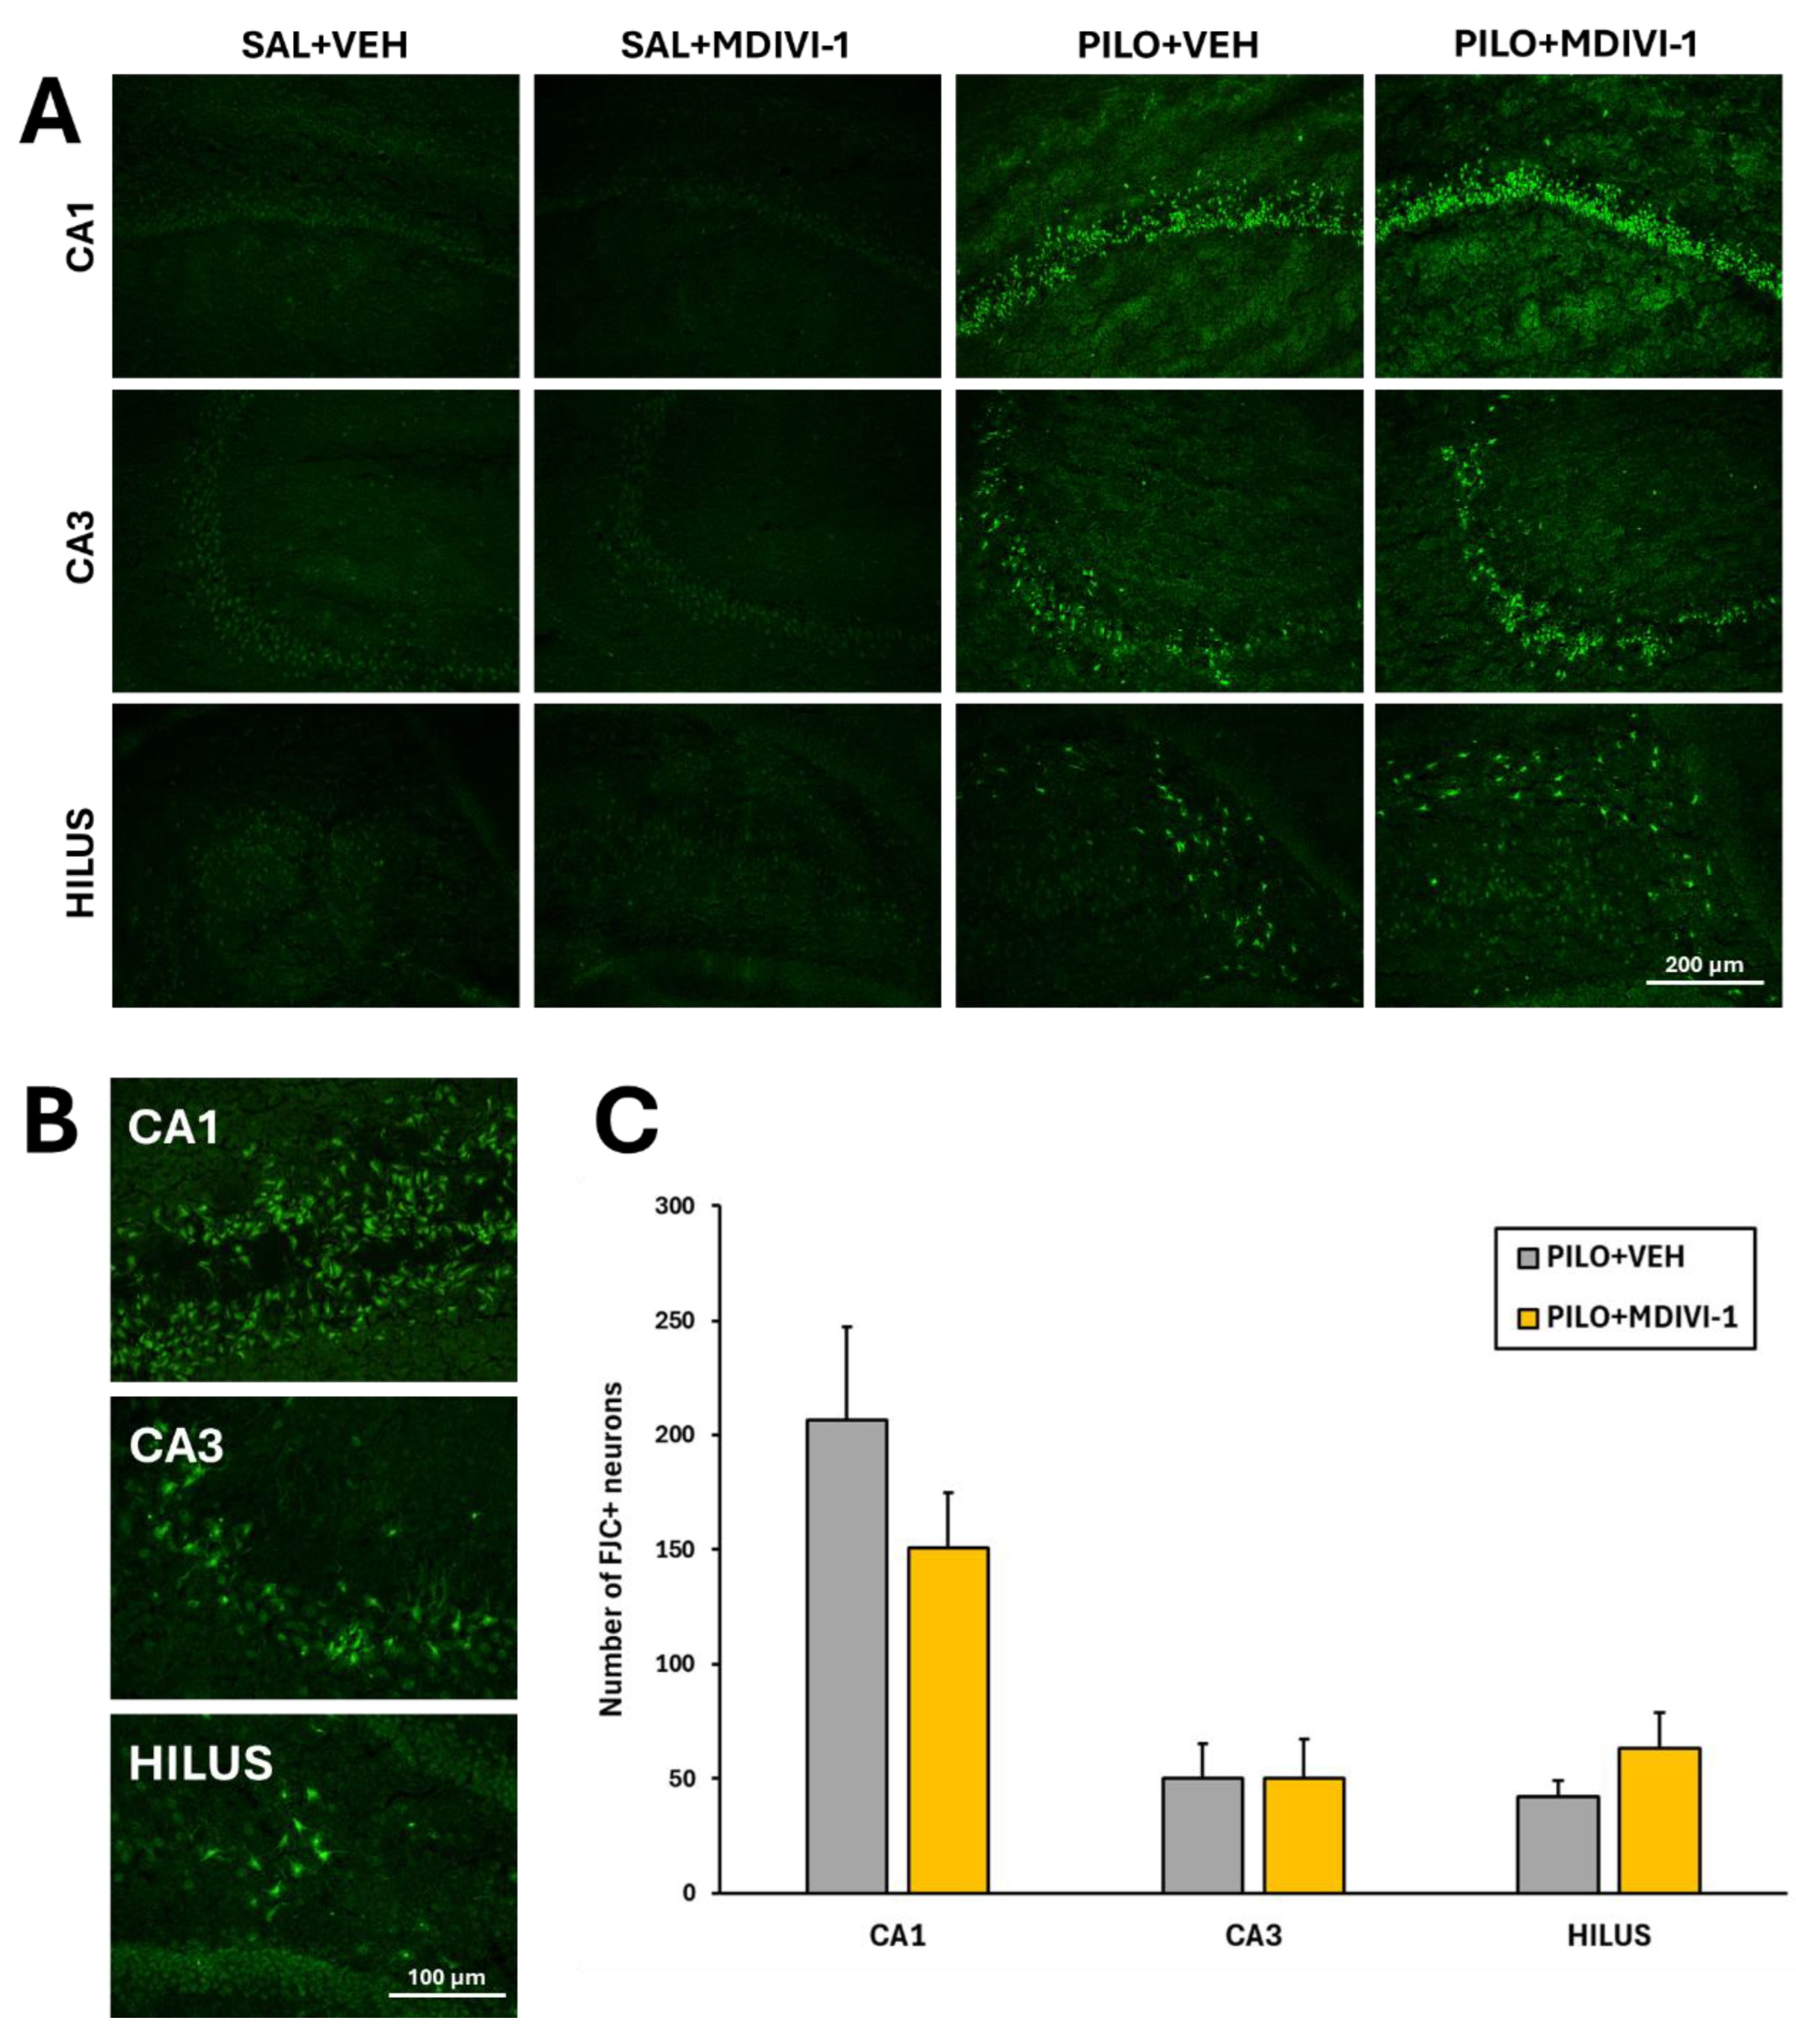
Figure 7.
Mdivi-1 reduced reactive astrocyte reactivity 3 days after SE as assessed by GFAP immunofluoresce. (A) Representative images (4x) of the whole hippocampus corresponding to the 4 experimental groups. Bar scale: 500 µm. (B) Magnified images (20x) of the hilus/dentate gyrus area. Bar scale: 100 µm. (C) Bar plot corresponding to the fluorescence quantitation in the hippocampus (mean ± SEM; n=7-10 rats/group; rats that survived the experimental procedure). **p<0.001 vs their respective control non-insulted groups; #p<0.05 indicates differences between PILO+VEH and PILO+MDIVI-1 groups.
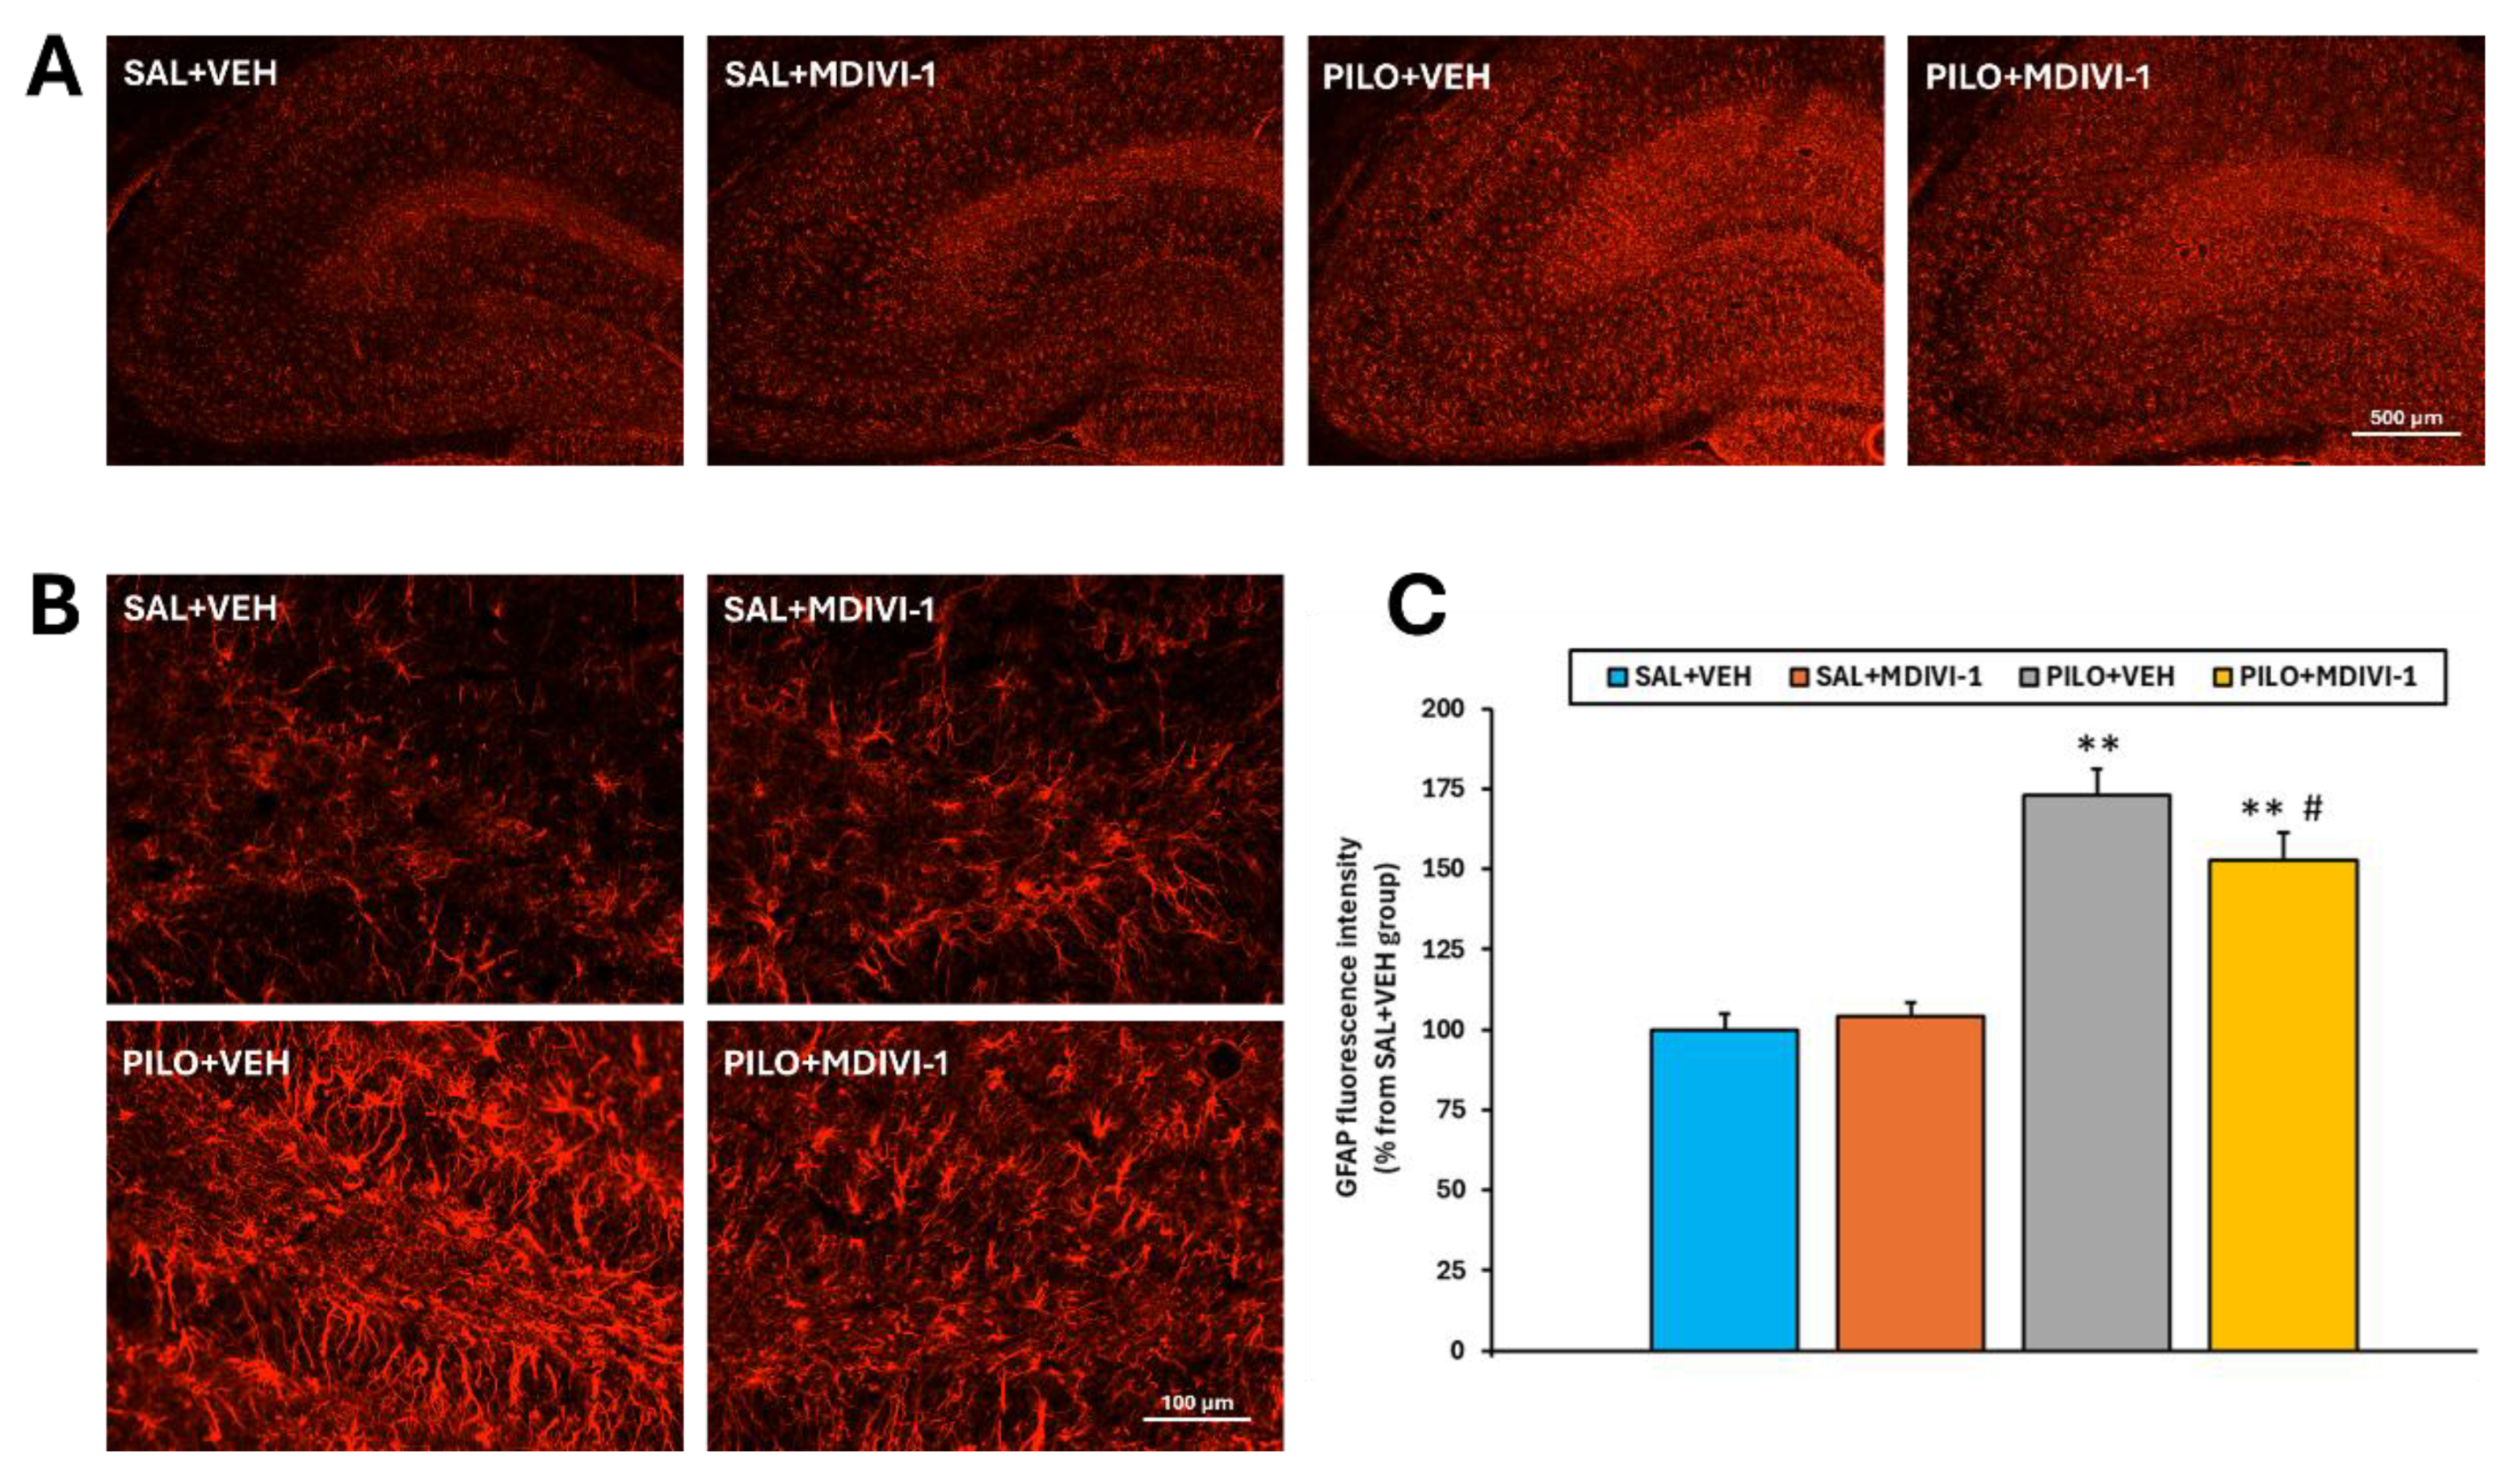
Figure 8.
Mdivi-1 treatment exacerbated microglia-induced neuroinflammation 3 days after the SE as measured by the [3H]PK11195 binding in major brain regions involved in epileptogenesis. (A) Representative [3H]PK11195 autoradiograms corresponding to the 4 experimental groups at the level of the anterior hippocampus. Letter code corresponds to the following brain regions as follows: a. Hippocampus; b. Thalamus; c: Amygdala; d: Parietal cortex; e: Temporal cortex. (B) [3H]PK11195 binding expressed in O.D. as the percentage from the SAL+VEH group. Data is shown as mean ± SEM (n=7-10 rats/group; rats that survived the experimental procedure). **p<0.001 PILO+VEH vs SAL+VEH; ##p<0.001 PILO+MDIVI-1 vs SAL+MDIVI-1 and $p<0.05, PILO+MDIVI-1 vs PILO+MDIVI-1, two-way ANOVA followed by post-hoc Tukey test.
Disclaimer/Publisher’s Note: The statements, opinions and data contained in all publications are solely those of the individual author(s) and contributor(s) and not of MDPI and/or the editor(s). MDPI and/or the editor(s) disclaim responsibility for any injury to people or property resulting from any ideas, methods, instructions or products referred to in the content. |
© 2025 by the authors. Licensee MDPI, Basel, Switzerland. This article is an open access article distributed under the terms and conditions of the Creative Commons Attribution (CC BY) license (http://creativecommons.org/licenses/by/4.0/).
Copyright: This open access article is published under a Creative Commons CC BY 4.0 license, which permit the free download, distribution, and reuse, provided that the author and preprint are cited in any reuse.


