
Submitted:
23 July 2025
Posted:
24 July 2025
You are already at the latest version
Abstract
E-Learning is an emerging dominant phenomenon in education, making the development of robust models that can accurately represent the dynamic behavior of learners in MOOCs even more critical. In this article, we propose Temporal Sparse Attention- Gated Recurrent Unit (TSA-GRU), which is a new framework in deep learning that combines TSA with a sequential encoder based on a GRU. This hybrid model effectively reconstructs student response times and learning trajectories with high fidelity by leveraging temporal embedding of instructional and feedback activities. By dynamically filtering noise from student interactions, TSA-GRU generates context-aware representations that seamlessly integrate both short-term fluctuations and long-term learning patterns. Empirical tests based on a large-scale randomized MOOC dataset demonstrate that TSA-GRU has superior accuracy and performance than Modular Sparse Attention with Gated Recurrent Units (MSA-GRU), Bayesian Knowledge Tracing (BKT), Performance Factors Analysis (PFA), and the Temporal Sparse Attention (TSA) model alone. TSA-GRU achieves an impressive 95.60% accuracy on the test with loss of 0.0209, which is also demonstrated by its rapid convergence within five training epochs, implying strength and efficiency compared to others. These results offer evidence that TSA-GRU has the potential to contribute as a state-of-the-art model for adaptive learning systems that incorporate timely and personalized interventions, and that its scalability and efficiency captures the complexity of learner behavior in order to solve issues associated to modeling learner behavior in digital education settings and predictive efficacy in modern e-learning contexts.
Keywords:
MOOCs
; TSA-GRU
; Temporal Sparse Attention (TSA)
; Gated Recurrent Unit (GRU)
; self-attention
; learner behavior analytics
; knowledge tracing
; student response time prediction
; Hybrid deep learning model
1. Introduction
Online education reduced some barriers, including geography and time, allowing learners to access meaningful, high-quality educational content no matter where they are in the world. These changes are significantly altering the educational landscape. For example, current efforts to expand alternative pedagogy through adaptive learning, better virtual classrooms, and performance development based on data are increasing student engagement and support. At the same time, Massive Open Online Courses (MOOCs) have become a key part of modern e-learning [1], which has altered the educational landscape into one of broader access and democratization of learning experiences[2]. MOOCs offer learners a structured learning experience available free of charge, or at a low cost, to those interested in the learning process, be it students, professionals, or lifelong learners. The Open Classrooms platform explicitly employs mentor-led programs, interactive assignments, real-world projects, and recommendation systems to add value to a personalized learning experience [3,4]. While MOOCs provide various advantages, they also present several obstacles, which include overall completion rates, a lack of personalized support during learning, varied learner motivations, and no opportunity for interaction with instructors [5]. Learner behavior is fragmented and data-rich in MOOCs and can include several different activities such as watching video lectures, engaging in discussions, and completing assignments [6]. Research suggests that goal-setting and peer engagement (or interaction) are the most significantly predictive of improved completion rates, as well as student performance in the course [7]. Additionally, group-level behaviours may either facilitate or inhibit course selection and learning outcomes [8,9]. Secure online learning is also a necessity, involving policies and practices that establish strong encryption, multi-factor authentication, and strict privacy compliance to protect learner data and establish trust within digital learning contexts [2,10].
The large amount and variety of MOOCs create challenges for having a personalized learner analytics process. Predictive models and clustering methods can put learners into categories with respect to their behavior, but their usefulness is limited by the amount of heterogeneity in students and the noisy, unstructured data produced by redundant interactions[4]. Privacy issues often make large-scale data collection difficult in practice, and the data collected must comply with strict ethical and data protection policies. To compound these challenges, many analytics approaches struggle with both scalability and interpretability when dealing with complex learning data. To address these shortcomings, this research integrates process-mining methods with learning analytics to help reveal the sometimes hidden, implicit patterns within MOOC learner data. The study will critically evaluate the current analytic techniques in this context and propose the TSA-Transformer, a new deep learning model architecture that incorporates Temporal Sparse Attention (TSA) and Transformer networks into a single model. This model can filter noise in the data and model contextualized and sequential data from learners’ interactions while extracting the underlying implications of learner engagement and dropout risk. Ultimately, a more personalized online learning system can be established for learners. Through TSA-Transformer, it is possible to have personalized interventions that are intended for individual learners, resulting in improved educational outcomes in a MOOC context.
This research presents a new TSA-GRU model that is used to understand learner movement in MOOCs. While TSA-GRU is based on known mechanisms such as sparse attention and GRU, it is novel in how the model builds TSA across the sequence dynamically and selectively to focus on the learning moments that are most critical to achieving learning objectives. Whereas MSA-GRU does not filter out uninformative time steps, TSA-GRU introduces a sparsity threshold mechanism to filter out the uninformative time steps in both a cognitively efficient manner, as well as from a perspective of interpretability. Unlike traditional probabilistic models or recurrent architectures that do not handle long-range dependencies well, TSA-GRU is a combined TSA model with a GRU-based sequential model, which captures both short- and long-range dependencies in learner behavior. Over the other models, it renders a dense and robust representation of learner behavior while reducing noise and redundancy with regard to all of the learners’ evidence. Some experimental evidence indicates that TSA-GRU outperforms most prior knowledge tracing models, including MSA-GRU, BKT, PFA, and TSA alone, with an accuracy of 95.60% and a test loss of 0.0209. Model also converged considerably faster than other models to reach its optimal performance in five epochs, suggesting that TSA-GRU is both an efficient learner behavior representation as well represents an ability to mitigate the risks of overfitting or underfitting models to learner behaviors. Overall, this evidence supports the contention that TSA-GRU will provide both advances in predicting better student performance outcomes and act as an exemplar platform for adaptive, data-driven, and personalized approaches for large-scale online educational environments.
This work makes three primary contributions to the field of learner behavior analytics in MOOCs:
- We introduce a next-generation learner model, TSA-GRU, a novel deep learning module that uses the combined output of TSA and a GRU, each focusing on context-aware, enriched embeddings of student interactions.
- In parallel, such embeddings are concatenated with a sequential modeling procedure, which helps capture short- and long-term dependencies in student behavior and hence supports learning outcome and response time prediction.
- In Our current procedure, the embedding originating from TSA has been merged with GRU-based sequential modeling. This allows it to capture short-term fluctuations and long-term temporal dependencies in student behavior. All of this translates into better performance in predicting learning outcomes and the time needed to respond.
- Finally, extensive experiments and validation on big-scale educational datasets have proved the superiority of TSA-GRU over existing knowledge-tracing models. These experiments show that TSA-GRU is capable of being put to real-world use in adaptive learning systems.
The structure of the paper is as follows: Section 2 discusses related work on knowledge tracing and online learning analytics; Section 3 presents the architecture and method of the TSA-GRU Module; Section 4 provides experimental results and compares the models; Section 5 discusses how to interpret the findings according to impacts; Section 6 gives a preview of implications and future works; and Section 7 concludes the paper.
2. Related Works
Recent advancements in AI and data-driven technologies have had a tremendous influence on online education, which has ignited large amounts of research into learner behaviour analytics in MOOCs. In order to render a scientific state-of-the-art of the recursive field, the related studies can be loosely divided into five categories. These latter sum together the wide range of techniques and approaches in support of improving learner experiences. They are summarized in the following:
- 1.
- Learner Behavior Analytics in MOOCs, which examines the intricate patterns of student interactions.
- 2.
- Dropout prediction studies, which use traditional ML techniques to define and detect early indicators of disengagement and help in better learner retention.
- 3.
- MOOC engagement prediction strategies that rely on deep learning methods to identify intricacies in learner interaction and engagement patterns.
- 4.
- Personalized learning in MOOCs that encompasses adaptive-based algorithms to provide pedagogical content and intervention based on individual learners.
- 5.
- Student performance which arises in online learning by means of a combination of deep and traditional learning to effectively forecast academic aspects.
2.1. Learner Behavior Analytics in MOOCs
In the referenced study [11], the authors analyzed undergraduate students participating in an online learning experience at Kyung-Hee University using k-means clustering. Although the students were organized using standard indicators (i.e., attendance, completion of required work, and participating in discussions), the authors concluded that these indicators did not reflect authentic engagement in learning. The researchers suggested that behavioral, emotional, and cognitive dimensions need to be included when considering the development of active learning strategies and student support systems. In [12], the emergent integration of process mining, learning analytics, and explainable artificial intelligence (XAI) in MOOCs was discussed. Process mining allows hidden learning patterns to be elicited from event logs and uses these data in the analytics to identify at-risk students and recommend interventions in a timely manner. XAI promotes educator transparency and builds trust in adaptive multimodal learning systems, iterated through continuous real-time feedback. The Tadakhul model described in [13] is a bilingual MOOC platform that has been developed for higher education in Oman. An approach based on a combination of Bidirectional Long Short-Term Memory (BiLSTM) and Convolutional Neural Network (CNN) makes use of a hybrid deep learning model to investigate student interactions, resulting in better predictions for students who drop out of their courses than any past methods, making way for better personalized learning analytics. In the context of MOOC video analytics, [14]explains that studying student interactions with video content is important to gain insight about video engagement and dropout risk (play, pause, rewind) that lead to immediate feedback with visual dashboards. Additionally, [15]illustrates a hierarchical attention model using CNNs and Long Short-Term Memory (LSTMs) to analyze the sentiment of MOOC comments, leading to more precise sentiment detection and adjustments to inform better teaching. Finally, [16] proposes an NLP framework that uses topic modeling on free-text survey responses to identify 18 distinct problem-solving approaches, offering a comprehensive view of student learning behaviors beyond traditional log data. In [17], predictive AI models employing K-means clustering and decision trees classify MOOC learners in Thailand into three groups, High Active, Medium Active, and Lurking Participants, demonstrating the potential of AI to personalize learning experiences and boost both engagement and retention.
2.2. Mooc Engagement Prediction
In this study [18], a hybrid application was used to predict learner engagement in MOOCs based on complicated data from 1356 learners from different semesters. It grouped students based on level of engagement using unsupervised clustering, and identified emotions expressed in forum discussions using BiLSTM. A classification model with a decision tree approach obtained an accuracy of 98%, and AUC was 0.97. This study involved contextual factors, such as location and connection, that contributed to personalizing learning experiences for dropouts within learning context. [19] speaker-centric, balanced, and media with context) on learner engagement. The findings point to a media with context video style that appears to mediate social engagement, while balanced videos appeared to provide better cognitive and emotional engagement indicators, particularly for STEM course learners. The overall finding was that speaker-centric videos provided little to no effectiveness. The findings advance the literature by providing information for educators and instructional designers in selecting video content styles. An optimized, lightweight CNN model based on the architecture ShuffleNet V2 has been developed [20] for real-time engagement recognition in MOOCs. The model includes an attention mechanism and a modification to the activation function to increase performance while maintaining speed, making it appropriate for mobile applications. The model performed better than other architectures reported in the literature, such as Inception V3 and ResNet. This work indicates the potential of leveraging deep learning to improve personalized learning and retention strategies in online education.
2.3. Mooc Dropout Prediction Models
As described in [21], the researchers developed a new dropout prediction model for MOOCs based on fractional calculus. This model seeks to address the drawbacks of previous dropout prediction techniques, which require hand-designed features and very large datasets. This strategy gives greater confidence to the predictions made by the model, and supports the development of targeted interventions to retain learners. Both studies in [22] reached the same conclusion and built a dropout prediction model using a deep neural network with data from various sources. In this analysis, dropout data from over 3,000 students was utilized with 17 attributes within the model, enabling the researchers to achieve high precision and low false negative rates, indicating the great potential of deep learning in dropout prediction. Documenting dropout prediction technology in [23], researchers proposed a new module of dropout prediction that uses self-supervised learning on clickstream data using skip-gram and PCA. It was noted that when the methods were applied to datasets from XuetangX and KDDCUP, the prediction performance of dropout outcomes improved to achieve higher metrics on dropout predictions, demonstrating that natural language processing methods can be borrowed to reflect learner behaviors in learning environments in more detail. In addition, [24] tackles high dropout rates by employing a combination of deep learning and traditional machine learning models to forecast student engagement and attrition. This study also offers a conceptual model, indicating a degree of personalized adaptive e-learning, particularly for learners with disabilities, and highlights the necessity for faculty to receive training in the effective use of emerging technologies. Lastly, the research in [25] proposed a hybrid method that involves using convolutional networks and recurrent networks (with LSTM) to analyze time-based sequences of learner engagement in STEM MOOCs. Their research identifies explicit and implicit behavioral features, suggesting early intervention approaches while emphasizing the importance of data-driven models to reduce learner attrition.
2.4. Personalized Learning in MOOCs
The research referenced in [26] introduces a hybrid knowledge-based recommendation system for MOOCs developed by combining semantic web rules with collaborative filtering techniques. The system employs the Felder-Silverman Learning Style Model to cluster learners according to patterns of course usage and subsequently offers personalized recommendations for course components, such as readings and quizzes, which can occur over time in a dynamic process. The technique enhances user engagement and assists in addressing dropout rates through reducing the cold-start problem, as well as taking advantage of contextual knowledge. In [27], the authors discuss the ongoing use of learner behavior analytics in MOOCs. It demonstrates that meaningful insights on learners can be based on their engagement over a while, in terms of assessments, learning navigation, and how that can dictate adaptive pathways and personalized recommendations that enhance the overall experience. The research presented in [28] uses a sentiment analysis methodology to analyze feedback from learners in the MOOC context. By employing machine learning and data analytics, the study leverages a range of individual learning styles and preferences to provide individualized content and real-time analysis of feedback that improves motivation and engagement while enhancing learners’ performance and satisfaction. Additionally, the researchers in [29] present an examination and application of eye-tracking technology within MOOC contexts to facilitate personalized course recommendations. This innovative perspective highlights the potential of personalized learning approaches, which can assist adaptive and efficient environments of online learning. Another study [30] provides a review of specific developments in online learning analytics, focusing on recent extensions in the deep learning world, referring to techniques such as neural networks and reinforcement learning. The work uses a systematized approach of literature synthesis using a co-occurrence network analysis, and the analysis found new conversations in the predicting of learners’ engagement and success. The review also discusses scalability, integration in education, and ethics around data informed practices, before turning to the potential to enhance individually tailored learning and educational well-being.
2.5. Student Performance Prediction in Online Learning
In [31], the scientists examine deep learning techniques to forecast student performance in MOOCs and LMS, focusing on backpropagation-based models like LSTM. This research provides a systematic filtering of a broad literature pool, resulting in 23 key papers in the area of deep learning and MOOCs/LMS, pinpointing patterns in model architecture, prediction accuracy, and possibilities for early intervention, which demonstrates the growing efficacy of deep neural networks handling complex educational datasets. This work [32] pertains to an integration module that combines behavioral analysis and machine learning algorithms for an augmented performance prediction in online continuing education, specifically in MOOCs. To develop this integration approach, a scientometric review and clustering analysis of the literature was applied, revealing a range of learning patterns (e.g., low autonomy and motivation), and showing how adding behavioral data may improve prediction accuracy that exceeds the conventional machine learning algorithms utilized in the field, such as XGBoost. Researchers in [33] make use of advanced analytical methods involving spiking neural networks (SNNs) and more than 300,000 records of past behavior data from the edX platform to predict whether students completed a MOOC. The analysis achieved an impressive 99.8% prediction accuracy. The study shows that student activity, such as posting in discussion forums and watching videos, are linked to the ability to complete a course. All of this highlights the importance of understanding behavioral characteristics to help better design timely interventions to reduce dropout rates. The research presented in [34] investigates predicting student performance in MOOCs using machine learning models to analyze demographics, assessment test scores, and student engagement metrics from the Open University Learning Analytics Dataset (OULAD). Techniques such as logistic regression and random forest regression showed that simple student behaviors, such as levels of daily activities, predicted success, with random forest demonstrating elevated prediction accuracy. The research pointed to the value of integrating a variety of data to identify at-risk students earlier, and inform retention strategies.
Review and Comparative Analysis of Prior Work
Table 1 illustrates a thorough comparison of different methods of learner behavior analytics in e-learning and MOOC contexts.
-1.5cm -1.5cm
As outlined in Table 1, there are several key trends that can be identified in the studies reviewed. First, deep learning methods (CNN, BiLSTM, and hybrid approaches) have consistently outperformed traditional machine learning methods with respect to accuracy and generalizability, particularly with dropout prediction and MOOC engagement identification. For example, models that utilize a BiLSTM and CNN [13,25] have demonstrated considerable predictive performance while using a moderate number of computational resources, suggesting a potential application in a real-time system.
Deep learning approaches have demonstrated a significant lack of interpretability. Approaches that incorporate XAI [12] or decision trees,[17,18] provide some degree of accountability but may result in either a lack of scalability or predictive capacity. Thus, the trade-offs in interpretability, prediction, and accountability must be balanced when developing the aforementioned systems with the potential for uncovering unknown behavioral insights.
Cold start and sparsity issues have been addressed frequently with clustering [11,17] and self-supervised learning [23], which suggests that unsupervised techniques are critical for generalizing results between learner populations. Furthermore, while research studies focused on a single behavioral signal, the more capable systems [24,26,33] included multiple elements, such as clickstream web data, forum text (ICT-based and sentiment), or even eye tracking which improved generalizability and reliability.
Despite a few models achieving high accuracy, there are few that actually address the real-time limits of MOOC platforms. The optimized CNN model in [20] and spiking neural networks in [33] are important steps toward low-latency and scalable prediction. These takeaways guide the implementation of our model TSA-GRU and aim to combine interpretability, accuracy, efficiency, while fixing the limitations of the previous approaches.
Problem Analysis and Proposed Solution
The swift growth of MOOCs has produced a significant quantity of learner interaction data while traditional probabilistic and attention-based sequential methods have not capitalized on filtering noise caused by redundant interaction and behavior signals, such as engagement and risk of early dropouts, and accurate temporal modeling. Which gives rise to several central research questions:
- Can the integration of TSA method to a GRU-based sequential modeling approach in the TSA-GRU module assist in filtering out noise and capturing both short and longer-term dependencies for students’ overall interaction?
- Will the TSA-GRU model enhance the meta-representation of learner behavior by allowing for noise monitoring and suppressing noise while still ’corral’ contextually relevant features?
- Thus, creating improved predictive accuracy of complex behavior and generalizable targeted interventions within learner contexts found in MOOC design?
To address these issues, we propose TSA-GRU: a novel hybrid deep learning model using a TSA Encoder component that allows for selective feature extraction using a threshold-based sparse attention to yield context-enhanced embeddings from a learner data set, followed by a GRU modeling temporal dependencies through technology gating unit operations, combining these interpretable layers and dynamic features in feedforward fully connected layers, fosters a comprehensive learning response framework to predict learning outcomes with global context understanding and fine temporal dynamics.
3. Methodology
The TSA-GRU Fusion Model is composed of two modules for making effective time series predictions on MOOC data (Figure 1):
- TSA Module:
- Using sparse multi-head attention mechanism, this module extracts the most salient temporal features by focusing on certain parts of the sequence.
- GRU Sequential Encoder and Fusion Module:
- This extracts local sequential dynamics from attention-enhanced features and fuses these global and local representations for the final prediction.
TSA-GRU adds a new TSA component, where only some time steps are assigned a meaningful attention weight based on a learnable sparsity threshold. TSA-GRU employs a dynamically learned method for filtering temporal noise and irrelevant information. Specifically, this will be interpreted as an improved attention to the most pedagogically relevant moments, contributing to generalization and prediction.
3.1. Temporal Sparse Attention (TSA)
The TSA Module directs its focus on the most vital temporal interactions from the information. It utilizes multi-head attention while incorporating the sparsity mechanism to ignore bleeding relationships. While the concept of sparse attention has been explored in the context of language models and transformers, our proposed TSA introduces a novel adaptation tailored to time-series educational data. Specifically, TSA applies a learnable sparsity threshold on attention weights across time steps, dynamically retaining only the most salient learner interactions. This contrasts with standard sparse attention mechanisms that often rely on fixed or predefined patterns.
- Embedding Transformation
The transformation is performed with an embedding to turn discrete inputs into a continuous vector space wherein inputs sharing similar properties will have similar representations.
Input Representation: For each student, we use a sequence of standardized features (e.g., original, correct, attempt_count, position) to construct an interaction sequence.
Embedding Transformation: These input features are passed through a linear layer to project them into a higher-dimensional space:
where:
- is the input sequence of shape ,
- and are learnable parameters,
- is the embedded sequence with H being the hidden dimension.
- Multi-Head Sparse Attention
A set of attention processes running in parallel (in parallel termed heads) to capture different sorts of relations in the data.
Query, Key, and Value Computation
The embedded sequence linearly projects to three vectors:
Where , , and are learned weight matrices.
Scaled Dot-Product Attention
A method where attention scores between query and key are obtained via a dot product and scaled by the square root of the dimension . This scaling helps maintain numerical stability.
Scaled Dot-Product
Here, and are the query and key matrices for each head h, with where n refers to the number of heads.
Sparse Query-Key Selection
Sparsity in this case implies that only relevant connections with attention scores higher than a threshold are retained, and the remaining lateral connections are masked.
For each query position i, the maximum attention score is computed:
A threshold of 50% of this maximum is applied:
Scores that fall below the threshold (all but the maximum) are masked out:
The softmax function is applied over these masked scores to determine the attention weights:
- Contextual Feature Compression
Concatenation
It is a process of placing several vectors next to each other and combining them into a single vector.
The output for each head has the following form as a weighted sum of value vectors:
Outputs from all heads are concatenated and then passed through a final linear projection:
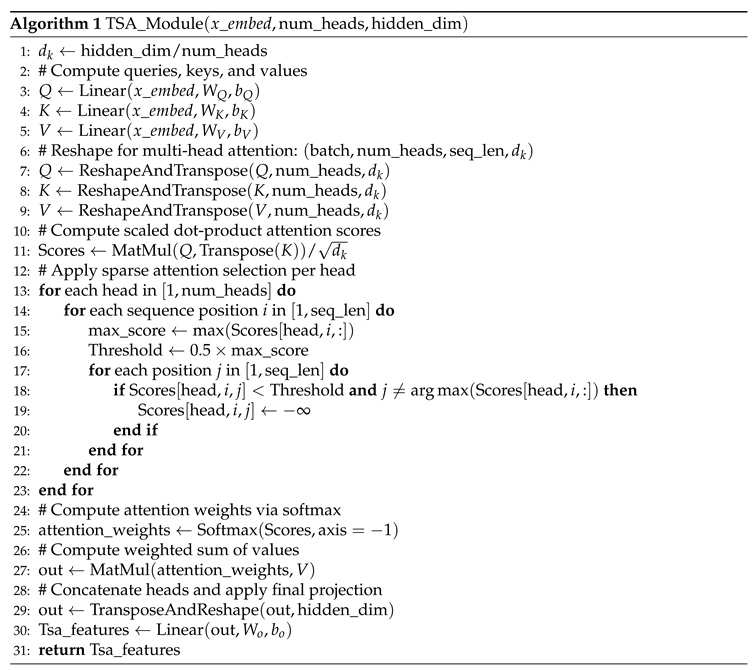
TSA Module Pseudocode: The Algorithm 1 describes the TSA module.
3.2. GRU Sequential Encoder and Fusion Module
The actual local number of sequential dependencies from the TSA-enhanced features is taken into account in this module, and these dependencies are integrated with global representations in order that a final prediction may take place.
- GRU Sequential Encoding
Gated Recurrent Unit (GRU)
A type of recurrent neural network (RNN) that controls information flow by using various gating methods to try to address problems, including the vanishing gradient problem.
GRU Layer
TSA features are fed into a GRU layer:
where is the hidden state keeping track of what happened sequentially.
- Global Pooling and Feature Fusion
Global average pooling
Computes the average value across the time dimension, effectively squeezing down a variable-length sequence into a fixed-size description.
Pooling: Global average pooling is applied to both TSA and GRU outputs:
Fusion: The pooled TSA and GRU representations are concatenated:
3.3. Final Prediction
Dense Prediction Layer:
A fully connected layer maps the fused vector to the final output:
where is the predicted, normalized response time.
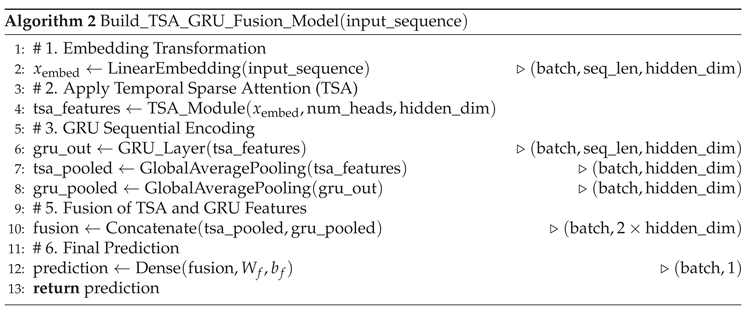
TSA GRU Fusion Model Pseudocode: The Algorithm 2 describes the TSA-GRU pseudocode.
4. Experimental Results and Comparaison
4.1. Dataset
In this paper, the dataset used is the 2009-2010 ASSISTments Data [35] comprises systematic records of student interactions with an intelligent tutoring system that predates MOOCs and many modern learning analytics features. The dataset includes user IDs, problem IDs, correct or incorrect responses, attempts, time taken, and position of questions. Interestingly, while preprocessing, duplicates were removed. Furthermore, numerical features were standardized in Scikit-Learn using the StandardScaler. For sequential modeling, the user interactions were grouped by user ID and ordered by question position, which generated Fixed-length learning sequences (in this case, 10) so that all input dimensions stayed the same. The data were split into a train-test split of 80/20 using a random seed of 42 for reproducibility. These preprocessing steps highlighted connections that were not visible before but opened pathways to train even more sophisticated deep neural network models. The processed sequences will be input to a TSA-GRU network for the prediction of students’ response time in investigation.
Once the TSA-GRU model to be proposed is established, various preprocessing techniques have been adopted for the data to attain consistency and quality:
-
Input Data:
- -
- Student interaction logs with records featuring original, correct, attempt_count, and position.
- -
- The variable to predict is ms_first_response_time.
-
Preprocessing:
- -
- Cleaning: Removing duplicate records.
- -
- Feature Scaling: Standardizing input features and the target using z-score normalization.
-
Sequence Generation:
- -
- For each user, a fixed-length sequence (e.g., 10 timesteps) is generated.
- -
- The last value within each sequence is used as the prediction target.
-
Variable Split:
- -
- Processed data is split into training and testing sets.
- -
- Data is wrapped in a custom PyTorch Dataset and DataLoader for efficient batching during model training.
4.2. Materials
To assess the proposed method, we made use of the ASSISTments dataset from the 2009–2010 school year, which contains detailed logs of how students interacted with an intelligent tutoring system. Before using the data, we carried out several cleaning steps, such as removing repeated entries, filling in missing values with appropriate defaults, and scaling the numerical fields. These interaction logs were then divided into equal-length sequences to keep the input format consistent across the model. We developed our TSA-GRU model by combining a TSA mechanism with GRU layers, using the PyTorch framework. All training and testing were done on a local machine powered by an Intel Core i7 processor and 16 GB of RAM.
To support reproducibility and make it easier for others to compare with our results, we’ve outlined all key training settings in Table 2. These hyperparameters were chosen based on findings from earlier research in the field and were fine-tuned through trial-and-error across multiple validation rounds.
4.3. Implementation of the TSA-GRU for Learner Behavior Analytics
The TSA-GRU model was developed using several configurations and tested for its ability to predict student response times from sequential interaction data. The model is comprised of a combination of TSA and GRU, capturing broad behavioral patterns as well as the temporal characteristics present in the context of learner interactions.
The simulated sequential interaction data serving as input is structured as a series of numerically encoded features that represent student behavior over time. By combining a TSA-Attention module for global feature refinement with a GRU layer for modeling sequential dependencies, TSA-GRU effectively predicts the expected response time for the next interaction. Hyperparameter tuning across various configurations was performed to optimize predictive accuracy while ensuring robust generalization across multiple student datasets.
The TSA-GRU model includes the following key components (Figure 2):
- Linear Embedding Layer: The input sequences (10 steps with multiple numerical features per step) are projected into a 128-dimensional space using a linear embedding layer. With 640 learnable parameters, this layer enables the model to capture complex nonlinear relationships among features.
-
TSA-Attention Module: The embedded features are refined through linear transformations of queries, keys, and values. A sparse selection mechanism, based on binary masks and thresholding, filters out irrelevant interactions and enhances the most pertinent temporal patterns.
- -
- Query transformation: 16,512 parameters
- -
- Key transformation: 16,512 parameters
- -
- Value transformation: 16,512 parameters
- -
- Output transformation: 16,512 parameters
The total number of parameters in the TSA-Attention module is therefore , enabling effective feature selection and the extraction of global behavioral representations. - GRU Module for Sequential Dependency Modeling: The refined features from the TSA module are passed to a GRU layer. Using update and reset gates, the GRU captures temporal dependencies in student behavior, retaining important historical information while discarding less useful patterns. This module contains tunable parameters.
- Fusion and Prediction Layer: Outputs from both the TSA-Attention and GRU modules undergo global average pooling to reduce sequence length. The pooled outputs (each 128-dimensional) are concatenated into a 256-dimensional vector. This vector is passed through a fully connected layer (with 257 parameters) to predict the normalized response time for the next interaction.
4.4. TSA-GRU Performance Across Epochs and with Other Models
The evaluation of TSA-GRU is conducted in two phases: first, its performance across training epochs; and secondly, its comparison to other models in knowledge tracing.
In phase one, the TSA-GRU model depicts significant decreases in training and test loss and steady improvements in accuracy while training. Certainly, best performance is attained at epoch 40 as shown in Figure 3, where minimal test loss and maximum accuracy are recorded. This is an indication for TSA-GRU: the performance captures the sequential dependencies in student interactions with no overfitting or underfitting. This stability at that time provides further justification for its robustness while processing fixed-length sequences of student learning data.
The second phase considers the comparison of TSA-GRU against various other knowledge tracing systems, specifically TSA-Transformer, MSA-GRU, BKT, and Performance Factor Analysis (PFA). The attention-based models, TSA and MSA-GRU, demonstrate that they performed fairly well, but TSA-GRU performs better by achieving high predictive accuracy along with considerably lower test loss values. On the other hand, classical models such as BKT and PFA incur higher losses but lower accuracies, letting one know that it’s very hard to completely characterize the inherently complicated human learning behaviors. The relative comparisons confirm that TSA-GRU can show us the best representation concerning student learning paths, thus backing up its argument in favor of high-level knowledge tracing activities.
- TSA-GRU Performance Across Epochs
Model Performance Across 5 Epochs
Figure 4 showed that the TSA-GRU model registered significant improvement in performance during the five training epochs, gradually fine-tuning its predictions with little loss and incremental accuracy gains. Most of its training performance settled down at a training loss of about 0.0302 (95.69% accuracy) and a test loss of some 0.0211 (95.96% accuracy). This indicates that the TSA-GRU was able to reasonably correctly capture sequential patterns in student interactions and, based on that, soon learned from data arising to robustly peak performance.
Model Performance Across 10 Epochs
Through 10 epochs in Figure 5, TSA-GRU showed a smoothly decreasing loss curve for both training and test loss, indicating its high capability of learning and generalizing. The training loss started around 0.0319 and finally reached equilibrium around 0.0298. The test loss went from around 0.0283 down to 0.0210. This demonstrates the potential of the model to capture useful features from sequences of student learning. There was a small improvement in accuracy (tolerance equal 0.2); the training accuracy was improved from about 94.02% to the end of 94.68%, while the testing accuracy was improved from about 93.83% to 94.68%. These results start showing the capability of TSA-GRU in modelling complex layer-wise sequential dependencies and achieving strong performance predictively.
Model Performance Across 20 Epochs
The TSA-GRU model was trained for 20 epochs, and both the training and test loss curves, as shown in Figure 6, show a tendency to decrease, demonstrating the great capability of learning and generalization of this network. About 0.0309 is the initial value for training loss, 0.0210 being the test loss. Over the entire period of training, minor variations notwithstanding, the model stabilized at the end to training loss of 0.0293 and test loss of 0.0205. Regarding the accuracy tolerance at 0.2, the training accuracy went to a total of 95.39% whereas the test accuracy was 95.18%. These results demonstrate that the TSA-GRU captures intricate sequential patterns of student learning data very well and thus justifies its capability for sound knowledge tracing operations.
Model Performance Across 30 Epochs
In Figure 7, the TSA-GRU model has established its performance after 30 epochs of training. A steady decrease in training and testing loss confers stable and strong performance. The training loss starts from approximately 0.0324 and decreases to about 0.0295, whereas the test loss drops from around 0.0221 to 0.0205, with many bumps during the training phase. In terms of accuracy, the TSA-GRU model scored quite high: training accuracy stabilizing around 95.78% and test accuracy settling at 95.67%. The results suggest that TSA-GRU, among other models, best capture the learning patterns of students and generalize better across various knowledge tracing tasks, while the insignificant ups and downs indicate it remains sensitive to the variations of the data and could be adjusted further upon tuning.
Model Performance Across 40 Epochs
The TSA-GRU model’s training is remarkably consistent over 40 epochs in Figure 8 as both training and test losses continue their steady decline clear indicator of learning and generalization. Training loss dropped from 0.0316 to 0.0288, while test loss dropped from 0.0313 to 0.0201 by the last epoch. In tandem, training accuracy increased from 93.79% to 95.60% and testing accuracy rose from 93.76% to 95.74%. Such observations verified that the TSA-GRU model could adequately seize the essential patterns establishing the sequences of students’ learning and is resilient and consistently applicable to various knowledge tracing problems while accommodating slight training perturbations.
Model Performance Across 100 Epochs
In 100 epochs in Figure 9, the TSA-GRU model showed a stable and robust performance in detecting student learning activities. The training loss of the model monotonically converged toward 0.0277, while the test loss stably converged to 0.0209. This was mirrored by an estimated training accuracy of 95.44% and a test accuracy of 95.25%. These results indicate that the TSA-GRU learns well from the sequential student interaction data, capable of strong generalization, and performance consistency along knowledge tracing tasks, all in the context of some minimal fluctuations throughout training.
These findings indicate that the TSA-GRU can learn effectively from the sequential data of objects being interacted with by students, along with impressive levels of generalization and consistency in performance in knowledge tracing tasks, all within the context of some relatively small changes throughout the training. Besides that, we also monitored the model performance across train and validation sets to evaluate generalization. The training and test curves (shown in Figure 4 to Figure 9) continuously and in parallel declined in loss with no indication of diverging. The TSA-GRU learned to converge very early on in training, and results remained constant in consecutive epochs. The patterns suggest that the model generalized well over unseen data and did not overfit. Generally, from the performance of the TSA-GRU model in run training for multi-epochs, it can be deduced that the model learns quickly and generalizes properly. All experiments conducted for 5, 10, 20, 30, 40, and 100 epochs accepted the persistent statement that training loss and test loss went down constantly. Notably, the highest test accuracy ratio is achieved after 5 epochs at 95.96%. Although few epochs of training produce slight improvements in loss (from 0.0302 after 5 epochs to 0.0277 after 100 epochs) as well as variability in accuracy, the advantage gained after that is marginal. It can thus be deduced that: perforated by the TSA-GRU taken at the beginning of each of the five epochs into the training iterations, meaningful patterns regarding student interaction data were recognized; therefore, further epochs became to a fading utility, promoting the entire model’s capacity for doing tasks concerning knowledge tracing.
- Comparison of Knowledge Tracing Models
To evaluate the performance of the method described above, we compared training and testing performance across several metrics (training loss, training accuracy, test loss, test accuracy). The results shown in Table 3 provide strong evidence that modern attention-based architectures (TSA-GRU and MSA-GRU) are generally more accurate than classical models (BKT and PFA), with notably lower test loss. Additionally, the TSA-GRU model achieved the highest test accuracy, as well as the lowest test loss, which provides further evidence of its ability to better model complex student behavior due to the nature and capabilities of attention-based architectures. Overall, these results provide strong evidence that the TSA-GRU model (and other similar attention-enhanced architectures) is capable of producing superior multiple-choice predications to traditional models specifically for the task of knowledge tracing. We conducted a controlled experiment comparing TSA-GRU, MSA-GRU, BKT, and Performance Factor Analysis (PFA) using the 2009–2010 ASSISTments dataset under identical experimental conditions. TSA-GRU achieved the best results, with a test accuracy of 95.60% and a test loss of 0.0209.
MSA-GRU vs TSA-GRU
Although Modular Sparse Attention with GRU is responsible for the computation of a certain range of dependencies at a far lesser computational overhead, it lacks, however, efficiency in the handling of very complicated long-range dependencies necessary for learning trajectories. In contrast, TSA-GRU combines TSA and GRU as its core for capturing richer contextual insights from all student interactions. The Figure 10 demonstrates. Testing results substantiate this very difference. MSA-GRU, with a training loss of 0.0667, achieved a training accuracy of 81.36% and a testing loss of 0.0222 with testing accuracy at 80.00%. In contrast, the TSA-GRU recorded a training loss of just 0.0296 and a greater training accuracy of 95.62% along with a test loss of 0.0209 and test accuracy of 95.60%. The analysis also illustrates that TSA-GRU not only exhibits better performance in predictive capacity, but has also shown its competence in deciphering complex sequential behaviors from educational data-hence making it an optimal choice for advanced knowledge tracing challenges
BKT vs TSA-GRU:
The BKT model and TSA-GRU are two distinct representations of different paradigms of knowledge tracing. BKT is a probabilistic model, which uses binary correctness observations to infer the gradual and probabilistic process of mastering any skill that is conceived to proceed according to the structure of hidden Markov models. Although such an approach is more interpretable and simpler, it cannot fit very complex learning patterns since it has a training loss of 0.6651 and a test loss of 0.6691 as demonstrated in Figure 11, while the corresponding low training and test accuracy are at 64.10% and 64.01%, respectively. So, one thing becomes clear. Unlike this, the TSA-GRU model follows a hybrid architecture combining temporal sparsity attention with GRU, representing long-term dependencies and implied contextual relations in student interactions. This modern approach surpasses BKT by far, with a training loss of 0.0296 and a test loss of 0.0209, and a solid training and testing accuracy of 95.62% and 95.60%.The TSA-GRU may have other large data sets and computational power requirements. The main feature is its capability of delivering high predictive performance by modeling complex learning pathways, which makes it suitable for large-scale data-driven education applications.
PFA vs TSA-GRU:
Unlike PFA, which relies on traditional statistical methods to model the acquisition of skills-and therefore finds it quite impossible to capture the intricate learning dependencies-TSA-GRU builds upon TSA combined with GRU to model both short- and long-term dependencies of student learning trajectories. In the experiments, TSA-GRU attained a training loss of 0.0296 and a test loss of 0.0209, while training accuracies were 95.62% and 95.60% for test data, respectively. Conversely, PFA obtained a training loss of 0.6363 and poor accuracies of 64.11% and 63.63% on training and test data, respectively, as shown in Figure 12. Concisely, these results stem from capturing fine-grained learning patterns, which TSA-GRU implements dramatically better than PFA, persuading the consideration of TSA-GRU as the proper model for knowledge tracing within complex settings.
TSA vs TSA-GRU:
Both TSA and TSA-GRU capitalize on attention mechanisms to scrutinize learning activities exhibited by students. However, the TSA-GRU addresses key assumptions made by prior models by achieving a far more predictive accuracy than TSA. The TSA used a sparse attention mechanism to steer its analysis toward crucial learning interactions, but long-term dependencies and complex learning patterns are beyond the TSA model’s ability to handle. On the contrary, TSA-GRU integrates TSA with GRU-based sequential modeling, thus able to conciliate short- and long-range dependencies and contextual relationships existing among learning trajectories. Figure 13 shows that it achieved a training loss of 0.0296, a test loss of 0.0209, and training and test accuracies of 95.62% and 95.60%. In contrast, the TSA’s training loss was 0.0678 and its testing loss 0.0238, with greatly diminished training and testing accuracy at 75.06% and 74.83%. Given these empirical results, it is clear that while functional, the superior capability of TSA-GRU in recognizing complex learning behaviors has made it a technologically advanced solution to fulfilling educational projects that require a modest level of predictive accuracy in combination with more profound insights into student-learning processes.
4.5. Cross-Validation and Statistical Significance Analysis
To ensure the robustness, generalizability, and statistical reliability of the proposed TSA-GRU model, the following analysis was performed: 5-fold cross-validation, estimates of confidence intervals, analysis of variance, and the evaluation of paired statistical significance as compared to the baseline MSA-GRU model.
- 5-Fold Cross-Validation Procedure and Results
To reduce overfitting and verify that metrics didn’t fluctuate due to the data splits, we applied a 5-fold cross-validation procedure, and handled the data appropriately. We split the data into five equal subsets; then on each fold, we trained the model on four subsets and tested it on the remaining one. So, this was repeated five times, meaning every sample was used for validation only once.
The TSA-GRU model maintained a high level of accuracy throughout all folds, with only slight variation, demonstrating stable efficiency. The fold-wise accuracy scores for TSA-GRU model are shown in Figure 14, along with a breakdown of per-fold accuracy scores in Figure 15, confirming the efficiency and robustness of the TSA-GRU model across these partitions.
- Confidence Intervals and Variability Analysis
To measure performance stability, we computed the mean accuracy, standard deviation (SD), and the 95% confidence interval (CI) for each model, as shown in Table 4:
The small confidence interval and variance of TSA-GRU indicate low noise and high reliability and generalizability. Figure 16 illustrates this by comparing the fold-wise accuracy distributions for each method.
- Statistical Significance Testing
To mathematically validate if the observed enhancements in performance of TSA-GRU over MSA-GRU are statistically significant, we conducted a paired t-test on fold-wise accuracy scores for both models.
The t-test found a t-statistic and a p-value , meaning that the performance difference is statistically very significant ().
These results support our assumption that the TSA-GRU improved performance cannot be attributed to random factors, and the improvements come from its architectural changes. The summary of the statistical comparison is shown in Figure 17 for completeness.
- Visual Comparative Analysis
To provide a better perspective for the comparison, we include the following visualizations: A bar chart comparing TSA-GRU and MSA-GRU’s accuracy scores side-by-side for all five folds in Figure 18. A line chart showing the accuracy trends per fold, also indicating that TSA-GRU was considerably more accurate than MSA-GRU in each fold shown in Figure 19.
This extensive validation framework five-fold cross-validation, confidence interval estimation, rigorous testing of the statistical significance greatly enhances the reliability and reproducibility of our results. The TSA-GRU model confidently outperforms the MSA-GRU model with respect to accuracy, reduced variance, and higher levels of statistical confidence. This validates that the TSA-GRU is robust and resolves all issues raised concerning statistical rigor.
5. Discussion
The experimental evaluation of the TSA-GRU model provided insight into its performance across varying training epochs while also establishing how it outstrips several other knowledge tracing models in quality. The focus of this investigation is on the way it could investigating the model’s convergence property, generalization capability, and complete predictive accuracy based on a large-scale dataset of student interactions. In this discussion, we describe our findings by observing performance measures for different epoch configurations and by contrasting TSA-GRU with other approaches in the discipline-exploration, such as MSA-GRU, BKT, Performance Factor Analysis (PFA), and a solitary TSA approach.
- Performance Across the Training Epochs
The TSA-GRU model was tested over a wide range of epochs (5, 10, 20, 30, 40, and 100 epochs) to determine the optimal training duration needed to better capture sequential patterns from students’ interaction data. The results indicated that the model converges very fast, best performance overall at 5 epochs. It was at this time that the training loss was about 0.0302 and the training accuracy about 95.69%; the test loss was about 0.0211, while test accuracy was almost 95.96% (or, as reported in the comparative summary, 95.60%). Interestingly, while there were further small reductions in loss between various epochs-for instance, at 100 epochs, the training loss was 0.0277-there was only marginal improvement in accuracy; in some cases, longer training resulted in a minor decrease or some cycling of accuracy. This would imply, then, that TSA-GRU captures very well the important dependencies that are sequenced in student interactions within a few training epochs. So, after that point, it enters a phase in which added epochs give no further advantage. That rapid convergence is also indicative of the strength of the model as well as its computational efficiency, a crucial consideration for educational use cases in real-world scenarios. In order to strengthen concerns about possible overfitting, we explicitly assessed the model’s learning behaviour over the training process. The lack of divergence between training and testing curves, its rapid convergence, and stability provide evidence that TSA-GRU is very robust. In the results section, we added a statement signaling this to be more transparent and demonstrating how effectively the model generalizes beyond the training data.
- Comparative Analysis with Other Models
We also did a performance comparison with a number of commonly used knowledge tracing models, aside from the focused examination of TSA-GRU. Whereas traditional models like BKT and PFA, of course, provide interpretability, they do not allow the modeling of long-term learning and contextual influences. Therefore, each of these models was at lower than 60% accuracy and high loss values in a way that did not capture more nuanced student behavior. Similarly, attention-based models with MSA-GRU and TSA models performed better than the traditional models (but worse than TSA-GRU). For example, MSA-GRU achieved training and test accuracies of and , respectively, while TSA alone performed around . TSA-GRU, by contrast, reached training and test accuracies close to , with significantly reduced loss values ( training and testing).
These enhancements arise from combining existing methodologies as well as a novel way of incorporating TSA into the GRU model architecture. While MSA-GRU attends to each time step uniformly through its attentional mechanism, TSA-GRU uses a learnable sparsity threshold to eliminate irrelevant or noisy temporal information. This attention mechanism allows the model to attend more closely to its most informative sequence segments, improves learning efficiency, improves interpretability, and better generalization. All in all, the results illustrate that TSA-GRU is not just a combination of two existing models; it is a hybrid explicitly created to improve on previous models by shifting and relaxing attention to allow a more focused and adaptive attention mechanism. It creates a new and substantial advancement in knowledge tracing models.
- Adaptive Learning and Knowledge Tracing
The use of TSA-GRU does have some serious implications on the adaptive learning and educational data analytics scenes. Its learning rate and accuracy make it capable of identifying meaningful patterns from student interaction data, going on with updates within a short period, thus intervening, when necessary, in this digital space of learning. That the optimal performance comes with relatively small intakes of the epoch (5 epochs means less computation and time to deploy), both crucial when such applications get to run on a large scale and depend heavily on data. The double capability of TSA-GRU to identify both the short-scale variations as well as the long-scale active tendencies of the learners in their behavior does look to grant it the potential to reveal a more subtle insight into the performance of the learners. This double-cut capability further means improvement both in the prediction of response times of learners and provides help in more focused interventions in lessons. Improvement with this particular technique would, in practice, lead to adaptive learning systems that are faster and more focused on finding the details of any given student in their singular learning moment. The findings of TSA-GRU are an entirely novel kind of hybrid deep learning model. In terms of prediction accuracy and speed, it certainly outperformed the standard knowledge-traction models. Model integration of TSA with sequential modeling based on GRU imparts state-of-the-art analysis capability to complex learning patterns from the fixed-length student interaction data concerning precision. Because of the ability to converge in five epochs very fast and yet having very good generalization properties, TSA-GRU is an excellent model for adaptive learning systems. The proposed solution, TSA-GRU, is excellent, scalable, and works very effectively for the challenges of modeling student behavior in digital education, therefore providing a way to improve teaching data-driven.
- Cross-Validation and Statistical Significance Analysis
The use of a rigorous 5-fold cross-validation protocol and statistical significance testing greatly enhances the reliability of the reported findings, and the fact that TSA-GRU showed high accuracy in each fold with minimal variance and narrow confidence intervals lends evidence to TSA-GRU’s robust generalization capacity. The paired t-test assures that the improvements in performance over MSA-GRU were not the result of chance/randomness and could be considered truly statistically significant. These tests, supported by detailed visualizations (Figures 14–19), represent evidence that the TSA-GRU architecture can achieve meaningful, reproducible improvements in sequential modeling tasks for knowledge tracing activities.
6. Implications and Future Directions
The TSA-GRU model achieves impressive results in the context of knowledge tracing, with the reported test accuracy of 95.60% and test loss of 0.0209 after five epochs. Given the speed in obtaining these results, it appears the model can handle capturing very complex sequential dependencies in student-learning data and limit overfitting, making it useful for real-time education systems. With long- and short-term dependency modeling capacity, the TSA-GRU is well-positioned to provide personalized learning experiences and employ powerful situational performance predictors. However, several limitations should be noted. The sparse attention mechanism can require the user to tune threshold values manually, which may limit generalizability to other datasets or learning contexts. In addition, the current model does not leverage any affective or contextual learning signals, which would provide additional opportunities for improved prediction performance and personalization. Furthermore, we recognize that the ASSISTments 2009–2010 dataset, while still commonly utilized in the educational modeling community, is far from capturing the intricacies and variability of the contemporary MOOC platforms, such as edX, Coursera, or XuetangX. Although we decided upon this dataset based on its sequential structure and its common benchmarking use for temporal models, we will certainly develop our work for better generalizability and provide a more accurate instantiation of contemporary e-learning environments where possible. Future work will require the consideration of new and heterogeneous datasets that possess multimodal learner behavior (e.g., text, video, exercises), richer engagement signals, and modality-dependent features, such as their real-world use of the TSA-GRU across a number of possible MOOC implementations. In future work, we intend to research the use of reinforcement learning technologies to cater for adaptive learning path generation through the dynamic performance of each student. We will also research meta-learning means of quickly adapting to new learners, courses, or contexts with little retraining. Other routes of research include using graphic neural networks to understand the relational structures in the learning data, applying self-supervised pretraining to enrich the feature extraction, improving interpretability in models to provide actionable outputs for educators, and the most important immediate route of exploration for TSA-GRU is to evaluate it in live adaptive learning systems as, from an overall practical view, it is important to implement it in real settings.
7. Conclusion
In this work, we presented TSA-GRU, a hybrid model that brings together TSA and GRU-based sequential modeling to better trace student knowledge within MOOC platforms. Unlike many traditional approaches, such as BKT, Performance Factor Analysis (PFA), or even more recent architectures like MSA-GRU, TSA-GRU shows a stronger ability to track how learners progress over time by handling both short- and long-term learning patterns. The model produced promising results concerning the experimental design: it had a test accuracy of 95.60% and a loss of 0.0209, converging after 5 epochs. One could look at the convergence of the model in a positive light since, in practice, we need faster or even larger training (and potential modeling) cycles, implying the model can generalize and be trained and succeed without overfitting or unlimited training. Moreover, there were no large performance gains even with additional training epochs, to further support the assertion that the TSA-GRU learns things of interest quickly early on. One of TSA-GRU’s core strengths is its ability to model how students’ knowledge changes over time. This feature opens up real opportunities for building systems that respond to learners individually, whether by helping to spot early warning signs for struggling students or by supporting more adaptive content delivery. Additionally, extensive validation through 5-fold cross-validation, confidence interval analysis, and paired t-testing confirmed the robustness, statistical reliability, and consistent superiority of TSA-GRU over MSA-GRU. That said, a few limitations should be mentioned. At present, the attention mechanism depends on fixed threshold values, which must be selected manually. This could make it harder to transfer the model across different datasets without tuning. Also, the current setup does not include emotional or contextual data, both of which could play a role in learning outcomes and model accuracy. For future development, one track we are examining is reinforcement learning, with an eye toward the model adapting the learning path during the assignment as the student interacts with the content. We are also interested in meta-learning approaches so that the model can generalize to new types of students or educational content with minimal retraining. Other potential areas are investigating self-supervised learning to work more with raw interaction data, and utilizing graph neural networks to better represent the relationships between students, topics, or assessment. Enhancing model transparency is furthermore a substantial aim. By developing clearer interpretability mechanisms, we anticipate being able to support teachers in understanding why certain predictions are made, which would make the tool more actionable in classrooms. Testing TSA-GRU in situ in learning environments is another important next step that would indicate how it operates in real-world conditions. To conclude, TSA-GRU represents an important advance in student modeling. Its fidelity, performance, and adaptability make it an important part of the journey toward AI-enhanced personalized education systems. As we continue to develop TSA-GRU, and consider possible uses of the toolbox to support better, smarter, and responsive educational technologies behaviour in different learning scenarios.
Author Contributions
Conceptualization, S.O.B, A.B, M.D, M.M M.S.K M.C.G; Methodology, S.O.B, A.B, M.D, M.M M.S.K M.C.G.; Software, S.O.B, A.B, M.D, M.M M.S.K M.C.G.; Validation, S.O.B, A.B, M.D, M.M M.S.K M.C.G.; Formal Analysis, S.O.B, A.B, M.D, M.M M.S.K M.C.G.; Investigation, S.O.B, A.B, M.D, M.M M.S.K M.C.G.; Resources, S.O.B, A.B, M.D, M.M M.S.K M.C.G.; Data Curation, S.O.B, A.B, M.D, M.M M.S.K M.C.G.; Writing—Original Draft, S.O.B, A.B, M.D, M.M M.S.K M.C.G.; Writing—Review and Editing, S.O.B, A.B, M.D, M.M M.S.K M.C.G.; Visualization, S.O.B, A.B, M.D, M.M M.S.K M.C.G.; Supervision, A.B, M.D, M.S.K M.C.G.; Project Administration, A.B, M.D, M.S.K M.C.G.; Funding Acquisition, A.B, M.D.
Funding
This research received no external funding.
Data Availability Statement
Data used in this research is publicly available on MOOC https://doi.org/10.1016/j.dib.2018.11.139. No new data was created in this research.
Conflicts of Interest
The authors declare no conflicts of interest.
References
- Boufaida, S.O.; Benmachiche, A.; Maatallah, M.; Chemam, C. An Extensive examination of varied approaches in e-learning and MOOC Research: A thorough overview. In Proceedings of the 2024 6th International Conference on Pattern Analysis and Intelligent Systems (PAIS). IEEE; 2024; pp. 1–8. [Google Scholar] [CrossRef]
- Nadira, B.; Makhlouf, D.; Amroune, M. Personalized Online Learning: Context Driven Massive Open Online Courses. International Journal of Web-Based Learning and Teaching Technologies 2021, 16, 1–15, Publisher: IGI Global. [Google Scholar] [CrossRef]
- Boutabia, I.; Benmachiche, A.; Betouil, A.A.; Chemam, C. A survey in the use of deep learning techniques in the open classroom approach. In Proceedings of the 2024 6th International Conference on Pattern Analysis and Intelligent Systems (PAIS). IEEE; 2024; pp. 1–7. [Google Scholar] [CrossRef]
- Kahil, M.S.; Bouramoul, A.; Derdour, M. Big data visual exploration as a recommendation problem. International Journal of Data Mining, Modelling and Management 2023, 15, 133–153. [Google Scholar] [CrossRef]
- Benmachiche, A.; Sahia, A.; Boufaida, S.O.; Rais, K.; Derdour, M.; Maazouzi, F. Enhancing learning recommendations in mooc search engines through named entity recognition. Education and Information Technologies, 2025, pp. 1–31. [CrossRef]
- Almaiah, M.A.; Al-Khasawneh, A.; Althunibat, A. Exploring the critical challenges and factors influencing the E-learning system usage during COVID-19 pandemic. Education and information technologies 2020, 25, 5261–5280. [Google Scholar] [CrossRef] [PubMed]
- Wunnasri, W.; Musikawan, P.; So-In, C. A two-phase ensemble-based method for predicting learners’ grade in MOOCs. Applied Sciences 2023, 13, 1492. [Google Scholar] [CrossRef]
- Wang, W.; Guo, L.; Sun, R. Rational herd behavior in online learning: Insights from MOOC. Computers in Human Behavior 2019, 92, 660–669. [Google Scholar] [CrossRef]
- Ghanem, M.; Mouloudi, A.; Mourchid, M. Towards a scientific research based on semantic web. Procedia Computer Science 2015, 73, 328–335. [Google Scholar] [CrossRef]
- Sedraoui, B.K.; Benmachiche, A.; Makhlouf, A.; Chemam, C. Intrusion Detection with deep learning: A literature review. In Proceedings of the 2024 6th International Conference on Pattern Analysis and Intelligent Systems (PAIS). IEEE; 2024; pp. 1–8. [Google Scholar] [CrossRef]
- Kim, S.; Cho, S.; Kim, J.Y.; Kim, D.J. Statistical assessment on student engagement in asynchronous online learning using the k-means clustering algorithm. Sustainability 2023, 15, 2049. [Google Scholar] [CrossRef]
- Mukala, P. Unveiling the Synergy of Process Mining, Explainable AI, and Learning Analytics in Advancing Educational Data Interpretability: Paving the Way for a New Era in Educational Analytics. Explainable AI, and Learning Analytics in Advancing Educational Data Interpretability: Paving the Way for a New Era in Educational Analytics (January 24, 2025), 24 January; 2025. [CrossRef]
- Doss, A.N.; Krishnan, R.; Karuppasamy, A.D.; Sam, B. Learning analytics model for predictive analysis of learners behavior for an indigenous MOOC platform (tadakhul system) in Oman. International Journal of Information and Education Technology 2024, 14, 961–967. [Google Scholar] [CrossRef]
- Şahin, M. Advances in video analytics. Technology, Knowledge and Learning 2024, 29, 1869–1875. [Google Scholar] [CrossRef]
- Su, B.; Peng, J. Sentiment analysis of comment texts on online courses based on hierarchical attention mechanism. Applied Sciences 2023, 13, 4204. [Google Scholar] [CrossRef]
- Kong, B.; Hemberg, E.; Bell, A.; O’Reilly, U.M. Investigating Student’s Problem-solving Approaches in MOOCs using Natural Language Processing. In Proceedings of the LAK23: 13th International Learning Analytics and Knowledge Conference; 2023; pp. 262–272. [Google Scholar] [CrossRef]
- Chonraksuk, J.; Boonlue, S. Development of an AI predictive model to categorize and predict online learning behaviors of students in Thailand. Heliyon 2024, 10. [Google Scholar] [CrossRef] [PubMed]
- Benabbes, K.; Housni, K.; Hmedna, B.; Zellou, A.; El Mezouary, A. A new hybrid approach to detect and track learner’s engagement in e-learning. IEEE access 2023, 11, 70912–70929. [Google Scholar] [CrossRef]
- Deng, R. Effect of video styles on learner engagement in MOOCs. Technology, Pedagogy and Education 2024, 33, 1–21. [Google Scholar] [CrossRef]
- Hu, Y.; Jiang, Z.; Zhu, K. An optimized cnn model for engagement recognition in an e-learning environment. Applied Sciences 2022, 12, 8007. [Google Scholar] [CrossRef]
- Anand, G.; Kumari, S.; Pulle, R. Fractional-Iterative BiLSTM Classifier: A Novel Approach to Predicting Student Attrition in Digital Academia. SSRG International Journal of Computer Science and Engineering 2023, 10, 1–9. [Google Scholar] [CrossRef]
- Baron, M.J.S.; Sanabria, J.S.G.; Diaz, J.E.E. Deep Neural Network (DNN) applied to the analysis of student dropout in a Higher Education Institution (HEI). Investigación e Innovación en Ingenierías 2022, 10, 202–214. [Google Scholar] [CrossRef]
- Al Amoudi, S.; Alhothali, A.; Mirza, R.; Assalahi, H.; Aldosemani, T. Click-Based Representation Learning Framework of Student Navigational Behavior in MOOCs. IEEE Access 2024. [Google Scholar] [CrossRef]
- Rizwan, S.; Nee, C.K.; Garfan, S. Identifying the factors affecting student academic performance and engagement prediction in mooc using deep learning: A systematic literature review. IEEE Access 2025. [Google Scholar] [CrossRef]
- Xia, X.; Qi, W. Driving STEM learning effectiveness: dropout prediction and intervention in MOOCs based on one novel behavioral data analysis approach. Humanities and Social Sciences Communications 2024, 11, 1–19. [Google Scholar] [CrossRef]
- Agarwal, A.; Mishra, D.S.; Kolekar, S.V. Knowledge-based recommendation system using semantic web rules based on Learning styles for MOOCs. Cogent Engineering 2022, 9, 2022568. [Google Scholar] [CrossRef]
- Wu, S.; Cao, Y.; Cui, J.; Li, R.; Qian, H.; Jiang, B.; Zhang, W. A comprehensive exploration of personalized learning in smart education: From student modeling to personalized recommendations. arXiv preprint arXiv:2402.01666, arXiv:2402.01666 2024. [CrossRef]
- Chanaa, A.; et al. Sentiment analysis on massive open online courses (MOOCs): multi-factor analysis, and machine learning approach. International Journal of Information and Communication Technology Education (IJICTE) 2022, 18, 1–22. [Google Scholar] [CrossRef]
- Chen, Q.; Yu, X.; Liu, N.; Yuan, X.; Wang, Z. Personalized course recommendation based on eye-tracking technology and deep learning. In Proceedings of the 2020 IEEE 7th International Conference on Data Science and Advanced Analytics (DSAA). IEEE; 2020; pp. 692–968. [Google Scholar] [CrossRef]
- Wang, Y.; Lai, Y.; Huang, X. Innovations in Online Learning Analytics: A Review of Recent Research and Emerging Trends. IEEE Access 2024. [Google Scholar] [CrossRef]
- Ismanto, E.; Ab Ghani, H.; Saleh, N.I.M.; Al Amien, J.; Gunawan, R. Recent systematic review on student performance prediction using backpropagation algorithms. Telkomnika (Telecommunication Computing Electronics and Control) 2022, 20, 597–606. [Google Scholar] [CrossRef]
- Yuan, J.; Qiu, X.; Wu, J.; Guo, J.; Li, W.; Wang, Y.G. Integrating behavior analysis with machine learning to predict online learning performance: A scientometric review and empirical study. arXiv preprint arXiv:2406.11847, arXiv:2406.11847 2024. [CrossRef]
- Li, Y.; Wang, X.; Chen, F.; Zhao, B.; Fu, Q. Online Learning Behavior Analysis and Prediction Based on Spiking Neural Networks. Journal of Social Computing 2024, 5, 180–193. [Google Scholar] [CrossRef]
- Althibyani, H.A. Predicting student success in MOOCs: a comprehensive analysis using machine learning models. PeerJ Computer Science 2024, 10, e2221. [Google Scholar] [CrossRef]
- 2009-2010 ASSISTment Data. https://t.ly/oSggh. Accessed: 2025-07-19.
Figure 1.
Architecture of the TSA-GRU Module.
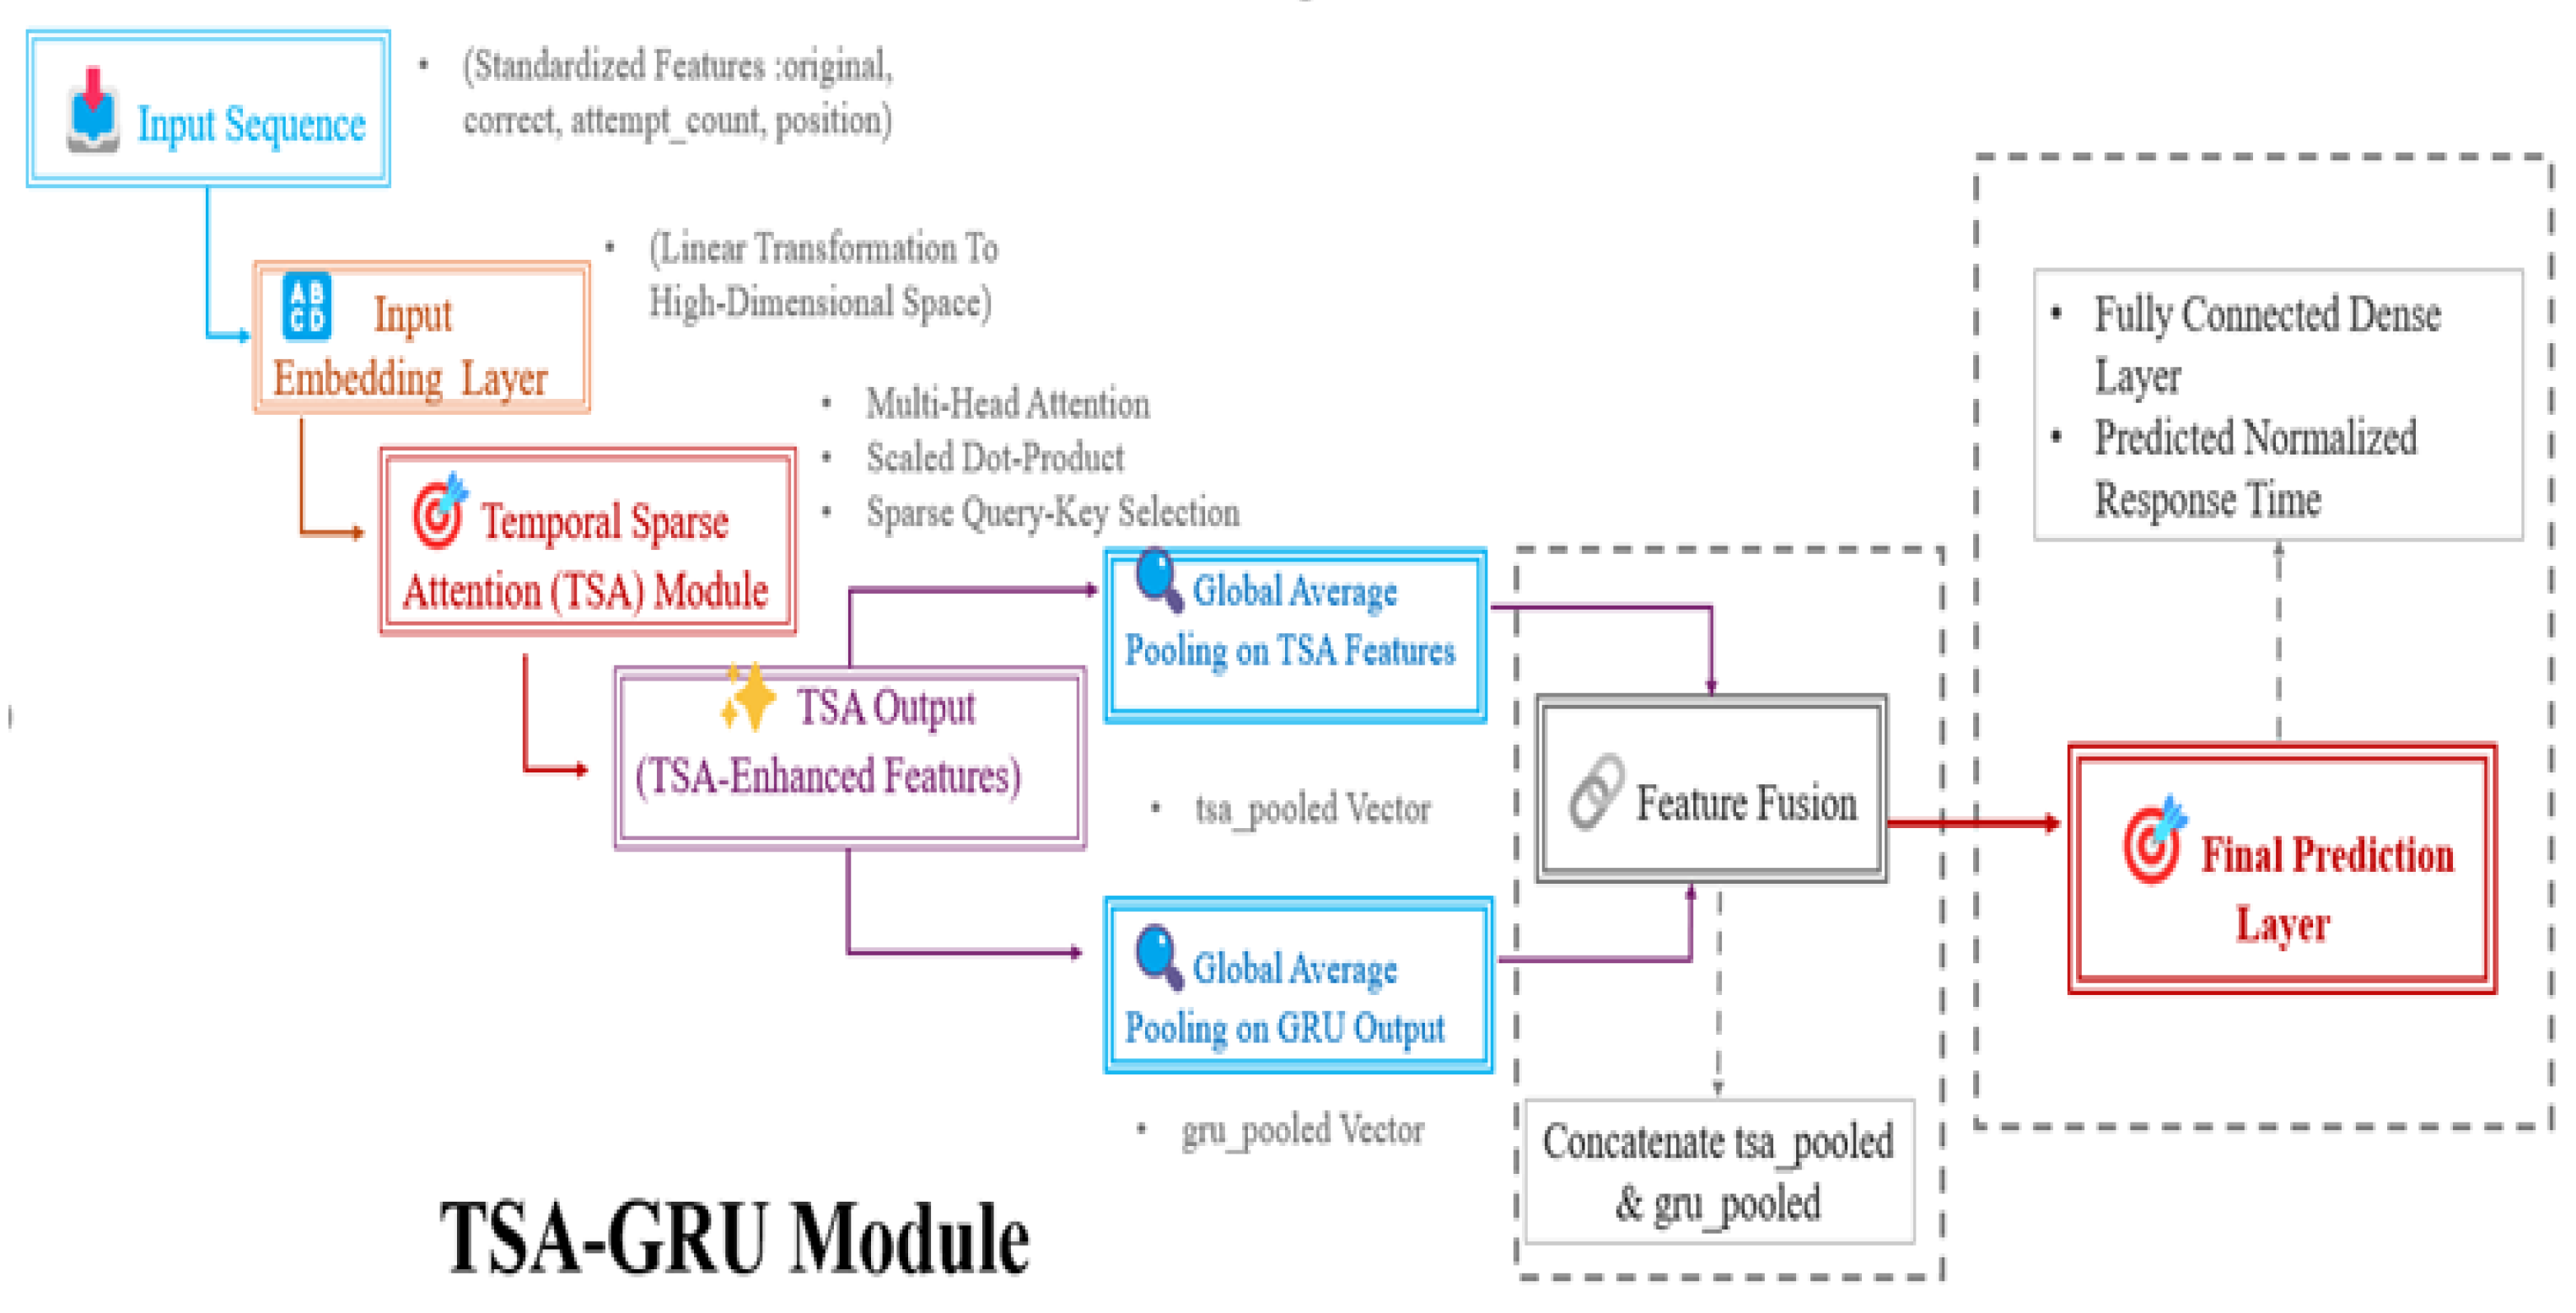
Figure 2.
Layer-wise Architecture and Hyperparameter Details of TSA-GRU.
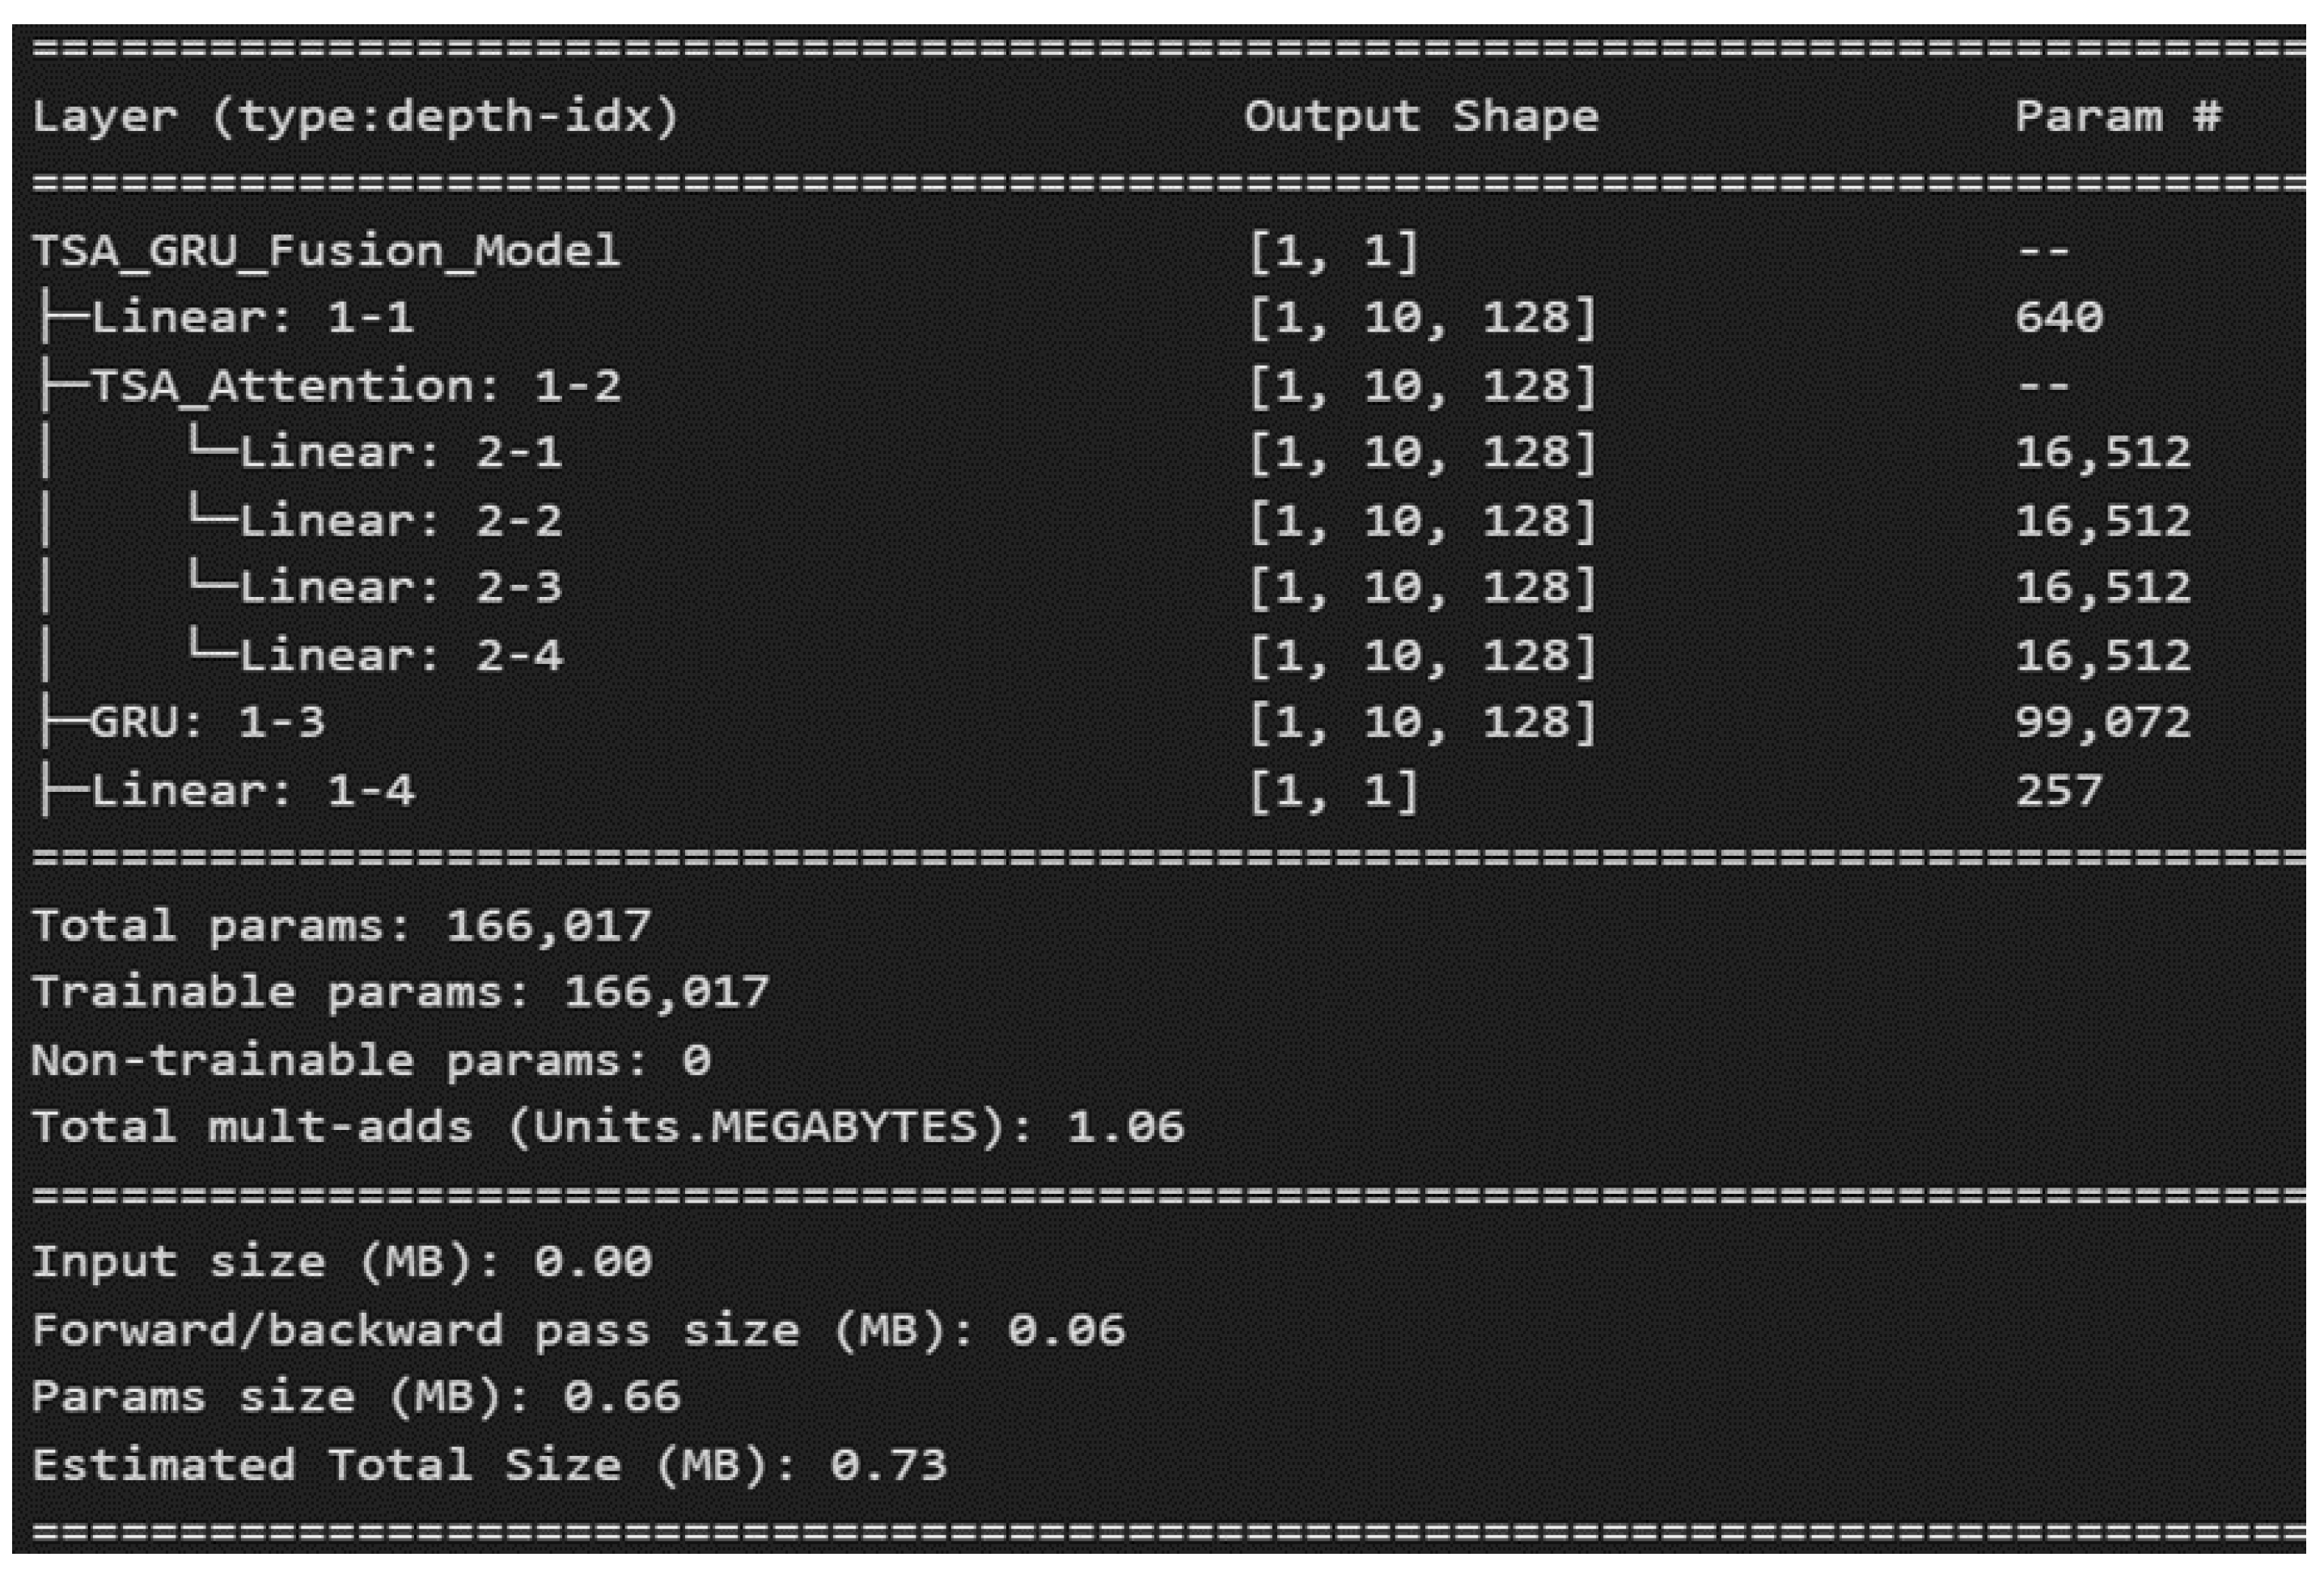
Figure 3.
Epoch-wise Performance Analysis of TSA-Transformer.
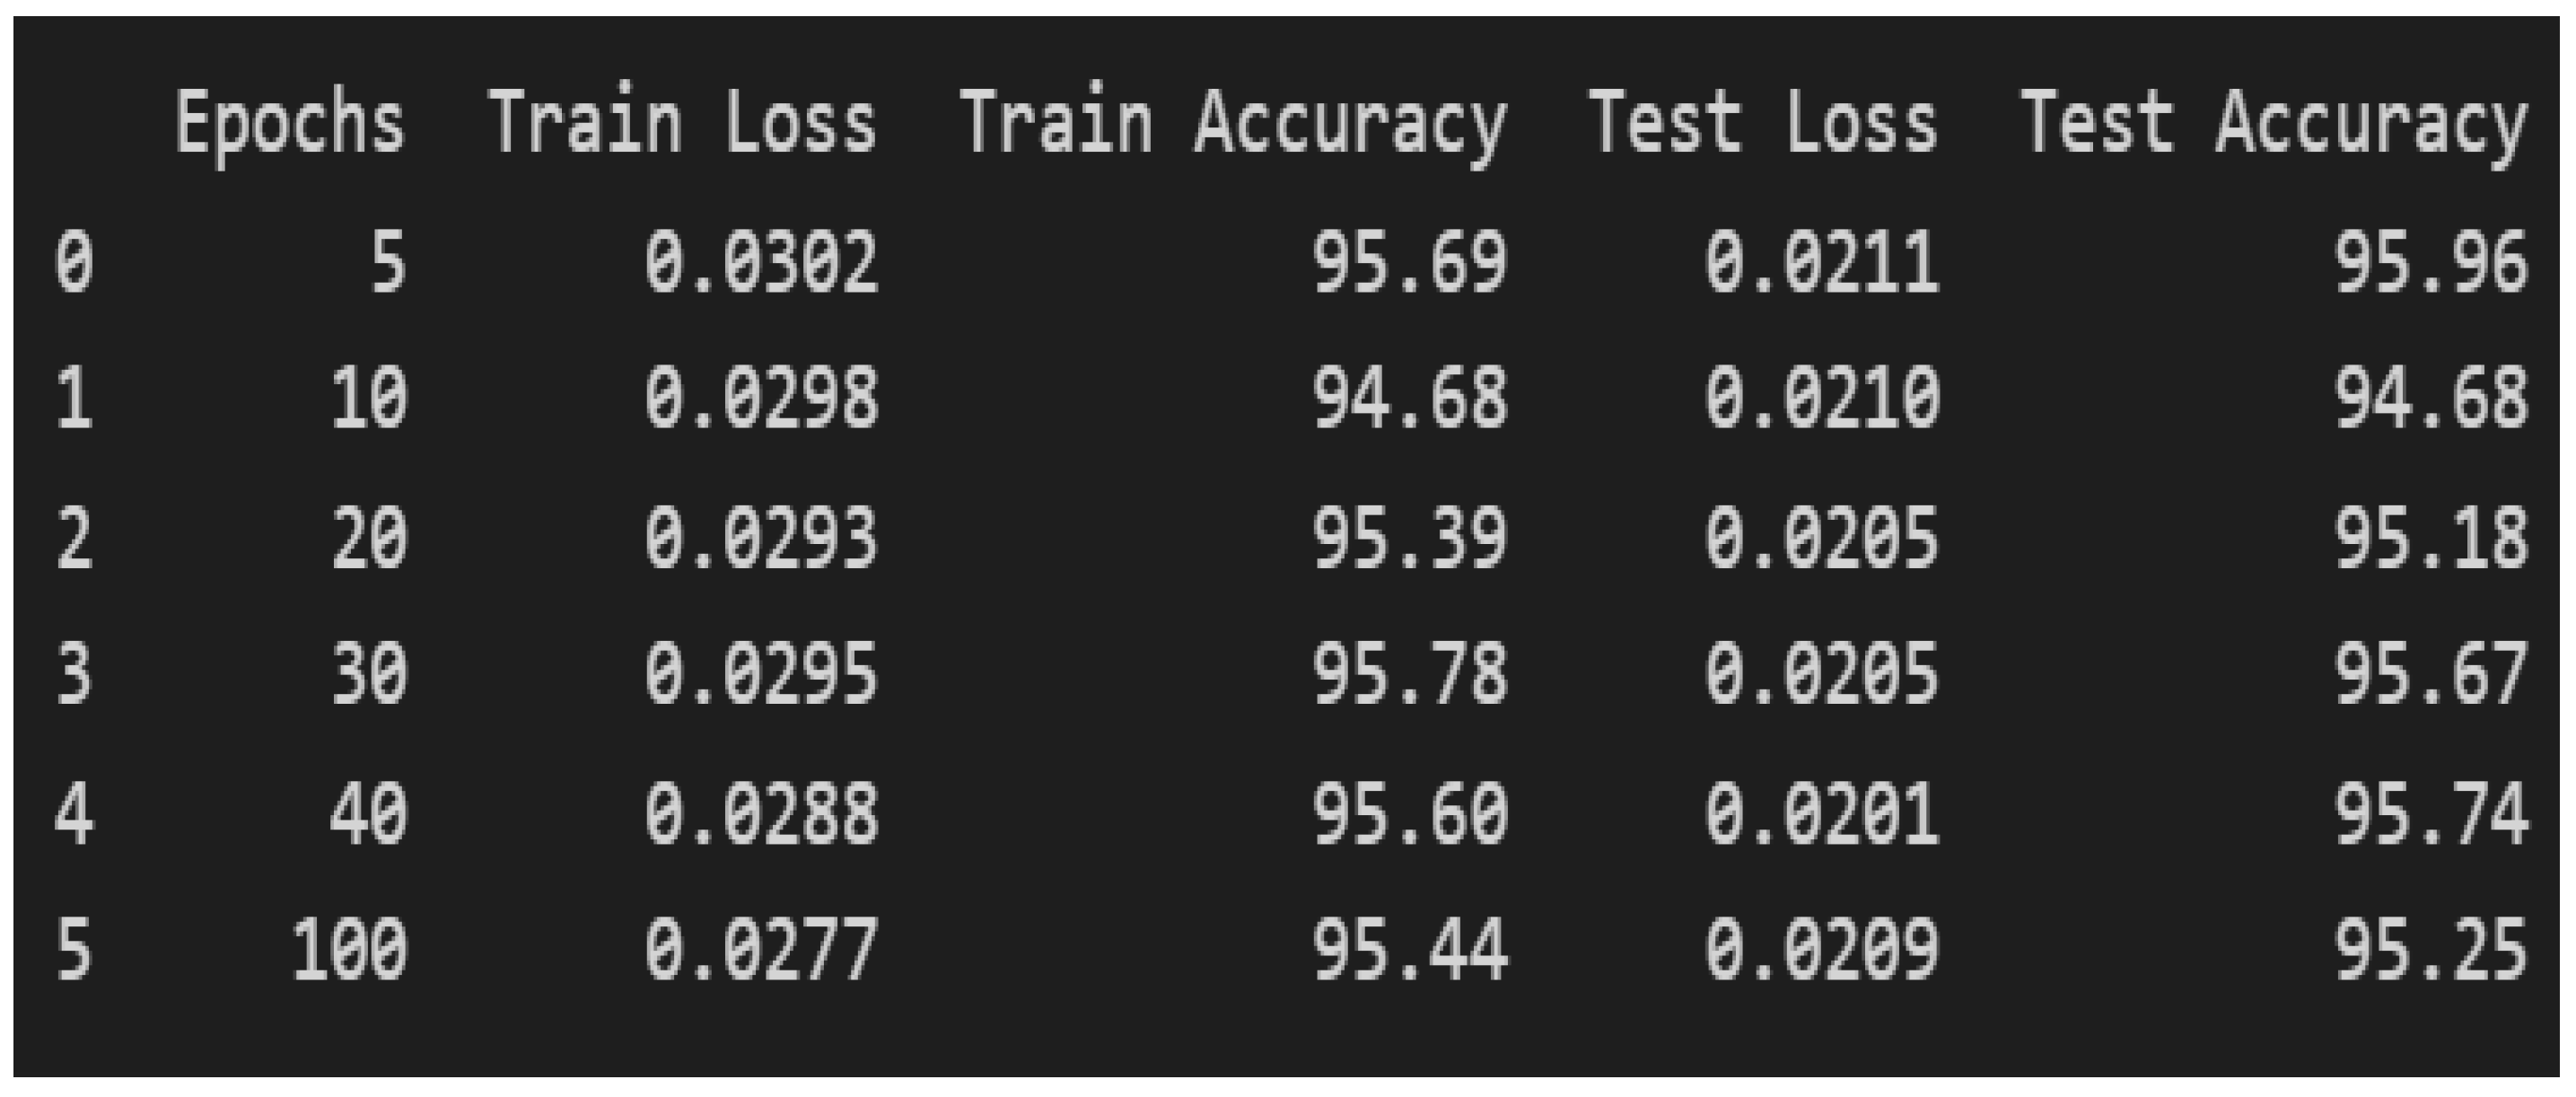
Figure 4.
Accuracy and Loss curves with 5 Epochs.
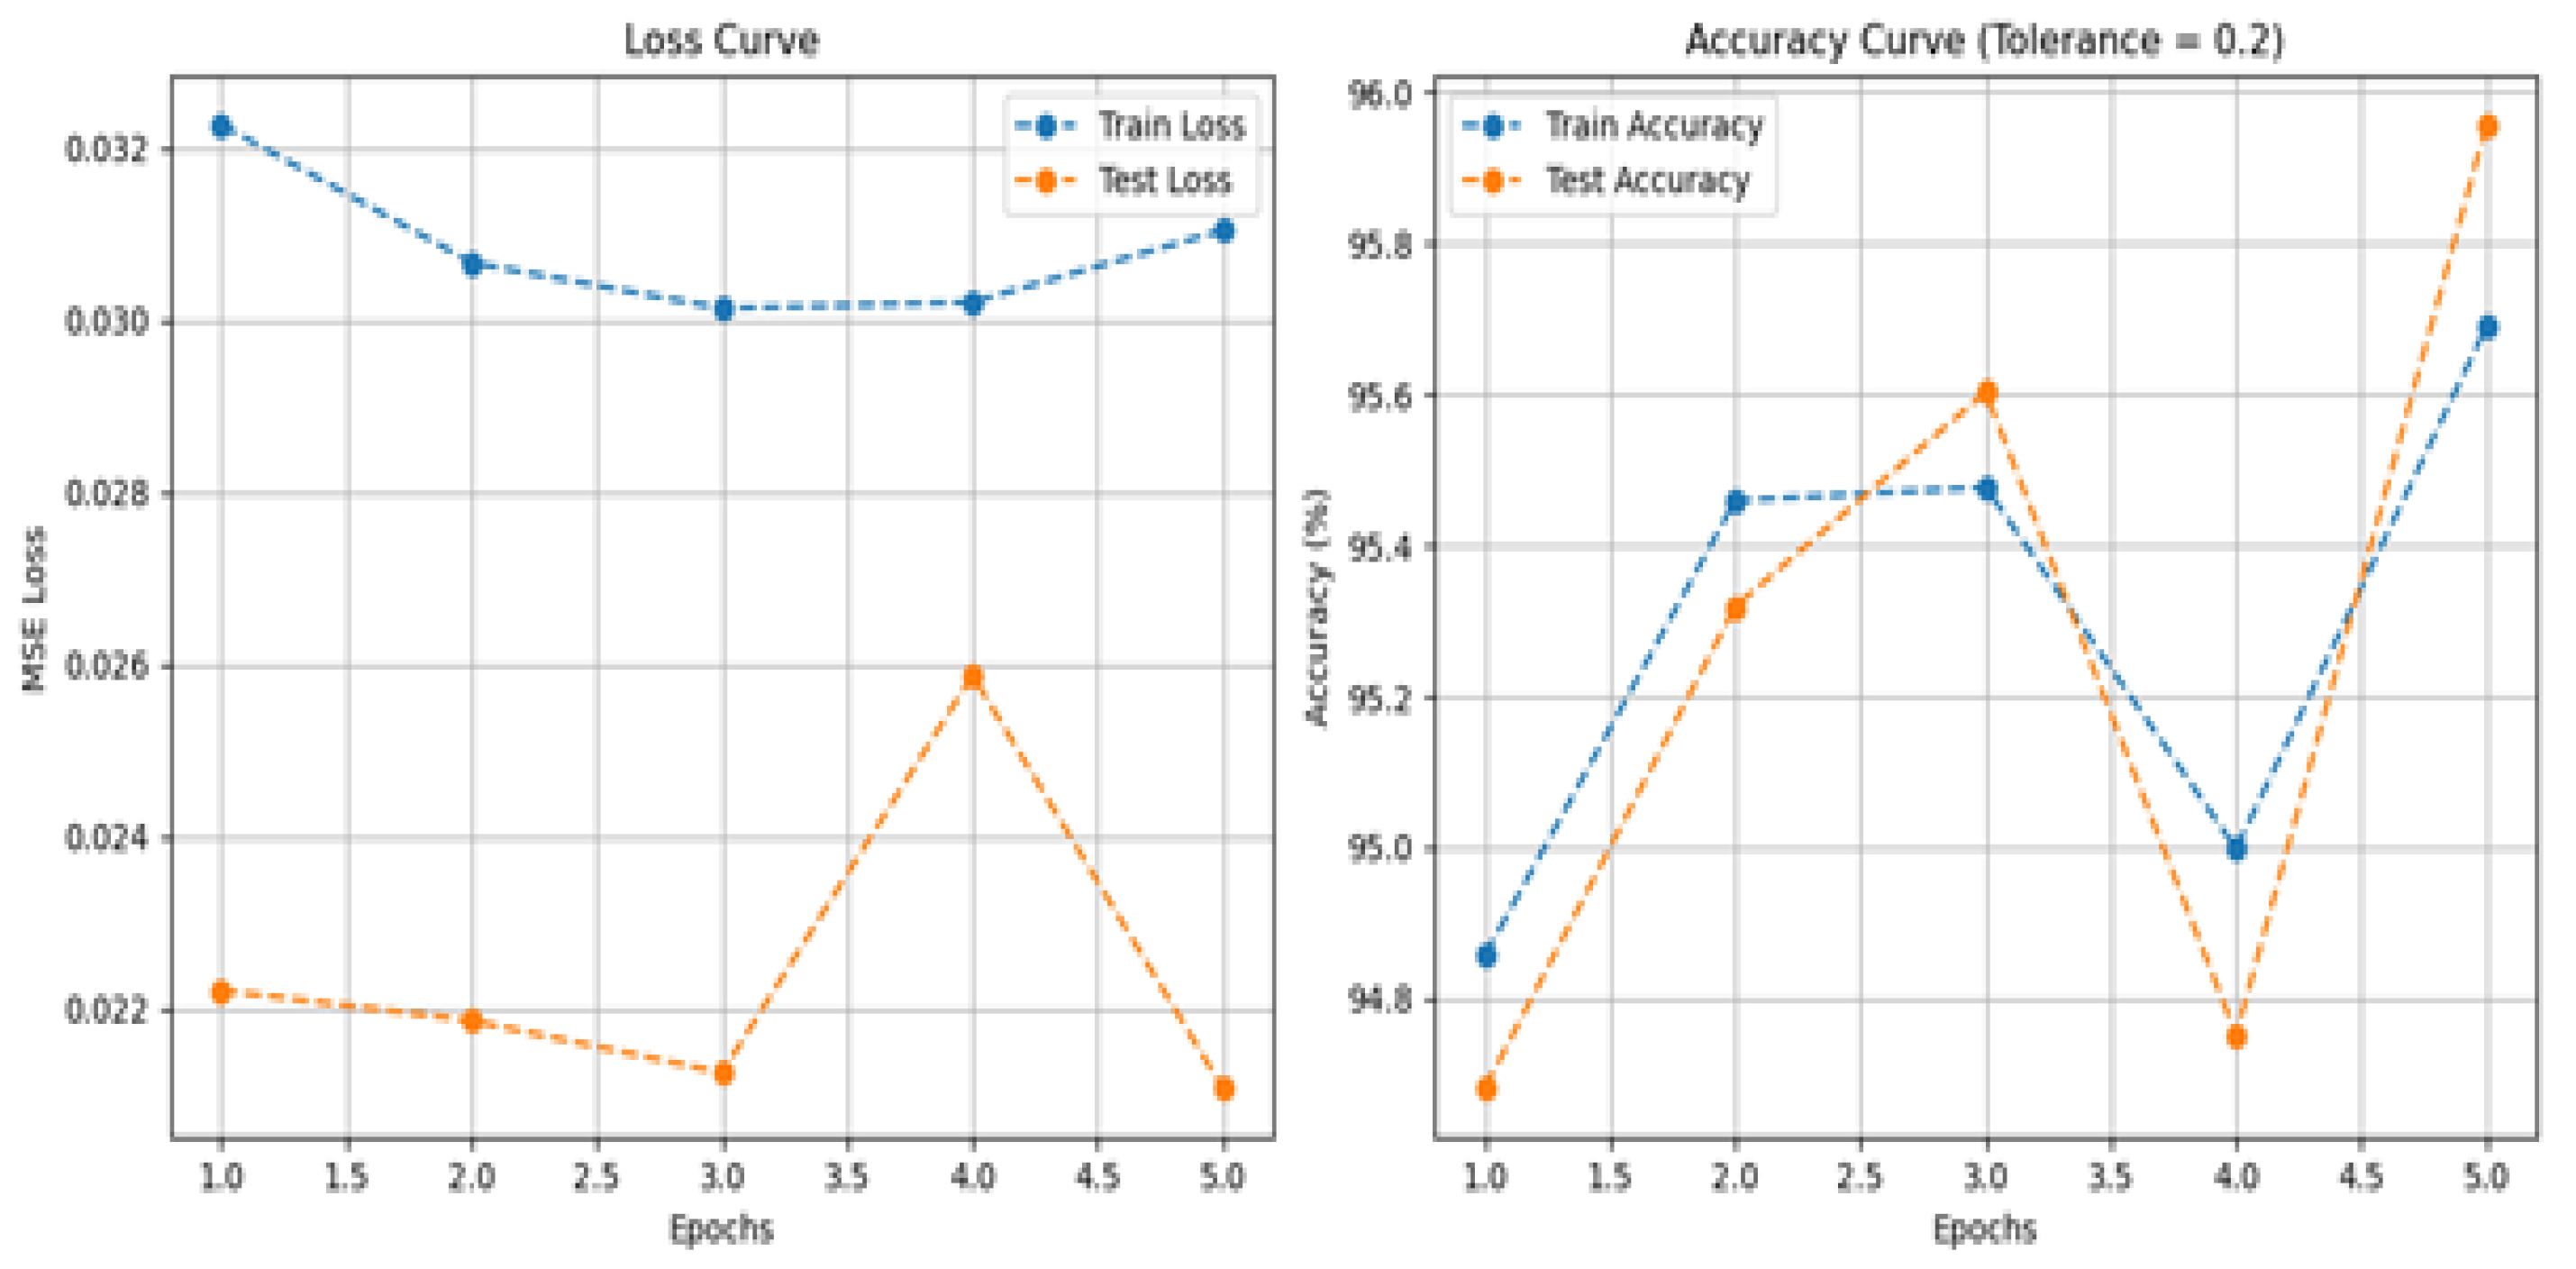
Figure 5.
Accuracy and Loss curves with 10 Epochs.
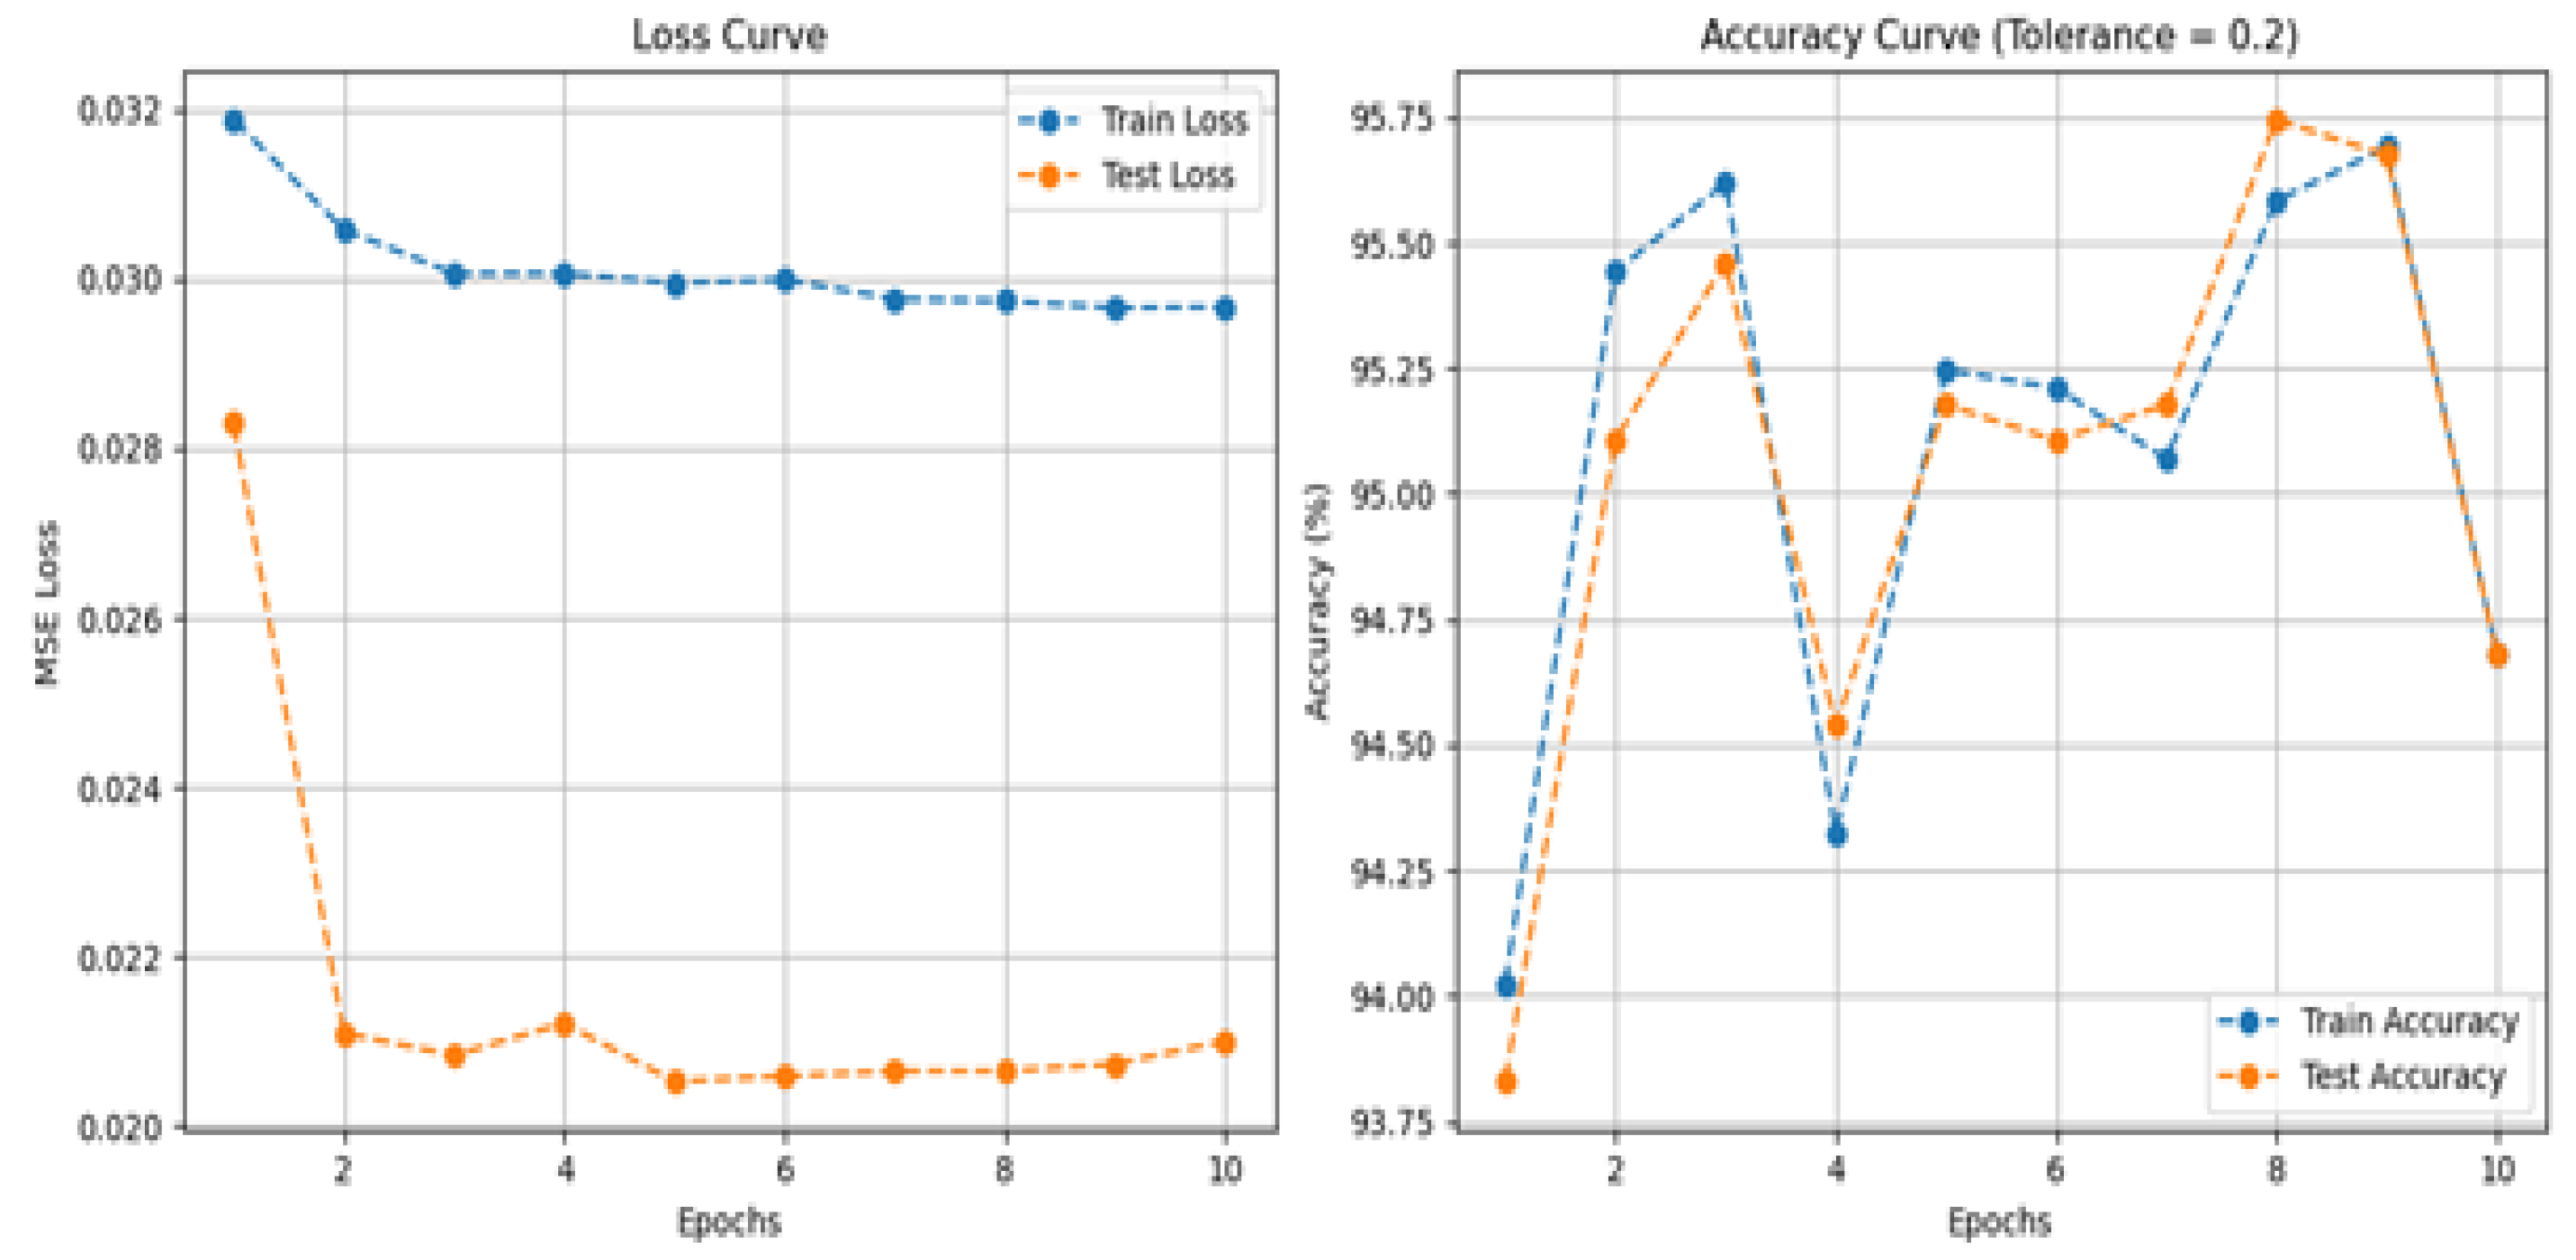
Figure 6.
Accuracy and Loss curves with 20 Epochs.
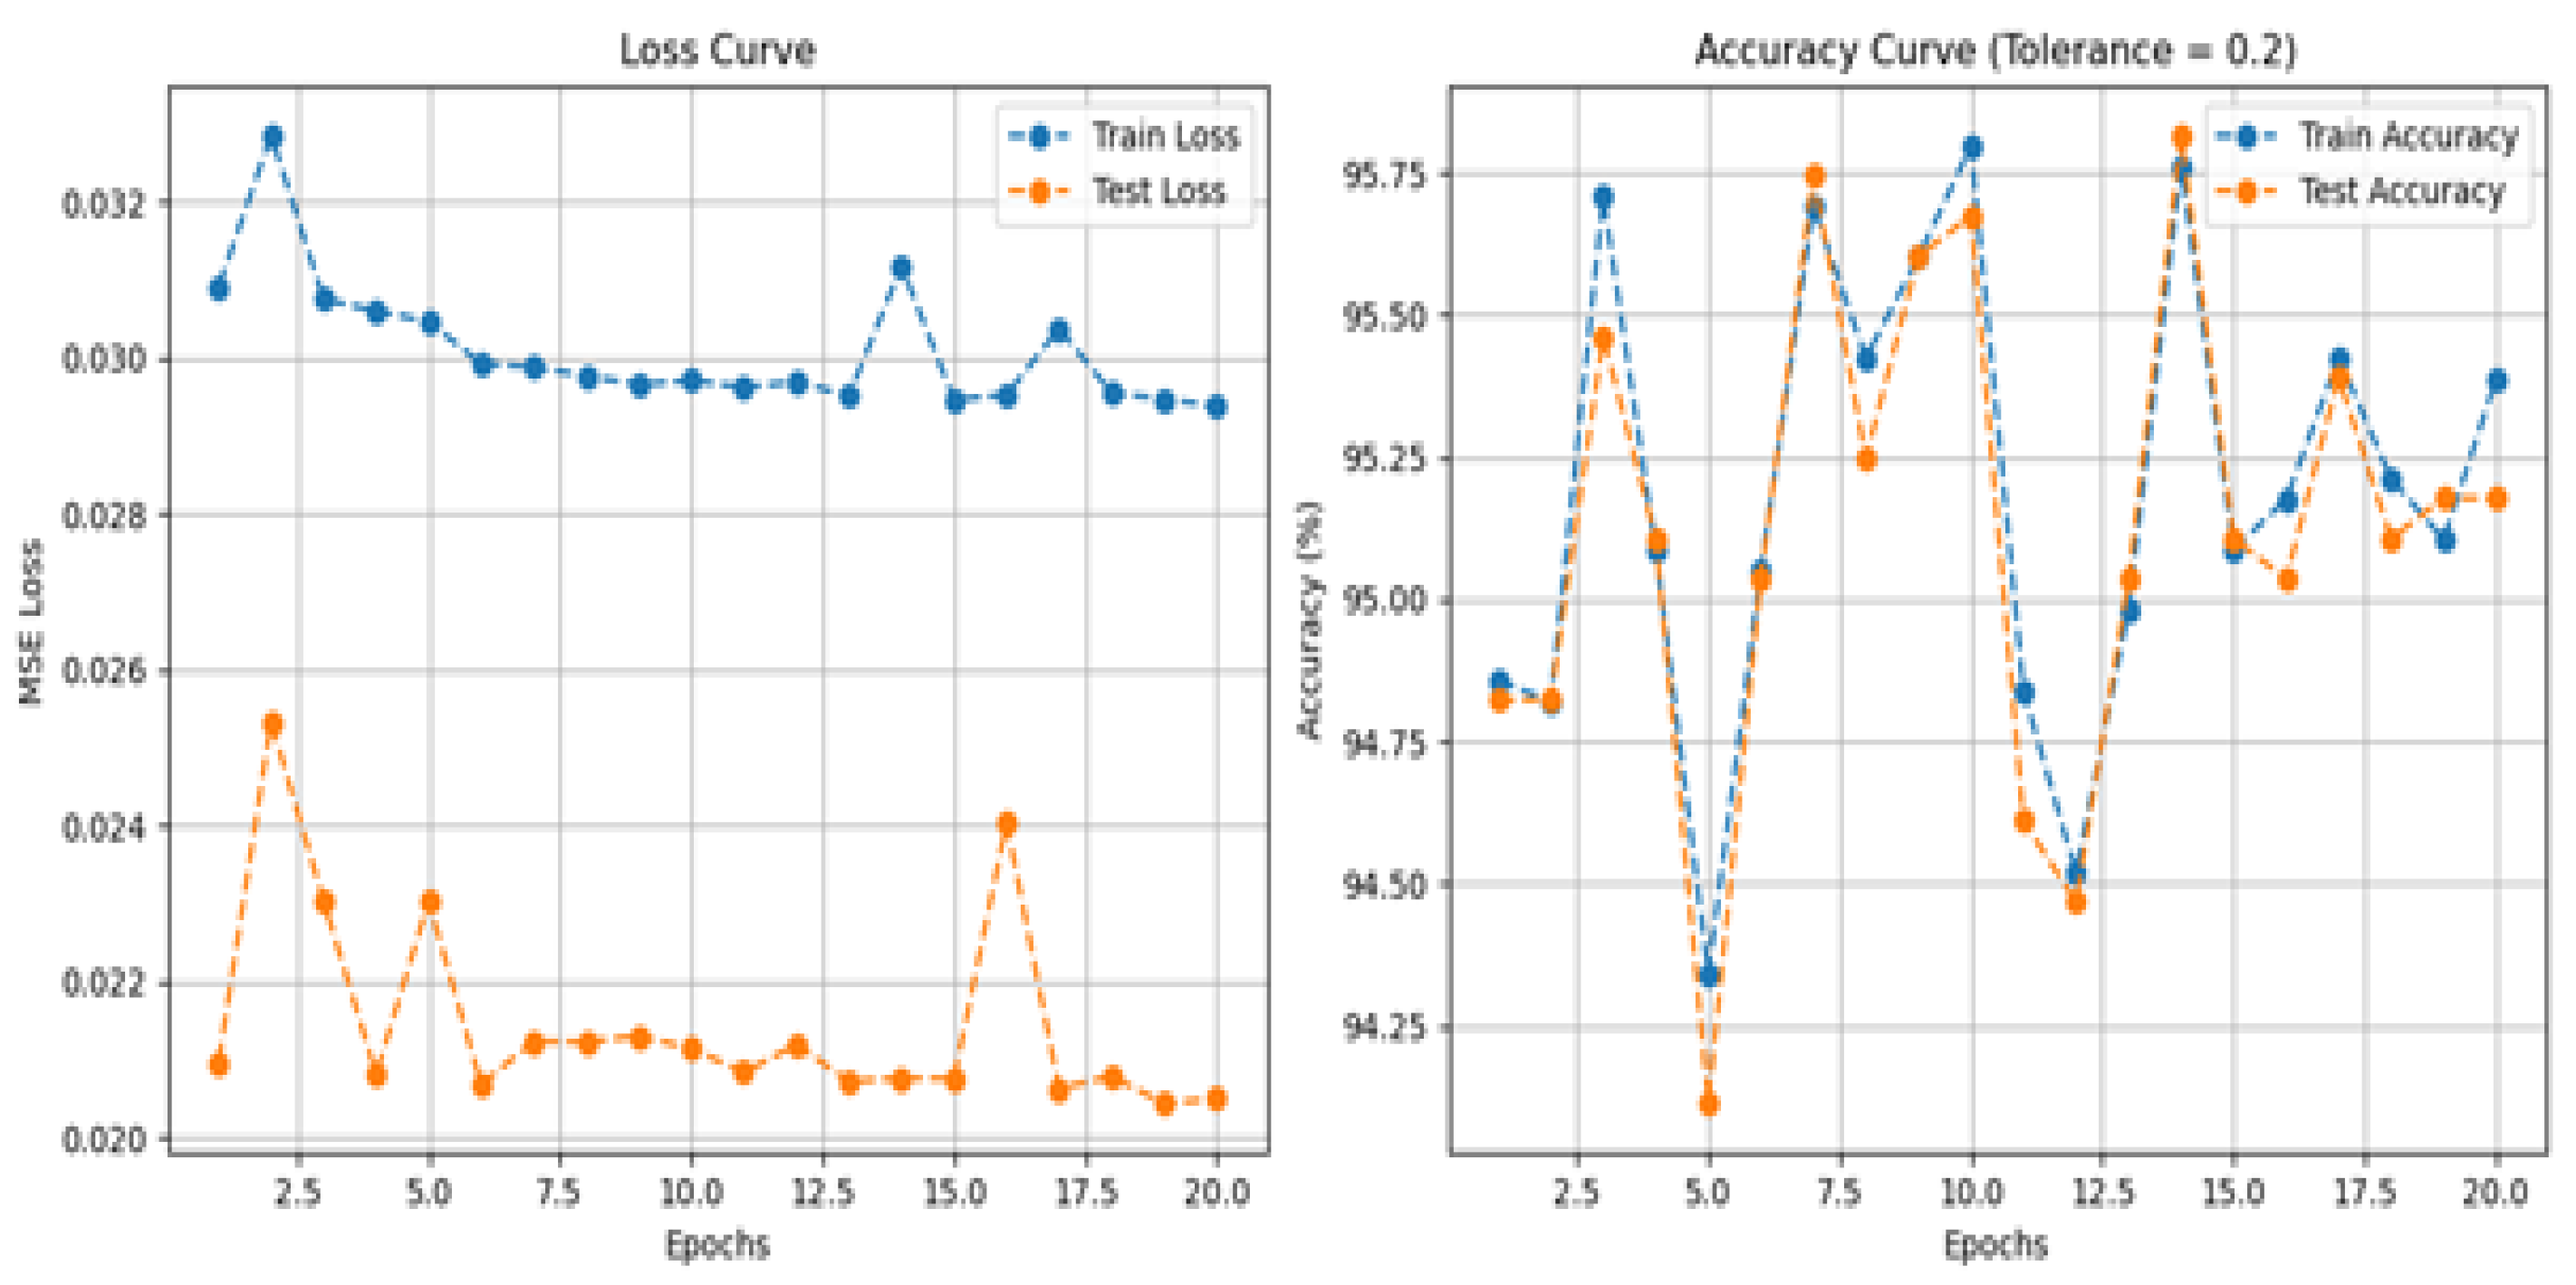
Figure 7.
Accuracy and Loss curves with 30 Epochs.
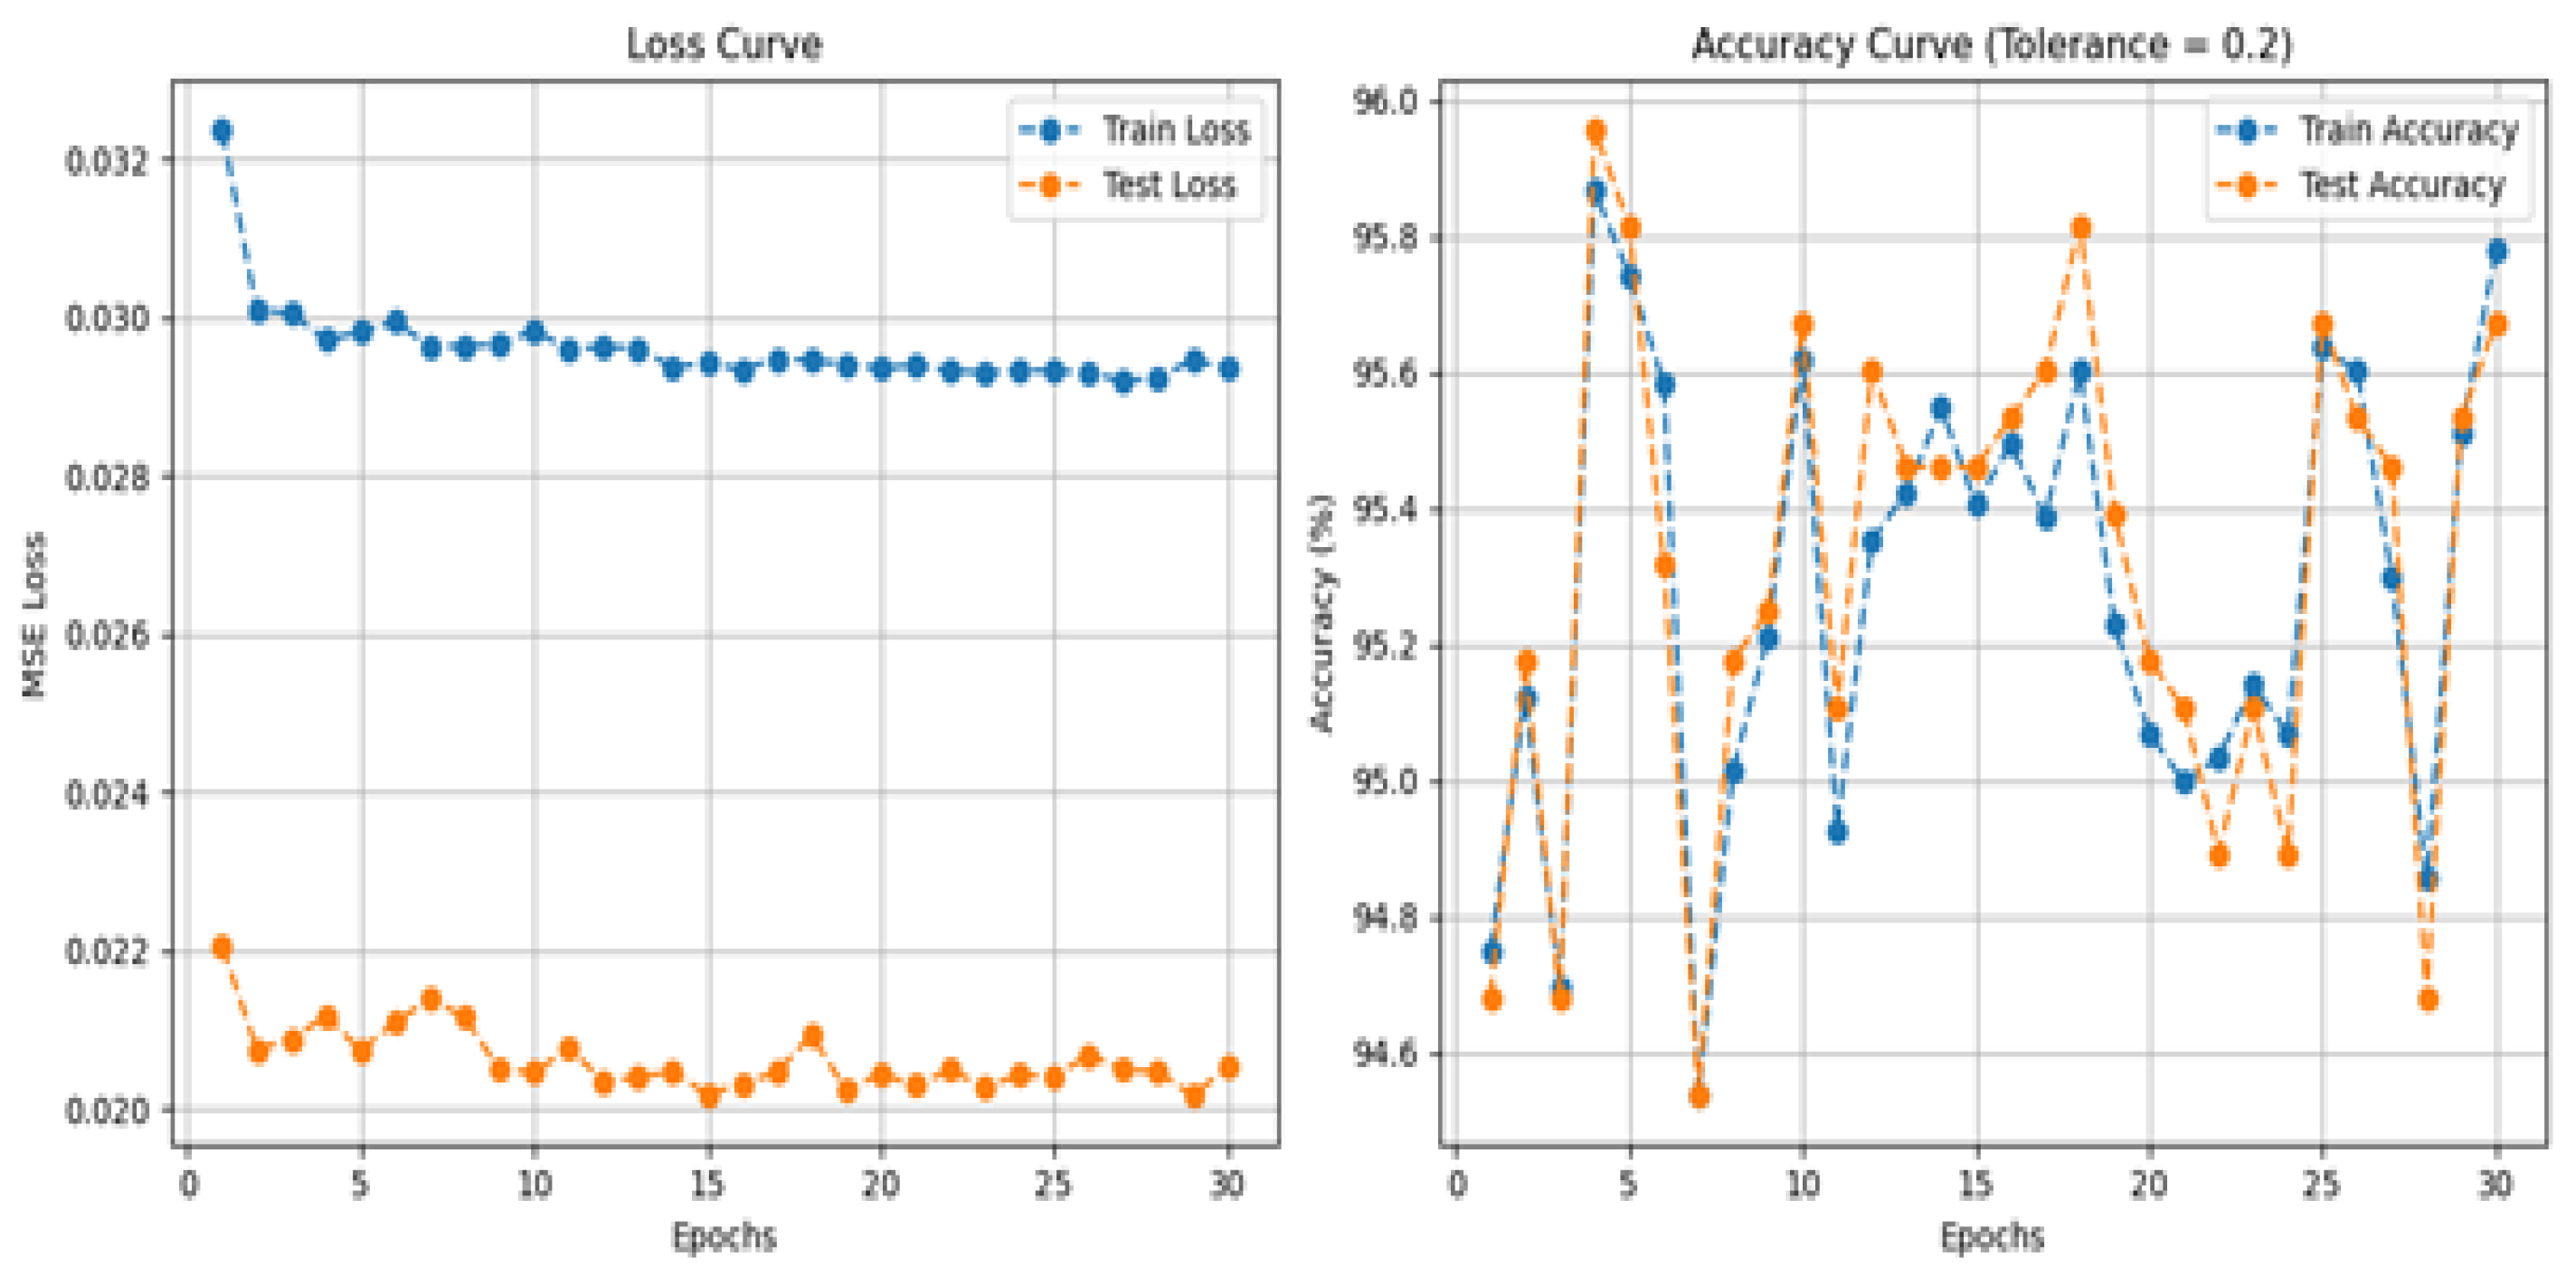
Figure 8.
Accuracy and Loss curves with 40 Epochs.
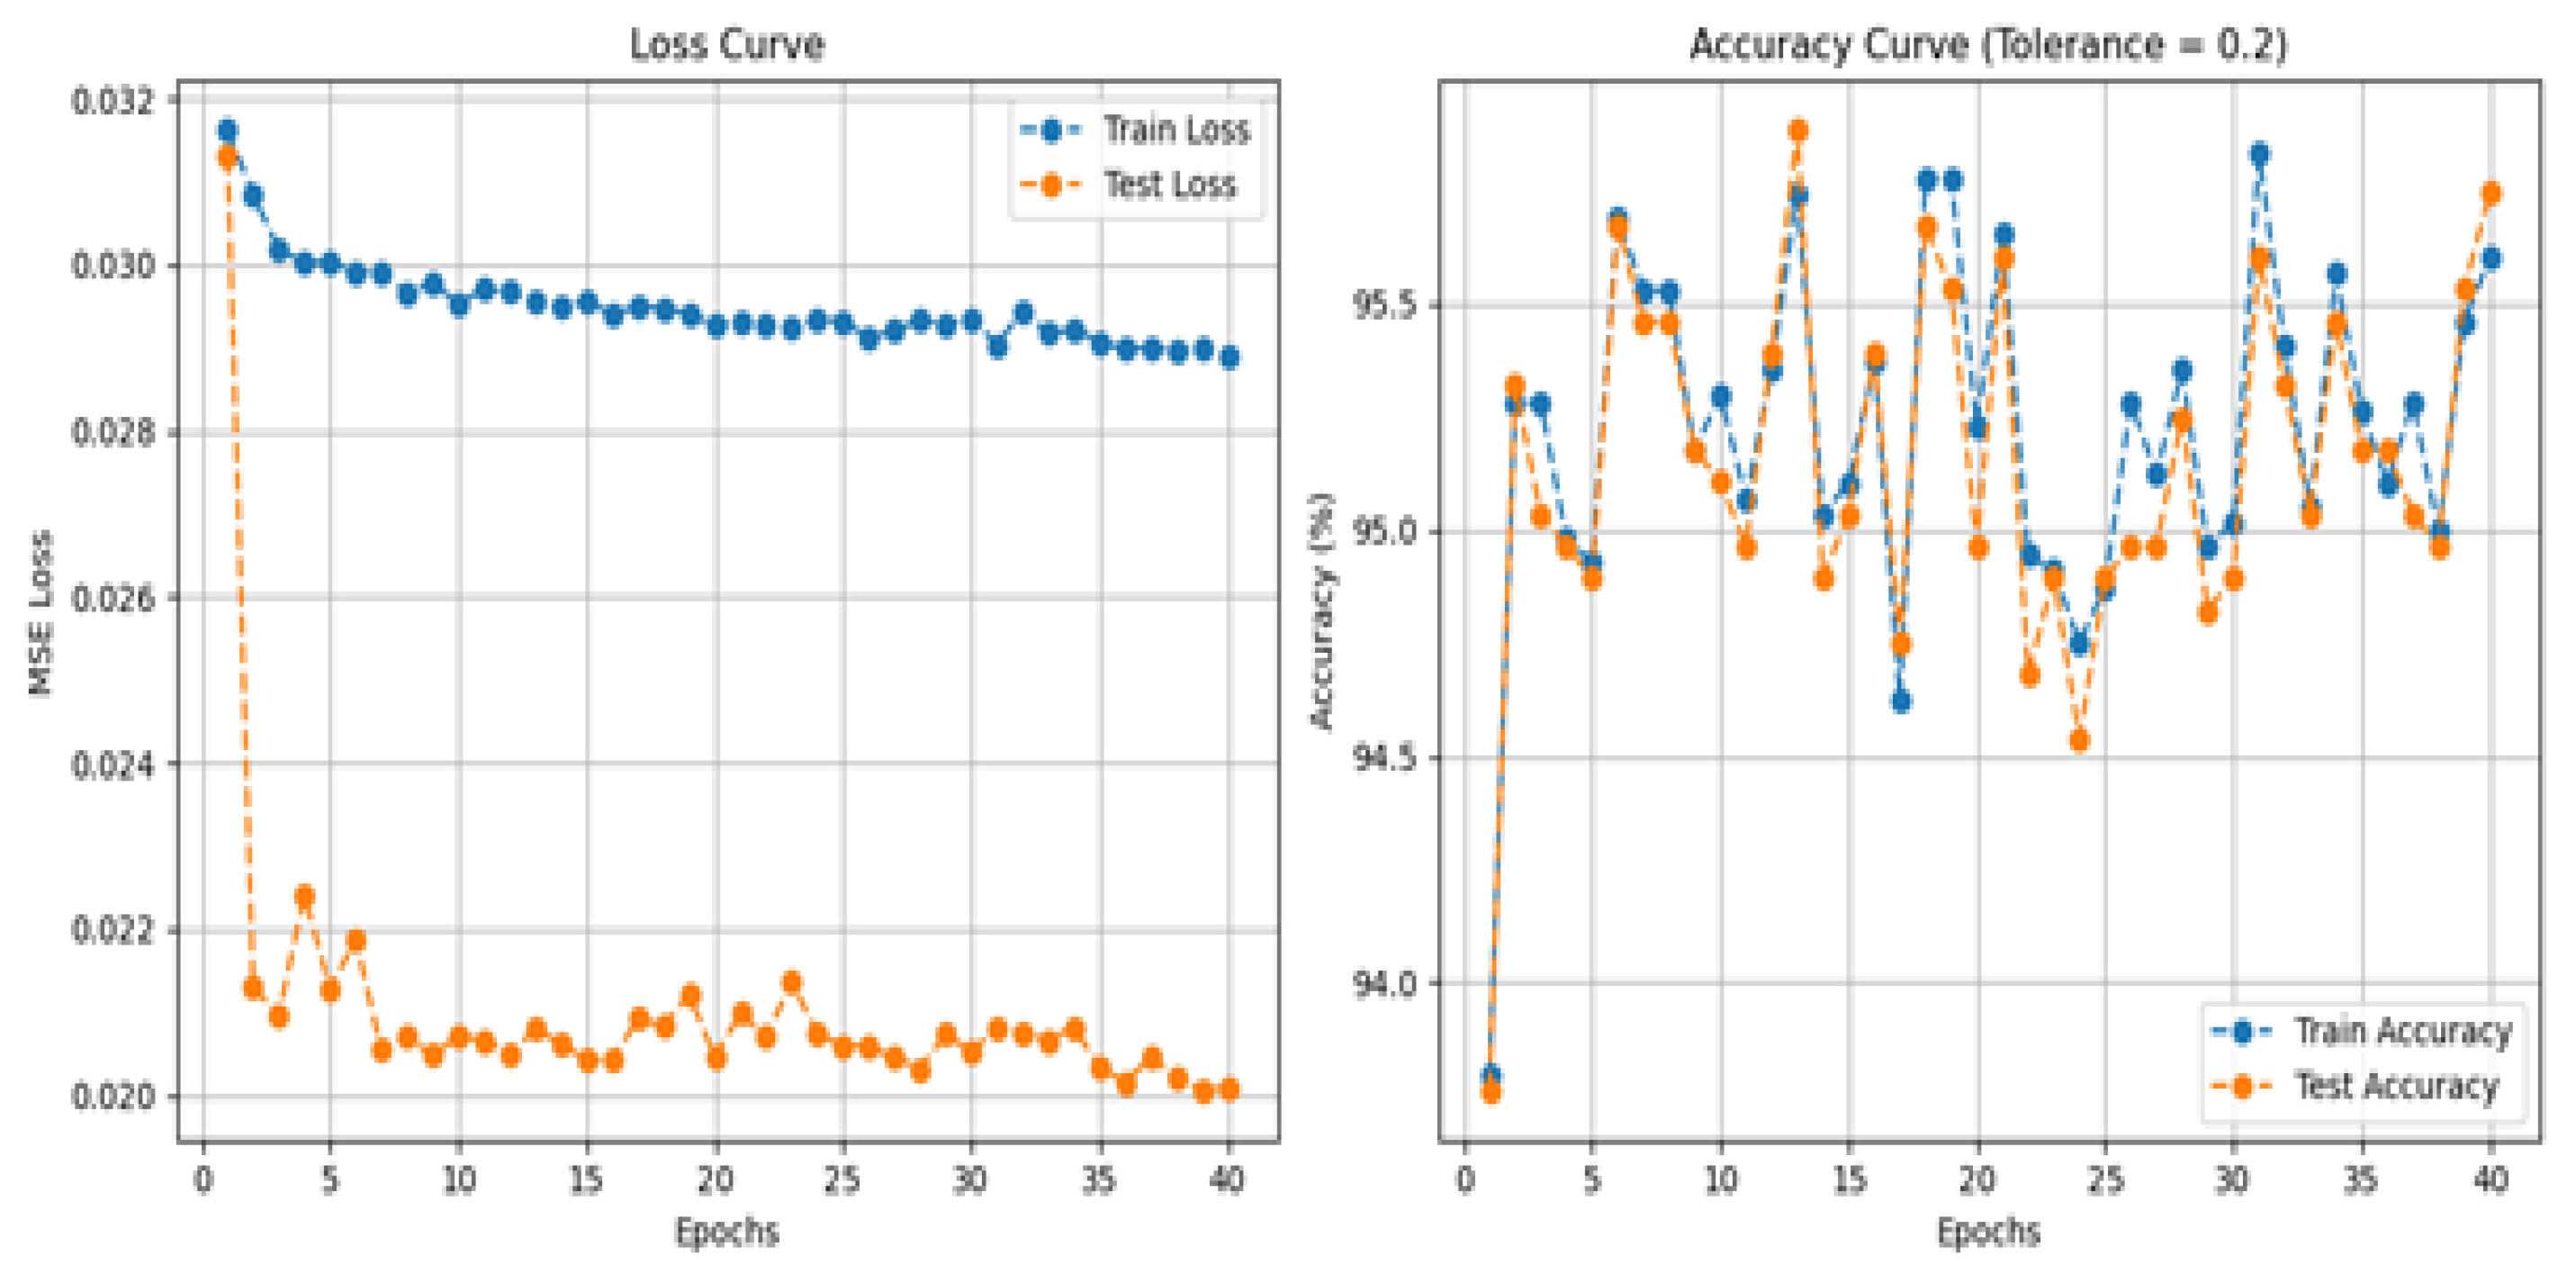
Figure 9.
Accuracy and Loss curves with 100 Epochs.
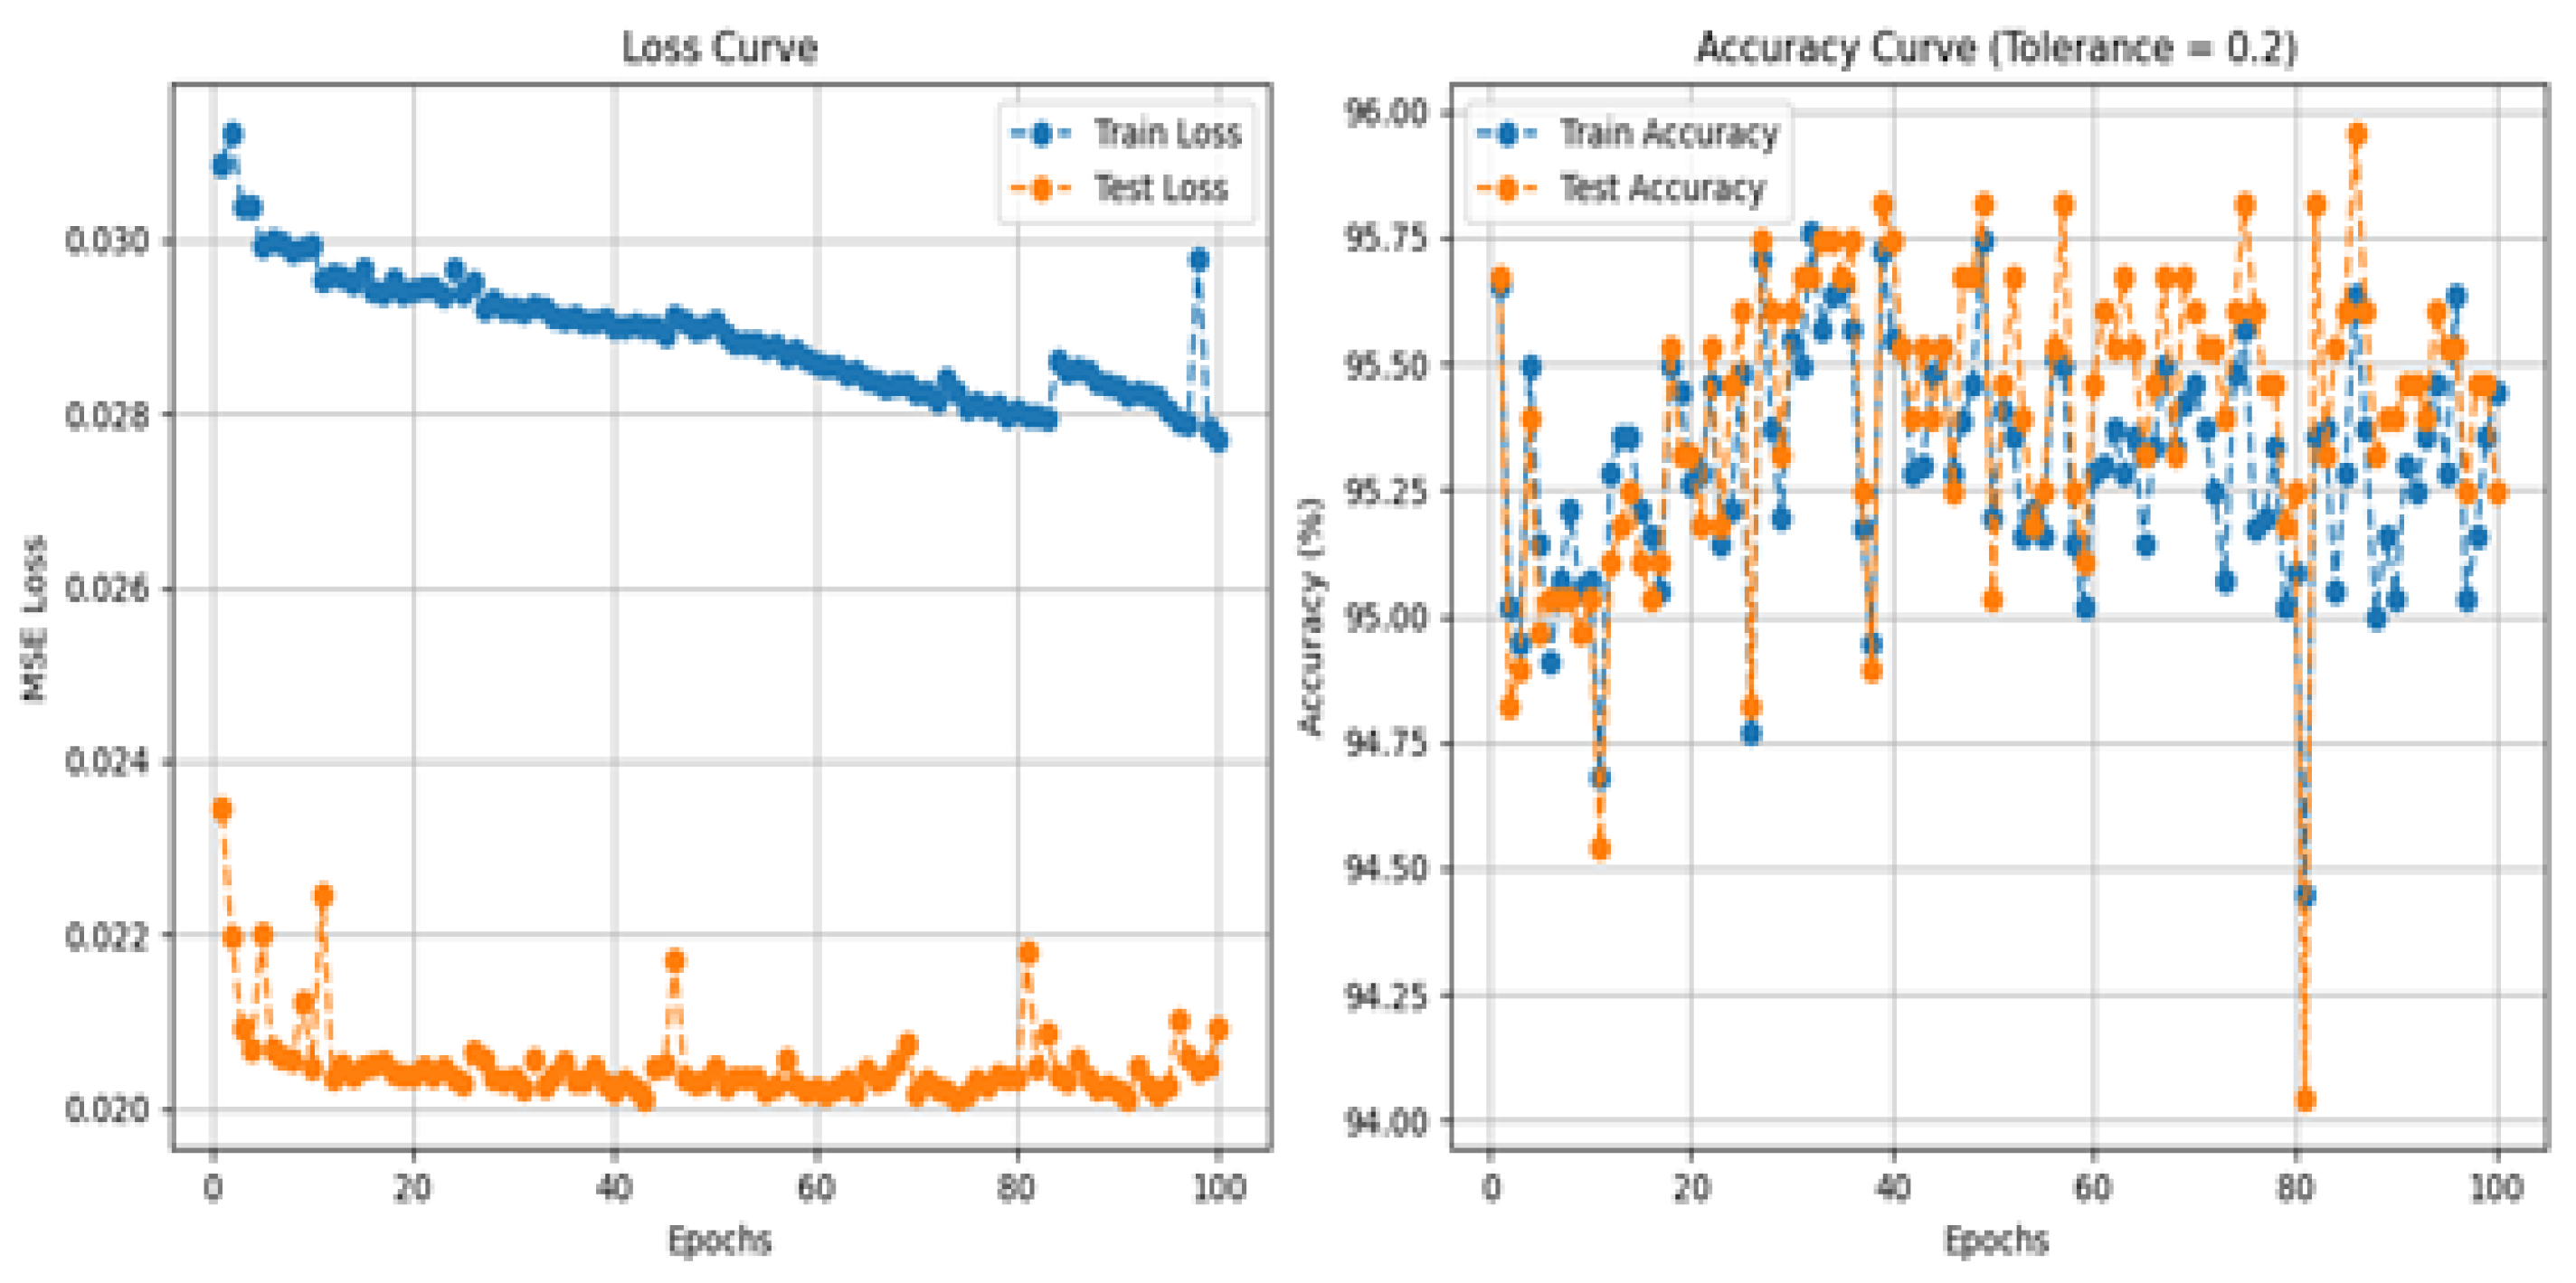
Figure 10.
Accuracy and Loss curves of MSA-GRU.
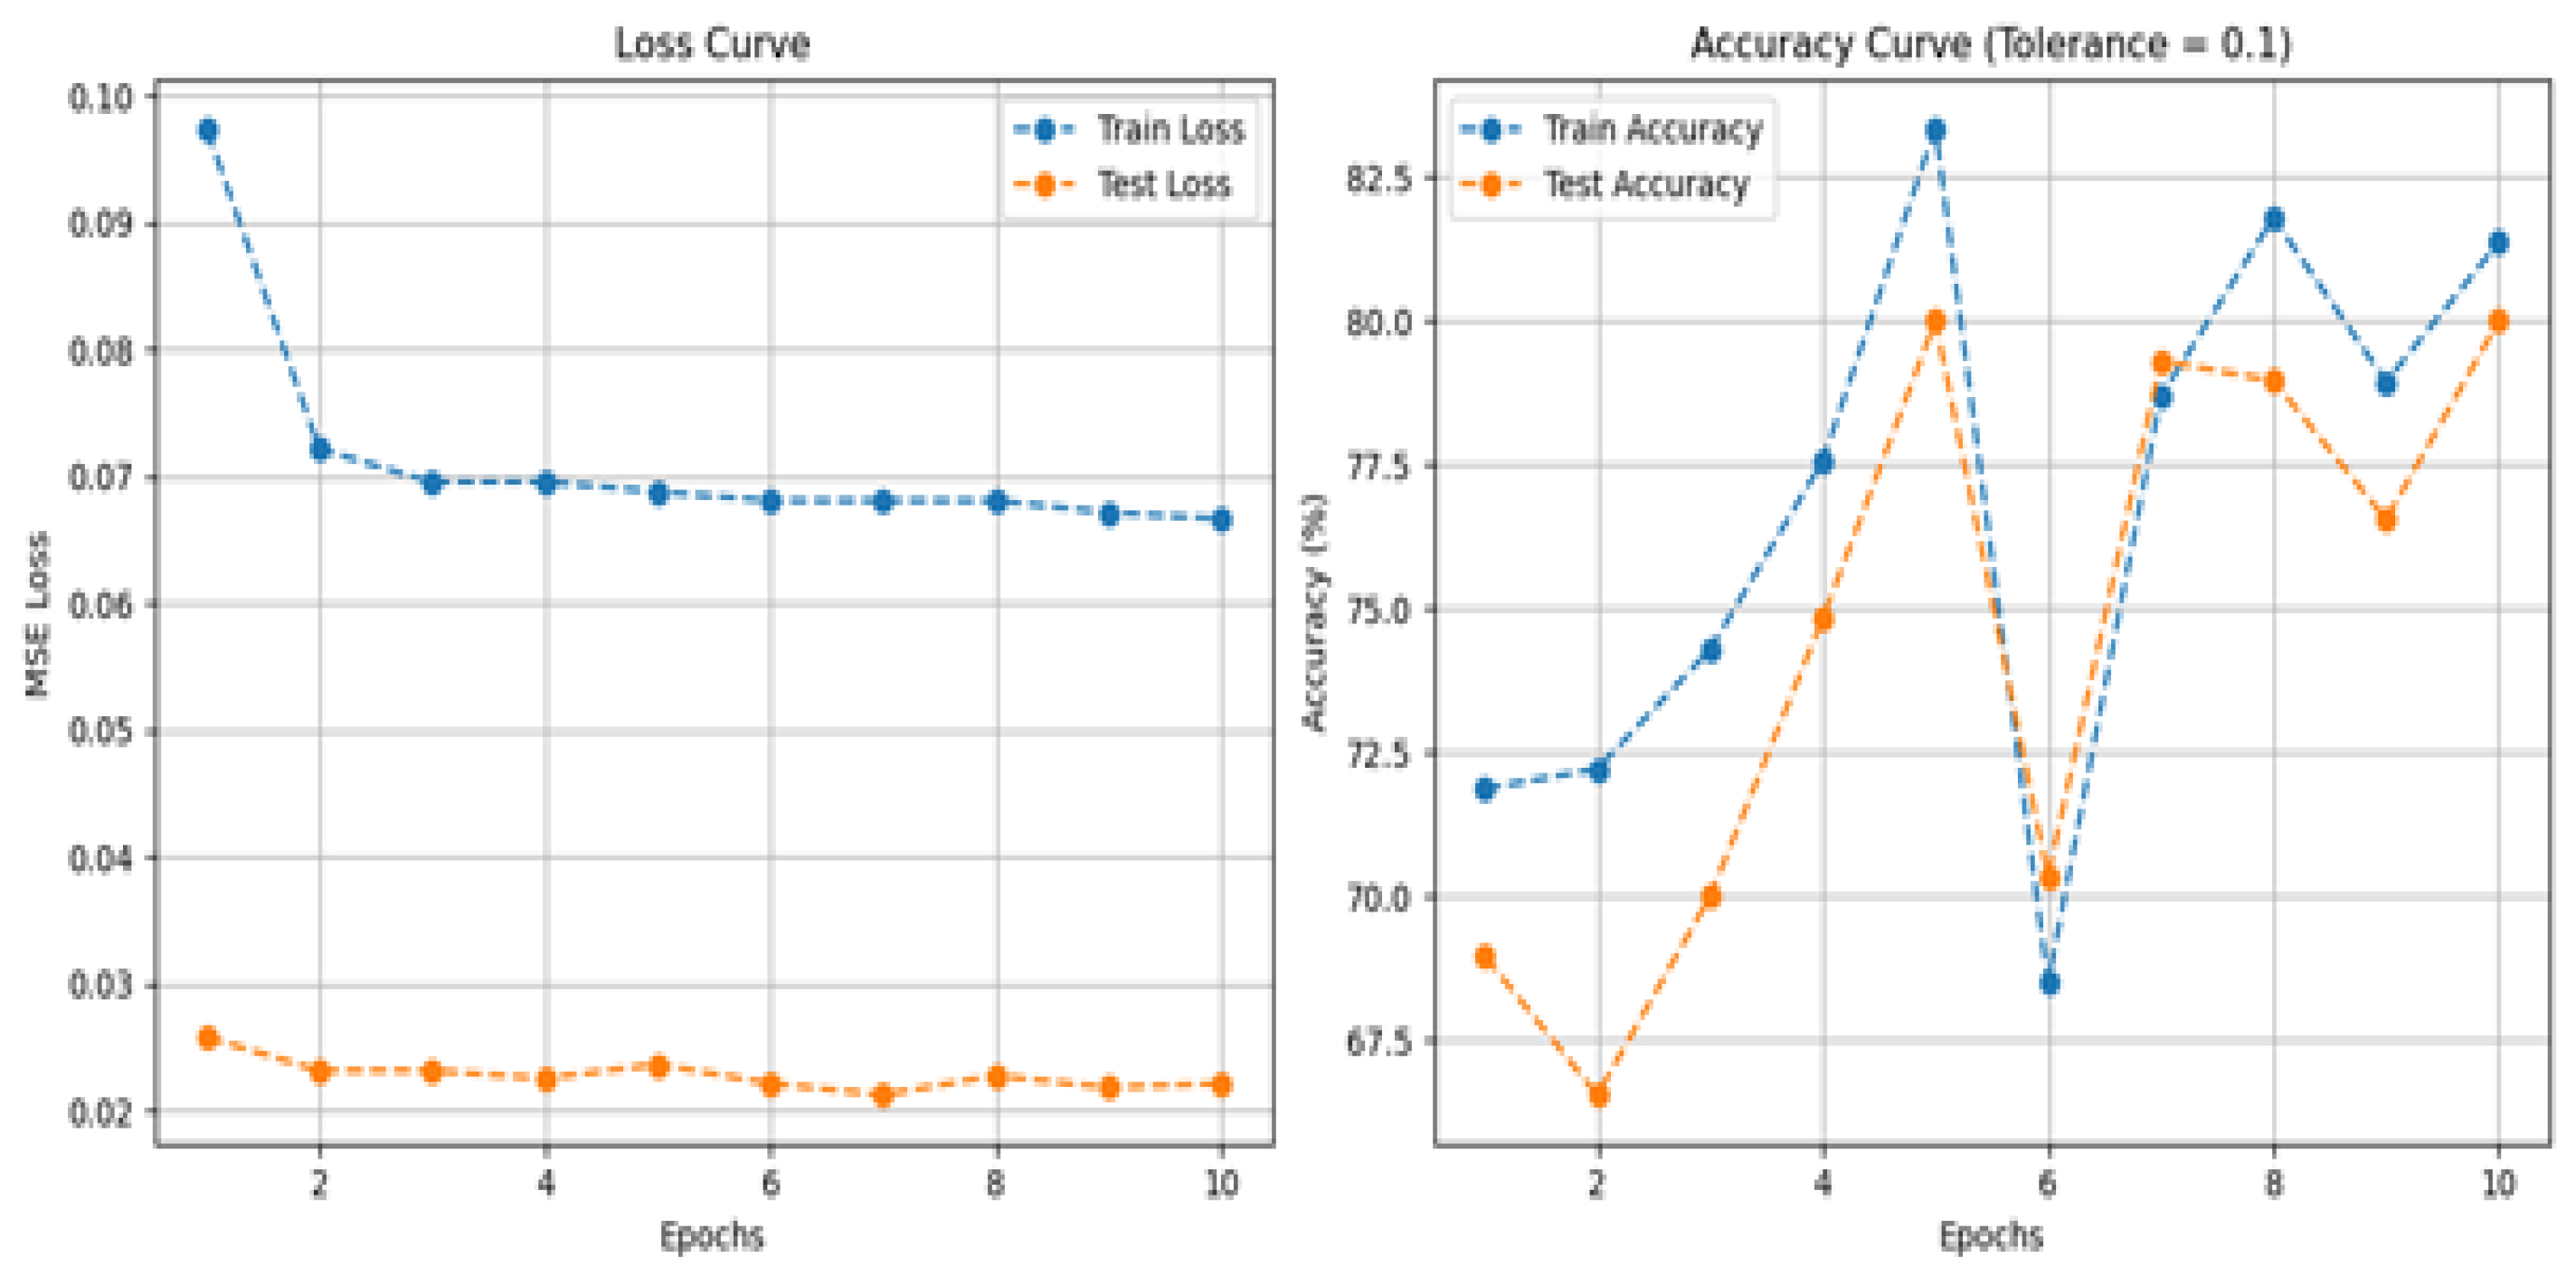
Figure 11.
Accuracy and Loss curves of BKT.
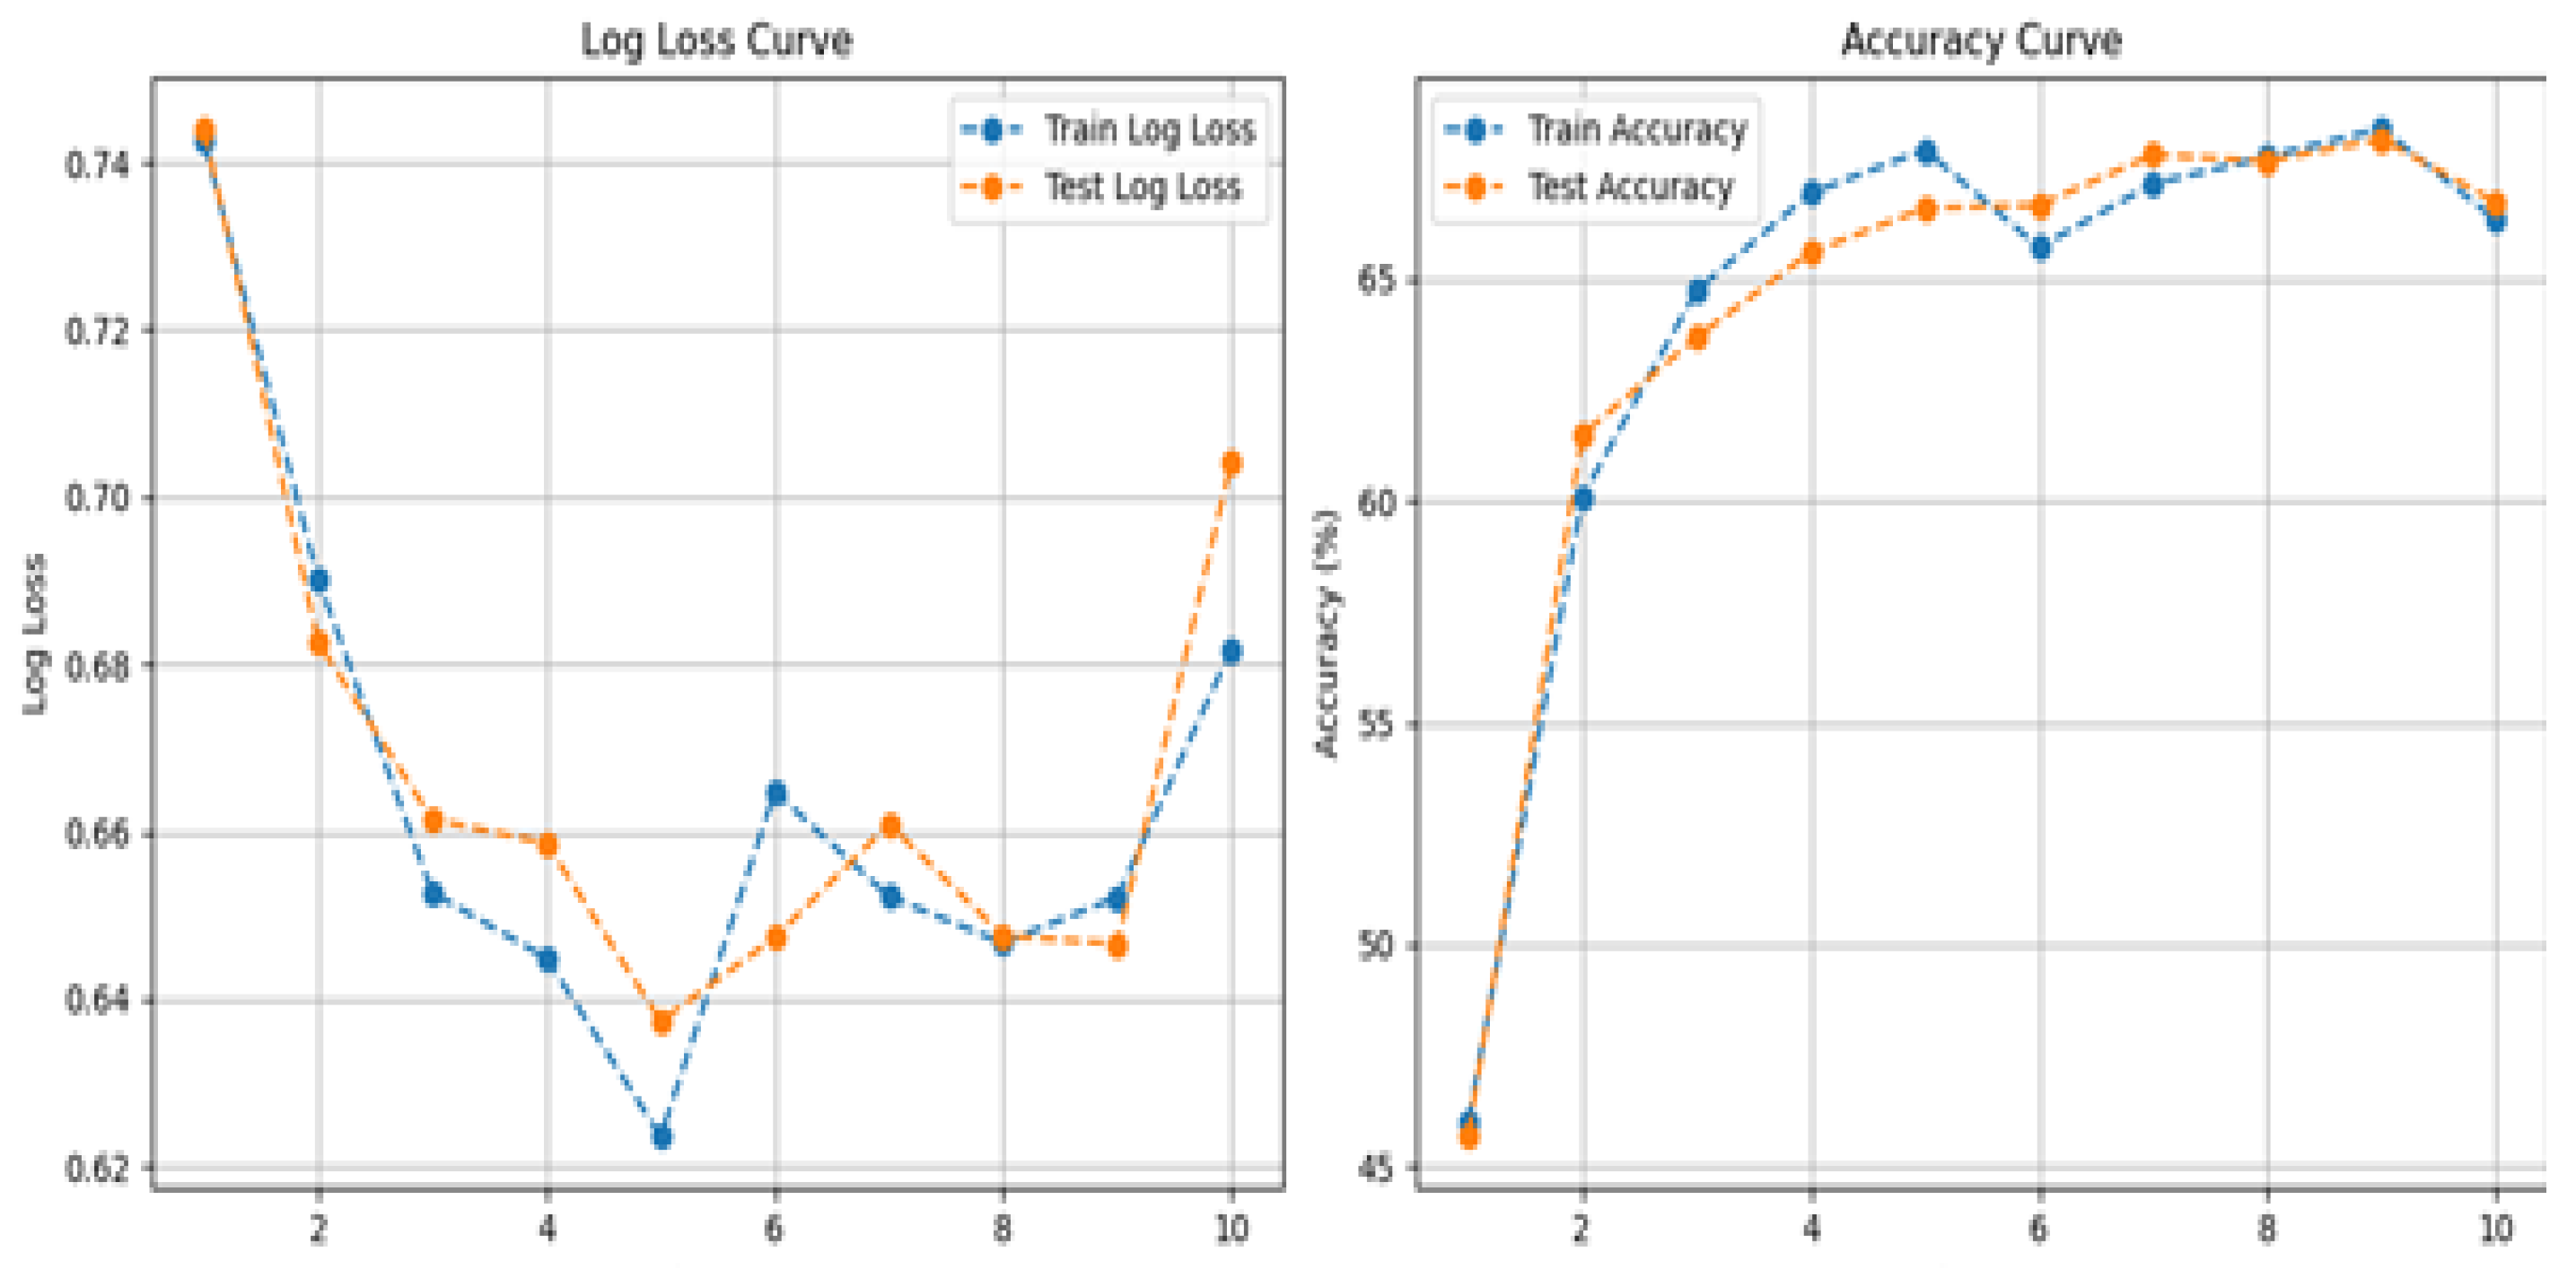
Figure 12.
Accuracy and Loss curves of PFA.
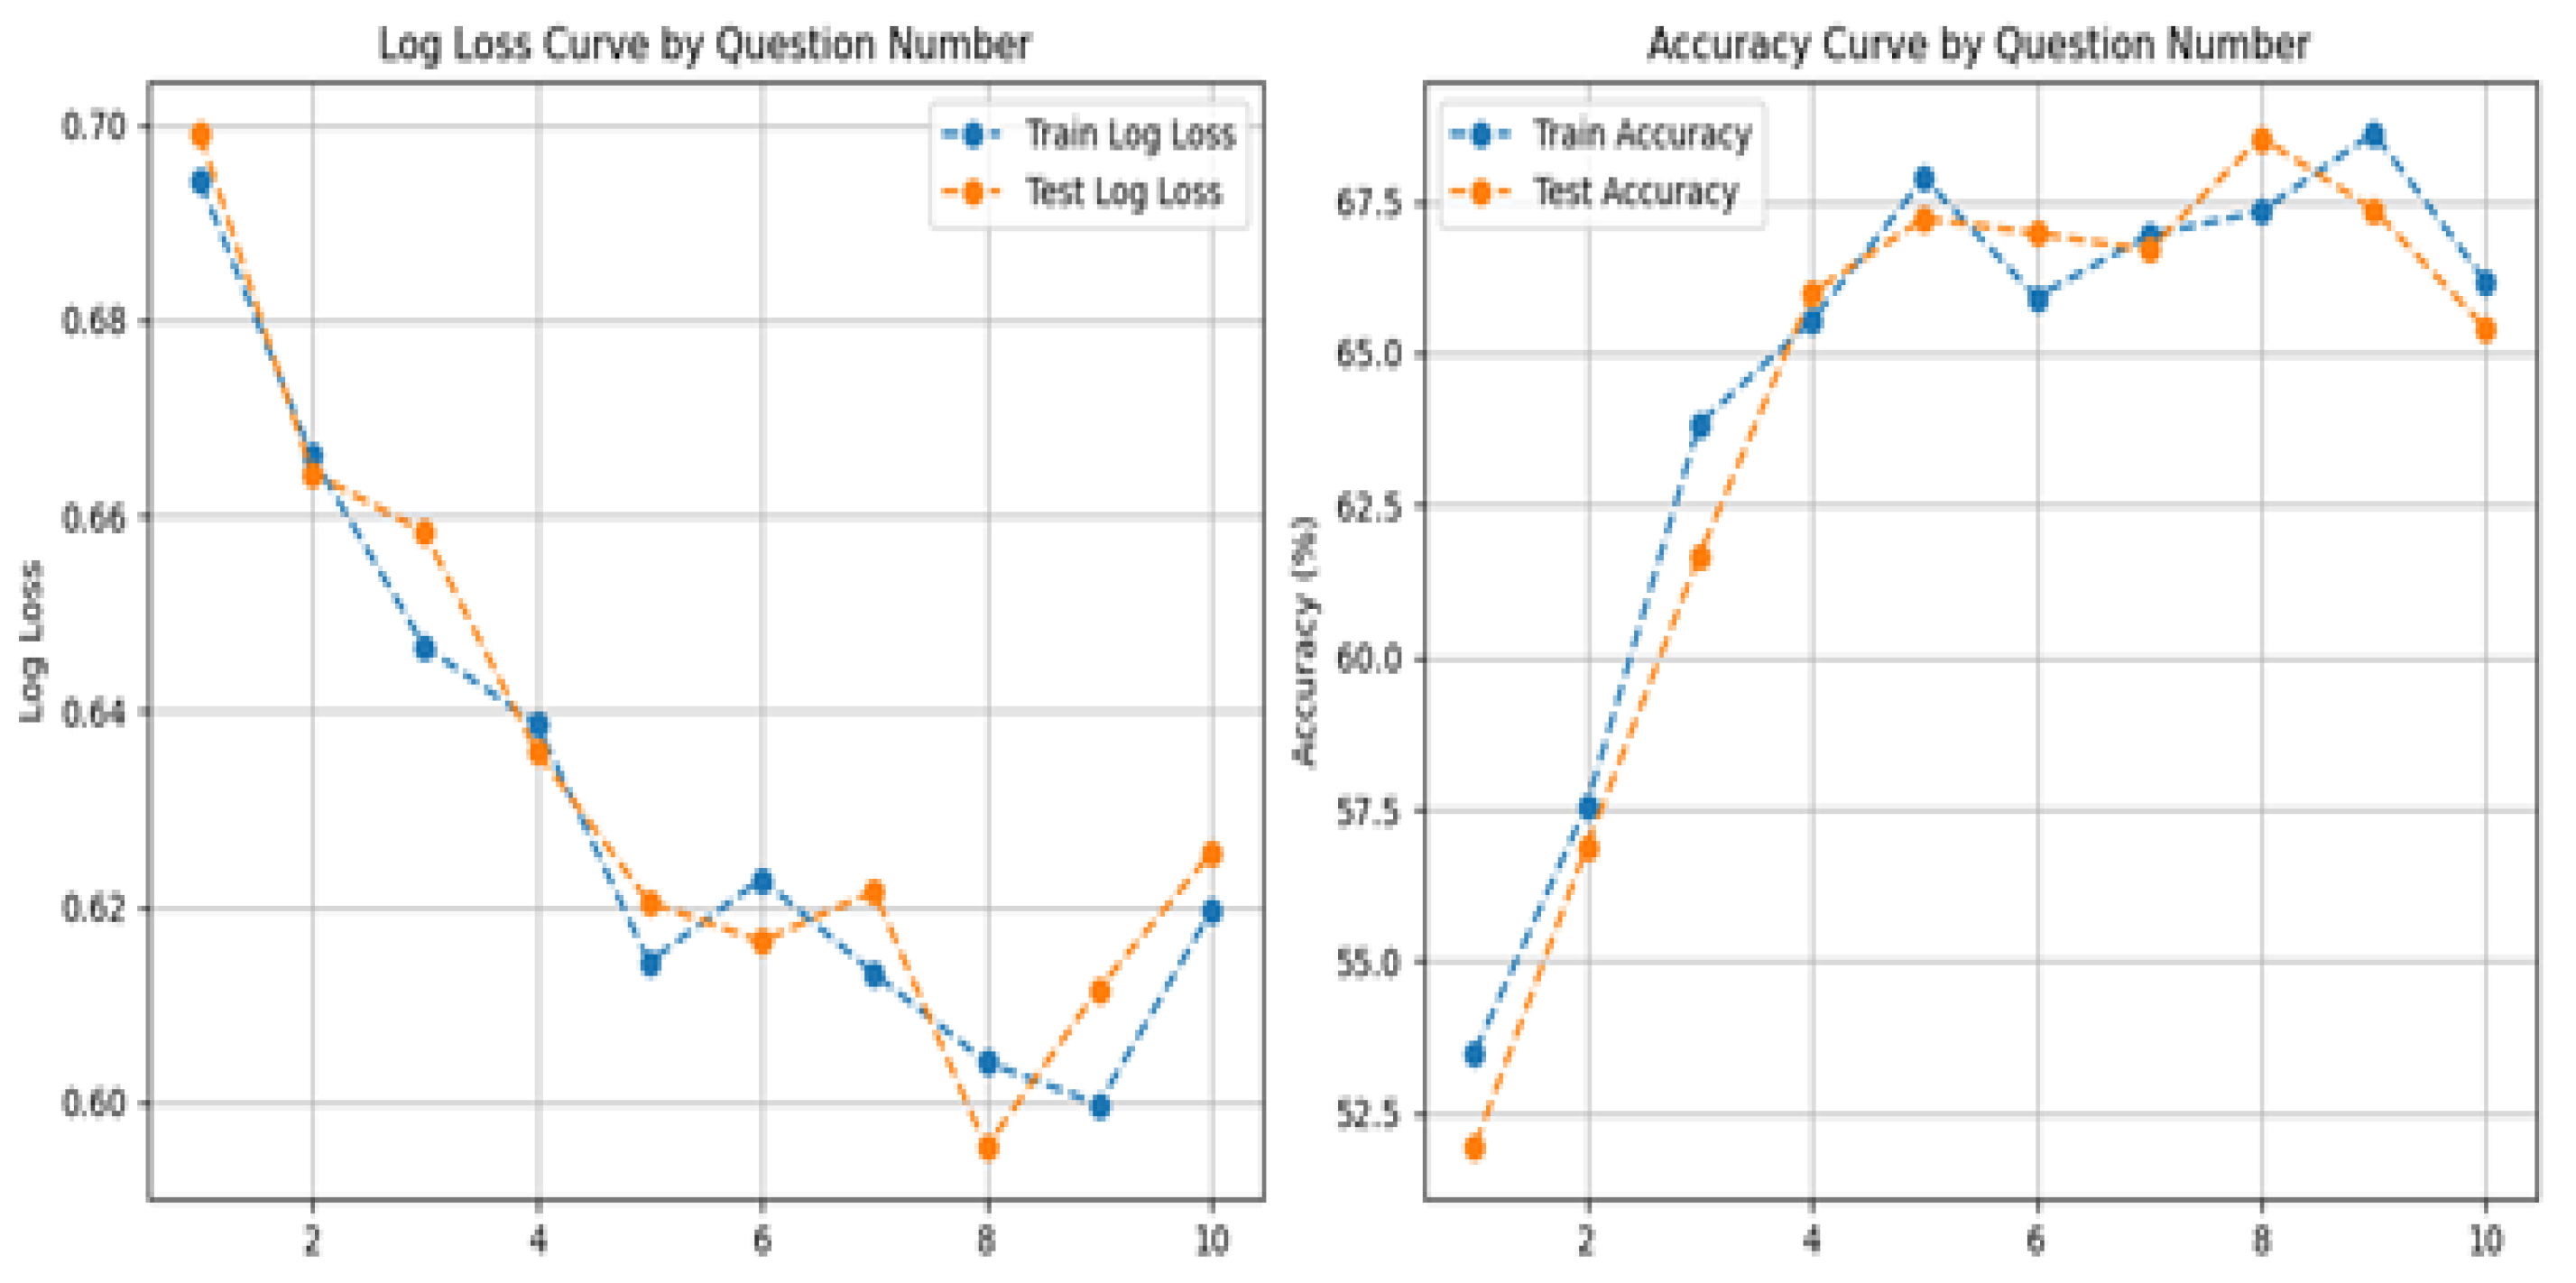
Figure 13.
Accuracy and Loss curves of TSA.
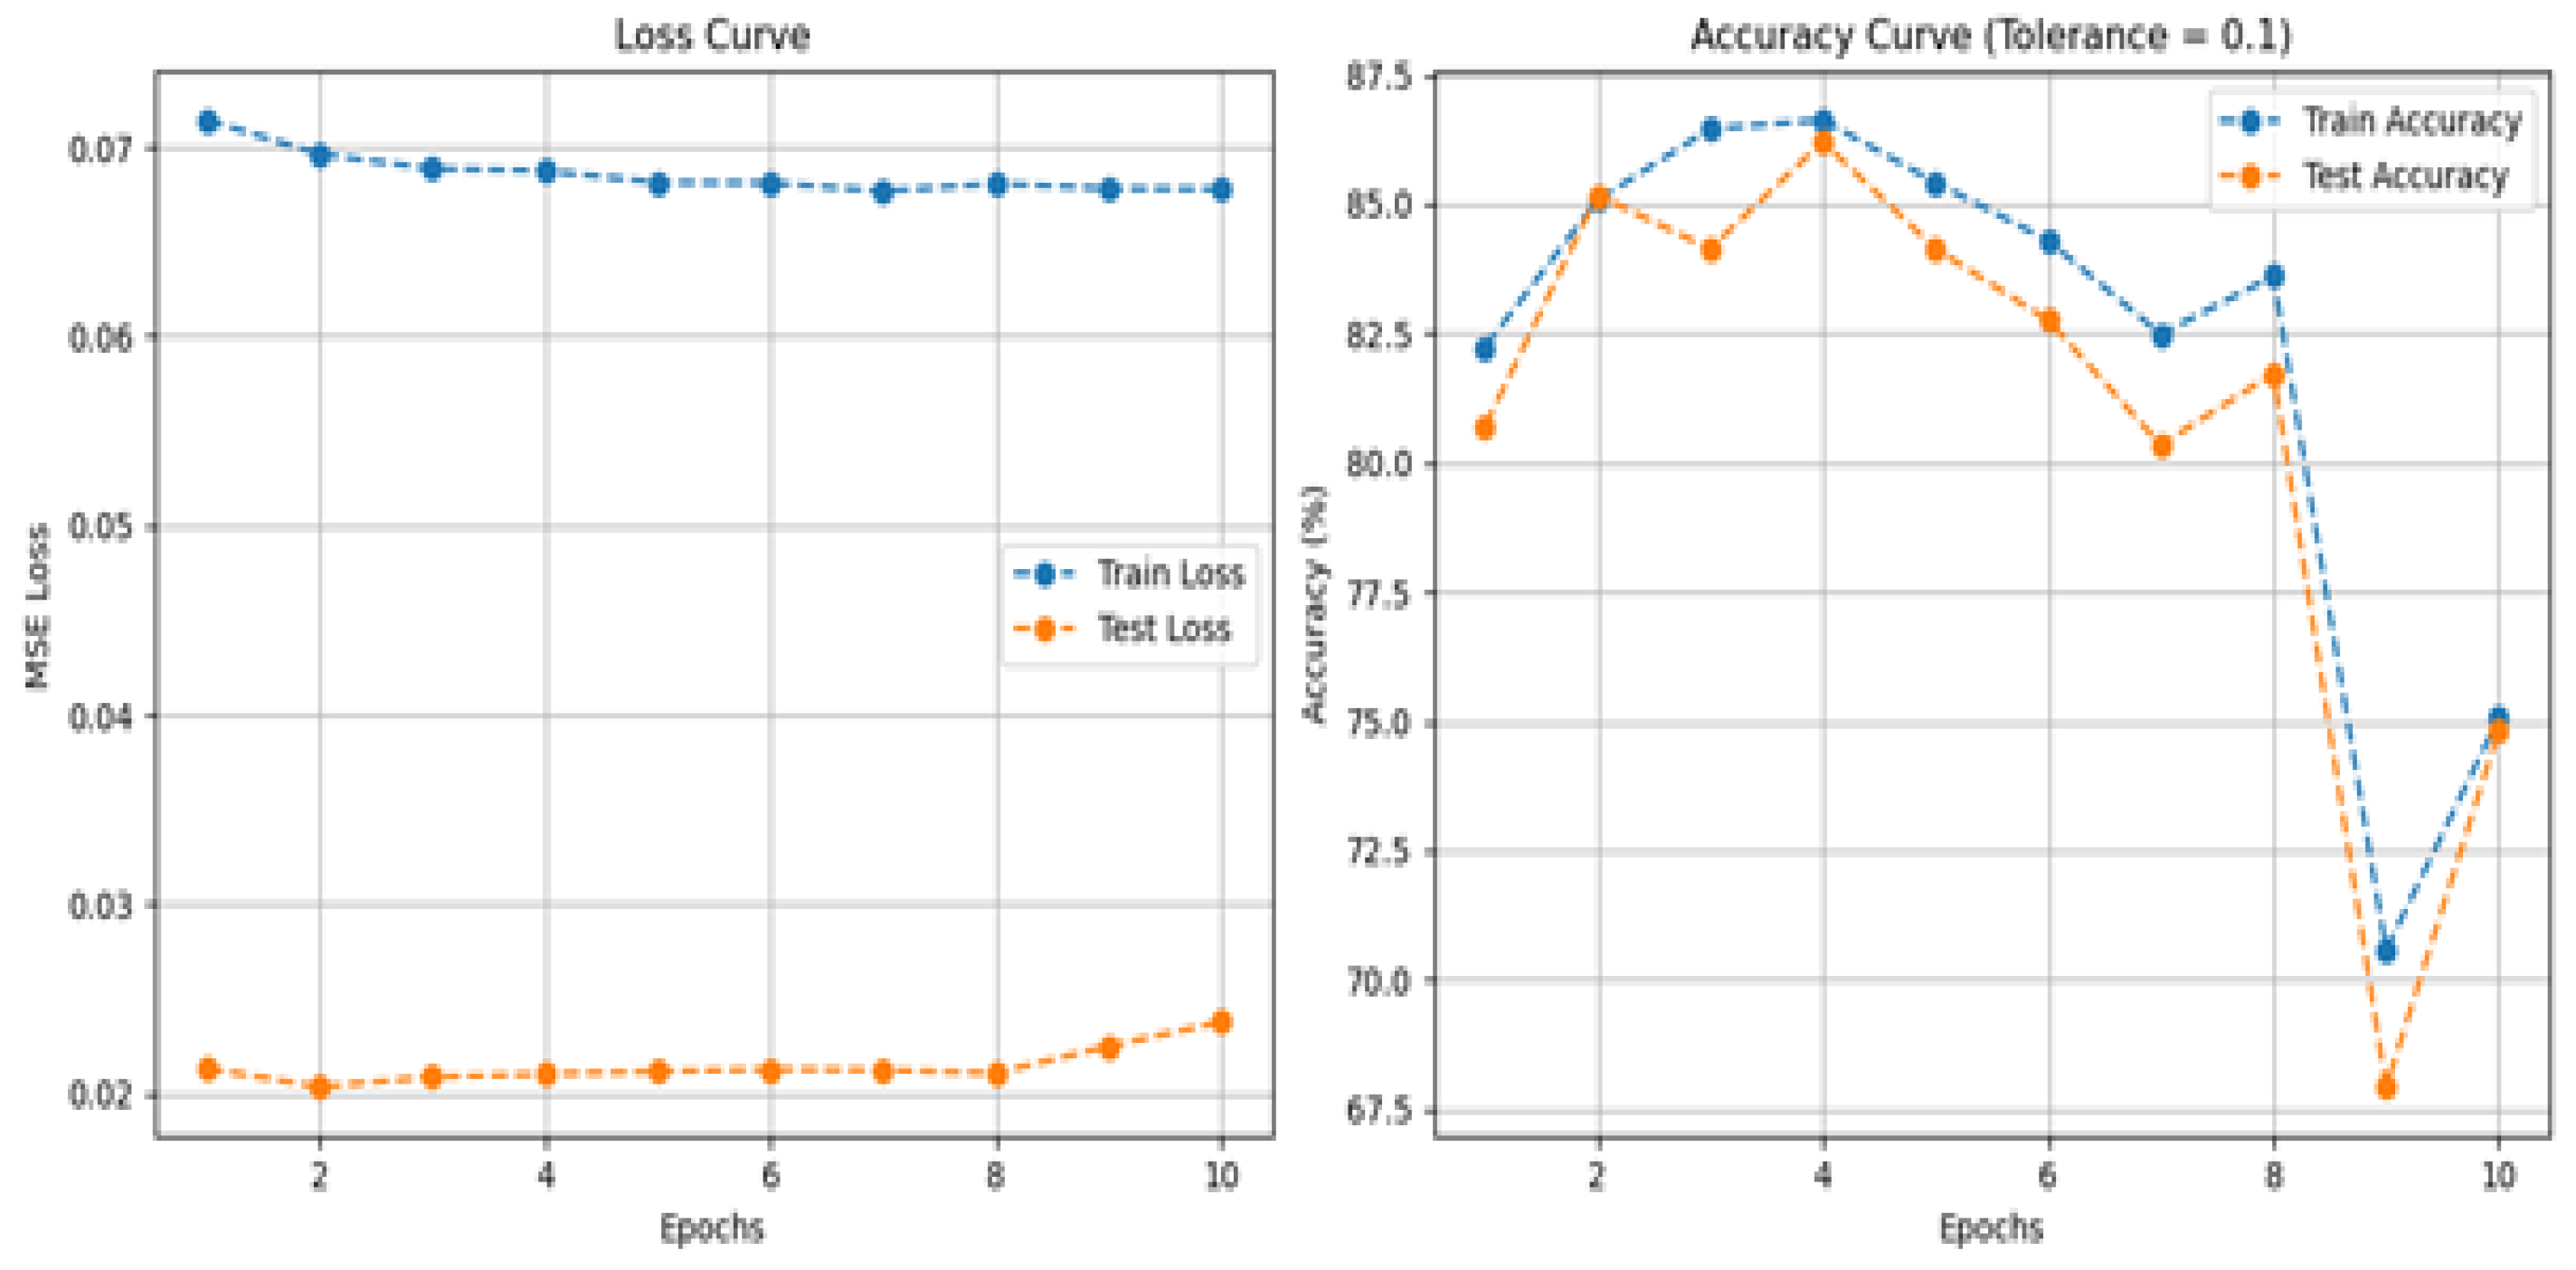
Figure 14.
TSA-GRU 5-Fold Cross-Validation Accuracy.
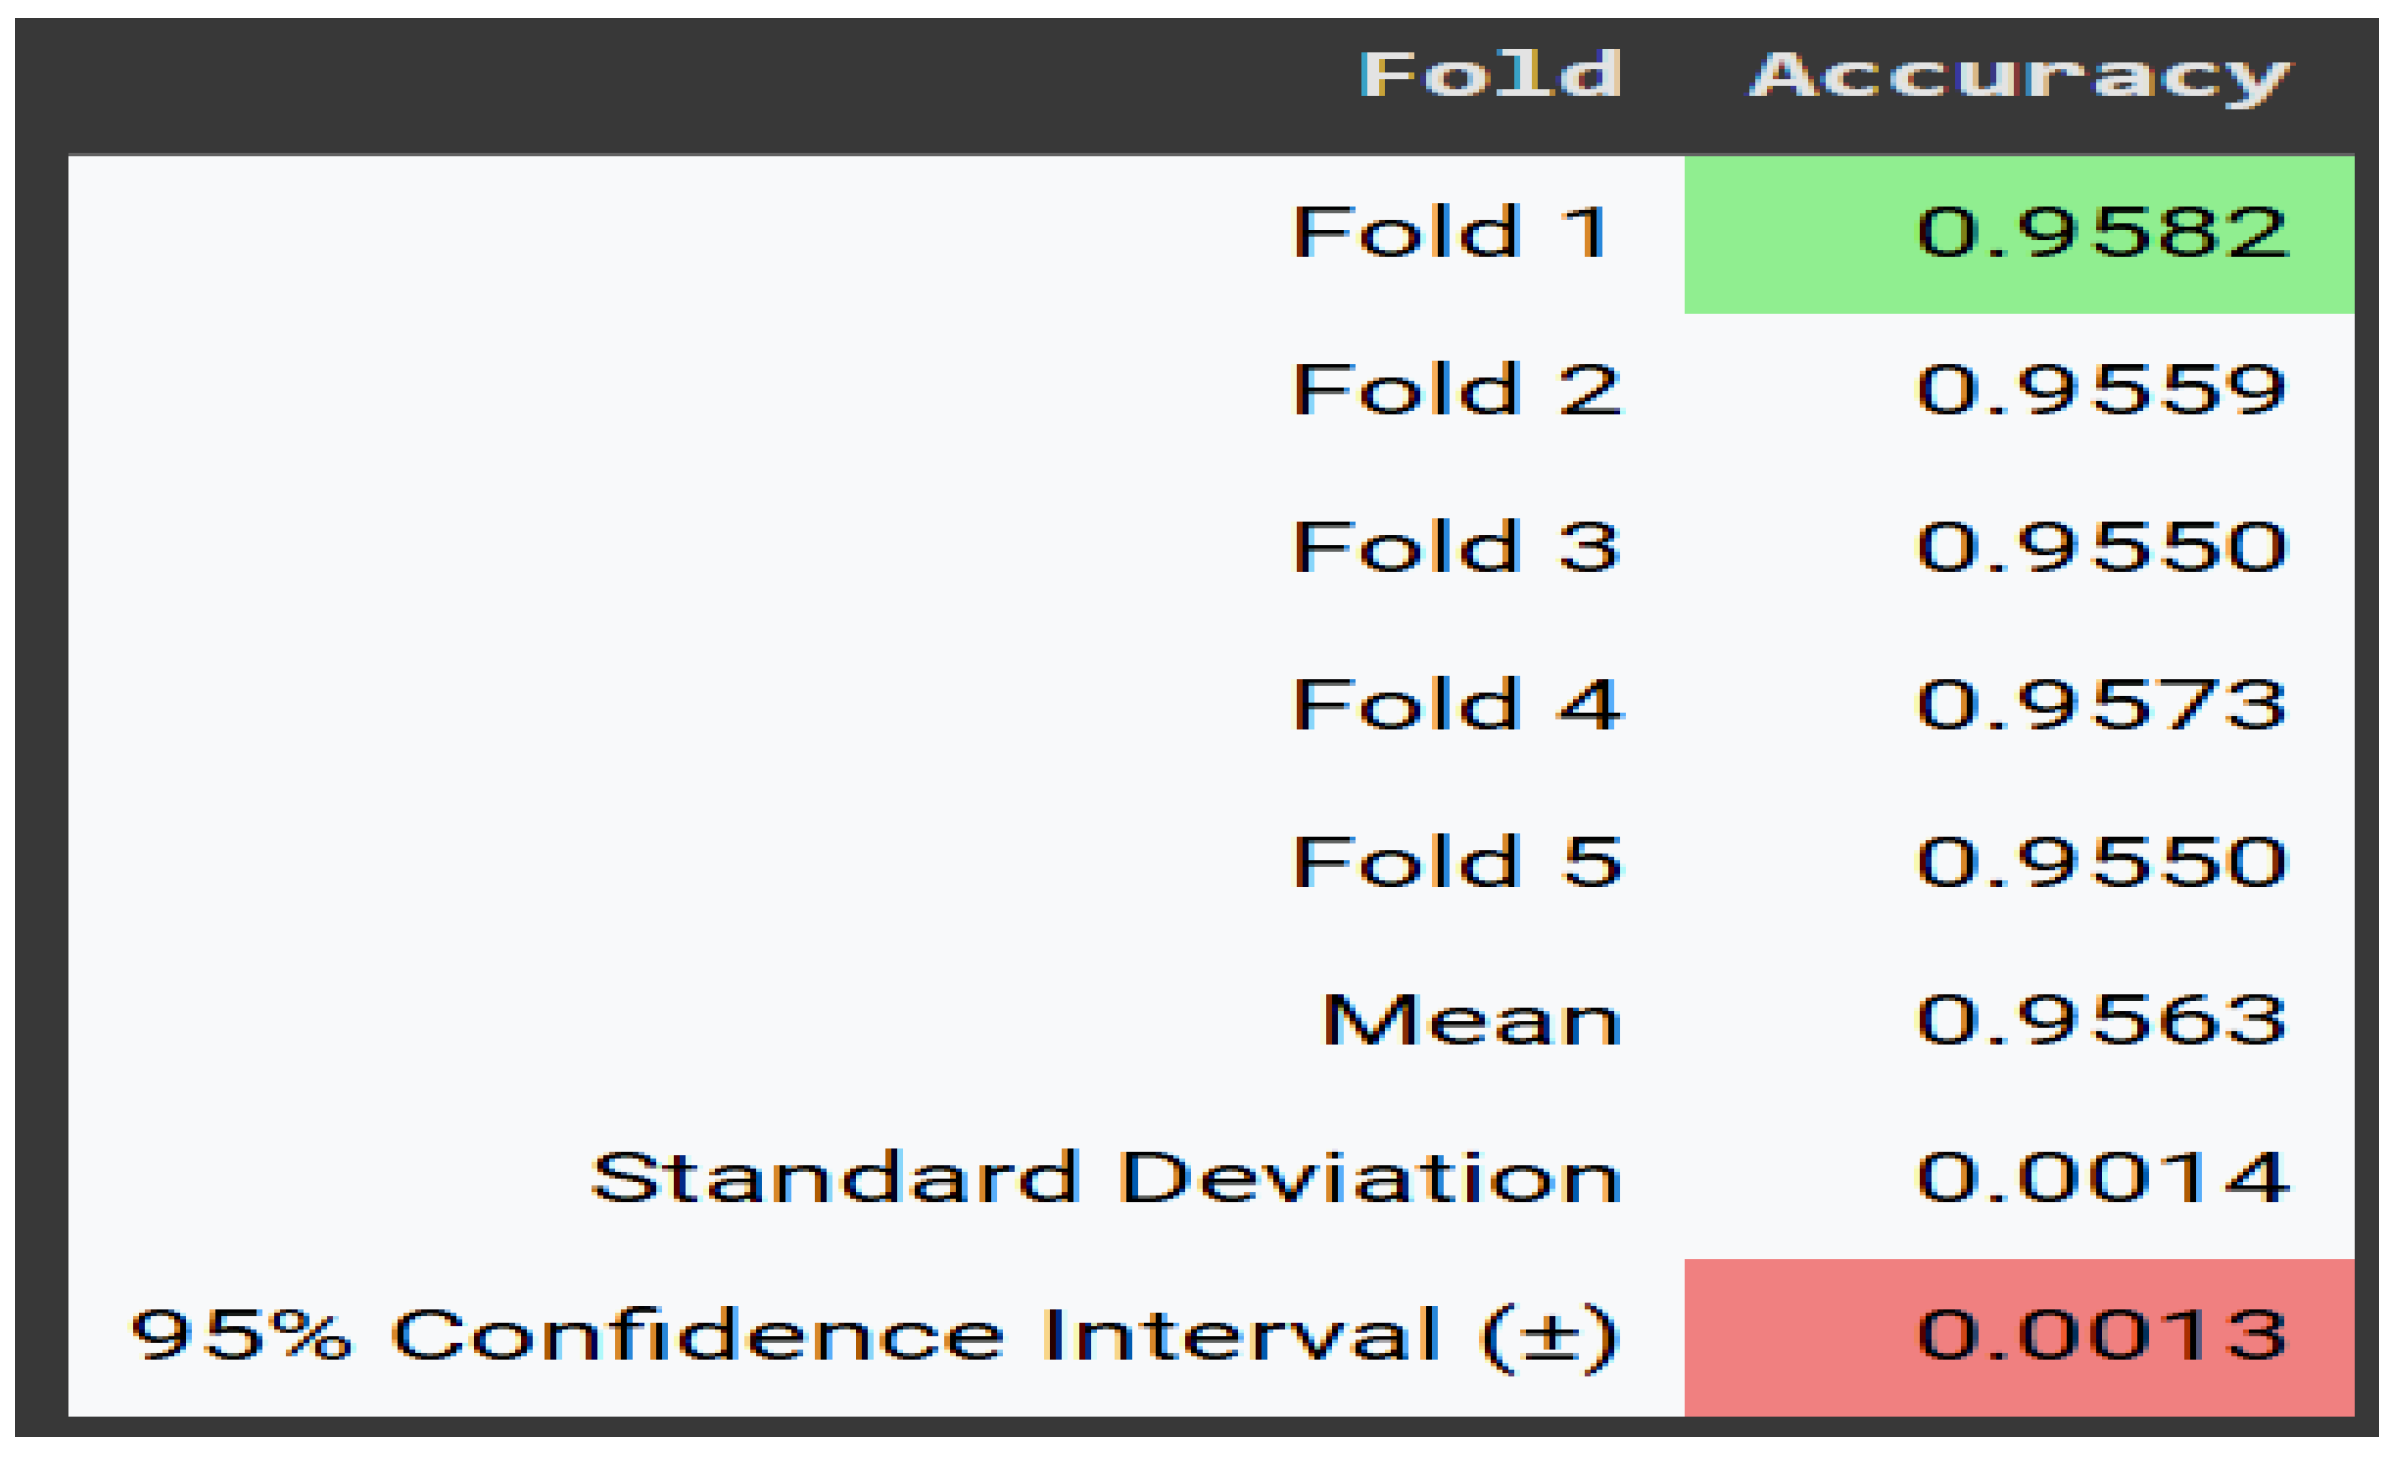
Figure 15.
TSA-GRU Accuracy per Fold.
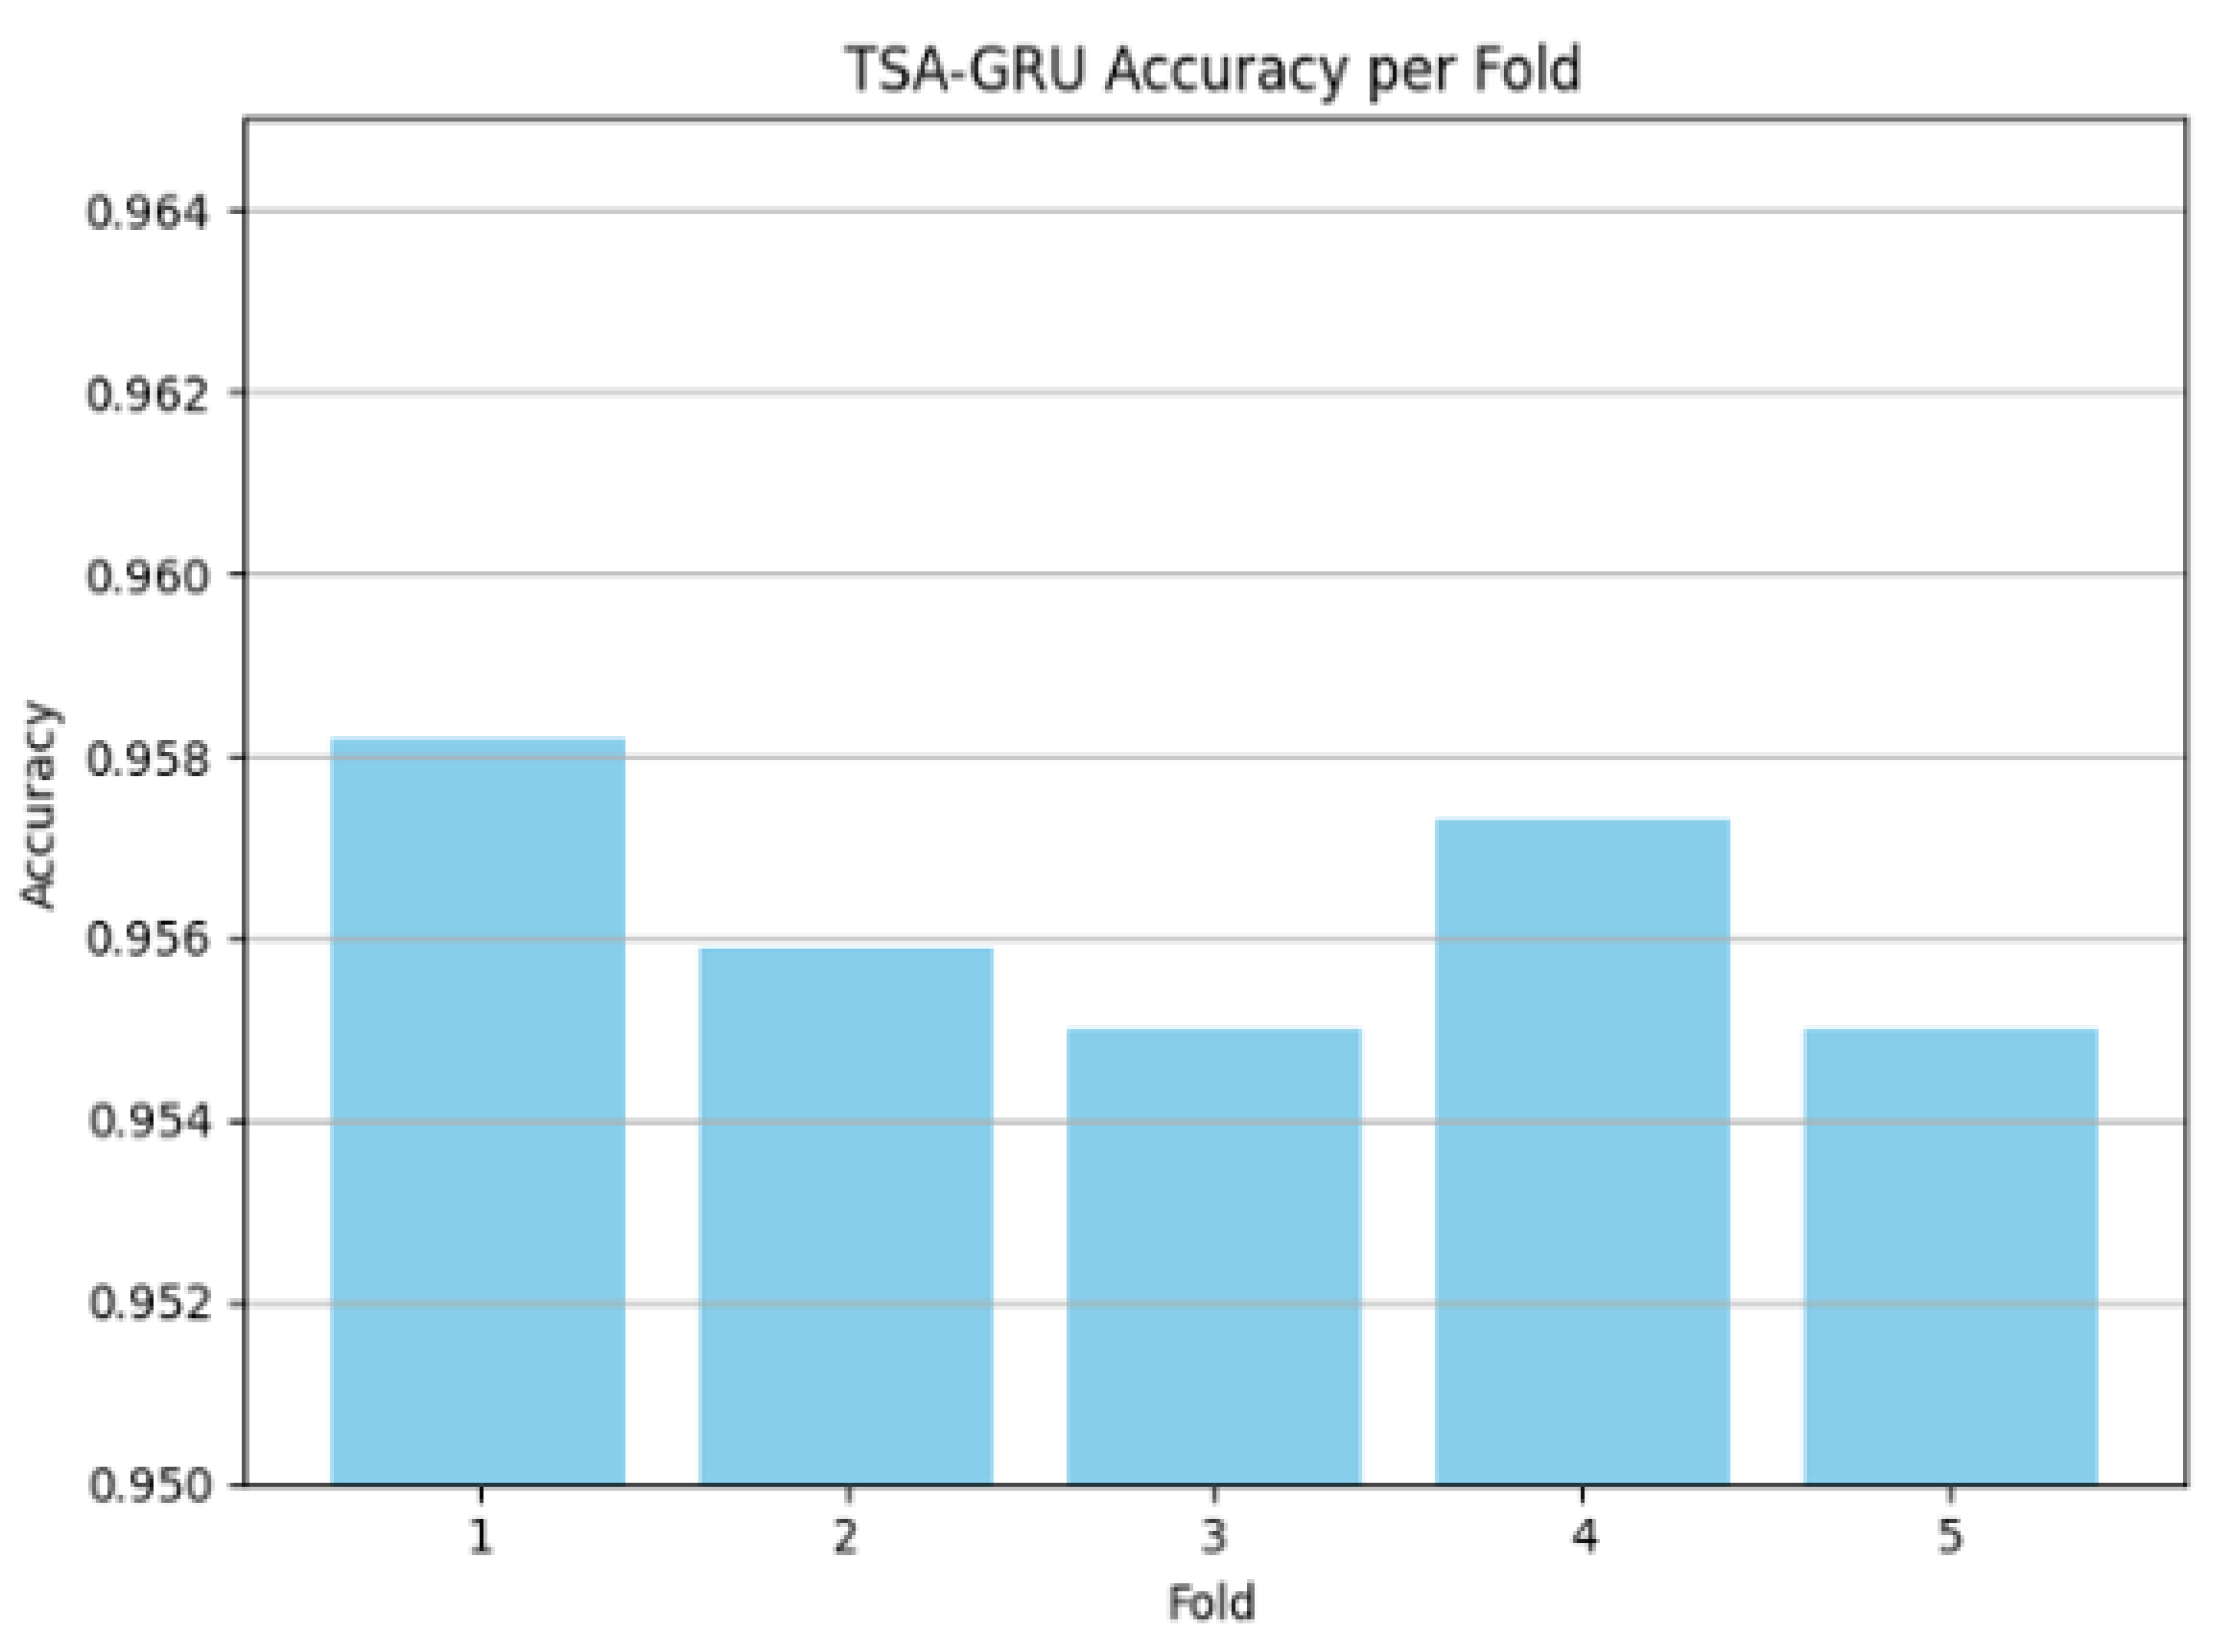
Figure 16.
Accuracy Distribution Across Folds.
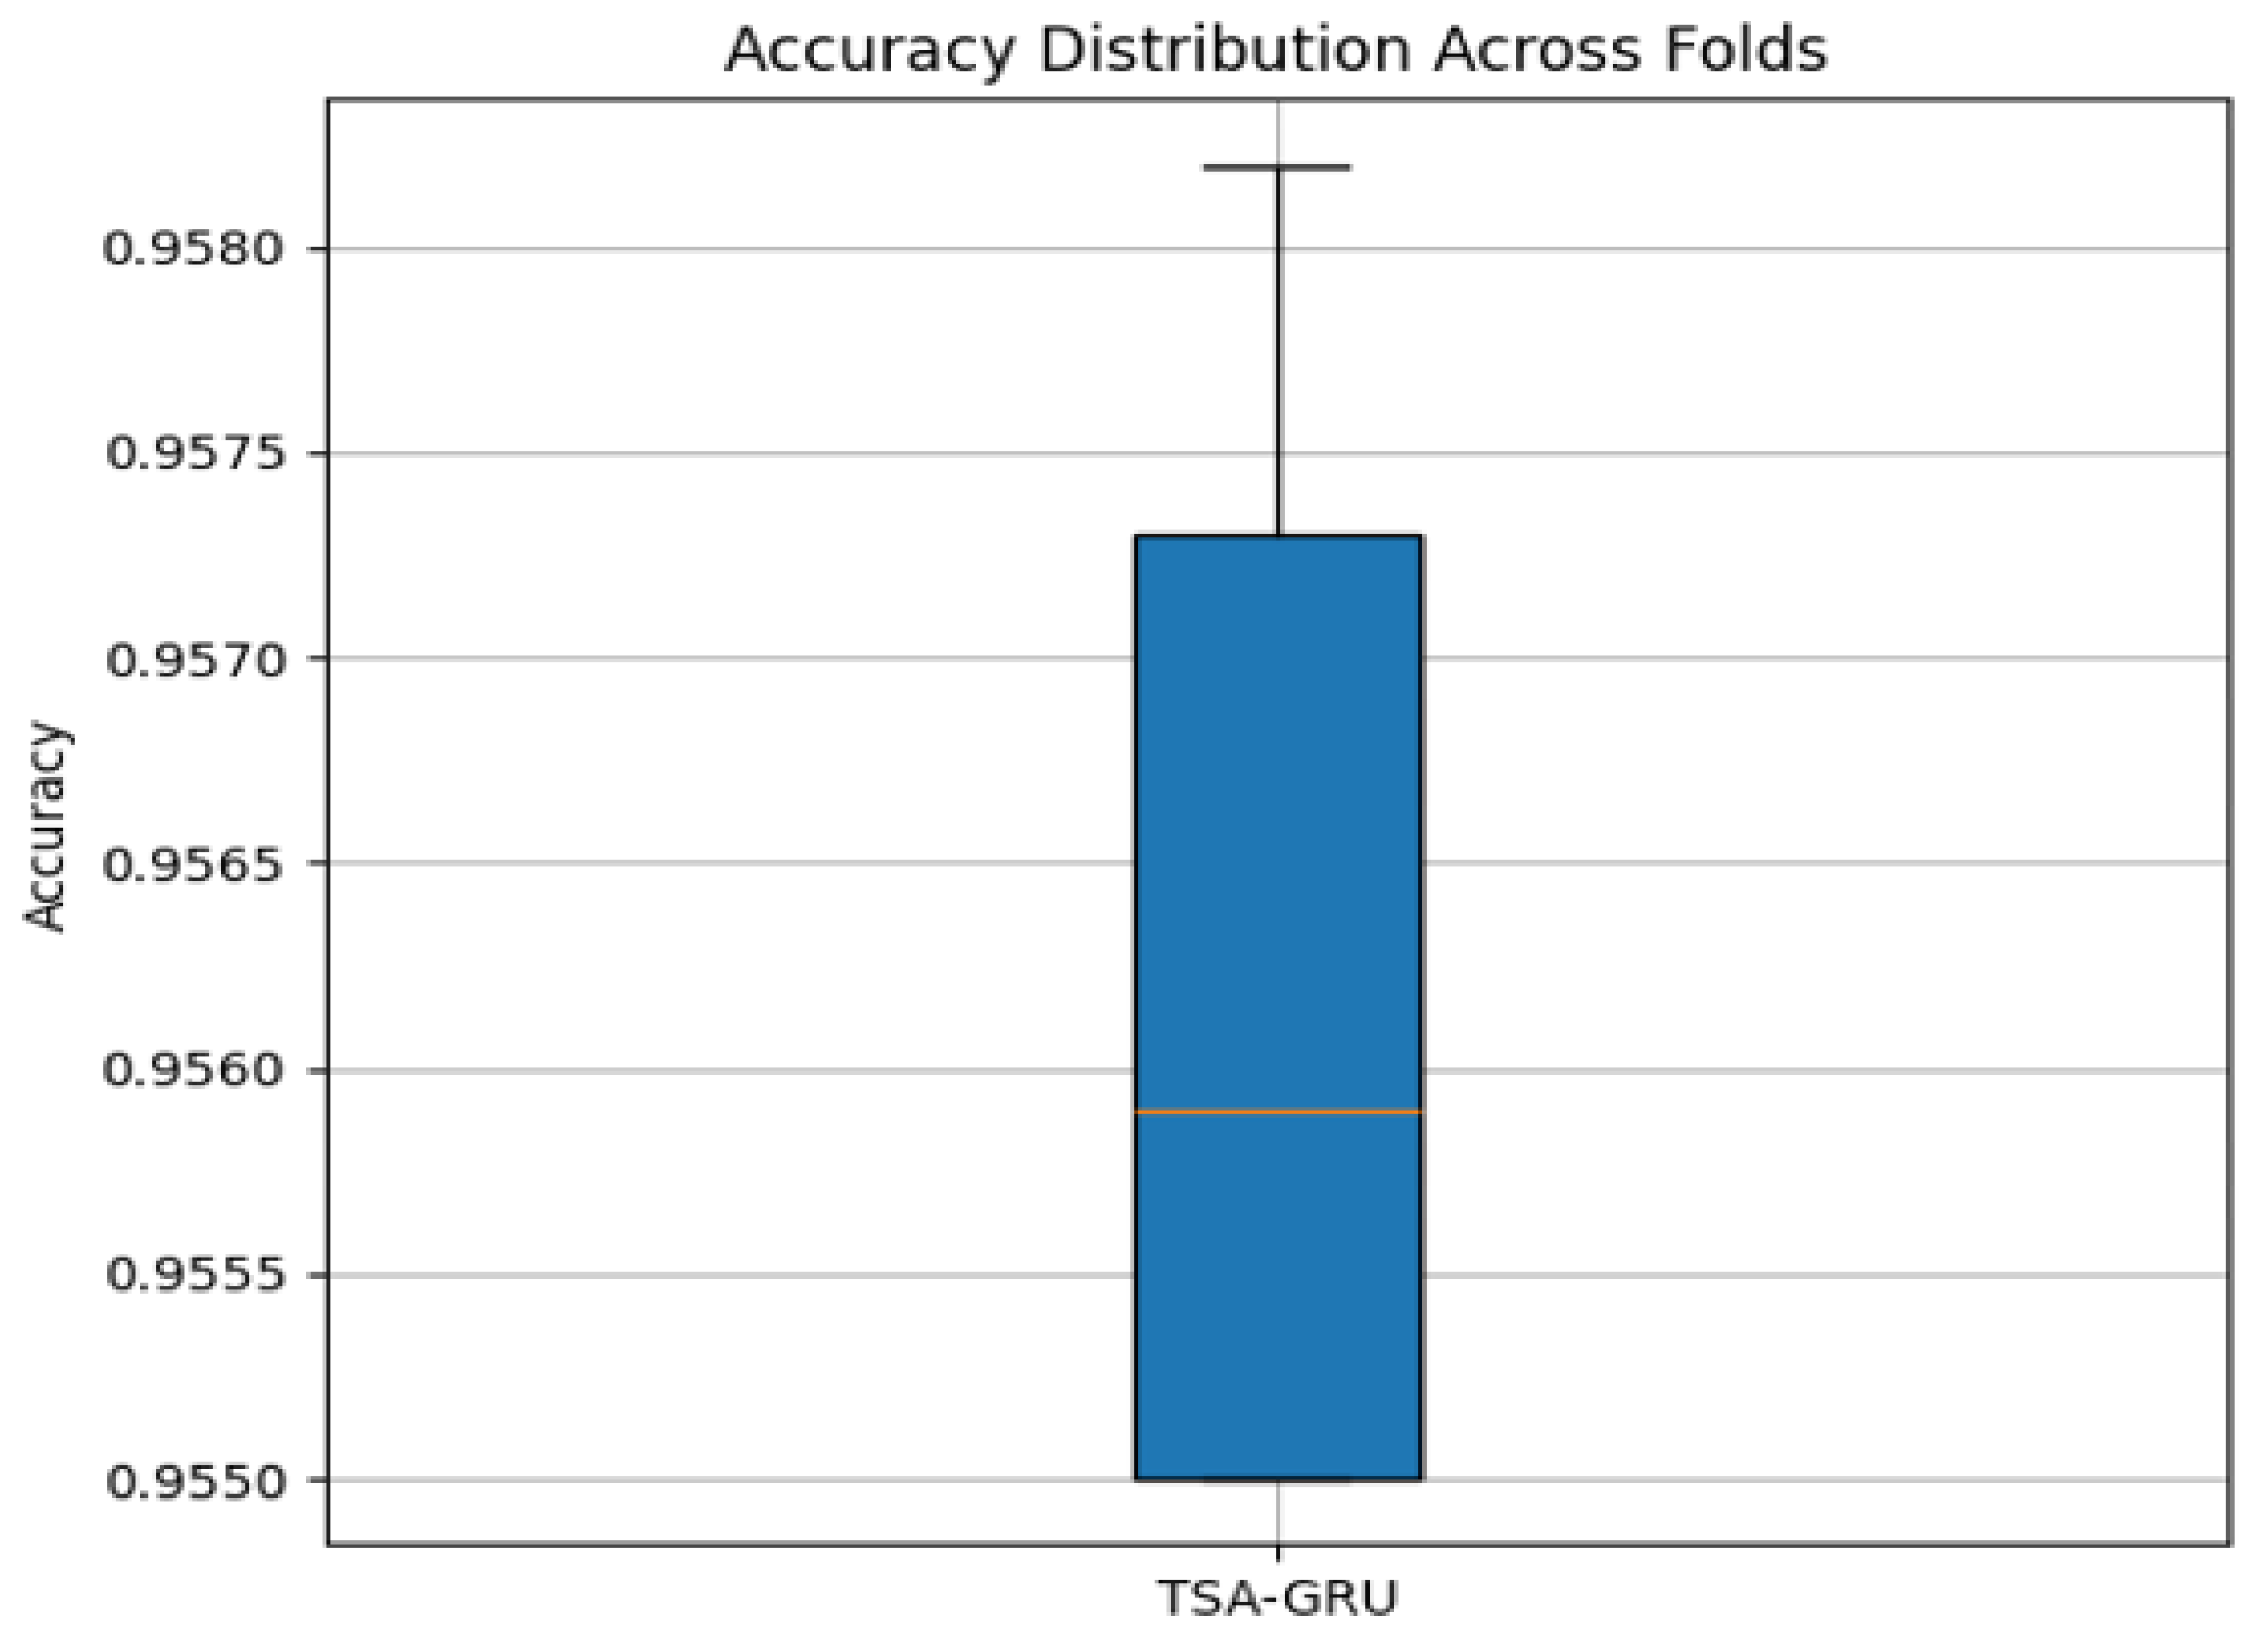
Figure 17.
Paired t-test accuracy comparison between TSA-GRU and MSA-GRU.
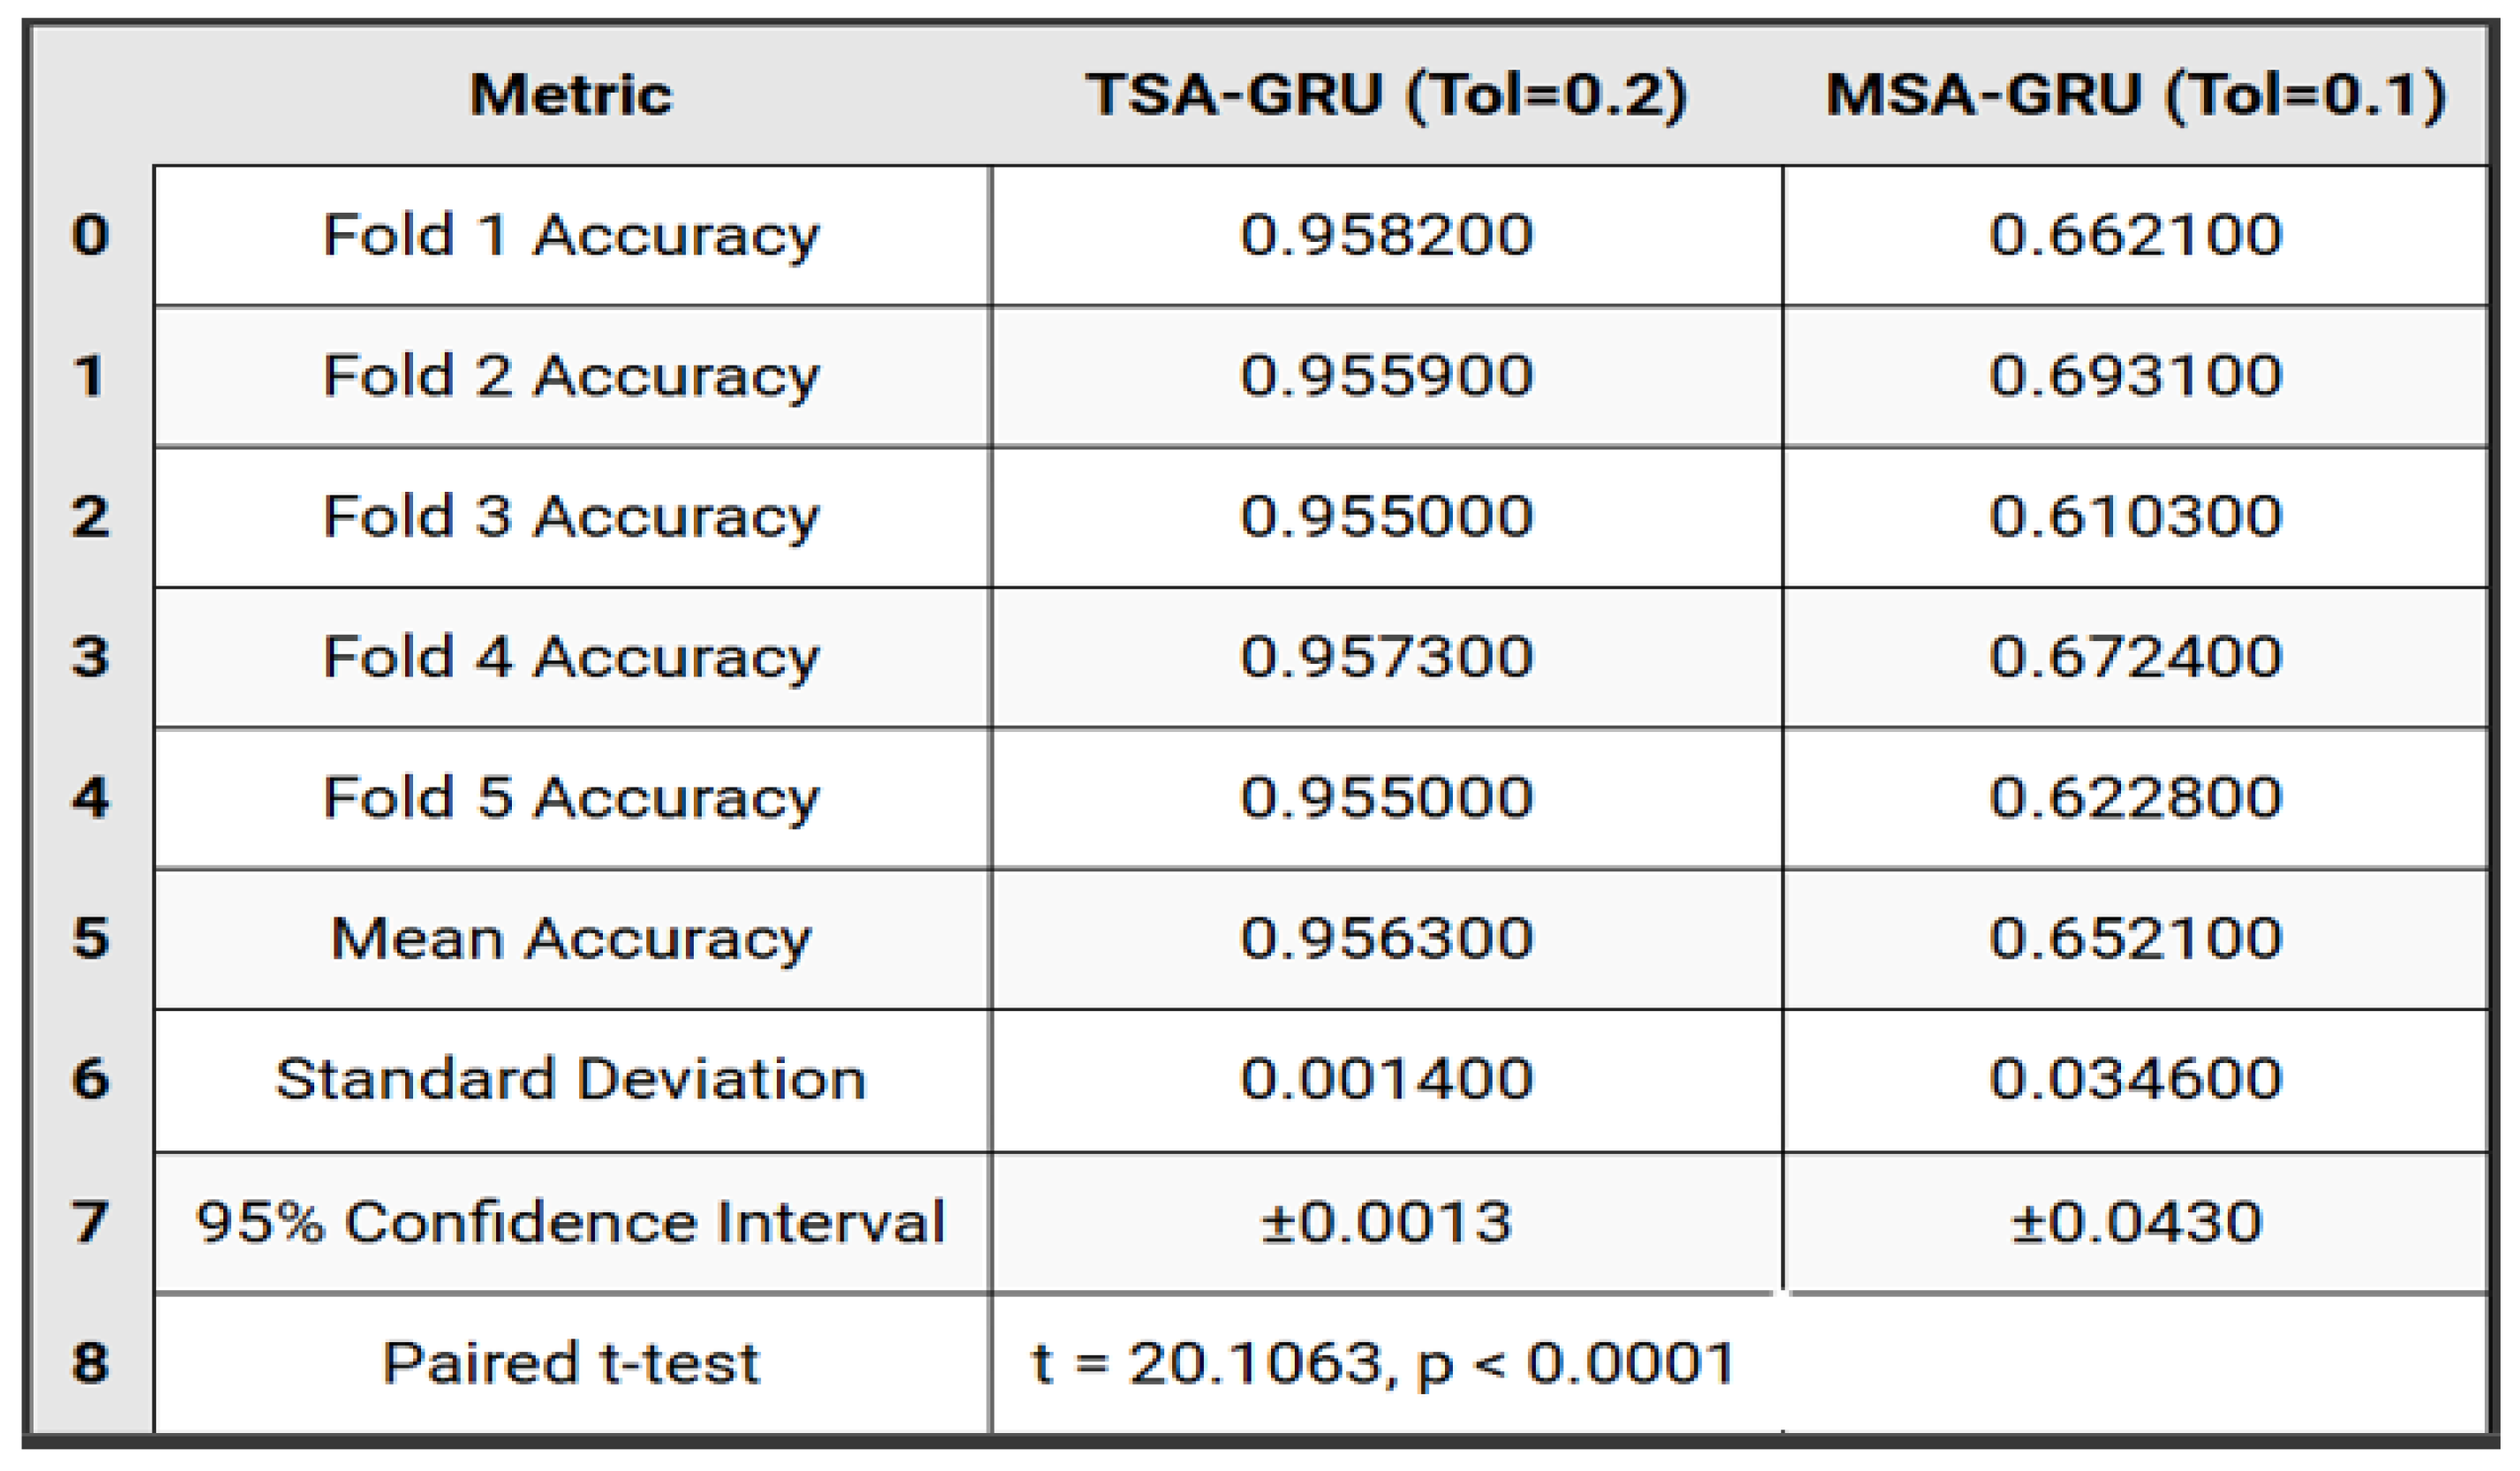
Figure 18.
5-Fold Accuracy Comparison MSA-GRU vs. TSA-GRU.
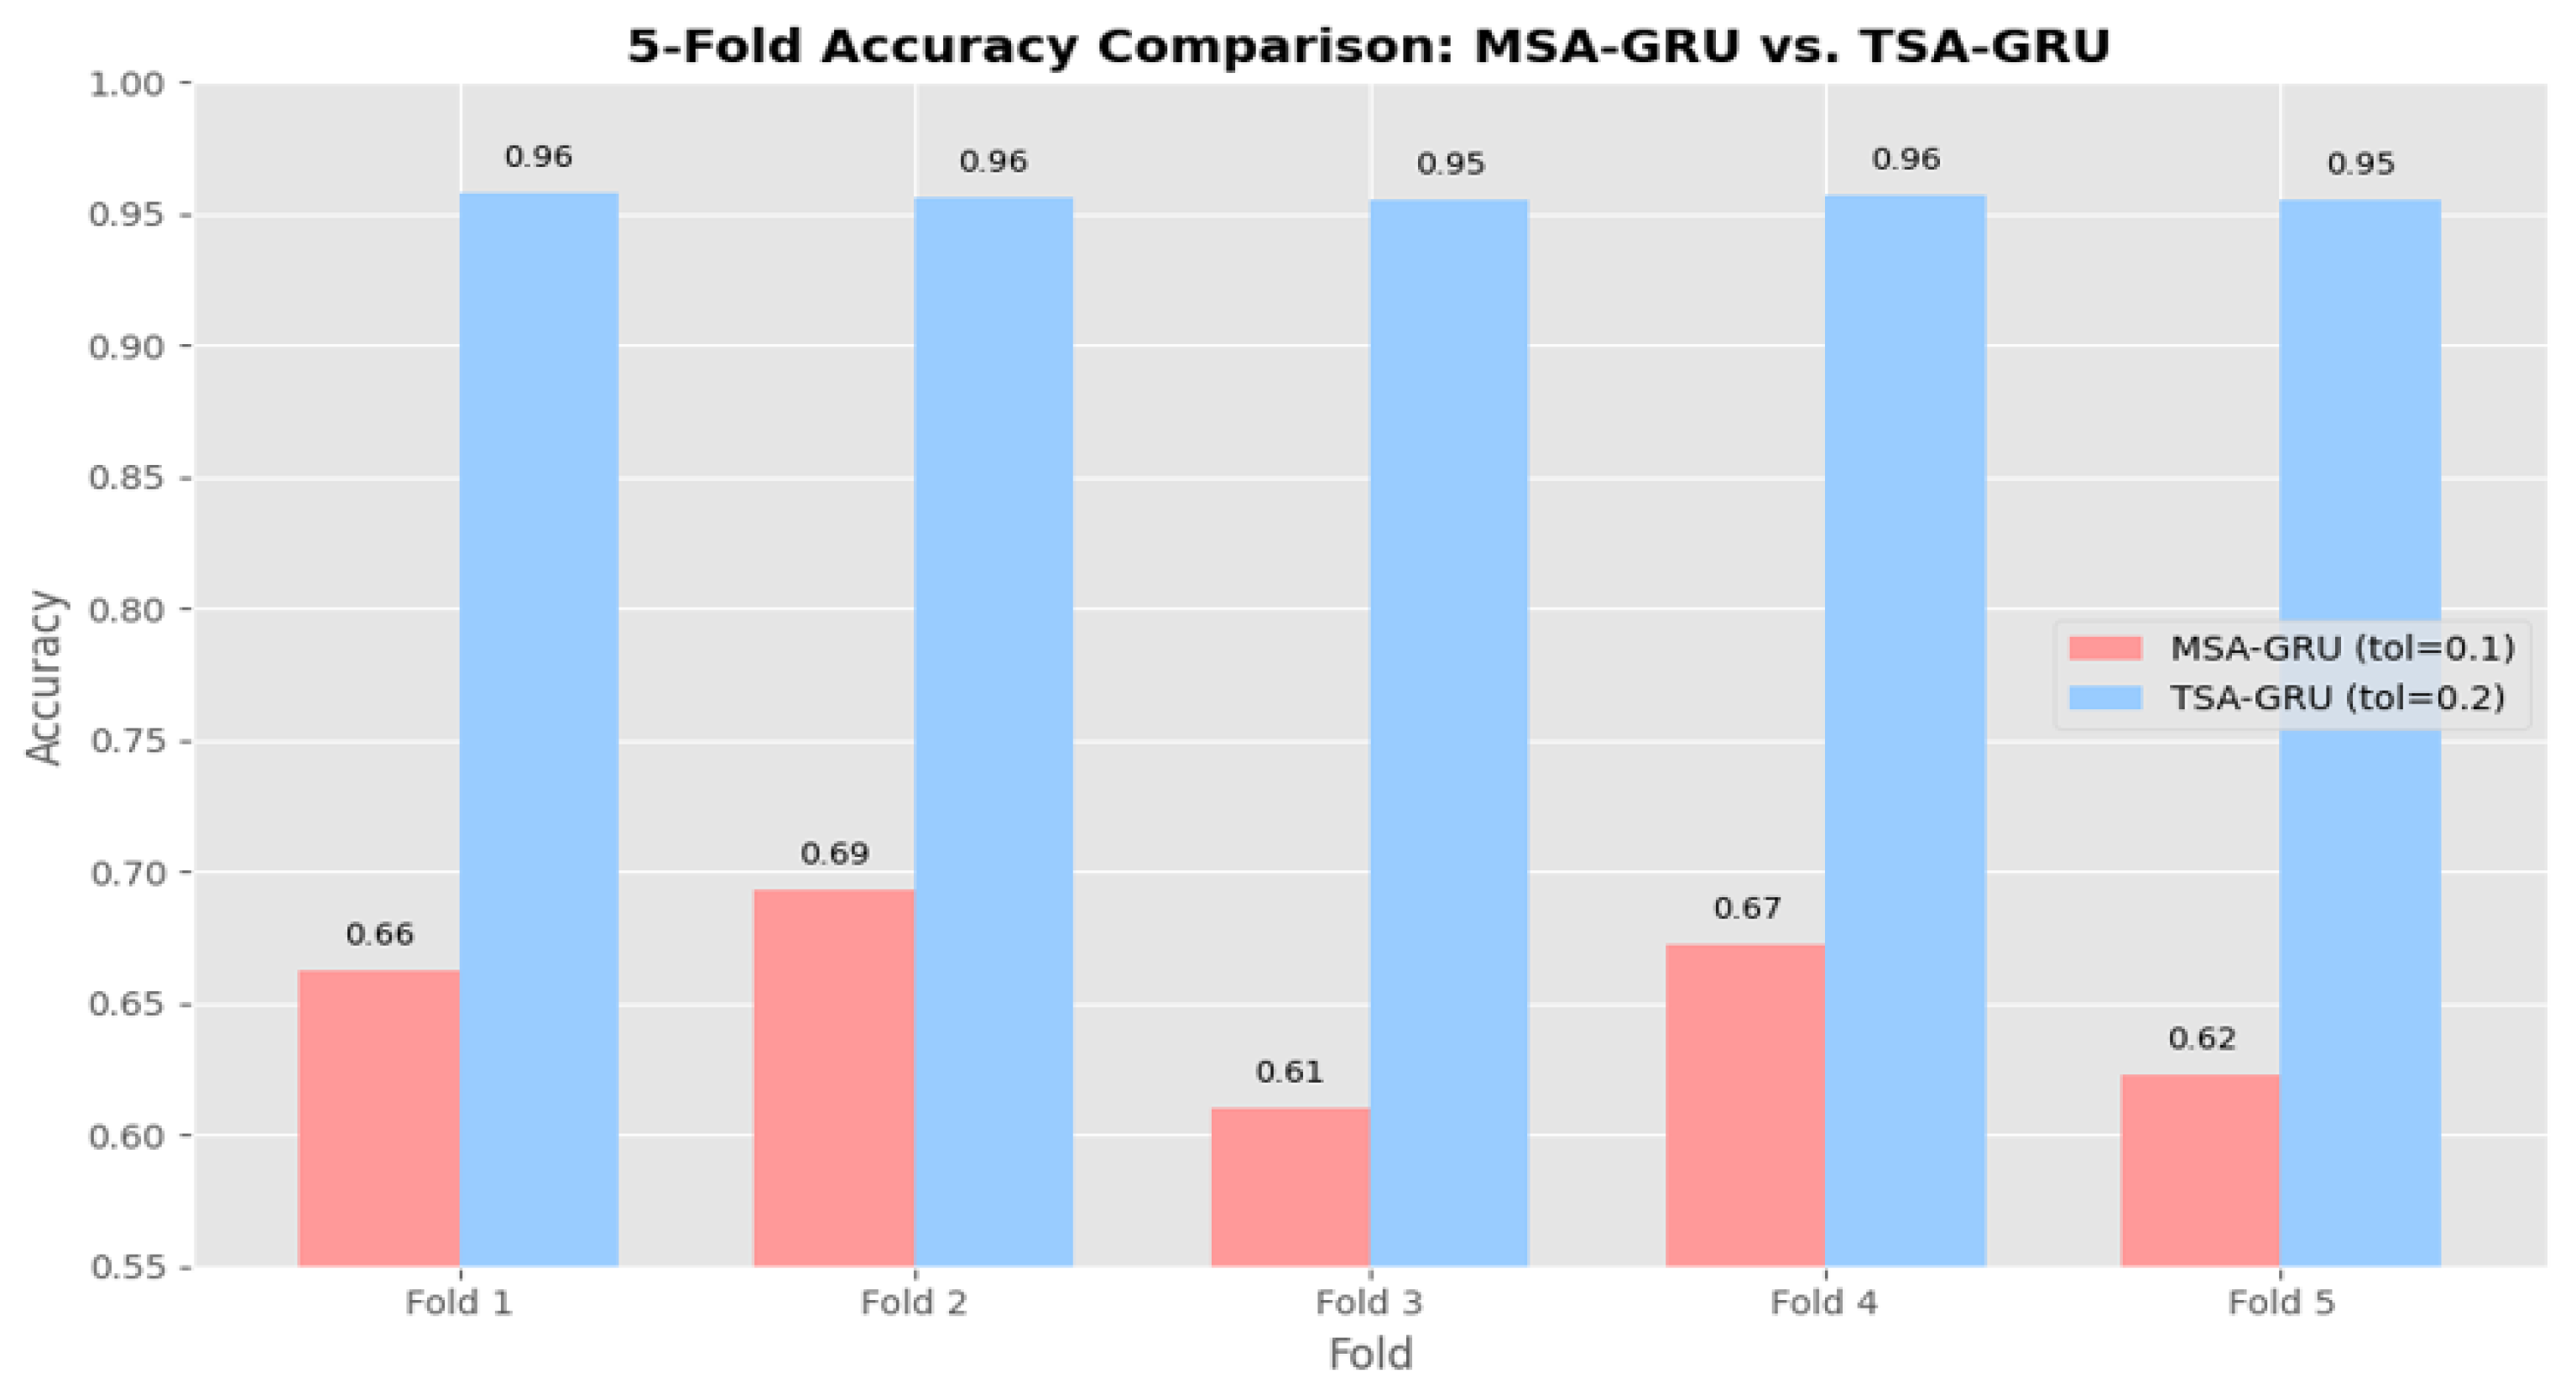
Figure 19.
Accuracy Trend per Fold.
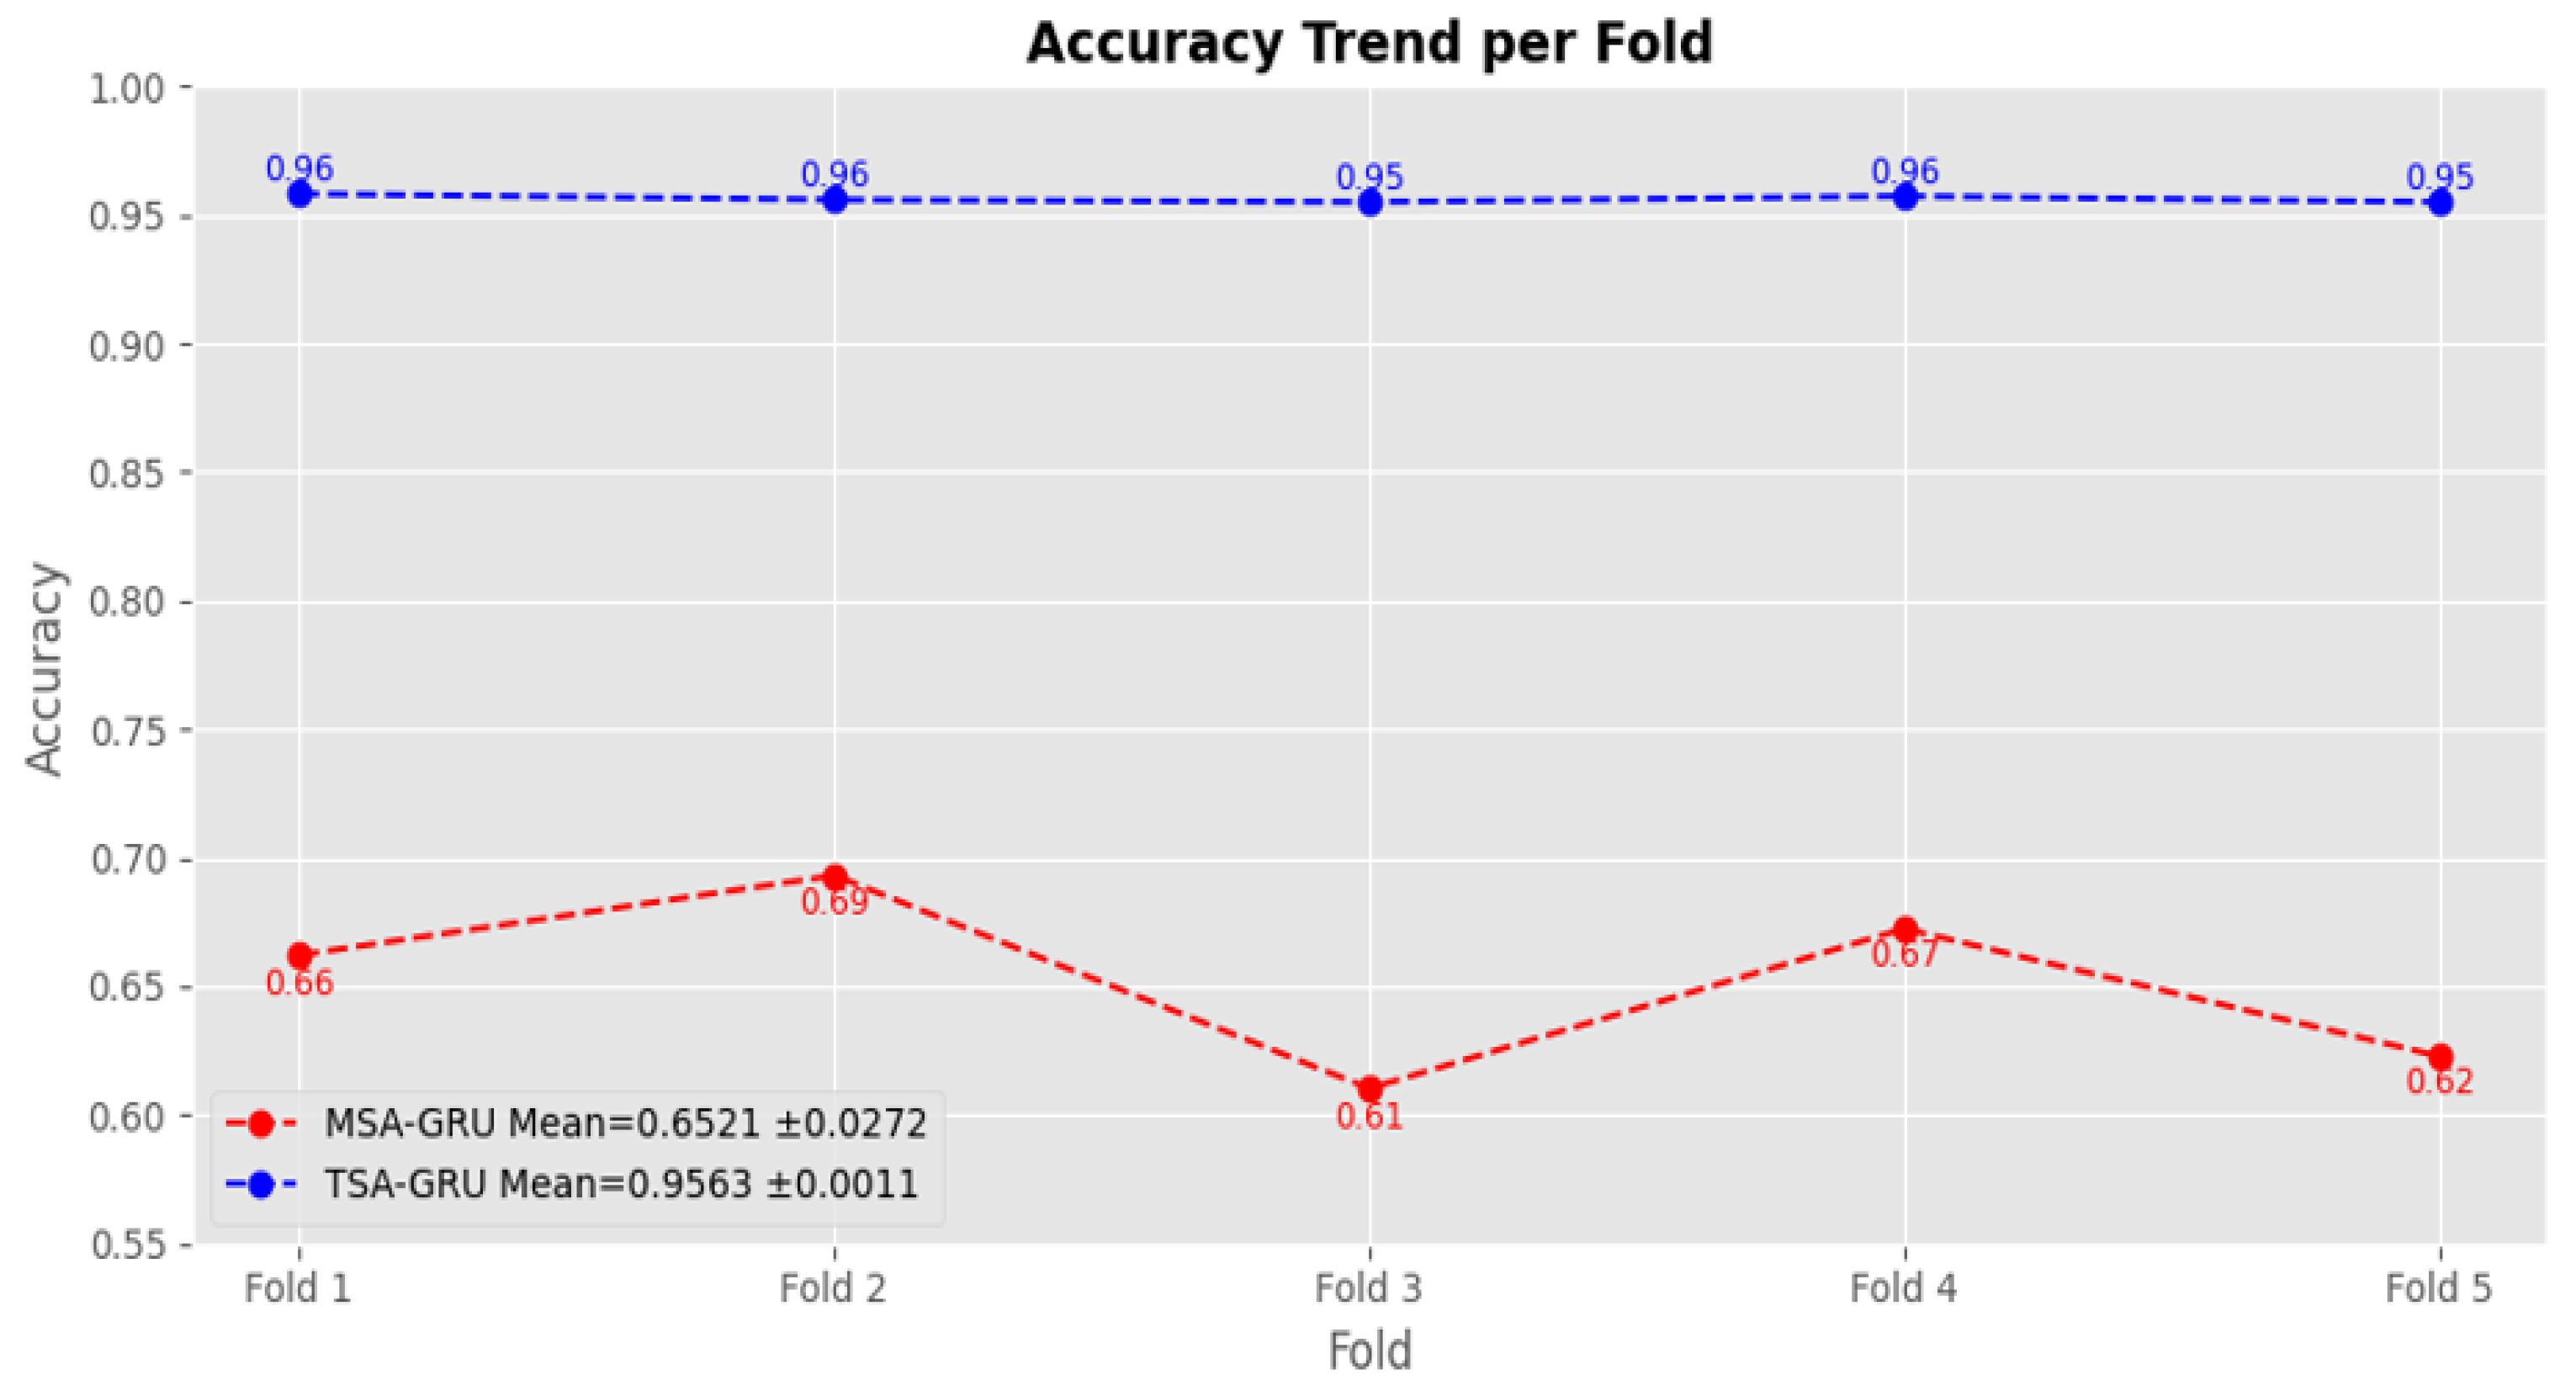

Table 1.
Comparative Analysis for learner behavior analytics in E-Learning and MOOCs.
| Method | The Resolved Problem | Gaps Resolved by the Approach | Accuracy | Scalability | Interpretability | Resource Consumption | Adaptability to Large Datasets |
| Learner Behavior Analytics in MOOCs | |||||||
| Machine Learning [11] | Traditional engagement metrics do not capture true student engagement. | Introduces k-means clustering to indicate the necessity of behavioral, emotional, and cognitive measures. | – | High | High | Low-Medium | Medium |
| Process Mining + XAI [12] | Opaque analytics in MOOCs lead to a lack of trust and insight. | Combines process mining, learning analytics, and XAI to identify hidden patterns and provide transparent recommendations. | – | High | Very High | Medium | Very Good |
| Tadakhul System [13] | Cold start issues and insufficient personalization on MOOC platforms. | Combines BiLSTM and CNN to predict behavior, engagement, and drop-out rates. | High | Medium | Medium | Medium | Very Good |
| Video Analytics [14] | Limited understanding of how video interactions affect learner engagement. | Analyzes video metrics and recommends real-time feedback via dashboards. | Medium | High | Medium | Medium | Good |
| Sentiment Analysis [15] | Comment texts are underexplored in MOOCs. | Combines CNN and LSTM in a hierarchical attention model for sentiment detection. | High | Medium | Medium | Medium | Good |
| NLP Framework [16] | Log data analysis overlooks off-platform problem-solving. | Uses topic modeling on free-text responses to identify 18 problem-solving types. | Medium | Medium | High | Medium | Good |
| Predictive AI [17] | Need for improved learner classification for interventions. | Uses k-means and decision trees to segment students for targeted support. | High | Medium | High | Medium | Very Good |
| MOOC Engagement Prediction | |||||||
| Hybrid Engagement Model [18] | Difficulty predicting engagement from complex MOOC data. | Combines unsupervised clustering, BiLSTM, and decision trees. | High | Medium | Medium | Medium | Very Good |
| Video Style Impact Study [19] | Uncertainty on best video modalities for engagement. | Classifies video styles and correlates with engagement types. | Medium | High | Very High | Medium | Good |
| Optimized CNN Model [20] | Need for lightweight real-time model. | Upgrades ShuffleNet v2 with attention; outperforms Inception V3 and ResNet. | High | High | High | Low | Very Good |
| MOOC Dropout Prediction Models | |||||||
| Fractional-Iterative BiLSTM [21] | Conventional models struggle with feature identification. | Uses fractional calculus in BiLSTM to capture nuanced behavior. | High | Medium | Medium | Medium | Good |
| Deep Neural Network [22] | Sparse hand-crafted features hinder prediction. | Uses 17 features from 3,000 students in a DNN. | High | High | Medium | High | Very Good |
| Self-Supervision from Clickstream [23] | Clickstream behavior is underutilized. | Uses self-supervised skip-gram + PCA for better dropout prediction. | Medium | High | Medium | Medium | Good |
| Integrated deep learning and machine learning [24] | Dropout factors are multifaceted and underaddressed. | Integrates DL and ML for adaptive interventions. | Medium | High | Medium | Medium | Good |
| CNN + RNN Hybrid [25] | High dropout in STEM MOOCs; few early warnings. | Combines CNN and LSTM to analyze behavioral sequences. | High | High | Medium | High | Very Good |
| Personalized Learning in MOOCs | |||||||
| Knowledge-based Recommender [26] | Cold start and lack of personalization in recommendations. | Combines semantic web rules and clustering based on learning styles. | High | Medium | High | Medium | Very Good |
| Personalized Learning Exploration [27] | Need for diverse behavior-based recommendations. | Deep learning-based analysis of diverse learner data. | Medium | High | Medium | High | Very Good |
| Sentiment Analysis for Personalization [28] | Learner feedback is underused for personalization. | Combines sentiment analysis with engagement metrics. | Medium | Medium | High | Medium | Good |
| Eye-Tracking Recommendations [29] | Observing non-intrusive behavior for personalization is difficult. | Uses eye-tracking and DL to suggest courses. | Medium | Medium | High | Medium | Good |
| Student Performance Prediction in Online Learning | |||||||
| Behavior-Integrated Prediction [32] | ML models often ignore behavior logs. | Integrates clustering with ML models to include behavior. | High | High | Medium | Medium | Very Good |
| Spiking Neural Networks [33] | Course completion prediction from massive logs is hard. | Uses SNNs to connect behavioral data to completion. | High | High | Low-Medium | High | Very Good |
| ML on Diverse Features [34] | Traditional models use limited data for predictions. | Combines LR and RF on demographics, assessments, and logs. | Medium | High | High | Medium | Very Good |
Table 2.
Hyperparameter Settings for TSA-GRU Model
| Hyperparameter | Value |
|---|---|
| Number of Attention Heads | 4 |
| Hidden Dimension (Embedding) | 128 |
| Learning Rate | 0.001 |
| Batch Size | 64 |
| Number of Epochs | 5 |
| Optimizer | Adam |
| Dropout Rate | Not used |
| Loss Function | Binary Cross-Entropy |
| Sequence Length | 10 |
| GRU Hidden Units | 128 |
| Weight Initialization | Xavier Normal |
| Sparsity Threshold | 50% of max attention score |
| Total Parameters | 166,017 |
Table 3.
Comparative Analysis of Knowledge Tracing Methods
| Model | Train Loss | Train Accuracy | Test Loss | Test Accuracy |
|---|---|---|---|---|
| MSA-GRU | 0.0667 | 81.36% | 0.0222 | 80.00% |
| BKT | 0.6651 | 64.10% | 0.6691 | 64.01% |
| PFA | 0.6334 | 63.63% | 0.6363 | 64.11% |
| TSA | 0.0678 | 75.06% | 0.0238 | 74.83% |
| TSA-GRU | 0.0296 | 95.62% | 0.0209 | 95.60% |
Table 4.
Confidence Interval and Variability Analysis of Models
| Model | Mean Accuracy | Standard Deviation (SD) | 95% Confidence Interval (CI) |
|---|---|---|---|
| TSA-GRU | 95.63% | ±0.0014 | ±0.0013 |
| MSA-GRU | 65.21% | ±0.0346 | ±0.0430 |
Disclaimer/Publisher’s Note: The statements, opinions and data contained in all publications are solely those of the individual author(s) and contributor(s) and not of MDPI and/or the editor(s). MDPI and/or the editor(s) disclaim responsibility for any injury to people or property resulting from any ideas, methods, instructions or products referred to in the content. |
© 2025 by the authors. Licensee MDPI, Basel, Switzerland. This article is an open access article distributed under the terms and conditions of the Creative Commons Attribution (CC BY) license (http://creativecommons.org/licenses/by/4.0/).
Copyright: This open access article is published under a Creative Commons CC BY 4.0 license, which permit the free download, distribution, and reuse, provided that the author and preprint are cited in any reuse.


