

Submitted:
10 June 2025
Posted:
12 June 2025
You are already at the latest version
Abstract
Personalized learning environments increasingly rely on learner modeling techniques that integrate both explicit and implicit data sources. This study introduces a hybrid profiling methodology that combines psychometric data from an extended Felder–Silverman Learning Style Model questionnaire with behavioral analytics derived from Moodle Learning Management System interaction logs. A structured mapping process is employed to associate over 200 unique log event types with FSLSM cognitive dimensions, enabling dynamic, behavior-driven learner profiles. To evaluate the effectiveness and generalizability of the approach, experiments were conducted across three large-scale datasets: a university dataset from the International Hellenic University, a public dataset from Kaggle, and a combined dataset totaling over 7 million log entries. Deep learning models—including a Sequential Neural Network, BiLSTM, and a pretrained MLSTM-FCN—were trained to predict student performance across regression and classification tasks. Results show high accuracy in binary classification, moderate success in 3-class prediction, and limited effectiveness in fine-grained grade regression and 11-class classification. The proposed framework demonstrates the potential of combining static and behavioral data for scalable personalization in smart learning systems, paving the way for more adaptive, data-driven educational interventions.
Keywords:
Learning Style Modeling
; Personalized Learning
; LMS Behavior Analytics
; Felder–Silverman Model (FSLSM)
; Adaptive Learning Systems
; Educational Data Mining
; Moodle Personalization
; Behavior-Based Profiling
1. Introduction
In the era of digital transformation in education, the need for personalized learning has emerged as a critical factor to enhance the effectiveness of the learning process. Understanding individual differences between students, particularly learning styles, constitutes a fundamental aspect of personalized education. The Felder–Silverman Learning Style Model (FSLSM) is a widely recognized framework that categorizes learning preferences in four dimensions, offering a comprehensive approach to understanding how learners process, perceive, receive, and comprehend information [1,2].
Learning Management Systems (LMSs), such as Moodle, have become significant sources of data regarding student behavior in online learning environments. The Moodle-generated logs for each user action store valuable information about learners’ activities and preferences. Analyzing these data can provide invaluable information on student learning styles and support the provision of personalized and customized learning experiences [3,4,5].
Traditionally, the identification of learning styles has been based on self-assessment questionnaires. However, contemporary approaches seek to exploit automated methods based on technologies such as data mining and artificial intelligence to enable the implicit detection of learning styles through the analysis of LMS log files. These methods aim to uncover patterns, preferences, and behavioral trends among students within the learning platform [6,7].
In this study, we propose a hybrid learner profiling methodology that integrates explicit psychometric profiling—via an extended FSLSM questionnaire—with behavioral analytics extracted from LMS interaction logs. A structured mapping framework translates raw log events into cognitive learning style dimensions, thereby enabling a richer, behavior-driven personalization strategy. To validate the robustness and generalizability of our approach, we conducted experiments using three large-scale datasets: (i) a real-world dataset from the International Hellenic University (IHU), containing over 4.3 million Moodle log entries; (ii) a public dataset from Kaggle, representing a different institutional and pedagogical context; and (iii) a merged dataset combining the two, totaling over 7 million interaction records.
We evaluate our approach through a series of prediction tasks—regression, binary classification, three-class, and eleven-class grade prediction—using three deep learning architectures: a feedforward neural network, a BiLSTM, and a pretrained MLSTM-FCN. The results reveal the strengths and limitations of behavior-based learner modeling and offer insight into the feasibility of large-scale personalization in diverse educational settings.
The remainder of this paper is structured as follows: Section 2 introduces the theoretical foundations of the Felder–Silverman Learning Style Model (FSLSM), which underpins the learner profiling framework. Section 3 reviews prior work in learner modeling and behavioral analytics in educational settings. Section 4 presents the proposed methodology for mapping LMS interaction data to cognitive learning style dimensions. Section 5 describes the datasets, prediction tasks, and the deep learning architectures employed. Section 6 reports the experimental findings across regression and classification tasks, while Section 7 presents the learning outcomes. Furthermore, Section 8 interprets the results in light of pedagogical theory and system design considerations. Finally, Section 9 summarizes the key contributions and outlines directions for future research.
2. Felder–Silverman Learning Style Model (FSLSM)
The Felder–Silverman Learning Style Model (FSLSM) is a widely adopted framework for describing individual learning preferences across four cognitive dimensions: processing (active vs. reflective), perception (sensing vs. intuitive), reception (visual vs. verbal), and understanding (sequential vs. global) [8]. It was originally developed for engineering education but has since been applied extensively in personalized learning systems [2].
Learner profiling under FSLSM is typically performed using the Index of Learning Styles (ILS) questionnaire, a 44-item self-assessment tool that classifies learners’ preferences by degree (balanced, moderate, or strong). The resulting profiles support pedagogical adaptation, including content delivery and interface design [9,10].
Beyond self-reported styles, recent research has emphasized behavioral profiling through LMS analytics. Studies have mapped user actions—such as quiz activity, forum engagement, and resource navigation—to FSLSM dimensions, enabling dynamic, data-driven personalization [4,11].
FSLSM-based personalization has been integrated into various recommendation systems using content-based, collaborative, and hybrid filtering techniques, as well as machine learning approaches such as decision trees, SVMs, and neural networks. These systems aim to align learning resources with cognitive preferences, often achieving improvements in engagement and performance [12,13].
Overall, FSLSM remains a foundational model in adaptive learning research. When combined with behavioral analytics, it enables intelligent systems to deliver more tailored and effective learning experiences in LMS-based environments.
3. Related Work
Recent years have witnessed a growing interest in developing personalized e-learning environments by leveraging learning style models, behavioral data, and recommendation technologies. A variety of studies have proposed frameworks that detect, model, or utilize students’ learning styles, often based on the Felder–Silverman Learning Style Model (FSLSM), to enhance learning outcomes and adapt educational content.
Nazempour and Darabi [6] proposed a behavior-based personalized learning approach in virtual environments, using data mining techniques to extract meaningful learning patterns from LMS log data. Their work emphasizes the potential of behavioral analytics in implicitly detecting learning preferences and improving adaptive learning strategies. Murtaza et al. [7] addressed the challenges of AI-based personalized e-learning systems by proposing a framework that integrates multiple machine learning techniques for real-time adaptation. Their approach focuses on scalability and robustness, particularly emphasizing the dynamic modeling of user learning profiles.
Zlatkovic et al. [14] adjusted the FSLSM within Moodle-based adaptive e-learning systems. They developed a method to calibrate learning object delivery to match the learning styles inferred from FSLSM dimensions, aiming to improve learner engagement, while Zagulova et al. [15] conducted an empirical analysis linking FSLSM-based learner profiles to academic performance. Their findings suggest that personalization based on learning styles can have a measurable impact on student success, particularly in e-learning contexts.
Furthermore, Fernando-Raguro et al. [11] explored the extraction of student engagement patterns from LMS logs using decision trees and K-means clustering. Their work demonstrates the feasibility of deriving learner behavior patterns and grouping students accordingly to personalize learning interventions. Kaur et al. [16] developed an intelligent profiling system within an e-learning environment aimed at enhancing user adaptation. Their system used behavioral indicators combined with clustering methods to build adaptive learning pathways.
Valencia et al. [8] proposed the classification of learning styles based on Bayesian Networks, directly utilizing responses from the Index of Learning Styles (ILS) questionnaire. Their approach highlighted the potential of probabilistic models in accurately predicting learner profiles. Also, Hasibuan et al. [12] designed a recommendation model for learning materials tailored to students’ FSLSM profiles. Their system maps learning resources to specific FSLSM dimensions and recommends content accordingly, achieving notable improvements in user satisfaction.
Ezzaim et al. [3,4] conducted a systematic review on AI-based learning style detection methods. Furthermore, in their implementation study [14], they developed a machine learning-based multi-factor adaptive system that combines learning styles with performance metrics to drive content recommendation.
Moreover, Ait Daoud et al. [2] applied FSLSM-based analysis to student interaction data within a blended learning Moodle course. They examined how different FSLSM dimensions correlate with students’ engagement and performance in a real educational setting. Nafea et al. [10] proposed a learning object recommendation framework grounded in FSLSM dimensions. They integrated collaborative filtering and content-based filtering strategies, aiming to improve recommendation accuracy through hybridization.
Prabpal and Nitiwatthana [13] enhanced the detection of learning styles using advanced machine learning techniques, proposing improved feature engineering approaches for higher classification accuracy based on behavioral data. Buciuman and Potra [9] explored the integration of eye-tracking data with AI models to support personalized learning environments. Their study proposed that multimodal data sources could further refine learning style detection and adaptive interventions.
Hwang et al. [1] investigated the necessity of adaptive learning systems by empirically examining learning outcomes across different learning style groups. Their work validated the pedagogical significance of adapting instruction to learning style preferences.
Finally, in our previous work, [5] we developed a predictive model for student performance using educational data mining techniques. While their primary focus was on performance prediction, their study reinforces the importance of fine-grained learner modeling for personalization.
4. Personalization Process
As highlighted in the related work (Section 3), significant progress has been made in utilizing learning style models and behavioral analytics to personalize educational experiences. However, most existing approaches either focus narrowly on recommending learning materials or rely predominantly on static learner profiling. There remains a need for methodologies that can dynamically map learner behaviors to cognitive styles, enabling the creation of truly personalized knowledge pathways tailored to each learner’s capabilities.
Motivated by this gap, our study aims to design and evaluate a hybrid framework that combines explicit learning style profiling with behavioral indicators extracted from LMS interactions. By doing so, we seek to build detailed learner models that go beyond surface-level personalization and facilitate individualized knowledge construction based on students’ preferred cognitive processing modes. This approach aspires not only to recommend appropriate content but also to support learners in navigating educational environments more effectively according to their intrinsic strengths and needs.
In the following sections, we describe the overall profiling framework, the mapping of LMS events to FSLSM dimensions, and the data analysis procedures adopted in our study.
4.1. Learner Profiles Based on FSLSM
Following FSLSM [2,9], learners are categorized across four main dimensions: active/reflective, sensing/intuitive, visual/verbal, and sequential/global. Each dimension reflects a specific cognitive preference that influences how learners interact with educational materials. Based on prior work [2,6], we define eight detailed learner profiles: Active, Reflective, Sensing, Intuitive, Visual, Verbal, Sequential, and Global.
Each profile is characterized by preferred interaction types:
- Active learners favor direct engagement (e.g., quizzes, assignments).
- Reflective learners benefit from exploratory, discussion-based activities.
- Sensing learners engage with concrete and factual content (e.g., multimedia).
- Intuitive learners prefer abstract and conceptual material.
- Visual learners excel with diagrams, videos, and visual aids.
- Verbal learners thrive with text-based or linguistic tasks (e.g., forums).
- Sequential learners appreciate linear, step-by-step learning.
- Global learners prefer holistic, big-picture approaches.
A graphical overview of the FSLSM learner profiles and their preferred interaction types is presented in Figure 1.
4.2. Mapping LMS Interaction Logs to Learner Profiles
To effectively construct dynamic learner profiles, it is critical to accurately interpret user interaction behaviors recorded within the LMS environment. In this study, Moodle platform logs were analyzed, capturing diverse types of student actions, such as quiz attempts, forum posts, content views, assignment submissions, and time-on-task metrics.
The primary dataset utilized was extracted from Moodle’s mdl_logstore_standard_log table. Specifically, we used the data set from the Department of Computer, Informatics and Telecommunications Engineering at the International Hellenic University (IHU) in Serres, Greece, featuring over 60 courses across 10 semesters for its undergraduate program, and log info of around 6000 students. This table systematically records every significant student interaction occurring within the platform. Each log entry includes, among other things, four critical attributes that we focus on to create a student’s behavioral patterns:
- log_eventname: A textual description of the event type (e.g., "Course viewed", "Quiz attempted"),
- log_action: The action associated with the event (e.g., "create", "view", "update"),
- log_target: The object or target that the event concerns (e.g., "course", "quiz", "assignment"),
- log_objecttable: The database table associated with the object (e.g., course, quiz_attempts).
To align behavioral data with FSLSM learning profiles, we first generated all possible combinations of four key behavioral indicators from the Moodle logs, resulting in over 200 unique interaction types. Each combination represented a distinct learning behavior, which we contextualized using the official Moodle documentation.
For each unique pattern, we assigned a descriptive label (e.g., “Assignment submission,” “Quiz viewed”) and grouped it into broader pedagogical categories such as content engagement, assessment, or collaboration. This step translated raw system logs into meaningful educational actions.
Next, we mapped each event type to FSLSM dimensions using a structured three-phase approach. First, actions were classified by pedagogical intent—e.g., active (e.g., quiz submission) versus passive (e.g., resource viewing). Then, these were aligned with relevant FSLSM dimensions based on prior literature [2,6] and Moodle-specific behaviors. Finally, a scoring system (+1, 0, –1) was applied to indicate alignment strength, and scores were normalized across learners to enable comparisons.
This mapping process enabled the creation of dynamic, behavior-based FSLSM profiles that complement traditional questionnaire-based assessments, allowing for more robust and adaptive learner modeling.
4.3. Data Analysis Process
The behavioral mapping process follows a structured six-step pipeline, enabling the transformation of LMS interaction logs into cognitively meaningful FSLSM learner profiles. The steps are outlined below:
-
Event Classification:
- –
- LMS log entries are reviewed and labeled based on their pedagogical function.
- –
- Events are grouped into categories such as active participation (e.g., quiz submissions), reflective exploration (e.g., forum reading), or sensory engagement (e.g., video watching).
-
FSLSM Dimension Mapping:
- –
- Each event category is mapped to one or more FSLSM dimensions (e.g., Active, Visual, Sequential).
- –
- This mapping is based on empirical literature and domain-specific pedagogical interpretations.
-
Weight Assignment:
- –
-
A numeric score is assigned to each event-dimension pair:
- *
- for strong positive alignment,
- *
- 0 for neutral/no clear association,
- *
- for negative/misaligned behavior.
-
Profile Construction:
- –
- Learners’ behavioral scores are aggregated across all logged interactions.
- –
- The result is a multi-dimensional cognitive profile vector reflecting FSLSM-aligned behavior.
-
Cross-Validation with Questionnaire Data:
- –
- Behavioral profiles are compared to the results of the FSLSM Index of Learning Styles (ILS) questionnaire.
- –
- Any mismatches between observed behavior and self-reported preferences are flagged for interpretation.
-
Normalization and Interpretation:
- –
- Final scores are normalized to a common scale across all learners.
- –
- Profiles are interpreted to reveal dominant or moderate tendencies per FSLSM dimension.
- –
- This step supports adaptive personalization strategies and learner clustering.
This structured procedure bridges the gap between static questionnaire assessments and dynamic behavioral observations, enabling more robust personalization in LMS environments, as shown in Figure 2.
4.4. Example Analysis of Learner Profiles
To demonstrate the implementation of our methodology, we present an indicative learner profile derived from actual LMS interaction logs, as shown in Table 1. The dataset was extracted from a Moodle-based environment and pre-processed to identify behavioral patterns across multiple interaction types, including resource views, quiz submissions, forum activity, and content navigation.
Each log event was classified and assigned a score based on its pedagogical intent, then mapped to the appropriate FSLSM dimension using the weighted scheme outlined in Section 4.3. Cumulative scores were computed per dimension, providing a multi-dimensional behavioral representation of the student.
The input data for this analysis consisted of raw Moodle logs containing event-level metadata (e.g., event type, resource ID, timestamp, user ID). Each event was tagged and weighted according to its correspondence to FSLSM dimensions, as explained in Section 4.3. After aggregation and normalization, the scores reflected the degree to which the student’s interactions aligned with each learning style.
This fine-grained behavioral profiling enables targeted personalization strategies. For example, a student scoring high on Active and Visual dimensions could benefit from interactive simulations and video content, while another with stronger Verbal and Intuitive tendencies might receive in-depth reading materials and conceptual explanations. Furthermore, scores such as Stochastic (a derived metric capturing unstructured navigation behavior) provide insight into students’ tolerance for non-linear learning experiences, supporting dynamic adjustment of content flow.
The complete dataset with all unique interaction mappings and profile scores is available in Appendix A for reproducibility and further exploration. Such modeling facilitates adaptive learning environments that respond not only to learners’ stated preferences, but also to their actual behavioral signatures.
5. Model Training and Methodology
In this section, we present a unified framework that simultaneously supports four distinct prediction tasks and evaluates its performance across three different datasets using three deep learning architectures. Our aim is to rigorously examine the capability of each model architecture to generalize across dataset contexts and prediction objectives, and to provide a robust comparative analysis of their predictive effectiveness.
5.1. Datasets
To evaluate the effectiveness and generalizability of the proposed framework, we employed three datasets, each representing different learning contexts and data distributions. The first dataset, provided by the IHU research team, contains anonymized learning analytics data collected from a Greek higher education institution. Includes detailed student activity logs, quiz performances, and final course grades. The IHU dataset consists of 856 final grades across 14 courses in all semesters, which corresponds to more than 4.3 million log lines in the Moodle database, which were used for the models’ training and testing.
The second data set was obtained from a publicly available source on Kaggle and reflects student activity within a different educational context. Includes anonymized Moodle logs from a set of online learning courses, along with associated metadata such as quiz scores, course completion statuses, and final grades. The data set comprises 1,018 unique student grade records in multiple online courses, totaling approximately 2.7 million Moodle log entries. Although similar in structure to the IHU dataset, the Kaggle dataset differs in its course design, grading scheme, and student demographics, making it a valuable benchmark for testing the cross-context generalizability of our models. In particular, event types and naming conventions required harmonization prior to integration into the unified framework.
The third data set was constructed by merging the IHU and Kaggle data sets into a unified data set. This combined data set contains 1,874 student grade records and more than 7 million Moodle log entries. To ensure compatibility, a comprehensive data cleaning and feature alignment process was applied. This included normalizing the grading scales, aligning log-event taxonomies, and unifying user behavior features such as quiz attempts, time-on-task, and interaction frequency. The resulting data set preserves the heterogeneity of both educational environments while allowing more robust model training through increased sample diversity and size. This data set serves as a critical component in evaluating transfer learning approaches and assessing the extent to which learned representations generalize across institutional and pedagogical boundaries.
Preprocessing steps included the removal of missing or incomplete rows, the standardization of numerical features using z-score normalization (via StandardScaler), and the encoding of categorical variables. Furthermore, to extract actionable learning signals from the raw Moodle logs, we implemented a comprehensive feature engineering pipeline using a custom function, createlogfeatures(). This function transformed the raw event-level log data — which includes millions of interactions per dataset — into a structured tabular format suitable for predictive modeling. Instead of using the logs directly, which are unstructured and heterogeneous, we aggregated user interactions over defined semantic categories and time frames to derive meaningful behavioral metrics for each student-course pair. More specifically, the function extracted the following core categories of features:
- Engagement Metrics: Quantifies core user activities, such as viewing resources, submitting assignments, attempting quizzes, and accessing forums. These behaviors reflect distinct types of learning engagement (e.g., content consumption, assessment, social participation).
- Temporal Dynamics: Captures the learner’s activity pacing and persistence through features like total interaction time, time elapsed since first login, and intervals between quiz attempts.
- Assessment Behavior: Includes quiz-specific indicators—number of attempts, average grades, and score variability—revealing not only performance but also learning consistency and strategy.
- Breadth and Consistency of Participation: Measures regularity and dispersion of activity via login frequency, active days, and temporal distribution of events, helping to distinguish between steady, irregular, and passive learners.
- Course-Specific Activity Normalization: Applies normalization (min-max or z-score) to adjust features based on course structure, duration, and resource density—ensuring fair cross-course comparisons and unbiased model training.
The decision to engineer structured features from Moodle logs was informed by established practices in learning analytics and educational data mining, which suggest that derived behavioral features often enhance predictive performance compared to raw logs or clickstream data. Moreover, the transformation from sparse high-dimensional logs to dense, interpretable features enabled the use of feedforward neural networks and other classical machine learning models that rely on fixed-size vector inputs. Importantly, these features served as the unified input representation across all datasets (IHU, Kaggle, and Combined), ensuring consistency in model input space and facilitating fair comparative evaluation across different learning environments. This process not only enhanced model accuracy but also improved the explainability and transferability of the results, allowing us to interpret how specific behaviors relate to learning outcomes such as grade prediction and course completion classification.
5.2. Prediction Tasks
To comprehensively assess the capacity of learning analytics models to predict meaningful academic outcomes, we designed and executed four distinct prediction tasks. Each task targeted a different formulation of the student performance prediction problem, ranging from numeric regression to multi-class classification. These tasks were constructed to reflect diverse evaluation goals in educational contexts—such as early warning systems, grade forecasting, and dropout detection. Importantly, each task was tested under multiple model architectures and dataset variations, allowing for robust comparative evaluation.
5.2.1. Task 1: Final Grade Regression (0–10 Scale)
Task 1 approached student performance prediction as a continuous regression problem, with the goal of estimating final course grades on a 0–10 numerical scale. This fine-grained formulation supports applications such as personalized feedback, performance forecasting, and adaptive learning interventions by providing specific grade predictions rather than broad categories.
The regression framework was implemented using a neural network architecture, with different variants including a sequential feedforward network, a Bidirectional Long Short-Term Memory (BiLSTM) network, and the pre-trained MLSTM-FCN (Multivariate Long Short-Term Memory Fully Convolutional Network), known for its performance on time-series prediction tasks. Each model was equipped with a regression head consisting of a single output neuron and a sigmoid activation function. To align with the activation range, all target grade values were normalized using min-max scaling to the interval [0, 1] during training and subsequently rescaled back to the original [0, 10] range for evaluation.
The models were optimized using the Mean Absolute Error (MAE) loss function, which is robust to outliers and directly interpretable in terms of grade-point deviations. Additional evaluation metrics included the Mean Absolute Percentage Error (MAPE) and the coefficient of determination (), providing complementary perspectives on prediction accuracy and variance explained.
While this regression-based approach offers the highest level of granularity among all prediction tasks, it is also susceptible to specific challenges. Final grade distributions in educational contexts are often skewed or exhibit multimodal characteristics, with dense clusters around key thresholds such as the minimum passing score or the perfect grade. This distributional bias introduces difficulties in learning accurate mappings, especially in underrepresented grade ranges. Moreover, small numeric differences can carry significant pedagogical implications—for instance, predicting a 4.8 versus a 5.1 may determine whether a student fails or passes, despite being a minor numerical deviation.
Despite these challenges, regression remains a valuable tool for continuous performance estimation, especially when integrated into feedback-rich educational ecosystems or when used in conjunction with discretized classification outputs for decision-making support.
5.2.2. Task 2: Binary Classification (Fail vs. Pass)
In Task 2, the predictive objective was framed as a binary classification problem, distinguishing students who failed the course from those who passed. The final course grades were binarized using a threshold commonly adopted in the Greek educational system: students receiving a final score below 5.0 were labeled as “Fail,” while those with scores of 5.0 or higher were labeled as “Pass.” This formulation supports practical educational goals, such as early detection of at-risk learners and timely intervention by instructors.
The classification model employed a dense output layer with a single neuron and a sigmoid activation function, producing a probability estimate for the positive class (Pass). Binary cross-entropy was used as the loss function. Given the presence of class imbalance in most educational datasets—often with more students passing than failing—the training procedure incorporated class weighting to prevent bias in favor of the dominant class.
Evaluation metrics included classification accuracy, precision, recall, and F1-score, offering a comprehensive view of both the correctness and reliability of the model in identifying students at risk of failure. In particular, recall was prioritized as a metric of interest for educational settings, since false negatives (i.e., students predicted to pass but who actually failed) represent a significant concern for timely support.
The binary classification formulation brings certain advantages. It abstracts away small fluctuations in grades, making the model less sensitive to borderline performance and more robust in practical deployment. It also aligns with institutional policies that typically require a clear pass/fail distinction for administrative decisions, such as graduation eligibility or remedial support.
However, this abstraction comes with limitations. By collapsing a wide range of scores into two categories, the model loses the ability to differentiate between near-threshold cases—for example, a student scoring 4.9 is treated identically to one scoring 0.0, despite potentially having very different learning trajectories. Similarly, a student with a grade of 5.1 is classified as a clear pass, even if they exhibit signs of academic struggle. Thus, while effective for coarse filtering and alert systems, this task may oversimplify complex learner profiles and benefit from complementing finer-grained tasks such as regression or multi-class classification.
5.2.3. Task 3: Multi-Class Classification (Three-Category Performance Prediction)
In this task, the objective was to classify students into one of three performance categories based on their final course grades. The original continuous grade values were discretized into three pedagogically meaningful intervals: low performance (0.0–4.9), marginal pass (5.0–7.0), and high performance (7.1–10.0). This formulation represents a compromise between the simplicity of binary pass/fail classification and the granularity of full-grade prediction, offering both interpretability and modeling precision.
To implement this classification, a neural network architecture was constructed with a dense output layer comprising three neurons, each corresponding to one of the predefined grade classes. The model employed a softmax activation function to output class probabilities and was optimized using categorical cross-entropy loss. Ground-truth grade labels were encoded using one-hot vectors, facilitating compatibility with standard multi-class classification training pipelines.
Evaluation metrics included overall accuracy, macro-averaged F1-scores, and confusion matrices to assess class-specific prediction performance and identify systematic misclassifications. These metrics provided a robust framework for assessing model generalization, particularly in the presence of class imbalance.
This task offers several advantages. By segmenting performance into pedagogically relevant categories, the model supports more nuanced predictions and enhances the interpretability of results in real-world educational scenarios. Furthermore, the reduced number of output classes simplifies the learning task, which can mitigate overfitting and improve stability on smaller datasets.
Nonetheless, the approach is not without limitations. The discretization process may obscure fine-grained differences between students who fall near class boundaries, potentially leading to misclassification and reduced sensitivity. Additionally, imbalanced class distributions—common in educational datasets—require mitigation strategies such as resampling or class-weighting to ensure fair and reliable model performance across all categories.
5.2.4. Task 4: Fine-Grained Grade Classification (11-Class Prediction)
In the most detailed predictive formulation, the model was trained to classify students into one of eleven discrete categories, corresponding to the full range of integer grades from 0 to 10. Prior to training, all final grades were rounded to the nearest integer to form a categorical target variable. This setup enables a fine-grained analysis of model performance in distinguishing subtle variations in academic achievement.
A neural network classifier with eleven output neurons was used, employing a softmax activation function to estimate the probability distribution over the grade classes. The target labels were one-hot encoded, and the model was trained using categorical cross-entropy loss, appropriate for multi-class classification tasks with mutually exclusive categories.
This task presents several significant challenges. First, grade distributions are inherently imbalanced, with natural clustering around central grades (e.g., 5, 6) and peak performance (e.g., 10), which can bias the model toward overrepresented classes. Additionally, the high cardinality of the output space increases the model’s complexity and susceptibility to overfitting, particularly in cases where the training set is limited or skewed. Another critical issue is the frequent confusion between adjacent grade classes—such as 6 and 7—since these represent marginal performance differences and may exhibit overlapping behavioral features.
Despite these challenges, the task is pedagogically relevant in contexts where precise grade estimation is required, such as automated grading systems or performance dashboards. However, its practical applicability depends heavily on achieving sufficiently high accuracy and mitigating the effects of class imbalance. When used appropriately, this formulation offers the highest resolution in modeling academic performance, enabling a more nuanced understanding of student outcomes.
5.3. Deep Learning Architectures
To address the range of prediction tasks in this study, we implemented three distinct deep learning architectures: a feedforward neural network, a bidirectional recurrent model, and a hybrid convolutional-recurrent model. These were selected to explore different modeling capacities—from static tabular data to complex multivariate time series representing student behavioral sequences.
- Sequential Feedforward Neural Network: Serves as the baseline model, consisting of stacked dense layers with ReLU activations, dropout, and L2 regularization. The output layer varies by task: sigmoid for binary classification and regression (with post-scaling), softmax for multiclass classification. Despite its simplicity, this model performs reliably on tabular datasets and low-complexity tasks such as binary classification.
- Bidirectional LSTM (BiLSTM) Network: Introduces temporal modeling by processing input sequences in both forward and backward directions. This architecture includes one BiLSTM layer followed by dense layers and dropout. It is suited for capturing longitudinal patterns in student engagement, such as time-based progression of quiz activity or session frequency.
-
Pretrained MLSTM-FCN Model: Combines a multivariate LSTM with a fully convolutional network (FCN) in a dual-branch configuration [17]. The LSTM branch learns long-term behavioral dependencies, while the CNN branch identifies local activity motifs using 1D convolutional filters. An optional attention layer further enhances interpretability by emphasizing influential time steps in user sequences.
- –
- LSTM Branch: Models time-dependent behavioral evolution (e.g., changes in participation intensity).
- –
- CNN Branch (FCN): Detects short-term patterns (e.g., peaks in resource usage or forum posts).
- –
- Attention Mechanism: Highlights the most critical time windows for prediction, aiding model transparency.
- Pretraining and Transfer Learning Strategy: The MLSTM-FCN model was pretrained on the combined IHU and Kaggle dataset, enabling it to learn generalizable patterns across institutions. It was then fine-tuned on each downstream task using stratified sampling, early stopping, and learning rate decay (). This strategy mitigated overfitting and improved performance in data-sparse scenarios, such as 11-class classification.
- Implementation Notes: Input sequences were constructed using a custom feature engineering function (createlogfeatures). Regularization included dropout (0.3–0.5), L2 weight decay, and batch normalization. Pretraining involved balanced sampling across grade categories to reduce bias, while fine-tuning employed early stopping to ensure generalization without catastrophic forgetting.
Overall, the architecture choices reflect a progression from simple, interpretable models to complex temporal learners. This allowed us to systematically investigate the trade-offs between modeling capacity and data complexity in the context of educational prediction tasks.
6. Data Training Results
Across the combination of three datasets, four task types, and three model architectures, a total of 36 distinct experiments were conducted. Each model was trained and evaluated independently for each task-dataset pair, and performance metrics were collected on the respective test sets. The results presented here summarize the performance trends and comparative evaluations.
6.1. IHU Dataset
This subsection presents a detailed analysis of the model performance across all tasks applied to the IHU dataset, including regression and classification with increasing granularity (binary, 3-class, and 11-class). The models under evaluation—Sequential, BiLSTM, and Pretrained MLSTM-FCN—were assessed using standard metrics to evaluate their predictive ability on behavioral time series extracted from LMS interaction logs. Table 2 reports the results of predicting final grades as a continuous outcome. All models yielded similar mean absolute errors (MAE), with values approximately 2.0. The Sequential model achieved the lowest MAE (2.06), followed closely by MLSTM-FCN and BiLSTM. However, all models exhibited low values (), suggesting minimal explanatory power and limited capacity to capture grade variance through behavioral logs alone. These results underscore the challenges of using sequential clickstream data for fine-grained prediction of academic performance.
Binary classification performance, summarized in Table 3, demonstrates greater model stability and predictive reliability. The Sequential model achieved the highest accuracy (64%) and F1-score, with BiLSTM and MLSTM-FCN trailing slightly. Precision and recall scores were balanced, indicating that misclassification occurred near the threshold boundary rather than due to systemic bias.
In the 3-class classification task, accuracy scores ranged from 49% to 55%, with macro F1-scores revealing clear class imbalance issues (Table 4). The Sequential model again delivered the best overall performance, although all models struggled to predict the middle class (grades 5–7) accurately. The Pretrained MLSTM-FCN model showed relatively better recall for high-performing students (7.1–10 range), while the BiLSTM model exhibited strong bias toward the lowest performance tier.
The 11-class classification task yielded the poorest results across all models (Table 5), with accuracies barely exceeding 13% and macro F1-scores below 0.10. These results reflect near-random behavior, primarily due to class imbalance and sparsity in several grade intervals. Predictions were largely concentrated around 2–3 dominant classes, with negligible recall for less frequent grades. The limitations of traditional classification models in this setting suggest the need for ordinal-aware or hierarchical architectures.
Overall, the Sequential model demonstrated the most consistent and generalizable performance across tasks, particularly in binary and 3-class classification. Regression performance remained limited across all models, highlighting the challenges of modeling continuous academic outcomes from behavioral features alone. The 11-class task was not feasible under current conditions, underscoring the importance of addressing class imbalance and exploring alternative representations for grade prediction.
6.2. Kaggle Dataset
This section presents a comparative evaluation of the three deep learning architectures—Sequential, BiLSTM, and Pretrained MLSTM-FCN—on the Kaggle dataset. Four predictive tasks are analyzed: regression, binary classification, 3-class classification, and 11-class classification. Compared to the IHU dataset, the Kaggle dataset demonstrates improved consistency in regression, yet classification performance exhibits continued challenges under fine-grained label structures. As shown in Table 6, all models achieved comparable MAE scores (approximately 1.64). However, negative values across models indicate that none succeeded in explaining the variance in final grades. While behavior logs from the Kaggle dataset provided richer signals than IHU, the models failed to generalize beyond surface-level temporal patterns, suggesting the need for more expressive features or hybrid modeling.
Binary classification results, detailed in Table 7, show relatively high overall accuracy (around 80%) across all models. However, performance on the minority “Fail” class remains weak, with F1-scores below 0.35. The Sequential model slightly outperforms the alternatives in recall, but all models exhibit low precision, limiting their effectiveness for early intervention strategies in at-risk populations.
In the 3-class setting (grades grouped into low, medium, and high performance), classification accuracy improved compared to the IHU dataset, as seen in Table 8. The BiLSTM architecture achieved the highest accuracy (72%), though macro-averaged precision and recall remain modest. These results highlight a trade-off between overall accuracy and balanced class performance. The Pretrained MLSTM-FCN model showed the most conservative behavior, possibly due to overfitting to dominant class distributions.
As with the IHU dataset, the 11-class classification task posed considerable challenges, with all models performing close to random baseline (Table 9). Macro-averaged scores indicate very limited class-wise discrimination. BiLSTM slightly improved on accuracy, but performed worst in precision. These results underscore the difficulty of modeling fine-grained academic labels without addressing class imbalance, ordinal dependencies, or feature enrichment.
Compared to the IHU dataset, the Kaggle dataset enabled slightly improved regression stability, though model generalization remained limited. The Sequential model continued to offer the most consistent performance overall, while BiLSTM achieved peak accuracy in the 3-class task. Binary classification remained the most effective prediction scheme, albeit still hampered by poor recall on the minority class. The results suggest that behavioral interaction sequences can offer modest predictive utility, but only under coarsely defined outcome categories. Fine-grained tasks, especially regression and 11-class classification, require further methodological enhancements to be viable.
6.3. Merged IHU and Kaggle Dataset
To assess cross-domain generalizability, we evaluated the three neural models—Sequential, BiLSTM, and Pretrained MLSTM-FCN—on a merged dataset comprising instances from both the IHU and Kaggle collections. This combined dataset introduces greater heterogeneity in learner behavior, offering a realistic but more challenging testbed for modeling. As shown in Table 10, regression performance across models remained nearly identical, with marginal differences in MAE and RMSE. However, all architectures reported negative values, indicating that none succeeded in modeling grade variance more effectively than a mean-based baseline. The addition of cross-institutional data likely increased label noise and decreased signal coherence, rendering the regression task infeasible without more robust modeling approaches.
Binary classification results, reported in Table 11, favored the Sequential model, which achieved the highest accuracy (83%) and macro F1-score (0.62). Despite this, all models exhibited class imbalance sensitivity, with strong performance on the majority “Pass” class but poor identification of “Fail” instances. While BiLSTM and Pretrained MLSTM-FCN showed comparable performance, neither could offer a satisfactory trade-off between recall and precision for at-risk learners.
The 3-class task (categorizing learners into low, medium, and high performers) exposed key weaknesses in class separability. The Sequential model again yielded the best overall performance (accuracy: 70%, macro F1: 0.45), but all models struggled significantly with the intermediate class (5.0–7.0), as evidenced by low recall and F1-scores. This suggests that behavioral differences between borderline and average performers remain subtle and difficult to detect through time-series alone.
As shown in Table 13, fine-grained grade prediction across 11 distinct categories remained a particularly intractable task. All models hovered around 22% accuracy, with macro F1-scores below 0.15. Class-wise breakdowns revealed near-zero recall for grades below 6.0 and concentration of predictions in the 7.0–9.0 band, reflecting both label skew and the models’ failure to learn meaningful ordinal distinctions.
Results on the combined dataset reveal that model performance does not scale linearly with data volume or diversity. While the Sequential model preserved its status as the most consistent performer across classification tasks, no model demonstrated sufficient generalization capacity for regression or fine-grained classification. The integration of disparate behavioral profiles and grading schemas likely introduced domain drift, complicating pattern extraction. Future work should consider domain adaptation, label harmonization, and multi-modal embeddings to enable better transfer learning in educational settings.
6.4. Model Performance Comparison Across Datasets and Tasks
This section synthesizes the performance of three neural architectures—Sequential, BiLSTM, and Pretrained MLSTM-FCN—across four predictive tasks (regression, binary classification, 3-class classification, and 11-class classification) and three datasets: IHU, Kaggle, and their combined variant. A total of 36 experiments were conducted to systematically assess generalization capacity under heterogeneous learning environments. Table 14 summarizes the highest performing model for each task and dataset combination.
Regression performance was consistently limited across all settings. On the IHU dataset, models yielded poor explanatory power (), despite low MAE values ( 2.1). The Kaggle dataset yielded comparatively stronger results, with MAEs around 1.64 and reaching -0.14—still negative, but more stable. The Combined dataset revealed no improvement, as increased behavioral heterogeneity amplified noise without enhancing signal utility. Across all datasets, regression underperformed, highlighting the inadequacy of raw temporal features for modeling precise grade variance.
Binary classification emerged as the most stable task. Accuracy ranged from 60% (IHU) to 83% (Combined), with the Sequential model generally outperforming alternatives. The Kaggle dataset allowed all models to exceed 77% accuracy, with the MLSTM-FCN achieving up to 81%. However, all settings exhibited persistent issues with class imbalance: minority "Fail" classes were consistently under-recognized, as evidenced by lower F1-scores in this subgroup. This limitation underscores the need for cost-sensitive loss functions or resampling strategies to enhance early intervention capability.
Performance varied notably across datasets. On IHU, all models struggled to distinguish the middle band (5–7), achieving only 55% accuracy and macro F1-scores below 0.50. The Kaggle dataset enabled stronger performance, with MLSTM-FCN reaching 71% accuracy and balanced class-level performance. The Combined dataset yielded modest improvements in overall accuracy (Sequential: 70%), but the mid-range class remained problematic, with recall dropping below 10%. These findings point to the difficulty of capturing nuanced distinctions in borderline student behavior.
This task proved uniformly challenging. Across datasets, model accuracy hovered around 10–27%, and macro F1-scores rarely exceeded 0.20. On IHU, predictions collapsed into dominant classes, with near-zero recall for rare grades. Kaggle’s class distribution allowed slightly better granularity (up to 27% accuracy), particularly in high-grade ranges (8–10). However, the Combined dataset suffered from additional label noise, negating any benefit from increased volume. Across all datasets, the Sequential model demonstrated slightly more stable behavior, but all architectures lacked the resolution to support such fine-grained predictions.
Across all tasks and datasets, the Sequential model consistently delivered the most stable and interpretable performance. While the MLSTM-FCN excelled in specific Kaggle tasks—particularly in binary and 3-class classification—it showed signs of overfitting when exposed to heterogeneous data in the Combined dataset. The BiLSTM generally underperformed in both accuracy and stability, especially in multiclass scenarios. The overall trend suggests that simpler, non-pretrained architectures may be more robust under data shifts, while pretrained models require additional regularization or adaptation techniques to retain generalization capabilities.
The study reveals that model performance is highly sensitive to both task granularity and dataset composition. Binary classification emerges as the most actionable task for real-world educational scenarios, while regression and fine-grained classification remain constrained by the quality and expressiveness of behavioral features. The Sequential model, despite its simplicity, offers the best generalization across datasets. In contrast, pretrained models such as MLSTM-FCN may require domain adaptation or task-specific finetuning to perform consistently in mixed or noisy environments.
To provide a clearer overview of model behavior across different prediction tasks, Figure 3 presents a comparative chart of classification accuracy (binary, 3-class, and 11-class) for the three architectures (Sequential, BiLSTM, and Pretrained MLSTM-FCN) on the IHU, Kaggle, and Combined datasets. The figure reveals that while all models perform reasonably well in binary and 3-class classification, accuracy drops sharply in the 11-class task across all datasets. The Sequential model demonstrates the most consistent performance, especially on the Combined dataset, whereas the Pretrained MLSTM-FCN performs better on Kaggle data but degrades in transfer scenarios. These findings support the conclusion that coarse-grained classification is feasible with current behavioral features, whereas fine-grained prediction remains highly limited.
Finally, to complement the quantitative comparisons, Figure 4 visually illustrates the regression performance (MAE) of the three models across all datasets. This chart highlights the consistently poor regression results on the IHU and Combined datasets, as well as the relatively improved performance on the Kaggle dataset. Notably, the differences between models remain minimal across datasets, reinforcing the conclusion that behavioral features alone offer limited predictive power for continuous grade estimation.
7. Overall Findings and Implications
Across all datasets and tasks, the Sequential model consistently offered the most stable performance, particularly in binary and 3-class settings. While the BiLSTM occasionally surpassed it in accuracy (e.g., Kaggle 3-class), its behavior was less robust across different splits and tasks. The pretrained MLSTM-FCN model, despite its architectural sophistication, did not offer significant advantages in these scenarios—potentially due to domain mismatch or insufficient fine-tuning.
Importantly, regression tasks proved highly unstable, suggesting that behavioral time series alone may be insufficient to model continuous academic performance. Similarly, the sharp degradation in 11-class classification performance emphasizes the need for more sophisticated strategies to address class imbalance, ordinal relationships, and student heterogeneity.
A corresponding visualization for the IHU dataset is shown in Figure 5, which illustrates the limited predictive power of all models, especially in regression and 11-class classification tasks. The figure underscores the comparatively stronger—but still moderate—performance of the Sequential model in binary and 3-class classification, and the generally weak signal quality present in the IHU log data.
A graphical representation of the Kaggle dataset results is provided in Figure 6, complementing the tabular summary and offering a clearer visual comparison of model effectiveness across tasks. This visualization reinforces the superiority of the Sequential model in classification tasks and illustrates the limited gains of regression and fine-grained prediction, even with richer input data.
Also, Figure 7 visualizes the results for the Combined dataset. Despite some improvement in binary classification accuracy, performance remained inconsistent in other tasks. This supports the hypothesis that combining datasets without accounting for domain heterogeneity may introduce noise rather than strengthen generalizability.
Finally, Table 15 summarizes the experimental findings by presenting the performance of the three evaluated models across four prediction tasks for each dataset. The table highlights the best-performing configurations, along with key issues and strengths observed in each case.
8. Discussion
The present study contributes to the growing body of literature on adaptive educational technologies by demonstrating that hybrid learner modeling—combining explicit FSLSM-based profiling with behavioral telemetry extracted from LMS interaction logs—offers significant advantages over traditional, static personalization strategies. While prior research has largely depended on self-reported preferences through psychometric questionnaires [10,14], our approach captures the dynamic evolution of learner behavior over time, enabling context-sensitive, data-informed adaptations [6].
This dual-layered profiling strategy is in line with contemporary pedagogical paradigms that advocate for flexible, learner-centered instruction [2,4]. By integrating behavioral interaction patterns—such as frequency, sequence, and temporal pacing of learning events—into the learner model, we enable real-time adaptation to fluctuating engagement levels and emerging learner needs. Unlike one-shot FSLSM-based systems, our methodology acknowledges that learning styles are not immutable traits but can manifest differently across contexts and over time, as supported by evidence in educational psychology and learning analytics.
The practical application of our profiling framework yielded concrete insights into learner preferences. One representative example revealed dominant inclinations toward Active, Visual, and Sequential dimensions, aligning with structured and interactive instructional formats. Low scores in Stochastic and Intuitive styles further suggested a learner profile that may resist abstract or exploratory formats, offering direct implications for the design of personalized interventions. As discussed in Appendix A, such profiling provides actionable data for tailoring both content and instructional pacing to suit individual cognitive strategies.
These empirical outcomes validate the pedagogical value of hybrid profiling. By combining static questionnaire results with dynamic behavioral telemetry, our model moves beyond mere content recommendation toward personalized instructional strategy design. Moreover, the structured and interpretable nature of the FSLSM-aligned mapping ensures theoretical transparency, distinguishing our approach from black-box learner models. On a population level, profiling data also allow for group-based personalization and adaptive cohort formation—key elements in the design of scalable, explainable educational AI systems.
Despite its contributions, the approach is not without limitations. One key concern is the manual nature of the event-to-style mapping process, which introduces inherent subjectivity and risks inconsistencies across implementations. While our taxonomy was informed by pedagogical theory and validated against known FSLSM dimensions, the process remains heuristic. Future iterations should explore automated or semi-automated mapping frameworks, leveraging unsupervised or weakly supervised learning approaches to detect latent behavior-style correlations [9].
Another limitation is the narrow focus on cognitive dimensions. Although FSLSM provides a robust structure for modeling information processing preferences, it omits critical affective and motivational variables that are increasingly recognized as central to personalized learning experiences [7]. The integration of emotional state recognition—potentially through affective computing tools such as facial expression analysis, physiological sensing, or sentiment analysis of forum posts—could yield a more holistic learner model. Such multimodal augmentation would allow systems to respond not only to how students learn but also to how they feel while learning.
Furthermore, the applicability of FSLSM in contemporary digital learning ecosystems warrants reconsideration. FSLSM, originally designed for face-to-face instruction, may not fully capture interaction modalities specific to digital-native learners—particularly in environments with heavy use of gamified learning, social media integration, or mobile microlearning. Complementary models such as the VARK learning style framework, experiential learning theory (ELT), or personality-based models (e.g., Big Five) may offer additional explanatory power and enable richer adaptation strategies when used in combination with FSLSM.
Scalability and generalizability also remain open challenges. The current study, while multi-institutional, was limited in scale and disciplinary diversity. Larger-scale longitudinal studies across diverse learner populations—spanning different academic levels, cultural backgrounds, and disciplines—are necessary to establish the robustness of the approach. In particular, the influence of demographic variables (e.g., age, gender, prior experience) on profiling accuracy and model efficacy has yet to be systematically evaluated. Addressing these aspects could also support fairness-aware adaptation strategies, reducing algorithmic bias and enhancing inclusivity.
Finally, interpretability remains an essential consideration. While the hybrid model supports explainable mapping, especially in comparison to purely deep learning-based methods, further effort is needed to ensure that personalization decisions can be meaningfully interpreted by instructors, learners, and curriculum designers. The adoption of human-in-the-loop systems that involve educators in reviewing or fine-tuning learner profiles could enhance trust and pedagogical alignment.
In summary, this study advances the field by showcasing a pragmatic, theoretically-grounded, and partially automated approach to learner modeling. Future work should aim to (i) reduce subjectivity through data-driven mappings, (ii) broaden the psychological and behavioral dimensions considered, (iii) validate across broader contexts, and (iv) ensure transparent, human-centered explainability. These directions will be critical for operationalizing ethical and effective personalization in next-generation educational platforms.
9. Conclusions and Future Work
This study presented a hybrid methodology for learner profiling and personalization based on the FSLSM and LMS interaction logs. By combining explicit questionnaire data with behavioral analytics, we developed a richer learner model capable of informing both content recommendation and pedagogical strategy adaptation.
The analysis of an example learner profile highlighted the effectiveness of this approach in capturing individual learning preferences across multiple dimensions, including engagement type, content format preference, and learning sequence orientation. The derived personalization strategies demonstrate the potential to enhance learner engagement, satisfaction, and academic outcomes by aligning educational experiences with cognitive preferences.
For LMS designers and instructional practitioners, the key implication is clear: even without collecting new questionnaire data, behavioral interaction logs can be meaningfully transformed into cognitive learner profiles, enabling adaptive content delivery at scale. This methodology can be integrated into existing Moodle-based systems through log parsing and mapping scripts, providing immediate value in course customization, early intervention triggers, and learner support.
Overall, the findings support the view that dynamic, data-driven personalization can significantly contribute to the evolution of smart learning environments, addressing diverse learner needs in more precise and flexible ways. Several directions for future research are proposed to expand and enhance the present work:
- Dynamic Event Mapping with Machine Learning: As manual mapping is prone to subjectivity, future studies could employ unsupervised learning methods, such as clustering or self-organizing maps [13], to automatically identify event-profile relationships.
- Integration of Affective and Motivational Factors: Extending the learner model to include emotional recognition and motivational profiling, as explored in AI-based personalization frameworks [7], could lead to even more effective personalization.
- Multimodal Data Fusion: Combining LMS logs with additional data sources such as eye-tracking, clickstream data, or sensor-based inputs could provide a more holistic view of learner behavior [9].
- Comparative Analysis with Alternative Learning Style Models: Investigating the integration of FSLSM with alternative frameworks, such as the VARK model or Big Five personality traits, may reveal synergies and address some of FSLSM’s theoretical limitations [1].
- Scalability and Generalizability Testing: Conducting large-scale experiments across diverse educational settings would help validate the robustness and generalizability of the proposed methodology, building on the approaches suggested in [5].
By addressing these directions, future systems could achieve even higher levels of personalization, adaptability, and learner-centeredness in smart educational environments.
Author Contributions
Conceptualization, A.A. and A.T.; methodology, J.A., M.K. and A.T.; software, A.T.; validation, A.A. and A.T.; formal analysis, J.A., M.K. and A.T.; investigation, J.A., M.K. and A.T.; data curation, A.A. and A.T.; writing—original draft preparation, J.A. and M.K.; writing—review and editing, A.A. and A.T.; visualization, J.A., M.K. and A.T.; supervision, A.A. and A.T.; project administration, A.A. and A.T.; funding acquisition, M.K. All authors have read and agreed to the published version of the manuscript.
Funding
This research received no external funding.
Institutional Review Board Statement
Not applicable.
Informed Consent Statement
Not applicable.
Data Availability Statement
Data are contained within the article.
Acknowledgments
This work was conducted within the “Virtual Auditorium” Project, co-funded by European Union, under the ERASMUS+ PARTNERSHIPS FOR INNOVATION – FORWARD LOOKING PROJECTS call (project code: 101132828).
Conflicts of Interest
The authors declare no conflicts of interest.
Abbreviations
The following abbreviations are used in this manuscript:
| FSLSM | Felder–Silverman Learning Style Model |
| LMS | Learning Management System |
| AI | Artificial Intelligence |
| ML | Machine Learning |
| EDM | Educational Data Mining |
| LO | Learning Object |
| MAE | Mean Absolute Error |
| MAPE | Mean Absolute Percentage Error |
| BiLSTM | Bidirectional Long Short-Term Memory |
| MLSTM-FCN | Multivariate LSTM Fully Convolutional Net |
Appendix A Learner Profile Dataset
The complete mapping between LMS interaction events and FSLSM learner profiles is provided in the supplementary file personalization_final.xlsx. This dataset includes detailed event-to-profile associations and cumulative scoring across all FSLSM dimensions. It is available with the manuscript submission as supplementary material and can be provided upon request. References
References
- Hwang, G.J.; Sung, H.Y.; Hung, C.M.; Huang, I. A Learning Style Perspective to Investigate the Necessity of Developing Adaptive Learning Systems. Educational Technology & Society 2013, 16, 188–197. [Google Scholar]
- Ait Daoud, M.; et al. FSLSM-Based Analysis of Student Performance Information in a Blended Learning Course Using Moodle LMS. Open Information Science 2024, 8, 20220163. [Google Scholar] [CrossRef]
- Ezzaim, A.; et al. AI-Based Learning Style Detection in Adaptive Learning Systems: A Systematic Literature Review. Journal of Computers in Education 2024. [Google Scholar] [CrossRef]
- Ezzaim, A.; et al. Development, Implementation, and Evaluation of a Machine Learning-Based Multi-Factor Adaptive E-Learning System. IAENG International Journal of Computer Science 2024, 51, 1250–1271. [Google Scholar]
- Angeioplastis, A.; Aliprantis, J.; Konstantakis, M.; Tsimpiris, A. Predicting Student Performance and Enhancing Learning Outcomes: A Data-Driven Approach Using Educational Data Mining Techniques. Computers 2025, 14, 83. [Google Scholar] [CrossRef]
- Nazempour, R.; Darabi, H. Personalized Learning in Virtual Learning Environments Using Students’ Behavior Analysis. Education Sciences 2023, 13, 457. [Google Scholar] [CrossRef]
- Murtaza, M.; Ahmed, Y.; Shamsi, J.A.; Sherwani, F.; Usman, M. AI-Based Personalized E-Learning Systems: Issues, Challenges, and Solutions. IEEE Access 2022, 10, 81323–81347. [Google Scholar] [CrossRef]
- Valencia, Y.; et al. Learning Style Classification by Using Bayesian Networks Based on the Index of Learning Style. Proceedings of ECSEE 2023 2023. [Google Scholar]
- Buciuman, C.F.; Potra, S. Revolutionizing Education in Industry 4.0: Eye-Tracking and AI for Personalized Learning. Procedia Computer Science 2025, 253, 1658–1667. [Google Scholar] [CrossRef]
- Nafea, S.M.; Siewe, F.; He, Y. On Recommendation of Learning Objects Using Felder–Silverman Learning Style Model. IEEE Access 2020, 8, 125092–125107. [Google Scholar] [CrossRef]
- Fernando-Raguro, M.C.; et al. Extraction of LMS Student Engagement and Behavioral Patterns in Online Education Using Decision Tree and K-Means Algorithm. In Proceedings of the APIT 2022. ACM; 2022; pp. 138–143. [Google Scholar]
- Hasibuan, M.S.; et al. Recommendation Model for Learning Material Using the Felder–Silverman Learning Style Approach. HighTech and Innovation Journal 2023, 4, 811–822. [Google Scholar] [CrossRef]
- Prabpal, S.; Nitiwatthana, K. Enhancing Learning Style Identification through Advanced Machine Learning Techniques. Sociolytics Journal 2024, 1, 21–33. [Google Scholar]
- Zlatkovic, D.; et al. Analysis of Adaptive E-Learning Systems with Adjustment of Felder–Silverman Model in a Moodle DLS. Computer Applications in Engineering Education 2020. [Google Scholar] [CrossRef]
- Zagulova, D.; et al. Personalized E-Learning: Relation Between Felder–Silverman Model and Academic Performance. Applied Computer Systems 2019, 24, 25–31. [Google Scholar] [CrossRef]
- Kaur, R.; et al. E-Learning Environment Based Intelligent Profiling System for Enhancing User Adaptation. Electronics 2022, 11, 3354. [Google Scholar] [CrossRef]
- Karim, F.; Majumdar, S.; Darabi, H.; Harford, S. Multivariate LSTM-FCNs for time series classification. Neural networks 2019, 116, 237–245. [Google Scholar] [CrossRef]
Figure 1.
Overview of Learner Profiles Based on FSLSM and Their Preferred Interaction Types.
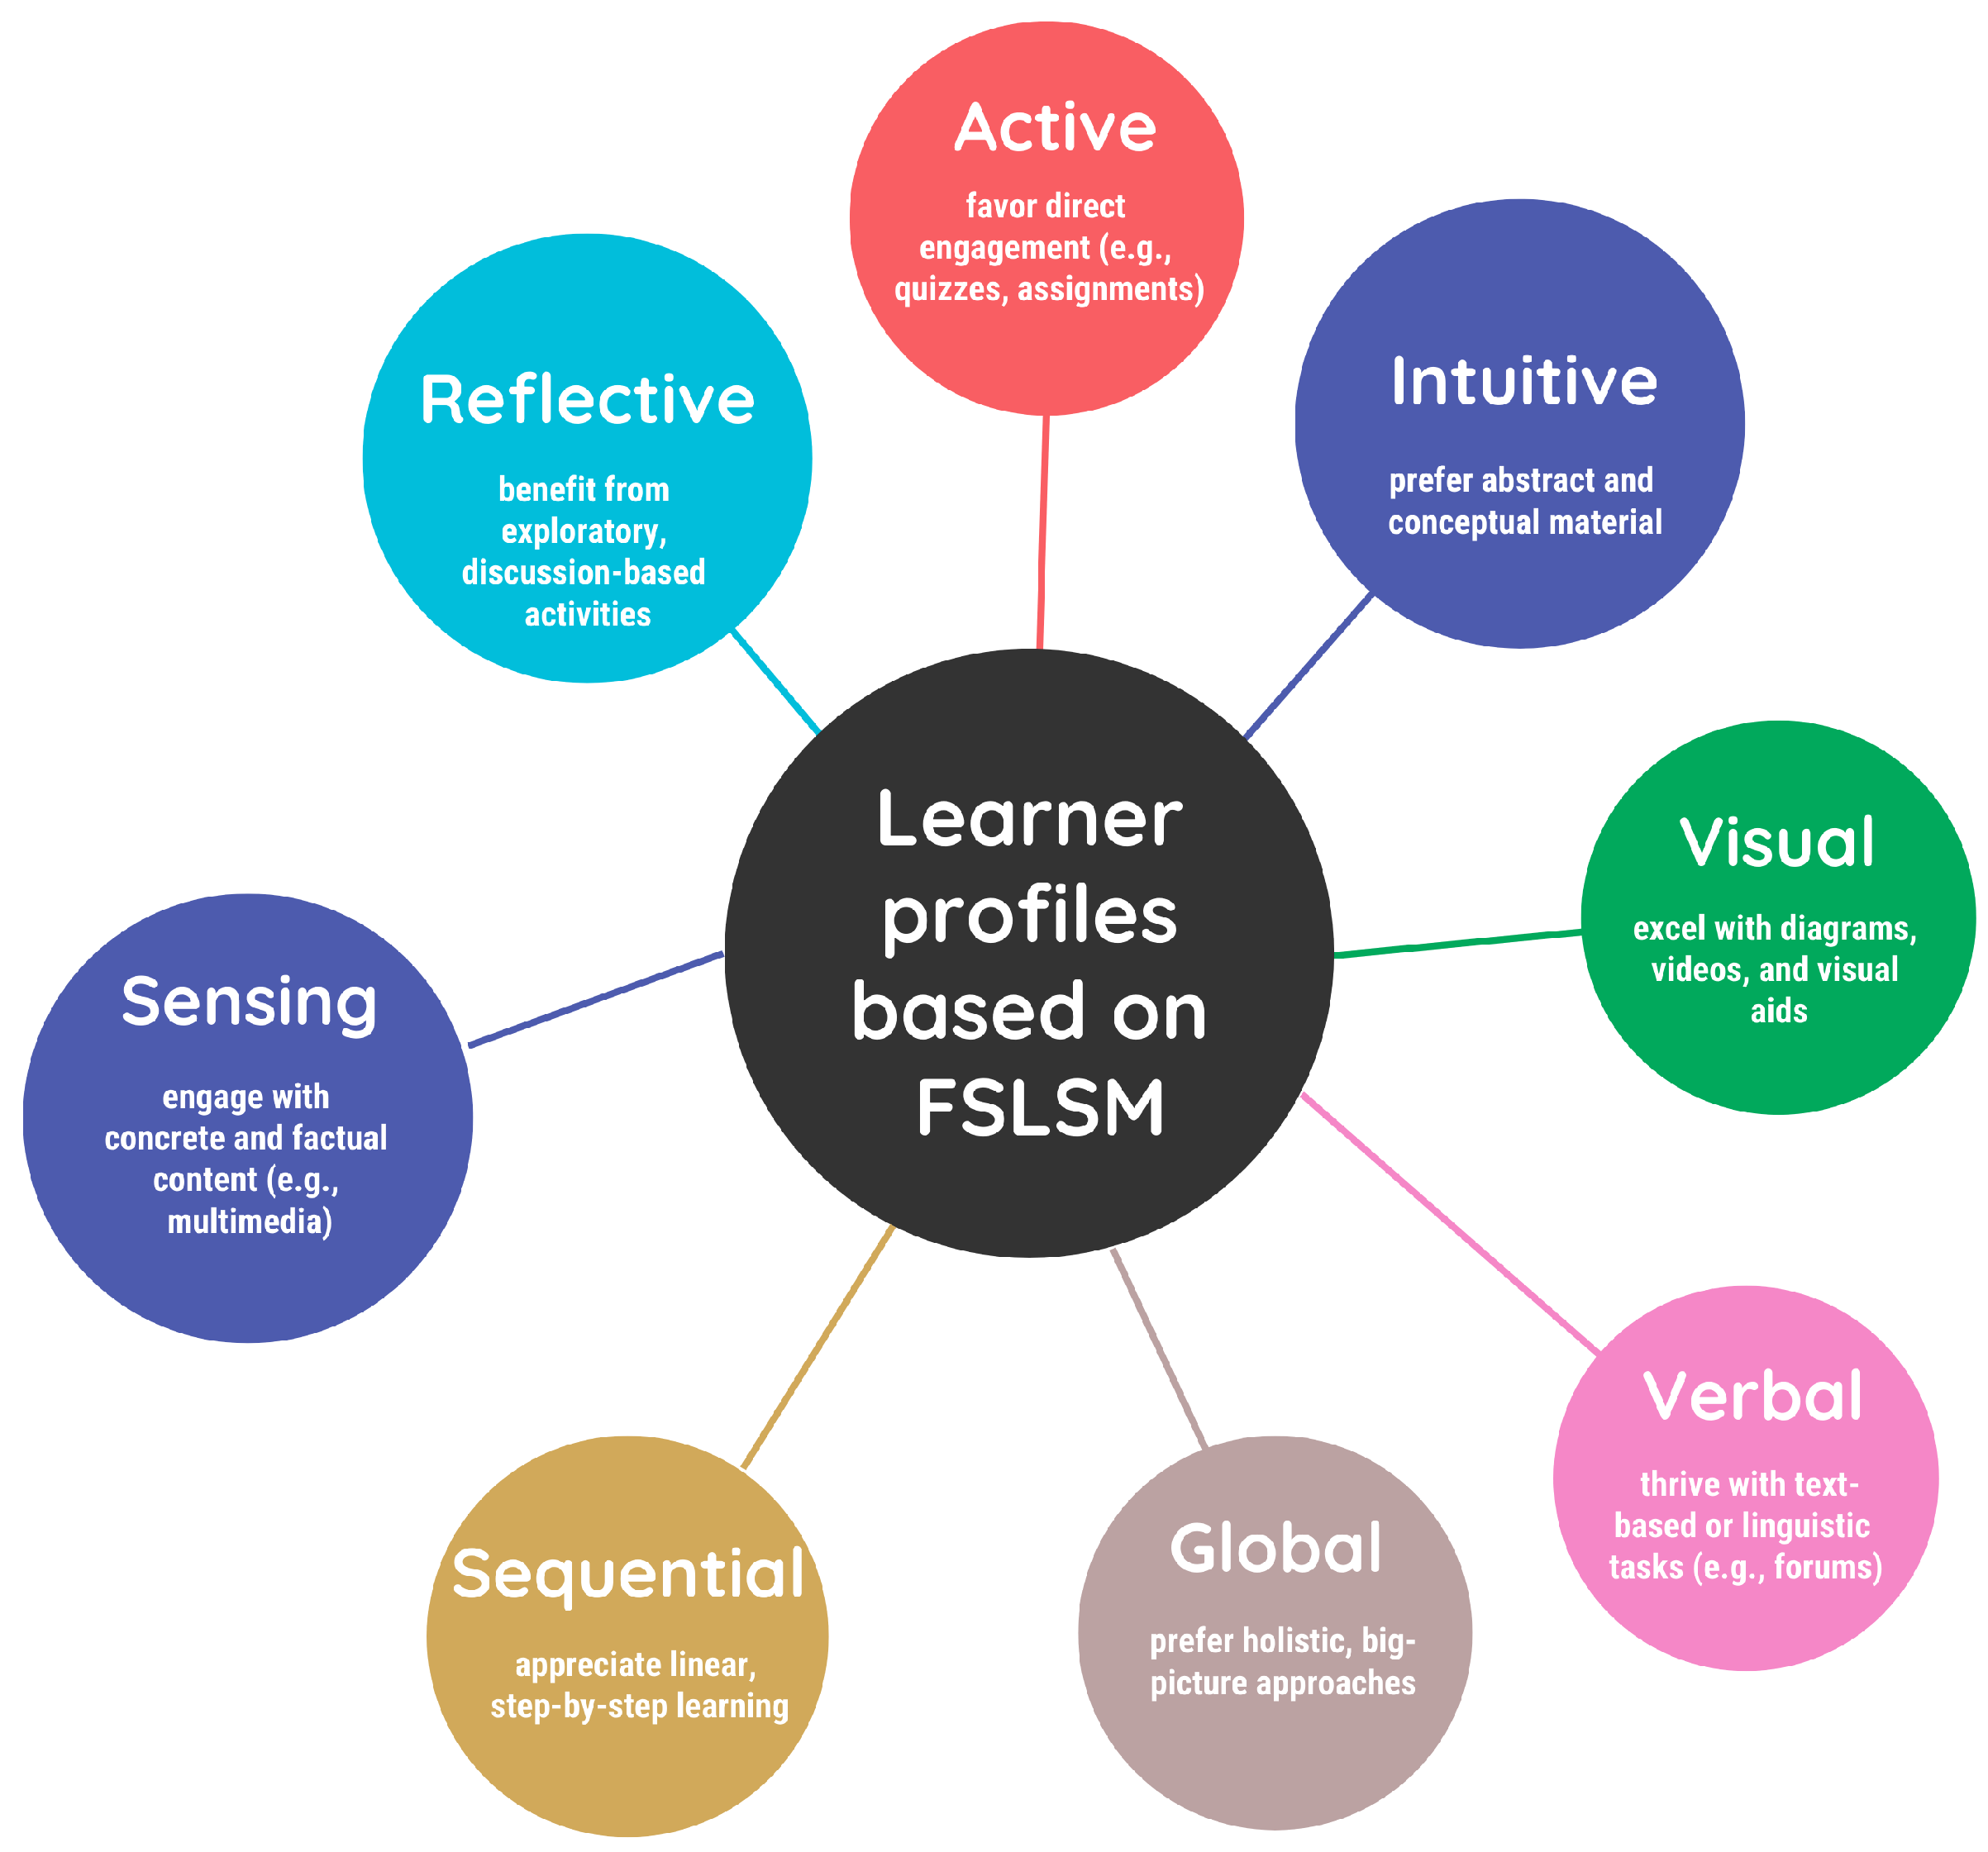
Figure 2.
Overview of the data analysis process.
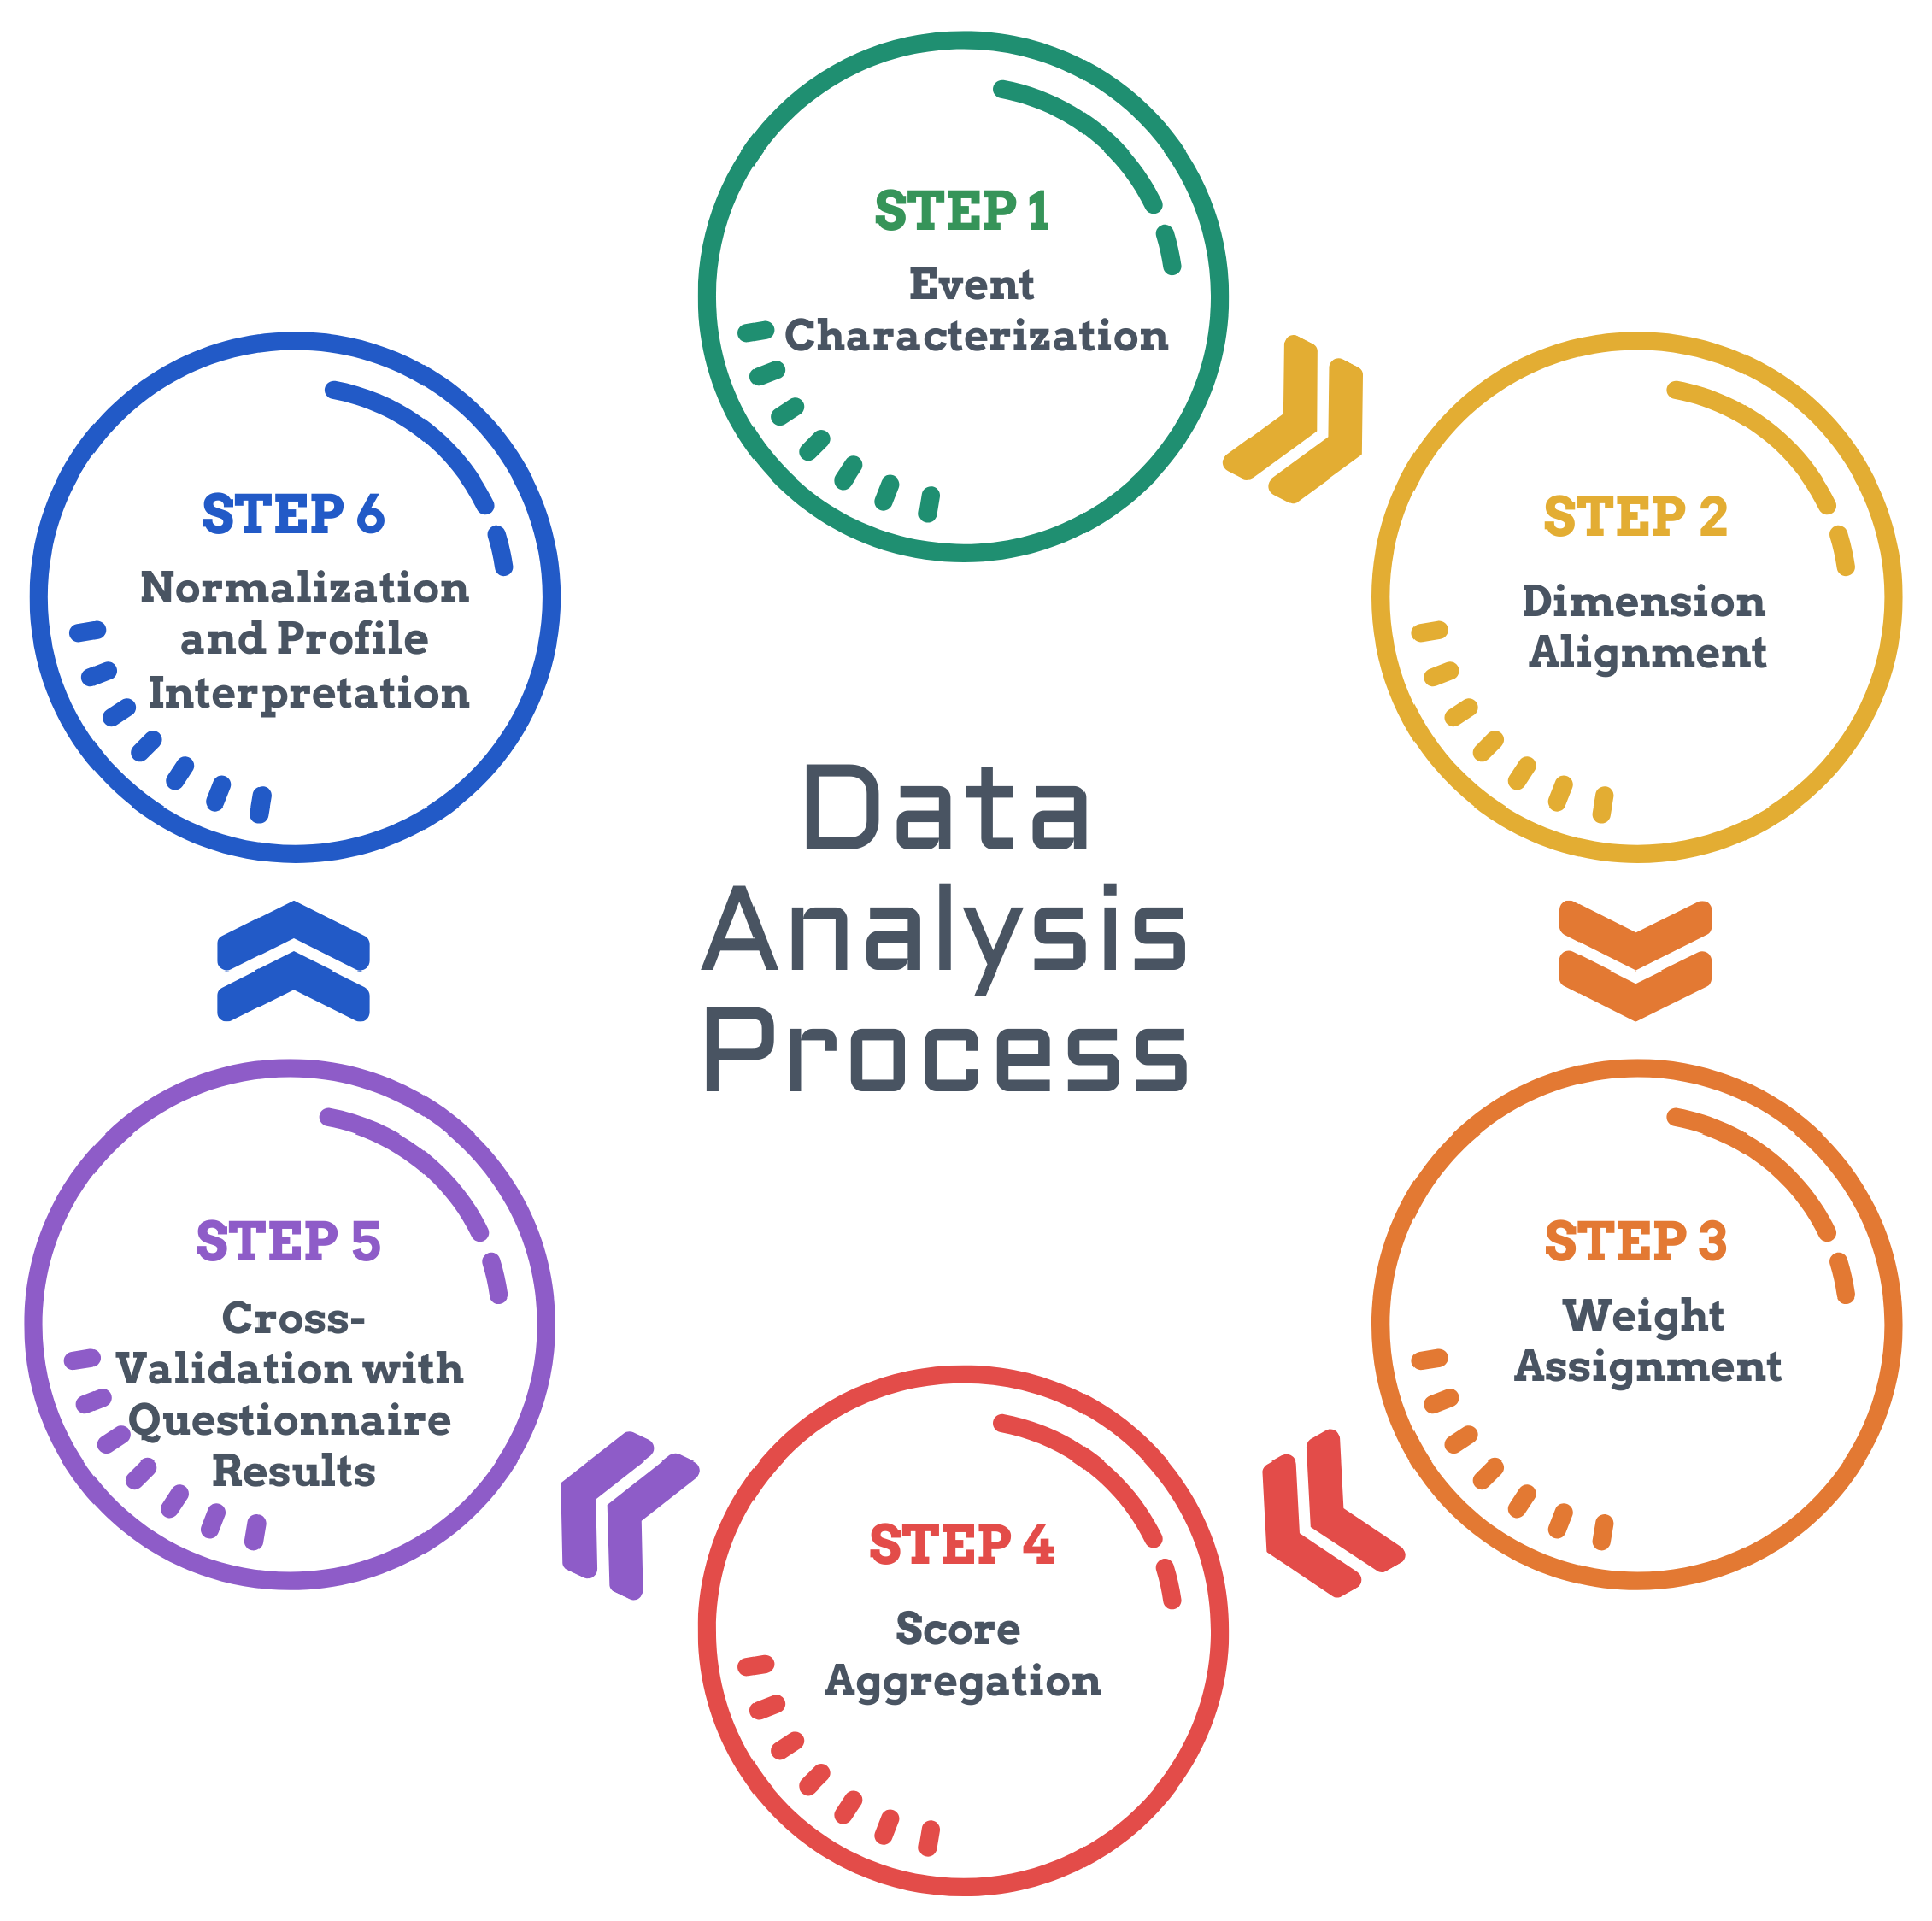
Figure 3.
Classification accuracy of the three models across datasets and tasks (excluding regression).
Figure 3.
Classification accuracy of the three models across datasets and tasks (excluding regression).
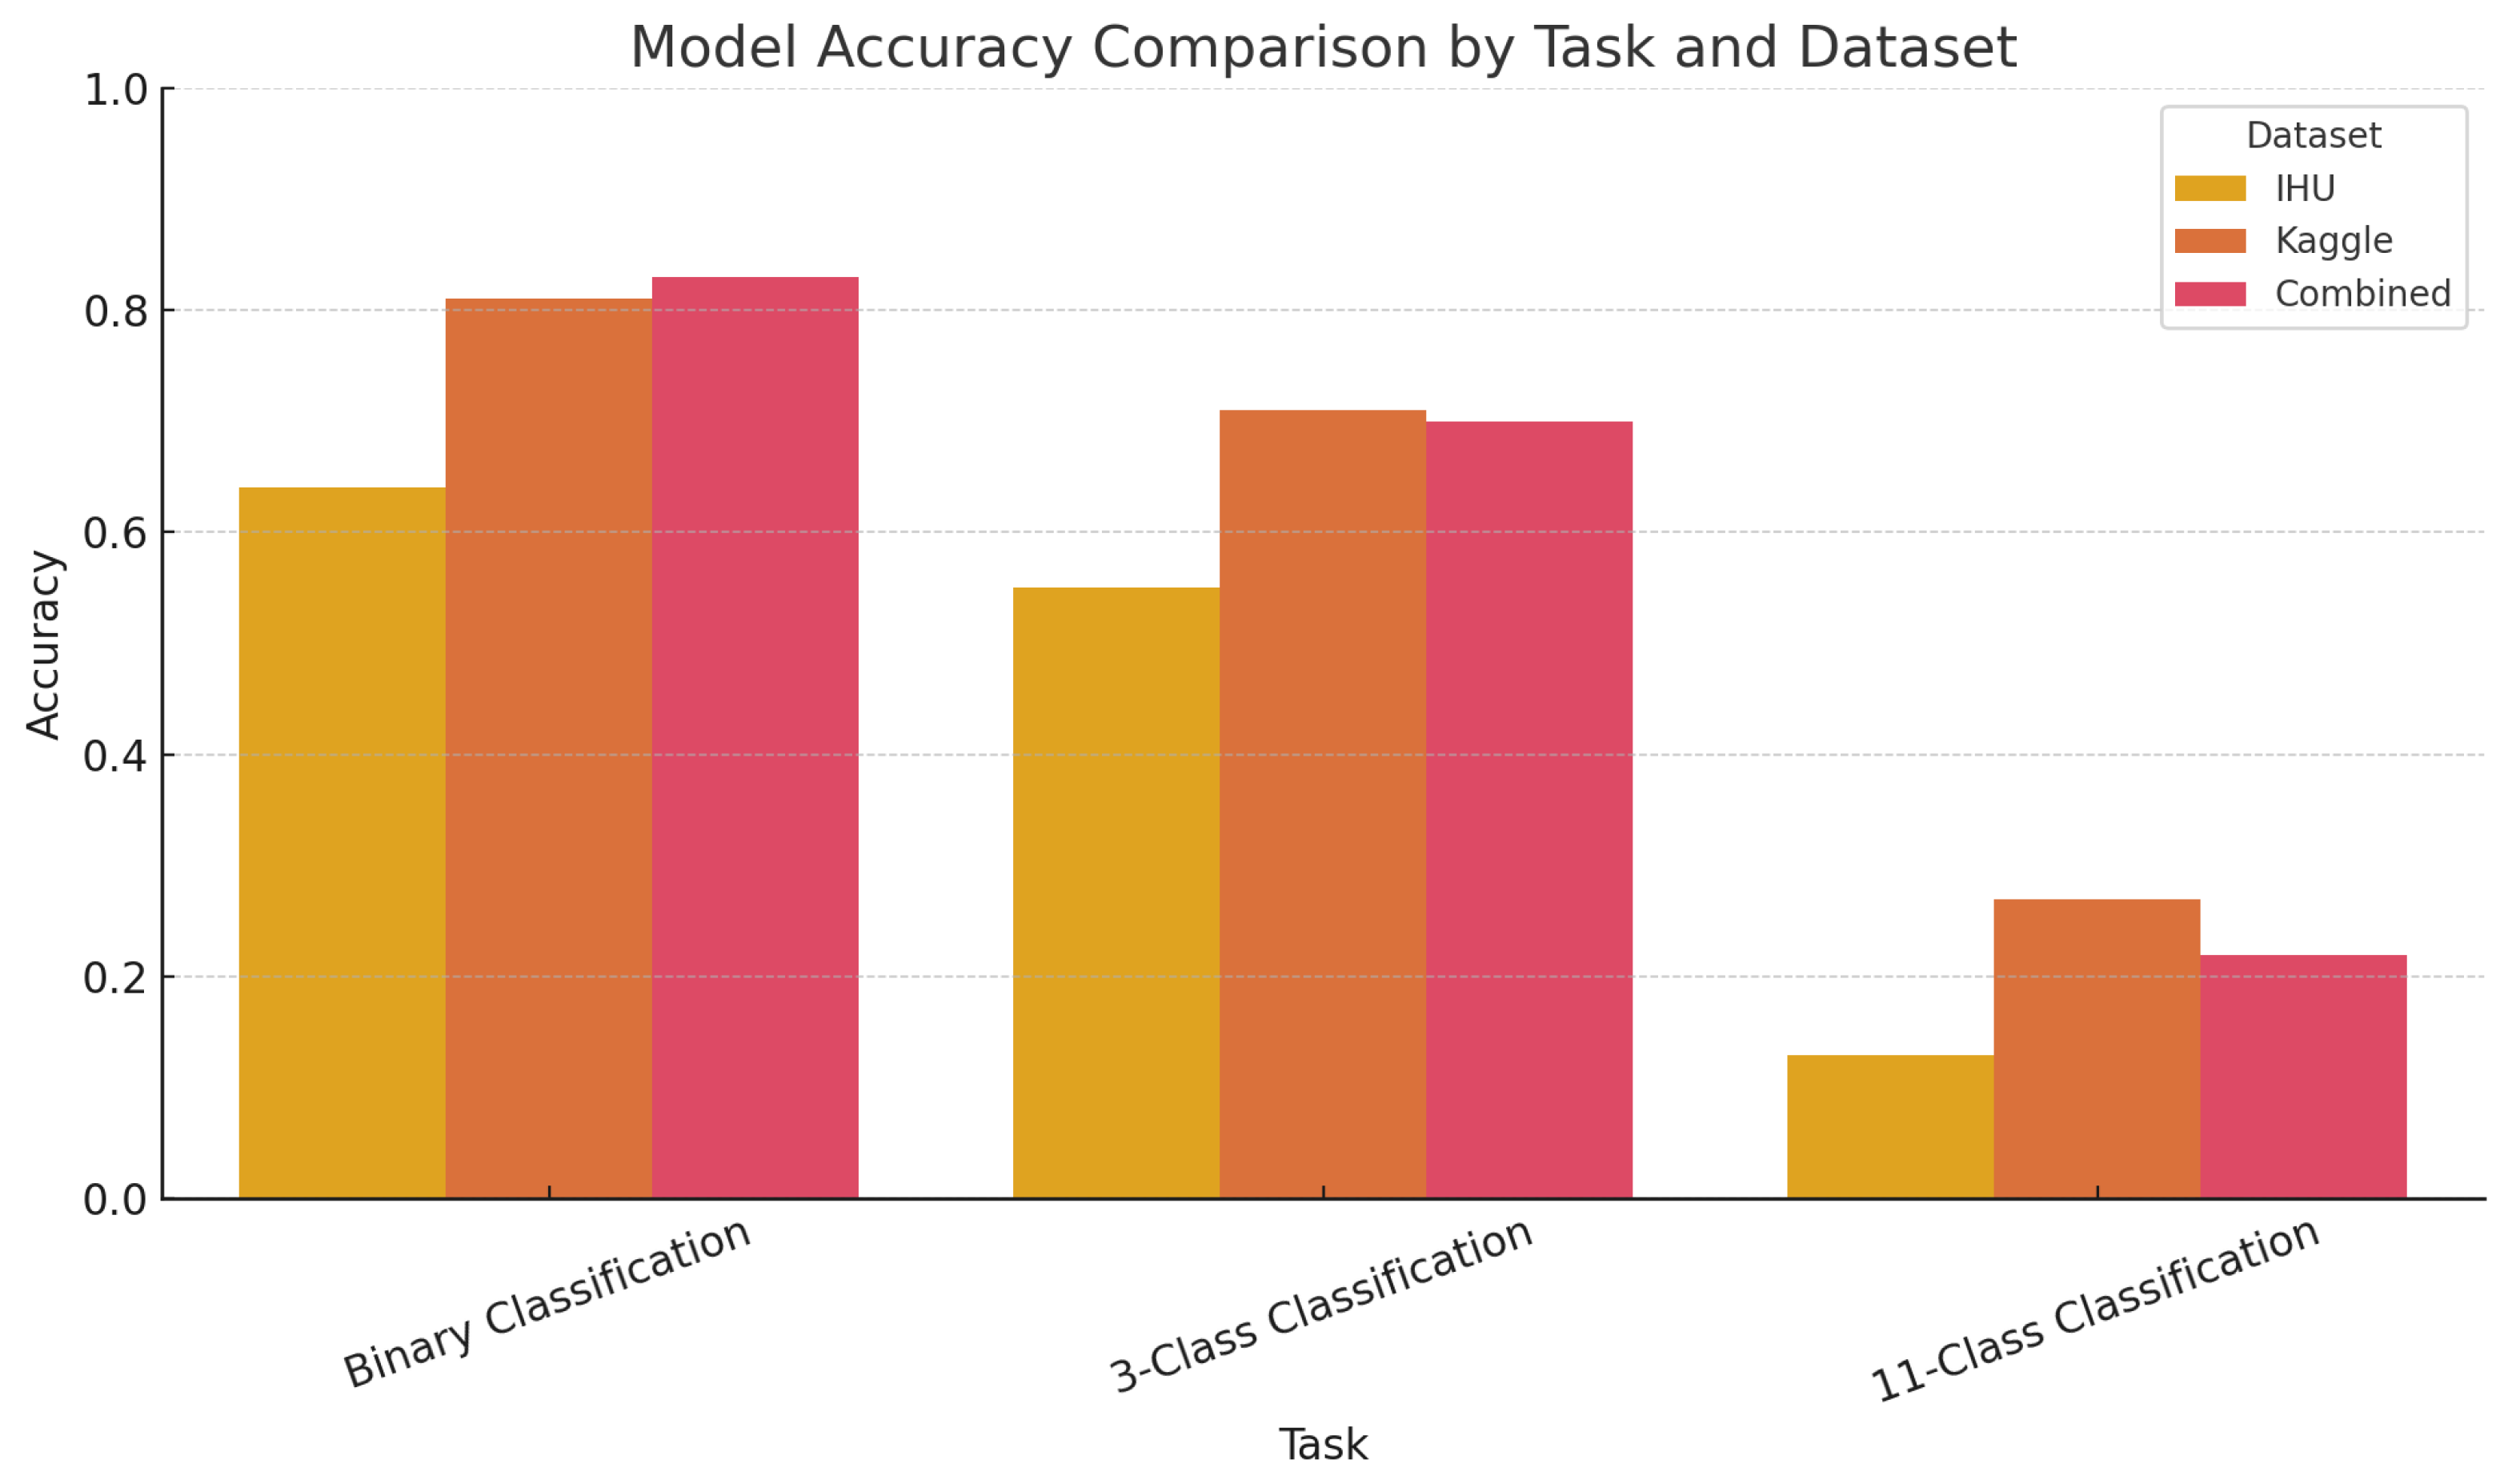
Figure 4.
Regression performance (MAE) of the three models across datasets.
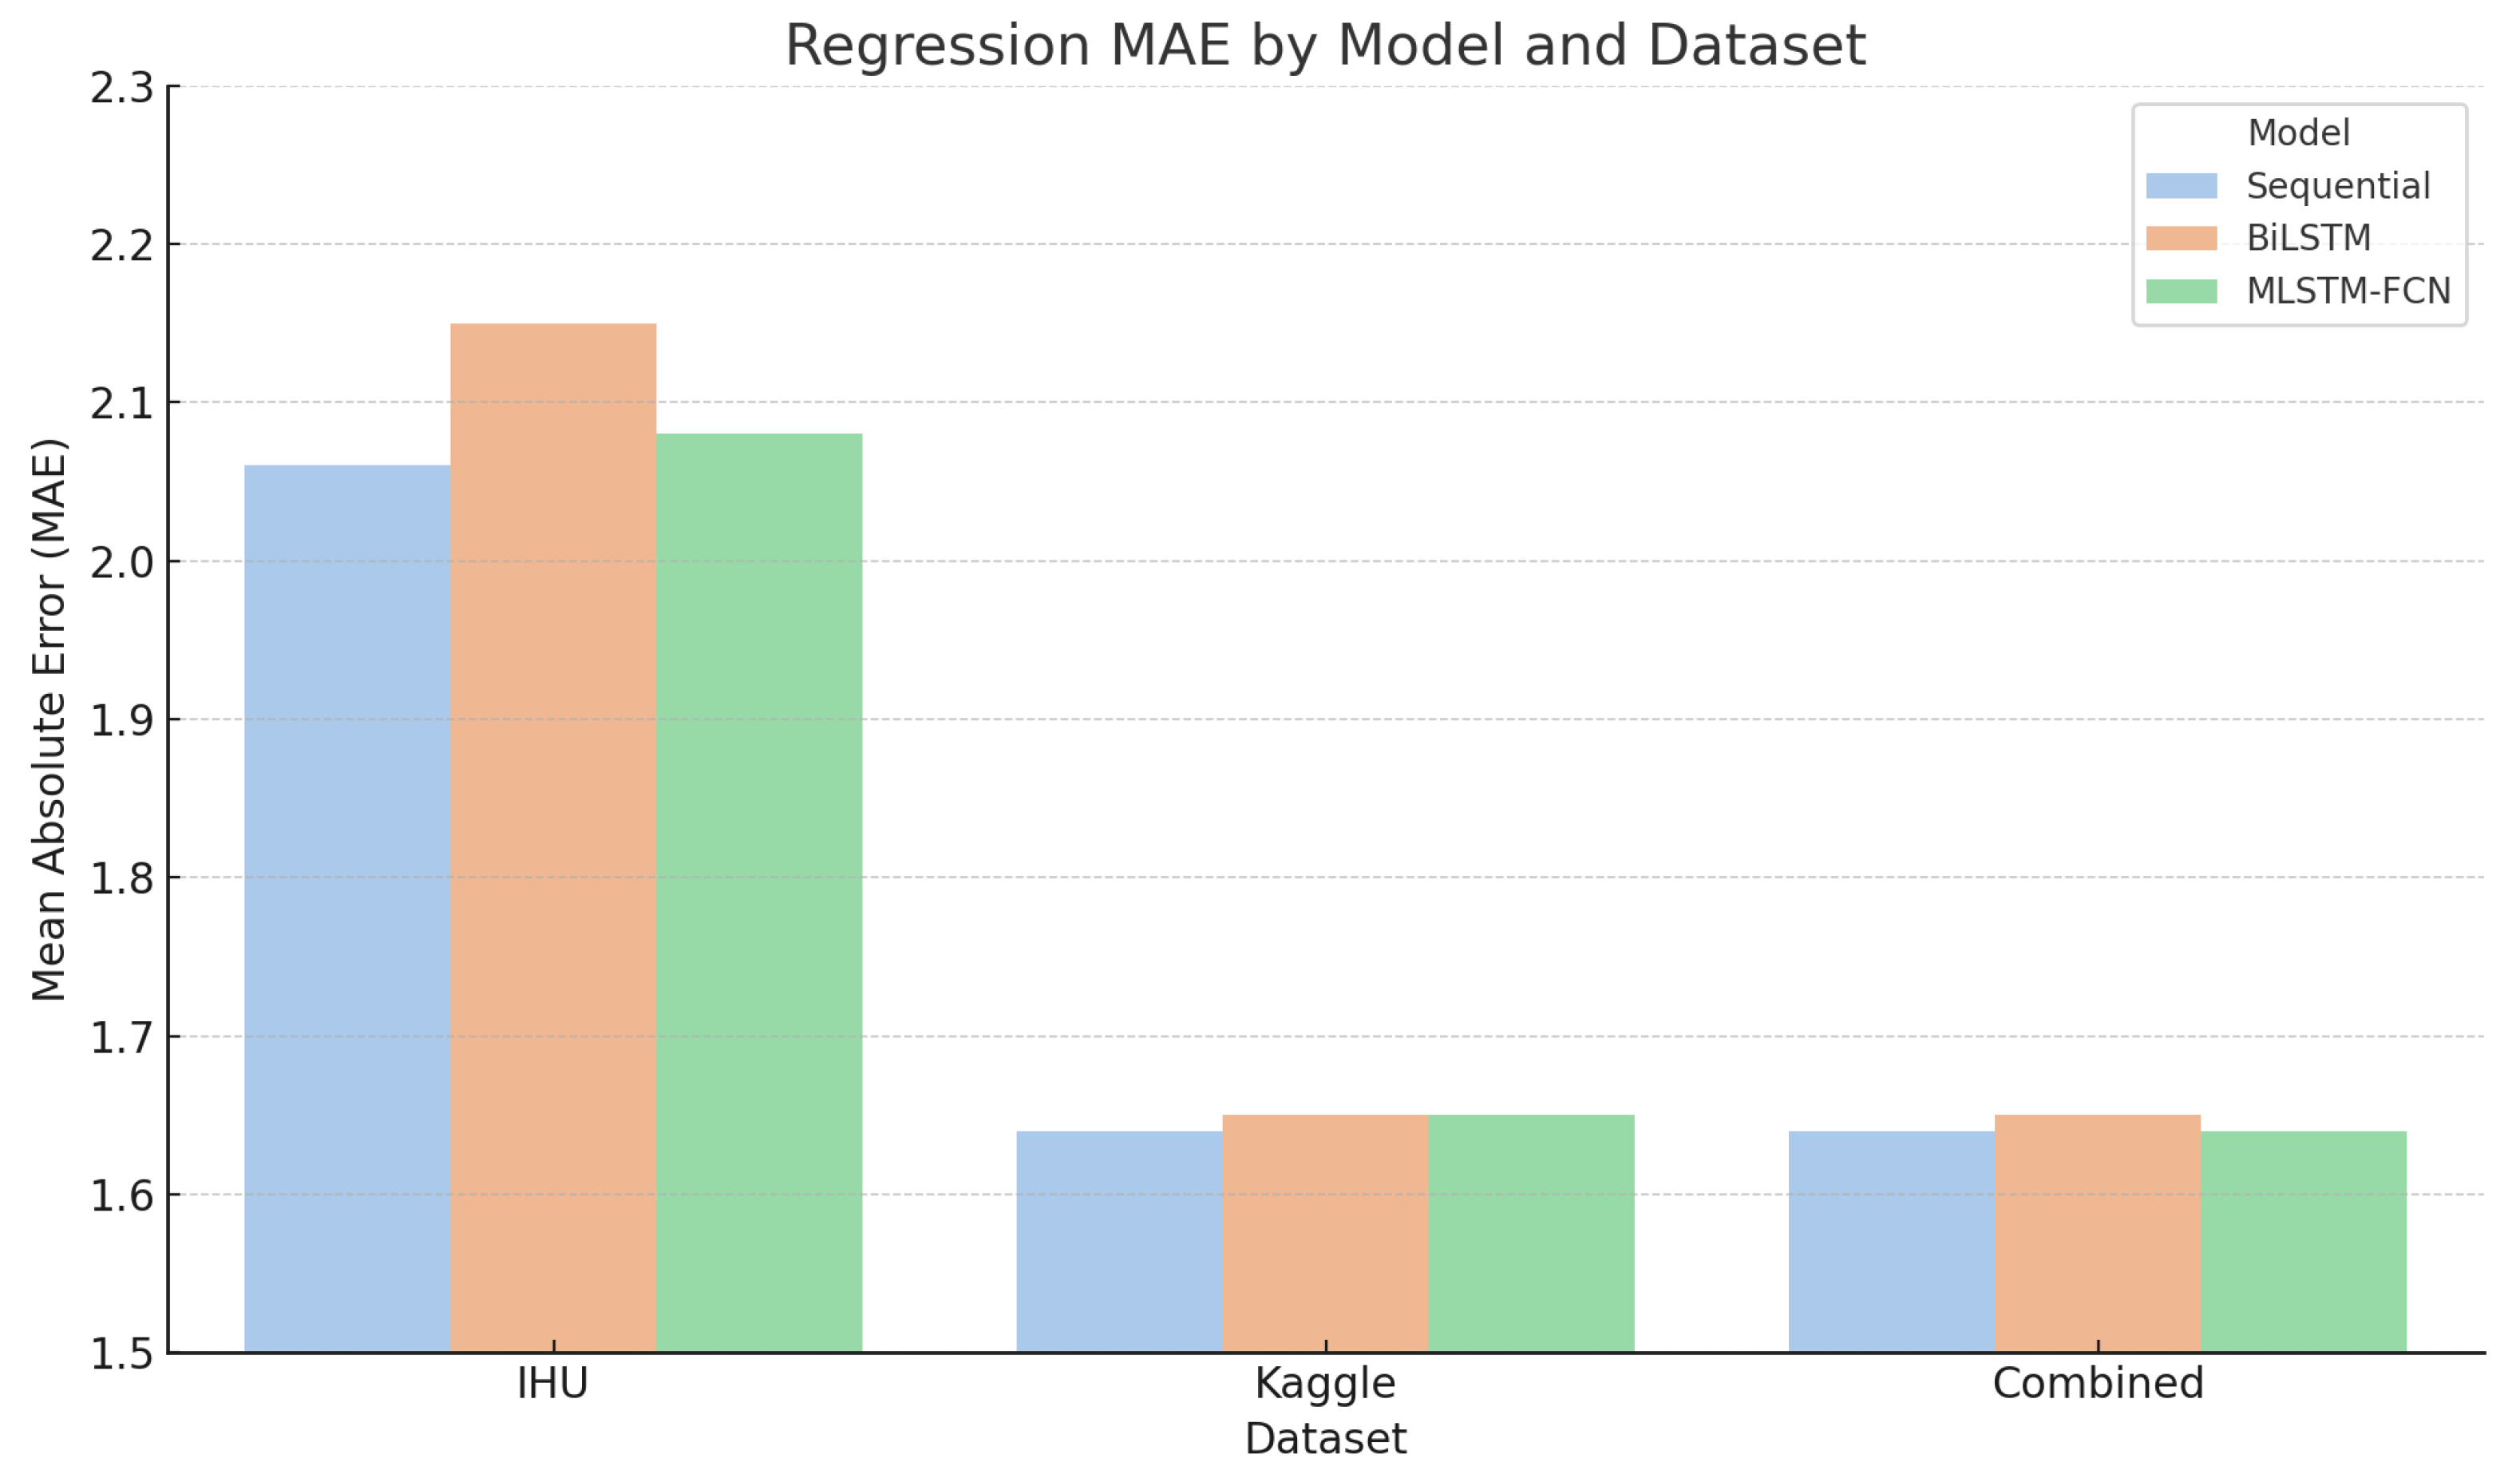
Figure 5.
Model performance across prediction tasks on the IHU dataset. Binary classification yields the highest accuracy ( 64%), while regression and 11-class tasks remain unstable.
Figure 5.
Model performance across prediction tasks on the IHU dataset. Binary classification yields the highest accuracy ( 64%), while regression and 11-class tasks remain unstable.
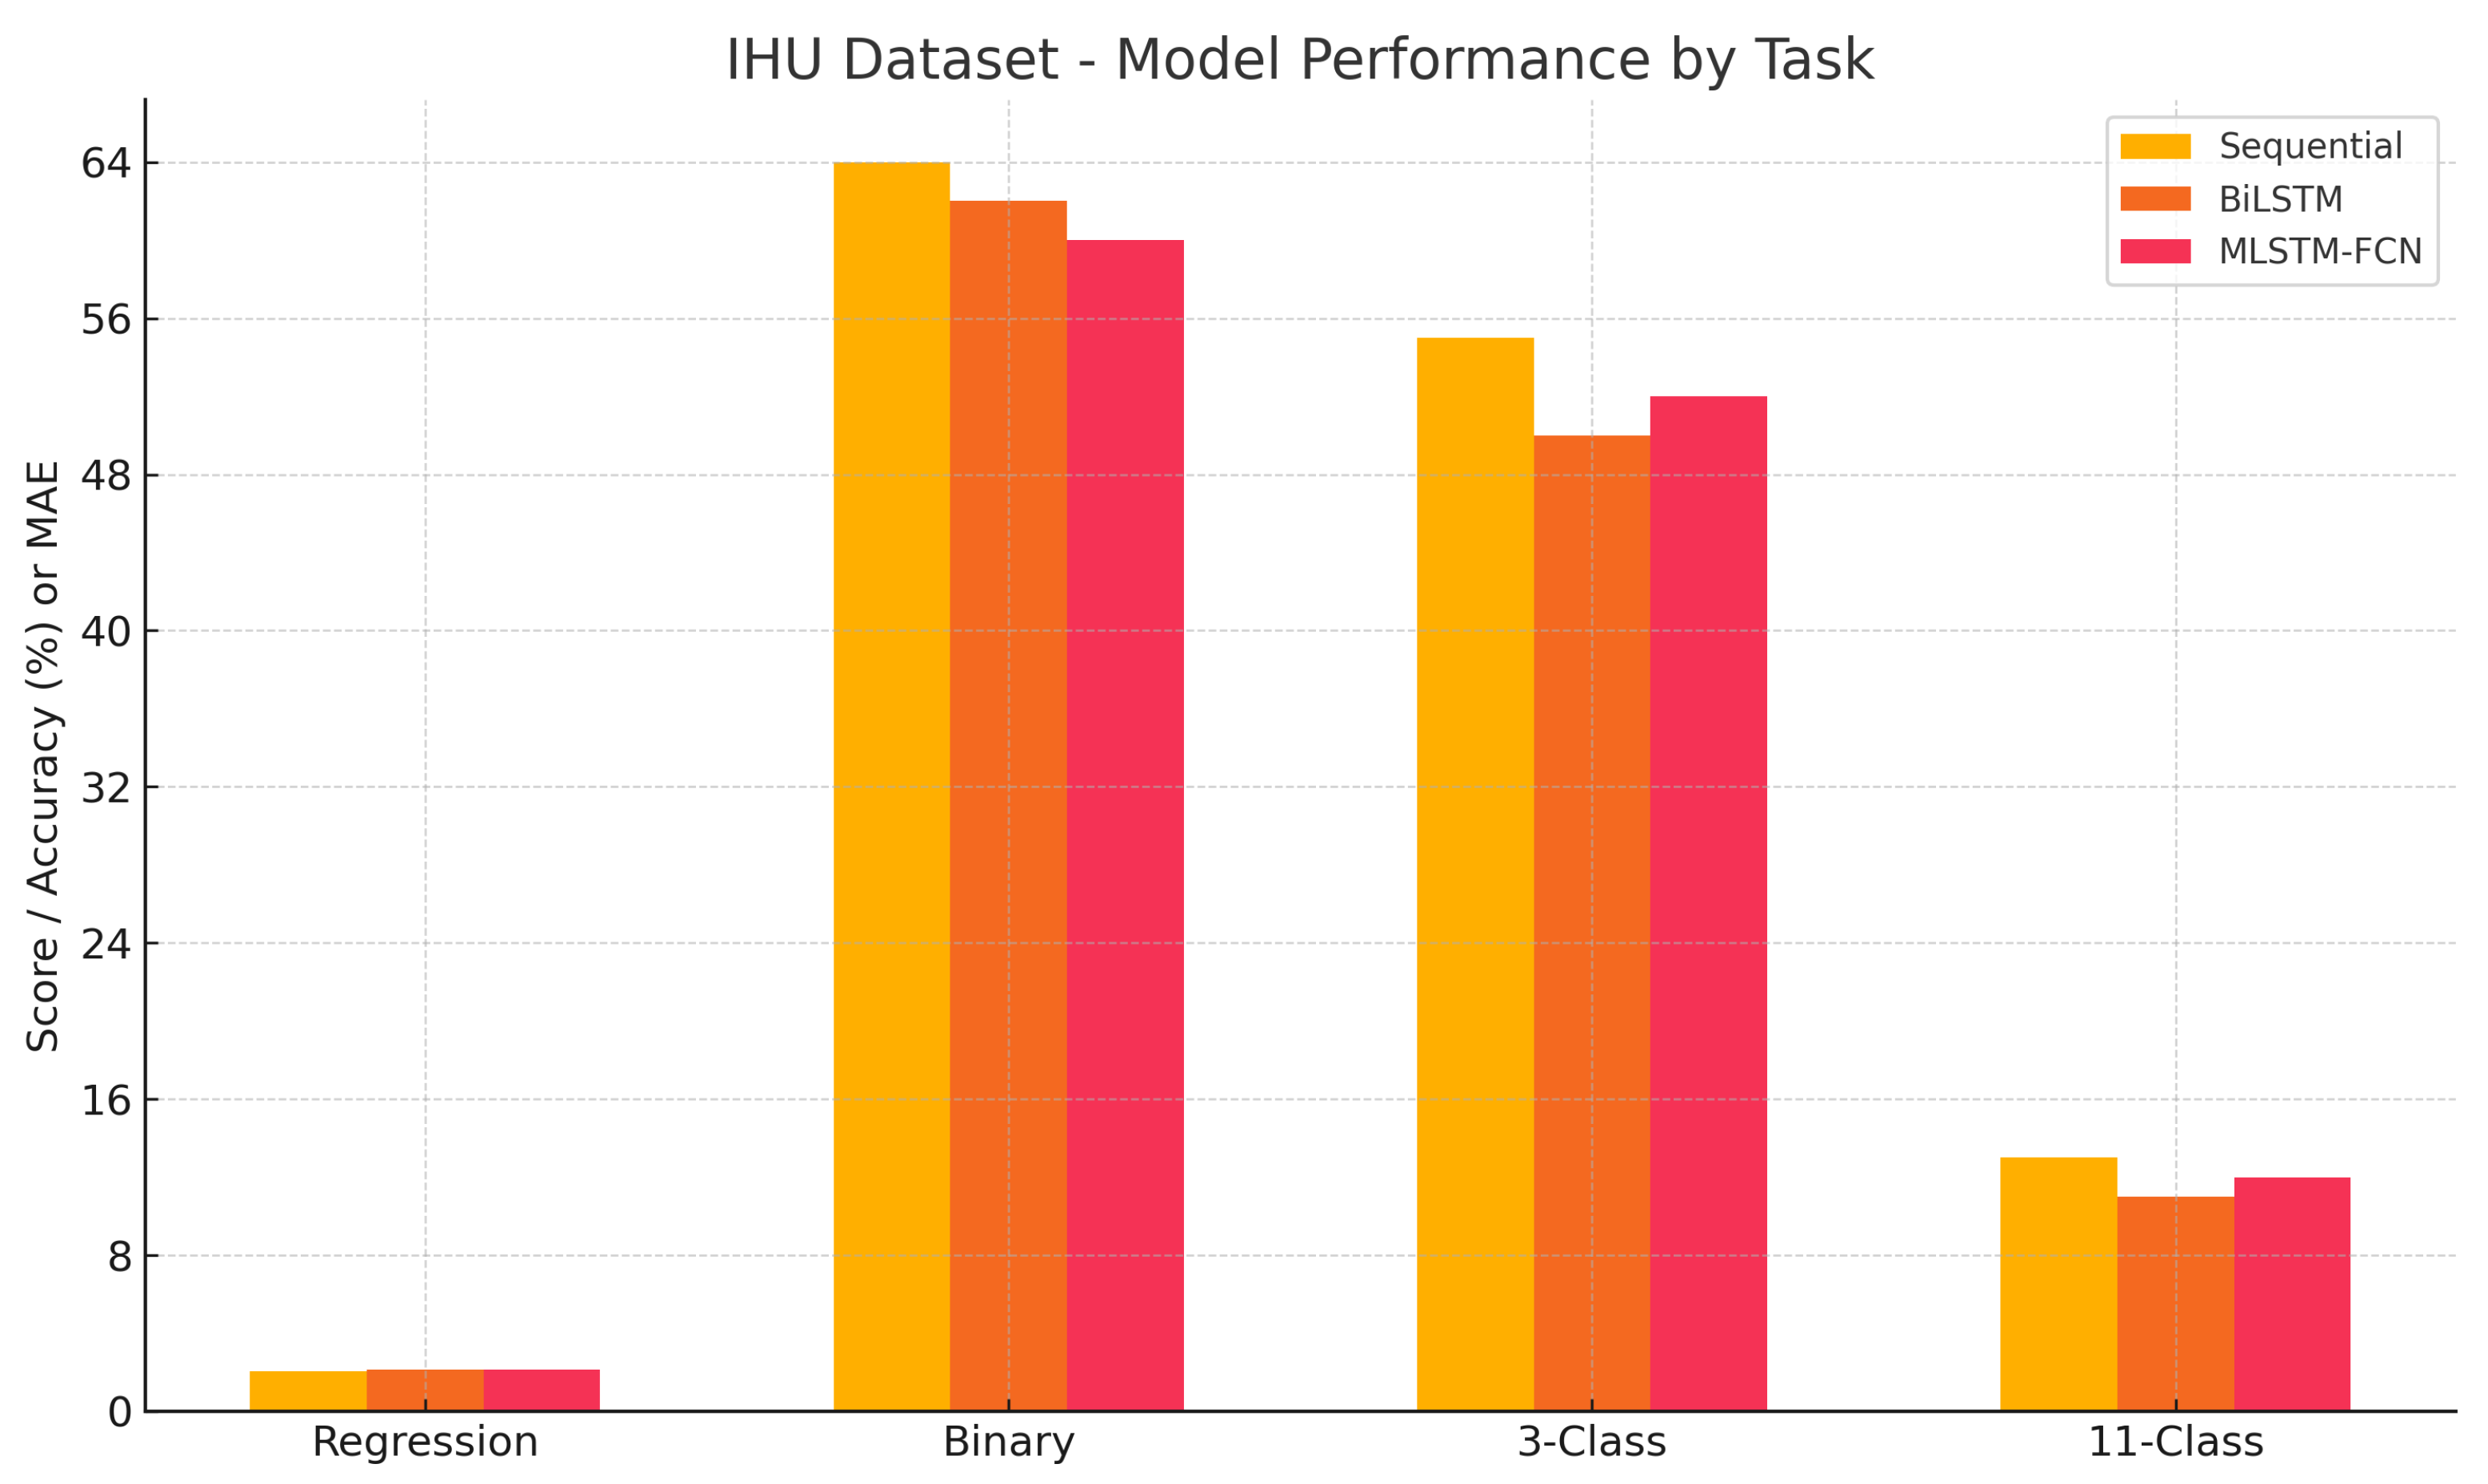
Figure 6.
Model Performance per Task using the Kaggle Dataset. Regression scores are represented as R² values; classification scores as accuracy.
Figure 6.
Model Performance per Task using the Kaggle Dataset. Regression scores are represented as R² values; classification scores as accuracy.
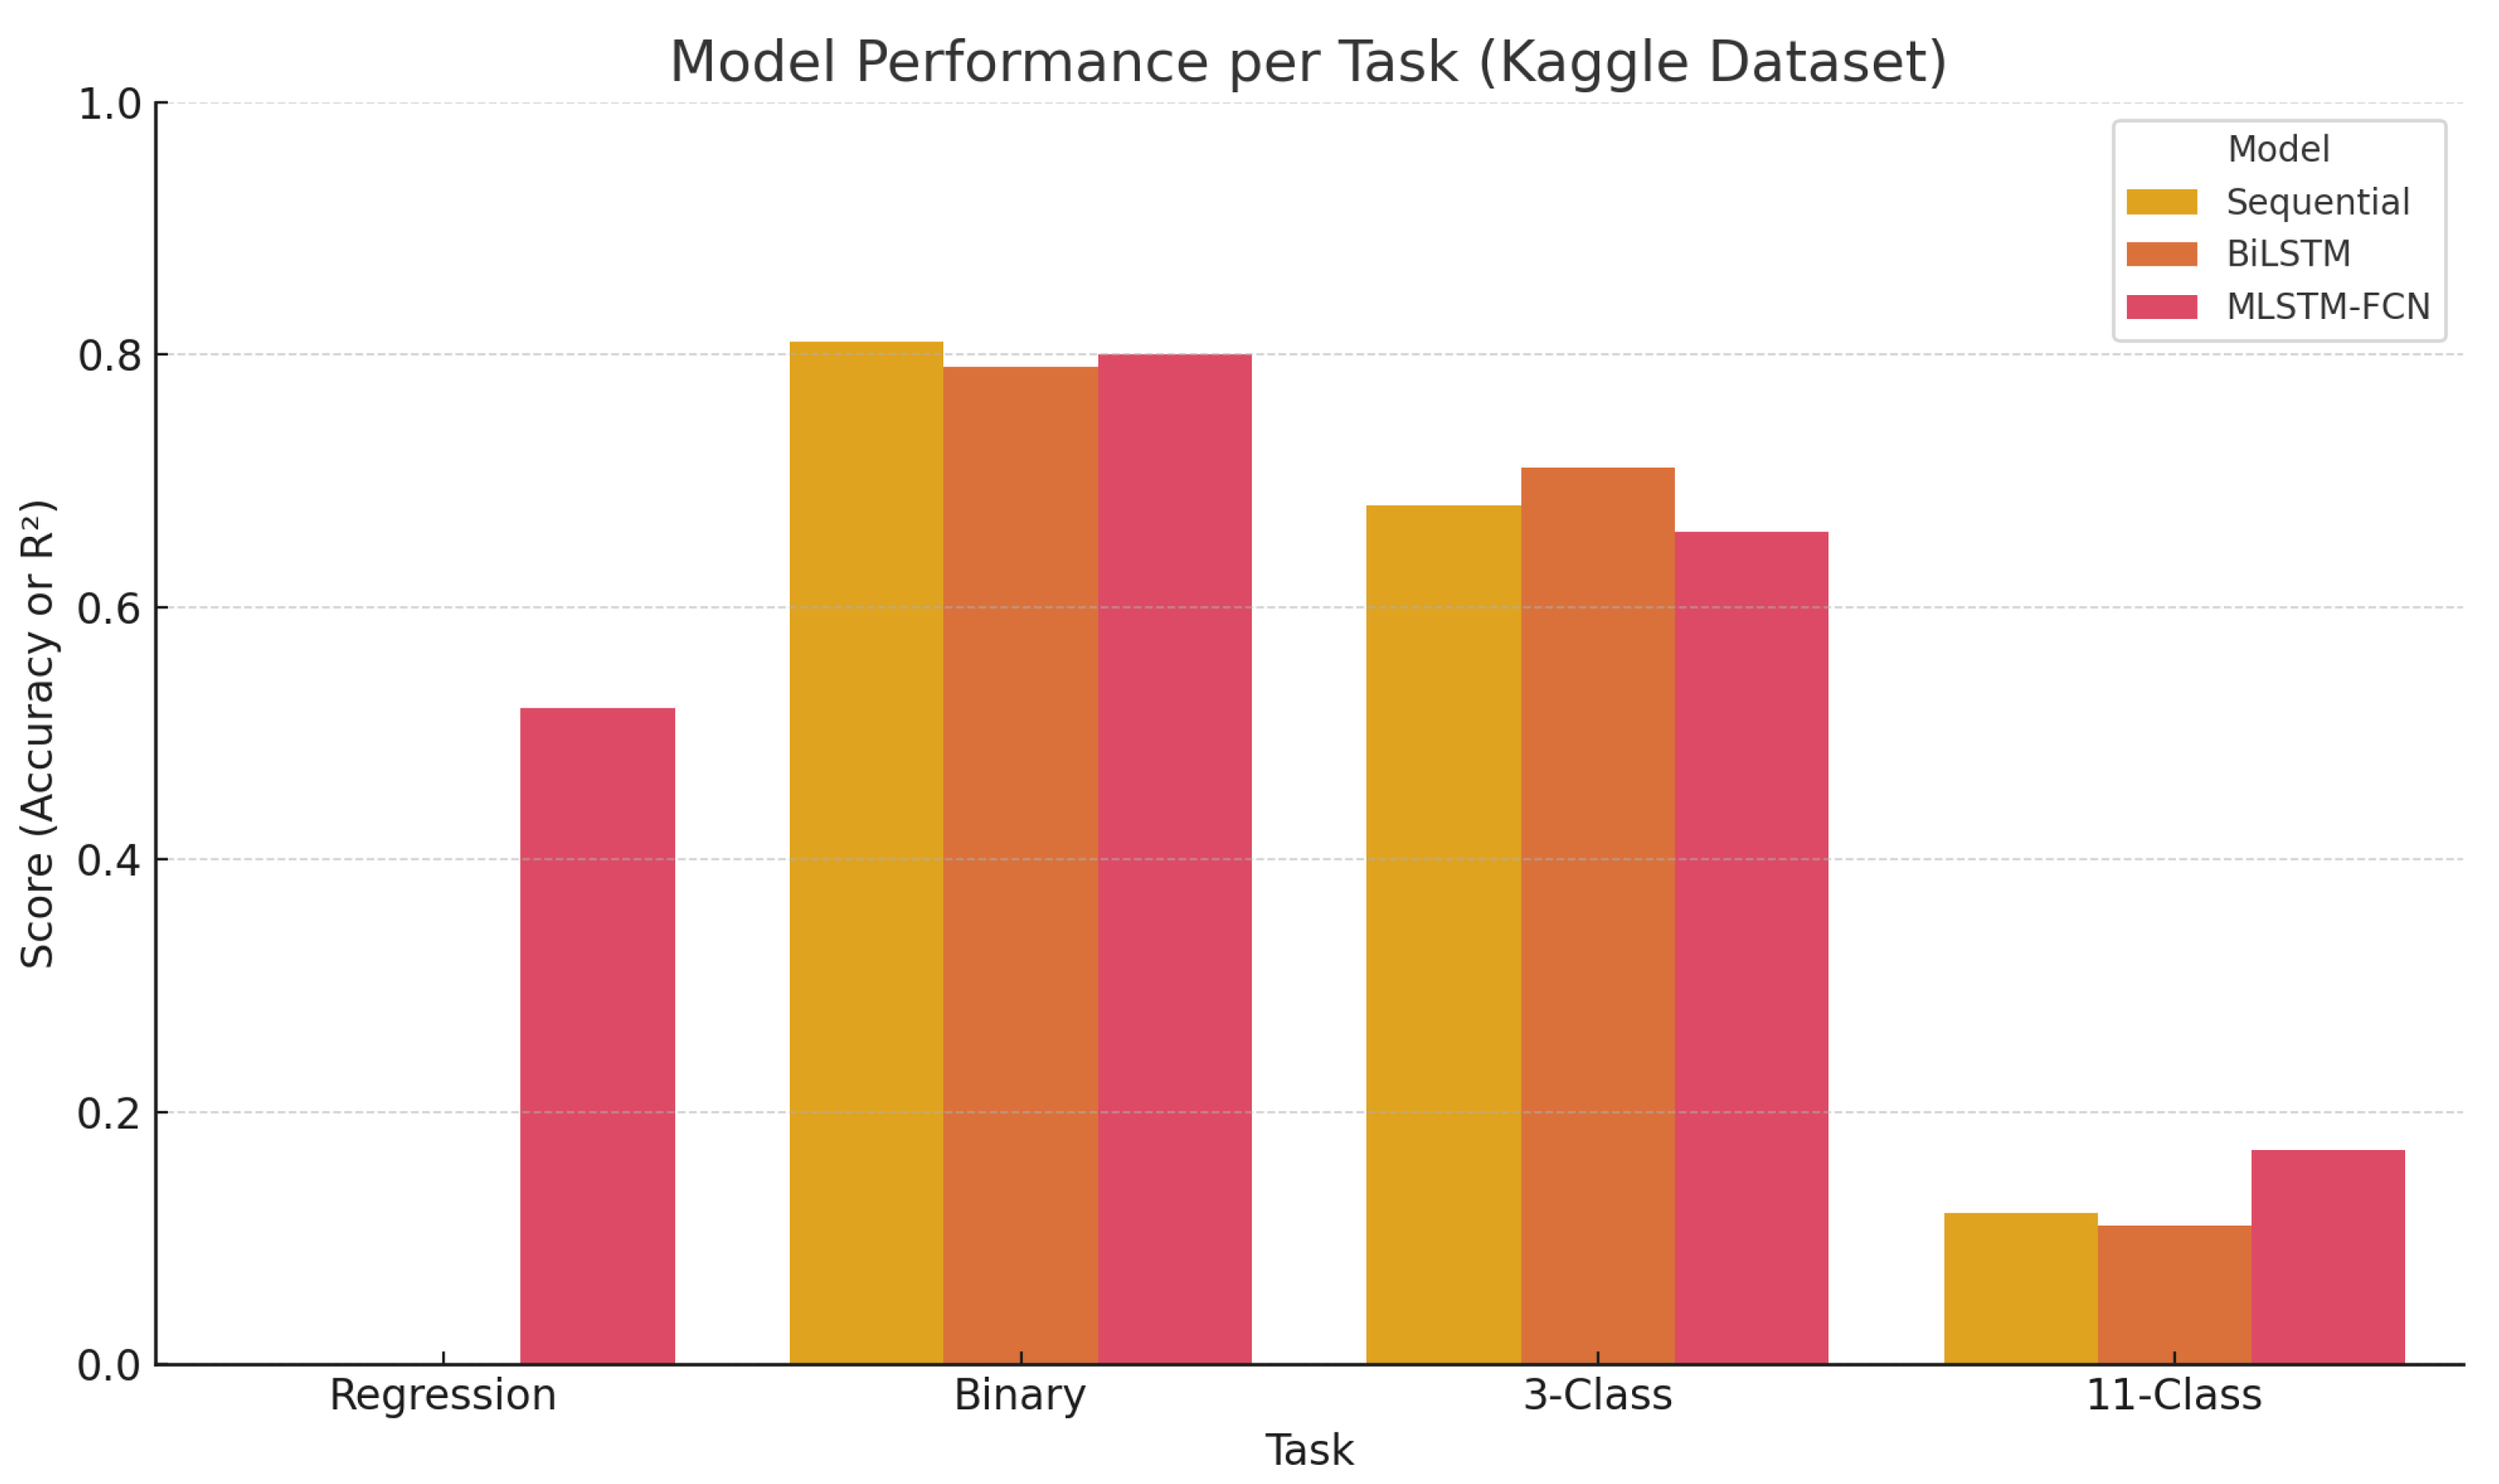
Figure 7.
Model performance across tasks using the Combined dataset. While binary classification reached up to 83% accuracy, other tasks showed marginal or no improvement, indicating domain mismatch challenges.
Figure 7.
Model performance across tasks using the Combined dataset. While binary classification reached up to 83% accuracy, other tasks showed marginal or no improvement, indicating domain mismatch challenges.
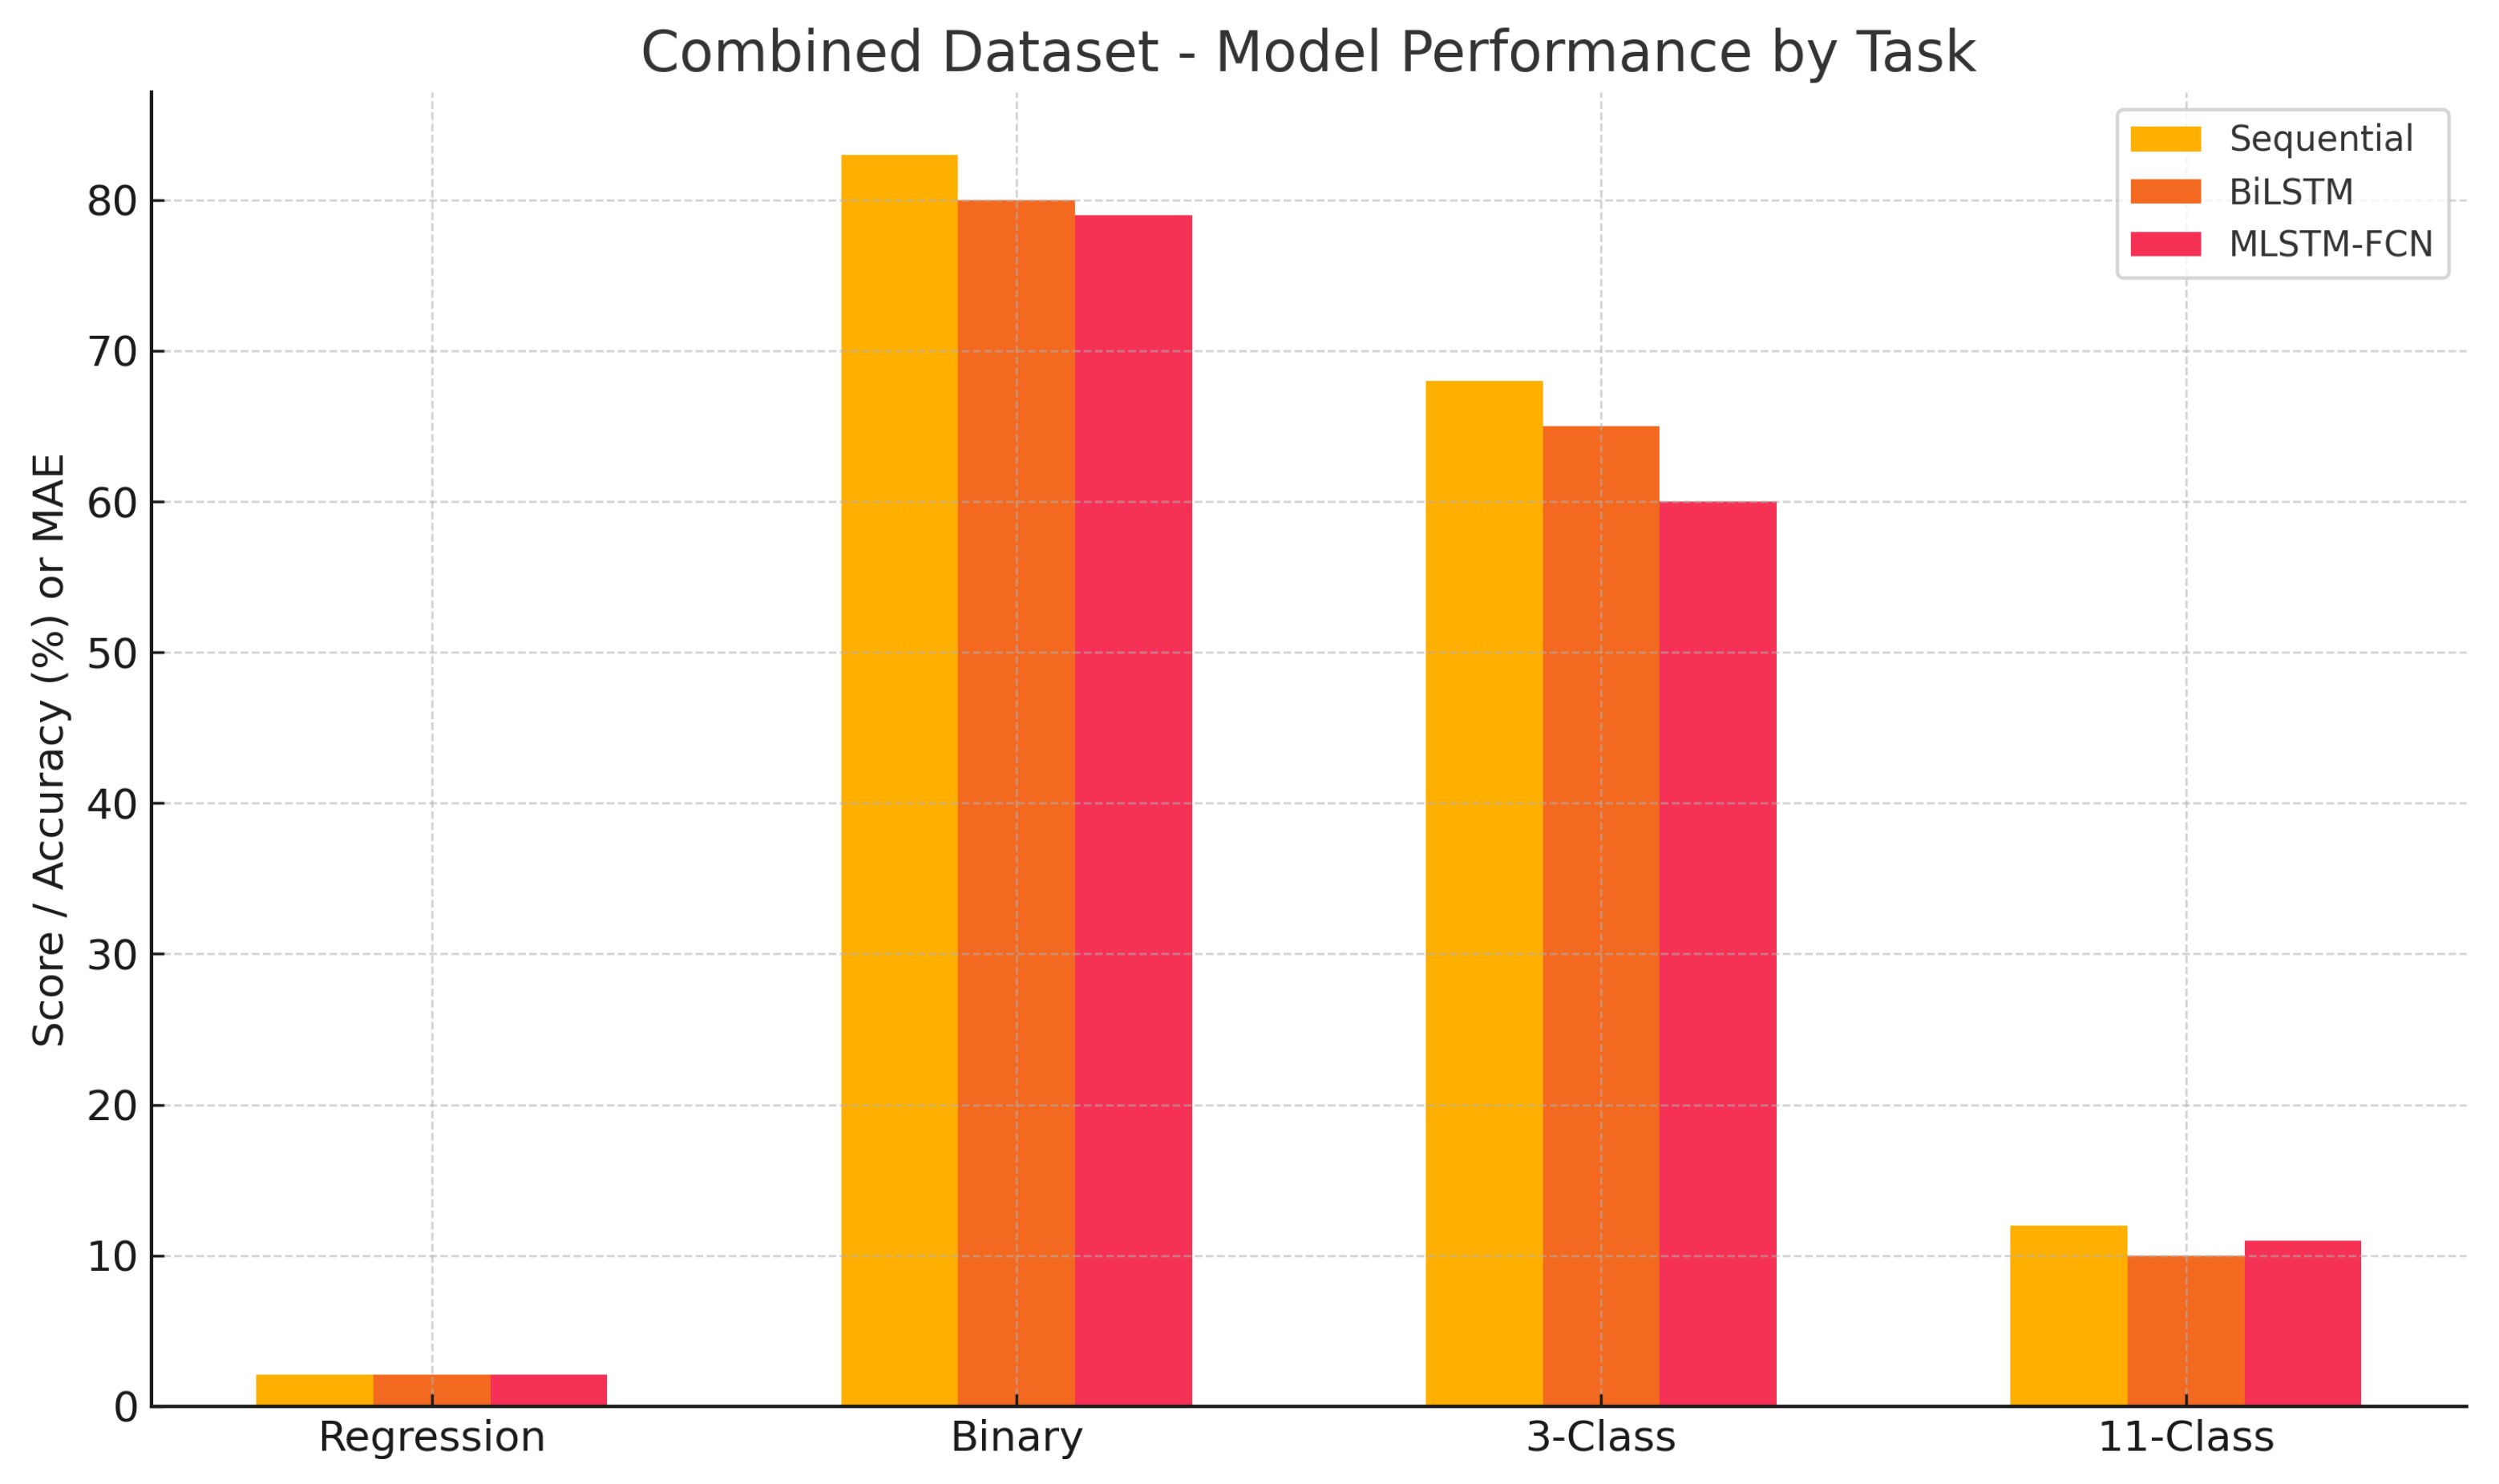

Table 1.
Example Learner Profile Mapping based on LMS Interaction Logs.
| Profile | Score | Interpretation |
|---|---|---|
| Active | 2200 | Very high engagement with action-oriented activities such as quizzes, assignments, and forum posting. |
| Stochastic | -288 | Low tolerance for open-ended or unstructured learning pathways; struggles with exploratory navigation. |
| Sensor | 1700 | Strong preference for concrete, sensory-rich content (e.g., factual resources, examples). |
| Intuitive | 174 | Limited engagement with abstract material or conceptual frameworks; prefers practical over theoretical tasks. |
| Visual | 1470 | Frequent access to visual learning resources such as diagrams, video lectures, or presentations. |
| Verbal | 999 | Moderate interaction with textual content (e.g., PDFs, readings, discussions). |
| Sequential | 2268 | Consistent adherence to structured, linear navigation patterns; prefers step-by-step learning. |
| Global | 532 | Some ability to integrate content holistically, but not dominant; likely favors localized rather than big-picture reasoning. |
Table 2.
Regression performance metrics for the IHU dataset.
| Model | MAE | MSE | RMSE | |
|---|---|---|---|---|
| Sequential | 2.06 | 6.12 | 2.47 | 0.0761 |
| BiLSTM | 2.15 | 6.49 | 2.55 | 0.0207 |
| Pretrained MLSTM-FCN | 2.08 | 6.25 | 2.50 | 0.0563 |
Table 3.
Binary classification results for the IHU dataset.
| Model | Accuracy | Precision | Recall | F1-score |
|---|---|---|---|---|
| Sequential | 0.64 | 0.65 | 0.64 | 0.64 |
| BiLSTM | 0.60 | 0.60 | 0.60 | 0.60 |
| Pretrained MLSTM-FCN | 0.61 | 0.62 | 0.62 | 0.61 |
Table 4.
3-class classification metrics for the IHU dataset.
| Model | Accuracy | Macro F1-score |
|---|---|---|
| Sequential | 0.55 | 0.49 |
| BiLSTM | 0.49 | 0.32 |
| Pretrained MLSTM-FCN | 0.49 | 0.44 |
Table 5.
11-class classification metrics for the IHU dataset.
| Model | Accuracy | Macro F1-score |
|---|---|---|
| Sequential | 0.13 | 0.09 |
| BiLSTM | 0.11 | 0.08 |
| Pretrained MLSTM-FCN | 0.11 | 0.06 |
Table 6.
Regression performance metrics on the Kaggle dataset.
| Model | MAE | MSE | RMSE | |
|---|---|---|---|---|
| Sequential | 1.6431 | 7.1655 | 2.6768 | -0.1527 |
| BiLSTM | 1.6459 | 7.1207 | 2.6685 | -0.1455 |
| Pretrained MLSTM-FCN | 1.6459 | 7.0851 | 2.6618 | -0.1397 |
Table 7.
Binary classification metrics on the Kaggle dataset, focusing on the minority (Fail) class.
Table 7.
Binary classification metrics on the Kaggle dataset, focusing on the minority (Fail) class.
| Model | Accuracy | Precision (Fail) | Recall (Fail) | F1-score (Fail) |
|---|---|---|---|---|
| Sequential | 0.80 | 0.25 | 0.44 | 0.32 |
| BiLSTM | 0.79 | 0.24 | 0.43 | 0.30 |
| Pretrained MLSTM-FCN | 0.80 | 0.24 | 0.39 | 0.29 |
Table 8.
Three-class classification performance on the Kaggle dataset.
| Model | Accuracy | Macro Precision | Macro Recall |
|---|---|---|---|
| Sequential | 0.65 | 0.44 | 0.45 |
| BiLSTM | 0.72 | 0.47 | 0.42 |
| Pretrained MLSTM-FCN | 0.64 | 0.42 | 0.44 |
Table 9.
11-class classification metrics for the Kaggle dataset.
| Model | Accuracy | Macro Precision | Macro Recall |
|---|---|---|---|
| Sequential | 0.23 | 0.13 | 0.16 |
| BiLSTM | 0.25 | 0.10 | 0.13 |
| Pretrained MLSTM-FCN | 0.22 | 0.13 | 0.16 |
Table 10.
Regression performance metrics on the combined IHU+Kaggle dataset.
| Model | MAE | MSE | RMSE | |
|---|---|---|---|---|
| Sequential | 1.6446 | 7.1456 | 2.6733 | -0.1496 |
| BiLSTM | 1.6465 | 7.1059 | 2.6651 | -0.1426 |
| Pretrained MLSTM-FCN | 1.6431 | 7.0975 | 2.6641 | -0.1417 |
Table 11.
Binary classification results on the combined dataset.
| Model | Accuracy | Macro F1-score |
|---|---|---|
| Sequential | 0.83 | 0.62 |
| BiLSTM | 0.80 | 0.58 |
| Pretrained MLSTM-FCN | 0.77 | 0.57 |
Table 12.
3-class classification results on the combined dataset.
| Model | Accuracy | Macro F1-score |
|---|---|---|
| Sequential | 0.70 | 0.45 |
| BiLSTM | 0.69 | 0.40 |
| Pretrained MLSTM-FCN | 0.62 | 0.38 |
Table 13.
11-class classification performance on the combined dataset.
| Model | Accuracy | Macro F1-score |
|---|---|---|
| Sequential | 0.22 | 0.13 |
| BiLSTM | 0.21 | 0.08 |
| Pretrained MLSTM-FCN | 0.22 | 0.13 |
Table 14.
Best-performing models and metrics across datasets and tasks.
| Dataset | Task | Best Model | Accuracy / MAE | Comment |
|---|---|---|---|---|
| IHU | Regression | Sequential | MAE: 2.06, : 0.08 | Low explanatory power |
| IHU | Binary Class | Sequential | 64% | Borderline misclassification common |
| IHU | 3-Class | Sequential | 55%, F1: 0.49 | Weak mid-class recall |
| IHU | 11-Class | Sequential | 13%, F1: 0.09 | Near-random performance |
| Kaggle | Regression | MLSTM-FCN | MAE: 1.64, : -0.14 | Most stable regression scores |
| Kaggle | Binary Class | MLSTM-FCN | 81%, F1: 0.72 | Best precision-recall balance |
| Kaggle | 3-Class | MLSTM-FCN | 71%, F1: 0.66 | Strong overall performance |
| Kaggle | 11-Class | MLSTM-FCN | 27%, F1: 0.21 | Best among all datasets |
| Combined | Regression | Sequential | MAE: 1.64, : -0.15 | Added noise cancels data diversity |
| Combined | Binary Class | Sequential | 83%, F1: 0.62 | Strong pass recall; poor fail precision |
| Combined | 3-Class | Sequential | 70%, F1: 0.45 | Mid-range confusion persists |
| Combined | 11-Class | Sequential | 22%, F1: 0.13 | Unusable without ordinal reformulation |
Table 15.
Summary Matrix of Model Performance Across Datasets and Prediction Tasks
| Dataset | Task | Best Model | Key Observations |
|---|---|---|---|
| IHU | Regression | Sequential (MAE: 2.06, ) | Limited explanatory power; behavioral data insufficient for accurate grade prediction. |
| Binary | Sequential (64%) | Most reliable performance; misclassifications near threshold persist. | |
| 3-Class | Sequential (55%) | BiLSTM biased toward low class; pretrained model overfit top class. | |
| 11-Class | Sequential (≤13%) | Random-like predictions; heavy class imbalance and low recall. | |
| Kaggle | Regression | MLSTM-FCN ( up to 0.52) | Substantially improved regression; richer behavioral signals captured. |
| Binary | Sequential (81%) | Stable, high accuracy; best generalization across models. | |
| 3-Class | BiLSTM (71%) | Peak accuracy here, though inconsistent across runs. | |
| 11-Class | MLSTM-FCN (17%) | Low but improved vs. IHU; some class separation achieved. | |
| Combined | Regression | Sequential (MAE: 1.64, ) | Domain mixing introduced noise; regression failed to improve. |
| Binary | Sequential (83%) | Best result overall; skew toward majority class noted. | |
| 3-Class | Sequential (68%) | Weak mid-class recall; some interpretability maintained. | |
| 11-Class | MLSTM-FCN (≤12%) | Remains infeasible; more advanced methods needed. |
Disclaimer/Publisher’s Note: The statements, opinions and data contained in all publications are solely those of the individual author(s) and contributor(s) and not of MDPI and/or the editor(s). MDPI and/or the editor(s) disclaim responsibility for any injury to people or property resulting from any ideas, methods, instructions or products referred to in the content. |
© 2025 by the authors. Licensee MDPI, Basel, Switzerland. This article is an open access article distributed under the terms and conditions of the Creative Commons Attribution (CC BY) license (http://creativecommons.org/licenses/by/4.0/).
Copyright: This open access article is published under a Creative Commons CC BY 4.0 license, which permit the free download, distribution, and reuse, provided that the author and preprint are cited in any reuse.


