
Submitted:
23 July 2025
Posted:
24 July 2025
You are already at the latest version
Abstract
To assess the carbon productivity of plant communities, soils, and the heterotrophic res-piration of permafrost landscapes, we conducted studies in the southern hypoarctic shrub tussock tundras of northeastern Siberia. We determined the structural characteristics, quantified the above-ground and below-ground phytomass, and evaluated the carbon and nitrogen deposition by various community components, plant fractions and organs. Our findings establish that the most significant primary producers in the southern tundras are deciduous shrubs, bryophytes, and graminoids. The degree of mortmass accumulation indicates a significant slowdown in the microbial decomposition of plant residues and a low rate of annual production. Shrub-lichen-green moss tundras with a significant pres-ence of Eriophorum vaginatum L. in the ground cover accumulate the most total organic carbon (TOC) in the litter-humus and peat layer—449.48 t C ha-1, which is double that of shrub-sphagnum-green moss tundras with Carex L. species. In the mineral layer at 0–10 cm depth, the corresponding values are 29.47 and 6.07 t C ha-1. With continued climate warming, large-scale thermokarst development, an increase in the proportion of grass-sedge bogs, and a reduction in shrub community area could lead to a net carbon loss from the southern hypoarctic tundras. Microbiological parameters showed that the shrub-lichen-green moss tundra has a stable microbial community with high respiratory activity in the litter-humus (23.745 µg CO2-C/g soil/hour) and peat layers (70.627 µg C/g soil), as well as high availability of TOC for processing. The microbial metabolic quotient ranged from 0.14 to 0.73.
Keywords:
primary productivity
; total nitrogen
; microbiological activity
; TOC pools and stocks
; southern tundra of Yakutia
1. Introduction
The primary production of phytomass is a fundamental property of the plant world. This function becomes especially significant in tundra biomes, where the accumulation and synthesis of substances, energy, and the decomposition of organic matter occur at slow rates under extreme conditions. Increasing anthropogenic pressure on the biosphere and ongoing global shifts in climate are pushing vulnerable tundra landscapes toward imbalance and degradation, which could trigger the release of colossal volumes of greenhouse gases (GHGs) stored in the soil and permafrost into the atmosphere.
It is widely believed that climate warming in the Arctic is occurring 2–2.5 times faster than the global average [1]. According to some estimates, the linear trend of the mean annual temperature here showed an increase of about 2.64°C over 30 years (1991–2020) [2]. In light of these trends, there is a clear need for a quantitative assessment of the structural and functional organization, biological productivity, and carbon balance of tundra biogeocenoses (BGCs), as well as for forecasting their response to changes in climate and landscape properties. Of particular scientific interest are the functional groups of tundra plants that create the phytomicroclimate, stabilize permafrost, and accumulate the largest reserves of organic matter (OM).
Among the most common dominant species in the Siberian sector of the southern tundra subzone are the deciduous shrubs Betula nana L. and Salix pulchra Cham. The dense upper canopy they form provides a thermal insulating function in the southern tundras, shading the ground cover, cooling the soil surface, and thereby largely preventing permafrost thaw. Numerous studies have shown that rising air temperatures in recent decades have promoted the expansion of these shrubs, allowing them to assume dominant positions in tundras across different regions of the world [3,4,5,6,7,8,9,10]. Reports of increased activity in these species, as well as in graminoids and other plant groups, require field verification to assess the rate of change in their functional state under rapidly changing conditions. In this context, we aimed to conduct a detailed in situ study of the composition and structure of tundra communities, the life strategies and productivity of their edifying and dominant plant groups, and the extent of carbon and nitrogen deposition by them.
The pedosphere is one of Earth’s largest carbon reservoirs after the ocean, accumulating 2,500 billion tons of carbon [11]. The area occupied by permafrost soils is 8.6 million km2, accounting for about 27% of all land north of 50°N latitude [12]. In Yakutia, permafrost soils are prevalent in both lowland landscapes—42% (1.3 million km2)—and mountain regions—58% (1.8 million km2) [13]. The climatic conditions of Yakutia lead to slow soil thawing during the warm period, which necessarily affects the thickness of the seasonally thawed layer. This layer functions as the active zone for biochemical and physicochemical processes and is a key factor determining the generation of ecosystem organic carbon. The soils of northern latitudes are a key component of the global carbon cycle; the permafrost region covers 22% of the Northern Hemisphere and contains nearly twice as much carbon as the atmosphere. However, organic carbon stocks in different climatic zones of Russia are often underestimated due to complex heterogeneity [14] and landscape diversity. On a global scale, soil carbon stocks are estimated at 1417 Gt C, with the Russian Federation accounting for 216 Gt C, or 15% of the world’s total [15]. Currently, the preservation and stability of carbon in permafrost largely depend on the degree of permafrost (PF) degradation and anthropogenic impacts on the ecosystem. The most hazardous areas in terms of carbon release from Yakutian landscapes are degraded sections of the ice complex, where thermokarst processes are actively developing due to the reduction in ground ice volume and its thawing. This, along with rising PF temperatures, creates a cause-and-effect relationship leading to the loss of organic carbon from soil organic matter.
Modern changes in the planet’s climate structure [16,17] are causing the transformation of permafrost landscapes across vast northern territories, with expansion in northern and eastern Siberia. The results manifest as thermokarst and erosion processes, the formation of lakes and waterlogging, and the development of thermocirques and baydzharakhs (thermokarst mounds) that dominate certain areas of the landscape. Cryogenic processes are intensifying, and ground ice is degrading. Concurrently, the risks of losing organic matter reservoirs from the upper soil layer and PF increase, which undoubtedly causes accelerated anaerobic and aerobic microbial decomposition [18]. This could potentially lead to an increase in greenhouse gas emissions into the atmosphere, creating a positive feedback loop with rising air temperatures [19]. Additionally, physical losses of biogenic elements into river and sea basins are initiated through coastal destruction and thermo-abrasion. The circumpolar region contains approximately 1300–1395 Gt of terrestrial organic carbon [20], and the tundra holds 30% of the world’s soil organic carbon stock [21]. About 850 Gt are preserved within the PF [22]. The total carbon stock in the Arctic for sediments up to 25 m deep is estimated at 1400–1850 Gt [23]. Due to the thawing of late Pleistocene ice complex layers, these areas could transform from a carbon sink into an inevitable source, owing to their high saturation with organic material and silty fractions. Late Pleistocene deposits contain 83 Gt [24] of organic carbon, while Holocene thermokarst formations contain 130 Gt [25]. It is likely that these sediments accumulated rapidly, leading to the burial of source material before plant and animal remains could fully decompose. In the modern climate, rising air temperatures cause deeper heat penetration and soil warming. This promotes active decomposition and loss of the organic fraction, coupled with changes in hydrological conditions throughout the entire sediment profile [26], leading to a high carbon load on the atmosphere.
The purpose of our research is to assess the contribution of the southern hypoarctic shrub tundra to the accumulation of total organic carbon (TOC), considering the above-ground and below-ground phytomass of dominant plant species. Our objectives were: to assess the pools and stocks of TOC in the litter and soil cover, which have developed under complex permafrost-climatic conditions; and to analyze the microbiological activity within the soil-plant cover.
2. Materials and Methods
To assess the structural and functional state, primary biological productivity parameters, and the carbon and nitrogen balance of tundra ecosystems, we conducted studies in the lower Indigirka River basin (Yana-Indigirka Lowland) in northeastern Siberia. The studied tundra types belong to the Lena-Kolyma hypoarctic-tundra biome [27] and are among the dominant zonal lowland tundra types in this area.
The studies were conducted during the 2024 growing season at the “Chokurdakh” tundra research station (YA-Ckd), located 30 km northwest of the village of the same name in the Allaikhovsky district, and 167 km south of the East Siberian Sea. The station is situated within the “Kytalyk” National Park, managed by the Ministry of Ecology, Nature Management and Forestry of the Republic of Sakha (Yakutia). It is part of the regional SakhaFluxNet network of interdisciplinary research monitoring stations, which is integrated into the global FLUXNET network and the all-Russian RuFlux network for monitoring ecosystem greenhouse gas fluxes (Figure 1).
The climate of the territory is classified as arctic and subarctic continental [28] and is characterized by a long, cold winter and a short, cool summer. According to data from the Chokurdakh meteorological station, the mean annual air temperature is -12.7°C, with a mean January temperature of -33.4°C and a mean July temperature of +10.6°C. A stable transition of daily air temperatures above +10.0°C typically occurs in the first or second ten-day period of June. The number of days with temperatures >5°C is 65. The annual precipitation is 237 mm. The average maximum thickness of the snow cover ranges from 50 to 80 cm.
To assess tundra productivity, we used methods described in [29,30,31,32], which were adapted and approved by the Center for Forest Ecology and Productivity of the Russian Academy of Sciences (Moscow). This was part of the state project “Development of a system for ground-based and remote monitoring of carbon pools and greenhouse gas fluxes on the territory of the Russian Federation, ensuring the creation of a data accounting system for fluxes of climatically active substances and the carbon budget in forests and other terrestrial ecological systems” (https://ritm-c.ru).
The classification of plant communities was based on the prevailing life forms, dominant species, and considered the tiering, micro-complexity, structure, and ecological characteristics of the ecotopes, in accordance with the principles of V.I. Perfilieva et al. [33].
For monitoring the dynamics of productivity and fluxes of carbon and nitrogen in plant communities and soils, we established permanent sample plots (PSPs) of 50.0 x 50.0 m, with five replications along a transect on a low accumulative plain. On each PSP, we conducted detailed geobotanical descriptions, including a full characterization of the floristic composition, horizontal and vertical structure, an assessment of plant vitality, and measurements of their height and degree of projective cover (DPC).
Above-ground phytomass stocks were determined using the mowing method [29]. Measurements of above-ground and below-ground phytomass were carried out during the period of maximum seasonal plant development. Plant samples were collected from record plots in the buffer zone of each PSP, using monoliths of 25.0 x 25.0 cm to a depth of up to 20.0 cm [29,31,32]. Herbaceous plants and dwarf shrubs were cut at the boundary between the green and brown parts of mosses, and the moss-lichen turf was completely removed. For dwarf shrubs, leaves and stems were separated into current-year growth and perennial parts, along with fruits and seeds. For herbaceous plants, we distinguished between vegetative and generative parts. For mosses, we separated current-year shoots from perennial ones. Dead (brown) parts of mosses and lichens were separated from the living parts and classified as mortmass [29,31,32]. Dead grass, as well as dry plants and their parts that had changed color (yellowed and brown), were classified as litterfall.
To calculate the weighted average values of phytomass and total organic carbon (TOC) for each significant species, we used their DPC within the PSP. This method allowed us to determine the proportional contribution of each species to the productivity and carbon content of the studied tundra types. The parcelle, micro-grouping, mosaic, or elementary biogeoareal (EBGA) is the structural and functional unit of the biogeocenotic cover. It serves as the elementary provider of ecosystem functions, such as forming soil fertility and regulating biogeochemical cycles. The areas, shapes, and names of the EBGAs were determined by the dominant and co-dominant plants. Within the identified elements of the micro-complex mosaic, we calculated the DPC of the main dominants and subdominants. In the buffer zone outside the PSPs, on similar elements, we selected record plots for taking monoliths and digging soil pits and half-pits. To study the productivity of the BGC, we identified the following parcelles (EBGAs): Salix pulchra Cham., Betula nana L., Eriophorum vaginatum tussock, sedge tussock, lichen-green moss, and sphagnum.
We analyzed the composition, structure, functioning patterns, and productivity of plant communities, as well as the structure of phytomass and mortmass, divided into organs and fractions. We determined the parameters of deposited carbon in above-ground and below-ground fractions and organs of plants, lichens, annual production, and mortmass. We calculated weighted average values in conjunction with their landscape position, taking into account the horizontal micro-complexity (EBGA). We also assessed the amount of total nitrogen (TN) and the C/N ratio in all fractions of phytomass and dead OM.
On the permanent sample plots, we collected samples of the ground cover (litterfall and dead grass) using a 25×25 cm frame, with five replications. Soil samples were taken from freshly dug full-profile soil pits. We performed a morphological description of the soil profile and measured the soil bulk density by genetic horizons with three replications. Sampling for density was carried out using steel cylinders with a volume of 100 cm3. Carbon stocks were calculated separately for each genetic horizon and then summed to obtain the total carbon stocks in the ground and soil layers. The TOC stocks were calculated using Formula (1).
where S is the carbon stock in the soil, t/ha; X is the TOC content in the soil, %; p is the bulk density of the soil, g/cm3; and H is the thickness of the genetic horizon, cm.
To determine the proportion of fine earth (<2 mm) in the mineral horizons, the samples were sieved through a 2 mm mesh sieve. The proportion was 100% in all mineral layers, with no rock fragments; therefore, this indicator was not included in the formula for calculating TOC stocks.
A series of analytical works was carried out at the Federal Research Center “V.V. Dokuchaev Soil Science Institute” (Moscow):
1. The content of total nitrogen (TN) and TOC in plants, mortmass, and soil was determined by gas chromatography using an ECS 8020 elemental analyzer.
2. The hydrogen ion exponent (pH) of the aqueous extract was measured in the litter-humus horizon, peat, and soil.
3. The granulometric composition of the parent material was determined in accordance with the international standard ISO 11277:2020 [34].
Microbiological analysis was performed at the V.N. Sukachev Institute of Forest, SB RAS (Krasnoyarsk). The amount of CO2 released by microorganisms was measured on a Picarro 2201-i gas analyzer. The potential respiration from organogenic and mineral soil horizons was assessed by the substrate-induced respiration (SIR) method using a glucose-mineral mixture.
The SIR rate is calculated using Formula (2) [35].
where SIR is the rate of substrate-induced respiration (µL CO2 g-1 h-1); CO2 soil is the CO2 concentration in the gas phase of the vial with soil (vol %); CO2 air is the CO2 concentration in the gas phase of the empty vial (vol %); Vvial is the volume of the air space in the vial with the soil sample (cm3); 60 is the conversion factor from minutes to hours; 10 is a calculation constant derived from 1000 (cm3 to µL) / 100 (vol % to units); Δt is the time from vial closure to gas probe sampling (min); and mads is the mass of the absolutely dry soil sample (g).
The mass of the absolutely dry soil sample is calculated using Formula (3).
where mads is the mass of the absolutely dry soil sample (g); msm is the mass of the soil sample (g); and W is the gravimetric soil moisture (%).
The microbial biomass content in the soil is calculated using Formula (4) [36].
where Cmic is the microbial biomass content (µg C g-1); SIR is the rate of substrate-induced respiration (µL CO2 g-1 h-1); and 40.04 and 3.7 are coefficients for estimating Cmic (µg C g-1) from SIR (µL CO2 g-1 h-1).
The basal respiration rate is calculated using Formula (5) [37].
where is the basal respiration rate of the soil (µg C g-1 h-1); CO2 soil is the CO2 concentration in the gas phase of the vial with soil (vol %); CO2 air is the CO2 concentration in the gas phase of the empty vial (vol %); Vvial is the volume of the air space in the vial with the soil sample (cm3); 60 is the conversion factor from minutes to hours; 10 is a calculation constant derived from 1000 (cm3 to µL) / 100 (vol % to units); Δt is the time from vial closure to gas probe sampling (min); mads is the mass of the absolutely dry soil sample (g); 0.272 is the carbon content in carbon dioxide (ratio of the mass of C to CO2: 12/44); and 1.8177 is the specific gravity of CO2 at 22°C (g L-1).
The specific respiration of microbial biomass, or the metabolic quotient, is calculated as the ratio of the basal respiration (BR) rate to the microbial biomass, according to Formula (5).
where qСО2 is the metabolic quotient (µg C mg-1 Cmic h-1); BR is the basal respiration rate of the soil (µg C g-1 h-1); Cmic is the microbial biomass content (µg C g-1); and 1000 is the conversion factor from µg to mg of Cmic.
Statistical processing of the data was performed in Microsoft Excel for Windows 10. The data in the manuscript are presented as arithmetic means with the standard error of the mean (SD).
3. Results
3.1. Permafrost-Landscape Conditions and Physicochemical Soil Characteristics at the “Chokurdakh” Tundra Research Station
The study areas are located in the Yana-Kolyma region, within the northern geocryological zone characterized by continuous permafrost with a mean annual rock temperature of –9 to –11°C [38]. Geologically, they belong to the Indigirka-Kolyma synclinal zone. The geocryological zone is characterized by the continuous (solid) distribution of permafrost. The lowest ground temperature in the layer of zero annual amplitude is -2...-12°С. The territory’s Quaternary deposits are composed of sandy-clay and silty material. Global changes in the climatic and landscape situation during the Pleistocene led to the development of hypoarctic landscapes and the onset of long-term rock freezing. In the initial stage of permafrost development in the Pliocene-Lower Pleistocene, a continental stratum of aleurites with interlayers of sand and peat was formed. This stratum includes several tiers with pseudomorphs along polygonal ice veins, reflecting a complex history of geocryological development. The Middle and Upper Pleistocene strata of loose deposits are relief-forming over a significant portion of the region and appear on the surface of the ancient lacustrine-alluvial plain in the continental part [38]. These deposits are generally of a uniform composition (silty and peaty sandy loams, loams, and fine-grained sands). The Ice Complex (IC), formed during the most severe epochs of the Upper Pleistocene, reached the maximum ice content (up to 80-100%) for the entire cryolithozone. The thickness of the IC deposits reaches 80 m, and the total thickness of the cryolithozone under typical zonal conditions can range from 200 to 700 m. Within the sections of the IC, alas complexes of sediments (taberal, lacustrine, bog, and alas proper) are found embedded in the Middle and Upper Quaternary lacustrine-alluvial deposits [39]. Alas plains are erosional-thermokarst basins formed on the surface of an ancient lacustrine-alluvial plain, with their bottoms typically complicated by a polygonal-ridged microrelief. In some areas of the lowlands, alases may cover a larger area than all other geomorphological levels combined. The bottoms of these alases can have both different absolute and relative elevations (in relation to accumulative watersheds). Within the permanent sample plots (PSPs), accumulative plains are particularly prominent. They occupy areas of tectonic subsidence and accumulation of loose Quaternary deposits (alluvial, lacustrine, marine, and glacial) and are characterized by a slightly dissected relief and minor fluctuations in relative heights. On these accumulative plains, landforms associated with their permafrost origin, the high ice content of loose deposits, and the presence of massive ground ice are widespread. These include thermokarst basins, frost mounds, frost cracks, and polygons [40].
According to permafrost-landscape zoning, the PSPs are located in the Nizhneindigirskaya lacustrine-thermokarst province. By locality type, they belong to the alas type, which is represented by flat-plain surfaces of lacustrine-alluvial plains and their remnants (yedoma). The stratigraphic-genetic complex is composed of lacustrine-alluvial rocks. In typological terms, the landscape is a typical tundra on continuous permafrost (PF). The lithological composition mainly consists of sandy loams and loams. The permafrost conditions of the PSPs are manifested in the development of the IC, which is covered with a mantle of loam and sandy loam and penetrated by syngenetic ice wedges (SIWs). Cryogenic processes such as frost cracking, thermokarst, and ground heaving are highly developed on the PSPs. The predominant cryogenic textures and bed-forming ice in the alas type of locality are layered, lenticular, and reticulate, along with a system of massive SIWs. The volumetric ice content varies widely, from 0.2 to 0.8 [41,42].
The cryogenic processes identified in our work are associated with the high ice content of the IC permafrost strata and yedoma uplands. These processes are manifested as polygonal frost cracking of soils, accompanied by the growth of syngenetic ice wedges (Figure 2A). As a result, mechanical movement of organic material occurs, contributing to its redistribution in the upper soil layers. The total organic carbon accumulated in peat horizons can be transported to deeper soil layers, where it becomes less accessible for microbial decomposition. This process aids in the conservation of carbon in the permafrost, which is especially important in the context of global warming, as permafrost degradation can lead to the release of significant amounts of carbon into the atmosphere. During the summer, regular sliding (solifluction) of the soil-plant layer is observed on the slopes of ridges. Solifluction microrelief forms (tongues, small terraces, and frontal ledges) are evident only on separate sections of the ridge slopes. The areas where they develop typically coincide with outcrops of argillite rock packs, which weather most quickly into sandy-loamy varieties (Figure 2B). On one hand, this process can contribute to carbon accumulation in relief depressions, such as thermokarst lakes or alases. Under these conditions, organic carbon can be buried under a layer of mineral deposits, which slows its decomposition and promotes long-term conservation. However, with permafrost degradation, solifluction can initiate soil cover erosion, leading to the loss of organic material and its transport into river runoff, converting the carbon into a water-soluble form. In addition, widespread thermokarst is observed—a process of ground subsidence resulting from the thawing of ground ice, which leads to the formation of thermokarst lakes and basins. In some cases, thermokarst processes can promote the burial of carbon under a layer of water or mineral deposits, which slows down decomposition.
Thus, thermokarst can both enhance carbon emission and contribute to its conservation, depending on the specific landscape conditions. An important aspect of physical carbon loss is the destruction of the Beryolyokh River coastline due to the thermo-abrasion of unconsolidated soils (Figure 2C), where a significant mass of plant (organic) and soil material is washed away by the flow of warm water and wave action. Polygonal-ridged relief is a characteristic feature of the southern tundra of the Yana-Indigirka Lowland. It is a system of polygons formed as a result of cryogenic processes caused by the frost cracking of the ground. The polygons are separated by ridges that form due to the accumulation of syngenetic ice wedges in the cracks. This type of relief is typical for areas with permafrost where seasonal cycles of freezing and thawing occur. Hydrolaccoliths, or frost mounds (pingos), are also the result of cryogenic processes. They arise from the freezing of water in the ground and the subsequent heaving of the earth’s surface (Figure 2D). These cryogenic and exogenous processes indicate permafrost degradation and have a significant impact on the distribution and dynamics of TOC in the landscape.
The intrazonal soils of the PSPs are located in the Eurasian polar geographical belt and belong to the subzone of tundra gley soils (Gleysols) [43] of the Yana-Indigirka-Kolyma district (Table 1). They consist of polygonal-fissured complexes of tundra gley peaty, tundra gley peaty-humus, and humus-gley soils, with soils of bare spots and frost cracks. They also include polygonal-ridged complexes of peaty-gley bog, tundra gley peaty soils, and soils of frost cracks. These are predominantly loamy, with frequent changes in granulometric composition in places, showing a predominance of sands and sandy loams on lacustrine-alluvial and loess-ice deposits [44]. The soil cover is characterized by: the distribution of mainly acidic soils; the ubiquitous development of gley soils on sandy loamy parent materials; the absence of salt and carbonate accumulations; a high degree of decomposition of organogenic horizons; widespread development of bare spot formation in plakor (upland) landscapes, but a small contribution of vegetation-free spots and their associated soils to the overall soil cover due to rapid overgrowth; and a lesser degree of gleying on elevated elements of meso- and microrelief compared to other tundra zone facies, with gleying expressed in the form of supra-permafrost gley horizons [45]. In the Quaternary deposits of the sandy loamy-loamy type, developed on the surface of the ice complex (IC), the soil thaw depth is 0.4–0.6 m. In peaty sandy loams, loams, peat, and the moss litter of alases and low-lying swampy bottoms, the thaw depth varies from 0.15 to 0.4 m, while on higher and drier areas it ranges from 0.2 to 0.45 m. The soils of the PSPs are characterized by a high degree of water saturation due to the shallow depth of icy permafrost, which also manifests as thixotropy in the mineral horizons. The proportion of fine earth <2 mm sifted through a 2 mm sieve is 100%.
Chok-1 Shrub-sphagnum-green moss tundra, Chok-2 and Chok-5 Shrub-lichen-green moss tundra, Chok-3 and Chok-4 Shrub-lichen-green moss tundra with Eriophorum vaginatum.
The TOC content in the peat-forming layer (O horizon) reaches 23.8–46.60%. Directly in the peat horizon (T), the variability of this indicator is high, ranging from 12.74–46.80%. The change in TOC content as plant mass transforms into peat serves as an indicator of the depth of the peat formation process. With a decrease in phytomass in the litter-humus horizon, TOC accumulates and TN decreases; conversely, an increase in the TN content in the peat horizon promotes its decomposition. Such a wide range of values was not recorded in the mineral gley horizon (G⊥), where values ranged from a minimum of 0.96% to a maximum of 1.91%. This pattern is characteristic of all studied tundra types within the biogeocenosis, regardless of the vegetation type. The low carbon content in the gleyed mineral horizon (GC⊥) may indicate the weathering of minerals and a relatively mature stage of soil formation. The mineral part of the soil is poor in nitrogen due to permafrost and cold soil conditions, which prevents the complete conversion of organic compounds into nitrates, leaving nitrogen primarily in ammonium form. The C/N ratio plays a crucial role in the qualitative decomposition of plant material and the activity of heterotrophic microorganisms in the natural environment. The high TOC and low TN content in the

Table 1.
Characteristics of soils in the hypoarctic southern shrub tundra of the Yana-Indigirka Lowland, Northeastern Siberia.
Table 1.
Characteristics of soils in the hypoarctic southern shrub tundra of the Yana-Indigirka Lowland, Northeastern Siberia.
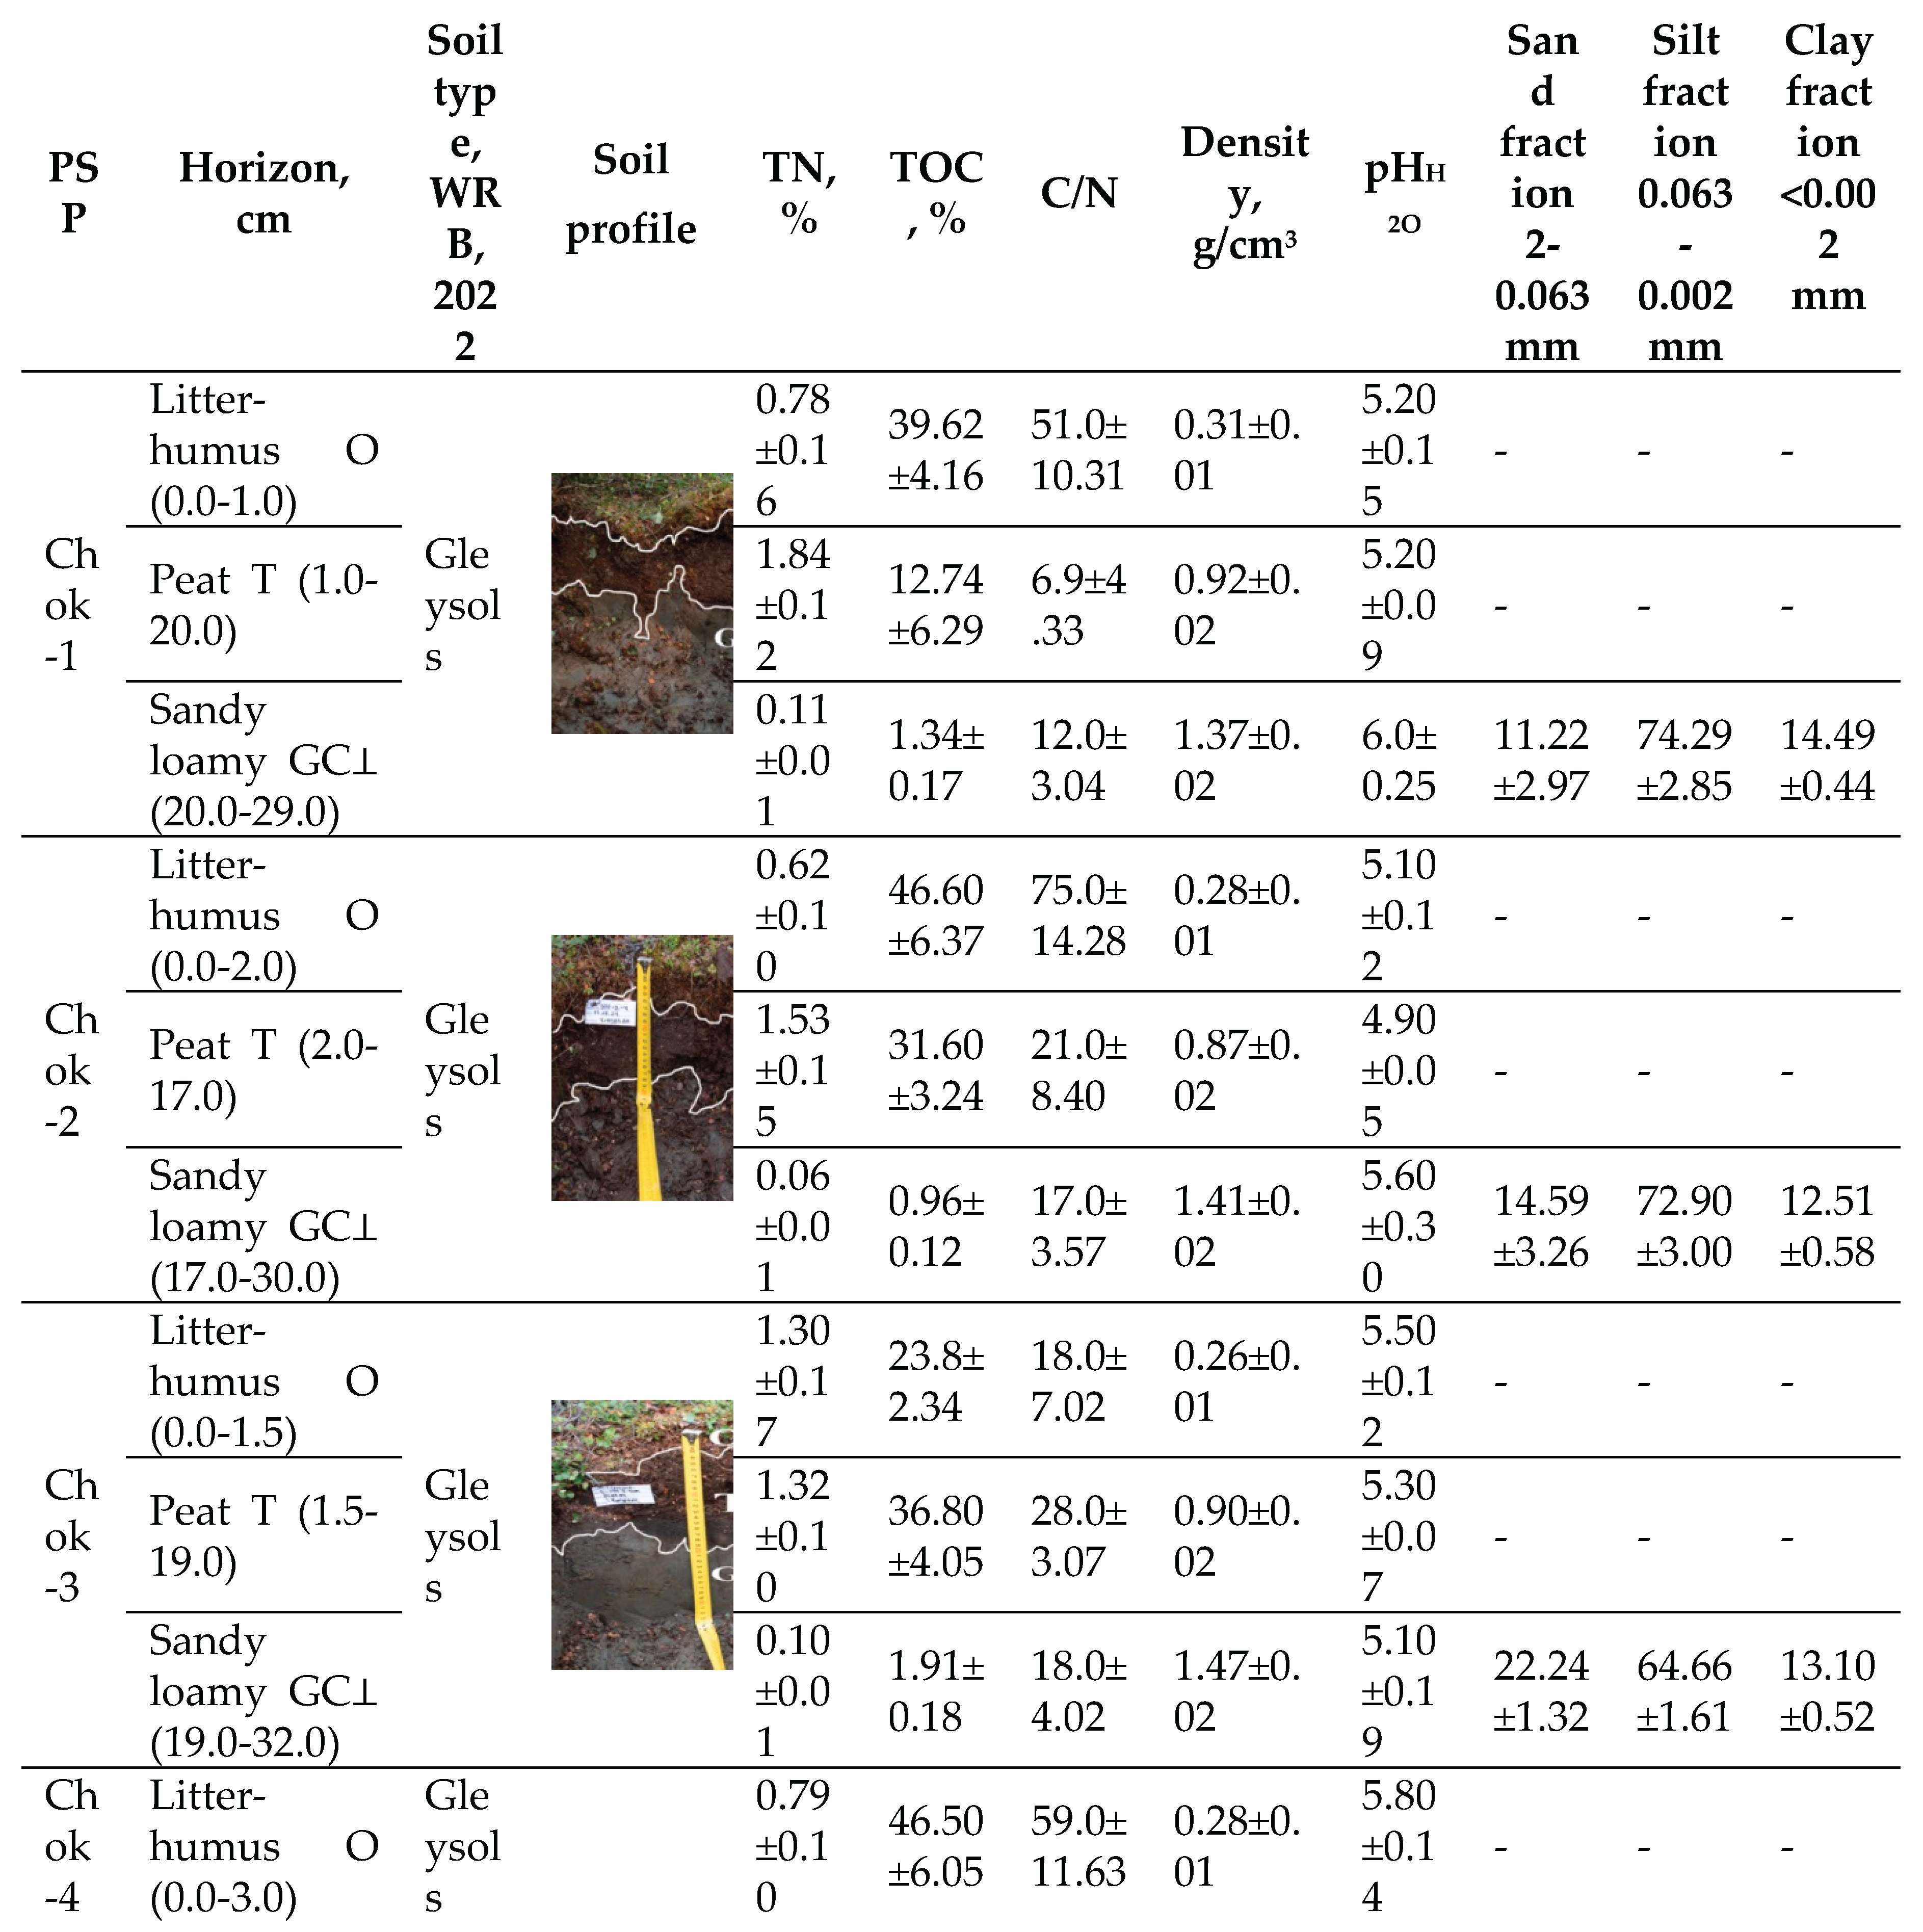
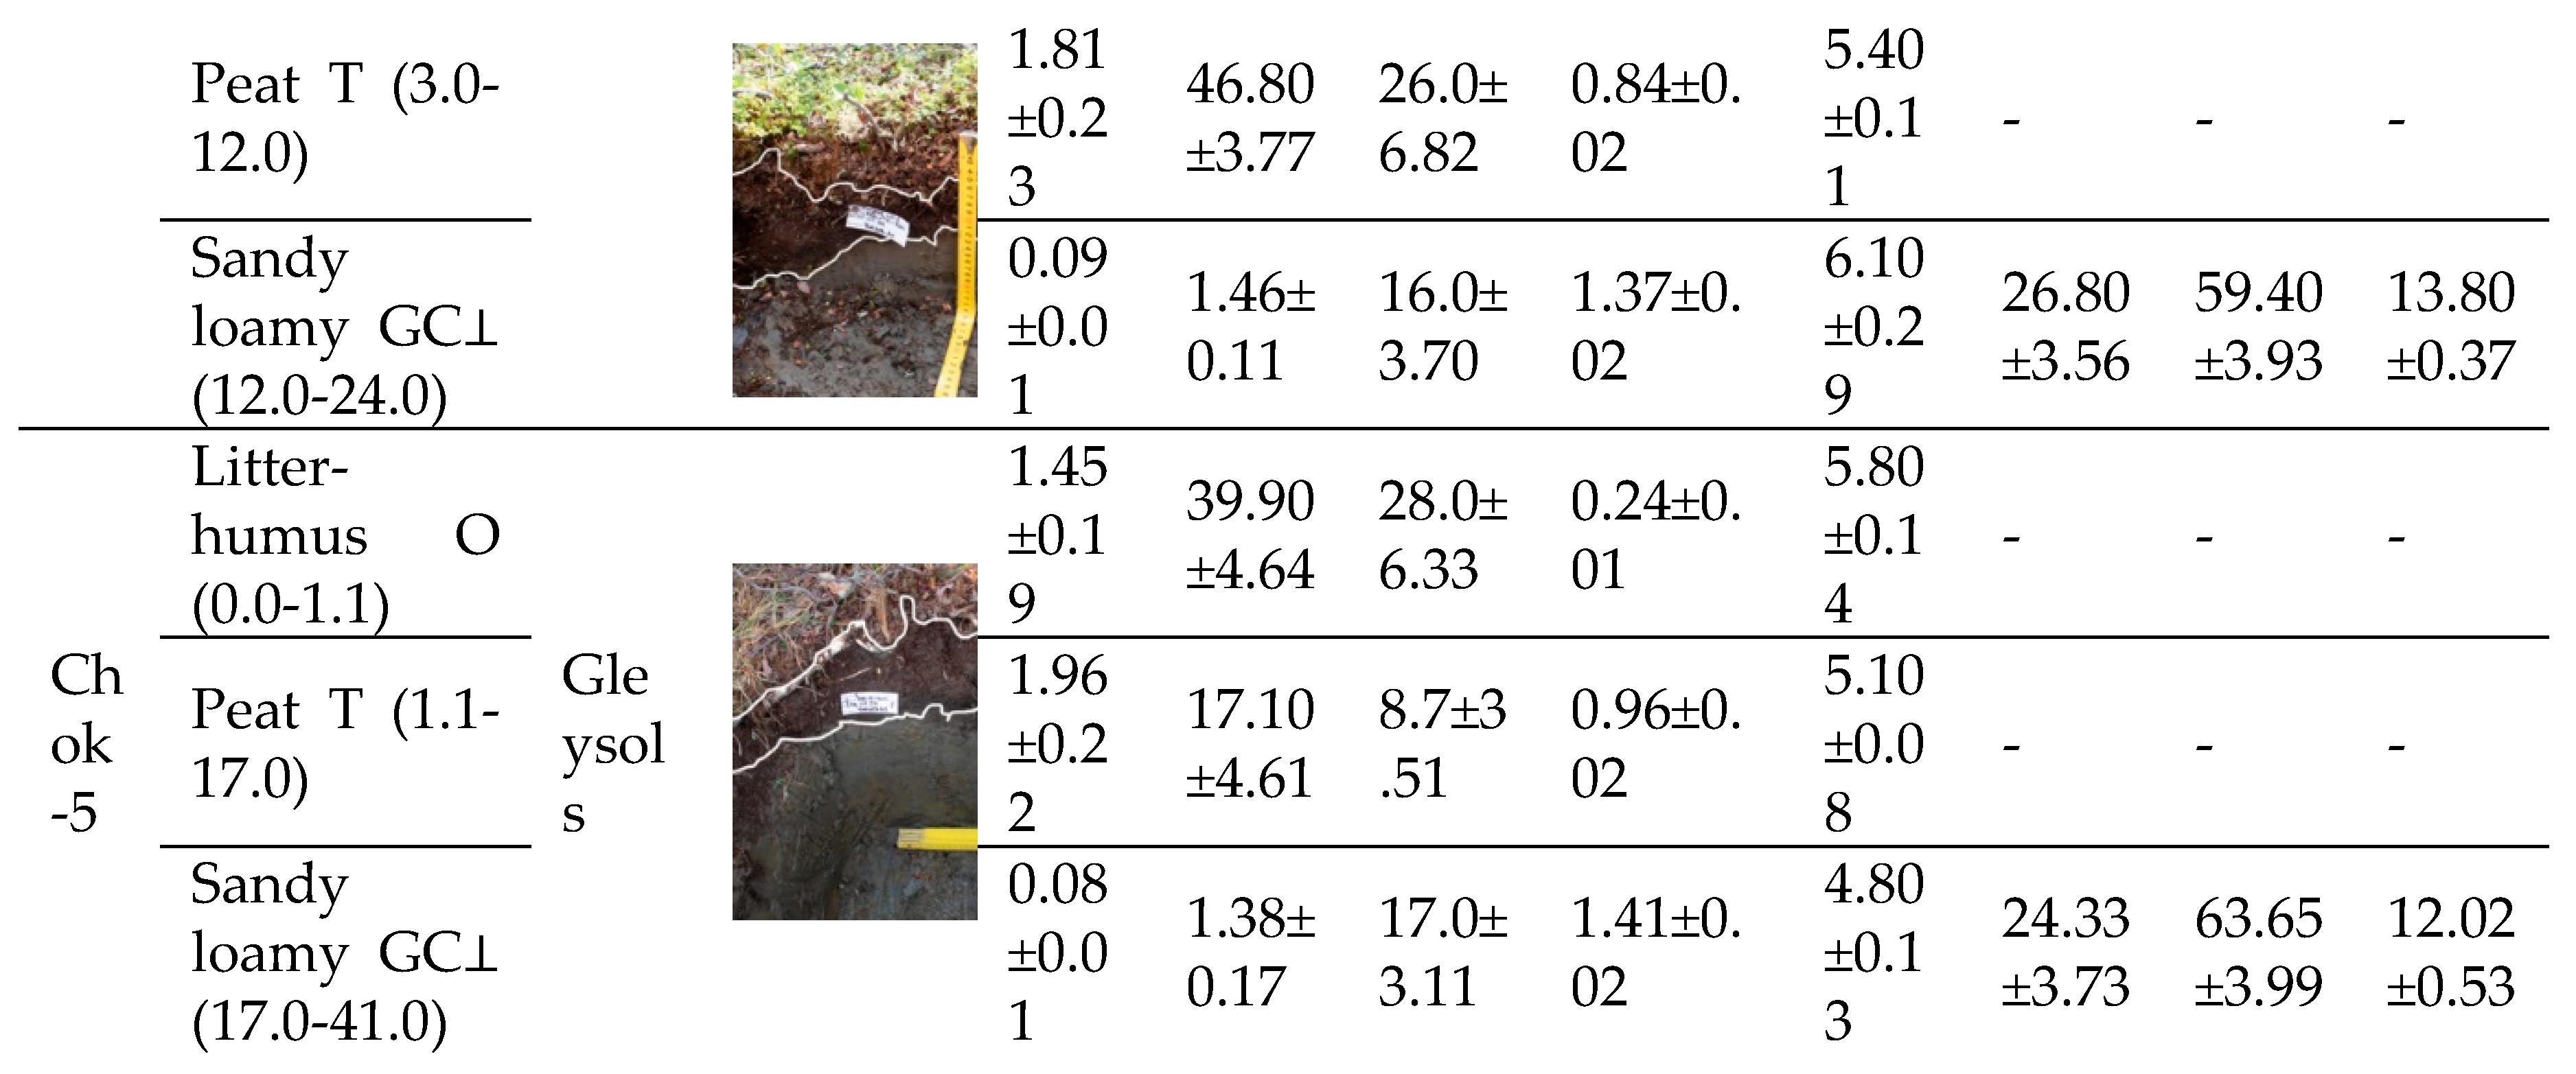
litter and soil contribute to the weak decomposition of both fresh and preserved organic material. This is due to a reduced rate of ammonification on nitrogen-poor media and the presence of a difficult-to-hydrolyze nitrogen fraction. Therefore, it can be assumed that organic matter with a high TOC content disrupts the C/N ratio and leads to nitrogen immobilization.
The granulometric composition of the parent material significantly impacts the soil’s hydro-physical, physicochemical, and thermal properties, as well as its redox conditions, absorption capacity, and the accumulation of carbon and nitrogen. In the Yana-Indigirka Lowland, silty fractions prevail, constituting 67% of the composition, but they have a low TOC content compared to the upper horizons. The proportions of sand and clay particles are 20% and 13%, respectively. The density of the litter and soil is the ratio of the mass of dry material in its natural, undisturbed state to its volume. This indicator is essential for calculating the pools and stocks of carbon and other elements in the ground and soil cover. Density values increase from the litter-humus horizon down to the parent material.
3.2. Geobotanical Analysis and the Content of Biogenic Elements in Phytomass and Mortmass
The research area belongs to the southern subzone of hypoarctic tundras and, according to geobotanical zoning [33], is part of the Khromo-Beryolyokhsky district of the Yana-Indigirka okrug of the hypoarctic Yana-Kolyma subprovince, within the East Siberian province of the Russian tundra zone. According to the floristic zoning of Yakutia, the territory is assigned to the Arctic region [46].
The vegetation cover of the region reflects the main features of the hypoarctic-tundra biome of northeastern Siberia. The high heterogeneity of vegetation and the complex landscape differentiation of communities are due to the spatial distribution of environmental factors along meso- and microrelief gradients. The studied tundra communities are developed on flat, inter-ridge accumulative plains and are classified as hypoarctic shrub (Salix pulchra, Betula nana, S. glauca L.) dwarf shrub-green moss (Vaccinium vitis-idaea L., Ledum decumbens (Aiton) Lodd. ex Steud., Aulacomnium palustre (Hedw.) Schwägr.) tundras. These occur in a complex with sedge-sheathed cottongrass (Carex bigelowii Torr. ex Schwein., Carex appendiculata (Trautv. & C.A. Mey.) Kük, Eriophorum vaginatum) tussock groupings that include sphagnums (Sphagnum warnstorfii Russow).
We determined the values of deposited carbon in the above-ground and below-ground fractions, organs of plants, and lichens in the studied tundras. The highest average TOC content was found in the woody fraction of the above-ground shoots of evergreen and deciduous shrubs and dwarf shrubs, such as Ledum decumbens, Betula nana, and Vaccinium vitis-idaea (Table 2). Among graminoids, the TOC content is lower in Eriophorum vaginatum. The lowest TOC concentrations were found in bryophytes.
As is known, the process of humification requires an optimal ratio of carbon to nitrogen in plant residues, typically within the range of 20-30:1. Different groups of organisms, life forms, and plant fractions in the studied tundras show marked differences in their C/N ratios. In our studies, the highest average values for this indicator were established for the stem mass of shrubs, the perennial woody shoots of dwarf shrubs, evergreen leaves, and lichen thalli (Figure 3). The maximum absolute value was recorded for the stems of Salix pulchra (178) and for the thalli of Flavocetraria cucullata (169). In graminoids, the C/N ratio is, on average, close to optimal values: in sedges with annual summer-green shoots, it is 28, while in the winter-green cottongrass with biennial leaves, it is higher at 40.
The slowest decomposition rate is observed in the stems, branches, and perennial shoots of shrubs, the evergreen leaves of dwarf shrubs, and lichen thalli. In contrast, the leaves of shrubs and the vegetative annual shoots of grasses are more susceptible to rapid mineralization, as they are an accessible substrate for microbial processing due to their higher nitrogen content compared to other plant parts. The intensity of mineralization of biogenic elements in permafrost conditions is extremely slow, which explains the high C/N ratio in the phytomass. Nevertheless, the transformation process of carbon and nitrogen in Arctic ecosystems holds a key position, influencing the productivity of plant communities and the accumulation of litter along with the peat layer.
The results of our studies on the productivity of tundra ecosystems showed that in the considered types of southern tundras, the most important producers that accumulate the maximum phytomass—both above-ground and below-ground—are shrubs, bryophytes, and Eriophorum vaginatum (Cyperaceae Juss). The weighted average above-ground living phytomass in these tundras reaches 15.79 t/ha, with an annual production of 2.58 t/ha/year in absolutely dry weight. Overall, the average total living productivity, including above-ground and below-ground phytomass, was 43.12 t/ha. The total amount of above-ground TOC was 7.76 t C/ha, below-ground was 12.22 t C/ha, and in mortmass, it was 12.47 t C/ha (Figure 4).
We established that Salix pulchra accumulates the largest weighted average above-ground phytomass, accounting for 40.50% of the above-ground plant weight in the studied tundra BGCs (Figure 5). The DPC of Salix pulchra in the surveyed tundras is relatively low, averaging 18.50% and ranging from 12% to 25%, occasionally reaching a maximum of 40%. Nevertheless, its 100% occurrence rate in the communities and the mass of its large woody shoots were decisive factors in the weighted average values. The stock in the stem part is 2.56 t C/ha (83.54%), while in the leaves it is 0.43 t C/ha (16.46%).
In terms of above-ground productivity, bryophytes rank second. Their total weighted average phytomass in the BGC is 4.08 t/ha, which is 25.84% of the total above-ground phytomass. The dominants are arcto-alpine hypoarctic hygrophilic and mesohygrophilic species, among which the leafy moss Aulacomnium palustre prevails (average DPC – 31%, occurrence – 100%, average above-ground phytomass – 1.01 t/ha). It is co-dominated by A. turgidum and Dicranum elongatum, and in some communities, patches of Sphagnum warnstorfii Russow appear. The average thickness of the moss cover in the BGC is 10–15 cm. Bryophytes are characterized by a significant DPC (from 40% to 60–70%) in almost all studied BGCs. This, combined with a significant stock of organic material, determines their tangible contribution to the long-term accumulation of mortmass, peat, and peaty coarse humus in the tundras. The weighted average carbon accumulated by bryophytes in the considered BGCs is 2.19 t/ha.
The third-largest contributor to productivity was dwarf birch (Betula nana), with a total weighted average above-ground phytomass of 3.15 t/ha (19.95% of the total above-ground phytomass). Its average DPC is higher than that of Salix pulchra at 34%, yet its above-ground phytomass is approximately half, which is mainly due to the low habitus (growth form) of this shrub. The overwhelming majority of its carbon stock is in the woody parts (88.08%), with 11.92% in the leaves. The weighted average carbon stock in the above-ground organs of B. nana in the considered BGCs was 1.60 t C/ha.
A significant contribution to the tundra phytomass was also established for Cyperaceae, among which Eriophorum vaginatum is of the greatest importance. In the surveyed tundra types, the occurrence of this species reached 100.00%. In dwarf shrub-sheathed cottongrass-green moss tussock tundras (Chok-3 and Chok-4), the above-ground phytomass increased to 1.44 t/ha, with a DPC ranging from 1.00% to 40.00% (Figure 2). The main mass of cottongrass is found in the dead part of the tussock, in the form of numerous dry leaves, their sheaths, and dead roots, which was accounted for in the mortmass and litter.
The weighted average annual production in our studied tundra BGCs (Figure 4) accounts for 16.33% of the above-ground phytomass. The ratio of above-ground phytomass to annual growth is 6.1:1.0, which indicates the slow growth rate and low productivity of tundra plants and lichens. In the structure of production, the main role is played by the green assimilating organs of flowering plants, which account for 85.30%. In the annual above-ground production, the significance of mosses and lichens, characterized by a slow growth rate, is small, at 14.70%. The total annual TOC production in the studied BGCs reaches 1.56 t C/ha.
In the structure of phytomass and OM production, one of the important indicators is the ratio of above-ground to below-ground organs. The results of our studies showed that the below-ground living phytomass (roots, rhizomes, underground shoots) in the studied types is 1.73 times greater than the above-ground mass (63.39% of the total living phytomass). We found that Betula nana and Salix pulchra accumulate the largest values of below-ground biomass in the lower parts of their shoots, which are embedded in the soil. The transition to prostrate, hemiprostrate morphotypes and to rhizomatous reproduction at the expense of seed reproduction is one of the most important adaptations of tundra shrubs and dwarf shrubs to extreme environmental conditions. The developed root system of northern plants allows for the temporary deposition of a significant amount of plastic substances in the roots, which are necessary for the formation of above-ground organs during periods when photosynthesis is limited by permafrost-related factors [21,48]. This characteristic of tundra plants significantly increases the below-ground phytomass values of the southern tundra communities and, consequently, their carbon storage: 4.39 t C/ha is accumulated in the underground shoots of Betula nana, and 2.83 t C/ha in those of Salix pulchra.
Figure 6 presents the final results of studies on TOC pools and stocks in the hypoarctic southern tundras of the Yana-Indigirka Lowland. The climate of the territory causes shallow soil thawing during the warm period, which inevitably affects the thickness of the seasonally thawed layer. This layer serves as the active zone for biochemical and physicochemical processes and is a key factor determining the generation of ecosystem organic carbon. In the litter and peat horizons of different tundra types, maximum TOC stocks were recorded. Total TOC stocks vary from 257.93 t C ha-1 in Chok-1 to 511.38 t C ha-1 in Chok-3 and Chok-4. The litter-peat horizon accounts for 234.27 and 449.48 t TOC/ha, respectively. In the 0-10 cm and 0-30 cm layers, from 6.07 to 29.47 t C ha-1 and from 17.60 to 49.76 t C ha-1 are accumulated, respectively. The fluctuating values for carbon pools and stocks are due to the initial TOC content in the litter-humus horizon and the soil cover, which are unevenly distributed across the tundra areas and along the soil horizons. In the southern tundra, anaerobic conditions increase the accumulation of TOC in the organo-accumulative layers. At the same time, the accumulated plant and organic material insulates the soil, limiting heat penetration into the mineral layer and reducing the thawing depth of the seasonally thawed layer.
The distribution of TOC stocks is noticeably pronounced in the litter, which is associated with the density of organic material, the degree of moss development and decomposition, the species composition of plants, and their respective TOC content. Moreover, the varying amount of stored carbon in the organo-accumulative horizons does not significantly affect the TOC stock of the mineral horizons. As a result, a minimal amount of carbon enters the mineral part of the soil to be stored in the deposits of the upper ice complex. The predominant part of the organic matter production is preserved on the surface in the form of a moss mat and a peat horizon. These layers are subject to destruction by abiotic environmental factors, but their rate of mineralization under natural conditions remains low. The formation and subsequent development of permafrost ensure the preservation of carbon-containing materials until the permafrost degrades. This degradation can occur both locally and globally as a result of cyclical climate changes. To identify the functioning of biological media in the geological formations of the cryolithozone, it is important to understand their relationship with the potential destabilization of the natural environment.
To understand the ecosystem functioning of the studied PSPs, we undertook a series of microbiological experiments to demonstrate the activity of the microbial community in releasing carbon dioxide from the active layer. This clearly shows their viability upon activation and with an increase in air temperature under laboratory conditions. This finding is applicable to the natural conditions of permafrost ecosystems, as it reveals the principles by which contained organic residues and their carbon serve as a substrate for microbiological activity. This activity causes CO2 emission from degraded permafrost. The destruction is accompanied not only by biological processes but also by the physical disruption of frozen deposits under the influence of thermokarst. Thus, the carbon that has accumulated over thousands of years and is locked in the permafrost turns into an ecosystem source of atmospheric gases, along with water vapor, which is formed during the thawing of ground ice. This process continues until the main part of the ice loses its volume.
Soils in cryogenic landscapes have a lower diversity of microorganisms compared to forest soils of southern and temperate latitudes, which is manifested in the composition and abundance of microscopic fungi [48]. At the same time, their role is invaluable in the decomposition of organic matter and soil formation in a sharply continental climate. Figure 7A shows a general characteristic of the microbial respiration of the ground and soil cover. The data reflect the stratification of the studied horizons: O – litter-humus, T – peat, and GC⊥ – gley. The background respiration (BR) throughout the biogeocenosis is at its maximum in the organic horizons, ranging from 8.3 to 19.7 µg CO2-C/g soil/hour. This is associated with the activity of microorganisms in conditions of seasonal thawing and heat penetration into the surface layers of the phytomass. Moving down to the mineral soil layer, the intensity of BR reaches a minimum threshold in the range of 0.3 to 0.9 µg CO2-C/g soil/hour. This indicates very weak microbial activity due to excessive moisture, low temperatures, and a lack of biogenic elements for microbial processing. Based on the obtained data series, it was not possible to distinguish a specific tundra type by the BR parameter from the entire biogeocenosis. Firstly, the organic horizons are excessively saturated with carbon but are not supplied with sufficient nitrogen. Secondly, due to the lack of nitrogen, the decomposition of plant residues is slowed, and the background microbial respiration does not differ significantly between the tundra types.
A more informative indicator of the biological activity of the biogeocenosis was the microbial biomass carbon (Figure 7B). From the general data series, the shrub-lichen-green moss tundra (Chok-2 and Chok-5) stands out. It is capable of mineralizing and transforming a sufficient amount of carbon into the ecosystem, averaging 29,212.12 µg C/g of soil, versus 8,294.88 µg C/g of soil in the shrub-sphagnum-green moss tundra (Chok-1) and 12,979.10 µg C/g of soil in the lichen-green moss tundra with Eriophorum vaginatum (Chok-3 and Chok-4). The microbial metabolic quotient (qCO2) of the southern tundra ranged from 0.14–0.21 (GC⊥ horizon), to 0.44–0.97 (T horizon), and up to 0.73–1.69 (O horizon) (Figure 7C). The qCO2 values of the lower soil horizons of the studied tundra types hardly differed. In the mineral soil layer, low utilization of organic material by microorganisms is observed, as it is inherently poor in available food sources. High values of the microbial quotient were found in the Chok-1 tundra (0.19–1.69). This indicates that microorganisms are inefficiently consuming and utilizing the organic matter of the ecosystem. It is known that the higher the values of this indicator, the less favorable the conditions in the ecosystem. In contrast, heterotrophic microorganisms in the Chok-2 and Chok-5 tundras demonstrate significant activity in the biogeochemical cycle of carbon,
Figure 7.
Microbiological activity (A – basal respiration, B – microbial biomass carbon, C – metabolic quotient) of the soil-plant cover in various types of southern shrub tundra of the Yana-Indigirka Lowland, Northeastern Siberia.
Figure 7.
Microbiological activity (A – basal respiration, B – microbial biomass carbon, C – metabolic quotient) of the soil-plant cover in various types of southern shrub tundra of the Yana-Indigirka Lowland, Northeastern Siberia.
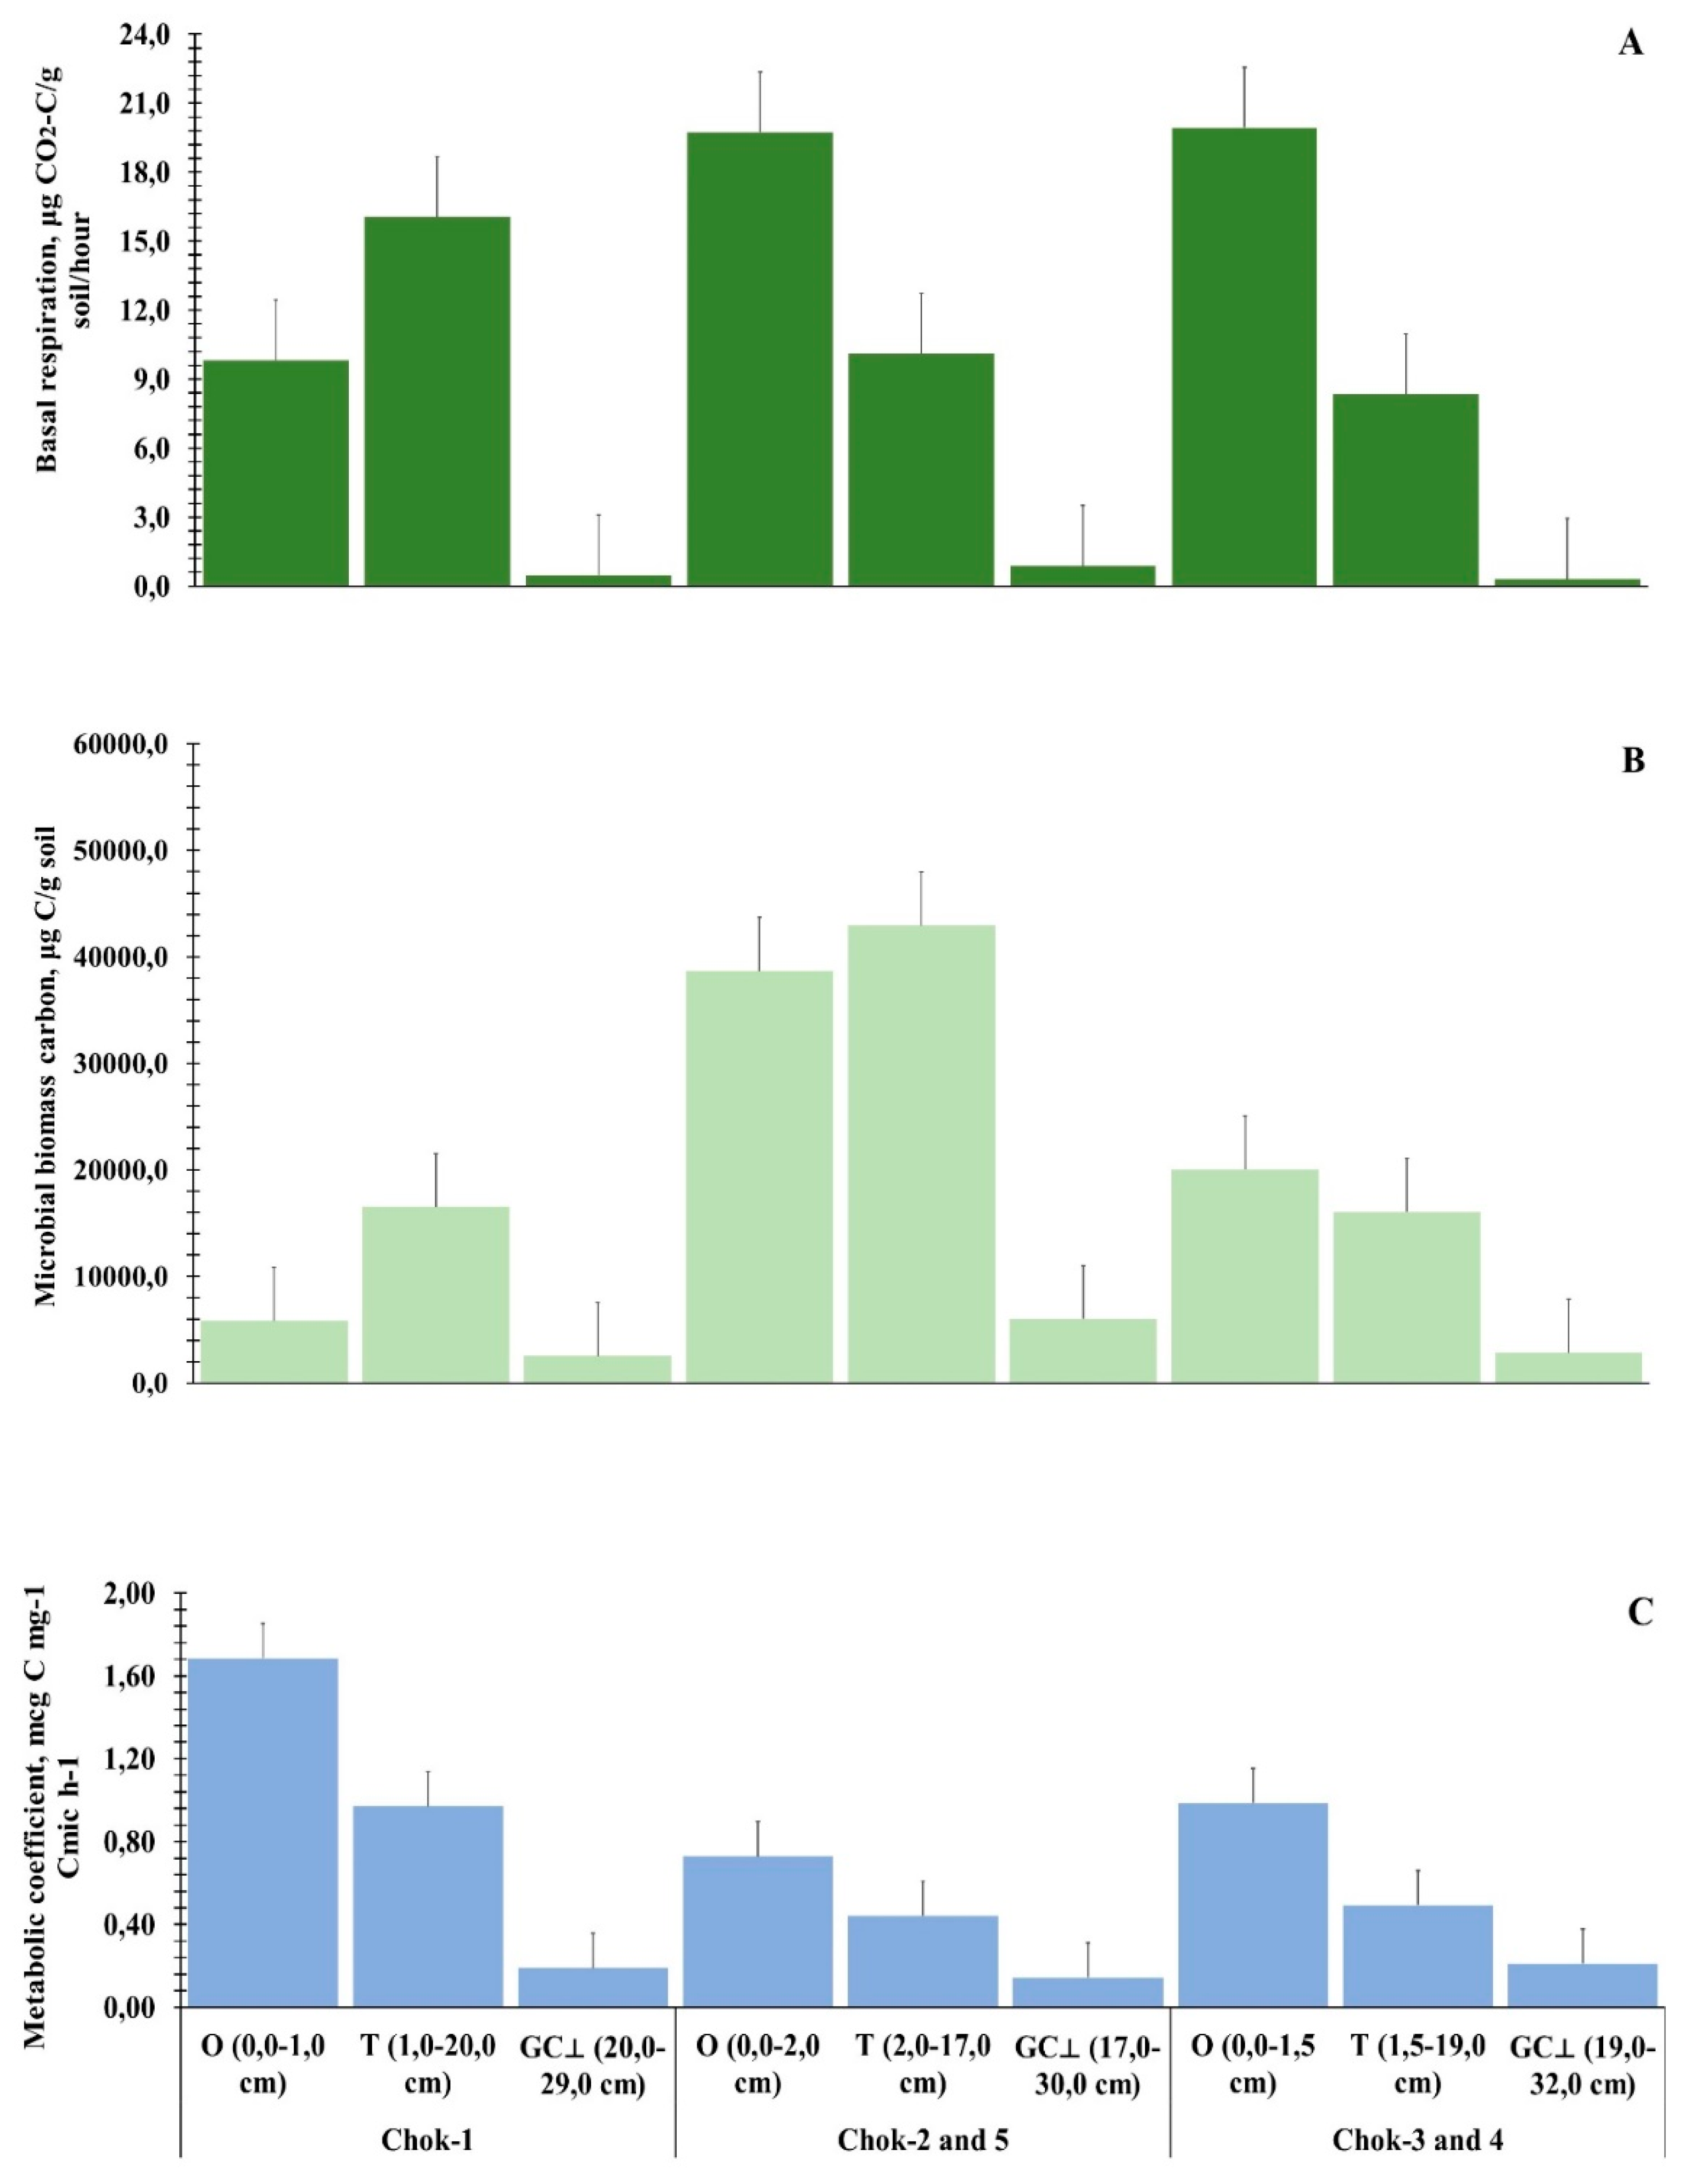
able to fully assimilate the incoming organic material (qCO2 – 0.14–0.73). Thus, the microorganisms of the Yana-Indigirka Lowland BGC have the natural potential to transform organic matter, perform physiological functions, and effectively use it to maintain the stable functioning of the permafrost ecosystem. However, this effect could be enhanced with an increase in air and soil temperature.
The microbiological studies conducted in the southern hypoarctic shrub tundra of the Yana-Indigirka Lowland—a key Arctic region and a global carbon reservoir since the late Pleistocene—show that even in low-temperature conditions, microorganisms retain their metabolic potential and exhibit significant activity with increasing temperature, as confirmed by microbiological indicators. The degradation of permafrost caused by climate change leads to the release of previously stabilized carbon in the form of CO2 and CH4, which increases the concentration of these active atmospheric gases. A high spike in emissions is associated with the upper soil horizons and permafrost deposits, where a sufficiently large amount of TOC is stored, despite the low initial concentration. Microbiological activity under optimal conditions demonstrates deep processing of this organic matter. The obtained data confirm the need for systematic monitoring of microbiological processes in permafrost ecosystems, especially for forecasting and studying the long-term dynamics of the carbon cycle under permafrost thawing conditions, as well as for developing methods to minimize climate risks.
4. Discussion
Climate change affects ecosystem productivity by altering environmental variables and, ultimately, the physiological functioning of plants [49]. Satellite imagery indicates an increase in the average Normalized Difference Vegetation Index (NDVI), which reflects the degree of “greening” of a territory [10,50]. For the period from 1982 to 2008, it was found that in some high-latitude areas of the Canadian Arctic, northern Alaska, and Eurasia, the growth of maximum NDVI values reached 15% [51]. In the 2010s, an increase in NDVI values of 15% and 30% was detected in the subarctic and near-subarctic territories of Russia, respectively [52]. An increase in phytomass stocks and production was noted for the south of eastern Taimyr and the interfluve of the Anabar and Olenyok rivers [53,54]. The authors argued that this process occurs due to an increase in the stocks of the green portion of above-ground phytomass (grasses, leaves of shrubs and dwarf shrubs) and an expansion of the areas of more productive phytocenoses, such as grass, sedge, and cottongrass communities (meadowing) and willow thickets (shrub encroachment). Using a regression model between NDVI and above-ground phytomass [53], they found that from 1982 to 2010, vegetation biomass in the southern subzone of Eastern Siberia (D-E) increased by 23.4%. In the Yana-Kolyma floristic province, the authors established an increase in phytomass of 81.60 g/m2, at a rate of 2.92 g/m2/year.
For the southern hypoarctic shrub tundras of the Yana-Indigirka Lowland, a body of information has accumulated regarding the shift and lengthening of the growing season, the expansion of shrub and graminoid plants into the tundra, the degradation of ice complex landscapes, and the resulting fluctuations in carbon emission and uptake [55,56]. An analysis of long-term average data from the Chokurdakh meteorological station [57] revealed that some climatic parameters in the Yana-Indigirka Lowland indeed show a shifting trend. The calculation of average monthly temperatures for July from 1975 to 2015 showed an increase of 2.04°C. In the 1960s–80s, more precipitation fell in the summer months, but since 2000, it has been concentrated in the autumn-winter months. The long-term average maximum height of the snow cover increased by 42.9 cm from 1975 to 2024 [58]. In connection with these ongoing changes, it is necessary to consider the life strategy and current state of the main edifying, dominant shrubs of the southern tundras: Salix pulchra and Betula nana.
In the floodplain of the Beryolyokh River (a left tributary of the Indigirka River) and on the southern coastal cliffs—where the temperature and wind regimes are milder due to the warming influence of the river and sun exposure, and where snow accumulates—Salix pulchra forms large bushes up to 2.0 m high with branched axial stems 5.0–6.0 cm in diameter and leaf blades up to 5.0–5.5 cm long (in a dry state). Based on its habitus and morphological structure, it can be identified as a floodplain ecotype formed under intrazonal floodplain conditions. Nearby, on the low alas plain where our research was conducted, the height of the willows is approximately 3.0–7.0 times lower (30–70 cm), which corresponds to the upper limits of the snow cover in these ecotopes. Their leaf blades are also 1.3–2.7 times smaller (2–4 cm). These represent a suppressed tundra ecotype adapted to survival on open, low-snow plains. The annual tops of their shoots are desiccated by winter winds, polished by snow corrasion, and broken off by frost, which limits the growth and branching of the bushes.
The influence of snow cover on shrub development is demonstrated by experiments [59] in the Alaskan Arctic tundra, where the buildup of snowdrifts caused an increase in the area of shrub cover and crown height. In addition, the results of a study [60] on the annual rings of Salix pulchra indicate that this willow responds positively to early summer temperatures. Thus, a small amount of winter precipitation, wind, snow corrasion, low air temperatures, and cold soils with a thin active layer greatly reduce the growth and development potential of this dominant tundra willow. Its phytomass is several times lower than what might be possible under more favorable conditions. Based on this, it can be expected that an increase in the heat supply during the growing season, combined with an increase in winter precipitation, may have a positive effect on the productivity of the willow. This would, in turn, enhance their edifying, cooling, and permafrost-stabilizing significance. The above-ground shoots of this shrub live for up to 40–60 years, according to various estimates, and the underground parts live even longer. Thus, by virtue of its mass and the long-term storage of TOC in its woody shoots, this dominant species is also one of the main sequesters of organic carbon in the southern tundras of the Yana-Indigirka Lowland.
The strategy of Betula nana in the tundras we studied is more patient. It prefers to shelter in the shade of willows and use various depressions and microrelief indentations to avoid unfavorable environmental conditions. It is prone to minimizing its habitus, thereby conserving plastic substances and energy. Nevertheless, thanks to its 100% occurrence rate in the surveyed BGCs, high DPC in communities, and active development of underground shoots, this species of birch also accumulates a significant mass and appears to be an important carbon preservative. The construction of annual ring width series (1974–2018) for Betula nana stems showed a positive relationship between the radial growth of this shrub and summer temperature [60,61]. In the lower reaches of the Kolyma River (Kolyma Lowland), it was also found that the maximum stock in Betula nana accumulates in conditions of a moderately warm summer [62]. In studies at the “Chokurdakh” tundra research station [63], it was shown that the positive reaction of B. nana to changes in summer air temperature may be indirectly related to an improvement in the availability of nutrients in the soil.
It has been established [64] that an increase in air temperatures boosts the above-ground productivity of tundra ecosystems, while the below-ground part does not show a similar reaction. In warmer conditions, the distribution of phytomass shifts toward the above-ground part. This may affect the carbon cycle in ecosystems due to changes in the input and distribution of litter in the soil, as well as possible changes in root systems. In our studies, the overwhelming part of the below-ground phytomass (56.85%) was composed of the lower, rooting parts of Salix pulchra and Betula nana shoots that were embedded in the soil. Their total average mass exceeded the phytomass of the roots by 1.4 times.
An analysis of 20 years of Net Ecosystem Exchange (NEE) data at the “Chokurdakh” tundra research station showed a trend towards an increase in the annual carbon sink in the southern tundra; the approximation of eddy covariance data indicated a positive trend of increasing carbon uptake. The authors explain the ongoing changes in the carbon balance by the expansion of shrub community areas due to climate warming. They also noted an increase in the duration of the growing season by 2 weeks, which is a serious factor for ecosystems and carbon exchange. R.E. Petrov et al. [55,56]. A number of authors suggest that the expansion of the range of deciduous shrubs in the Arctic region may reduce permafrost thawing and, thus, partially compensate for its further degradation [7,8,55,61,65]. In experiments [7,63,65,66], the removal of the B. nana canopy initiated the thawing of ice-rich permafrost, which led to the collapse of elevated areas covered with shrubs and their transformation into waterlogged, concentric depressions within 6 years [66]. It turned out that even a small-scale disturbance of the shrub cover leads to thermokarst processes, as a result of which waterlogged areas with an increasing presence of graminoids (Arctagrostis latifolia (R. Br.) Griseb., Carex sp., Eriophorum angustifolium Honck.) became a source of methane.
Based on the results of the described experiments, it can be assumed with a high probability that the restoration of Salix pulchra and Betula nana thickets in these waterlogged areas will be practically impossible. With ground collapses and the development of water bodies and bogs, they will reduce their areas and find refuge in various elevated ecotopes. Salix pulchra is a hygro-mesophile, while Betula nana has more mesophilic properties. Although these two species might adapt to some waterlogging by entering a pessimal state, neither can withstand prolonged immersion in water. This is evidenced by the mass death of Salix pulchra after large-scale floods in the valley of the middle and lower reaches of the Alazeya River (Kolyma Lowland) in the first decade of the 2000s, which occurred due to climate change [67]. It is also supported by the established [61] high mortality of Betula nana after a wet summer, as a result of waterlogging and thermokarst at the “Chokurdakh” tundra research station. Thus, with large-scale violations of the integrity of the shrub canopy and/or with a further increase in climate warming, an expansion of water bodies and grass-sedge and cottongrass bogs could lead to a carbon imbalance and an increase in greenhouse gas (GHG) emissions in the southern tundra subzone.
The role of bryophytes in creating the carbon pool in the ecosystems of the southern tundra subzone is significant. It is believed that mosses began to play an important role in the tundra vegetation cover after the late Pleistocene [68], and the peat deposits they have formed since then play a significant role in the GHG balance. In the lower ground layer of tundra communities, these spore-bearing organisms perform the most important phytocenotic, thermoregulatory, and permafrost-protective functions. The results of studies [61] conducted at the “Chokurdakh” tundra research station showed that mosses can have a noticeable effect on the water, heat, and energy flows in tundra ecosystems, and that changes in the moss cover can cause permafrost thawing and, in general, affect the carbon balance in tundra soils [69]. Our studies have confirmed that bryophytes in southern shrub tundras act as the most important dominants of the lower tiers. They form a dense cover, reaching high values of projective cover and phytomass (up to 60–70%), and perform edifying functions, regulating not only the hydrothermal regime of soils but also the seed and vegetative renewal of many plant species. In the green part of the phytomass in the considered BGCs, they are dominant, exceeding the contribution of flowering plants. However, they contribute significantly less to the magnitude of annual growth due to the slow growth inherent in these organisms. The longevity, density of the moss turf, slow decomposition, and large biomass determine their significant importance in the long-term conservation of carbon in the tundra zone.
Tussock-forming, dense-sod graminoids, especially Eriophorum vaginatum, also make a large contribution to the mortmass and litter of the studied tundras due to their inherent property of accumulating a large number of dead shoots. Considering that the formed tussocks can exist for up to 100 years or more [68], they are also one of the significant sequesters of carbon in the southern subzone of the tundras in northeastern Siberia.
We have established that the woody parts of shrubs and dwarf shrubs have the maximum C/N values (Figure 3). For the leaves of flowering plants, the values of this indicator are determined by the lifespan of the photosynthetic apparatus (i.e., evergreenness vs. deciduousness). High ratios are found in the leaves of evergreen shrubs, dwarf shrubs, and in lichen thalli. The leaves of deciduous shrubs and the vegetative shoots of graminoids are characterized by lower, more optimal values, which means that the litter from their leaves will be humified more quickly. Higher C/N parameters in the leaves of evergreen plants, coupled with their characteristic dense cuticle, slow down their decomposition, increase soil acidity, and reduce nitrogen mineralization.
The productivity and phytomass structure, as well as the mortmass values of the studied shrub-dwarf shrub-green moss tundras of the Yana-Indigirka Lowland, generally correlate with figures reported in the 1990s for the southern tundras of the European and Asian parts of Russia. According to data from those years, in the subarctic tundras, the total average phytomass stocks ranged from 10 to 40 t/ha, mortmass from 20–60 t/ha, and annual production from 2–4 t/ha [70,71,72]. Our results do not fall outside these ranges. The total above-ground production we established is close to that of the subarctic typical spotted tundras on slopes and watershed tops, and to the small-hummocky shrub-dwarf shrub-moss and dwarf shrub-shrub-moss-lichen southern subarctic tundras of Russia. In terms of annual production, our southern tussock tundras are close to the hummocky shrub-dwarf shrub-moss and dwarf shrub-herb-moss-lichen southern tundras of other regions of the country. The phytomass structure is also characterized by similar parameters [71].
Calculations showed that the average TOC content in the phytomass of the vegetation cover on the territory of the “Chokurdakh” tundra research station is 0.70±0.10 kg C/m2 [72]. This is slightly higher than the 0.5 kg C/m2 that was calculated [53] for the circumarctic bioclimatic subzone E [73], where the station is located. In our studies, the average TOC content in the above-ground phytomass of the studied BGCs was 0.78 kg C/m2, and in the total living phytomass, it was 1.99 kg C/m2.
In the southern hypoarctic shrub tundras, the litter and peat pool is the main repository of TOC. This persists despite changes in the temperature background of ecosystems and thermokarst processes, and is also due to the low intensity of plant residue destruction resulting from the scarcity of TN content in plant organs. A number of authors believe [74] that litter can decompose faster under dominant species, and that the limiting factor for mineralization is not nitrogen, but phosphorus content. The TOC stocks in the mineral horizon of the soil (the upper layer of the yedoma ice complex) depend on the specifics of the region where the soil cover is formed. Considering that thermokarst has been dynamically developing in the Yana-Indigirka Lowland for thousands of years—resulting in the physical movement of organic material into the cracks between syngenetic ice wedges and its subsequent conservation—this warrants further research on the study of deep-seated TOC. Undoubtedly, thermokarst and the stocks of organic matter in the soil affect the release of carbon-containing gases from the permafrost. To reduce the intensity of permafrost degradation, an increase in plant biomass and, consequently, a greater accumulation of peat is required [75]. We note that the yedoma ice complex of the Yana-Indigirka Lowland from the late Neopleistocene began to form in MIS 4 and is correlated with the upper part of the Allaikhovskaya suite [76].
Our study area, based on the microbiological results obtained, is consistent with a number of other works [77]. For example, for the eastern part of the Russian Arctic, the proportion of microbial biomass carbon is high, which mainly depends on humidity and biogenic elements, rather than on ground temperature. On the one hand, the TN content in all tundras has a unidirectional, slightly distinguishable low character and a wave-like curve of high TOC content. This explains the high C/N ratio, which limits the decomposition of organic matter and the growth of microorganisms. On the other hand, the shrub-green moss (Chok-2 and Chok-5) and shrub-lichen-green moss (Chok-3 and 4) tundras are characterized by high basal respiration activity—that is, a large release of carbon dioxide—and a lower metabolic quotient compared to Chok-1. This coefficient indicates the state of microbial communities in the ecosystem. With its increase, prerequisites are created for a negative impact of ongoing climatic processes on Chok-1. The larger this coefficient, the stronger the negative impact of anthropogenic or natural factors on permafrost landscapes.
In model experiments conducted at the “Chokurdakh” tundra research station [78], it was shown that soil warming contributes to an increase in the above-ground biomass of sedges but does not affect other types of plant communities. The application of mineral fertilizers (NPK) accelerates the growth of the above-ground biomass of dwarf shrubs, and grasses are responsive, showing an increase in both above-ground and below-ground phytomass. The authors conclude that the reaction of the plant communities of the southern tundra to climate change is determined by the depth of thawing and the presence of nutrients in the soil, as well as the accumulation of organic matter in the surface soil layers.
Soils in temperate latitudes with a narrow C/N ratio release more greenhouse gases due to more optimal hydrothermal conditions and active mineralization processes compared to cold regions. Microorganisms inhabiting permafrost deposits have weak kinetic energy and limited access to nitrogen and carbon [79,80]. This is due to the greater preservation of plant residues, which is a limiting feature in the cycle of elements between the soil and the atmosphere. The composition and density of the vegetation cover determine the input of TOC and TN into the soil. In the shrub tundra, plant litter is present in the form of a dense “cushion” of varying degrees of decomposition, with underlying horizons of felt and peat. This acts as a kind of buffer that prevents heat from penetrating deep into the deposits, which in turn slows down the activity of the microbiota and does not contribute to the formation of a sufficient amount of nitrogen. Thus, if the TN content is low for plant productivity, it also limits the metabolism of microorganisms. In the studies of the authors [81], methanogenesis decreases with depth due to the appearance of a mineral horizon, which is less saturated with TOC, and a change in pH, which is not possible in anaerobic conditions. Conversely, with an increase in permafrost thawing in Siberia, a greater release of greenhouse gases from tundra soils is expected. According to [23], data obtained at the “Chokurdakh” tundra research station show that methane fluxes are not sensitive to soil temperature but depend on hydrological conditions. Carbon sequestration [82] in the southern tundra of the Yana-Indigirka Lowland does not increase with the length of the growing season, and the influence of increased summer temperatures does not lead to a decrease in carbon exchange between the ecosystem and the atmosphere.
Microorganisms living in permafrost are vulnerable to climate change and can affect the ecosystem in different ways. Firstly, they must be adapted to obtaining energy from an available substrate. Secondly, the thawing of permafrost will lead to a shift in biogeochemical processes, which will have serious consequences for the metabolic potential of microorganisms. Thirdly, the permafrost microbiota reflects the local climate, vegetation, and soil properties at the time of its formation. Therefore, understanding these factors is important for predicting changes in the transformation of TOC and TN in the context of climate change [83,84,85].
The geomorphology of the landscape and the geochemical characteristics of the soil, which affect the metabolic capacity of microorganisms, are of undeniable importance, since the composition of the microbial community at the local level is associated with landscape elements [86,87]. In our studies, this fact was not taken into account, as the permanent sample plots are located on a low accumulative plain and are represented by a uniform soil cover of Gleysols..
5. Conclusions
We conducted a field assessment of primary biological production, carbon productivity of plant communities, soils, and heterotrophic respiration of permafrost landscapes in the southern hypoarctic shrub-tussock tundras of northeastern Siberia.
The most important form-shaping factors affecting the phytomass of shrubs are air and soil temperatures, the thickness of the active layer, drainage, and the height of the snow cover. In general, the plants of the southern tundra exhibit a patient life strategy, are adapted to life in initially poor habitats with constant abiotic stress, and are characterized by a low growth rate, low productivity, maximum carbon concentration, and minimum nitrogen concentration.
We established that the most significant producers accumulating the largest phytomass, both above-ground and below-ground, are deciduous shrubs, bryophytes, and graminoids. The beautiful willow (Salix pulchra) develops the largest weighted average phytomass, accounting for slightly less than half of the total phytomass of the studied tundra BGCs. Bryophytes rank second in terms of above-ground productivity in the studied tundra types, with the leafy moss Aulacomnium palustre showing the highest values. The third-largest contributor to phytomass accumulation is the shrub Betula nana. Among graminoids, Eriophorum vaginatum accumulates the largest phytomass and mortmass. In the green, assimilating part of the phytomass of the surveyed BGCs, bryophytes predominate, while in terms of annual growth, flowering plants prevail. In the structure of the above-ground phytomass, the contribution of the woody organs of shrubs is high. More than half of the below-ground phytomass is formed by the rooting shoots of the shrubs Salix pulchra and Betula nana, which are embedded in the soil. The mortmass stocks are 1.8 times higher than the above-ground phytomass and 10.8 times higher than the annual production, which indicates a significant slowdown in the microbiological decomposition of plant residues and a low growth rate for the plants.
We established that the woody parts of shrubs and dwarf shrubs, evergreen leaves, and lichen thalli have the maximum C/N values. Optimal C/N values were found in the vegetative shoots of graminoids and the summer-green leaves of shrubs and dwarf shrubs.
The taxonomic composition, the life forms of dominants and subdominants, their habitus, abundance, and the rates of bio-decomposition of residues are the key parameters that determine the quantitative indicators of carbon accumulation and sequestration in the vegetation cover. Among the southern tundra plants, the main carbon keepers are Salix pulchra, Betula nana, and bryophytes.
It is predicted that in the event of large-scale thermokarst processes with increasing climate warming, the dominant deciduous shrubs will be forced to reduce their areas. With a high probability, destabilizing processes will cause the expansion of hygrophilic and hydrophilic graminoids (Carex, Eriophorum, Poaceae) on disturbed ecotopes. An increase in the proportion of grass-sedge and cottongrass bogs, alongside a reduction in the area of shrub tundras, could lead to an increase in GHG emissions in the southern tundras.
In the Yana-Indigirka Lowland, cryogenic processes are developing near and on adjacent areas with our permanent sample plots. These are associated with the high ice content of the permafrost rocks of the ice complex and yedoma uplands and are manifested as polygonal frost cracking of soils, accompanied by the growth of syngenetic ice wedges. Other characteristic processes include the regular sliding of the soil-vegetation layer on ridge slopes during the summer, the widespread distribution of thermokarst, the degradation of permafrost rocks, and the destruction of the Beryolyokh River coastline under the influence of thermo-abrasion of unconsolidated soils. This complex of ongoing cryogenic and exogenous processes inevitably affects the soil system and the biogeochemical cycle of carbon and nitrogen in the southern tundra.
The TOC pool of the above-ground phytomass is an order of magnitude higher than the stocks in the below-ground mineral part of the soil. In the studied tundra ecosystems of the Yana-Indigirka Lowland, the above-ground phytomass is dominant in the formation of TOC pools and stocks; on average, this value for the biogeocenosis is 346.25 t C ha-1, compared to 20.81 t C ha-1 in the mineral layer of 0–10 cm. The permafrost conditions and geomorphological features of the Yana-Indigirka Lowland tundras contribute to the accumulation of organic matter on the soil surface in the form of a living cover of mosses and a moss mat. At the same time, there is no significant migration of carbon into the accumulative forms of the landscape or the mineral horizons of the soil. On the sample plots, conditions are created for the local formation of carbon stocks, regardless of their facies affiliation.
For the first time for the landscapes of the Yana-Indigirka Lowland, we have shown heterotrophic activity with a division into phytomass and soil. We have established that the intensity of basal respiration and microbial biomass carbon in the litter and peat is determined by the amount of accumulated carbon. In contrast, in the mineral horizon, where the TOC content is minimal, microbiological processes are at a low level. According to the indicators of microbial biomass carbon and the metabolic quotient, the shrub-dwarf shrub-green moss tussock tundra (Chok-2 and Chok-5) stands out, indicating more favorable conditions in the ecosystem compared to other tundra types (Chok-1, Chok-3, and Chok-4).
Author Contributions
Conceptualization, A.P.E. and A.G.S.; methodology, A.G.S. and A.P.E.; software, A.P.E. and A.G.S.; validation, A.G.S, A.P.E. and T.Kh.M.; formal analysis, A.P.E. and A.G.S.; investigation, A.G.S and A.P.E.; data curation, A.G.S, A.P.E. and T.Kh.M.; writing – original draft preparation, A.P.E. and A.G.S.; writing – review and editing, A.G.S, A.P.E. and T.Kh.M.; visualization, A.P.E. and A.G.S.; supervision, A.G.S, A.P.E. and T.Kh.M.; project administration, T.Kh.M.; funding acquisition, T.Kh.M. All authors have read and agreed to the published version of the manuscript.
Funding
1. This work was carried out as part of the state project “Development of a system for ground-based and remote monitoring of carbon pools and greenhouse gas fluxes on the territory of the Russian Federation, ensuring the creation of a data accounting system for fluxes of climatically active substances and the carbon budget in forests and other terrestrial ecological systems” (reg. No. 123030300031-6). 2. The research was carried out within the framework of basic projects: “Cryogenic processes and formation of natural risks of development of permafrost landscapes of Eastern Siberia” (reg. No. 122011400152-7), “Investigation of biogeochemical cycles and adaptive reactions of plants of boreal and arctic ecosystems of northeastern Russia” (reg. No. АААА-А21-121012190034-2), and the state assignment of the Ministry of Science and Higher Education of the Russian Federation “Vegetation cover of the cryolithozone of taiga Yakutia: biodiversity, environment-forming functions, protection and rational use” (reg. No. 121012190038-0), using the equipment of the Core Facility of the FRC “YSC SB RAS” (grant No. 13.ЦКП.21.0016)
Data Availability Statement
The data sources and their references have been included in the manuscript.
Acknowledgments
The authors express their deep gratitude to Ph.D. R. Petrov and S. Karsanaev for the logistical organization of the field research. Sincere gratitude to graduate student M. Grigoriev and researcher A. Slepsov for their invaluable help in carrying out the field and laboratory work. We thank the staff of the V.V. Dokuchaev Soil Science Institute (Moscow) and the V.N. Sukachev Institute of Forest, SB RAS (Krasnoyarsk) for their professional and high-quality analyses.
Conflicts of Interest
The authors declare no conflicts of interest.
References
- National report “Global climate and soil cover of Russia: Arctic zone, permafrost soils - the future of Russia (agriculture and forestry)”. Eds.; Edelgeriev, R.S.-Kh.; Ivanov, A.L.; Dokuchaev Soil Science Institute: Moscow, Russia, 2024; Vol. 4, 672 p. (In Russian).
- The Third Assessment Report on Climate Change and its Consequences in the Russian Federation. General Summary; Science-intensive Technologies: St. Petersburg, Russia, 2022; 124p. (In Russian).
- Walker, M.D.; Wahren, C.H.; Hollister, R.D.; Henry, G.H.R.; Ahlquist, L.E.; Alatalo, J.M.; Bret-Harte, M.S.; Calef, M.P.; Callaghan, T.V.; Carroll, A.B. et al. Plant community responses to experimental warming across the tundra biome. Proceedings of the National Academy of Sciences 2006, 103, 1342–1346. [CrossRef]
- Tape, K.; Sturm; M., Racine, C. The evidence for shrub expansion in northern Alaska and the pan-Arctic. Global Change Biology 2006, 12, 686–702. [CrossRef]
- Bret-Harte, M.S.; Mack, M.C.; Goldsmith, G.R.; Sloan, D.B.; DeMarco, J.; Shaver, G.R.; Ray, P.M.; Biesinger, Z; Chapin, F.S. III. Plant functional types do not predict biomass responses to removal and fertilization in Alaskan tussock tundra. Journal of Ecology 2008, 96, 713–726. [CrossRef]
- Forbes, B.C.; Fauria, M.M.; Zetterberg, P. Russian Arctic warming and ‘greening’ are closely tracked by tundra shrub willows. Global Change Biology 2010, 16, 1542–1554. [CrossRef]
- Blok, D.; Schaepman-Strub, G.; Bartholomeus, H.; Heijmans, M.M.P.D.; Maximov, T.C.; Berendse, F. The response of Arctic vegetation to the summer climate: relation between shrub cover, NDVI, surface albedo and temperature. Environ. Res. Lett. 2011b, 6, 035502. [CrossRef]
- Blok D.; Sass-Klaassen, U.; Schaepman-Strub, G.; Heijmans, M.M.P.D.; Sauren, P.; Berendse, F. What are the main climate drivers for shrub growth in Northeastern Siberian tundra? Biogeosciences 2011a, 8, 1169–1179. [CrossRef]
- Myers-Smith, I.H.; Forbes, B.C.; Wilmking, M.; Hallinger, M.; Lantz, T.; Blok, D.; Tape K.D.; Macias-Fauria M.; Sass-Klaassen U.; Levesque E. et al. Shrub expansion in tundra ecosystems: Dynamics, impacts and research priorities. Environ. Res. Lett. 2011, 6(4), 045509. [CrossRef]
- Tishkov, A.A.; Belonovskaya, E.A.; Vaisfeld, M.A.; Glazov, P.M.; Krenke, A.N.; Tertitsky, G.M. “The greening” of the tundra as a driver of the modern dynamics of arctic biota. Arctic: ecology and economy 2018, 2 (30), 31–44. (In Russian) . [CrossRef]
- Wang J., Wilson R.S., Aristilde L. Electrostatic coupling and water bridging in adsorption hierarchy of biomolecules at water–clay interfaces. Proc. Natl. Acad. Sci. 2024, 121(7), e2316569121. [CrossRef]
- Zubrzycki, S.; Kutzbach, L.; Grosse, G.; Desyatkin, A.; Pfeiffer, E.-M. Organic carbon and total nitrogen stocks in soils of the Lena River Delta. Biogeosciences 2013, 10(6), 3507–3524. [CrossRef]
- Zubrzycki, S.; Kutzbach, L.; Pfeiffer, E.-M. Permafrost-affected soils and their carbon pools with a focus on the Russian Arctic. Solid Earth 2014, 5(2), 595–609. [CrossRef]
- Schuur, E.A.G.; Abbott, B.W.; Commane, R.; Ernakovich, J.; Euskirchen, E.; Hugelius, G.; Grosse, G.; Jones, M.; Koven, C.; Leshyk, V.; et al. Permafrost and Climate Change: Carbon Cycle Feedbacks From the Warming Arctic. Annu. Rev. Environ. Resour. 2022, 47, 343–71. [CrossRef]
- Chestnykh, O.V.; Grabovskiy, V.I.; Zamolodchikov, D.G. Estimate of the Soil Carbon Stock of Forested Regions in Russia Using Databases of Soil Properties. Contemp. Probl. Ecol. 2022, 15, 731–740. [CrossRef]
- Fountain, A.G.; Campbell, J.L.; Schuur, E.A.G.; Stammerjohn, S.E.; Williams, M.W.; Ducklow, H.W. The disappearing cryosphere: impacts and ecosystem responses to rapid cryosphere loss. Biosciences 2012, 62(4), 405–415. [CrossRef]
- Bjorkman, A.D.; Myers-Smith, I.H.; Elmendorf, S.C.; Normand, S.; Rüger, N.; Beck, P.S.A.; Blach-Overgaard, A.; Blok, D.; Cornelissen, J.H.C.; Forbes, B.C.; et al. Plant functional trait change across a warming tundra biome. Nature 2018, 562, 57–62. [CrossRef]
- Gentsch, N.; Mikutta, R.; Shibistova, O.; Wild, B.; Schnecker, J.; Richter, A.; Urich, T.; Gittel, A.; Šantrůčková, H.; Bárta, J.; et al. Properties and bioavailability of particulate and mineral-associated organic matter in Arctic permafrost soils, Lower Kolyma Region, Russia. Eur. J. Soil Sci. 2015, 66, 722–734. [CrossRef]
- Sun, T.; Ocko, I.B.; Hamburg, S.P. The value of early methane mitigation in preserving Arctic summer sea ice. Environ. Res. Lett. 2022, 17(4), 044001. [CrossRef]
- Hugelius, G.; Bockheim, J.G.; Camill, P.; Elberling, B.; Grosse, G.; Harden, J.W.; Johnson, K.; Jorgenson, T.; Koven, C.D.; Kuhry, P.; et al. A new data set for estimating organic carbon storage to 3 m depth in soils of the northern circumpolar permafrost region. ESSD 2013, 5(2), 393–402. [CrossRef]
- van der Molen, M.K.; van Huissteden, J.; Parmentier, F.J.W.; Petrescu, A.M.R.; Dolman, A.J.; Maximov, T.C.; Kononov, A.V.; Karsanaev, S.V.; Suzdalov, D.A. The growing season greenhouse gas balance of a continental tundra site in the Indigirka lowlands, NE Siberia. Biogeosciences 2007, 4(6), 985–1003. [CrossRef]
- Hugelius, G.; Strauss, J.; Zubrzycki, S.; Schuur, E.A.G.; Ping, C.-L.; Schirrmeister, L.; Grosse, G.; Michaelson, G.J.; Koven, C.D.; O’Donnell, J.A.; et al. Estimated stocks of circumpolar permafrost carbon with quantified uncertainty ranges and identified data gaps. Biogeosciences 2014, 11(23), 6573–6593. [CrossRef]
- Karelin, D.V.; Zamolodchikov, D.G.; Gil’manov, T.G. Carbon stocks and production in the phytomass of tundra and forest-tundra ecosystems of Russia. Russian Journal of Forest Science 1995, 5, 29–36. (In Russian).
- Strauss. J.; Schirrmeister, L.; Mangelsdorf, K.; Eichhorn, L.; Wetterich, S.; Herzschuh, U. Organic-matter quality of deep permafrost carbon – a study from Arctic Siberia. Biogeosciences 2015, 12(7), 2227–2245. [CrossRef]
- Walter Anthony, K.M.; Zimov, S.A.; Grosse, G.; Jones, M.C.; Anthony, P.M.; Chapin III, F.S.; Finlay, J.C.; Mack, M.C.; Davydov, S.; Frenzel, P.; et al. A shift of thermokarst lakes from carbon sources to sinks during the Holocene epoch. Nature 2014, 511, 452–456. [CrossRef]
- Harden, J.W.; Koven, C.D.; Ping, C.-L.; Hugelius, G.; McGuire, A.D.; Camill, P.; Jorgenson, T.; Kuhry, P.; Michaelson, G.J.; O’Donnell, J.A.; et al. Field information links permafrost carbon to physical vulnerabilities of thawing. Geophys. Res. Lett. 2012, 39(15), L15704. [CrossRef]
- Ogureeva, G.N.; Leonova, N.B.; Miklyaeva, I.M.; Bocharnikov, M.V.; Fedosov, V.E.; Muchnik, E.E.; Urbanavičius, G.P.; Emelyanova, L.G.; Khlyap, L.A.; Rumyantsev, V.Yu. et al. Biodiversity of Russian biomes. Plain biomes. Ogureeva, G.N., Ed.; IGKE: Moscow, Russia, 2020; 623p. (In Russian).
- Atlas of Agriculture of the Yakut ASSR. Main Directorate of Geodesy and Cartography: Moscow, Russia, 1989; 115p. (In Russian).
- Bazilevich, N.I.; Titlyanova, A.A.; Smirnov, V.V.; Rodin, L.E.; Nechaeva, N.T.; Levin, F.I. Methods of studying biological circulation in various natural zones. Mysl: Moscow, Russia, 1978; 185p. (In Russian).
- Scurlock, J.M.O.; Johnson, K.; Olson, R.J. Estimating net primary productivity from grassland biomass dynamics measurements. Global Change Biology 2002, 8, 736–753. [CrossRef]
- Schmidt, I.K.; Ostonen, I.; Blume-Werry, G. Belowground plant biomass. In: Halbritter A.H. (ed.) The handbook for standardised field and laboratory measurements in terrestrial climate change experiments and observational studies (ClimEx). 2020, 63–76. [CrossRef]
- Reinsch, S.; Linstädter, A.; Beil, I.; Berauer, B.; Kröel-Dulay, G.; Stuart-Haëntjens; E., Schmidt, I.K. Aboveground plant biomass. In The handbook for standardized field and laboratory measurements in terrestrial climate-change experiments and observational studies (ClimEx). Halbritter, A.H., Ed. 2020; 46–63. [CrossRef]
- Perfilyeva, V.I.; Teterina, L.V.; Karpov, N.S. The vegetation cover of Yakutia zonal tundras. YSC SD RAS: Yakutsk, Russia, 1991; 192. (In Russian).
- ISO. 2020. Soil quality – Determination of particle size distribution in mineral soil material – Method by sieving and sedimentation. ISO 11277:2020. Vernier, Geneva: Switzerland.
- Ananyeva, N.D.; Susyan, E.A.; Gavrilenko, E.G. Determination of the soil microbial biomass carbon using the method of substrate-induced respiration. Eurasian Soil Science 2011, 44(11), 1215–1221. [CrossRef]
- Anderson, J.P.; Domsch, K.H. A physiological method for the quantitative measurement of microbial biomass in soils. Soil biology and biochemistry 1978, 10(3), 215–221.
- ISO. 2002. Soil quality – laboratory methods for determination of micro-bial soil respiration. International Organization for Standardization. ISO 16072. 2002. Geneva: Switzerland.
- Geocryology of USSR. Eastern Siberia and Far East; Ershov, E.D., Ed.; Nedra: Moscow, Russia, 1989; 515p. (In Russian).
- Dubikov, G.I.; Baulin, V.V. History of development of permafrost of the Eurasia. Nauka: Moscow, Russia, 1981; 197p. (In Russian).
- Gvozdetsky, N.A.; Mikhailov, N.I. Physical Geography of the USSR (Asian Part). Geografgiz: Moscow, Russia, 1963; 572p. (In Russian).
- Fedorov, A.N. Permafrost landscapes of Yakutia: identification methods and mapping issues. Permafrost Institute: Yakutsk, 1991; 140p. (In Russian).
- Fedorov, A.N.; Vasilyev, N.F.; Torgovkin, Y.I.; Shestakova, A.A.; Varlamov, S.P.; Zheleznyak, M.N.; Shepelev, V.V.; Konstantinov, P.Y.; Kalinicheva, S.V.; Basharin, N.I.; et al. Permafrost-landscape map of the Republic of Sakha (Yakutia) at scale 1:1,500,000. Geosciences 2018, 8, 465. [CrossRef]
- IUSS Working Group WRB. World Reference Base for Soil Resources. International soil classification system for naming soils and creating legends for soil maps. 4th edition. International Union of Soil Sciences. 2022, Vienna, Austria.
- Map of soil-ecological zoning of the Russian Federation. Scale 1: 8,000,000. Explanatory text and map legend. Urusevskaya, I.S., Ed.; MAKS Press: Moscow, Russia, 2020; 100p. (In Russian).
- Karavaeva, N.A. Tundra soils of Northern Yakutia; Nauka: Moscow, Russia, 1969; 205p. (In Russian).
- Conspectus of the flora of Yakutia: vascular plants. Kuznetsova L.V.; Zakharova V.I. Nauka: Novosibirsk, Russia, 2012, 272p. (In Russian).
- van der Molen, M.K.; van Huissteden, J.; Parmentier, F.J.W.; Petrescu, A.M.R.; Dolman, A.J.; Maximov, T.C.; Kononov, A.V.; Karsanaev, S.V.; Suzdalov, D.A. The seasonal cycle of the greenhouse gas balance of a continental tundra site in the Indigirka lowlands, NE Siberia. Biogeosciences Discuss. 2007, 4, 2329–2384. [CrossRef]
- Grodnitskaya, I.D.; Sorokin, N.D.; Evgrafova, S.Yu.; Antonov, G.I.; Syrtsov, S.N.; Alexandrov, D.E.; Trusova, M.Yu.; Koroban, N.V. Microbial Transformation of Carbon CH4 and CO2 in Permafrost-Affected Soils in Tundra and Forest Ecosystems in Siberia. Russian Journal of Forest Science 2017, 2, 111–127. (In Russian). [CrossRef]
- Becklin, K. M.; Anderson, J. T.; Gerhart, L. M.; Wadgymar, S. M.; Wessinger, C. A.; & Ward, J. K. Examining plant physiological responses to climate change through an evolutionary lens. Plant Physiology 2016, 172(2), 635–649. [CrossRef]
- Belonovskaya, E.A.; Tishkov, A.A.; Vaisfeld, M.A.; Glazov, P.M.; Krenke, A.N.; Morozova, O.V.; Pokrovskaya, I.V.; Tsarevskaya, N.G.; Tertitskii, G.M. “Greening” of the Russian Arctic and the Modern Trends of Transformation of Its Biota. Izvestiya Rossiiskoi Akademii Nauk. Seriya Geograficheskaya. 2016, 3, 28–39. (In Russian) . [CrossRef]
- Walker D.A.; Epstein H.E.; Raynolds M.K.; Kuss P.; Kopecky M.A.; Frost G.V.; Daniels F.J.A.; Leibman M.O.; Moskalenko N.G.; Matyshak G.V. et al. Environment, vegetation and greenness (NDVI) along the North America and Eurasia Arctic transects. Environ. Res. Lett. 2012, 7, 1–17. [CrossRef]
- Lavrinenko, I.A.; Lavrinenko, O.V. The impact of climate change on the plant cover of the Barents Sea islands. Proc. of the Karelian Research Center of the RAS 2013, 6, 5–16. (In Russian).
- Epstein, H. E.; Raynolds, M.K.; Walker, D.A.; Bhatt U.S.; Tucker C.J.; Pinzon J.E. Dynamics of aboveground phytomass of the circumpolar Arctic tundra during the past three decades, Environ. Res. Lett. 2012, 7(1), 015506. [CrossRef]
- Bhatt, U.S.; Walker, D.A.; Raynolds, M.K.; Bieniek, P.A.; Epstein, H.E.; Comiso, J.C.; Pinzon, J.E.; Tucker, C.J.; Polyakov, I.V. Recent declines in warming and arctic vegetation greening trends over pan-Arctic tundra. Remote Sens (Special NDVI3g Issue), 2013, 5, 4229–4254. [CrossRef]
- Petrov, R.E.; Maximov, T.C.; Karsanaev, S.V. Studies of interannual and seasonal variability of balance of carbon and permafrost rock mass in typical tundra ecosystem in Northeast of Russia. Arctic and Subarctic Natural Resources 2018, 23(4), 89–96. (In Russian) . [CrossRef]
- Petrov, R.E.; Karsanaev, S.V.; Grigoriev, M.R.; Maximov, T.C. Dynamics of CO2 fluxes in northeastern Russia: contribution to understanding the carbon cycle in the Arctic. The Arctic is a territory of strategic scientific research. In Proceedings of the II Arctic Congress. Yakutsk, Russia, September 20-22, 2024, 314–317. (In Russian).
- Koroleva, T.M.; Gogoleva, P.A.; Petrovsky, V.V.; Zverev, A.A.; Troeva, E.I. Monitoring of local flora in the vicinity of the village of Chokurdakh (north-east of Yakutia). Botanical Journal, 2019, 104, 9, 1386–1420 (In Russian) . [CrossRef]
- Information portal «Weather and Climate». Available online: http://www.pogodaiklimat.ru/climate/21946.htm (accessed on 11 May 2025).
- Wahren, C-H.A.; Walker, M.D.; Bret-Harte, M.S. Vegetation responses in Alaskan arctic tundra after 8 years of a summer warming and winter snow manipulation experiment. Global Change Biology 2005, 11, 537–552. [CrossRef]
- Blok, D.; Heijmans, M.M.P.D.; Schaepman-Strub, G.; Kononov, A.V.; Maximov, T. C.; Berendse, F.. Shrub expansion may reduce summer permafrost thaw in Siberian tundra. Global Change Biology 2010, 16(4), 1296–1305. [CrossRef]
- Magnússon, R.Í.; Sass-Klaassen, U.; Limpens, J.; Karsanaev, S.V.; Ras, S.; van Huissteden, K.; Blok, D.; Heijmans, M.M.P.D.. Spatiotemporal variability in precipitation-growth association of Betula nana in the Siberian lowland tundra. Journal of Ecology 2023, 111, 1882–1904. [CrossRef]
- Andreev, V.N.; Galaktionova, T.F.; Govorov, P.M.; Zakharova, V.I.; Neustroeva, A.I.; Savinov, D.D.; Torgovkina, E.E. Seasonal and year-to-year dynamics of phytomass in subarctic tundra [Sezonnaya i pogodovaya dinamika fitomassy v subarkticheskoy tundre]. Nauka: Novosibirsk, Russia, 1978; 191p. (In Russian).
- Li, B.; Heijmans, M.M.P.D.; Blok, D.; Wang, P.; Karsanaev, S.V.; Maximov, T. C.; van Huissteden, J.; Berendse, F. Thaw pond development and initial vegetation succession in experimental plots at a Siberian lowland tundra site. Plant and Soil 2017, 420(1-2), 147–162. [CrossRef]
- Wang, P., Heijmans, M.M.P.D.; Mommer, L.; Van Ruijven, J.; Berendse, F.; Maximov, T.C. Belowground plant biomass allocation in tundra ecosystems and its relationship with temperature . Environmental Research Letters 2016, 11(5), 055003. [CrossRef]
- Petrov, R.E.; Karsanaev, S.V.; Maximov, T.C. The stabilizing role of the shrub layer of the tundra biogeocenoses of the north-east of Russia. Problems of regional ecology 2022, 1, 89–95. (In Russian) . [CrossRef]
- Nauta, A.L.; Heijmans, M.M.; Blok, D.; Limpens, J.; Elberling, B.; Gallagher, A.; Li, B.; Petrov, R.E.; Maximov, T.C.; Van Huissteden, J. Permafrost collapse after shrub removal shifts tundra ecosystem to a methane source. Nature Climate Change 2015, 5, 67–70. [CrossRef]
- Cryoecosystems of the Alazeya River Basin. Eds. Isaev, A.P.; Klimovsky, I.V.; Geo: Novosibirsk, Russia, 2018; 211p. (In Russian).
- Andreev, V.I. Tundra studies. Nauka: Novosibirsk, Russia, 2017; 312p. (In Russian).
- Beringer, J.; Lynch A.H.; Chapin, F.S. III; Mack, M.; Bonan, G.B. The representation of arctic soils in the Land Surface Model: the importance of mosses. Journal of Climate 2001, 14, 3324. [CrossRef]
- Siewert, M.B.; Hanisch J.; Weiss. N.; Kuhry. P.; Maximov. T.C.; Hugelius. G. Comparing carbon storage of Siberian tundra and taiga permafrost ecosystems at very high spatial resolution, Geophys. Res. Lett.: Biogeosciences 2015, 120, 1973–1994. [CrossRef]
- Walker, D.A.; Raynolds, M.K.; Daniëls, F.J.A.; Einarsson, E.; Elvebakk, A.; Gould, W.A.; Katenin, A.E.; Kholod, S.S.; Markon, C.J.; Melnikov, E. et al., The circumpolar Arctic vegetation map, J. Veg. Sci. 2005, 16(3), 267–282. [CrossRef]
- Bazilevich, N.I. Biological productivity of ecosystems of Northern Eurasia. Nauka: Moscow, Russia, 1993; 293p. (In Russian).
- Bazilevich, N.I.; Tishkov, A.A. Live and dead reserves and primary production in polar desert, tundra and forest tundra of the former Soviet Union. Ecosystems of the world 3. Polar and alpine tundra. Editor F.E. Wielgolaski; Elsevier publ.: Amsterdam; Lausanne; New York; Oxford; Shannon; Singapore; Tokyo, 1997, pp. 509–539.
- Wang, P.; van Ruijven, J.; Heijmans, M.M.P.D.; Berendse, F.; Maksimov, A.; Maximov, T.C.; Mommer, L. Short-term root and leaf decomposition of two dominant plant species in a Siberian tundra. Pedobiologia 2017, 65, 68–76. [CrossRef]
- van Huissteden, J.; Teshebaeva, K.; Cheung, Y.; Magnússon, R.Í.; Noorbergen, H.; Karsanaev, S.V.; Maximov, T.C.; Dolman, A.J. Geomorphology and InSAR-Tracked Surface Displacements in an Ice-Rich Yedoma Landscape. Front. Earth Sci. 2021, 9, 680565. [CrossRef]
- Tumskoy, V.E.; Tarasov, A.I. New stage of study of Quaternary deposits of the lower reach of the Indigirka river (2022-2024). Relief and Quaternary deposits of the Arctic, Subarctic and North-West Russia 2024, 11, 375–384. (In Russian). [CrossRef]
- Serna-Chavez, H.M.; Fierer, N.; van Bodegom, P.M. Global drivers and patterns of microbial abundance in soil. Global Ecol. Biogeogr. 2013, 22, 1162–1172. [CrossRef]
- Wang, P.; Limpens, J.; Mommer, L.; van Ruijven, J.; Nauta, A.L.; Berendse, F.; Schaepman-Strub, G.; Blok, D.; Maximov, T.C.; Heijmans, M.M.P.D. Above- and below-ground responses of four tundra plant functional types to deep soil heating and surface soil fertilization. Journal of Ecology 2017, 105, 947–957. [CrossRef]
- Blaud, A.; Lerch, T.Z.; Phoenix, G.K.; Osborn, A.M. Arctic soil microbial diversity in a changing world. Research in Microbiology 2015, 166(10), 796–813. [CrossRef]
- Gray, N.D.; McCann, C.M.; Christgen, B.; Ahammad, S.Z.; Roberts, J.A., Graham, D.W. Soil geochemistry confines microbial abundances across an arctic landscape; implications for net carbon exchange with the atmosphere. Biogeochemistry 2014, 120, 307–317. [CrossRef]
- Grodnitskaya, I.D.; Trusova, M.Y.; Syrtsov, S.N.; Koroban, N.V. Structure of microbial communities of peat soils in two bogs in Siberian tundra and forest zones. Microbiology 2018, 87(1), 89–102. [CrossRef]
- Parmentier, F.J.W.; van der Molen, M.K.; van Huissteden, J.; Karsanaev, S.A.; Kononov, A.V.; Suzdalov, D.A.; Maximov, T.C.; Dolman, A.J. Longer growing seasons do not increase net carbon uptake in the northeastern Siberian tundra. J. Geophys. Res. 2011, 116. G04013. [CrossRef]
- Waldrop, M.P.; Chabot, C.L.; Liebner, S.; Holm, S.; Snyder, M.W.; Dillon, M.; Dudgeon, S.R.; Douglas, T.A.; Leewis, M.-C.; Walter Anthony, K.M.; et al. Permafrost microbial communities and functional genes are structured by latitudinal and soil geochemical gradients. The ISME Journal 2023, 17, 1224–1235. [CrossRef]
- Marsh, G.; Chernikhova, D.; Thiele, S.; Altshuler, I. Microbial dynamics in rapidly transforming Arctic proglacial landscapes. PLOS Clim. 2024, 3(6), e0000337. [CrossRef]
- Danilova, A.A. Microbial landscapes of permafrost soils in degraded pasture exclusion. Problems of regional ecology 2018, 6, 118–121. (In Russian). [CrossRef]
- Taş, N.; Prestat, E.; Wang, S.; Wu, Y.; Ulrich, C.; Kneafsey, T.; Tringe, S.G.; Torn, M.S.; Hubbard, S.S.; Jansson, J.K. Landscape topography structures the soil microbiome in arctic polygonal tundra. Nature Communications 2018, 9, 777. [CrossRef]
- Bobrik, A.A.; Goncharova, O.Y.; Matyshak, G.V.; Tarkhov, M.O.; Petrzhik, N.M.; Drozdov, D.S.; Ponomareva, O.E. Spatial Distribution of Soil Carbon Cycle Components and Environmental Factors in Southern Tundra Ecosystems of the Taz Peninsula. Earth’s Cryosphere 2018, 22(6), 41–48. [CrossRef]
Figure 1.
Map showing the layout of permanent sample plots and sampling points at the “Chokurdakh” tundra research station within the “Kytalyk” National Park, located in the Yana-Indigirka Lowland.
Figure 1.
Map showing the layout of permanent sample plots and sampling points at the “Chokurdakh” tundra research station within the “Kytalyk” National Park, located in the Yana-Indigirka Lowland.
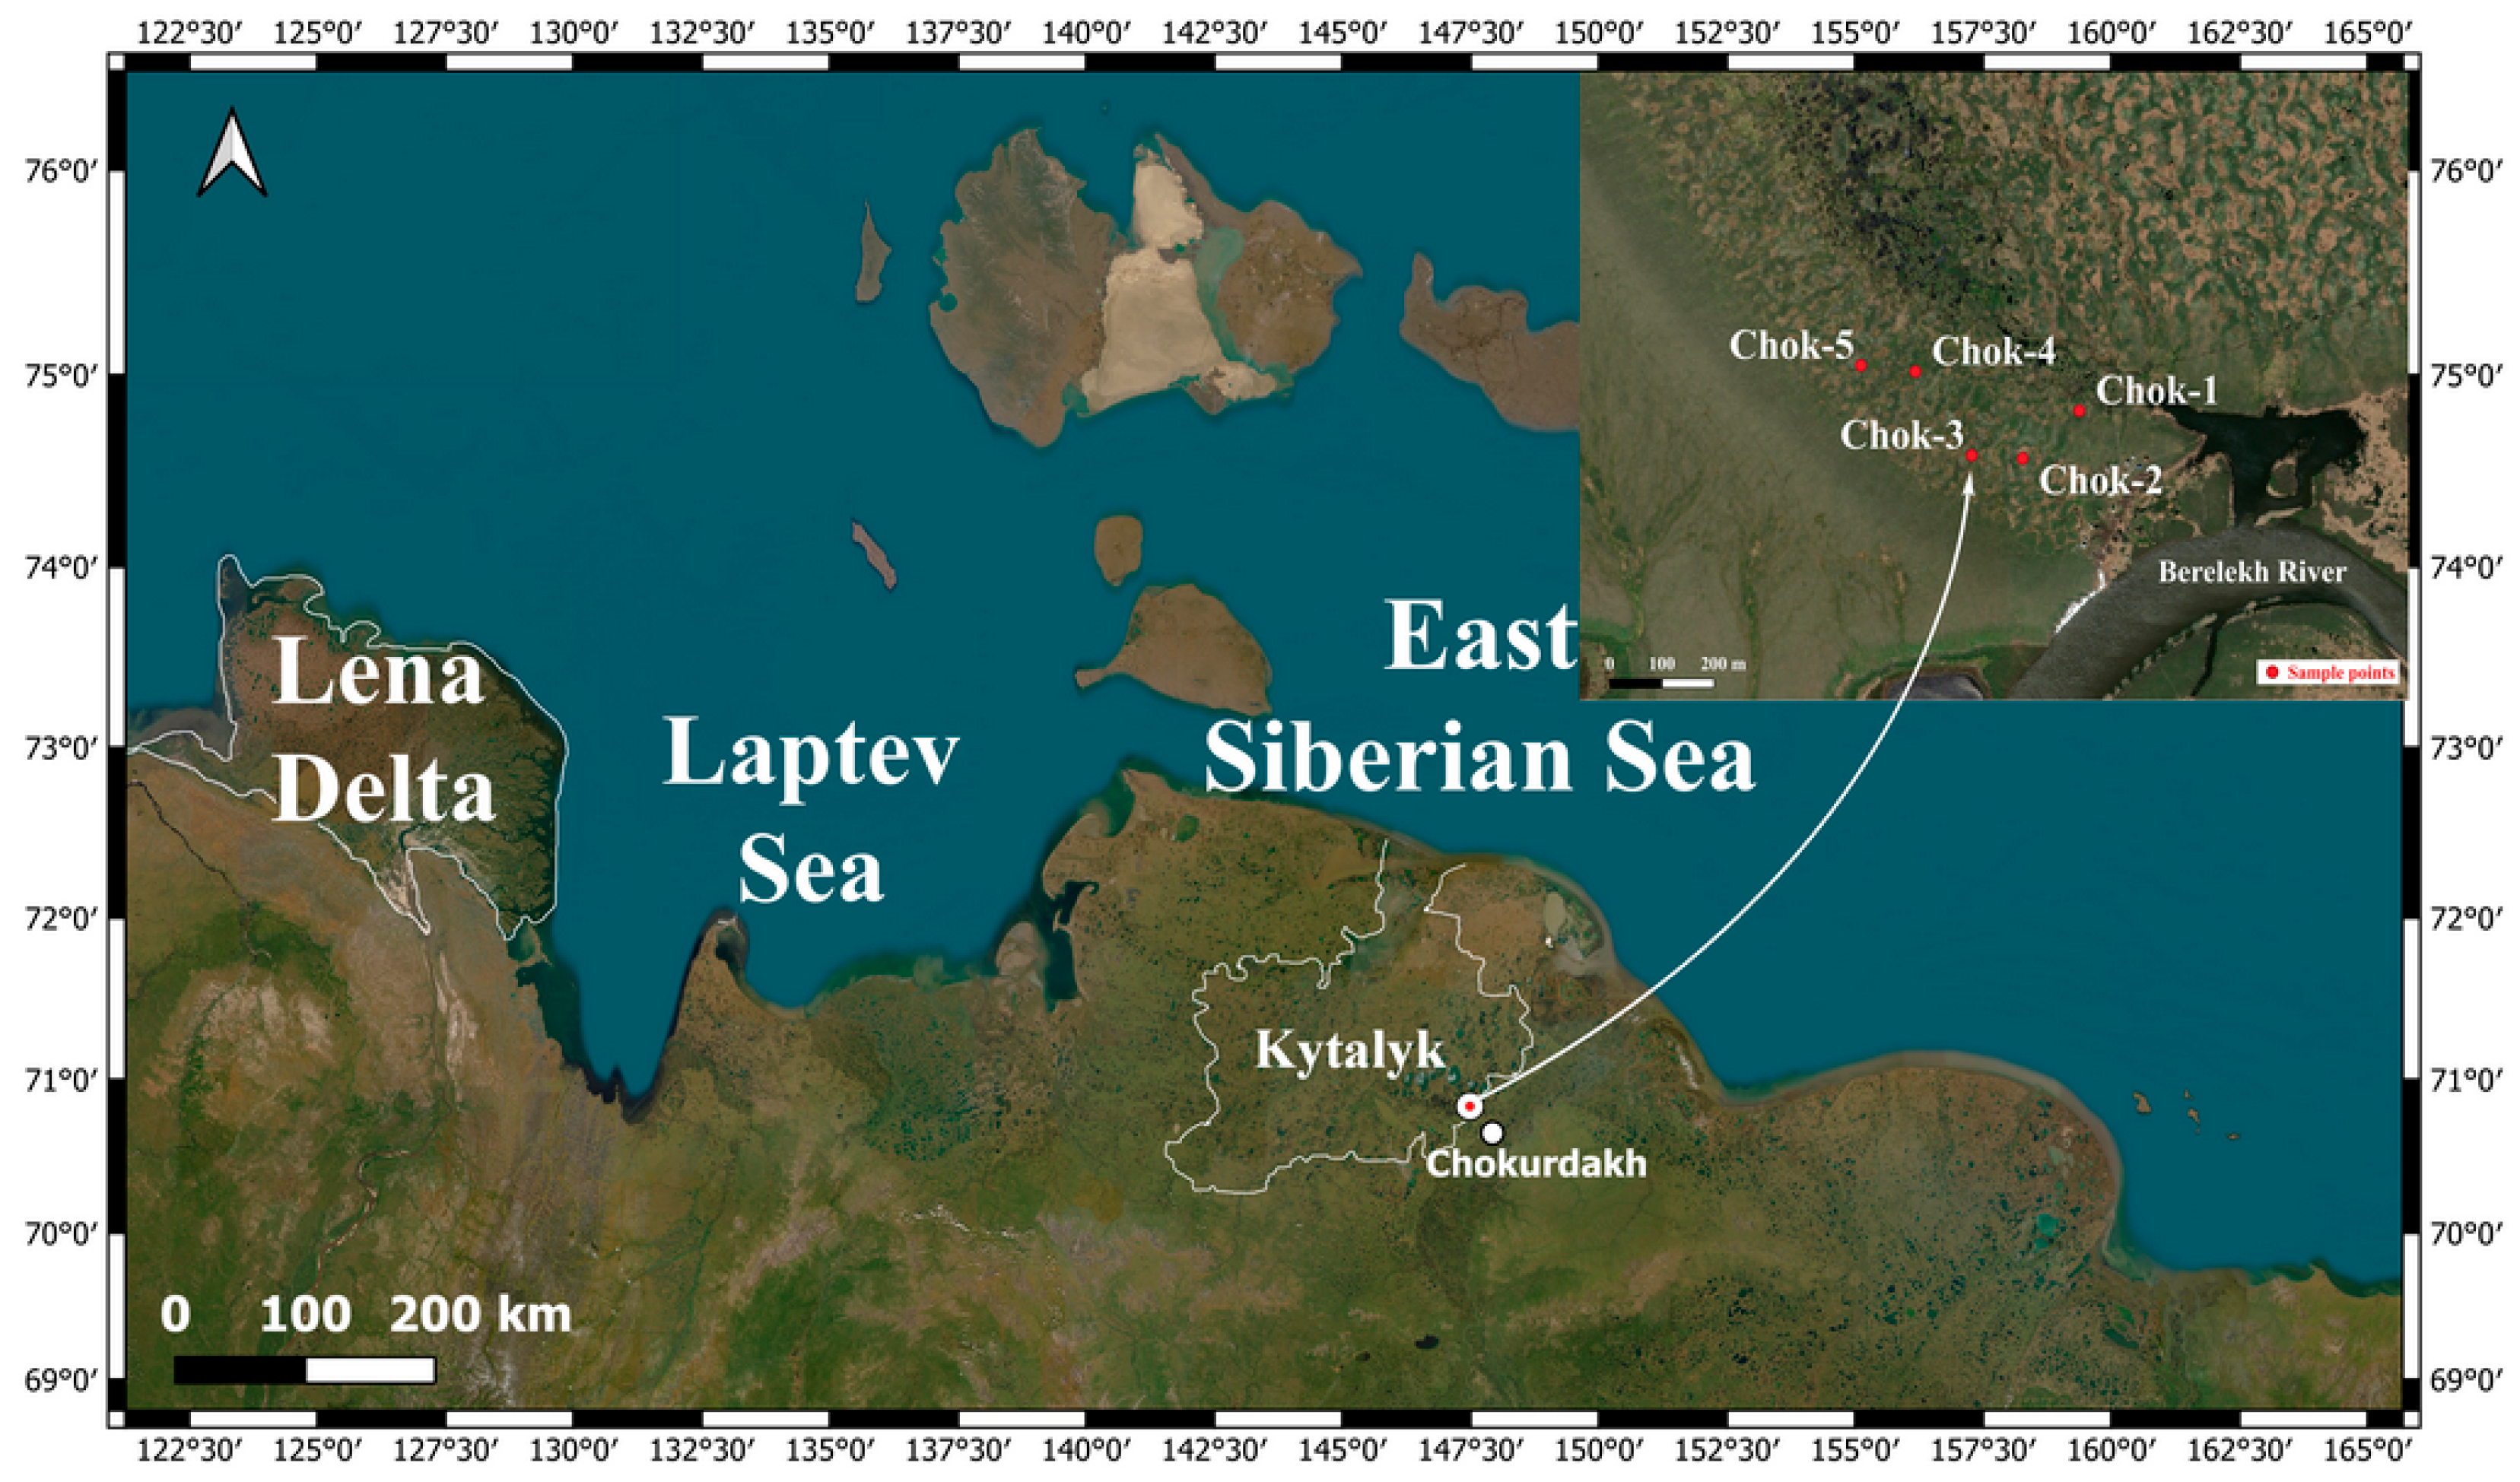
Figure 2.
Typical cryogenic processes occurring in the hypoarctic southern shrub tundra of the Yana-Indigirka Lowland, shaping the modern appearance of the landscape.
Figure 2.
Typical cryogenic processes occurring in the hypoarctic southern shrub tundra of the Yana-Indigirka Lowland, shaping the modern appearance of the landscape.
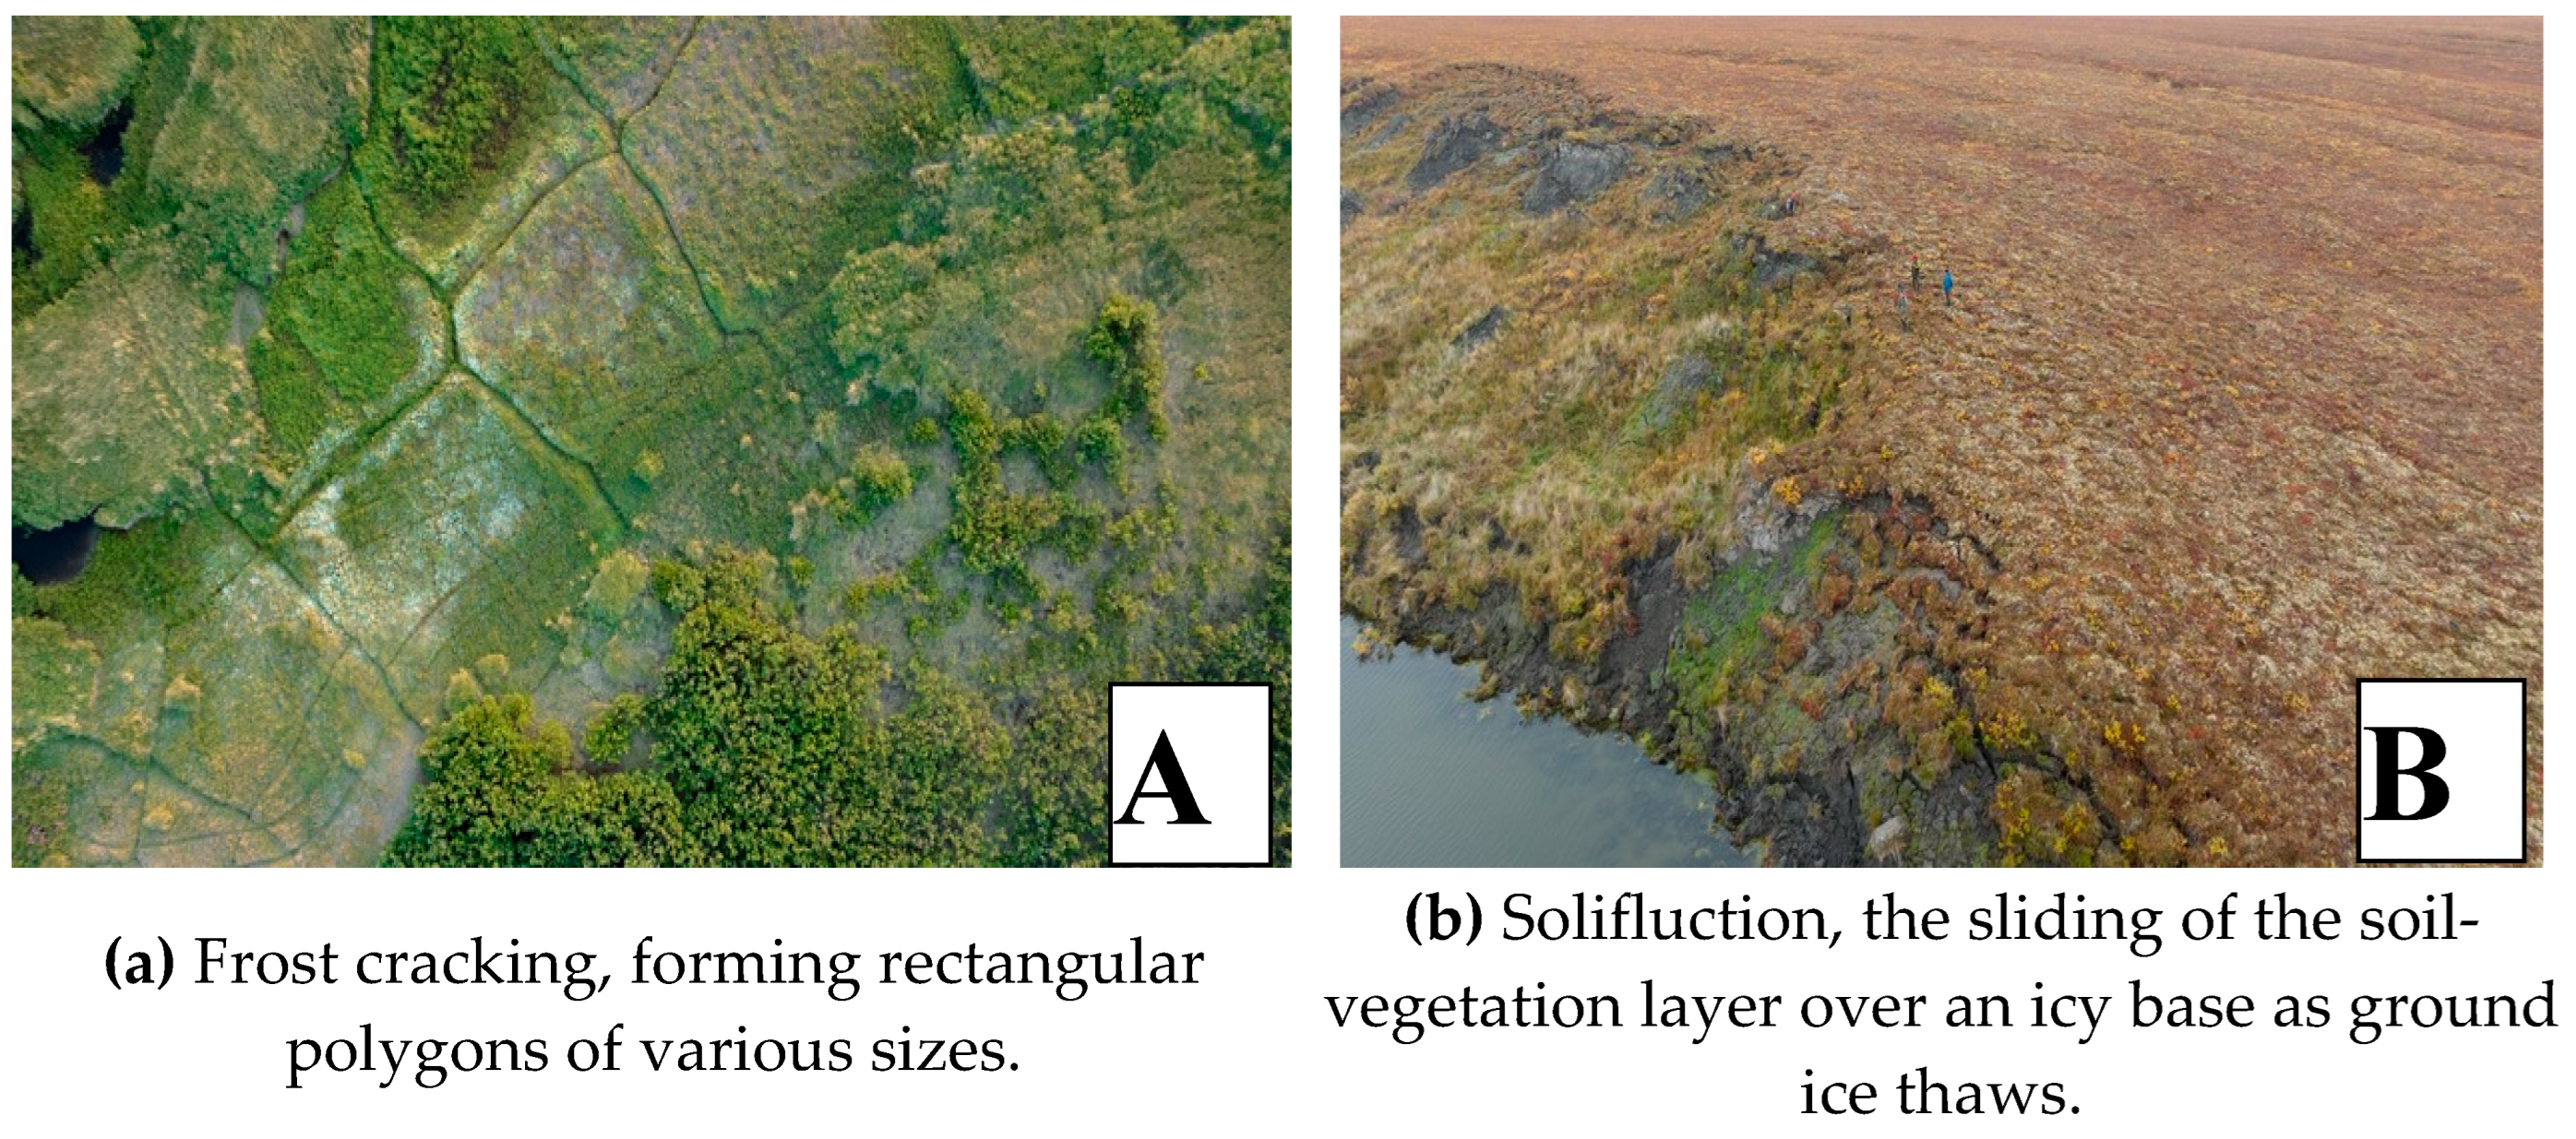
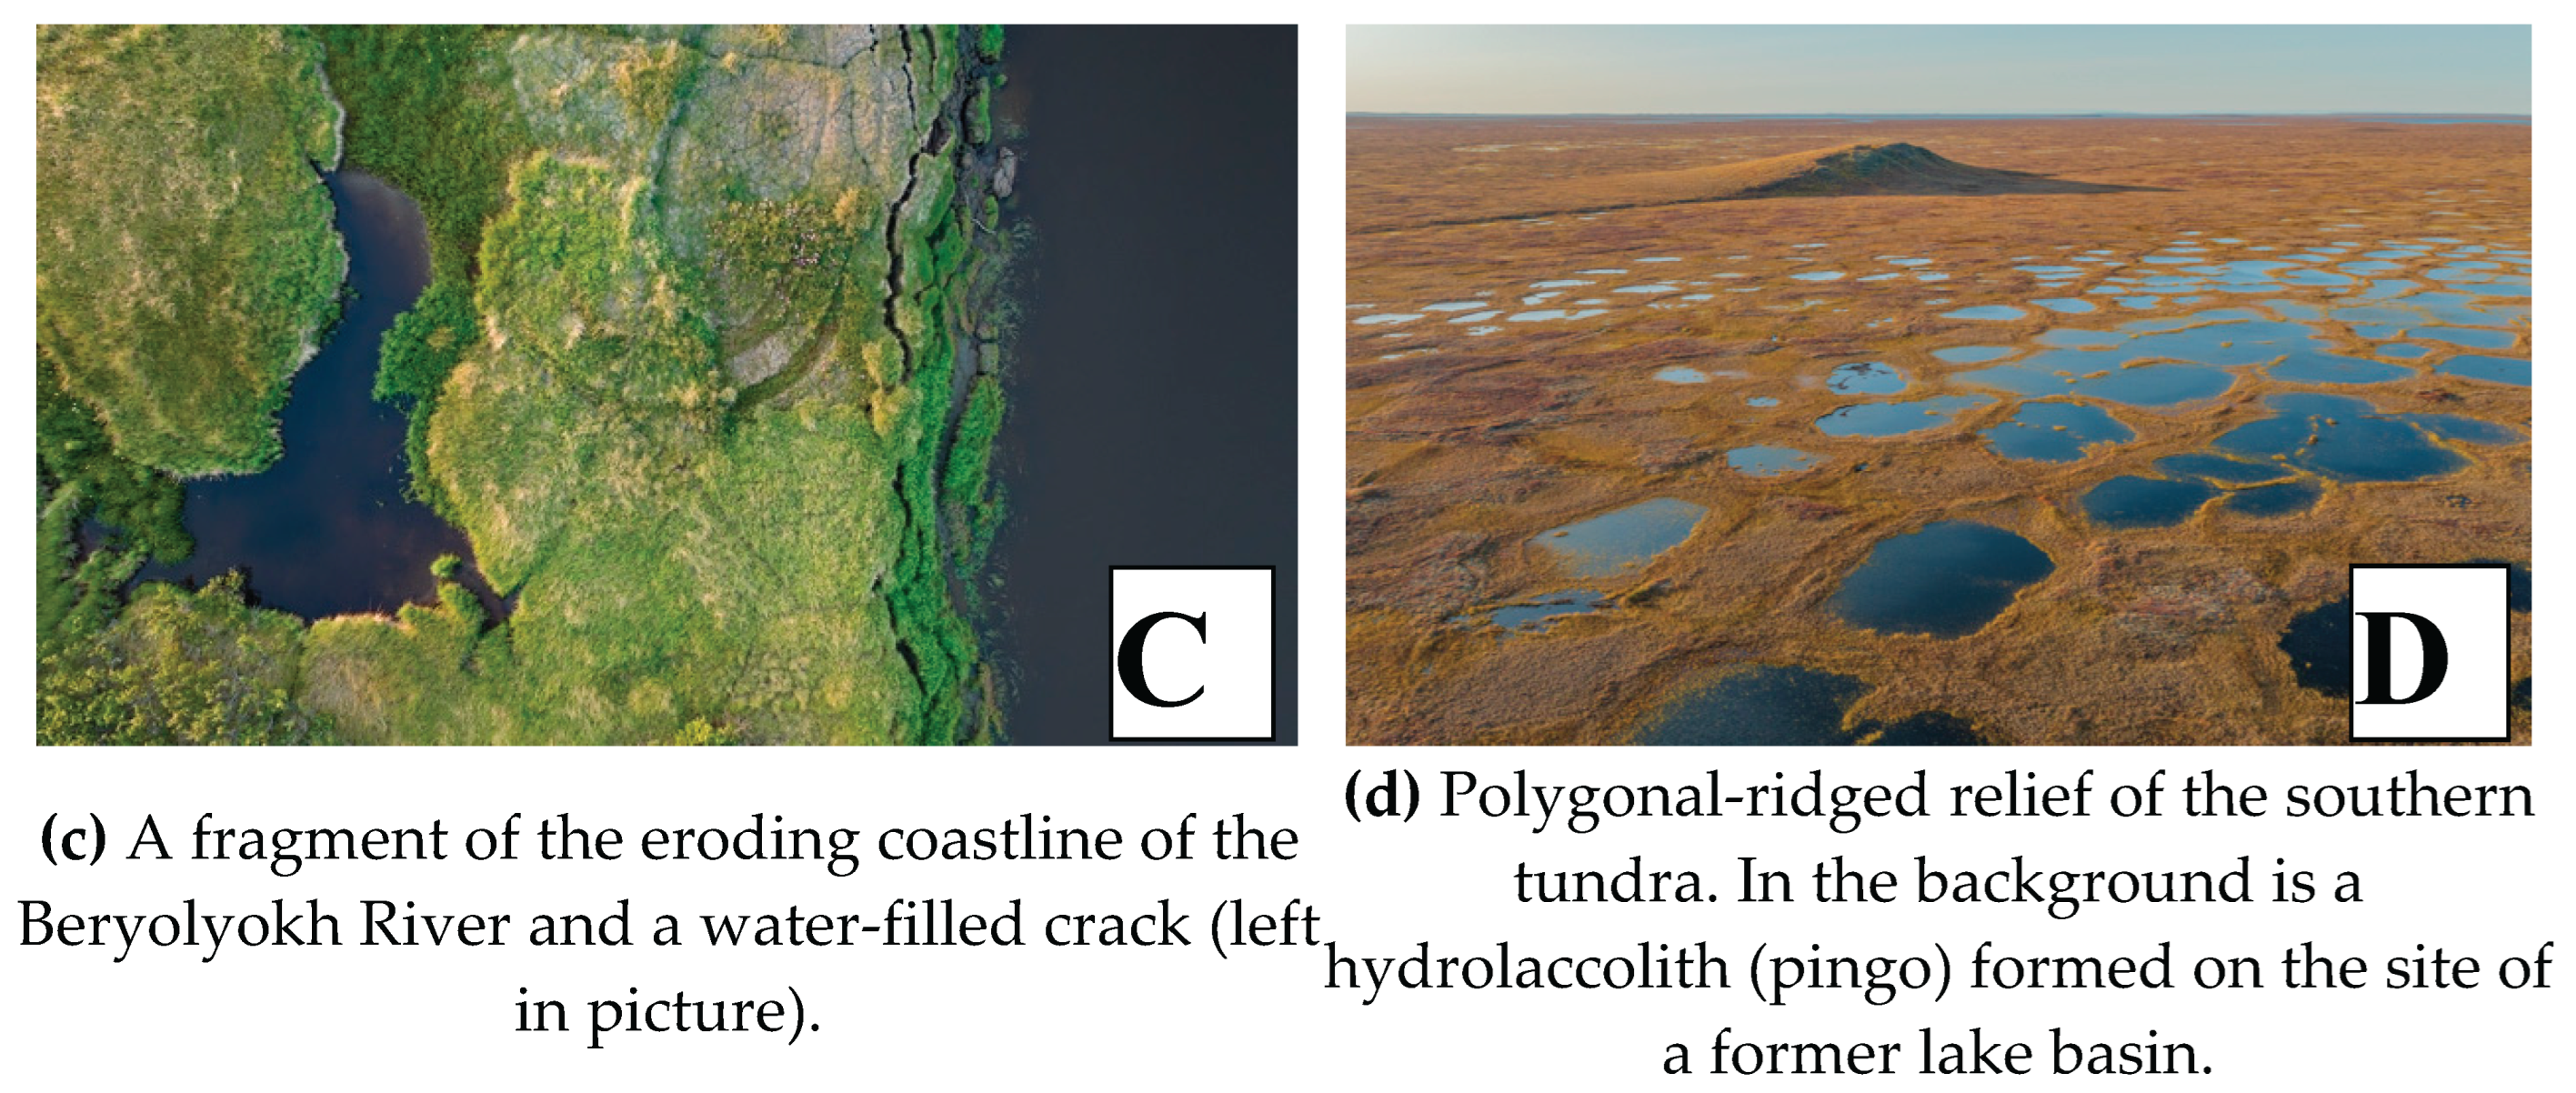
Figure 3.
Average C/N ratio in the organs of dominant plant species in the hypoarctic southern shrub tundra of the Yana-Indigirka Lowland, Northeastern Siberia.
Figure 3.
Average C/N ratio in the organs of dominant plant species in the hypoarctic southern shrub tundra of the Yana-Indigirka Lowland, Northeastern Siberia.
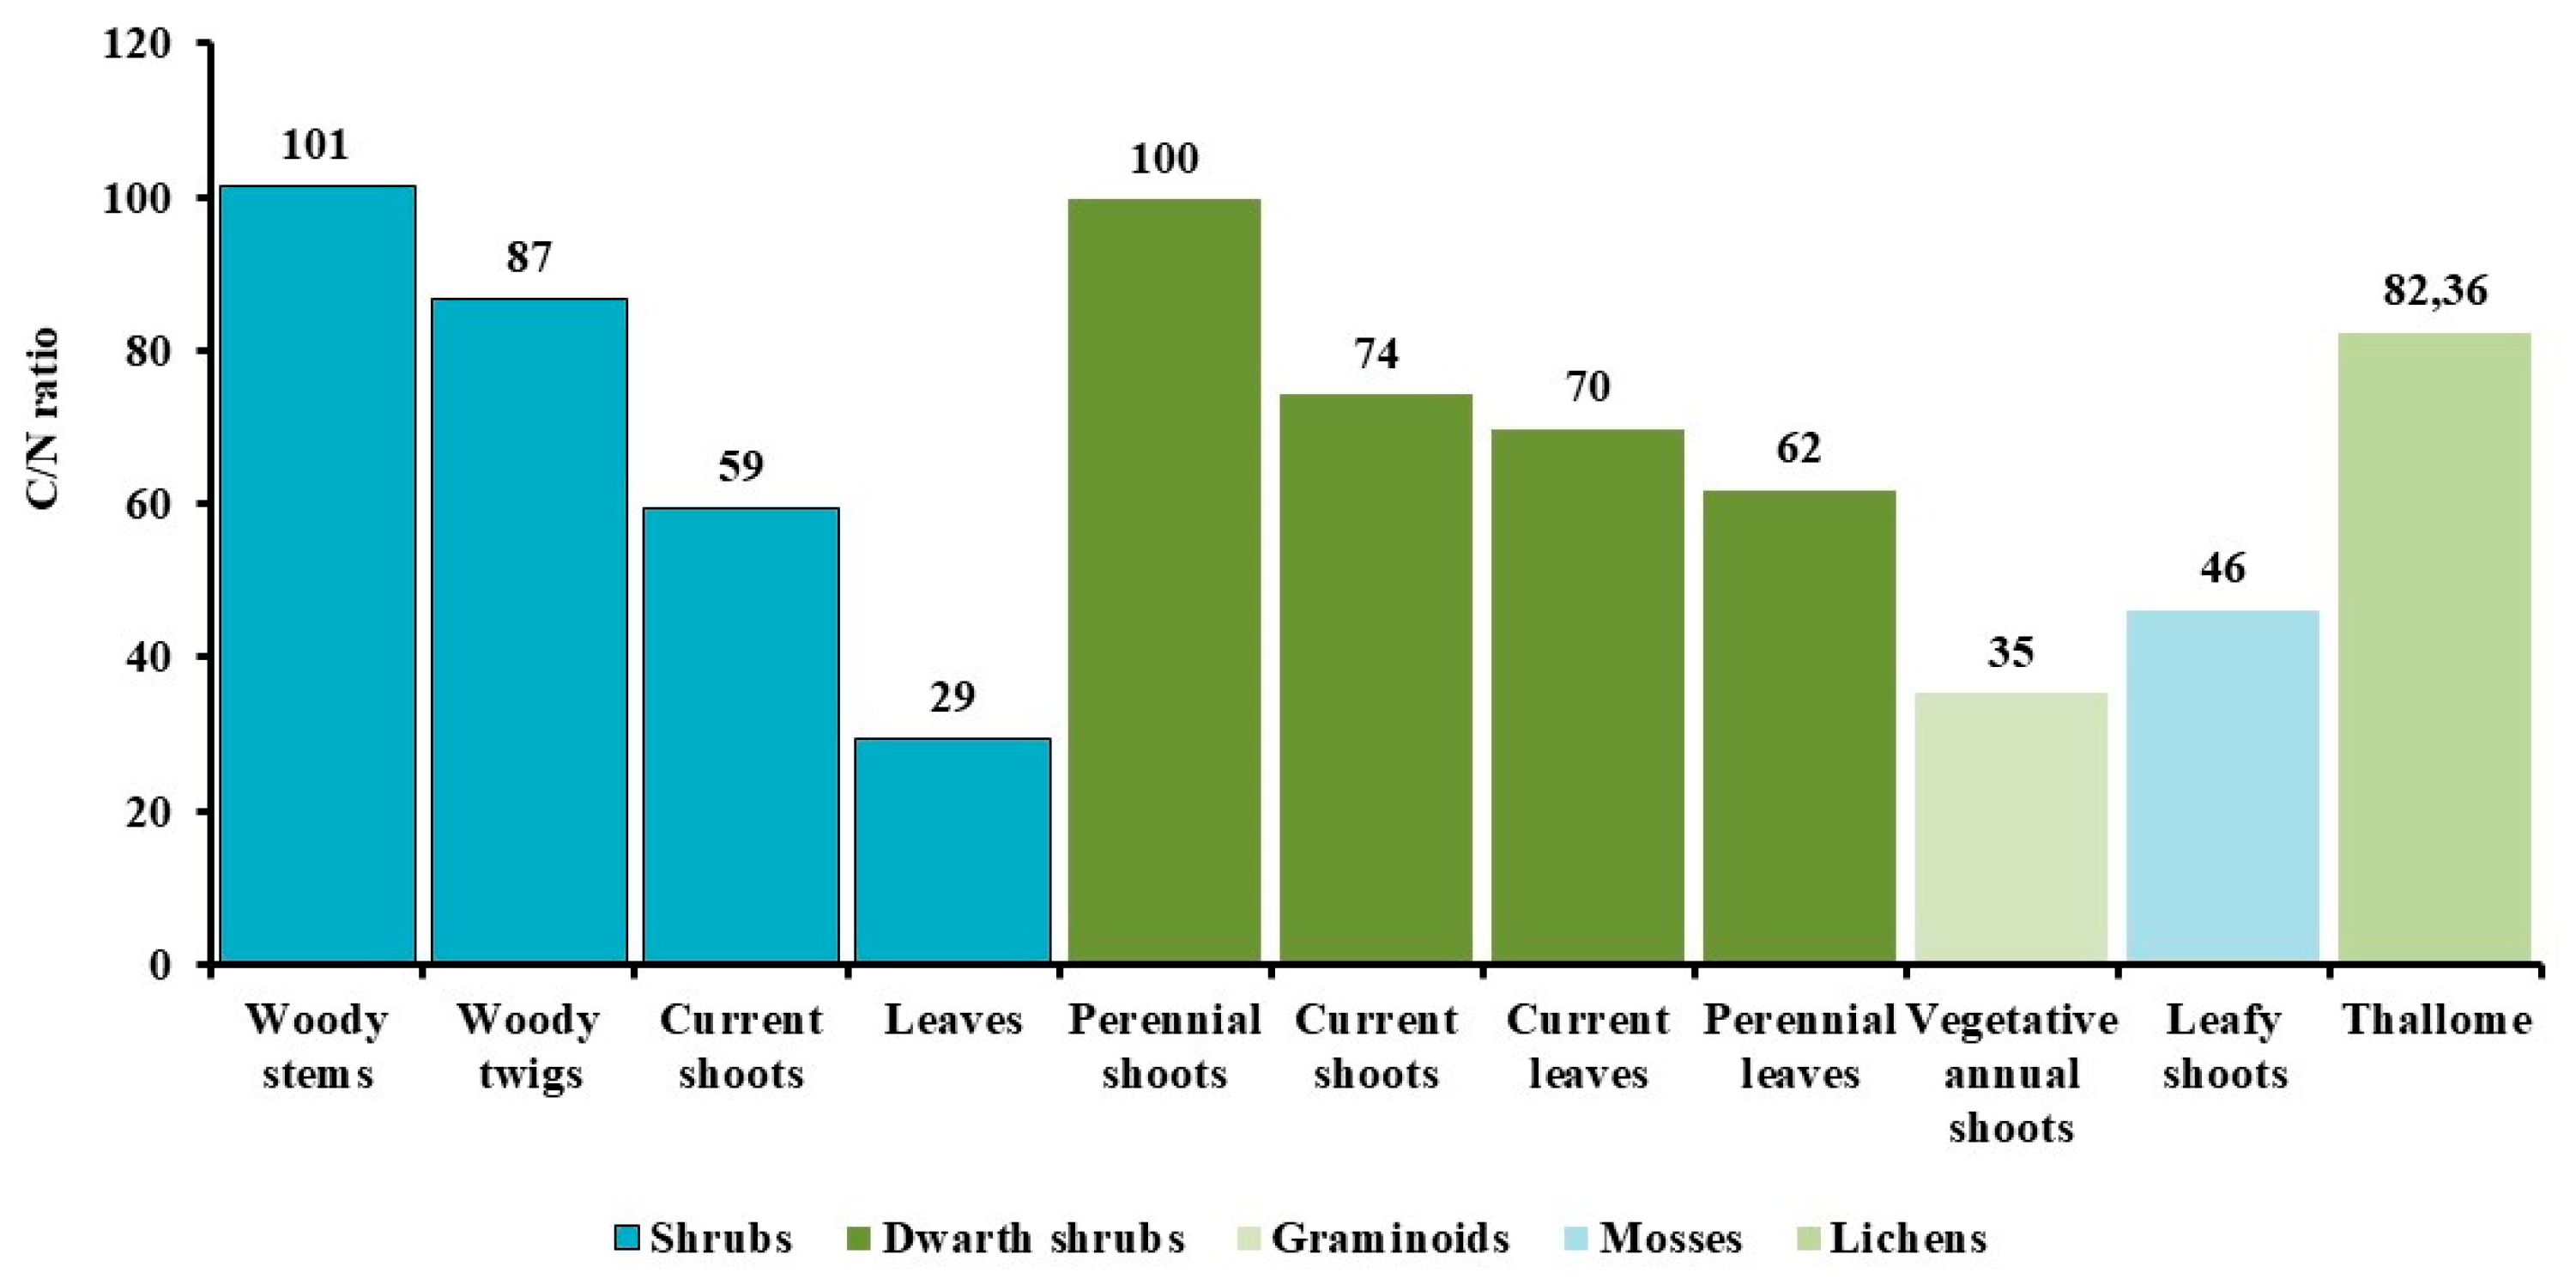
Figure 4.
Average phytomass, mortmass (t/ha), and average TOC stocks (t C/ha) in the hypoarctic southern shrub tundra in the vicinity of the “Chokurdakh” station (Yana-Indigirka Lowland, Northeastern Siberia).
Figure 4.
Average phytomass, mortmass (t/ha), and average TOC stocks (t C/ha) in the hypoarctic southern shrub tundra in the vicinity of the “Chokurdakh” station (Yana-Indigirka Lowland, Northeastern Siberia).
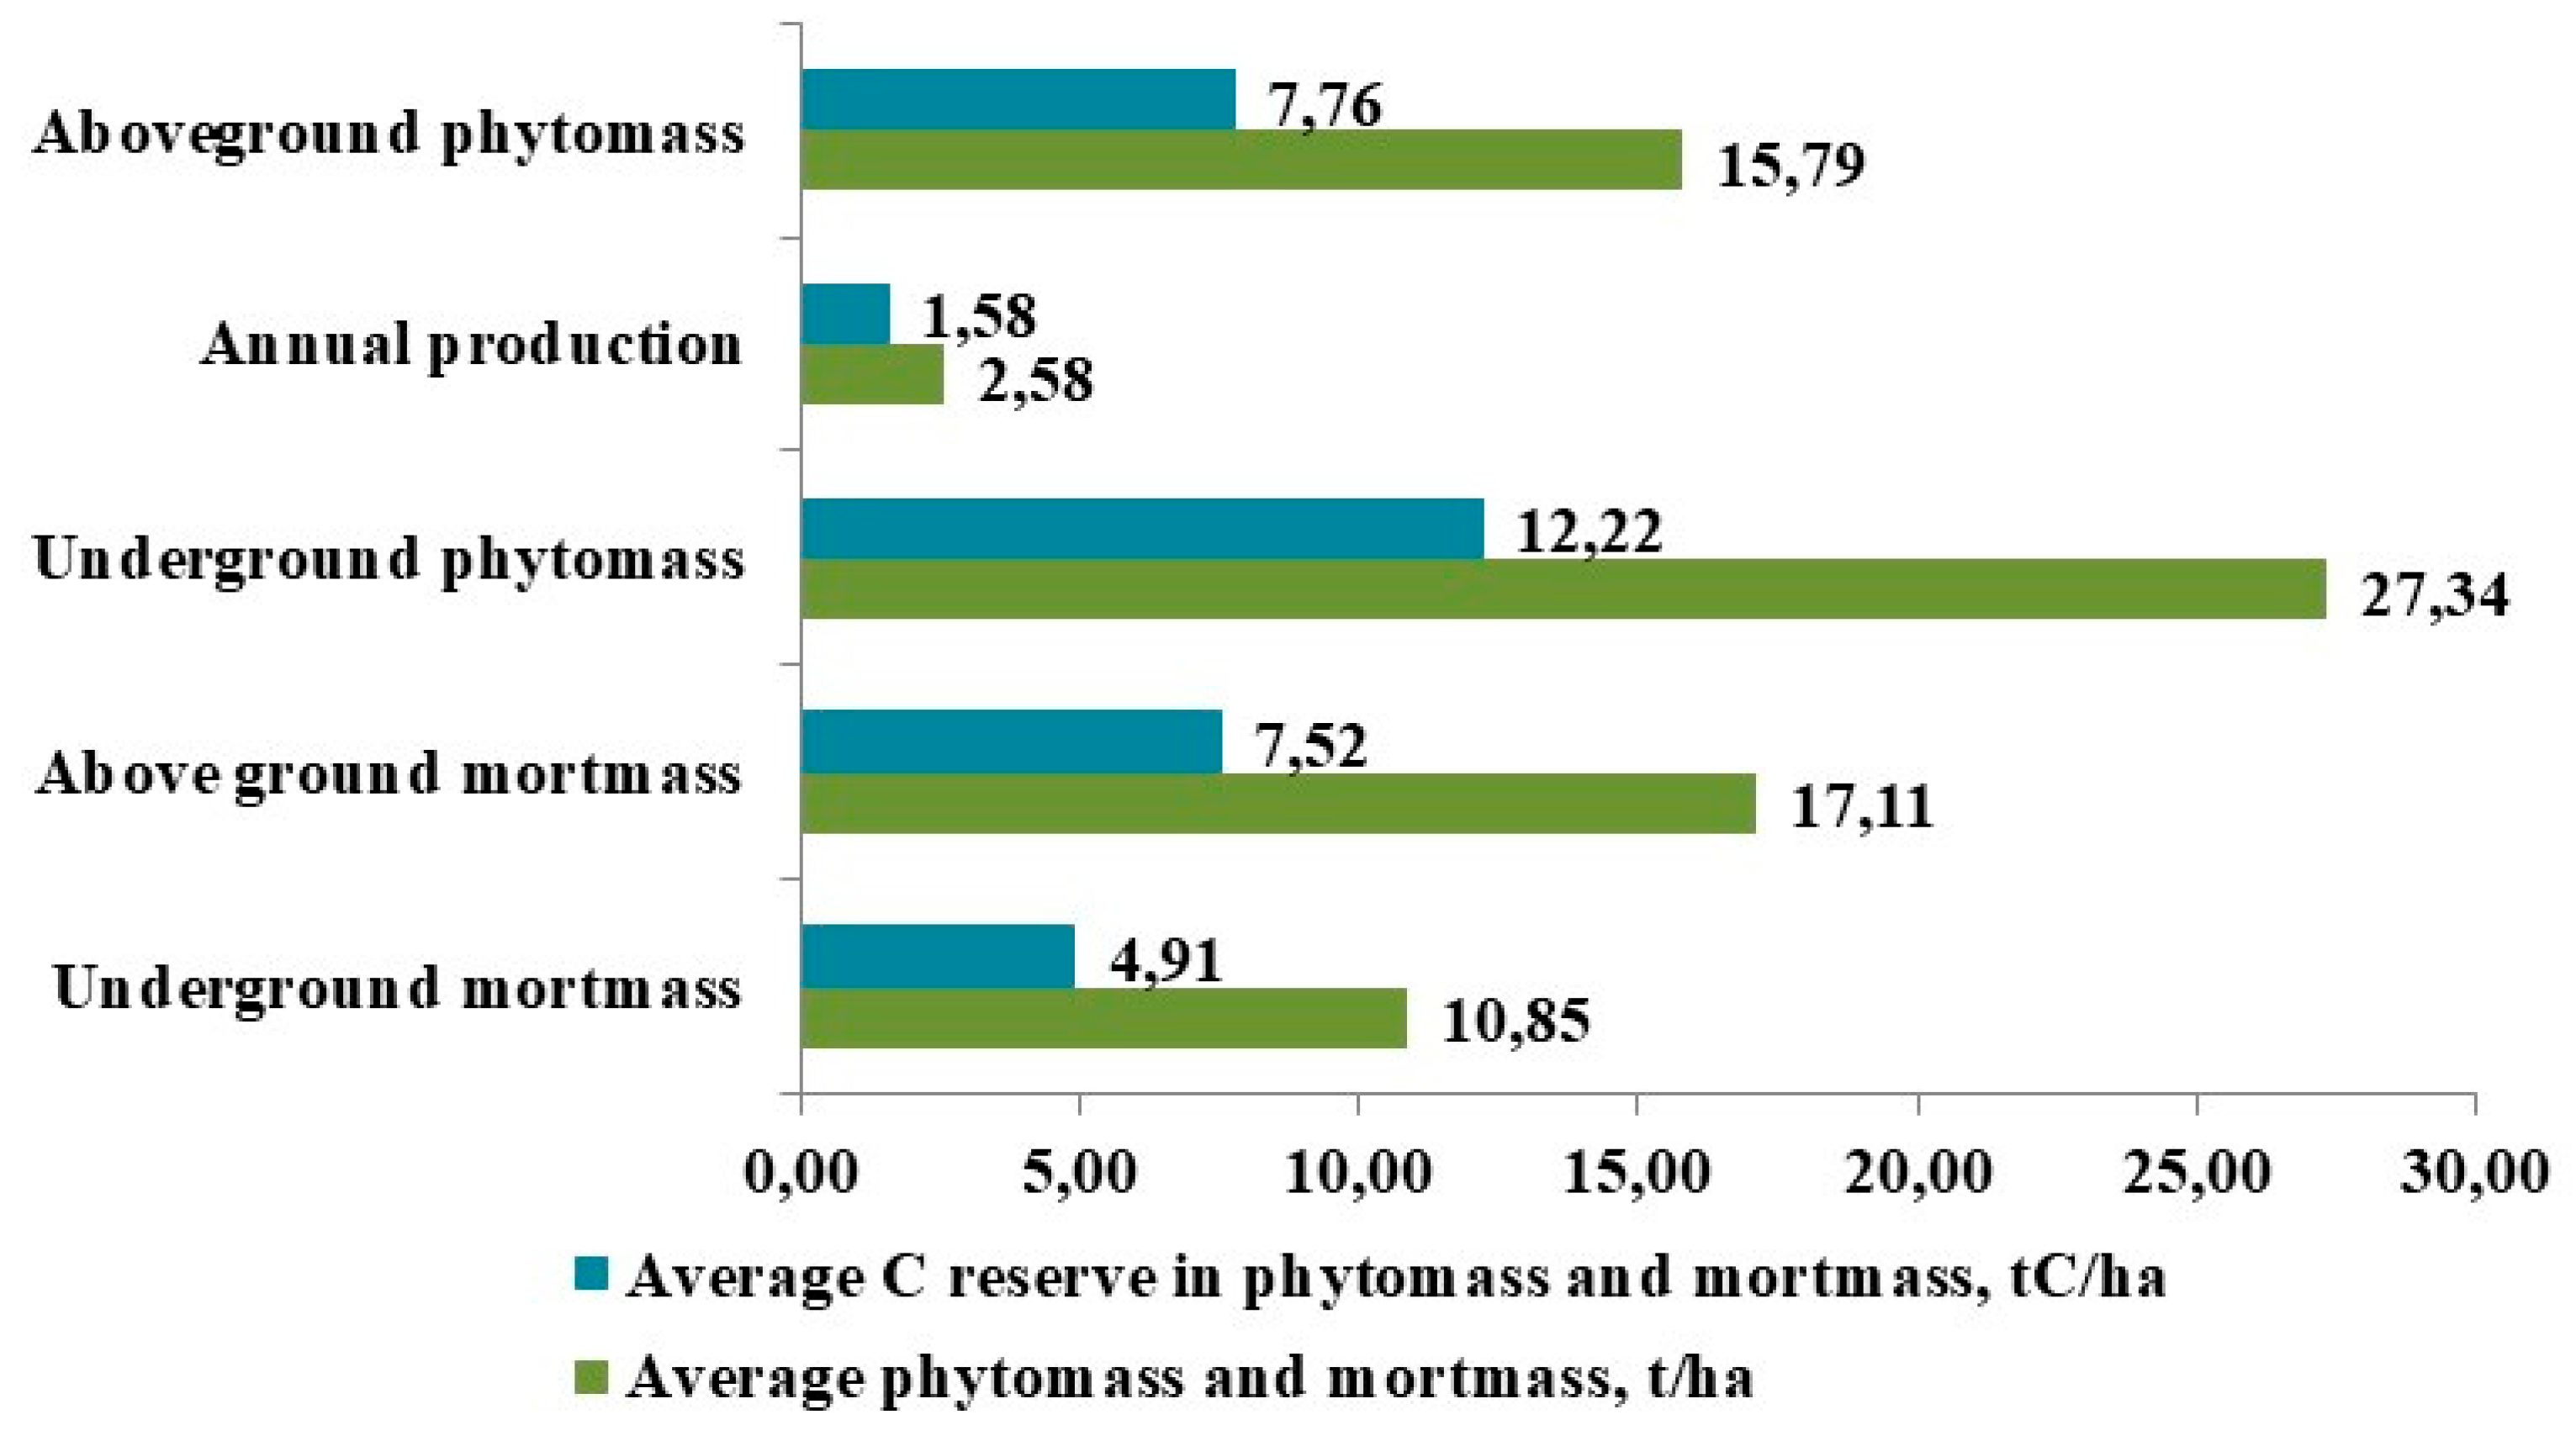
Figure 5.
Weighted average above-ground phytomass (t/ha) and weighted average above-ground TOC stock (t C/ha) in various species and groups of plants and lichens in the hypoarctic southern shrub tundra (Yana-Indigirka Lowland, Northeastern Siberia).
Figure 5.
Weighted average above-ground phytomass (t/ha) and weighted average above-ground TOC stock (t C/ha) in various species and groups of plants and lichens in the hypoarctic southern shrub tundra (Yana-Indigirka Lowland, Northeastern Siberia).
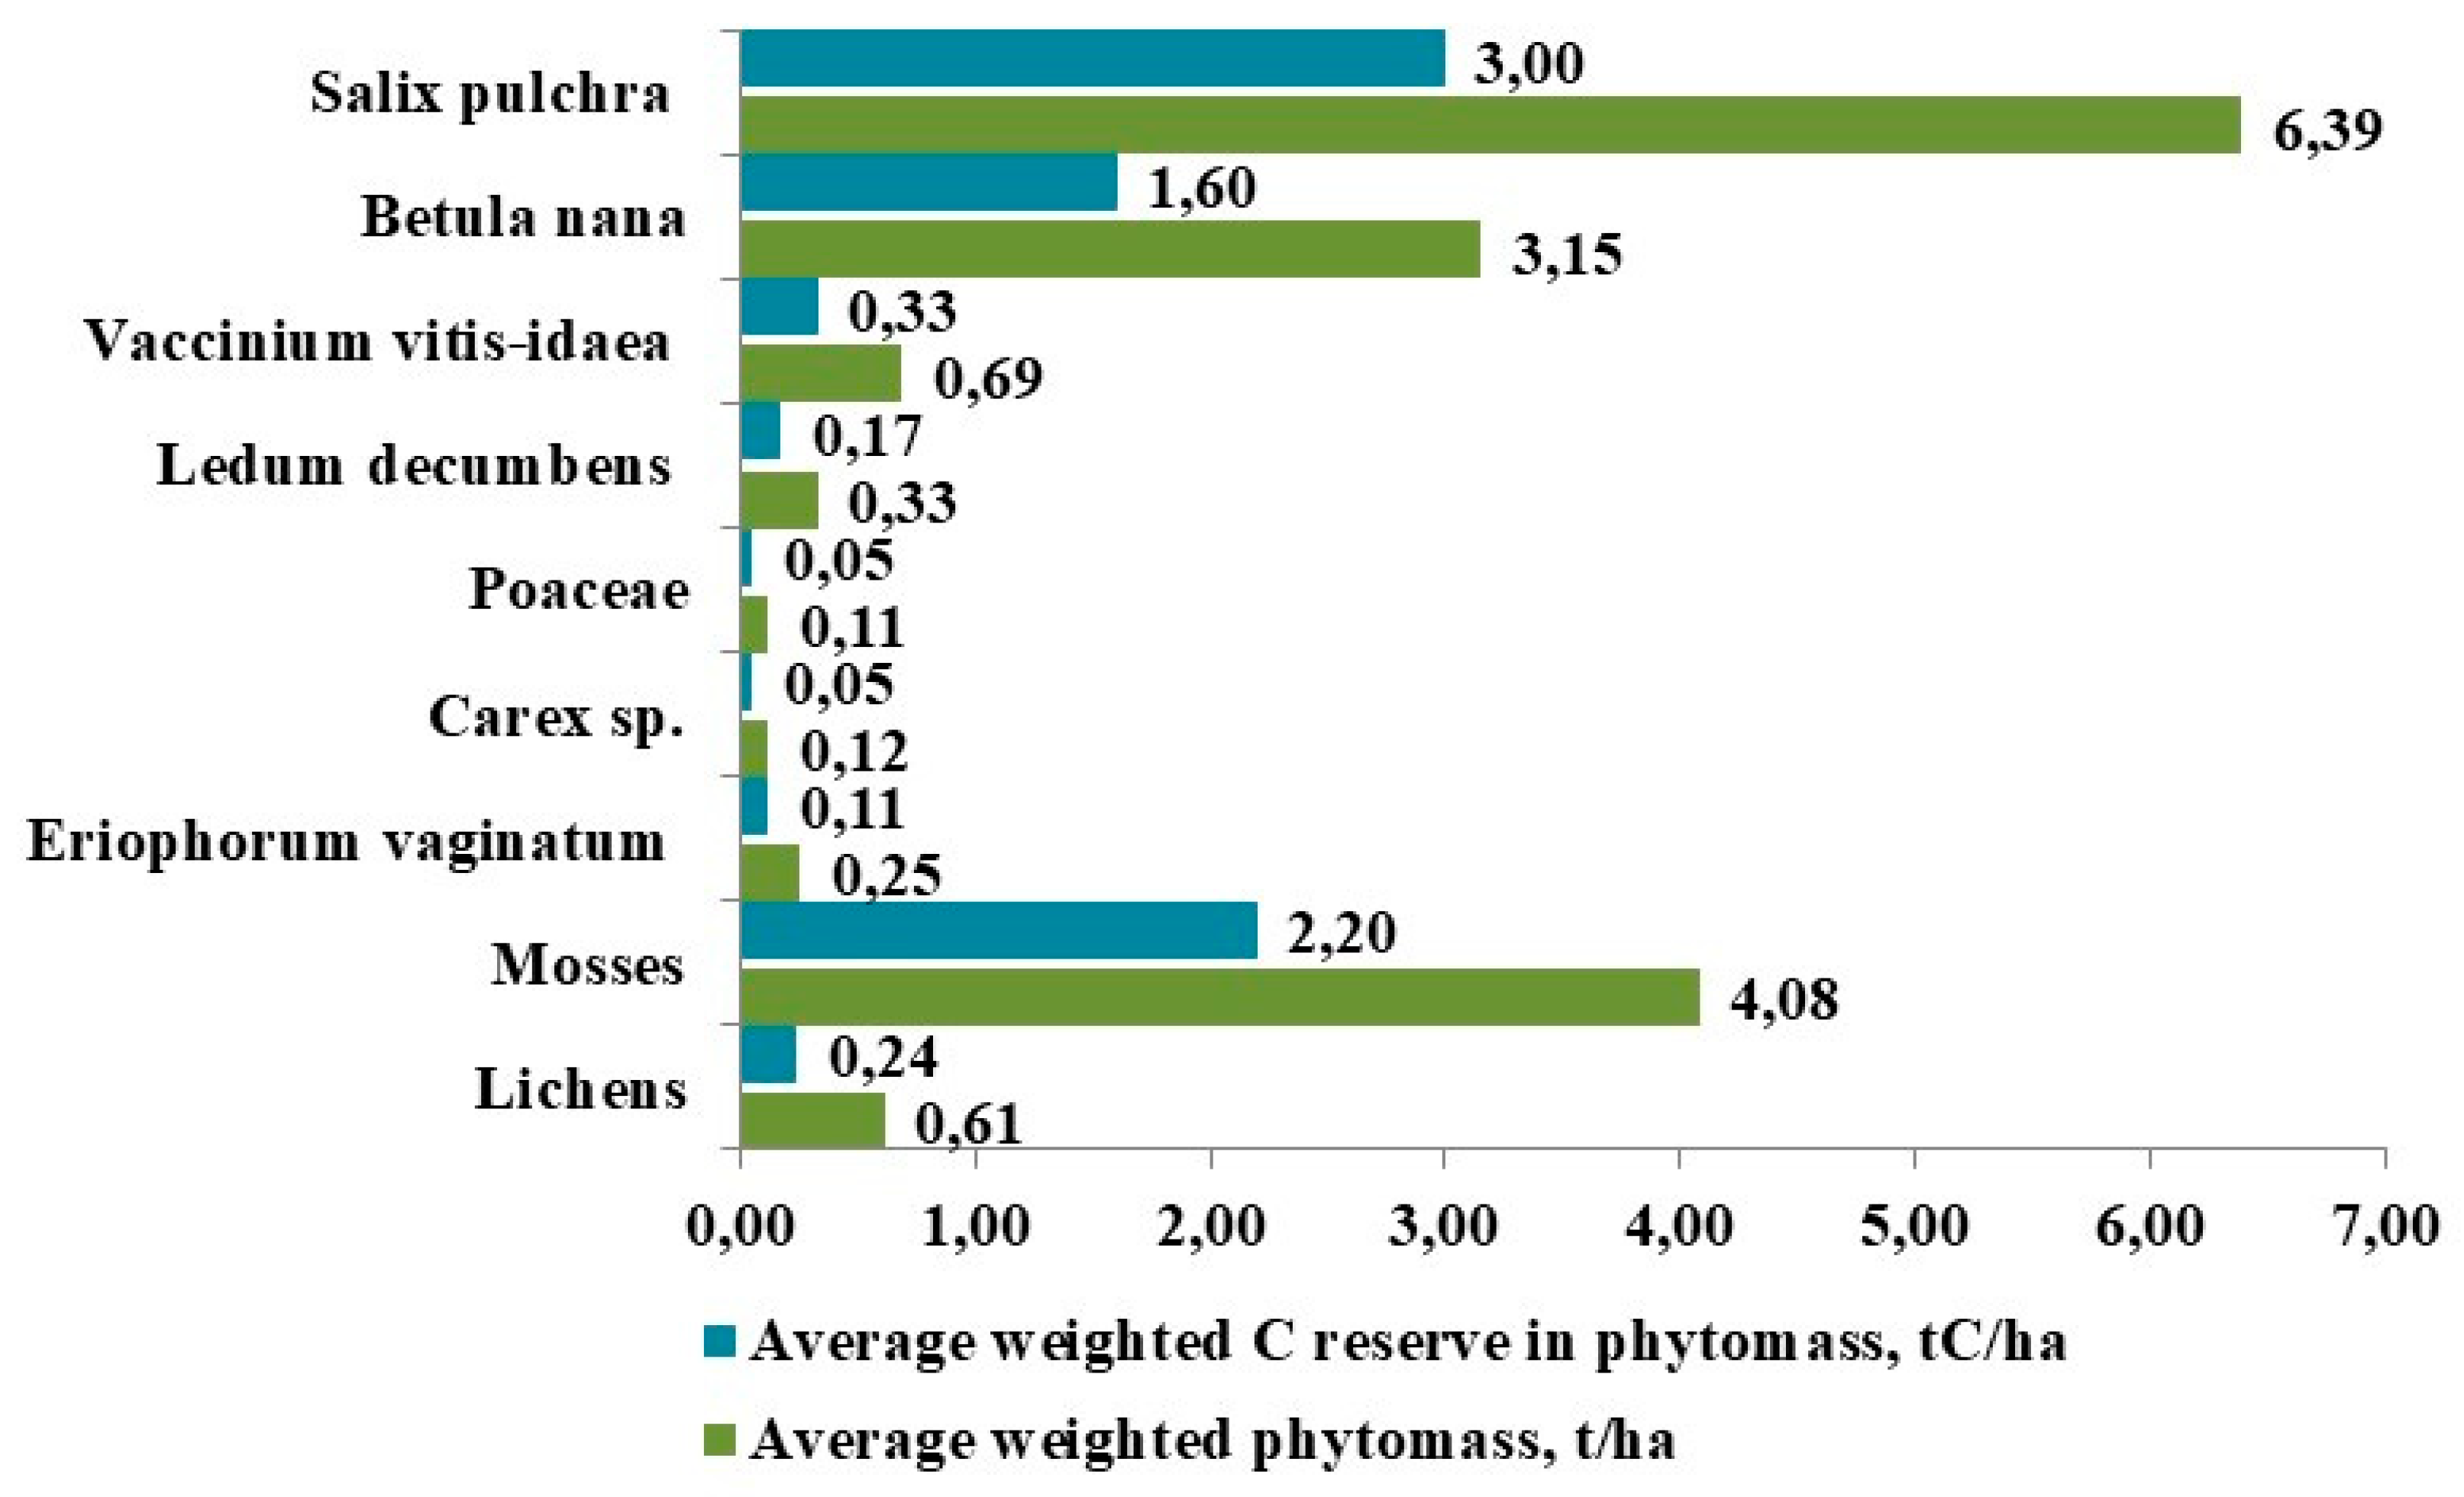
Figure 6.
Average pool and stocks of total organic carbon in the ground cover, organogenic, and mineral soil layers in various types of southern shrub tundra of the Yana-Indigirka Lowland, Northeastern Siberia. Note: Chok-1 Shrub-sphagnum-green moss tundra, Chok-2 and Chok-5 Shrub-lichen-green moss tundra, Chok-3 and Chok-4 Shrub-lichen-green moss tundra with Eriophorum vaginatum.
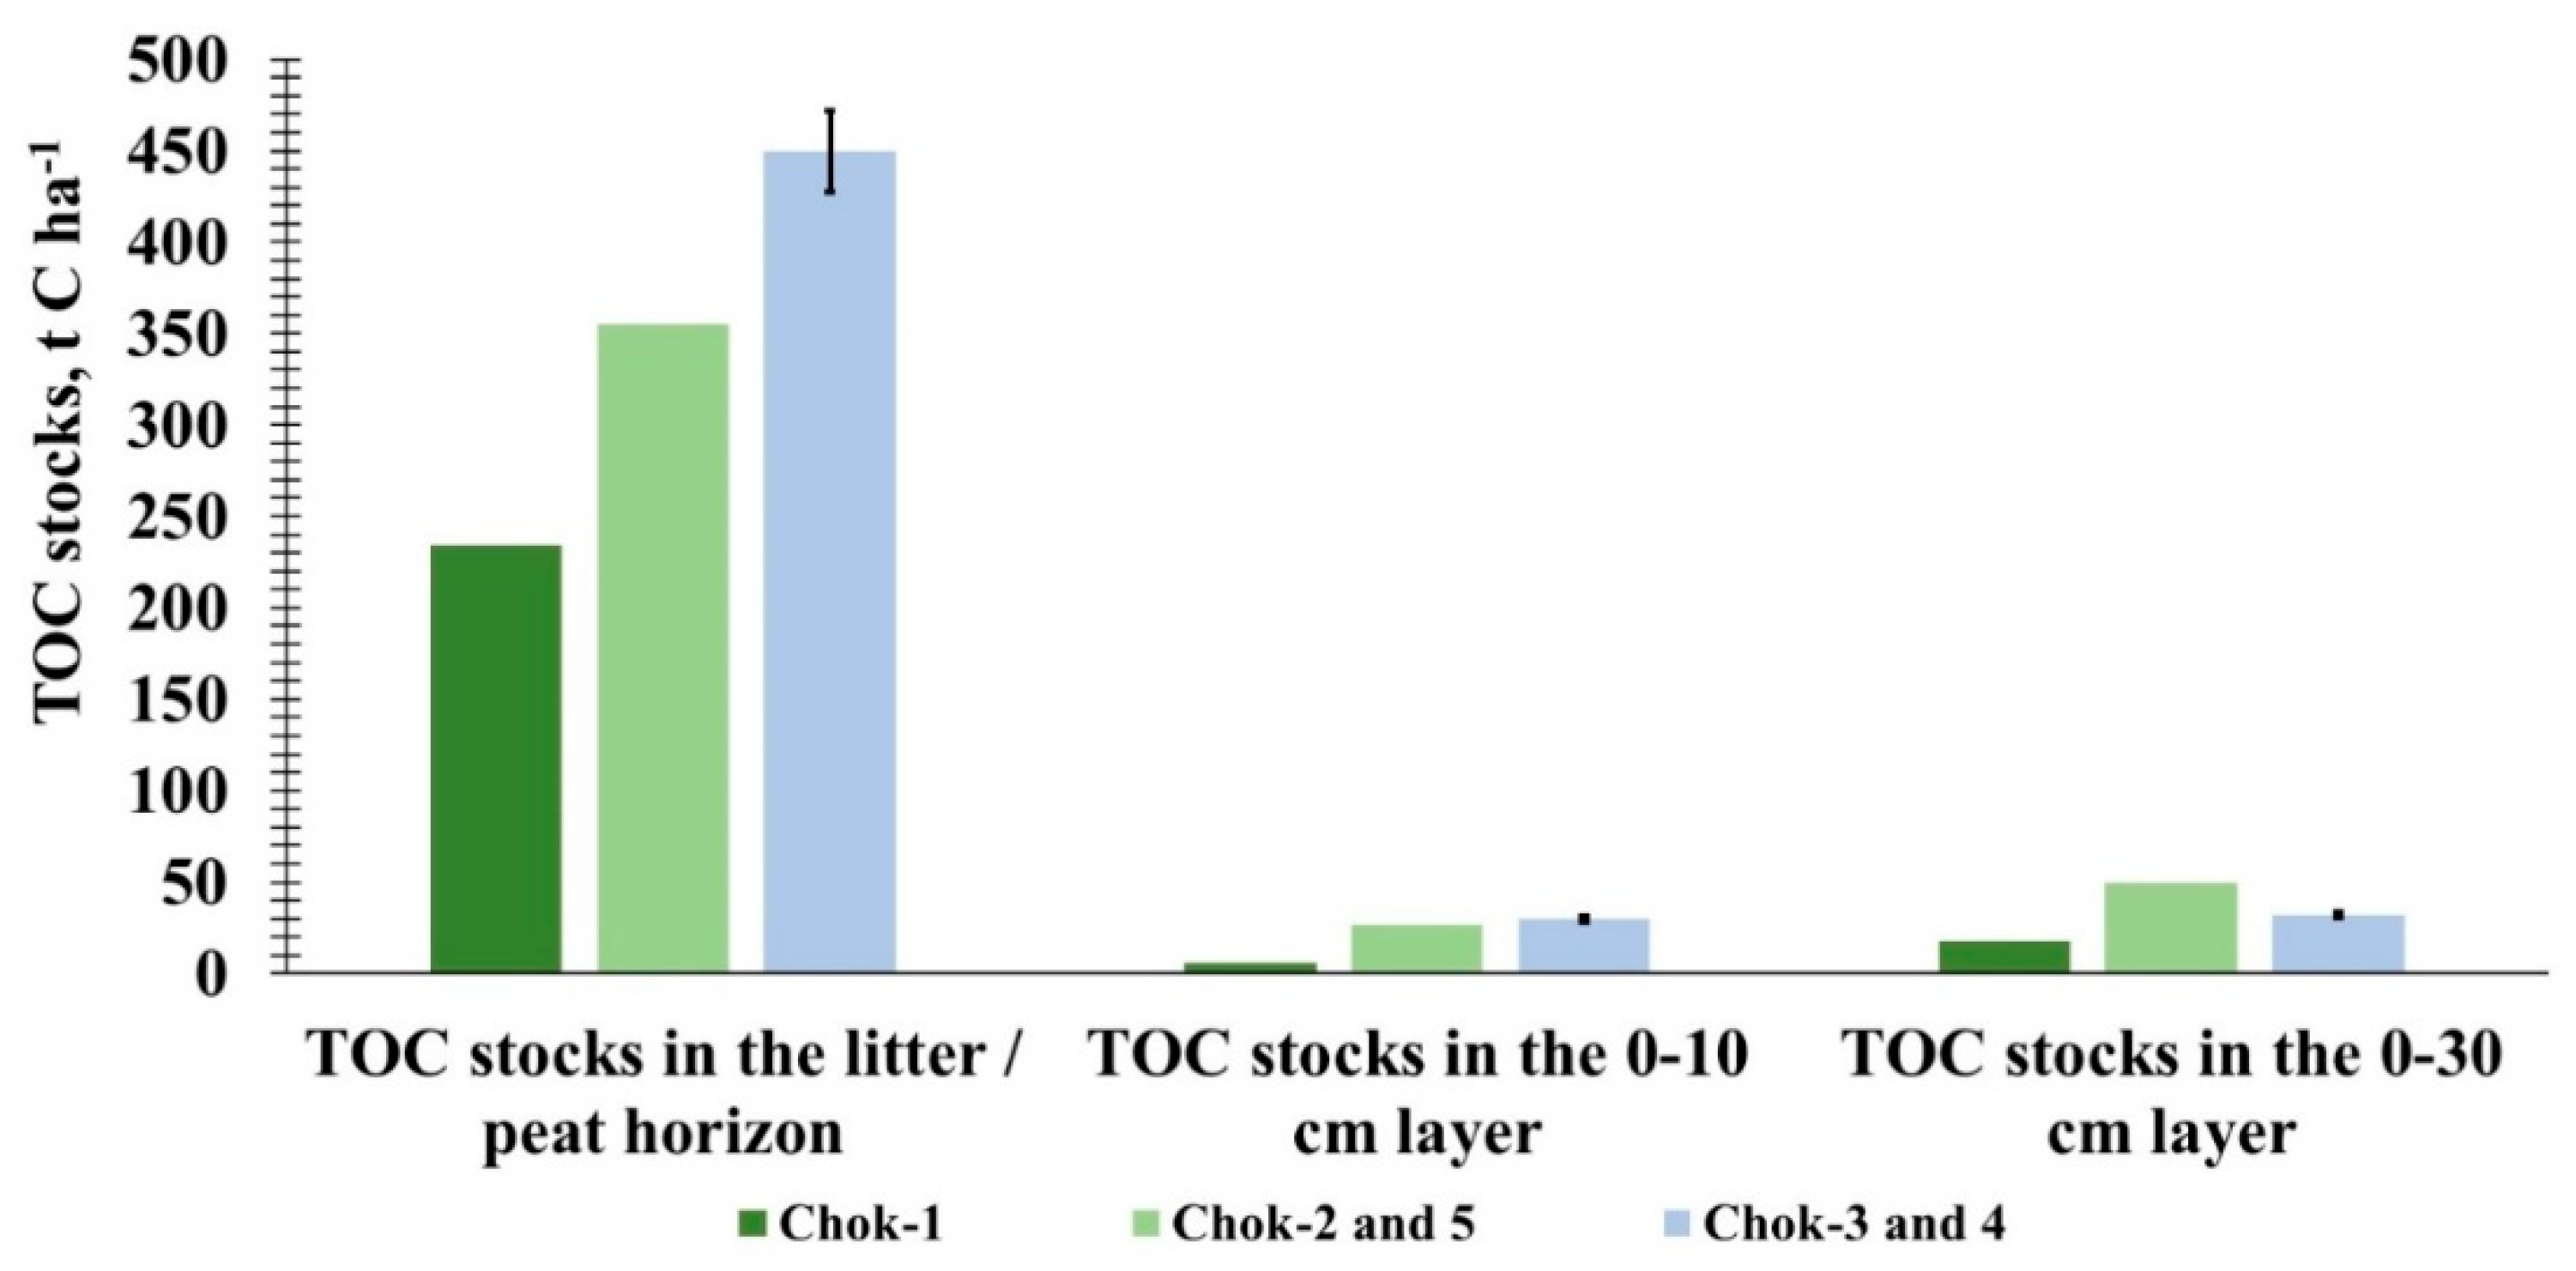
Table 2.
Average content of C and N in various organs, fragments of plants, and thalli of lichens in the hypoarctic southern shrub tundra of the Yana-Indigirka Lowland, Northeastern Siberia.
Table 2.
Average content of C and N in various organs, fragments of plants, and thalli of lichens in the hypoarctic southern shrub tundra of the Yana-Indigirka Lowland, Northeastern Siberia.
| Plant Organs and Fragments | Average C content, % | Average N content, % |
|---|---|---|
| Salix pulchra | ||
| Woody stems | 49.68 | 0.53 |
| Woody twigs | 48.52 | 0.65 |
| Current shoots | 48.21 | 1.01 |
| Leaves | 46.94 | 1.78 |
| Underground rooting shoots | 45.85 | 0.65 |
| Betula nana | ||
| Woody stems | 50.31 | 0.51 |
| Woody twigs | 52.45 | 0.57 |
| Current shoots | 53.56 | 1.17 |
| Leaves | 49.42 | 1.78 |
| Underground rooting shoots | 47.45 | 0.87 |
| Ledum decumbens | ||
| Woody stems | 54.49 | 0.52 |
| Woody twigs | 54.49 | 0.52 |
| Current shoots | 46.13 | 0.78 |
| Current leaves | 48.37 | 1.25 |
| Perennial leaves | 47.93 | 0.89 |
| Underground rooting shoots | 47.14 | 0.53 |
| Vaccinium vitis-idaea | ||
| Perennial shoots | 48.36 | 0.50 |
| Current shoots | 48.58 | 0.57 |
| Current leaves | 49.08 | 0.50 |
| Perennial leaves | 49.63 | 0.72 |
| Poaceae | ||
| Vegetative annual shoots | 44.83 | 1.19 |
| Carex | ||
| Vegetative annual shoots | 43.30 | 1.74 |
| Eriophorum vaginatum | ||
| Vegetative annual shoots | 42.78 | 1.18 |
| Mosses | ||
| Aulacomnium palustre | ||
| Current leafy shoots | 41.42 | 0.84 |
| Perennial leafy shoots | 44.13 | 0.76 |
| Aulacomnium turgidum | ||
| Current leafy shoots | 36.85 | 1.21 |
| Perennial leafy shoots | 39.28 | 1.13 |
| Sphagnum warnstorfii | ||
| Current leafy shoots | 39.54 | 0.85 |
| Perennial leafy shoots | 39.45 | 0.83 |
| Lichens | ||
| Thallus | 32.71 | 0.96 |
| Flavocetraria cucullata | ||
| Thallus | 31.65 | 0.24 |
Disclaimer/Publisher’s Note: The statements, opinions and data contained in all publications are solely those of the individual author(s) and contributor(s) and not of MDPI and/or the editor(s). MDPI and/or the editor(s) disclaim responsibility for any injury to people or property resulting from any ideas, methods, instructions or products referred to in the content. |
© 2025 by the authors. Licensee MDPI, Basel, Switzerland. This article is an open access article distributed under the terms and conditions of the Creative Commons Attribution (CC BY) license (http://creativecommons.org/licenses/by/4.0/).
Copyright: This open access article is published under a Creative Commons CC BY 4.0 license, which permit the free download, distribution, and reuse, provided that the author and preprint are cited in any reuse.


