
Submitted:
22 July 2025
Posted:
23 July 2025
You are already at the latest version
Abstract
As conventional oil reserves in Nigeria’s Niger Delta region continue to steadily decline, there is a pressing need to explore heavy oil production, which represents nearly 20% of the estimated crude oil reserves. The innovative hot chemical flooding system utilized thermal and chemical EOR technologies, economic analysis for optimal heavy oil production. The methodology involved developing a novel chemical mix that included dissolved liquid soap, scent leaf extract, bitter leaf extract, palm frond ash, xanthan gum, dry gin, and DG + DPFA, subjecting them to different temperatures (noting the corresponding heavy oil recovery results associated with each temperature), and comparing the results with the standard hot water and steam flood EOR processes currently practiced by oil and gas companies. Economic analysis was then carried out on the best-performing local process and also the steam flood process in order to obtain the most economically viable option. From the results obtained, xanthan gum was seen as the best-performing conventional chemical, with an average recovery factor of 96.43%, while the alkali-surfactant mix (DG – DPFA) was the best-performing local chemical, with an average recovery of 95%. The software simulation process provided key insights into the expected futuristic heavy oil recovery and expected water cut from the reservoir, and the economic analysis provided proxy mathematical equations for estimating the economical relevance of the project. Analysis of the results also gave the optimal surfactant – alkali – water mix percentage (10ml: 5g: 1000ml) for an effective production and economic viability. Observation and conclusions from the experimental and simulation results show the need for upstream companies to adopt hot chemical flood strategies for heavy oil production in the Niger Delta.
Keywords:
Enhanced oil recovery
; Heavy oil
; Thermal – Chemical flooding
; Economic Analysis
Introduction
The Niger Delta region of Nigeria has been a significant contributor to global crude oil production for decades. However, as conventional oil reserves in the region continue to decline, there is an increasing need to explore and exploit alternative resources, particularly heavy oil, which is estimated to constitute nearly 20% of Nigeria's crude oil reserves [1]. Heavy oil recovery poses unique challenges due to its high viscosity, which limits flow in the reservoir and necessitates the use of enhanced oil recovery (EOR) techniques [2]. Among the various EOR methods, thermal and chemical techniques have been identified as particularly effective for improving the recovery of heavy oil [3,4].
Thermal EOR methods, such as steam flooding, have been widely used to reduce the viscosity of heavy oil, thereby enhancing its mobility and recovery [5]. Steam flooding involves the injection of steam into the reservoir to heat the crude oil, reduce its viscosity, and increase its flow to production wells. Although effective, steam flooding is energy-intensive and can be costly, especially in regions where fuel prices are high or gas supplies are limited [6]. Furthermore, the thermal efficiency of steam injection diminishes with increasing reservoir depth, as heat losses to the surrounding rock formations reduce the effective heating of the reservoir [7]. Chemical EOR methods, on the other hand, involve the injection of chemical agents, such as surfactants, polymers, and alkalis, to improve oil displacement and sweep efficiency by reducing interfacial tension and increasing the viscosity of the displacing fluid [8]. The combination of thermal and chemical EOR techniques, known as thermal-chemical EOR, has shown promise in enhancing heavy oil recovery by synergistically improving both oil mobility and displacement efficiency [9].
Recent studies have explored various chemical combinations and their effectiveness in thermal-chemical EOR processes. For example, the use of surfactants and polymers in steam flooding has been shown to significantly enhance oil recovery by reducing the water-oil interfacial tension and increasing the viscosity of the injected steam, thereby improving sweep efficiency and reducing steam channelling [10,11]. Additionally, alkali-surfactant-polymer (ASP) flooding has emerged as a potential method for improving oil recovery in heavy oil reservoirs by combining the benefits of alkaline flooding (which reduces oil-water interfacial tension), surfactant flooding (which enhances microscopic displacement efficiency), and polymer flooding (which improves mobility control) [12,13]. However, the economic viability of these EOR methods, particularly in the context of the Niger Delta, remains a critical concern due to the high costs associated with chemical and thermal agents and the logistics of deploying these technologies in remote locations [14,15].
The novel hot chemical flooding system presented in this study offers a potentially cost-effective alternative by utilizing locally available materials and optimizing the chemical mix for enhanced recovery and economic viability. The unique combination of dissolved liquid soap, scent leaf extract, bitter leaf extract, palm frond ash, xanthan gum, dry gin, and an alkali-surfactant mix (DG + DPFA) is designed to leverage both thermal and chemical EOR mechanisms. The effectiveness of these materials is evaluated through a series of experiments conducted at varying temperatures to simulate the reservoir conditions encountered in the Niger Delta [16]. The use of locally sourced materials not only reduces the cost of chemical agents but also aligns with sustainable practices by utilizing renewable and biodegradable materials [17,18].
In addition to the experimental analysis, this study also incorporates valid economic models to simulate the economic related aspect of heavy oil recovery. The use of predictive modelling in EOR has gained traction in recent years due to its ability to provide valuable insights into reservoir behaviour and optimize EOR strategies [19]. The software models developed in this study are based on the experimental results and provide a quantitative basis for comparing the novel hot chemical flooding process with traditional steam flooding techniques currently used by oil and gas companies [20]. The economic analysis further assesses the cost-effectiveness of the proposed method, focusing on key economic metrics such as the Cost of Energy (COE), Gross Revenue, Net Present Value (NPV), and Present Value per Dollar ($) to determine the most economically viable option [21].
The findings from this study have significant implications for the future of heavy oil recovery in the Niger Delta. By demonstrating the potential of thermal-chemical EOR using locally sourced materials and optimized chemical formulations, this research provides a viable pathway for increasing heavy oil production in a cost-effective and sustainable manner. The adoption of such innovative strategies is crucial for upstream companies in the Niger Delta and other similar regions facing declining conventional oil reserves. This study contributes to the growing body of knowledge on enhanced oil recovery and offers practical solutions for overcoming the technical and economic challenges associated with heavy oil production.
Methodology
Experimental Set-up
The steam flood setup and the thermal-chemical hybrid flood setup as shown in Figure 1 and Figure 2 below is a locally fabricated EOR setup consisting of the flow pumps, the accumulator, valves and nipples, the relevant gauges (temperature and pressure), the steam generator and its gas-powered firing system, the core holder and its end stem the insulated piping connections and the air compressor that provides overburden pressure to the core setup. Camp gas was utilized for the provision of the necessary thermal energy for the thermal – chemical hybrid EOR system, and condensers were utilized in the crude oil temperature reduction process. These pieces of equipment are the building blocks of the following systems: the fluid injection system, the core flooding system, the data measurement system, and the computer output system.
Experimental Methodology
- Plug Preparation
For the experimental analysis plug samples were obtained from on-field consolidated reservoir rock samples, and weren’t developed in the laboratory. The petrophysical properties of the core samples were obtained using standard procedures.
-Brine Preparation
30g of NaCl was mixed with 1000cm3 of distilled water Stir the mixture until a homogenous solution is obtained.
Chemical EOR Fluids Preparation and Properties Determination
The chemical fluids utilized for the thermal – chemical EOR process were prepared analysed as follows:
- i.
-
Liquid Soap – Water mixture:
- i.
- 1000ml of distilled water was poured into a beaker.
- ii.
- 10ml of morning fresh liquid soap was introduced into the distilled water.
- iii.
- The mix was stirred into a homogenous 1% vol–vol mixture using a magnetic stirrer.
The Liquid soap mixture properties (density and viscosity) was obtained by following the standard procedures.
- ii.
-
Bitter Leaf Extract – Water mixture:
- i.
- 40ml of Bitter leaf extract was mixed with 10ml of Ethanol.
- ii.
- 10ml of the resulting mix in step (i) was mixed with 1000ml of distilled water.
- iii.
- A magnetic stirrer was used to stir the two fluids into a homogenous 1% vol-vol mixture.
- iii.
-
Other Chemicals – Water mixtures:
- i.
- 10ml of Dry gin; Palm burnt ash; Scent-leaf extract were each mixed with 1000ml of distilled water respectively.
- ii.
- A magnetic stirrer was utilized to further homogenize the 1% vol-vol mixtures.
- iii.
- 10ml of Dry gin was mixed with 5g of Palm burnt ash and 1000ml of distilled water.
Experimental Results
Core Analysis Results
Table 1 and Table 2 gave us a summary of the physical properties of the core samples, which were analysed, giving a wider understanding of the behaviours of the fluids to be injected and stored in the core samples. The core samples were seen to have low porosity and permeability values, which is in sync with published data on the characteristics of heavy oil reservoir rocks. The Rock lithology and thermal conductivity was estimated from standard density correlations.
Fluid Analysis Results
Table 3 and Table 4 tell us the characteristics of the heavy oil sample that was analysed, spanning from the density to the dynamic viscosity. The heavy crude oil sample was seen to have an API gravity of 16.79oAPI and a dynamic viscosity of 438.02 cp, suggesting that it did not fall under the extra heavy oil classification, and corresponds with the known ranges of the Niger-Delta heavy crude properties.
i. Crude Oil Results:

Table 3.
Crude oil calculated Density.
| Sample Name | Empty DB weight (g) | DB + Water weight (g) | DB + Crude oil weight (g) | Relative Crude Density | Crude API Gravity (oAPI) |
|---|---|---|---|---|---|
| Crude oil | 22.89 |
79.42 | 76.83 | 0.9542 | 16.79 |
Legend: DB = Density Bottle (Pycnometer).
i. EOR Fluids Properties Results:
Table 4.
Crude oil Viscosity and pH.
| Sample Name | Temp ) |
Efflux Time (s) | Viscometer constant | Density (g/cc) | (cSt) | (cP) | pH |
|---|---|---|---|---|---|---|---|
| Crude Oil | 29 |
12606 | 0.0364149 | 0.9542 | 459.046 | 438.022 | 6.5 |
Table 5and Table 6 gives the physical properties of the chemicals used for the hot fluid flooding and further gives the relationship between the chemical fluid properties and potential oil productivity. A fairly direct correlation was observed between the fluid’s density and its dynamic viscosity. Waterflooding wasn’t conducted for the heavy oil sample recovery due to its high density.
Crude Oil Recovery Results
A. 50oC Thermal – Chemical Hybrid Flood (Core A)
This section gives the results of the total flooding process from imbibition to tertiary flooding when the chemical EOR fluid was heated to 50oC and the utilized core sample was Core A. Secondary recovery wasn’t conducted due to the density and viscosity of the crude oil sample. During the tertiary flood process, an overburden pressure of 1500 psi was used, and 1000 ml of hot chemical was introduced into the accumulator.
Table 7.
Core Flood results (50oC Heat addition).
| Tertiary Recovery | ||||||||
|
Sample Name |
BP |
FR (ml/min) |
(psi) |
PV (cc) |
OOIP (cc) |
Oil Recovered (ml) |
RE (%) |
|
| DLS (core B) |
86 | 75.00 | 0.46 | 12.84 | 9.42 | 3.42 | 7.80 | 82.76 |
| Dry Gin | 84 | 75.70 | 0.43 | 13.92 | 9.87 | 4.05 | 9.07 | 91.89 |
| SLE | 86 | 74.03 | 0.47 | 13.92 | 9.92 | 4.00 | 8.53 | 85.99 |
| DPFA | 86 | 50.50 | 0.51 | 13.92 | 9.87 | 4.05 | 8.31 | 84.19 |
| BLE + E | 83 | 62.30 | 0.46 | 13.92 | 9.89 | 4.03 | 9.08 | 91.81 |
| XG | 85 | 61.07 | 0.57 | 13.92 | 9.85 | 4.08 | 9.35 | 94.97 |
Figure 3.
Graph of OOIP and Oil Recovery for the Fluid samples at 50
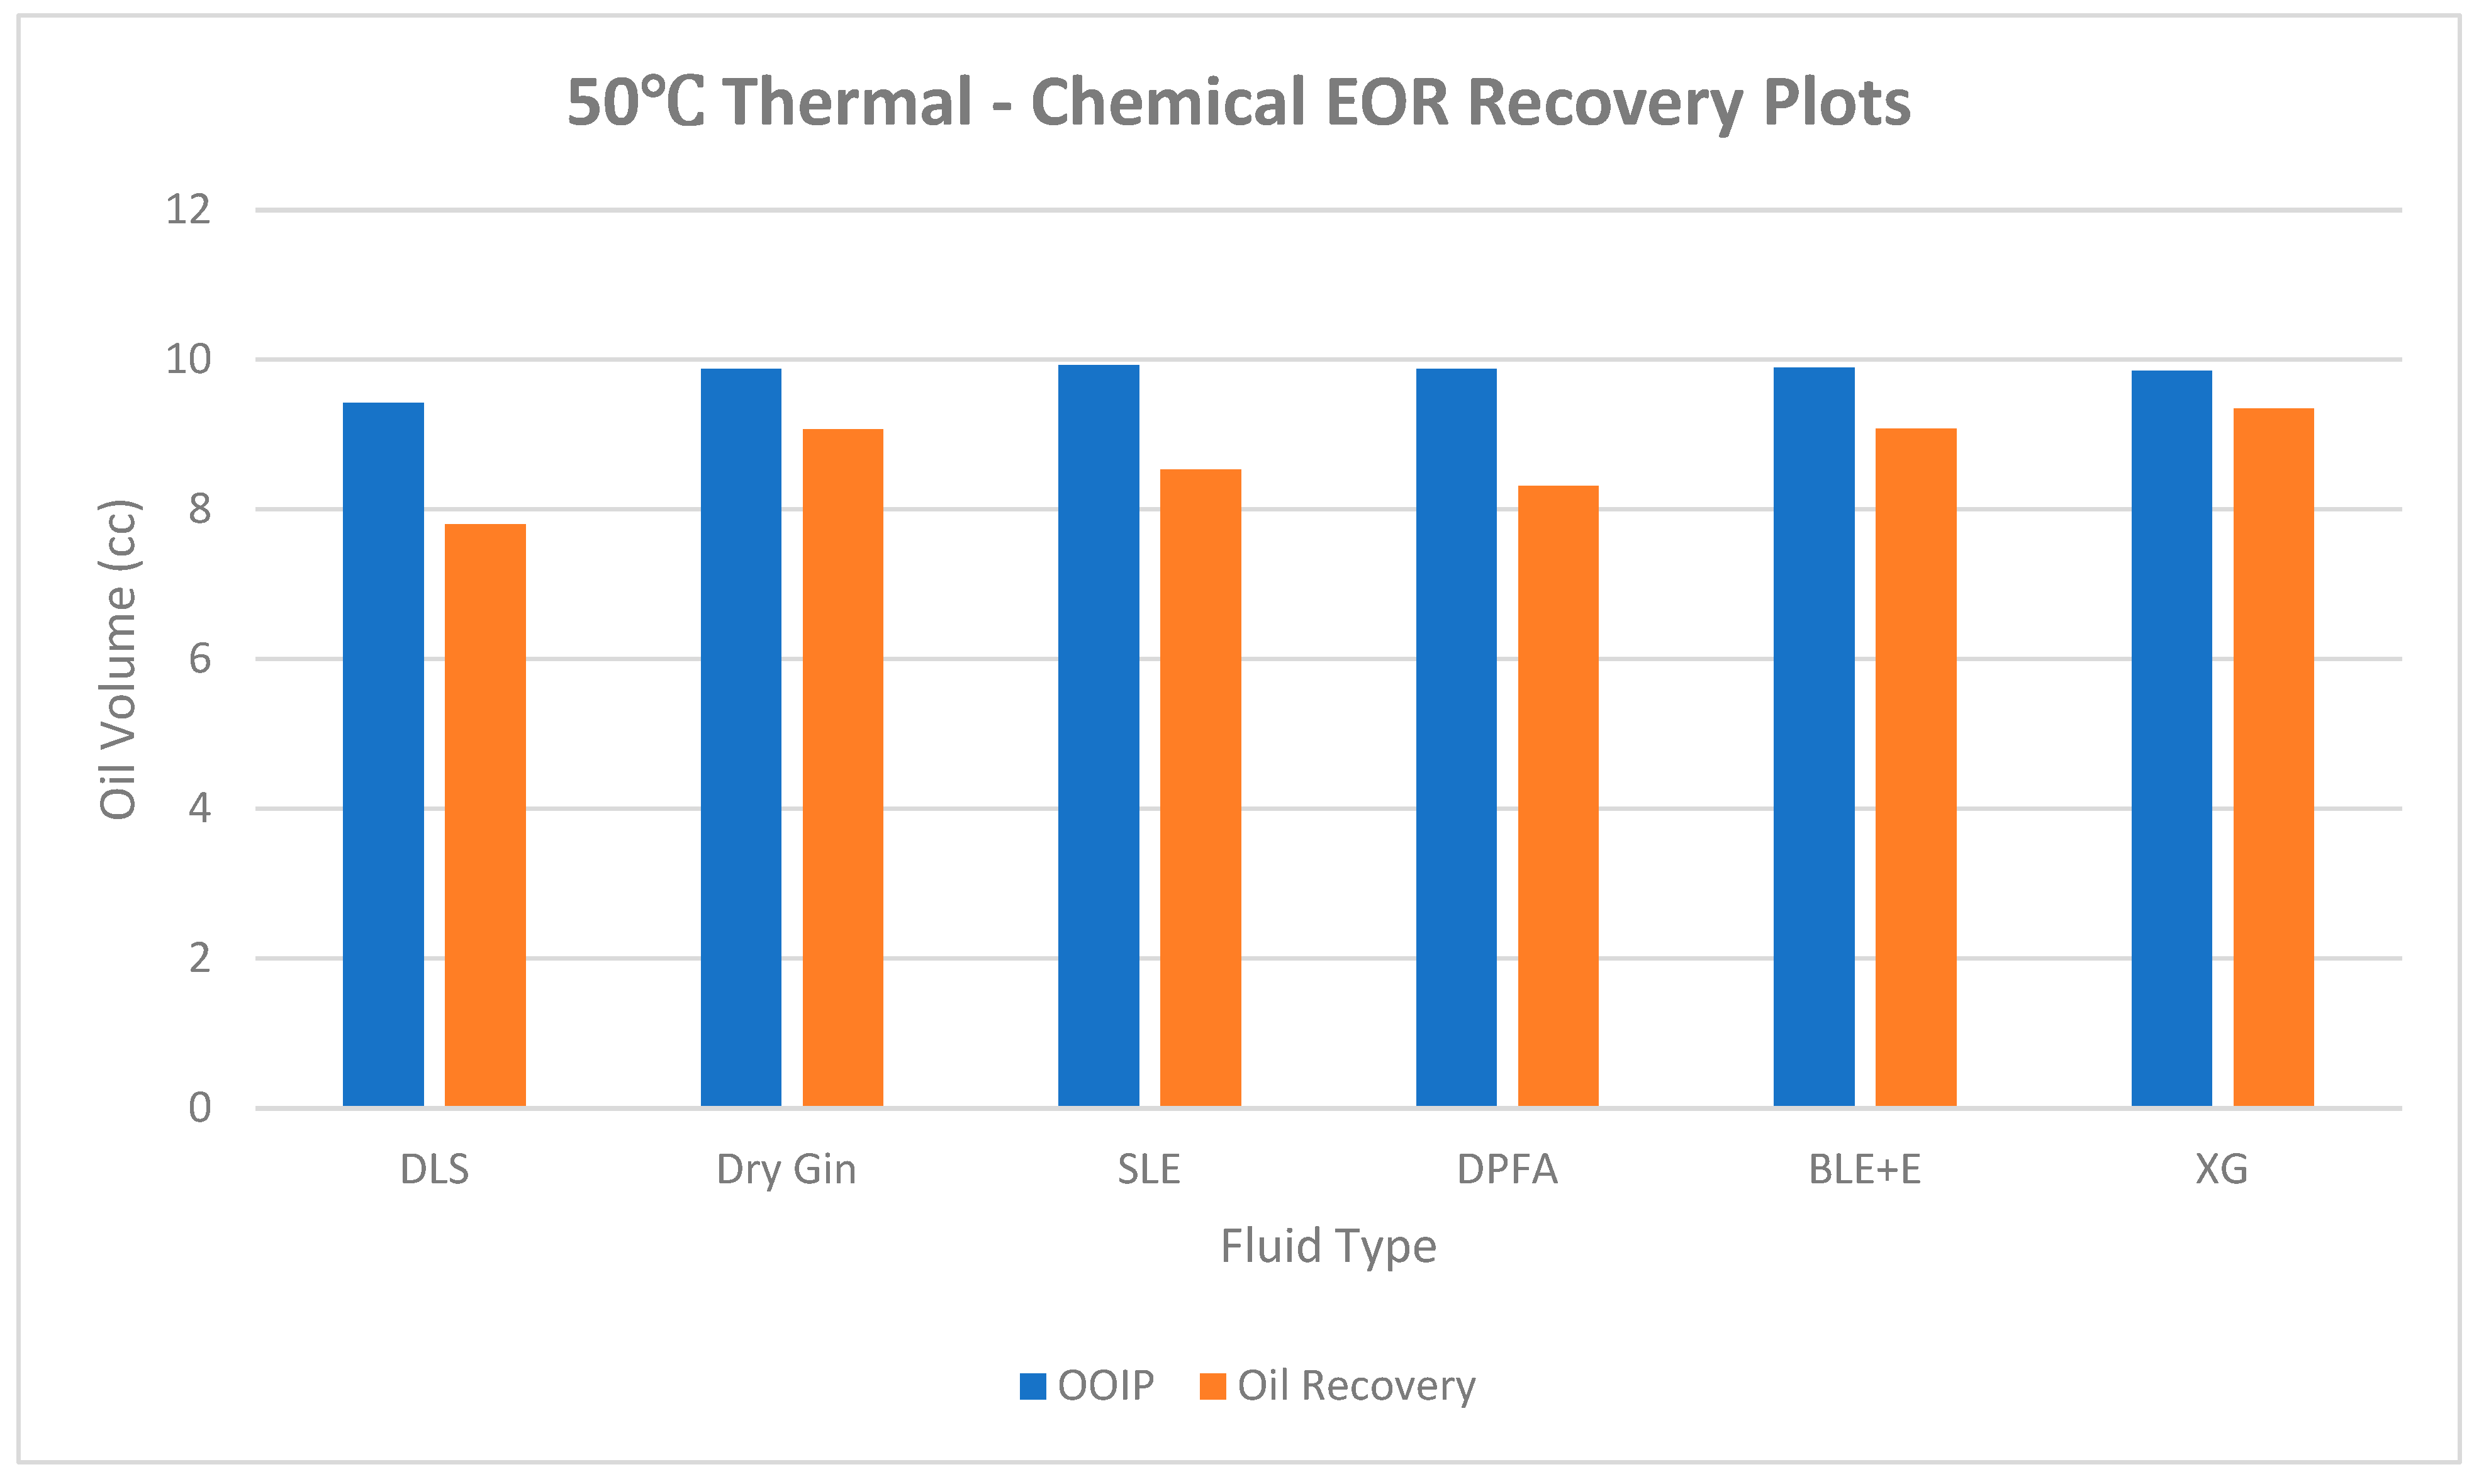
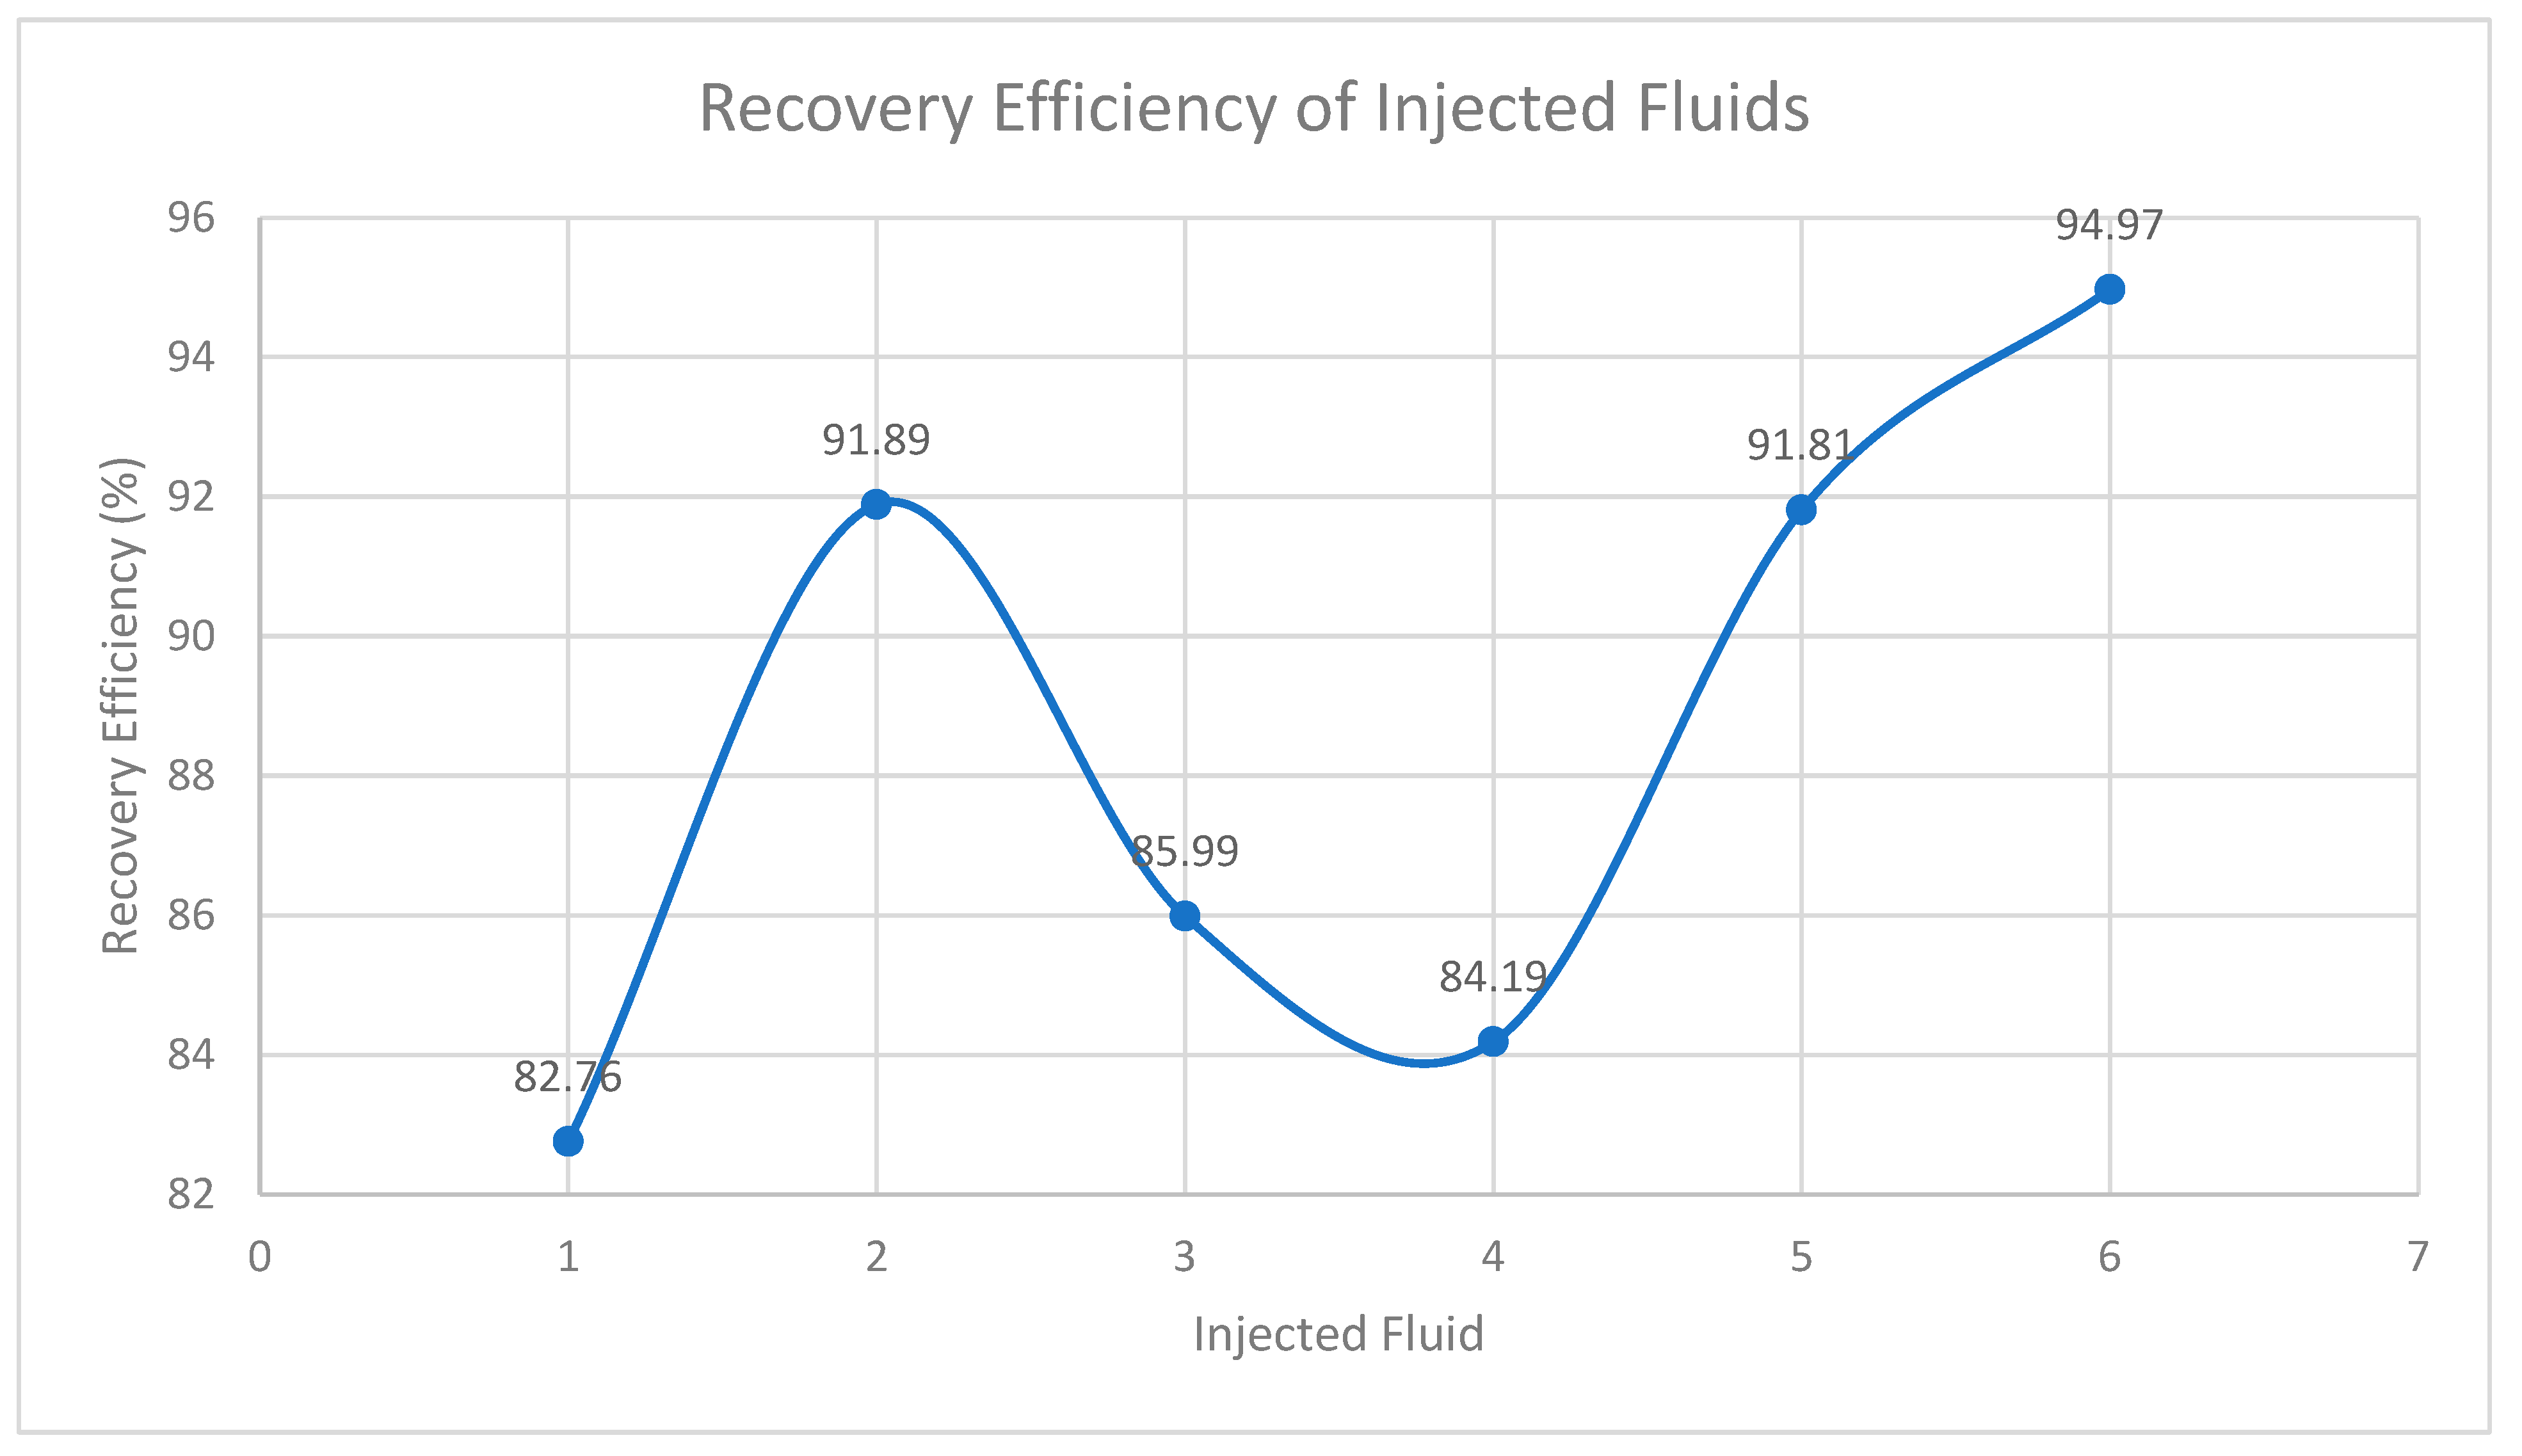
Figure 4.
Recovery Efficiency of fluid samples in Figure 4.1.
Figure 4.
Recovery Efficiency of fluid samples in Figure 4.1.
B. 80oC Thermal – Chemical Hybrid flood (CORE A)
This section gives the results of the total flooding process from imbibition to tertiary flooding when the chemical EOR fluid was heated to 80oC and the utilized core sample was Core A. Secondary recovery wasn’t conducted due to the density and viscosity of the crude oil sample. During the tertiary flood process, an overburden pressure of 1000 psi was used, and 1000 ml of hot chemical was introduced into the accumulator.
Table 8.
Core Flood results (80oC Heat addition).
| Tertiary Recovery | ||||||||
|
Sample Name |
BP |
FR (ml/min) |
(psi) |
PV (cc) |
OOIP (cc) |
Oil Recovered (ml) |
RE (%) |
|
| DLS (core B) |
86 | 95.00 | 0.56 | 13.92 | 10.02 | 3.90 | 9.25 | 92.31 |
| DG | 84 | 95.69 | 0.55 | 13.92 | 9.89 | 4.03 | 9.53 | 96.36 |
| SLE | 86 | 96.24 | 0.57 | 13.92 | 9.84 | 4.08 | 9.16 | 93.04 |
| DPFA | 86 | 61.60 | 0.60 | 13.92 | 9.83 | 4.09 | 9.10 | 92.57 |
| BLE + E | 83 | 83.00 | 0.56 | 13.92 | 9.86 | 4.06 | 9.09 | 92.19 |
| XG | 85 | 60.38 | 0.66 | 13.92 | 9.92 | 4.00 | 9.71 | 97.89 |
| DG + DPFA | 85 | 82.17 | 0.59 | 13.92 | 9.89 | 4.03 | 9.56 | 96.69 |
Figure 5.
Graph of OOIP and Oil Recovery for the Fluid samples at 50
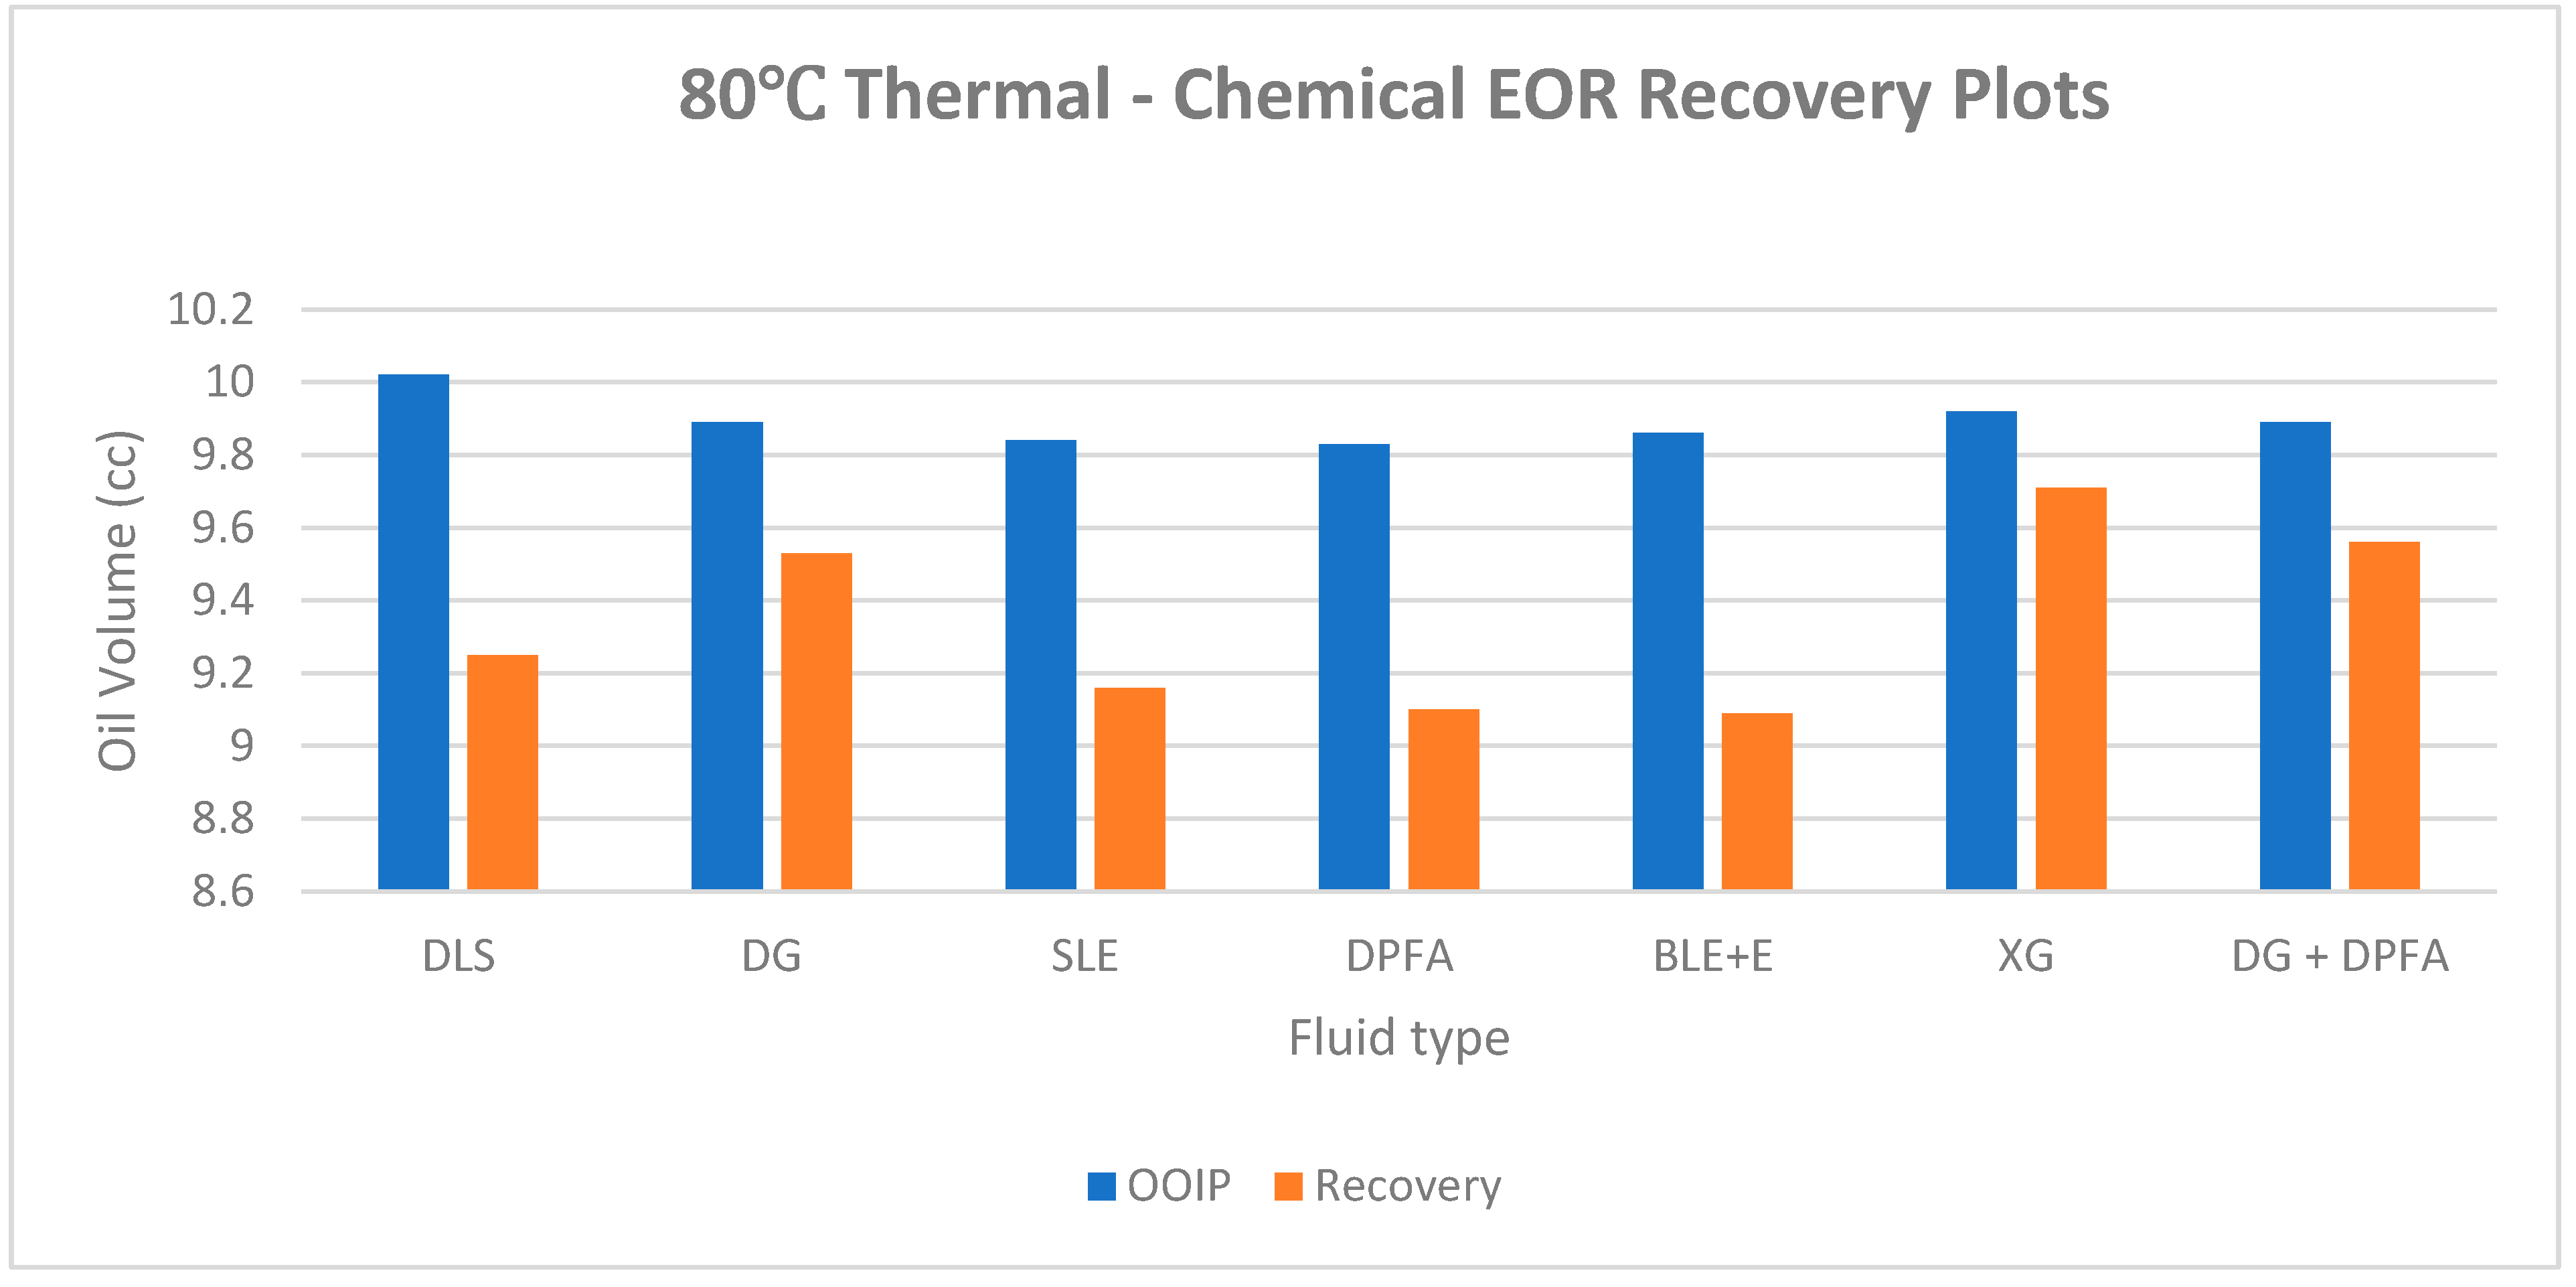
Figure 6.
Recovery Efficiency of fluid samples in Figure 4.3.
Figure 6.
Recovery Efficiency of fluid samples in Figure 4.3.
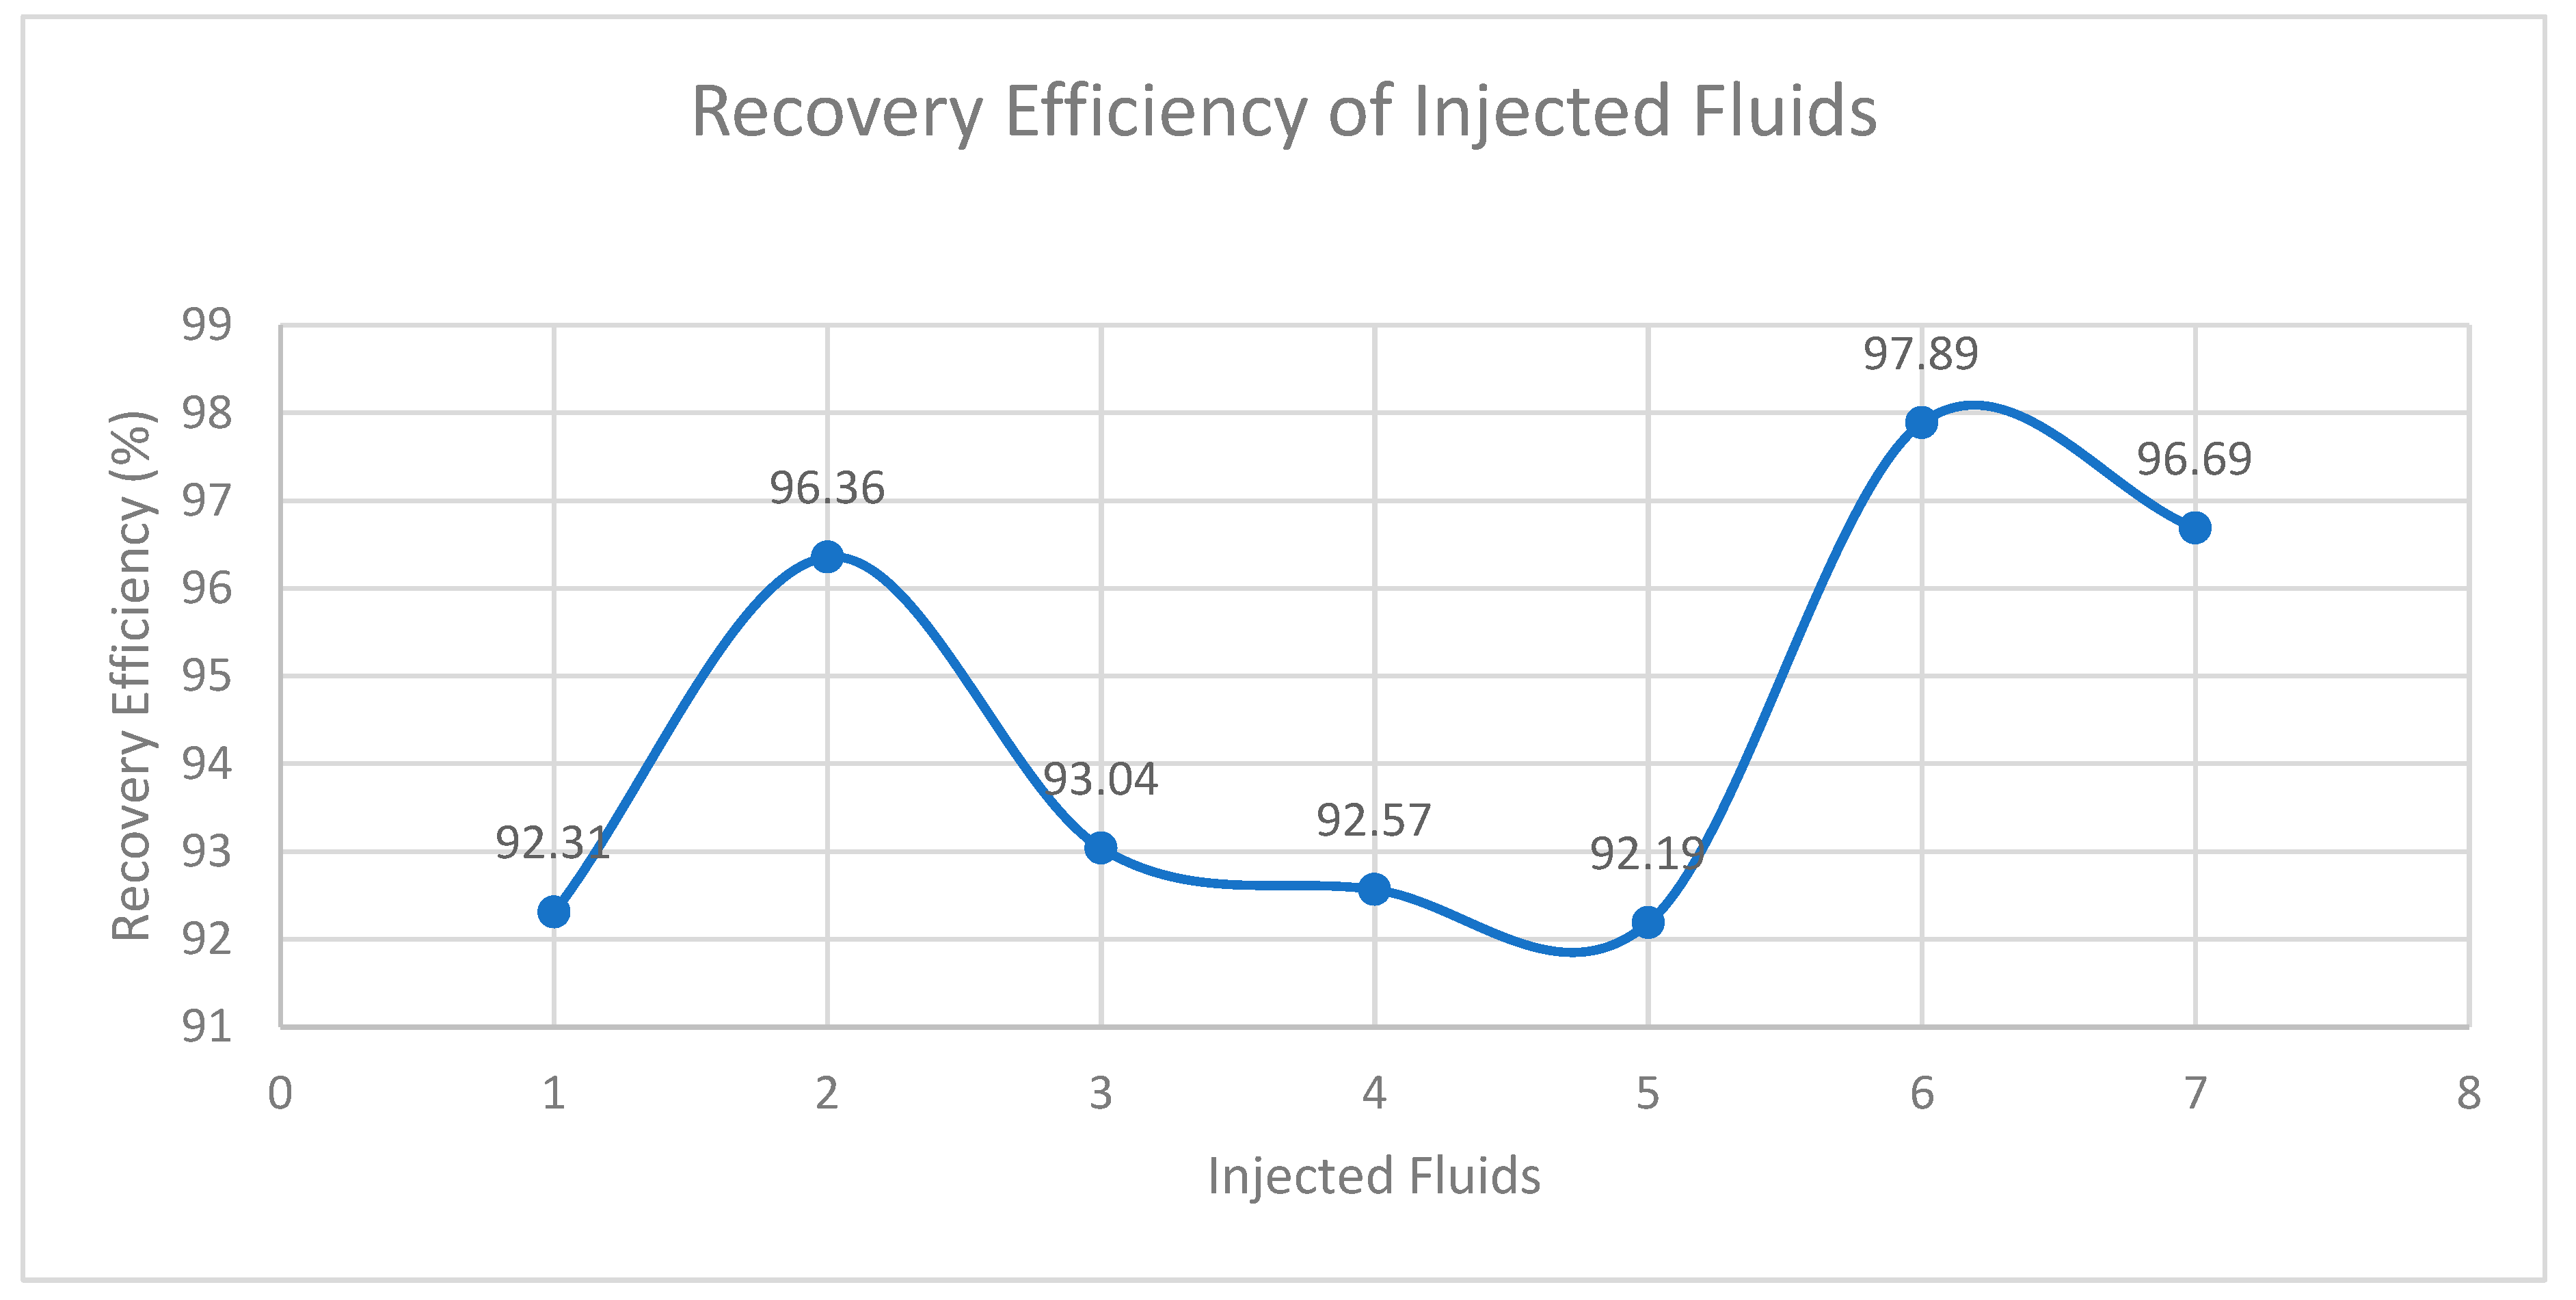
Figure 7.
80oC vs 50oC Chemical injection Oil Recovery efficiency comparison.
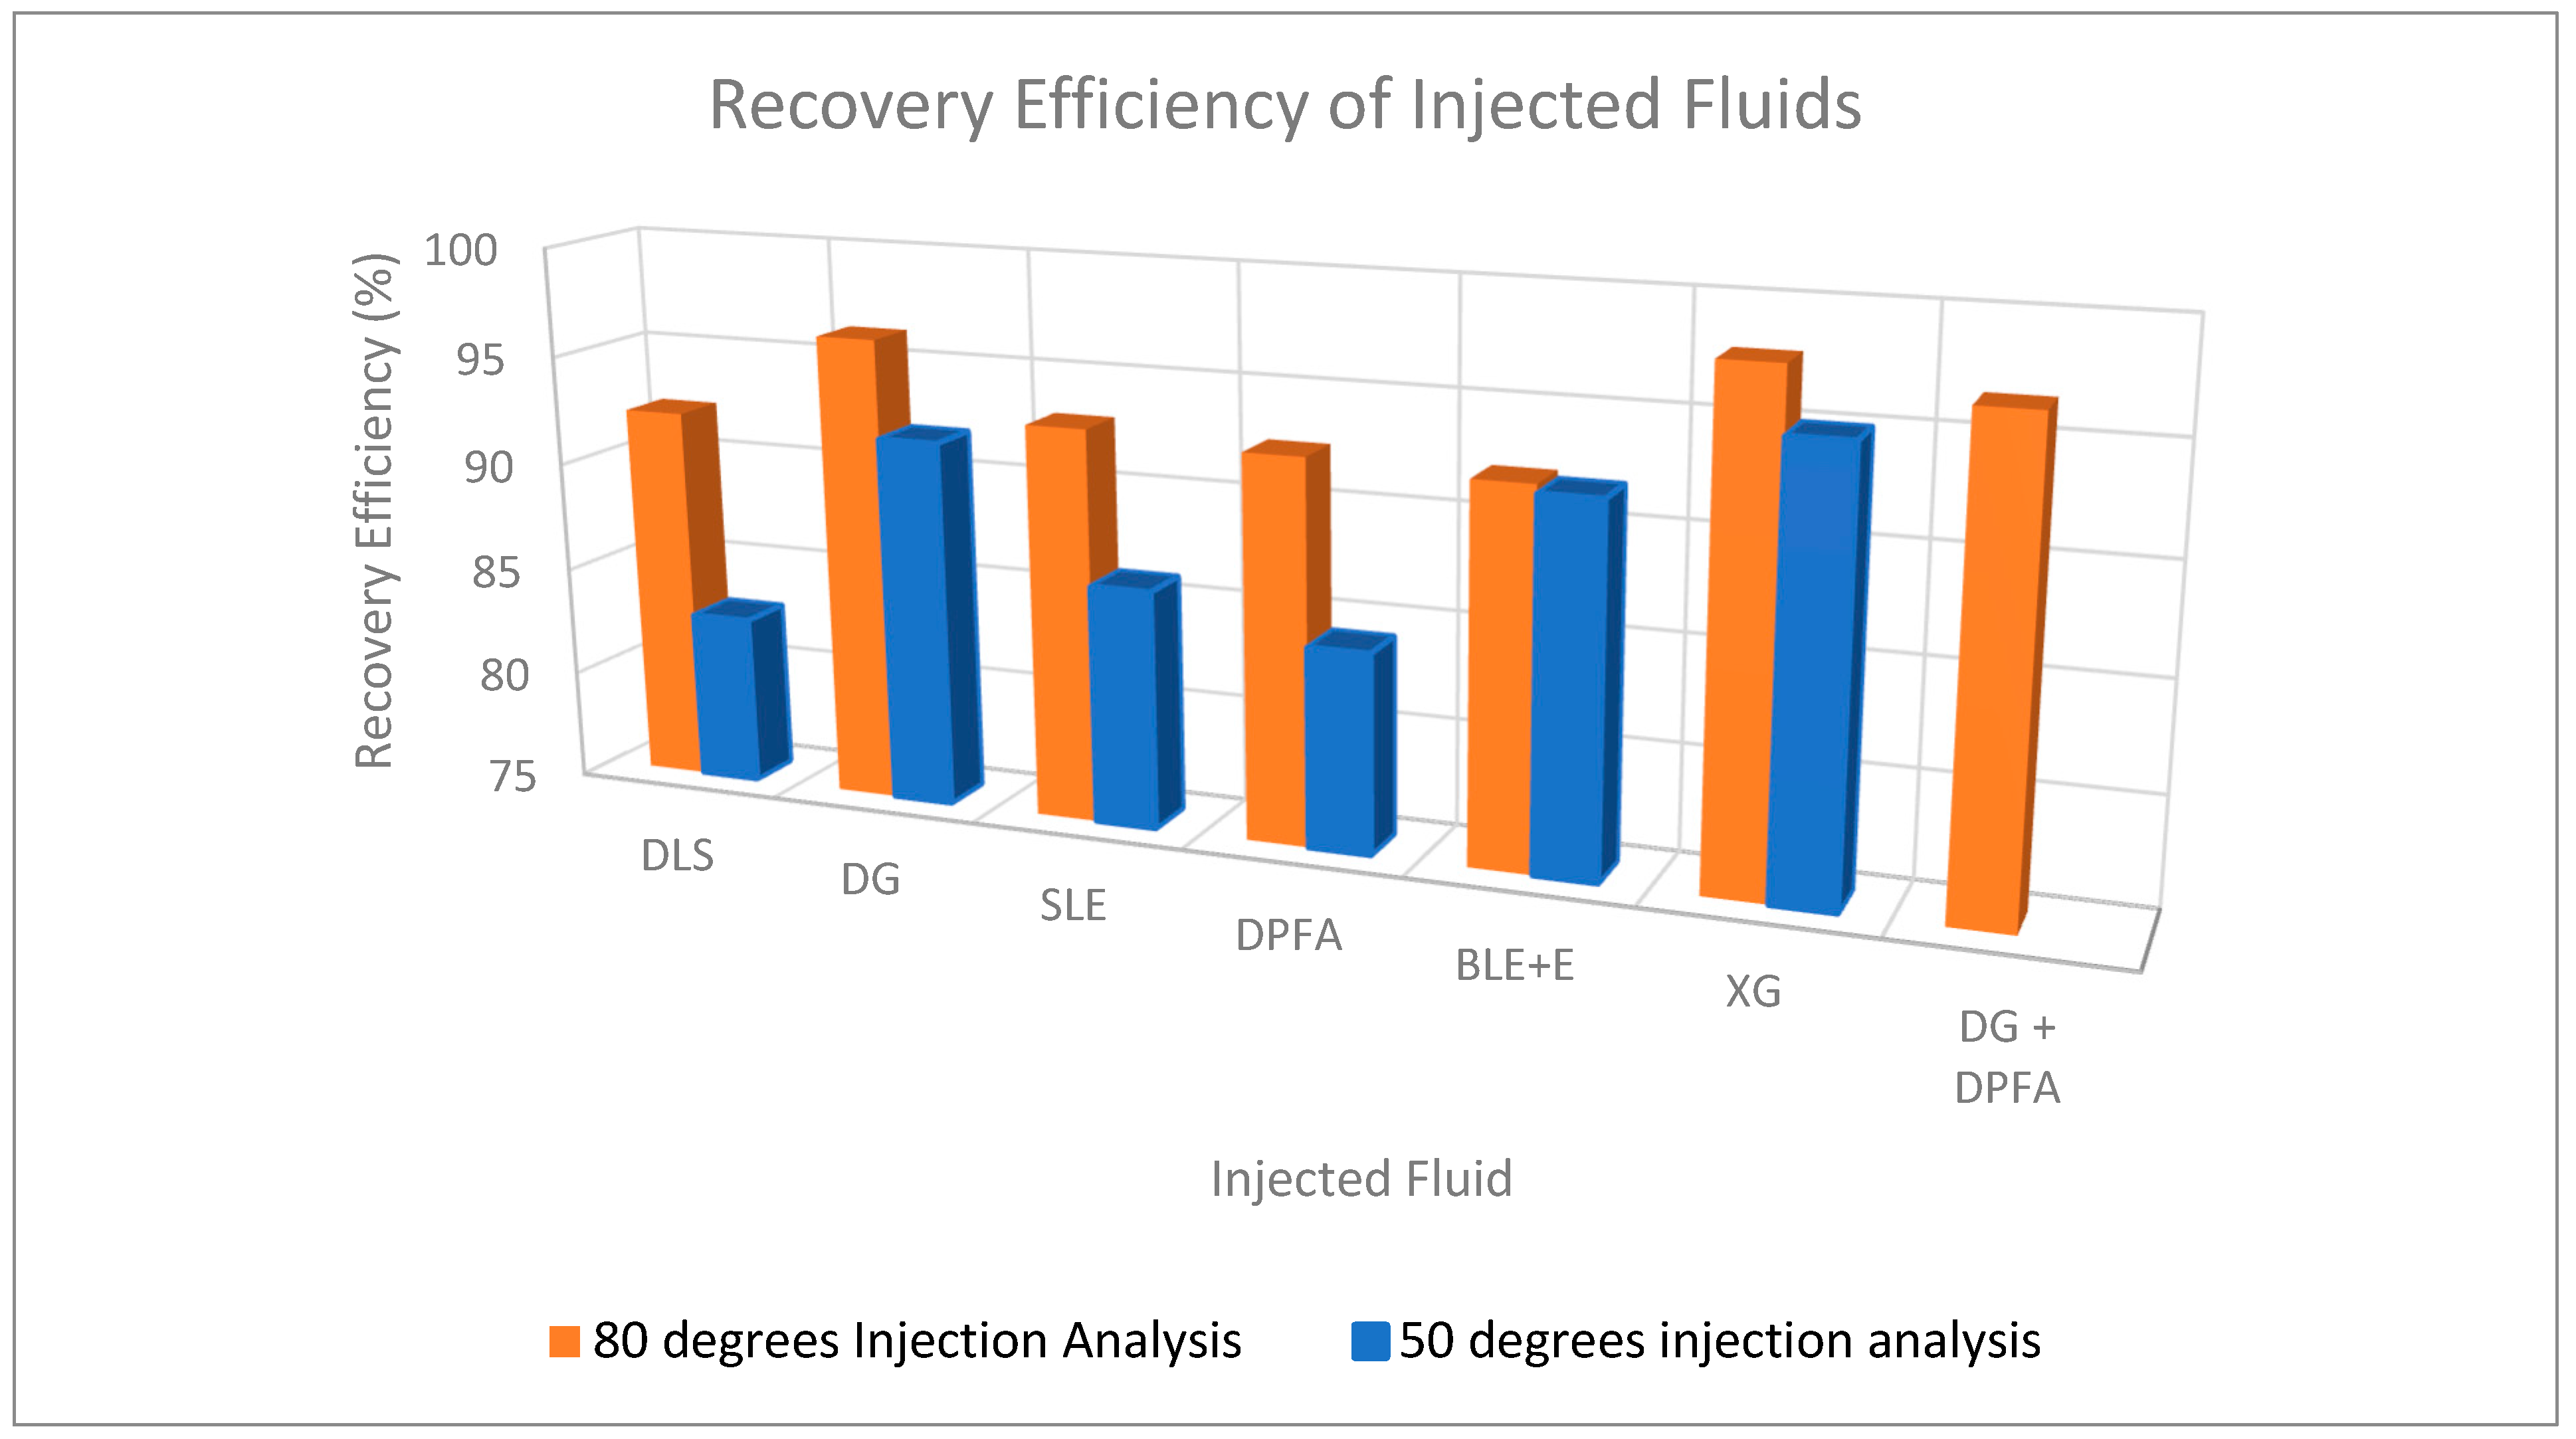
From the thermal-chemical flooding results, at 50oC, dissolved liquid soap was seen to be the worst-performing fluid out of the six fluids tested, and Xanthan gum, which works on the mobility ratio reduction mechanism, was seen to be the best-performing fluid. When the heat level was
increased to 80oC, Xanthan gum also performed the best, followed closely by the the alkali-surfactant mix, and the bitter-leaf extract concentration slightly performed the worst, with 92.19% oil recovery. This gives insights into the potential capabilities of these hot fluids in recovering a substantial amount of heavy crude from the reservoir.
C. Steam Flood Results (Core A)
This section gives the injected steam properties, and the oil recovery results as a
result of Steam flooding through the core sample A.
Table 9.
Injected Steam Properties.
| Steam Injection Pressure (psi) | Steam Injection Temp. (oC) |
Steam Injection rate (ml/min) |
Steam Quality (%) |
Heat of Steam (btu/lb) |
Heat Injection Rate (btu/hr) |
| 100 | 120 | 135 | 60 | 850 | 14320.80 |
Table 10.
Steam Flood results.
|
Fluid Name |
Temp (oC) |
FR (ml/min) |
(psi) |
PV (cc) |
OOIP (cc) |
Oil Recovered (ml) |
RE (%) |
|
| Hot Water | 50 | 79.00 | 0.49 | 13.92 | 9.92 | 4.00 | 6.94 | 69.96 |
| Hot Water | 80 | 115.00 | 0.51 | 13.92 | 9.83 | 4.09 | 7.37 | 74.97 |
| Steam | 120 | 135.00 | 0.56 | 13.92 | 9.86 | 4.06 | 9.66 | 97.97 |
Figure 8.
Graph of OOIP and Oil Recovery for varying hot water/steam temperatures.
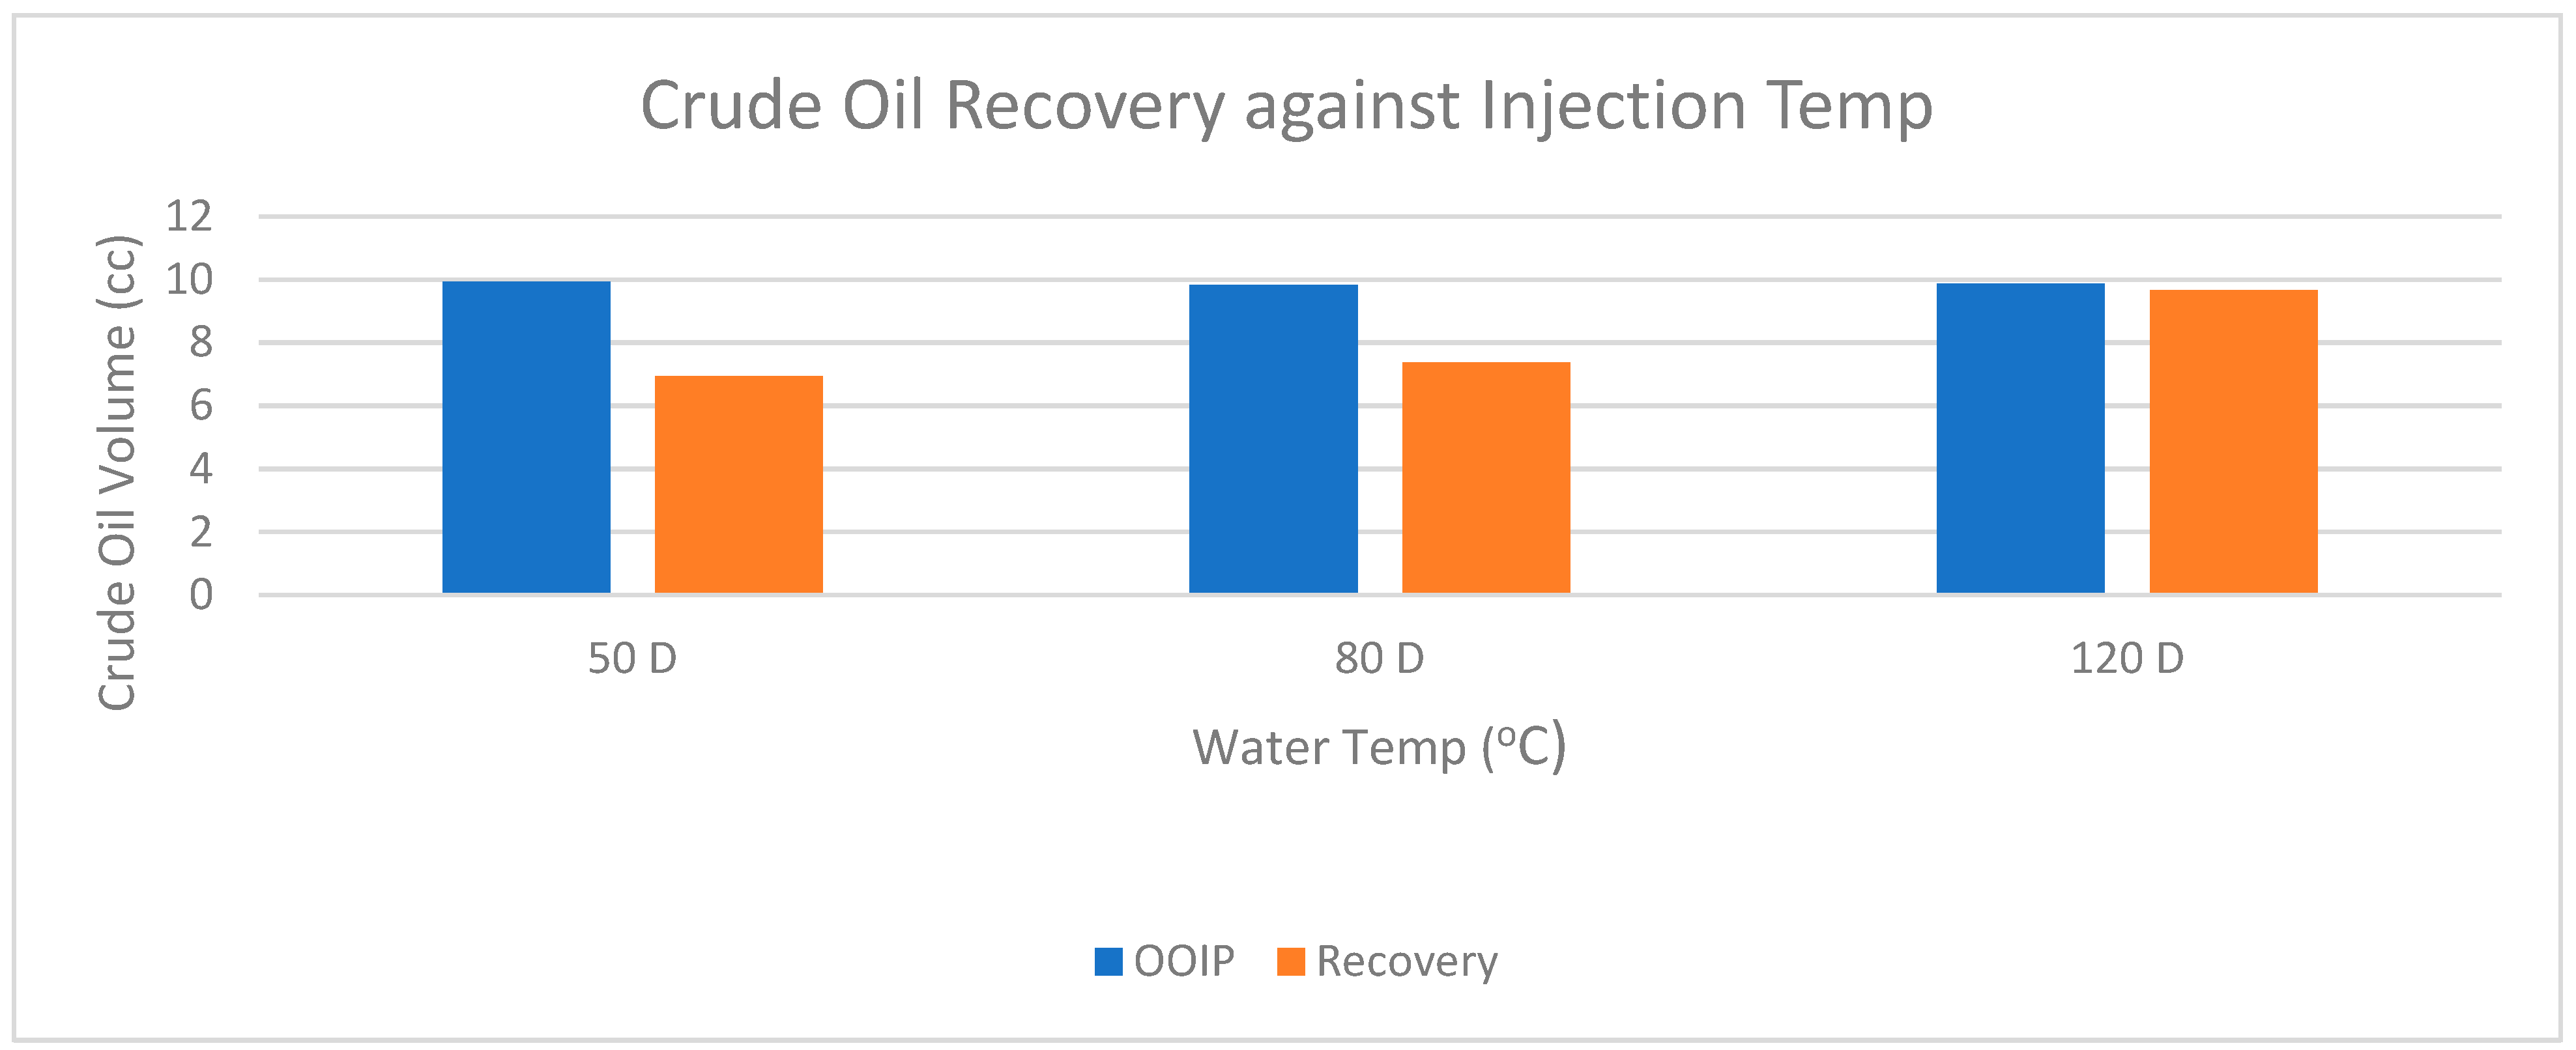
Steam flooding was seen to give poor results compared to hot chemical flood, when analyzing
the recovery at 50oC and 80oC, and also incurred the highest energy costs, which would affect the
overall economic balance of the project. The overall study shows that the thermal-chemical flood
system is a more economical alternative to the conventional steam flooding system as it provides a
higher recovery factor than steam (hot water) flooding at lower temperatures and with closely related
operating costs.
Fluid Injection Economic Analysis
Steam Injection Economic Analysis
Four economic indicators that would be employed in the analysis are:
- i.
- Net Present Value (NPV)
- ii.
- Net Present Value (NPV)
- iii.
- Net Present Value (NPV)
- iv.
- Net Present Value (NPV)
Key Assumptions:
- i.
- 1 barrel of oil = $50
- ii.
- The theoretical Heavy Oil field, has an OOIP of 5,000,000bbl.
- iii.
- 1BTU of energy = $0.0075154.
- iv.
- $1 = 891.04 NGN.
- v.
- A strong linear correlation between experimental prototypes production rate and on-field production rates
- vi.
- A production duration of 1 year.
- vii.
- Field scale steam flow rate (M) of 2917 kg/hr.
- viii.
- Energy content of a 150L (85% Butane, 15% Propane) LPG (E) = 4,064,440 BTU.
- iv.
- 150 Liters of LPG (85% Butane, 15% Propane) = 75kg.
Table 11.
Cost Analysis of the fabricated local Boiler (8.5 Litres).
| Steam Line | Valves | Thermometer | Pressure Gauge | Vessel | Furnace | Total | |
| CAPEX ($) | 15.21 | 8.34 | 17.20 | 11.22 | 50.13 | 35.02 | 137.12 |
Local Steam Boiler (Field scale) Economic Analysis
The Dataset used in developing upscaled Table 12 was obtained from Table 11 (laboratory scale). Analysis was done over a 1-year duration.
Table 12.
Hot water/Steam flood economic analysis.
|
T (oC) |
OOIP (bbl) |
OP (bbl) |
RR Bopd |
GR ($) |
LSG CAPEX ($) |
COE ($) |
REV ($) |
| 50 | 5 million | 762,277 | 2087 | 38,113,850 | 399,979 | 110,746 | 37,603,125 |
| 80 | 5 million | 1,108,169 | 3034 | 55,408,450 | 399,979 | 170,865 | 54,837,606 |
| 120 | 5 million | 1,302,116 | 3565 | 65,105,800 | 399,979 | 189,850 | 64,515,971 |
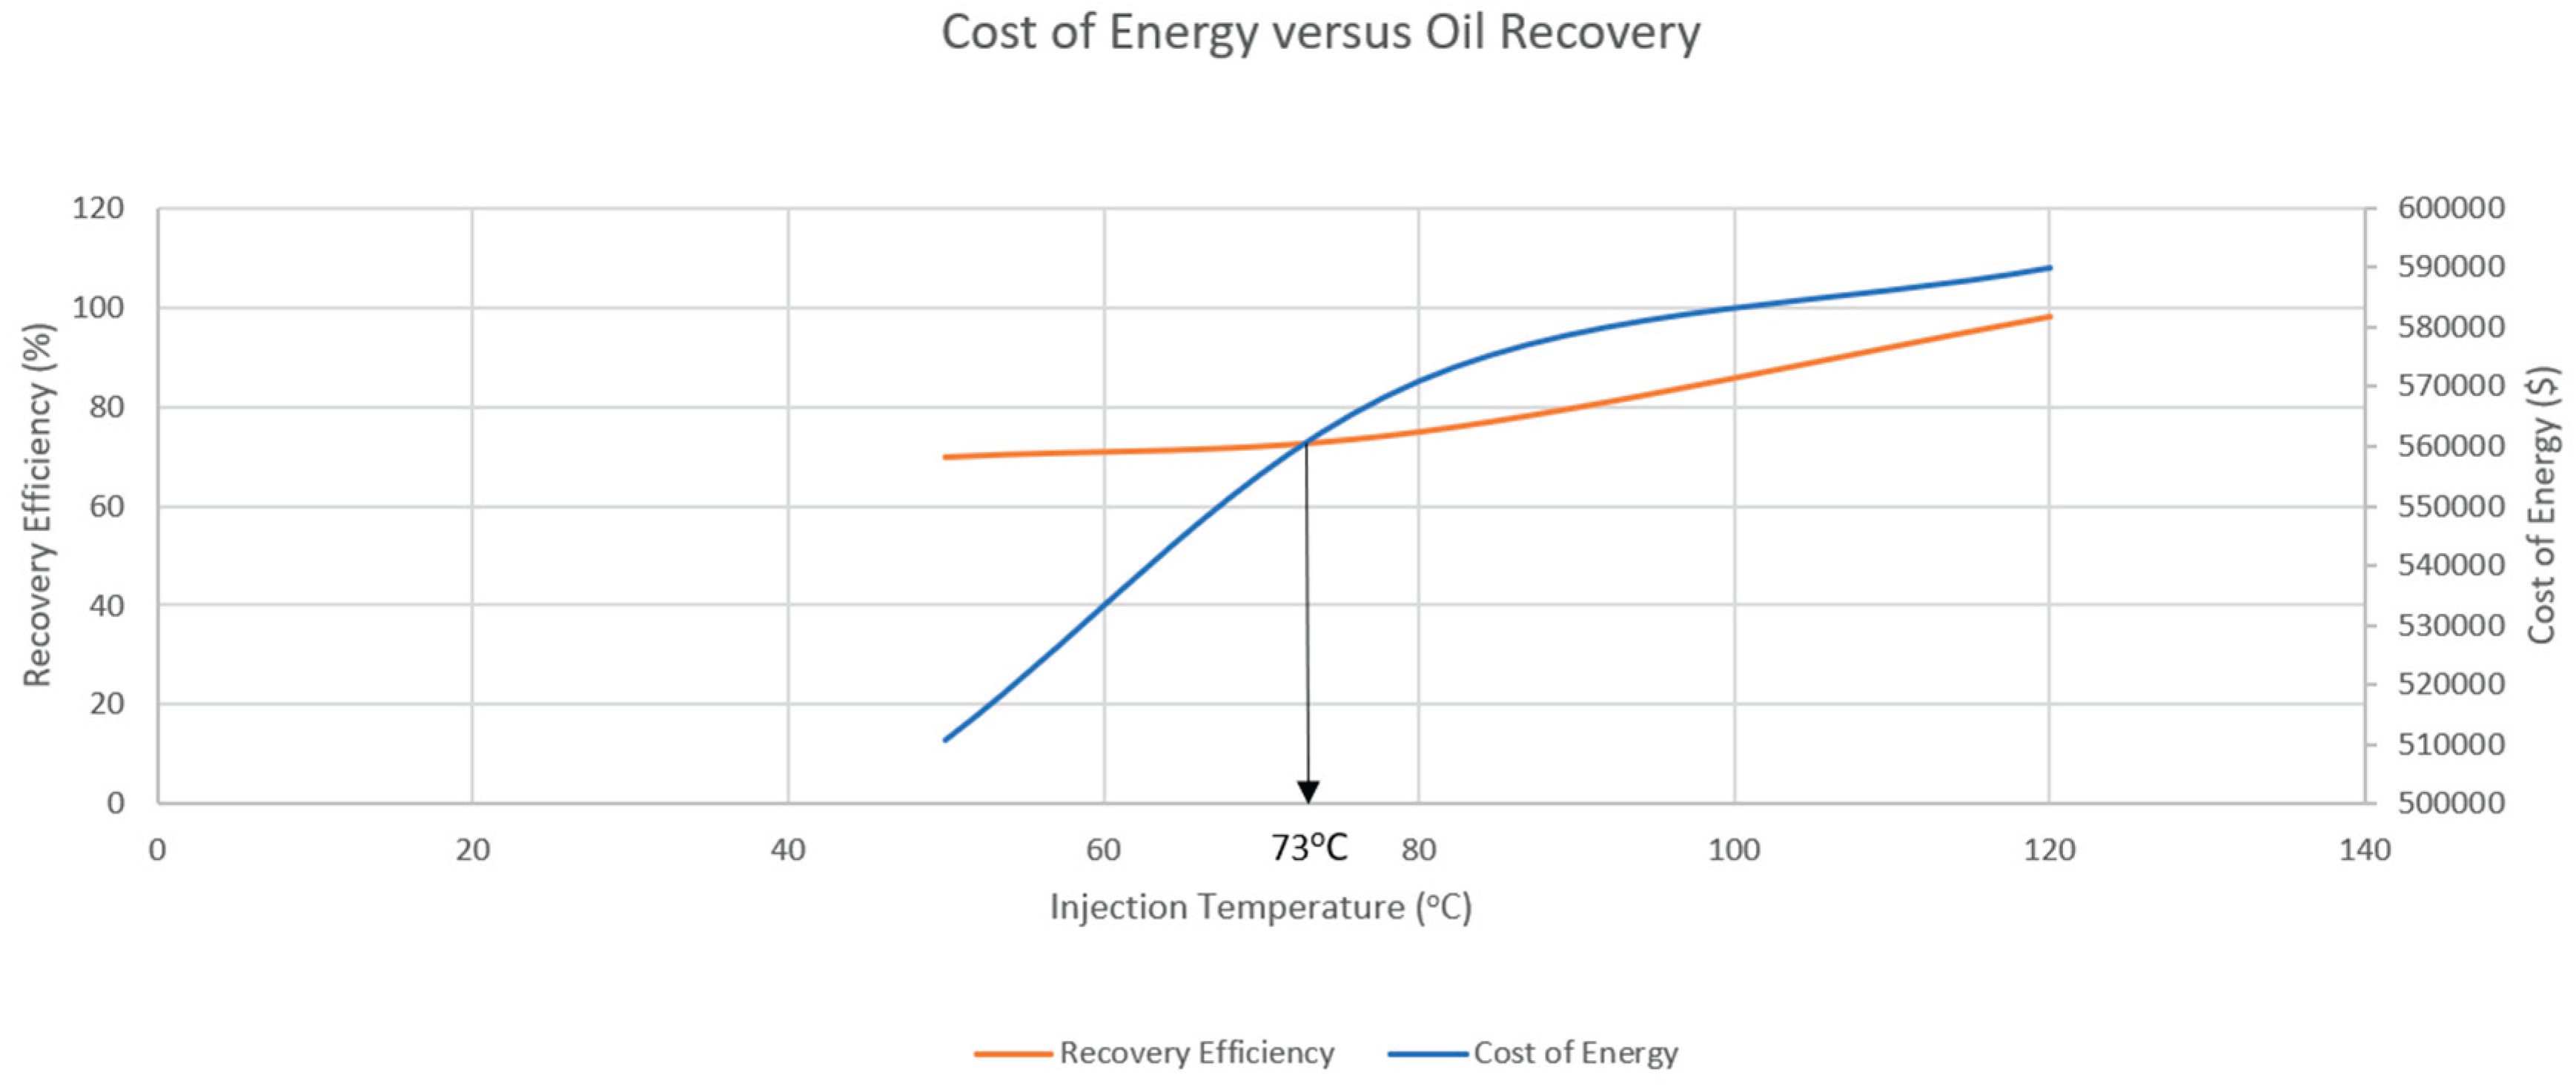
Figure 9.
Graph of RE & COE for varying hot water/steam temperatures.
Equations corresponding with the columns in Table 4.24:
where M = Field scale steam flow rate (kg/hr)
Cs = Lab scale local steam generator cost ($)
m = lab scale steam flow rate (kg/hr)
m = 1kg/hr (from experimental analysis)
Q is the cumulative energy produced (in BTU) over a duration t (hr).
E is the energy content of the field scale LPG powered furnace (150 L) = 4,064,440 BTU.
N is the prevailing market price of 75kg LPG in ($ / 75kg).
At an average gas price of NGN 1,500 / kg, we can estimate that the energy cost is about NGN 6.696 / BTU ($0.0075154/BTU).
Further Analysis at the Threshold Temperature of 73For the economical steam injection threshold of 73oC, the present values at various discounted rates for the 1year duration was analysed, and the DCF-ROR was estimated.
Table 13.
Optimal Temperature Economic Analysis.
| Temp (oC) | Oil Flowrate (bpd) |
Revenue ($) |
2% ($) |
50% ($) |
100% ($) |
| 73 | 2817.82 | 51,460,438 | 50,451,410 | 34,306,959 | 25,730,219 |
P/$ = = 90.15 (Expenses other than the total cost of steam generation was not factored).
Payout time = = 0.01859 years (6.764 days). (Other expenses not factored in).
The values gotten show that the cost of the local steam boiler was a little fraction compared to the value of heavy oil that is estimated to be obtained from the technique (2817.82 bpd) at the economic decision temperature, 73oC.
Chemical Fluid Injection Economic Analysis
- Alkali – Surfactant Flooding @73
Key Assumptions:
- i.
- 1 barrel of oil = $50.
- ii.
- The theoretical Heavy Oil field, has an OOIP of 5,000,000bbl.
- iii.
- 1BTU of energy = $0.0075154.
- iv.
- $1 = 891.04 NGN.
- v.
- Local market prices of agricultural feedstock as at march 2024.
- vi.
- A strong linear correlation between experimental prototypes production rate and on-field production rates.
- vii.
- A production duration of 1 year.
- viii.
- Field scale magnification of 2917.
- ix.
- Energy content of a 150L (85% Butane, 15% Propane) LPG (E) = 4,064,440 BTU.
- x.
- 150 Liters of LPG (85% Butane, 15% Propane) = 75kg.
- xi.
- Cost of a 1% vol – vol DG + DPFA (surfactant – alkali) solution in distilled water (1L) = $0.1.
- xii.
- Cost of a 75kg LPG = $126.23 ($1.68/kg)
Estimated specific heat capacity of the mixture (mathematical analysis)
SHC of Water =
SHC of Ethanol + Palm frond ash =
Density (Water, DG+DPBA) = (1, 1.07009)
Mass of a 10ml DG+DPBA in 1000ml Water = 1010.7009g
Mass fraction of water =
Mass fraction of DG + DPBA =
Weighted SHC = (0.9894*4.18) + (0.0106*2.46) = 4.162
Cost of Energy Estimation ($)
From equation 4.17, )
For a 1year duration;
.
Number of gas cylinders requirement (75kg) = 937.9.
Cumulative LPG cost = $118,391.12
CAPEX = $399,979.
Net Revenue Estimation ($)
.
The net revenue from hot DG + DPBA flooding at 73(significant threshold) supersedes the net revenue from hot water flooding alone (@73) by about 11.48%, thus implying a more profitable investment for heavy oil production.
Conclusion
The experimental analysis and economic evaluation of various enhanced oil recovery (EOR) methods highlight the superior performance and cost-effectiveness of hot chemical EOR compared to steam flooding for heavy oil recovery. The key findings are summarized as follows:
1. Hot chemical EOR proved to be a more economical alternative to steam flooding, primarily due to lower energy requirements and higher efficiency at lower temperatures.
2. Steam flooding showed an exponential increase in energy costs for linear production increments, making it less economically viable.
3. The optimal temperature for hot water flooding was identified as 73°C, with 90+% of the tested hot chemicals having better recoveries at that temperature.
4. The amount of residual oil left post-flooding was independent of the initial oil saturation and viscosity, indicating the robustness of the hot chemical EOR process.
5. More viscous hot chemicals yielded the highest recovery values, emphasizing the importance of chemical properties in EOR.
6. The rate of heavy oil production in hot chemical flooding was primarily influenced by the injection rate, pressure, temperature, chemical properties, and rock petrophysical properties.
7. A net revenue increase of approximately 11.48% was achieved with DG + DPBA flooding compared to hot water alone, at the economic temperature of 73°C.
Acknowledgement: A heartfelt appreciation is reserved for God almighty, for his inspiration and guidance throughout the course of this research study. I also wish to appreciate the University of Port Harcourt, Nigeria, for their technical support during the conduction of the experimental analysis. My heartfelt appreciation is also extended to the editorial team of Improved Oil and Gas Recovery Journal, for their top-tier suggestions, in order to obtain a high-quality research paper.
Conflicting Interests: The Author declares that he has no conflicting interests.
Nomenclature
BLE + E = Bitter Leaf extract + Ethanol
BP = Boiling Point
BTU = British Thermal Unit
CAPEX = Capital Expenditures
COE = Cost of Energy
DCF-ROR = Discounted Cash flow Rate of Return
DG = Dry Gin.
DLS = Dissolved Liquid Soap
DPFA = Dissolved Palm Frond Ash
EOR = Enhanced Oil Recovery
FR = Flow Rate
GR = Gross Revenue
LPG = Liquefied Petroleum Gas
LSG = Local Steam Generator
MR = Max Recovery
OOIP = Original Oil in Place
OR = Oil Recovery
PV = Pore volume
RE = Recovery Efficiency
REV = Revenue.
RR = Recovery Rate
SLE = Scent Leaf extract (Nchanwu)
XG = Xanthan Gum
References
- Orodu, O.D.; et al. Enhanced oil recovery using locally sourced materials in Nigeria. Journal of Petroleum Science and Engineering 2021, 204, 108745. [Google Scholar]
- Thomas, S. Enhanced oil recovery—an overview. Oil & Gas Science and Technology–Revue d’IFP Energies nouvelles 2008, 63, 9–19. [Google Scholar]
- Manrique, E.J.; et al. EOR: Current status and opportunities. SPE Reservoir Evaluation & Engineering 2007, 10, 669–686. [Google Scholar]
- Sheng, J.J. Enhanced Oil Recovery Field Case Studies. Gulf Professional Publishing, 2013.
- Green, D.W. , and Willhite, G.P. Enhanced Oil Recovery, 1998. [Google Scholar]
- Kumar, M.; et al. “Economic evaluation of steam injection projects.” Journal of Canadian Petroleum Technology 41.11 (2002).
- Kokal, S.; Al-Kaabi, A. Enhanced oil recovery: Challenges & opportunities. World Petroleum Council Journal 2010, 62, 64–70. [Google Scholar]
- Sheng, J.J. Status of surfactant EOR technology. Petroleum 2018, 4, 1–11. [Google Scholar] [CrossRef]
- Gupta, R. , and Trivedi, J.J. A comprehensive review on chemical enhanced oil recovery. Journal of Petroleum Exploration and Production Technology 2018, 8, 1241–1250. [Google Scholar]
- Kumar, M.; et al. Polymer flooding: Performance of various polymers under harsh reservoir conditions. SPE Journal 2009, 14, 478–484. [Google Scholar]
- Hirasaki, G.J.; Zhang, D.L. Surface chemistry of oil recovery from fractured, oil-wet, carbonate formations. SPE Journal 2004, 9, 151–162. [Google Scholar] [CrossRef]
- Manrique, E.J.; et al. EOR: Current status and opportunities. SPE Reservoir Evaluation & Engineering 2007, 10, 669–686. [Google Scholar]
- Levitt, D.B.; et al. The rheological properties of polymer solutions used for chemical flooding. SPE Journal 2009, 14, 282–294. [Google Scholar]
- Donato, A.R.; et al. Economic evaluation of enhanced oil recovery projects. SPE Reservoir Evaluation & Engineering 2008, 11, 149–157. [Google Scholar]
- Alvarado, V. , and Manrique, E. Enhanced oil recovery: An update review. Energies 2010, 3, 1529–1575. [Google Scholar] [CrossRef]
- Orodu, O.D.; et al. Enhanced oil recovery using locally sourced materials in Nigeria. Journal of Petroleum Science and Engineering 2021, 204, 108745. [Google Scholar]
- Akpan, E.U.; Udoh, F.D. Local materials for enhanced oil recovery: A case study in Nigeria. Journal of Petroleum Exploration and Production Technology 2020, 10, 1205–1216. [Google Scholar]
- Al-Jawad, M.S.; et al. The impact of using local materials on the economics of enhanced oil recovery projects. Petroleum Science and Technology 2015, 33, 212–220. [Google Scholar]
- Lake, L.W.; Walsh, M.P. Enhanced Oil Recovery. Prentice Hall, 2010.
- Thomas, S. Enhanced oil recovery: An overview. Oil & Gas Science and Technology 2008, 63, 9–19. [Google Scholar]
- Awan, A.R.; et al. “Recent developments in chemical EOR: An overview. ” Journal of Petroleum Science and Engineering 2007, 58, 105–114. [Google Scholar]
Figure 1.
Core Flood set – up (Chemical).
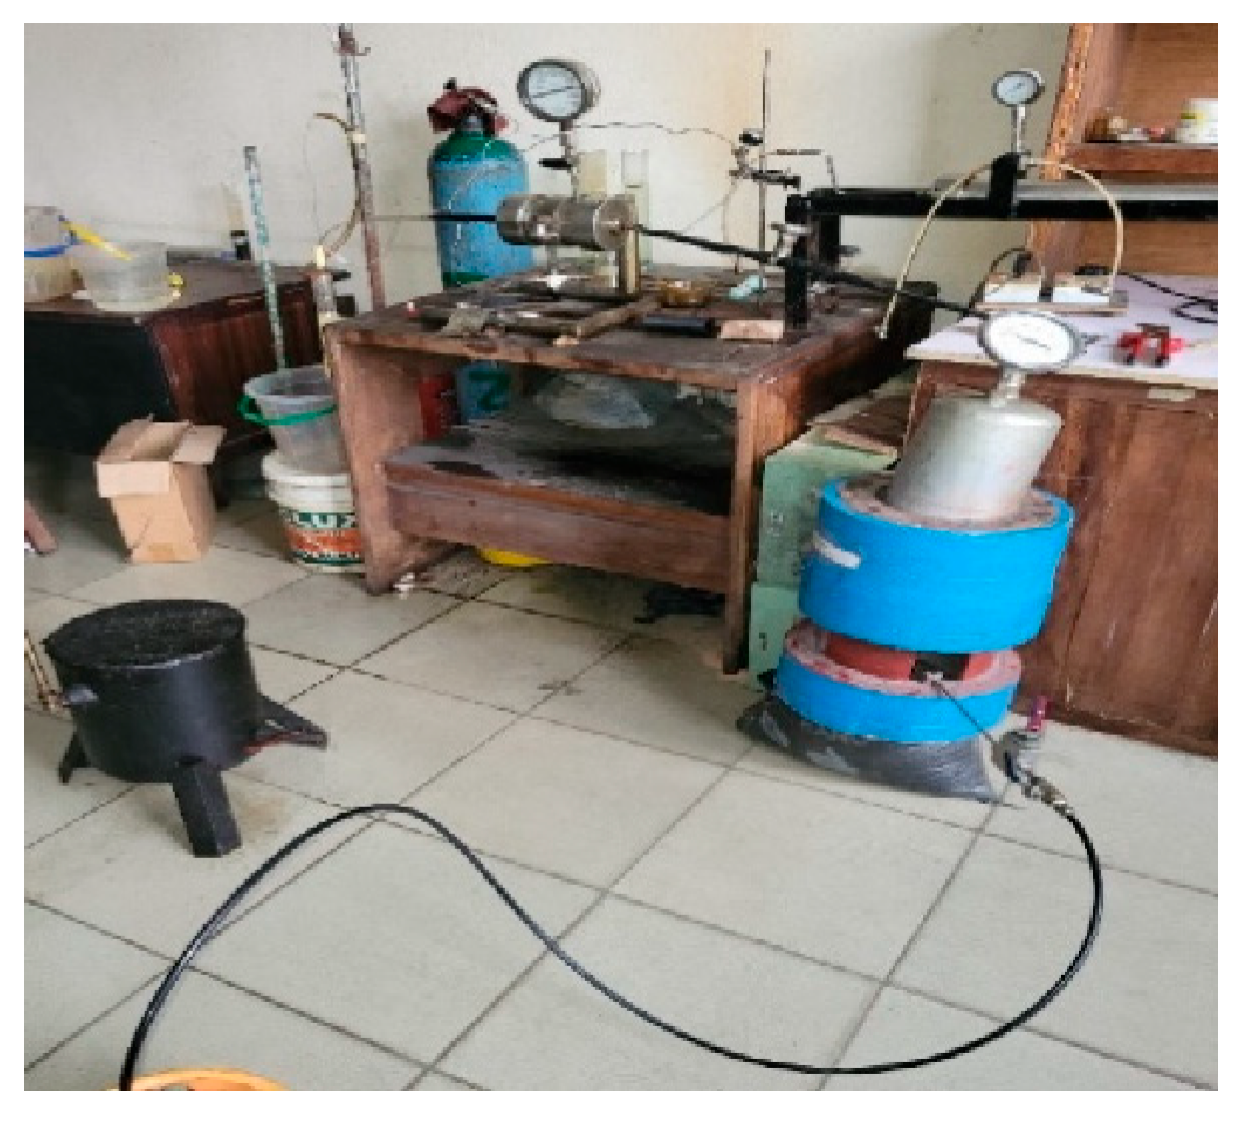
Figure 2.
Core Flood set – up (Steam).
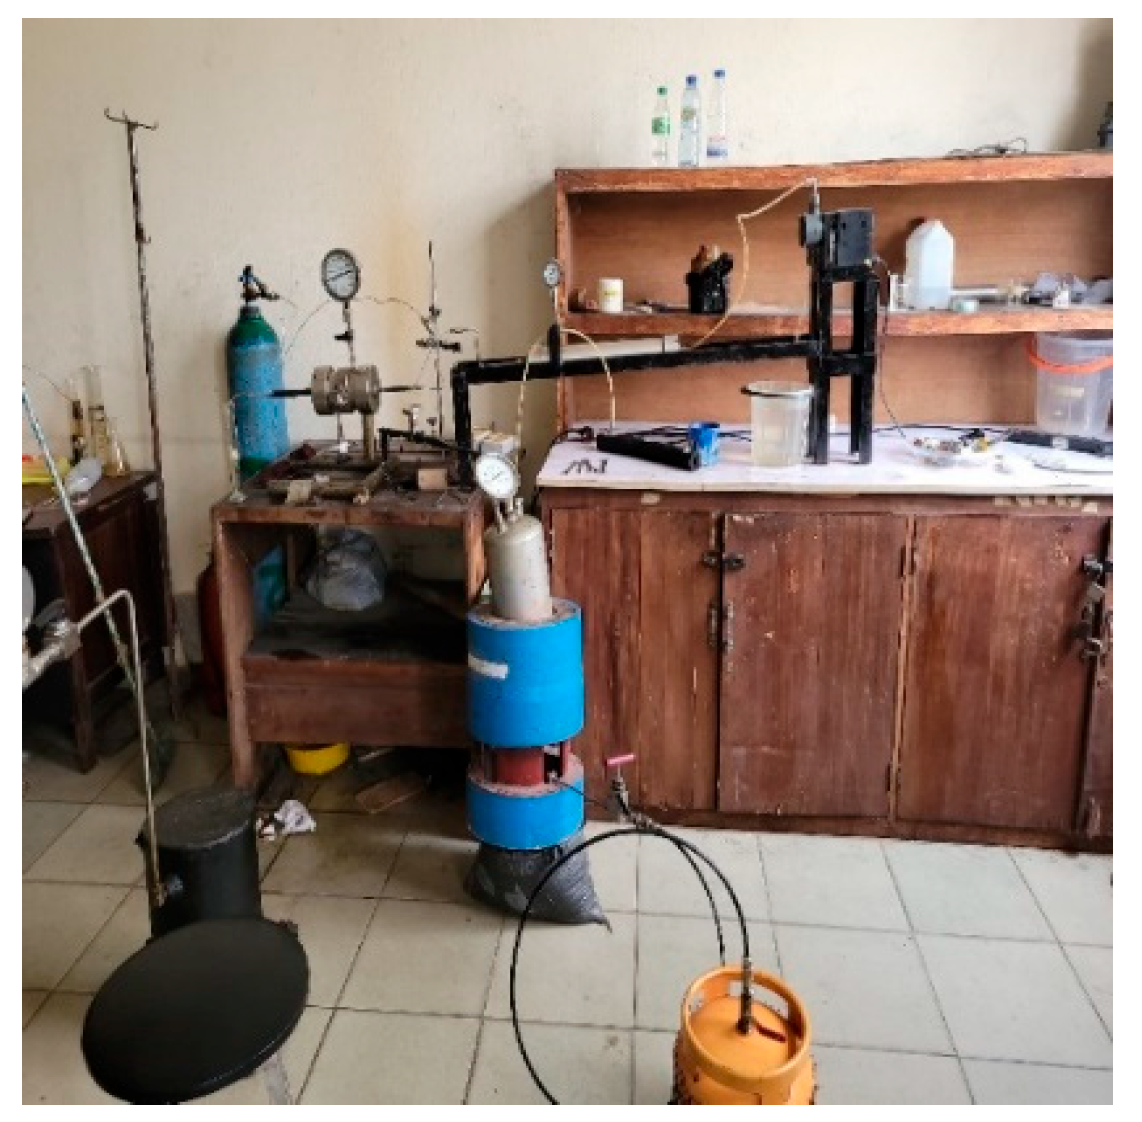
Table 1.
Experimental results for the Bulk Volume and Density of the Core samples.
| Core ID | Core Length (cm) | Core Diameter (cm) | Bulk Volume (cm3) | Dry Weight (g) | Core Density (g/cc) | Rock Type |
|---|---|---|---|---|---|---|
| A | 5.751 | 3.753 | 63.51 | 132.64 | 2.09 | Sandy-Shale |
| B | 5.585 | 3.812 | 63.74 | 115.39 | 1.81 | Sandy-Shale |
Table 2.
Experimental results for the Rock petrophysical parameters.
| Core ID | Saturated Weight (g) | Pore Volume (cm3) | Porosity (%) | Core Permeability (mD) | |
|---|---|---|---|---|---|
| A |
145.74 | 12.84 | 20.22 | 60.28 | 1.50 |
| B |
129.59 | 13.92 | 21.83 | 79.93 | 1.53 |
Table 5.
EOR fluids calculated Densities.
| Sample Name | Empty DB weight (g) | DB + Water weight (g) | DB + Fluid weight (g) | Relative Fluid Density | Fluid Density (kg/m3) |
|---|---|---|---|---|---|
| DLS | 22.89 |
79.42 | 79.44 | 1.0003 | 1000.30 |
| BLE + E | 22.89 | 79.42 |
79.35 | 0.9988 | 999.80 |
| SLE | 22.89 | 79.42 |
79.34 | 0.9990 | 999.90 |
| DPFA | 22.89 | 79.42 |
87.36 | 1.100 | 1100.00 |
| Dry Gin |
22.89 | 79.42 | 79.44 | 1.0003 | 1000.30 |
| XG | 22.89 | 79.42 |
119.13 | 1.5000 | 1500.00 |
Table 6.
EOR fluids Viscosity and pH results.
| Sample Name |
Temp ) |
Efflux Time (s) | Viscometer constant | Specific Gravity | (cSt) | (cP) | pH |
| DLS |
29 | 27.14 | 0.0364149 | 1.0003 | 0.9883 | 0.9886 | 6.7 |
| BLE + E | 29 | 28.09 | 0.0364149 | 0.9988 | 1.0228 | 1.0216 | 6.8 |
| SLE |
29 | 27.95 | 0.0364149 | 0.9990 | 1.0177 | 1.0167 | 6.7 |
| DPFA |
29 | 26.60 | 0.0364149 | 1.1000 | 0.9685 | 1.0653 | 8.7 |
| DG |
29 | 28.16 | 0.0364149 | 1.0003 | 1.0254 | 1.0257 | 5.9 |
| XG |
29 | 427.02 | 0.0364149 | 1.5000 | 15.5500 | 23.3200 | 6.8 |
Disclaimer/Publisher’s Note: The statements, opinions and data contained in all publications are solely those of the individual author(s) and contributor(s) and not of MDPI and/or the editor(s). MDPI and/or the editor(s) disclaim responsibility for any injury to people or property resulting from any ideas, methods, instructions or products referred to in the content. |
© 2025 by the authors. Licensee MDPI, Basel, Switzerland. This article is an open access article distributed under the terms and conditions of the Creative Commons Attribution (CC BY) license (http://creativecommons.org/licenses/by/4.0/).
Copyright: This open access article is published under a Creative Commons CC BY 4.0 license, which permit the free download, distribution, and reuse, provided that the author and preprint are cited in any reuse.


