
Submitted:
22 July 2025
Posted:
23 July 2025
You are already at the latest version
Abstract
This study presents the electrical and optical properties of phosphate glasses in the 35P2O5 -xV2O5 -(65–x) Sb2O3 (PVS) system with 0 ≤ x ≤ 65 mol%. DC resistivity was measured using the Van der Pauw method and optical absorption spectra were recorded in the UV–VIS–NIR range. Electrical transport is attributed to simultaneous hopping of small polarons (SPs) between V4+ and V5+ (vanadium ion) sites and small bipolarons (SBPs) between Sb3+ and Sb5+ (antimony ion) sites. The resistivity exhibits a non- linear dependence on the ionic fraction of vanadium, defined as, [V]([V]+[Sb]) where [V] and [Sb] are the concentrations of the respective cations in the glasses. Whereas the resistivity exhibits a minimum in the composition range 0 ≤ nV ≤ 0.3, a resistivity maximum was observed in the range 0.3 ≤ nV ≤ 0.5. On further increasing nv, the resistivity exhibits a monotonic decline. In the composition range 0 ≤ nV ≤ 0.3, where the hopping distance between V ions decreases, while that between the Sb ions increases, the resistivity minimum has been shown to be the consequence of decreasing tunneling distance of SPs between the V4+ and V5+ ion sites. Though the probability of successful hops of SBPs decreases on account of increasing separation between Sb3+ and Sb5+ ions, the far superior mobility of SPs than that of SBPs more than offsets the decreasing contribution of SBPs to the total conductivity. In the composition range 0.3 ≤ nV ≤ 0.5, the resistivity, activation energy for DC conduction, glass transition temperature and also density exhibit their respective maxima even though the separation between V4+ and V5+ sites continues to decrease. This feature is explained by enhanced localization of electrons on account of increased disorder (entropy) among the SPs and SBPs, similar to that of Anderson localization. This argument is further supported by a shift of the polaronic optical absorption bands associated with the SPs and SBPs toward higher energies. The transport behavior of all the glasses except the x = 0 composition has been explained by adiabatic transport, principally, by the SPs on V ions while the Sb ions contribute little to the total transport process. On the contrary, Sb ions is the principal source that produces the highly disordered potential field leading to a resistivity maximum at a [V/Sb] ratio of ~ 0.5 in the glass composition.
Keywords:
glass
; small polarons
; small bipolarons
; adiabatic transport
; non-adiabatic transport
1. Introduction
In oxide glasses, the polarizable lattice almost always traps an electron or a hole (carriers) as a result of strong electron-phonon interaction, or EPI [1,2,3,4,5,7,8,9,10,11,12,13,14,15,16,17,18], which produces local lattice distortions around the carrier. The ensemble comprising the carrier and the associated lattice distortion may be considered as a pseudo particle or polaron, the transportation of which is the origin of electronic conduction in glasses. In silicate, phosphate and telluride glasses, the size of the lattice distortions around carriers are mostly a few atomic distances and are termed small polarons (SPs). Even in the absence of substantial EPI, the theoretical basis of localization of electrons (Anderson localization or AL) was provided by Anderson [18]. Mott and others [8,9,10,11,12,13,14,15,16,17] have discussed localization of charge carriers in oxide and chalcogenide glasses, which provide the perfect environment for AL. Such localization of charge carriers almost always renders glasses semiconducting. There is no example of unactivated metallic conduction in any oxide glass.
In glasses containing transition metal oxides, TIs often exist in multiple oxidation states. When an electric field is applied, electrons localized at the reduced ion sites (i.e., those with lower ionization energy) can hop to neighboring oxidized sites, contributing to electrical conduction. However, in oxide glasses, almost all of the electrons available for conduction are self-trapped [1,2,3,7] in the lattice by the process commonly referred to as electron-phonon (EP) interaction [1,2,3,4,5,7,8,9,10,11,12,13,14,15,16]. Such self-trapped electrons are known as polarons [1,2,3,4,5,7,8,9,10,11,12,13,14,15,16,17,18,19,20,21,22,23,24,25,26,27,28,29,30]. Depending on the size of the lattice distortion, these polarons are termed either small or large polarons. In phosphate glasses, the polarons are almost exclusively as small polarons (SPs) [1,2,3,7].
Phosphate and telluride glasses incorporating mixtures of transition ions (TIs) have been shown to exhibit non-linear responses in several key aspects, including DC electrical resistivity (ρ), DC activation energy (W) and glass transition temperature (Tg) [1,2,3,4,5]. Keeping the total TI concentration constant, if the relative proportions of TIs are varied, ρ, W and Tg exhibit pronounced maxima, similar to that of the well-known mixed alkali effect (MAE), observed in glasses containing two different alkali ion species [6]. The non-linear effect is commonly referred to as the mixed transition ion effect (MTE) [1,2,3,4,5] in the scientific literature. However, it is important to note that, whereas MAE is explained by a classical barrier-crossing mechanism of two competing alkali ions, MTE has its origin in Anderson localization (a quantum phenomenon). At a critical TI ratio, which is close to 0.5, the configurational entropy (disorder) among the TIs reaches a maximum, which coincides with the maximum Anderson disorder parameter [16,18,22]. Such disorder in the potential field impedes electron hopping on account of enhanced Anderson localization of the SPs [1], culminating in carriers trapped in deeper potential wells even as the inter-TI separation decreases. The corresponding resistivity maximum confirms the role of the configurational disorder among the TIs (entropy) in suppressing polaron transport and highlights the impact of MTE.
Another important aspect of electronic transport, comprising small bipolarons, or SBPs have also been discussed in the literature [2,3,9,20]. In oxide glasses, group V ions such as As and Sb typically exist in As3+/As5+ and Sb3+/Sb5+ states. Two electrons may be localized in a deep trap forming what is known as a small bipolaron, or SBP. Hopping of such bipolarons between the reduced and oxidized states have been reported to result in electronic conduction in glasses [15,16,17,18,19,20]. Kumar et al. [20] have demonstrated the formation of small bipolarons (SBPs), which are bound pairs of small polarons in vanadium phosphate glasses containing antimony oxide. While the reduced TI, V4+, with a single electron forms a small polaron (SP) for the conduction process, the Sb3+ ion can provide two electrons, both of which can be trapped in the same potential well to form a small bipolaron (SBP), as described in the theoretical formalism set out by Emin [9]. Previous work has attributed electrical conductivity in Sb–phosphate glasses to transport of SBPs [21] between Sb3+ and Sb5+ sites. SBPs on the reduced (Sb3+) sites may hop over to the oxidized (Sb5+) sites under the influence of an external EMF during electrical conduction. It is to be noted that such conductivity is lower than conduction on account of SP transport in the same glass if SPs are present in the same glass on account of the presence of TIs such as vanadium or iron ions. In addition, the activation energy attributed to SP conduction will, accordingly, be lower than that for SBP conduction. Moreover, an SBP optical absorption band is expected to be detected at a shorter wavelength (greater energy) than an SP optical band in the same glass.
The mechanism of electronic transport of a self-trapped carrier in TI-containing glasses, when subjected to an external EMF, is described by the quantum mechanical process by which an electron tunnels between TI sites. Such a transport mechanism may be visualized as the “hopping” of the SPs between TI sites and is commonly referred to as SP hopping (SPH) conduction. SPH conductivity, is given by [1-6, 8, 9, and 16]:
(1)
where, the pre-exponential coefficient , is given by
(2)
Here, α is the wavefunction localization parameter, ν is the frequency of longitudinal optical phonons, R is the average distance between ions [8], and C is the fractional site occupancy [8]. The activation energy W comprises two components: W=WH+ WD/2 with WH being the hopping activation energy and WD the site energy difference due to lattice inhomogeneities. Since in oxide glass containing TIs, WD≪WH at room temperature or higher [1,2,3,4,5,8], WH is typically used as the activation energy for SPH conduction.
According to Emin's model [9], the polaron formation energy, Wp, relates to the W as [1,2,3,4,5,8,16,17]:
(3)
Equation (3) provides the relationship between the activation energy, W, for DC conduction and the SP or SBP formation energy, Wp. Moreover, as Emin has demonstrated, the Wp of SBP is approximately double that of SPs in the same glass. It follows that the polaron formation energy is the average depth of the potential wells the carriers are trapped in. The continuous random network (CRN) structure of glasses renders such trap “depths” smeared over a range of values, determined by the Anderson randomness parameter [18] as described by Mott [19]. When a glass containing polarons (SPs/ SBPs) is subjected to electromagnetic radiation in the near infrared region, the carriers in the traps or potential wells typically exhibit broad, noisy, and low intensity absorption bands [2,3,9]. The width of such absorption bands are indicative of the energy spread of the “depths” of the potential wells. The energy corresponding to the central (peak point) of the absorption band is approximately equal to twice the activation energy for DC conduction (W).
In the present investigation, the relationship between resistivity and optical absorption data has been attempted. Optical bands for SPs and SBPs are anticipated at frequencies that correspond to roughly 2W [9], facilitating the identification of SP/SBP transport through the correlation of W with the energy linked to the peak wavelengths (λSP/SBP) of the SP/SBP optical bands. As described earlier, while these optical bands in transition metal containing oxide glasses are often broad and noisy, they serve as valuable indicators of polaron dynamics [2,3,9].
At temperatures above (θD/2), where θD is the Debye temperature, SPH conduction involves multiple unsuccessful and successful hopping attempts from a reduced to an oxidized TI site by tunneling. Such a process is facilitated by the optical phonon frequency, ν, (Eq. 2) typical of the glass CRN structure and the distance between the tunneling sites. Close proximities between such sites will culminate in a favorable α, the wavefunction localization parameter, enhancing the overlap between the carrier wavefunctions. Depending on the probability that the carrier will successfully hop between TI sites, polaron conduction may occur via adiabatic (high probability) or non-adiabatic (low probability) mechanisms [8,9,17,18,19,20,21,22,23,24,25,26]. In the adiabatic regime, the term exp(−2αR) in Eq (2) approaches unity and may be neglected [8,17]. Conversely, in the non-adiabatic regime, this term becomes significant, resulting in reduced hopping probability.
The polaron (SP/BSP) radius, rp, is an important parameter that provides insight into the extent of localization. The polaron radius can be estimated under the assumption of a homogeneous atomic distribution as [15,19]:
(4)
where N is the density of hopping sites. The average intersite distance denoted by R can be found using [2,3,8]:
(5)
When donor cations are separated by only a few multiples of their polaron radius, adiabatic transport is likely. Conversely, when the separation between ions is large, non-adiabatic transport becomes dominant. In this regime, conduction is reduced because charge carriers encounter fewer opportunities to hop, as these hopping events are primarily facilitated by lattice vibrations [8,17].
The present investigation explores the combined effect of SPs and SBPs by systematically determining the electrical and optical properties as a function of the relative proportions of small polarons and small bipolarons in the glasses with the general composition: 35P2O5 -xV2O5 -(65–x) Sb2O3.
2. Experimental
2.1. Glass Synthesis
Glasses in the 35P2O5 -xV2O5 -(65–x) Sb2O3 composition systems were prepared employing the conventional melting and quenching method, where x was varied between 0 and 65. Another series of binary vanadium phosphate glasses with the general composition (100-x) P2O5 – xV2O5 were also synthesized with x = 45, 55, 65, 75 by following the same procedure. P2O5, V2O5 and Sb2O3 with 99.99% purity were obtained from Alfa-Aesar, USA.
The batches comprising appropriate weights of the oxides were melted in fireclay crucibles at 1373-1423 K for 30 min. The glass samples were quenched between two ½” thick copper plates. The binary antimony phosphate and vanadium phosphate were named PS and PV, respectively, in this work, while the ternary glasses containing P2O5, V2O5 and Sb2O3 were named PVS glasses. The compositions of the glasses were confirmed by x-ray fluorescence (XRF) spectroscopy and are presented in Table 1 and Table 2 which lists the nominal as well as the XRF-determined actual molar compositions.
X-ray diffraction (XRD and Differential Thermal Analysis (DTA) were employed to determine the amorphicity and glass transition temperature (Tg) of each sample. Small amounts from each batch were crushed and ground for XRD, XRF and DTA measurements. The rest of the glasses were successively polished with 400, 600, 1200, and 2000 grit abrasives to obtain polished co-planar, ~ 2 mm thick samples of arbitrary shapes to be utilized for electrical conductivity and optical (UV-VIS-IR) spectroscopy measurements. For XRD measurements, a Rigaku Smart Lab-II - diffractometer (scanning range: 10° < 2θ < 80°) was used to verify the amorphous nature of the glass samples (Figure 1). In XRF analysis, minor impurities of up to 0.5-1 wt% were identified, including multiple metal oxides. Some of the reported compositions were renormalized which ignores the existence of such impurities (Table 1 and Table 2). For some glasses, the actual composition of the glasses differed significantly from the nominal composition owing to the volatile nature of P2O5.
2.2. Electrical Resistivity Measurements
The Van der Pauw four-probe method [7] was utilized to measure DC resistivity (ρ) with a computerized setup (H-50, MMR Technologies) functioning within the temperature range of 82–700 K. The Van der Pauw method is particularly suited for measuring resistivity in irregularly shaped glass samples, as it allows accurate determination without requiring a specific geometry. The average of 24 measurements will be undertaken at each temperature to generate an average value of resistivity by incorporating the dimensions of the sample.
Glass samples, characterized by uniform thickness (800–1200 μm) and various shapes, were polished and fitted with silver electrodes using silver paste. Measurements were executed under ohmic conditions, with each sample affixed on top of an aluminum nitride ceramic heater utilizing thermal grease to ensure effective thermal contact. Current and voltage probes were configured as described above, with the current ranging between 10-6 and 10-11 ampere, chosen according to the measurement temperature. All measurements were taken in a dark, evacuated chamber (8–10 mTorr). The estimated uncertainties were ±7.5% for resistivity and ±0.02 eV for activation energy. Conductivity values were derived from the inverse of the measured resistivity. The electrical resistivity data are presented in Table 3 and Table 4 and also presented diagrammatically in (a)-(c), and .
2.3. Optical Absorption Spectroscopy
Optical absorption spectra were recorded using a Perkin-Elmer Model 330 dual-beam spectrophotometer, scanning in the 250–3000 nm range at a rate of 120 nm/min. This instrument was chosen for its broad spectral coverage, allowing observation of both UV-edge transitions and polaronic absorption in the near-infrared (NIR) region. The glasses were polished using 600- and 1200-grit silicon carbide abrasive papers to obtain optically surfaces with a final thickness of approximately 500–1000 μm. Careful preparation ensured minimized surface scattering and consistent sample geometry, which is critical for reliable absorption measurements. Spectra were recorded in transmission mode at room temperature. Figure 5 shows the absorption behavior of selected P2O5–V2O5–Sb2O3 glasses, exhibiting broad absorption bands in the visible-NIR region.
2.4. Density Measurement
Density measurements were conducted using standard pycnometric techniques with deionized water as the immersion medium. Glass samples were precisely shaped, cleaned, and dried prior to measurement to ensure accuracy. Temperature corrections were applied to account for variations in fluid density. The estimated uncertainty in these measurements is ±0.01 g/cm³. The density data are listed in Table 3 and Table 5.
2.5. Glass Transition Temperature (Tg)
The glass transition temperature was measured using a PerkinElmer DTA 7 system, operated at a heating rate of 10 °C/min across a temperature range of 200–1000 °C. The system was calibrated with DTA standards of alumina, quartz, and gold. The associated uncertainty in the Tg values, provided in Table 1 and Table 2 is estimated to be ±5 K.
3. Results and Discussion
3.1. Electrical Resistivity
The conductivity of the PV glasses (Figure 2(a)-(b)) increases with increasing V concentration in the glass composition (Table 1 and Table 3), indicating that V ions are primarily responsible for electrical transport in this glass system. The activation energy (W) for dc conduction for all glasses, which corresponds to the slope of the log () vs. 1000/T plot, is found to increase with increasing temperature —indicating a temperature-dependent transport mechanism. For clarity, the log () vs. 1000/T plot of the PV-1 is presented in Figure 2(b). In the low-temperature region (346-443 K), the activation energy: Wlow = 0.49 eV while at high-temperature range (463-493 K), Whigh = 0.64 eV.
For all binary and ternary glasses, activation energies (W) were determined from linear segments of the plots in the temperature range of 346–493 K. The conductivity (σ) measurements for the binary PS glass were conducted in the 420-493 K region on account of its exceptionally high resistivity at lower temperatures. Figure 2(c) presents the variation of conductivity of the PS and PVS glasses, which follows the general trend of increasing σ with the temperature. The pre-exponential factor () was found from the intercepts of the Arrhenius plots of Figure 2(c).
There is an extensive literature on hopping conduction of SPs and SBPs prevalent in oxide glasses containing TIs [1,2,3,4,5,7,8,9,10,11,12,13,14,15,16,17,18,19,20,21,22,23,24,25,26,27,28,29,30]. The characteristics of the hopping can be distinguished from the conduction by holes and electrons [27]. Whereas the activation energy of transport in a crystalline semiconductor is constant as a function of temperature, that of a glassy semiconductor varies with temperature, as discussed earlier. In glassy semiconductors, conduction may take place by two distinct mechanisms: i) small polaron hopping between localized states in the bandgap via tunneling, ii) direct transfer of carriers from the localized states to the extended states (conduction/valence bands). Typically, the latter takes place at higher temperatures [19] because SPs/SBPs are trapped quite deep inside the forbidden band. It is established that SPH is the mode of mode of conduction in glasses containing V ions [1,2,3,4,5,7,15,19] and small bipolaron hopping (SBPH) takes place in glasses containing Sb ions [20,21].
Table 5 presents the calculated average distance between V ions (V–V distance) denoted by R, and SP radius rₚ, determined [2,3,15,19] by using Eqs (4) and (5) [15,19]. When electrons are able to respond quickly to lattice vibrations, as in systems where donor cations are spaced by only a few multiples of their ionic radii, the conduction mechanism is considered adiabatic. In such cases, the charge carriers can efficiently utilize available lattice vibrations to hop between localized states. Conversely, in the non-adiabatic regime, where the coupling among charge carriers and the lattice is weaker or slower, the conduction is significantly reduced due to the limited number of effective hopping events [17,28]. In all the glasses of this investigation (Table 5), R is determined to be within 2.5 times that of its corresponding rₚ. Such a condition is considered to be conducive to the adiabatic mechanism of nearest-neighbor SPH.
For V-rich glasses within the composition range 65 [V/(V+Sb)] , the pre-exponential factor σ₀ varies between 10.96 and 275.42 S·cm-1, which are values with orders of magnitude lower than those observed in typical metals [28]. This confirms that the electrical transport mechanism is governed by small polaron hopping (SPH). In the binary PV glass, is found to be 20.42 Scm-1, which is in close agreement with the results reported by Dutta et al. for the mixed transition metal glass system P2O5–V2O5–MnO [1]. Figure 3 shows the relationship between the ln and V-V distance (R).
Doweidar et al. [29], Gohar et al. [30] and Dutta et al. [2,3] demonstrated SPH conduction in a variety of glasses (borate, phosphate, vanadate, telluride, etc.) containing V and Fe ions. The general consensus of all previous investigations is that SPH conduction is that the nature of the hopping process becomes increasingly adiabatic as the distance between the TI sites decreases. Another important conclusion is that α of trapped electron/s for SP/SBP remains largely unchanged, regardless of the TI concentration. If the optical phonon frequency (ν) and C (redox ratio of the TIs) are assumed constant, the term exp(-2αR), the wavefunction decay parameter becomes important.
For polaronic conduction in general, a plot of ln(σo.R) vs R gives a straight line, the slope of which gives -2α, if C, the redox ratio of V or Sb does not vary among the glasses [29,30]. However, this is true for glasses containing only SPs or SBPs, not a combination of SPs and SBPs. The ln(σo.R) vs R plot provided in Figs. 3is not a perfect straight lines but exhibits a maximum where V/(V+Sb) is ≈ 0.5 (Table 5). If, however, the ln(σo.R) data corresponding to RVV values between 0.65 and 0.75 are ignored, a straight line is obtained as shown by the dotted line as guides to the eye. In other words, some other factor is active around V/(V+Sb) ≈ 0.5, which will be treated next.
The probability of two electrons from two V4+ sites to simultaneously hop into one Sb5+ site and contribute to electrical transport would, indeed, be vanishingly small. Even in such an unlikely event, both the electrons would be buried in a deeper potential well of an SBP. Hence, the active role of Sb ions in the conductivity of ternary glasses is extremely limited as demonstrated by the drastic rise in conductivity even with modest additions of V2O5 to the binary antimony phosphate (PS) glass composition leads to conclude that the SPs on V sites are the principal carriers in the ternary PVS glasses. Hence the ln(σo.R) vs R plot provided in Figure 3 may be considered to be predominantly a reflection of SPH transport, contributed, principally, by the V ions, influenced by the potential field of the Sb ions.
In the composition range 0 ≤ V/(V+Sb) ≤ 0.31, the log(ρ) values decrease sharply. This behavior can be attributed to the increase in the number of available sites for SPH hopping resulting in increased conductivity. In polaronic systems, the conductivity (σ) depends exponentially on the hopping probability, which itself is highly sensitive to carrier concentration. Therefore, the sharp decrease in resistivity in this regime takes place on account of increasing the relative proportion of V.
Between V/(V+Sb) ≈ 0.30 to ≈ 0.50, the resistivity, however, starts to increase with increasing V, which contradicts the prevalent theory of SPH conduction, which mandates that the resistivity should decrease when the hopping distance becomes shorter. Such a behavior can only be explained by the mixed transition-ion effect (MTE), mediated by Anderson localization [18], as demonstrated earlier by Dutta et al. in phosphate and telluride glasses [2,4,5]. As discussed earlier, the electrons on V4+ are localized by the disorder of the potential field offered by the cations comprising the glass matrix, to start with. The maximum disorder or configurational entropy or maximum AL is reached when V/(V+Sb) approaches a value of 0.5. Accordingly, the glass composition with V/(V+Sb) = 0.46 (Table 4, Figure 4) exhibits the highest resistivity among all the glasses in this investigation. This also provides the reason why the ln(σo.R) vs R plot in Figure 3 deviates from linearity. As discussed earlier, the AL is accentuated by increasing the configurational entropy by virtue of the mixing of two different ions, reaching a maximum at V/(V+Sb) ≈ 0.50.
The fact that Sb ions play a negative role in the conduction process can be demonstrated by comparison of the resistivity (ρ) and activation energy (W) of selected ternary PVS glasses with those of binary PV glasses containing similar concentrations of V2O5, as shown in Table 6. For example, when comparing PVS-6 and PV-1, which contain 51.05 mol % and 51.23 mol % V2O5, respectively, notable differences are observed. The ρ and W of the two glasses differ by factors of approximately 1.6 and 2, respectively. It is important to note that PVS-6 also contains a significant amount of Sb2O3 (9.93 mol %). Furthermore, among the binary glasses, the PS composition shows the highest resistivity, while the PV glass exhibits the lowest. The ρ of the PS glass surpasses that of the PV glass by over 3.5 orders of magnitude (refer to Table 6 and Figure 4). These findings strongly suggest that under the conditions of our experiment, Sb ions actively influence the conduction mechanism in these glasses and play a significant role in suppressing the transport of SPs on V ions.
3.3. Optical Absorption Spectroscopy
The optical absorption spectra of two PVS glasses in the composition range 0.00 ≤ nV ≤ 1) as well as the PS and one PV glass are presented in Figure 5. The wavelengths corresponding to the optical absorption peaks are listed in Table 4. The small polaron and small bipolaron absorption bands, characteristically broad and noisy, have been smoothed for better display along with the matching glass compositions. With decreasing nV, it is noticed that the absorption band at 1300 nm (for the PVS-2 glass) shifts to higher wavelengths. The absorption band at 1430 nm for PV glass (nV =1) is absent in the PS-1 glass (nV =0). This validates the assignment of the 1430 nm peak to V ions.
The binary PS-glass lacks the distinctive absorption band (1430 nm) of the PV composition. However, the absorption band centered around 750 nm becomes much reduced in intensity is assigned to the Sb ions. Most likely, it has a signature of the phosphate matrix of the glass. Further study is required to confirm this assignment. The broadness and asymmetry of the SP absorption band of PVS glasses are standard properties of small polaron bands, [2,3,5] which are observed in the absorption spectra of the PV/PVS glasses (Figure 5). Absorption of a photon by the electron trapped in an SP comprises the change in the electronic energies between the V4+/V5+ and the Sb3+/Sb5+ states. The energy required is approximately double that of polaron production (WP), which is connected to hopping conduction by the equation W= WP /2. According to Emin’s model [9] the absorption band centered around 850 nm corresponds well in energy with bipolaron transport in the PS glass and the band at 1430 nm is caused by small polarons in the glass. According to Emin’s model, the DC activation energy, W, calculated from the optical data presented in Table 4, should be around 0.40 eV for the PV-1 glass, which corresponds with the left shoulder of the optical absorption band (Figure 5). This is close to the experimentally found value of 0.42 eV (Table 4) in the temperature range of 346-493 K. Given the extremely wide and noisy character of SP absorption bands, the W-WP association seems to be confirmed. Moreover, a shift of the left shoulders of the absorption bands to lower wavelengths (higher energy) is observed as the V/(V+Sb) ratio of the PV (1.0) and PVS-4 (0.46) glasses. In other words, the maximum activation energy and resistivity of the PVS-4 glass is verified by the optical absorption data.
3.4. Density
The effect of compositional variation on glass density was systematically analyzed for the binary PV glasses. As shown in Table 3 and Figure 6, the density increases with vanadium content. This trend can be attributed to the enhanced network connectivity introduced by V ions, which likely leads to a denser glass structure. In contrast, the density of ternary PVS glasses decreases with increasing vanadium, attributed to the lower mass of V4+ as compared to Sb3+ ions. The data obtained were used to calculate the concentration (N/cm3) of V and Sb ions in the glass, assuming homogeneous distribution. The concentration values were used to subsequently determine the SP/SBP radii (rp, ) and RV-V, the average separation of V ions, using Eqs. (4) and (5), respectively. Moreover, Figure 6 shows that the density increases with V/(V+P) ratio, supporting the RVV data presented in Table 5.
3.5. Glass Transition Temperature (Tg)
Figures 7 (a), (b) Table 1 and Table 2, illustrate the variation in glass transition temperature (Tg) across both binary and ternary glass compositions. The minima and maxima observed in the log(σ) vs 1/T curves correlate well with variations in the glass transition temperature (Tg). For the binary PV glasses the Tg monotonically increases with V concentration, as the continuous random network structure is increasingly fortified with the increasing addition of V2O5 to the glass composition. This trend is attributed to the role of vanadium ions as a conditional network former, enhancing the degree of connectivity within the glass network structure. Accordingly, as the V concentration increases, the structural rigidity of the glass network improves, resulting in an elevated Tg [6,30]. For the PVS glasses, the maximum in Tg is observed at V/(V+Sb) = 0.46, exactly where the maximum resistivity is located (Table 4 and Figure 4). This feature was also observed earlier in mixed TI glasses [2,5].
4. Conclusions
In summary, the electrical and optical properties of the 35P2O5 -xV2O5 -(65–x) Sb2O3 glasses have confirmed that the transport mechanism in these glasses consists of the simultaneous hopping of small polarons between V4+ and V5+ ion sites and small bipolarons between Sb3+ and Sb5+ ion sites. However, the Sb ions provide minimal contribution to the total conductivity of the glass. The principal role of Sb ions in this glass system turns out to actually inhibit the transport of small polarons between V4+ and V5+ ion sites, which is the more mobile charge carrier. Such inhibition of small transport is caused by the disorder of the cationic potential created by the antimony and vanadium ions (Anderson localization) on top of the inherent disorder of the glass matrix. All the glasses in the series except the binary phosphorus antimonide glass (x = 0) composition have been established to exhibit adiabatic small polaron hopping conduction. The ρ vs [V/V+Sb)] plot exhibits a maximum at a critical concentration of vanadium ions. Similar maxima in activation energy for DC conduction and glass transition temperature have also been observed near the critical vanadium ion concentration. Such a behavior has been ascribed to the enhancement of the disorder in the potential field of the glass on account of Anderson localization.
Author Contributions
Conceptualization: Biprodas Dutta; Methodology: Biprodas Dutta, Manar Alenezi and A. P Kafle; Software: VSL, CUA; Validation: Biprodas Dutta; Formal analysis, Biprodas Dutta and Manar Alenezi; Investigation: Manar Alenezi, Meznh Alsubaie, Najwa Albalawi, Biprodas Dutta; Resources: VSL, CUA; Data curation: Manar Alenezi; Writing—original draft preparation: Manar Alenezi; Writing—review and editing: Biprodas Dutta; Visualization: Biprodas Dutta and Manar Alenezi; Supervision: Biprodas Dutta and A. P Kafle; Project administration: Ian L. Pegg. All authors have read and agreed to the published version of the manuscript.
Funding
This research was partially funded by the Department of Physics and Vitreous State Laboratory (VSL), The Catholic University of America (CUA), Washington DC.
Data Availability Statement
Available on request.
Conflicts of Interest
The authors declare no conflicts of interest.
Abbreviations
The following abbreviations are used in this manuscript:
| AC | Alternating Current |
| DTA | Differential Thermal Analysis |
| DC | Direct Current |
| MAE | Mixed Alkali Effect |
| MIT | Metal–Insulator Transition |
| MTE | Mixed Transition Effect |
| PBT | Polaron–Bipolaron Transition |
| PFM | Phosphate–Fe₂O₃–MnO Glass |
| PS | Phosphate–Sb₂O₃ Glass |
| PV | Phosphate–V₂O₅ Glass |
| PVS | Phosphate–V₂O₅–Sb₂O₃ Glass |
| SP | Small Polaron |
| SBP | Small Bipolaron |
| SPH | Small Polaron Hopping |
| Tg | Glass Transition Temperature |
| TIR | Transition Ion Ratio |
| Tis | Transition Ions |
| TMI | Transition Metal Ion |
| XRF | X-ray Fluorescence |
| XRD | X-ray Diffraction |
References
- Dutta, B.; Fahmy, N.A.; Pegg, I.L. Effect of Mixed Transition-Metal Ions in Glasses. I. The P2O5–V2O5–Fe2O3 System. J. Non. Cryst. Solids 2005, 351, 1958–1966. [Google Scholar] [CrossRef]
- Dutta, B.; Fahmy, N.A.; Pegg, I.L. Effect of Mixing Transition Ions in Glasses. II. The P2O5–Fe2O3–MnO System. J. Non. Cryst. Solids 2005, 351, 2552–2561. [Google Scholar] [CrossRef]
- Dutta, B.; Fahmy, N.A.; Pegg, I.L. Effect of Mixed Transition-Metal Ions in Glasses. Part III: The P2O5–V2O5–MnO System. J. Non. Cryst. Solids 2006, 352, 2100–2108. [Google Scholar] [CrossRef]
- DUTTA, B.; PEGG, I.L. Mixed Transition Ion Effect in Certain Polaronic Semiconductors. J. Ceram. Soc. Japan, Suppl. 2004, 112, S732–S737. [Google Scholar]
- Annamalai, S.; Bhatta, R.P.; Pegg, I.L.; Dutta, B. Mixed Transition-Ion Effect in the Glass System: Fe2O3-MnO-TeO2. J. Non. Cryst. Solids 2012, 358, 1380–1386. [Google Scholar] [CrossRef]
- Doremus, R.H. Mixed-Alkali Effect and Interdiffusion of Na and K Ions in Glass. J. Am. Ceram. Soc. 1974, 57, 478–480. [Google Scholar] [CrossRef]
- Henderson, M.; Bhatta, R.P.; Eufrasio, A.M.; Pegg, I.L.; Dutta, B. Quantum Phase Transition in Phosphate Glasses Containing Multiple Transition Metal Oxides. J. Electron. Mater. 2019, 48, 3105–3114. [Google Scholar] [CrossRef]
- Mott, N.F. Conduction in Non-Crystalline Materials; Oxford University Press, 1993. [Google Scholar]
- Emin, D. Lattice Relaxation and Small-Polaron Hopping Motion in Disordered Materials. J. Non. Cryst. Solids 1972, 8–10, 511–515. [Google Scholar] [CrossRef]
- Edwards, P.P.; Sienko, M.J. Universality Aspects of the Metal-Nonmetal Transition in Condensed Media. Phys. Rev. B 1978, 17, 2575–2581. [Google Scholar] [CrossRef]
- Mott, N.F. The Transition to the Metallic State. Philos. Mag. A J. Theor. Exp. Appl. Phys. 1961, 6, 287–309. [Google Scholar] [CrossRef]
- Hubbard, J.; Flowers, B.H. Electron Correlations in Narrow Energy Bands. Proc. R. Soc. London. Ser. A. Math. Phys. Sci. 1963, 276, 238–257. [Google Scholar] [CrossRef]
- Holstein, T. Studies of Polaron Motion: Part II. The “Small” Polaron. Ann. Phys. (N. Y). 1959, 8, 343–389. [Google Scholar] [CrossRef]
- Alexandrov, A.S.; Mott, N.F. Polarons and Bipolarons; WORLD SCIENTIFIC, 1996. [Google Scholar]
- Greaves, G.N. Small Polaron Conduction in V2O5-P2O5 Glasses. J. Non. Cryst. Solids 1973, 11, 427–446. [Google Scholar] [CrossRef]
- Austin, I.; Mott, N.F. Polarons in crystalline and non-crystalline materials. Advances in physics 1969, 18, 41–102. [Google Scholar] [CrossRef]
- Al-Shahrani, A.; Al-Hajry, A.; El-Desoky, M.M. Non-Adiabatic Small Polaron Hopping Conduction in Sodium Borate Tungstate Glasses. Phys. status solidi 2003, 200, 378–387. [Google Scholar] [CrossRef]
- Anderson, P.W. Absence of Diffusion in Certain Random Lattices. Phys. Rev. 1958, 109, 1492–1505. [Google Scholar] [CrossRef]
- Mott, N.F.; Davis, E.A. Electronic Processes in Non-Crystalline Materials; Electronic Processes in Non-crystalline Materials; OUP Oxford, 1979. [Google Scholar]
- Kumar, D.; Chakravorty, D. Electrical Properties of Vanadium Phosphate Glasses Containing Antimony and Arsenide Oxide. J. Phys. D. Appl. Phys. 1982, 15, 305. [Google Scholar] [CrossRef]
- Datta, A.; Giri, A.K.; Chakravorty, D. Ac Conductivity of Sb2O3-P2O5 Glasses. Phys. Rev. B 1993, 47, 16242–16246. [Google Scholar] [CrossRef] [PubMed]
- Mott, N.F. Conduction in Glasses Containing Transition Metal Ions. J. Non. Cryst. Solids 1968, 1, 1–17. [Google Scholar] [CrossRef]
- Ghosh, A. Electrical Properties of Semiconducting Amorphous Copper-Tellurite Glasses. J. Phys. Condens. Matter 1989, 1, 7819. [Google Scholar] [CrossRef]
- Ghosh, A.; Chakravorty, D. Electrical Conduction in Some Sol-Gel Silicate Glasses. Phys. Rev. B 1993, 48, 5167–5171. [Google Scholar] [CrossRef] [PubMed]
- Lanzara, A.; Saini, N.L.; Brunelli, M.; Natali, F.; Bianconi, A.; Radaelli, P.G.; Cheong, S.-W. Crossover from Large to Small Polarons across the Metal-Insulator Transition in Manganites. Phys. Rev. Lett. 1998, 81, 878–881. [Google Scholar] [CrossRef]
- Capone, M.; Ciuchi, S. Polaron Crossover and Bipolaronic Metal-Insulator Transition in the Half-Filled Holstein Model. Phys. Rev. Lett. 2003, 91, 186405. [Google Scholar] [CrossRef] [PubMed]
- Elliott, S.R. A Theory of a.c. Conduction in Chalcogenide Glasses. Philos. Mag. A J. Theor. Exp. Appl. Phys. 1977, 36, 1291–1304. [Google Scholar] [CrossRef]
- Emin, D. Optical Properties of Large and Small Polarons and Bipolarons. Phys. Rev. B 1993, 48, 13691–13702. [Google Scholar] [CrossRef] [PubMed]
- Doweidar, H.; El-Damrawi, G.M.; Moustafa, Y.M. Transport Properties of Semiconducting Fe2O3-PbO-B2O3 Glasses. J. Phys. Condens. Matter 1994, 6, 8829. [Google Scholar] [CrossRef]
- Sidebottom, D.L. Connecting Glass-Forming Fragility to Network Topology. Front. Mater. 2019, 6, 114. [Google Scholar] [CrossRef]
- Gohar, I.A.; Moustafa, A.; Megahed, A. Electrical Properties of semicondcuting barium vanadate glasses containing iron oxide. Phys. and Chem. Of Glasses, 1998, 39, 56–60. [Google Scholar]
Figure 1.
XRD patterns of glasses xV2O5 – (65–x) Sb2O3 – 35P2O5 showing their amorphous nature.
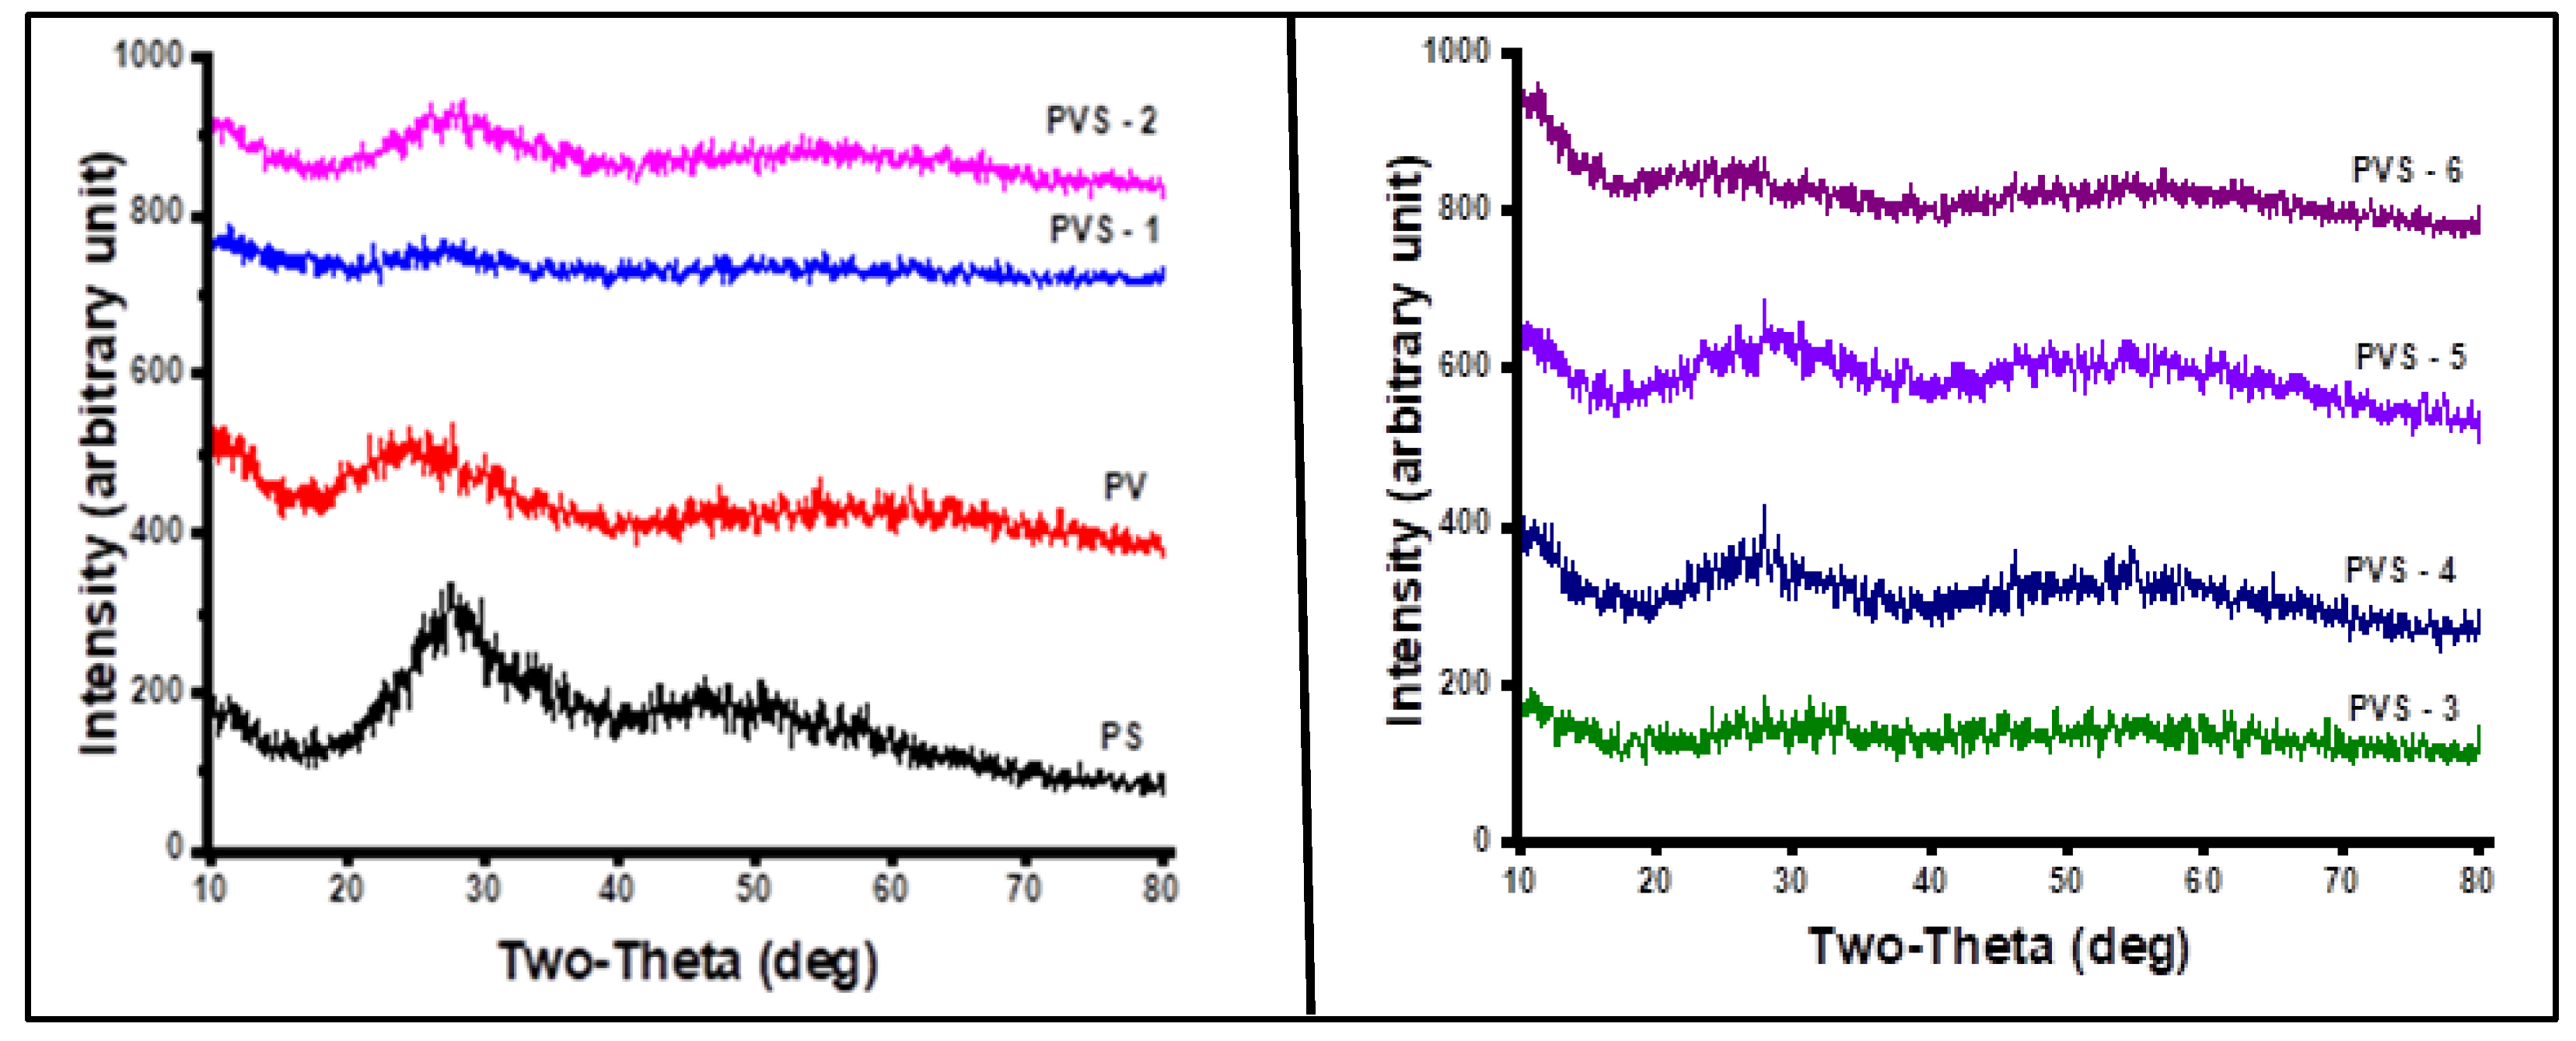
Figure 2.
(a) Conductivity in the temperature range 346 K to 493 K of xV2O5 – (100–x) P2O5 glasses with respect to 1000/K, (b) Log resistivity with respect to 1000/T plot of PV-1 glass (c) Conductivity in the temperature range 346 K to 493 K of xV2O5 – (65–x) Sb2O3 – 35P2O5 glasses with respect to 1000/K.
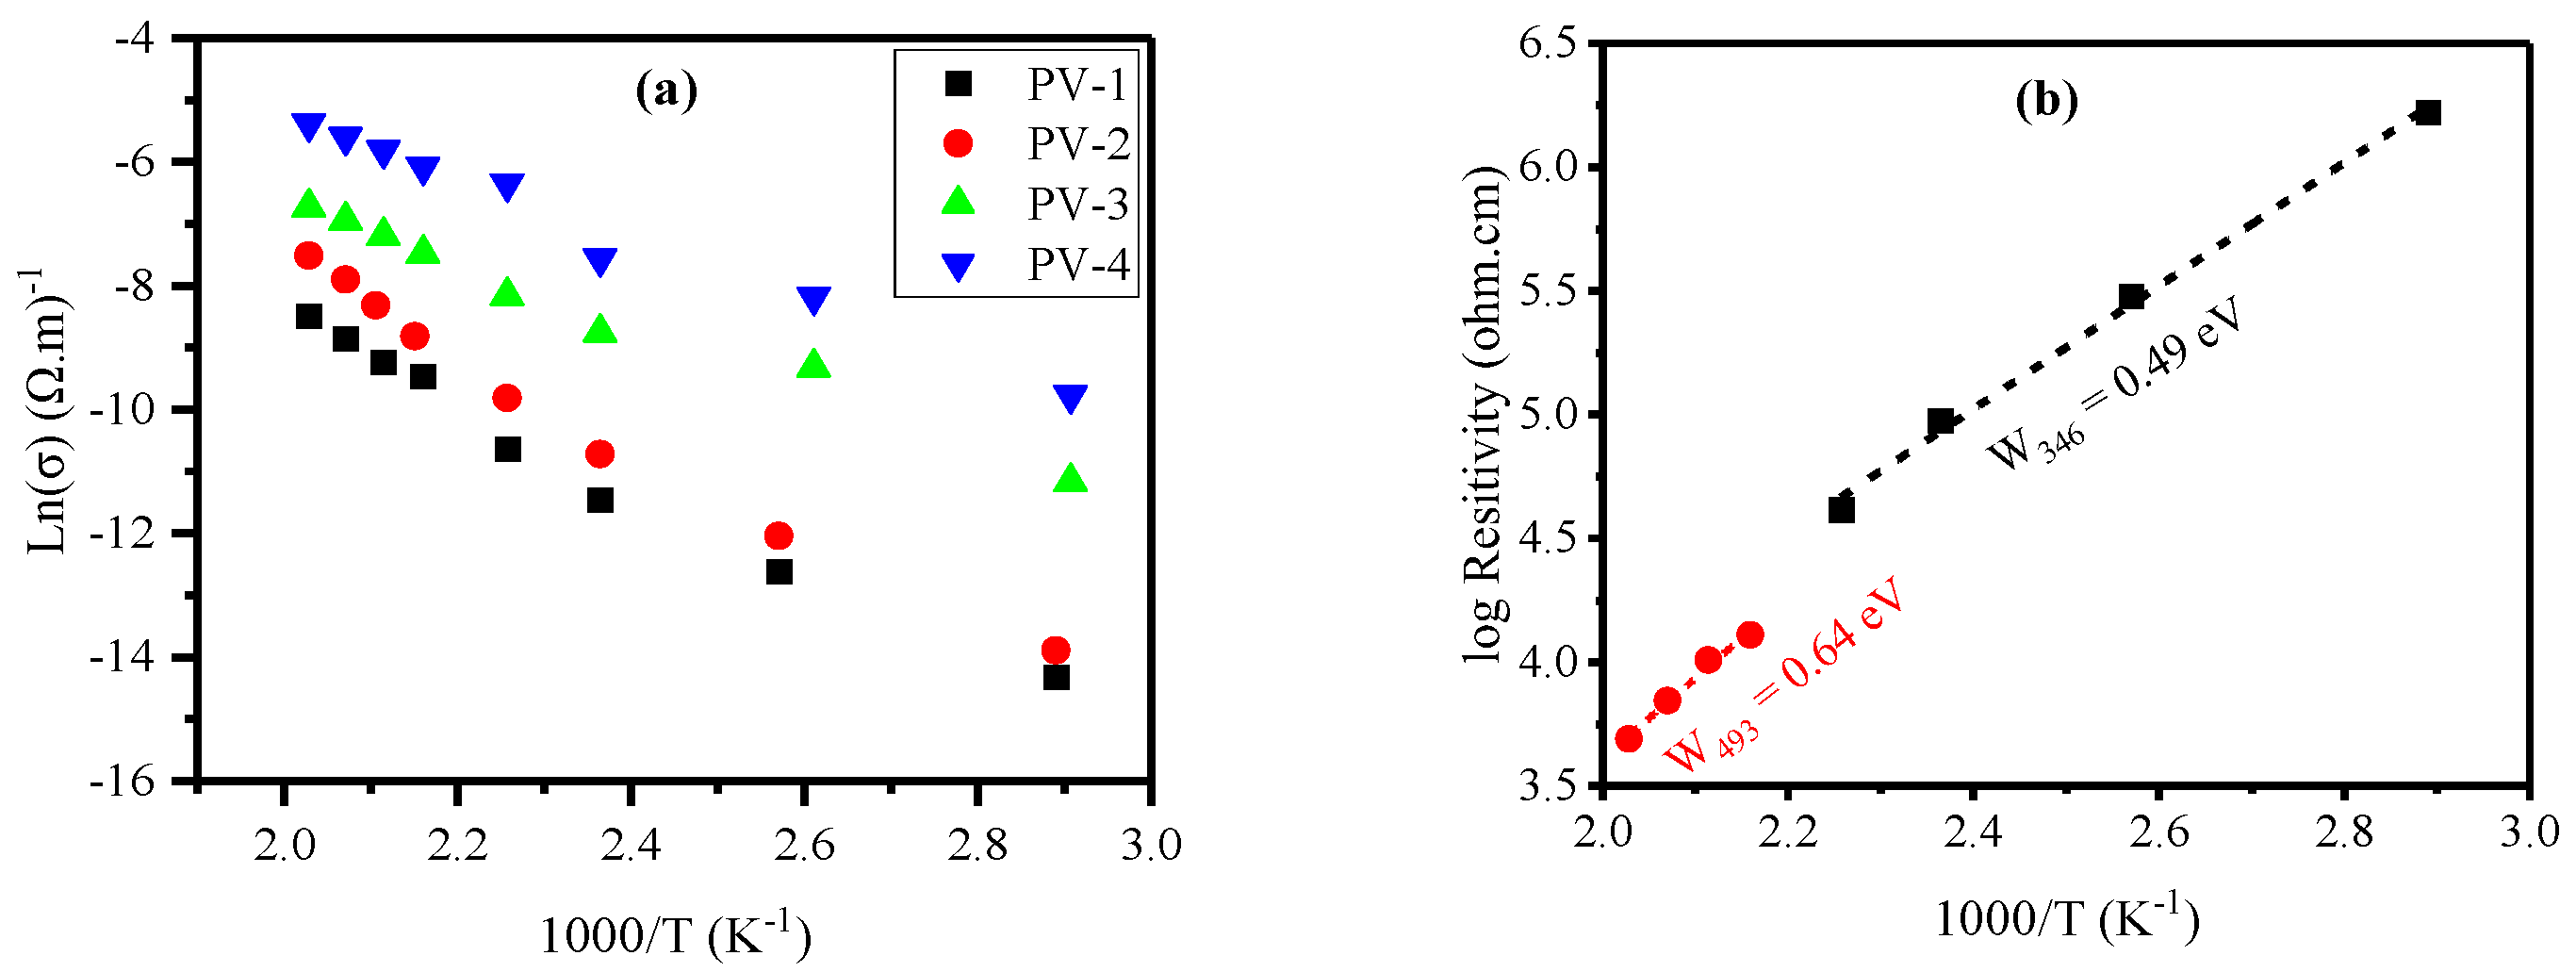
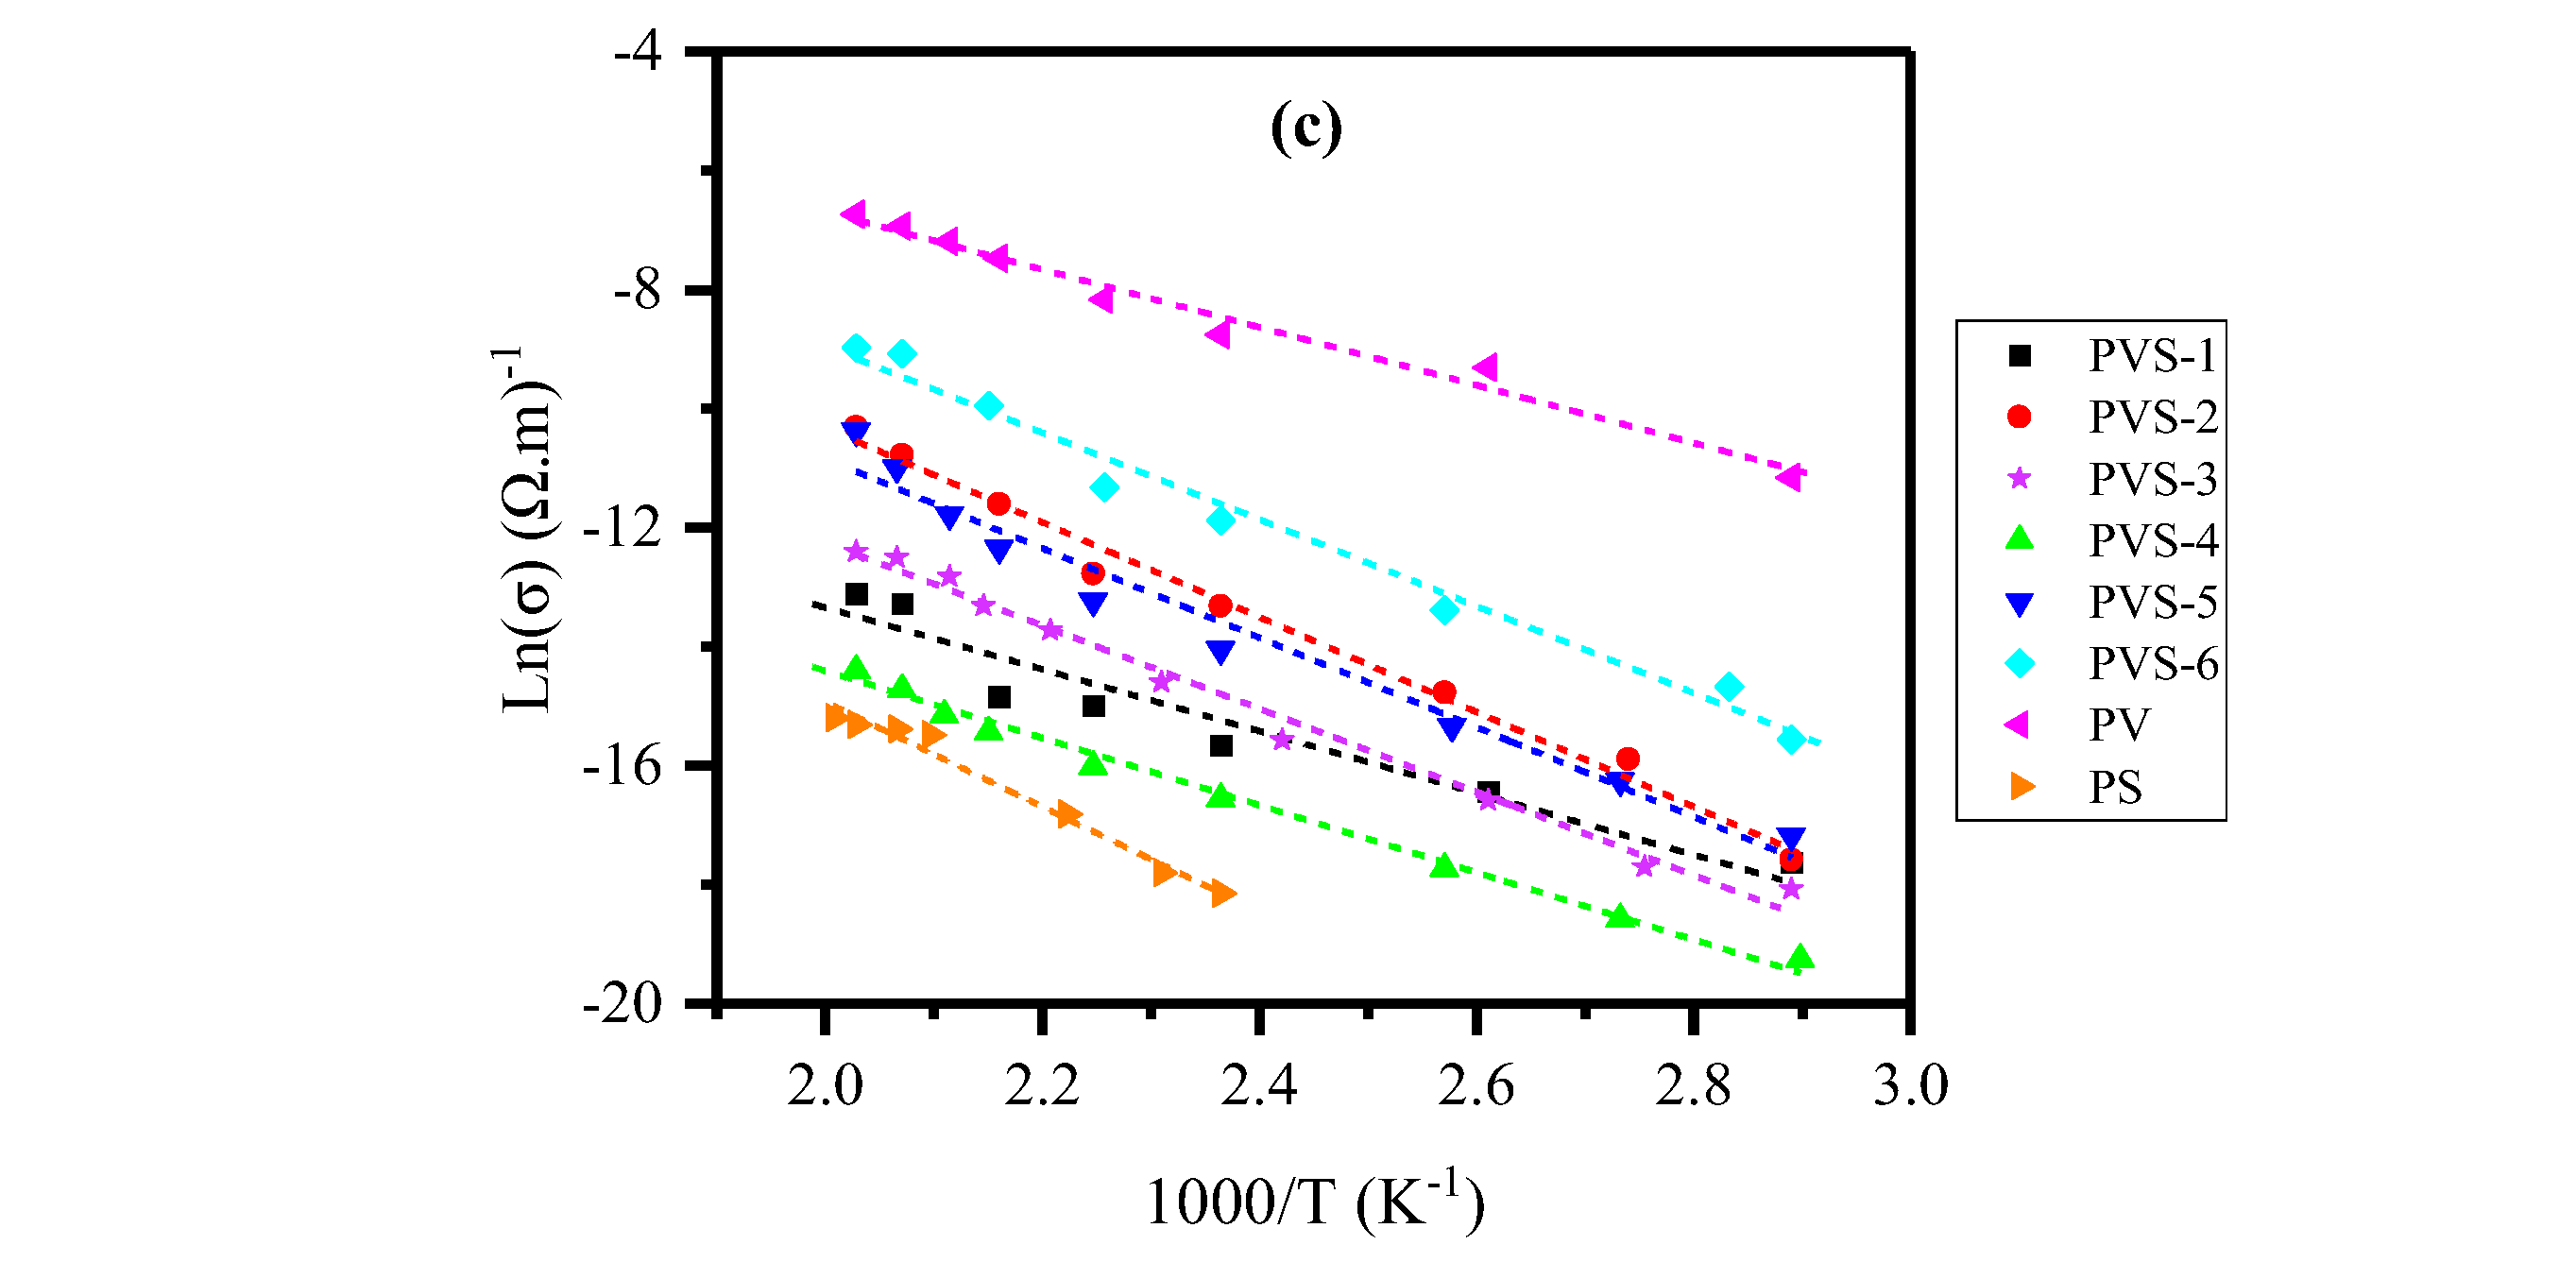
Figure 3.
R as function of R (V-V) for 35P2O5 -xV2O5 -(65–x) Sb2O3 glasses. Line drawn as a visual guide.
Figure 3.
R as function of R (V-V) for 35P2O5 -xV2O5 -(65–x) Sb2O3 glasses. Line drawn as a visual guide.
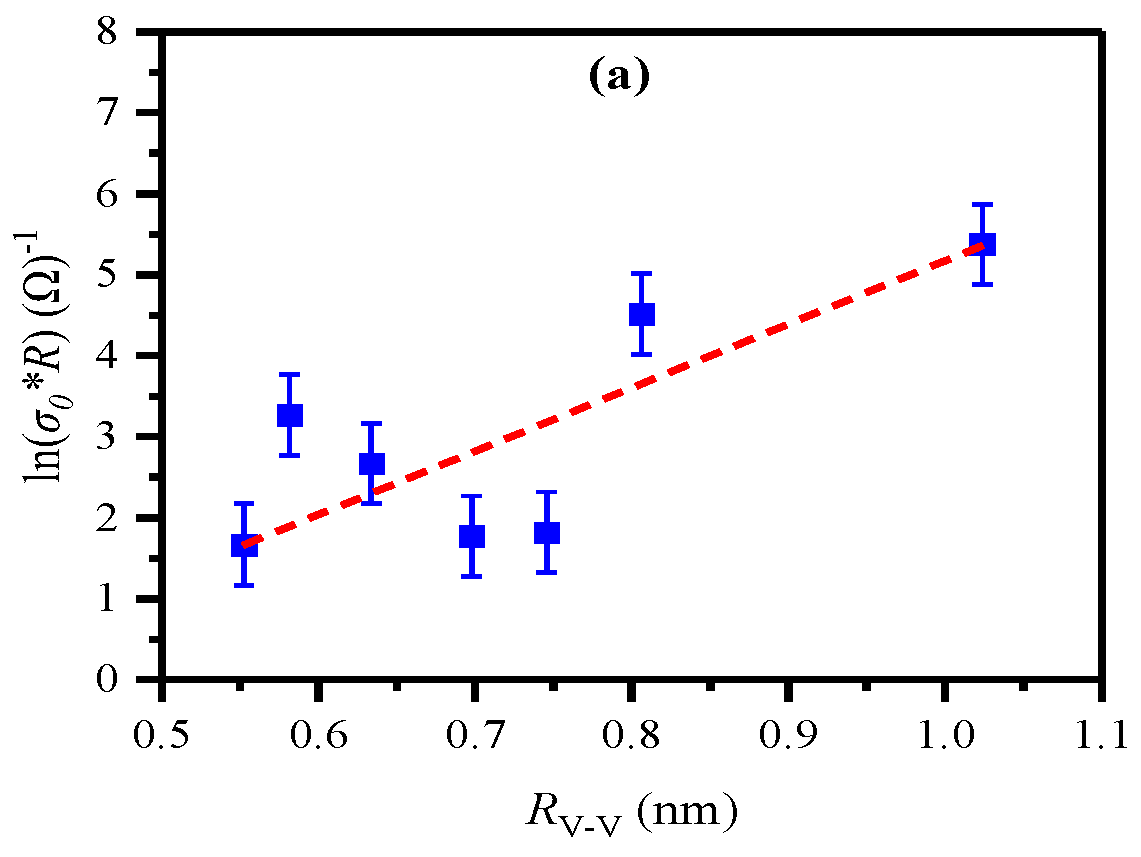
Figure 4.
Log ρ and activation energy at 493 K with respect to [V/(V+Sb)] of glasses 35P2O5 -xV2O5 -(65–x) Sb2O3
Figure 4.
Log ρ and activation energy at 493 K with respect to [V/(V+Sb)] of glasses 35P2O5 -xV2O5 -(65–x) Sb2O3
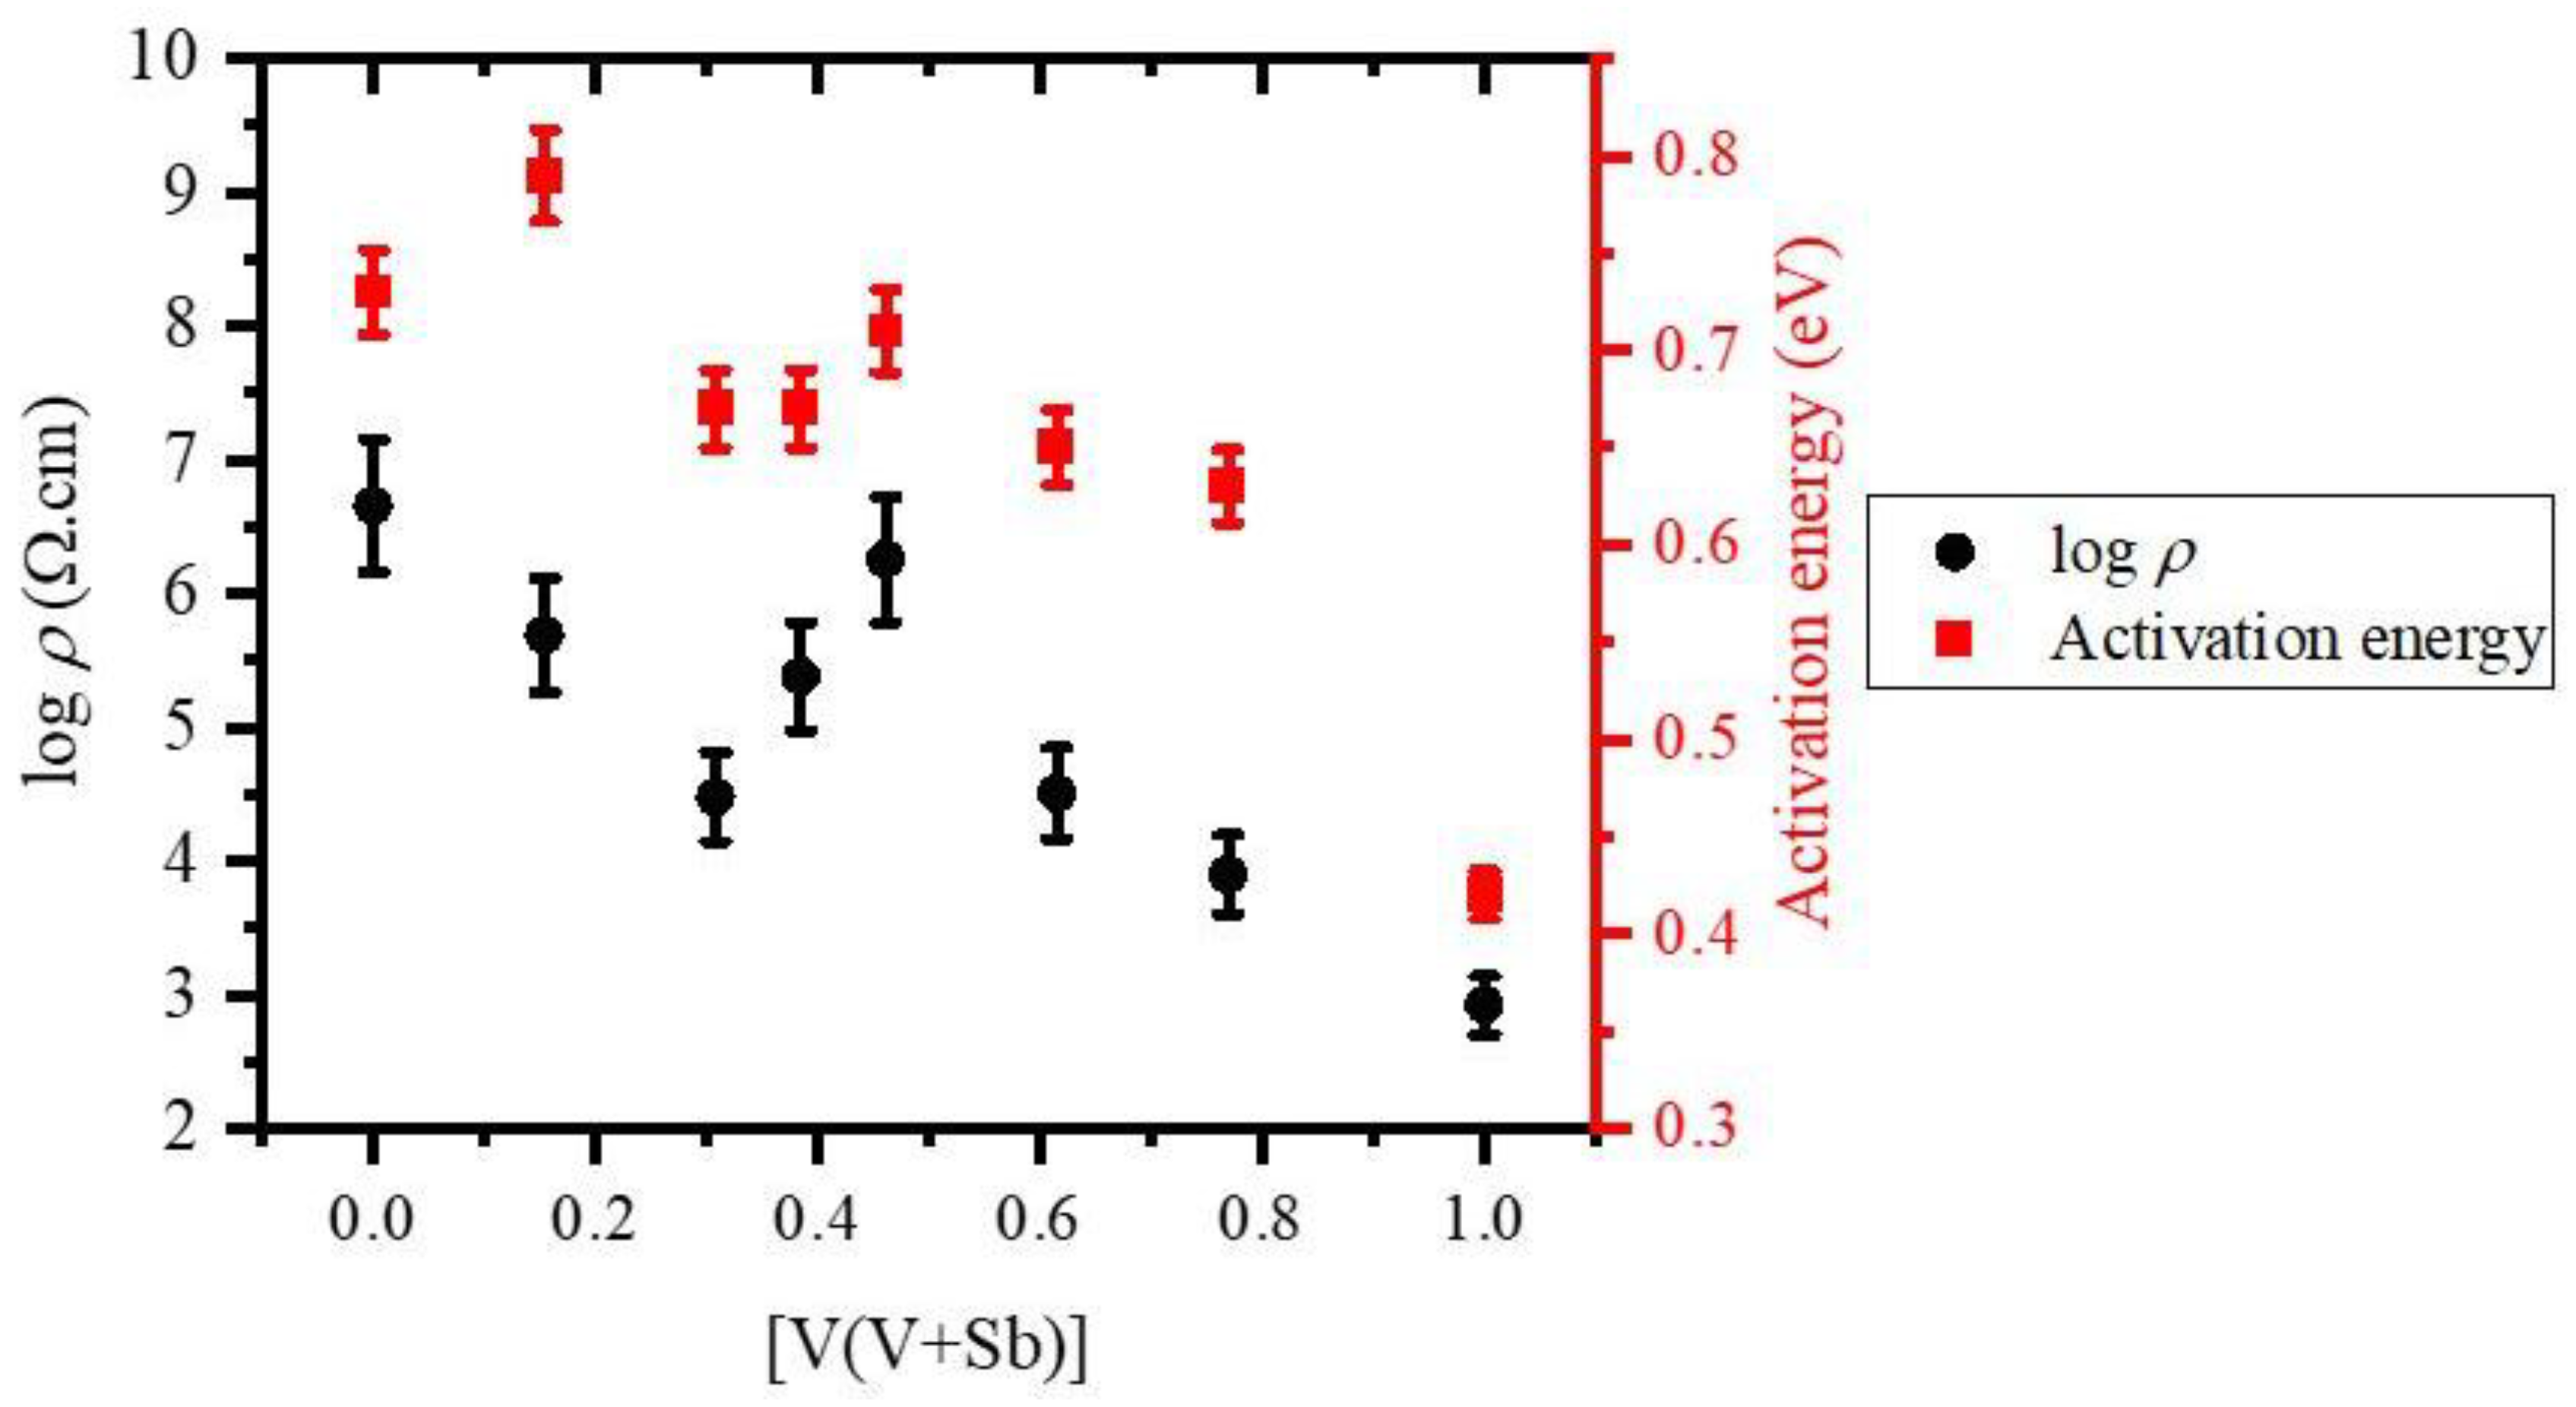
Figure 5.
Optical absorption spectra of 35P2O5-xV2O5 -(65–x)Sb2O3 glasses using a radiation of 250-3000 nm wavelength.
Figure 5.
Optical absorption spectra of 35P2O5-xV2O5 -(65–x)Sb2O3 glasses using a radiation of 250-3000 nm wavelength.
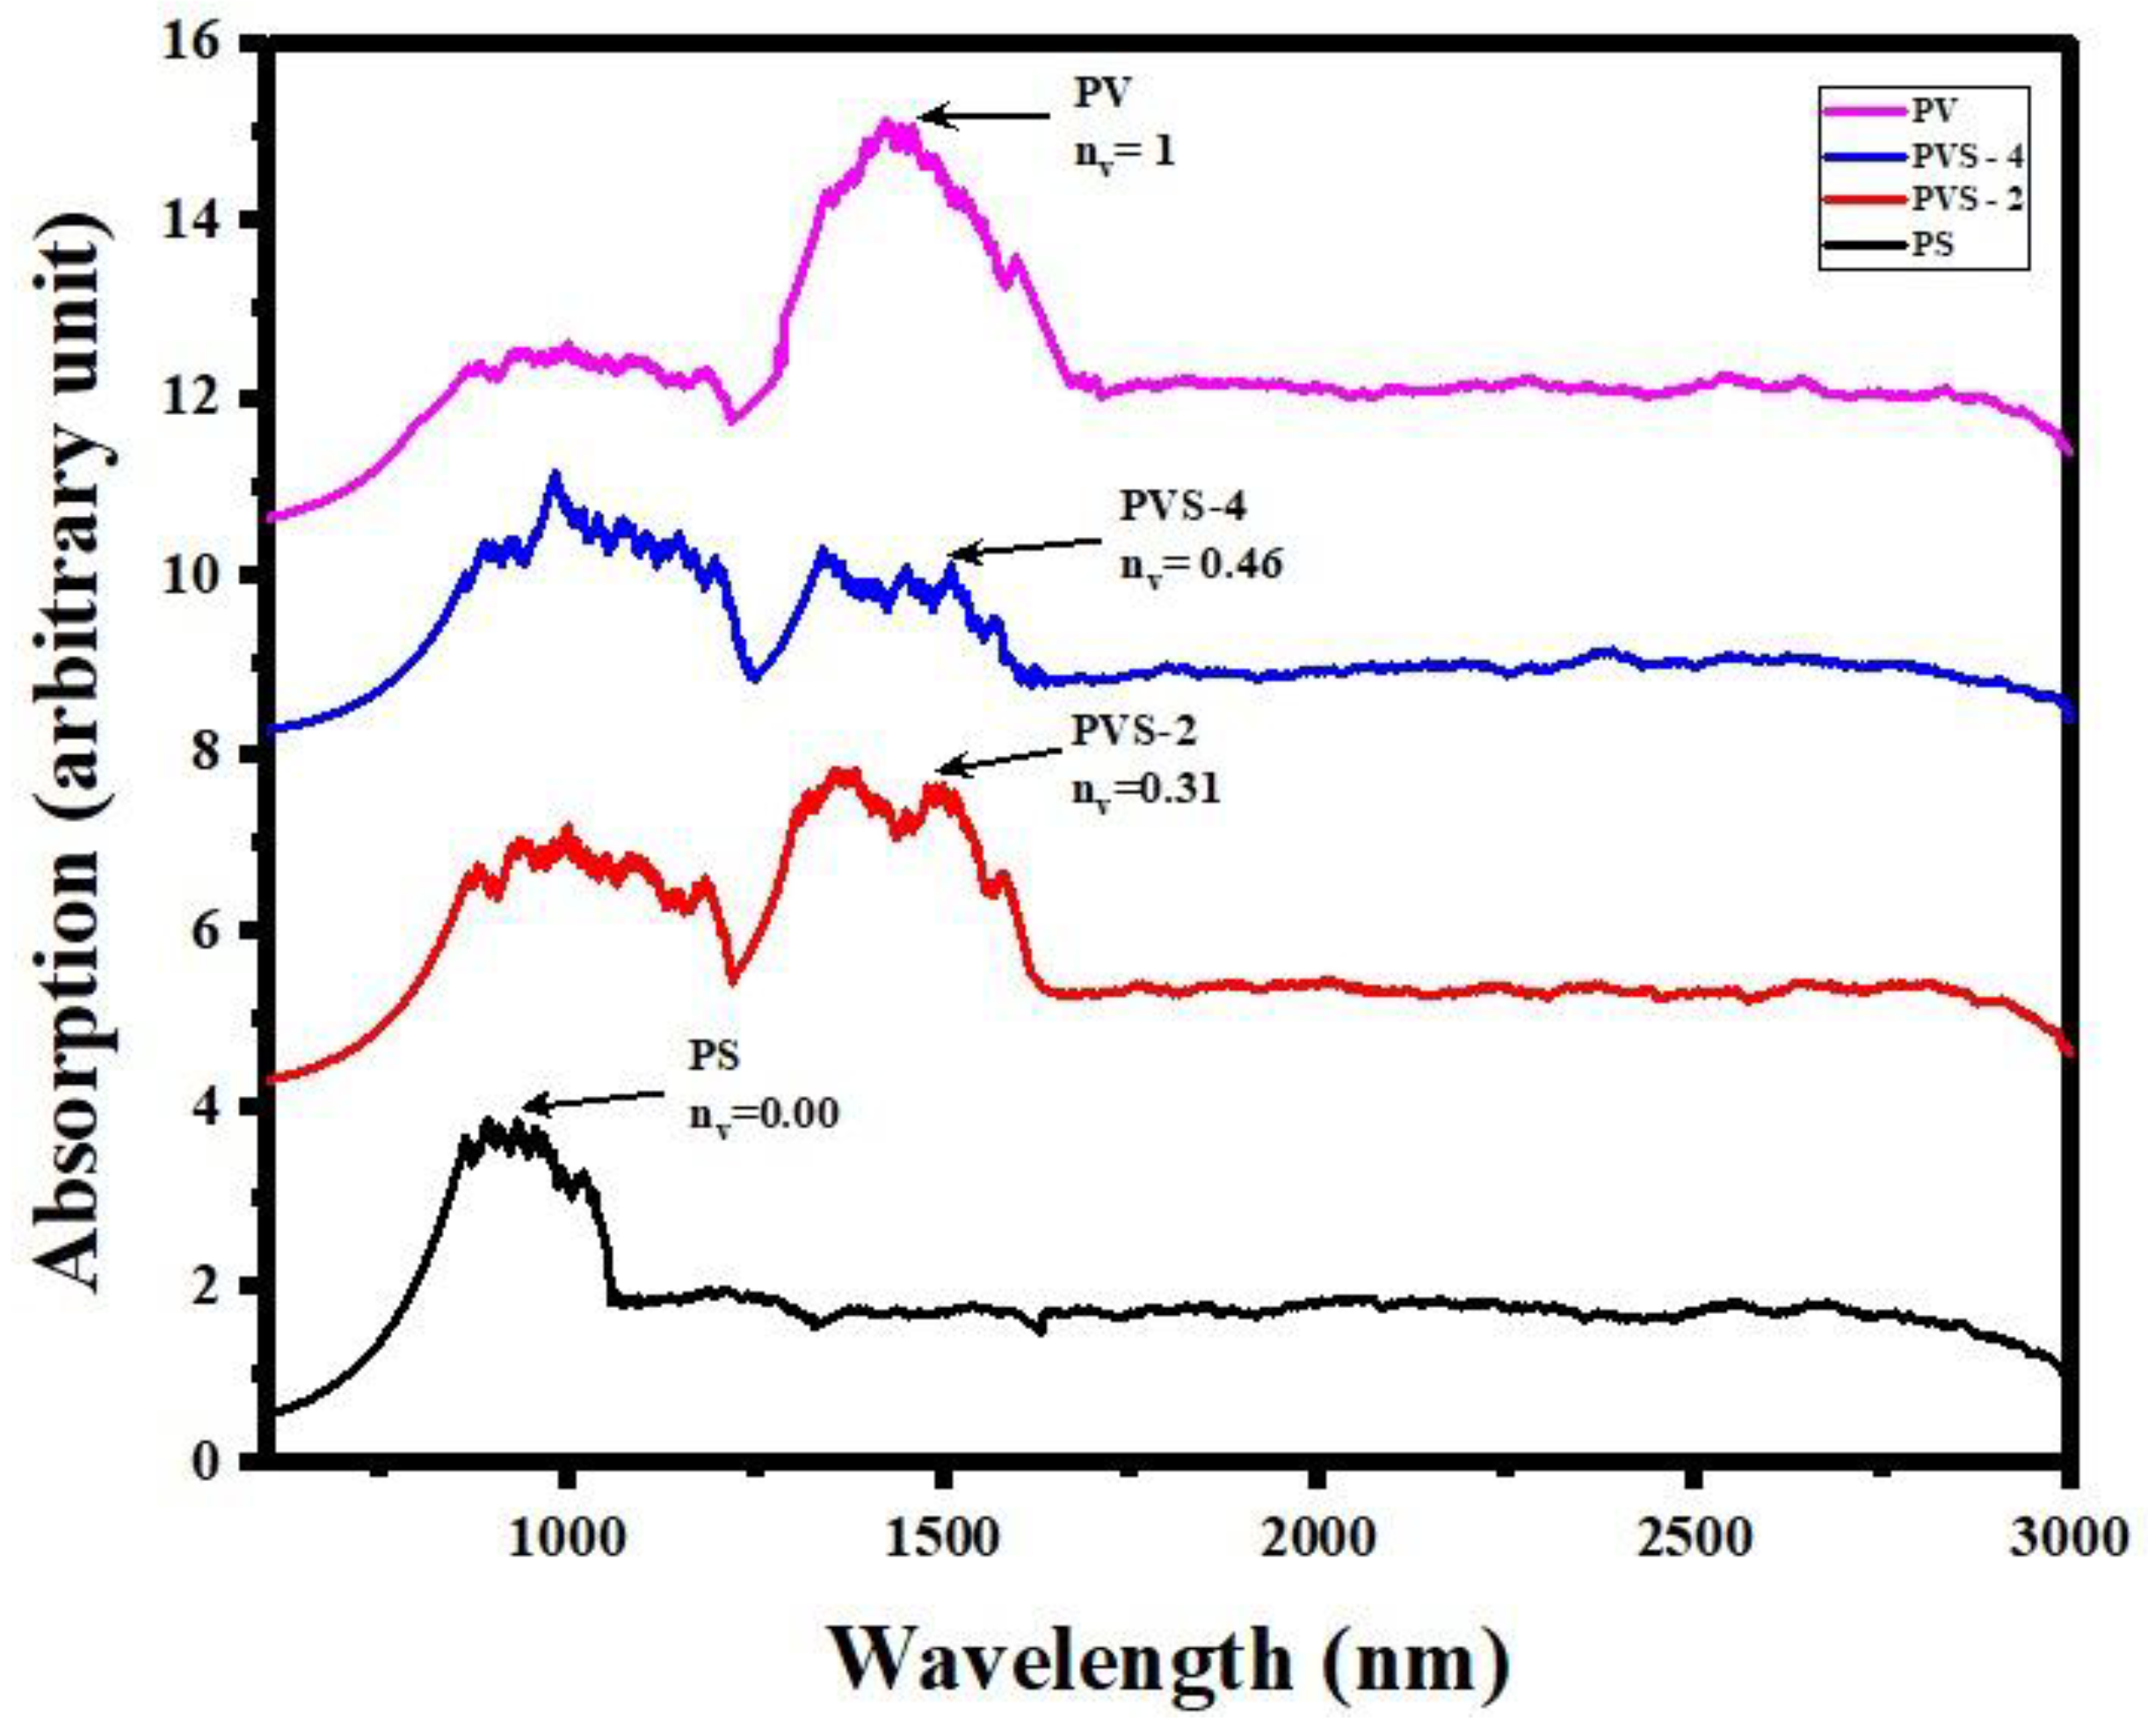
Figure 6.
Density of xV2O5 –35P2O5 binary glasses with respect to [V/(V+P)].
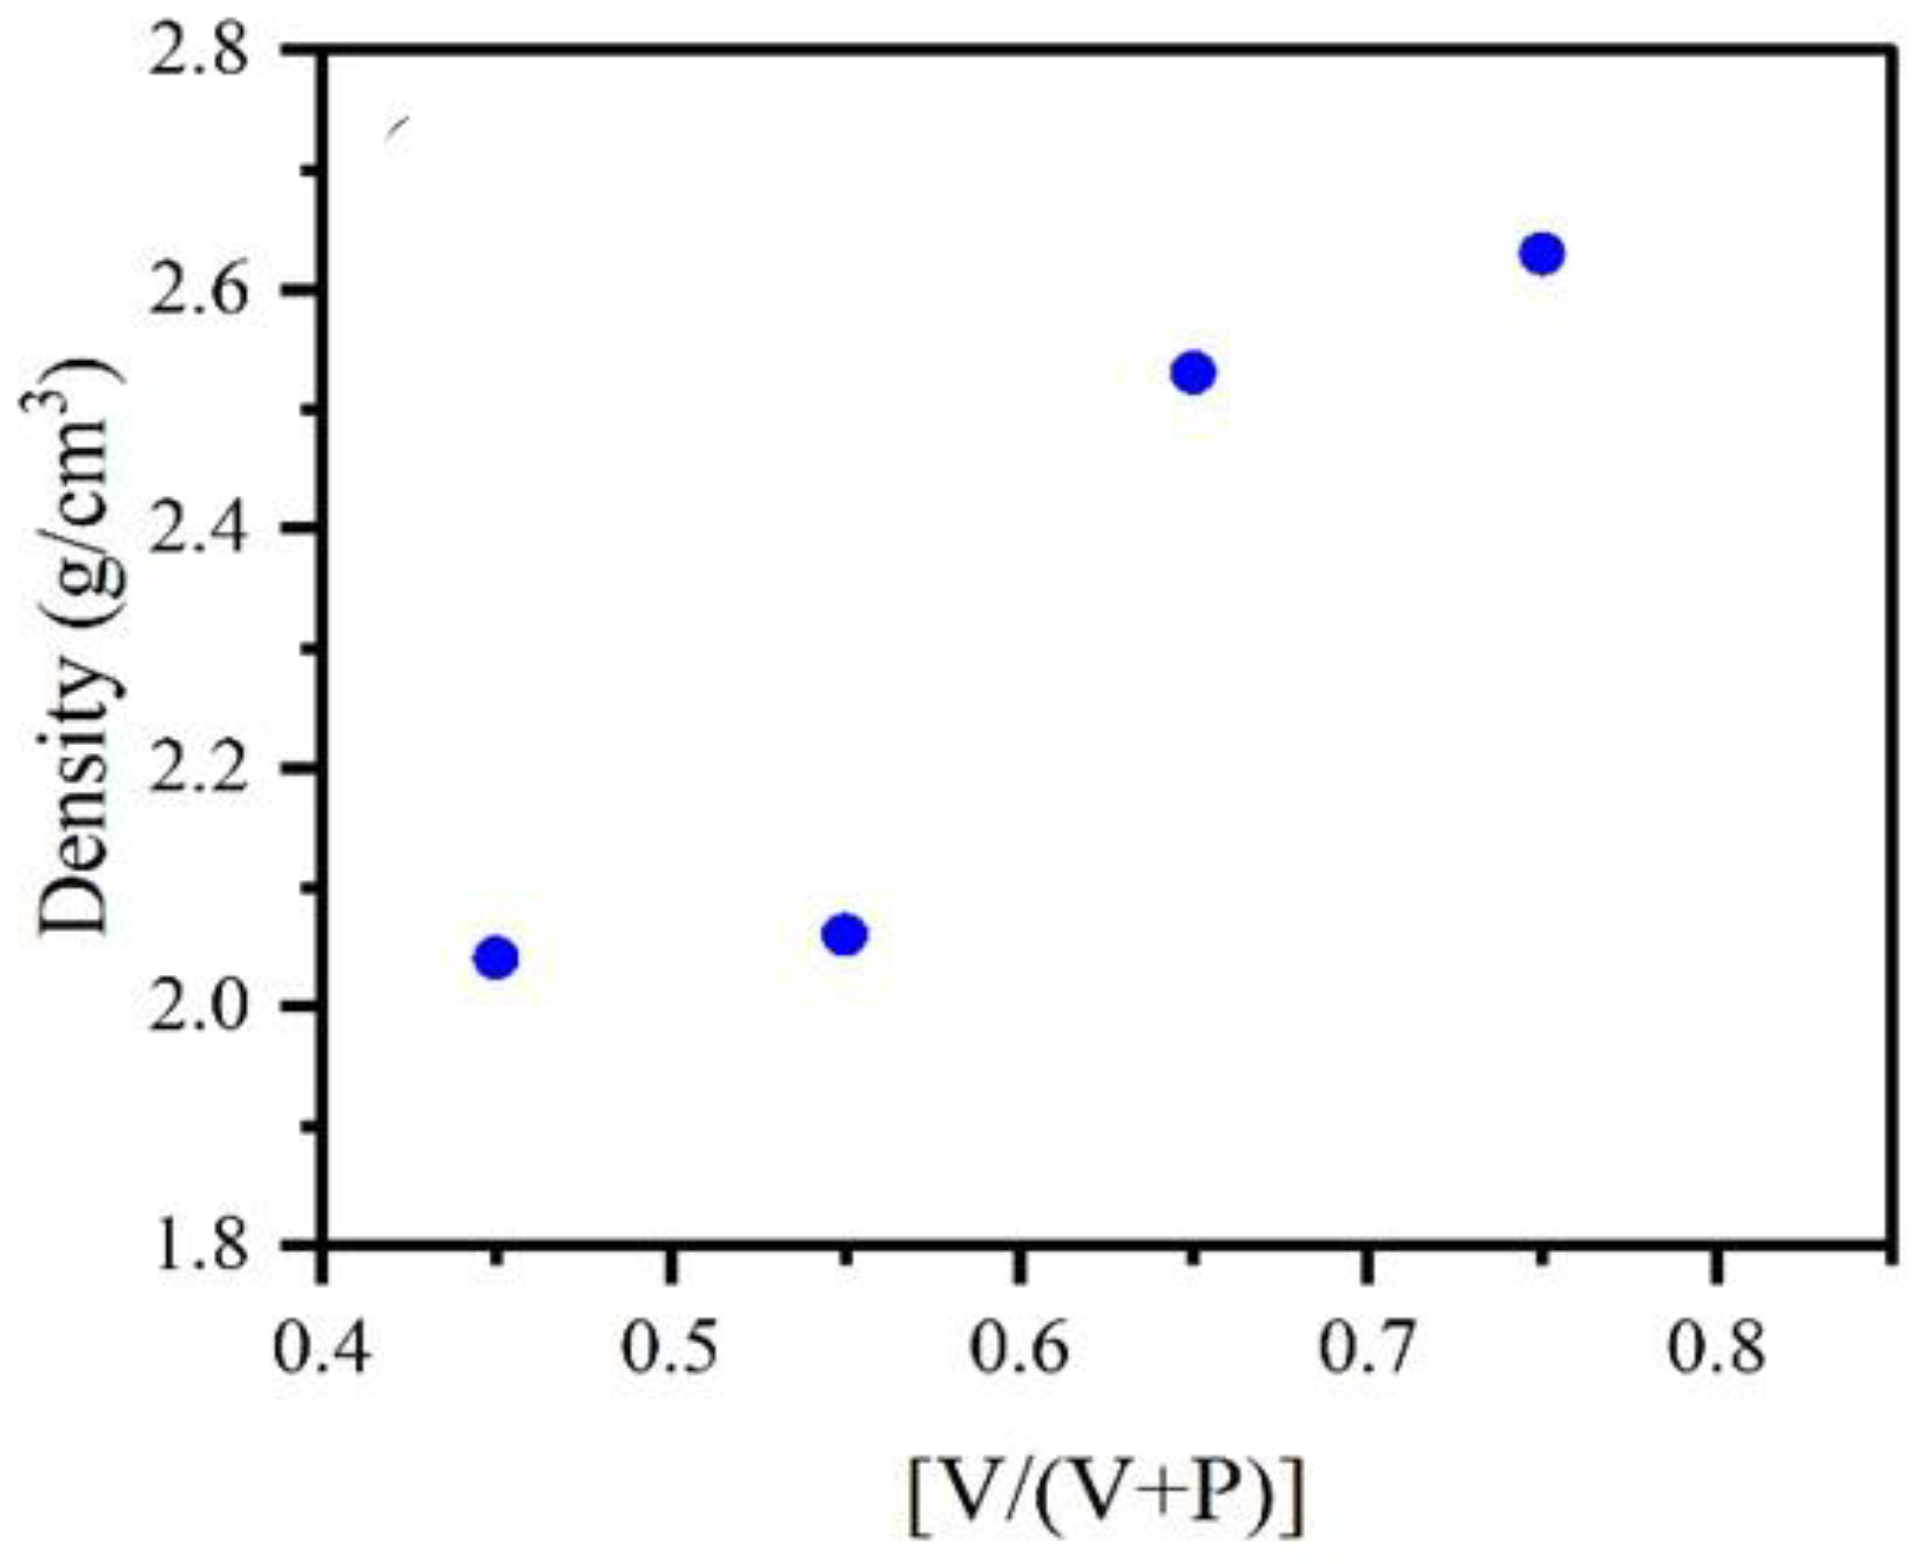
Figure 7.
a) The glass transition temperature variation of (100-x) P2O5 – xV2O5 glasses with respect to [V/(V+P)] b) The glass transition temperature variation of 35P2O5 -xV2O5 -(65–x) Sb2O3 glasses with respect to [V/(V+Sb)].
Figure 7.
a) The glass transition temperature variation of (100-x) P2O5 – xV2O5 glasses with respect to [V/(V+P)] b) The glass transition temperature variation of 35P2O5 -xV2O5 -(65–x) Sb2O3 glasses with respect to [V/(V+Sb)].
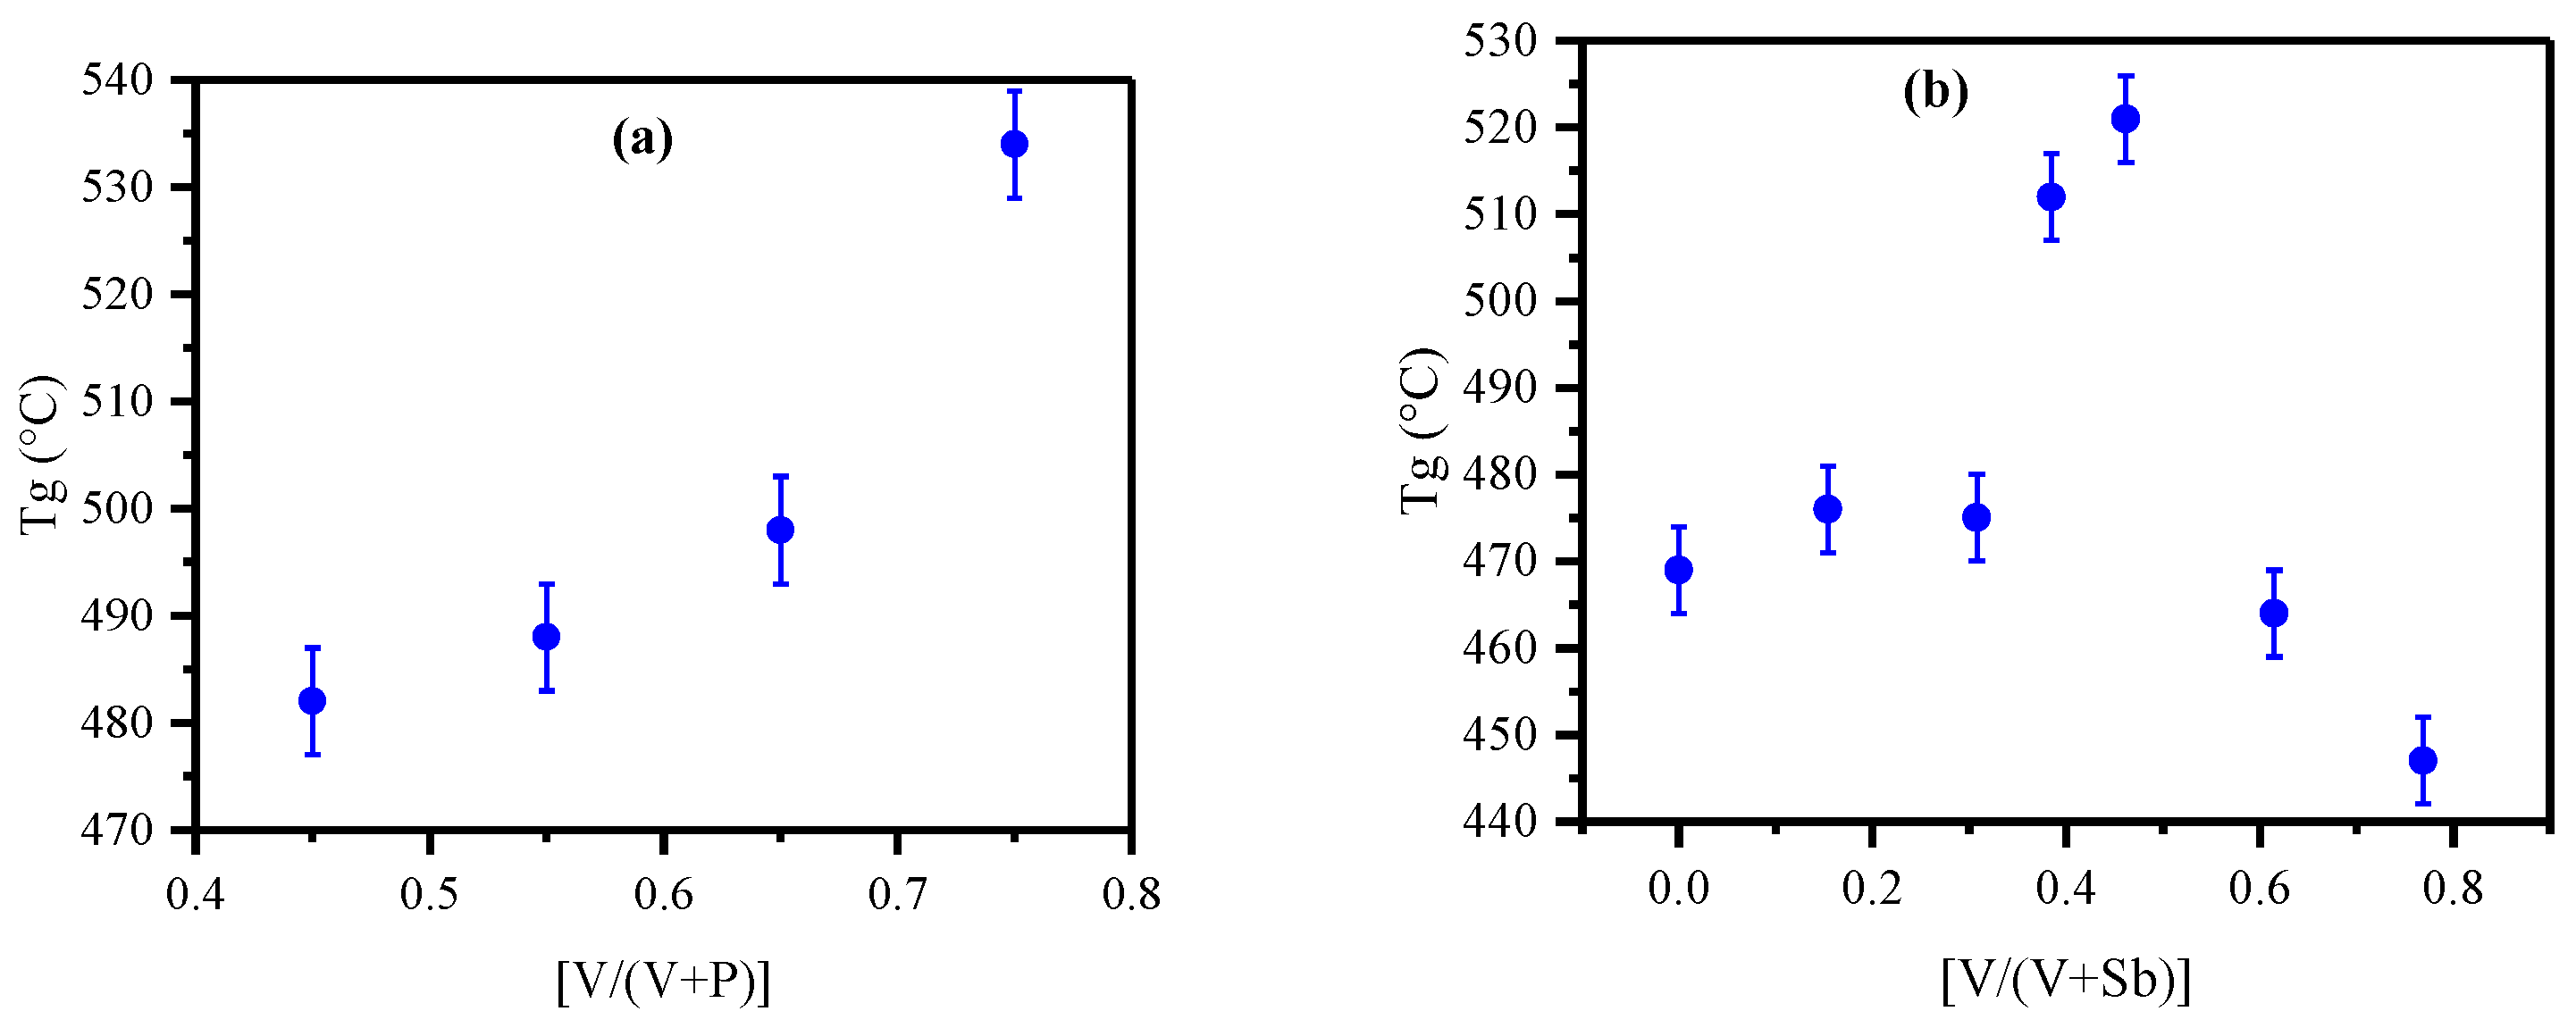

Table 1.
(Binary) PV glass XRF normalized chemical composition and glass transition temperature.
| Glass ID |
[V/(V+P)] |
P2O5 (mole %) | V2O5 (mole %) | Glass transition temperature(Tg) (°C) | ||
| Nominal | XRF normalize | Nominal | XRF normalize | |||
| PV-1 | 0.45 | 55 | 48.95 | 45 | 51.05 | 482 |
| PV-2 | 0.55 | 45 | 41.42 | 55 | 58.58 | 488 |
| PV-3 | 0.65 | 35 | 30.32 | 65 | 69.68 | 498 |
| PV-4 | 0.75 | 25 | 23.49 | 75 | 76.51 | 534 |
Table 2.
(Ternary) PVS glass chemical composition (nominal and XRF normalized), and glass transition temperature.
Table 2.
(Ternary) PVS glass chemical composition (nominal and XRF normalized), and glass transition temperature.
| Glass ID | [V/ (V + Sb)] | P2O5 (mole %) | V2O5 (mole %) | Sb2O3 (mole %) | Glass transition temperature(Tg) (°C) | |||
| Nominal | XRF normalize | Nominal | XRF normalize | Nominal | XRF normalize | |||
| PS | 0.00 | 35 | 35.20 | 0 | 0.00 | 65 | 64.80 | 469 |
| PVS-1 | 0.15 | 35 | 46.6 | 10 | 13.3 | 55 | 40.03 | 476 |
| PVS-2 | 0.31 | 35 | 32.55 | 20 | 27.93 | 45 | 39.52 | 475 |
| PVS-3 | 0.38 | 35 | 38.55 | 25 | 29.04 | 40 | 32.41 | 512 |
| PVS-4 | 0.46 | 35 | 34.11 | 30 | 31.54 | 35 | 34.36 | 521 |
| PVS-5 | 0.62 | 35 | 38.28 | 40 | 43.33 | 25 | 18.39 | 464 |
| PVS-6 | 0.77 | 35 | 38.84 | 50 | 51.23 | 15 | 9.93 | 447 |
| PV | 1.00 | 35 | 30.32 | 65 | 69.68 | 0.00 | 0.00 | 498 |
Table 3.
Comparison of the physical parameters of P2O5 – V2O5 glasses.
| Glass ID |
[V/(V+P)] Nominal |
Density (g/cm3) | Activation energy (W) (eV) | Resistivity (ρ) at 493K (Ωcm) |
Concentration of Vanadium ions (cm)-3 (NV) |
| PV-1 | 0.45 | 2.04 | 0.60 | 4.90E+03 | 3.45E+21 |
| PV-2 | 0.55 | 2.06 | 0.59 | 1.83E+03 | 4.16E+21 |
| PV-3 | 0.65 | 2.53 | 0.42 | 8.37E+02 | 5.92E+21 |
| PV-4 | 0.75 | 2.63 | 0.40 | 2.164E+02 | 6.90E+21 |
Table 4.
Comparison and transport data of V2O5 – Sb2O3 – P2O5 glasses.
| Glass ID | [V/(V+Sb)] |
Activation energy (W, eV) |
Resistivity at 493K ρ (Ωcm) | Pre-exponential | Wavelength* (nm) |
| PS | 0.00 | 0.73 | 4.50E+6 | 10.96 | 849 |
| PVS-1 | 0.15 | 0.79 | 4.92E+5 | 190.55 | 774 |
| PVS-2 | 0.31 | 0.67 | 3.00E+4 | 269.15 | 898 |
| PVS-3 | 0.38 | 0.67 | 2.43E+5 | 11.48 | 984 |
| PVS-4 | 0.46 | 0.71 | 1.79E+6 | 12.59 | 849 |
| PVS-5 | 0.62 | 0.65 | 3.20E+4 | 76.61 | 911 |
| PVS-6 | 0.77 | 0.63 | 7.93E+3 | 275.42 | 984 |
| PV | 1.00 | 0.42 | 8.37E+2 | 20.42 | 1430 |
* Wavelength of the optical absorption band peak.
Table 5.
Comparison of the physical parameters of V2O5 – Sb2O3 – P2O5 glasses.
| Glass ID | [V/(V+Sb)] | Density (g/cm3) | N Concentration of ions (cm)-3 | V-V distance R (nm) |
rp (nm) |
|
| NV | NSb | |||||
| PS | 0.00 | 3.74 | 0.00E+00 | 6.14E+21 | ||
| PVS-1 | 0.15 | 3.53 | 9.35E+20 | 5.13E+21 | 1.02 | 0.41 |
| PVS-2 | 0.31 | 3.44 | 1.91E+21 | 4.29E+21 | 0.81 | 0.32 |
| PVS-3 | 0.38 | 3.38 | 2.41E+21 | 3.86E+21 | 0.75 | 0.30 |
| PVS-4 | 0.46 | 3.36 | 2.95E+21 | 3.44E+21 | 0.70 | 0.28 |
| PVS-5 | 0.62 | 3.18 | 3.93E+21 | 2.45E+21 | 0.63 | 0.26 |
| PVS-6 | 0.77 | 3.11 | 5.09E+21 | 1.53E+21 | 0.58 | 0.23 |
| PV | 1.00 | 2.53 | 5.93E+21 | 0.00E+00 | 0.55 | 0.22 |
Table 6.
Comparison of ternary PVS-6 and binary PV-1, PV and PS glasses with comparable vanadium concentration.
Table 6.
Comparison of ternary PVS-6 and binary PV-1, PV and PS glasses with comparable vanadium concentration.
| Glass ID | PVS-6 | PV-1 | PV | PS |
| V2O5 | 51.23 | 51.05 | 69.68 | 0.00 |
| P2O5 | 38.84 | 48.95 | 30.32 | 35.20 |
| Sb2O3 | 9.39 | 0.31 | 0.00 | 64.80 |
| Resistivity (ρ) at 493K (Ω cm) | 7.93E+3 | 4.90E+03 | 8.37E+2 | 4.50E+6 |
| Activation energy (W) (eV) | 0.63 | 0.60 | 0.42 | 0.73 |
Disclaimer/Publisher’s Note: The statements, opinions and data contained in all publications are solely those of the individual author(s) and contributor(s) and not of MDPI and/or the editor(s). MDPI and/or the editor(s) disclaim responsibility for any injury to people or property resulting from any ideas, methods, instructions or products referred to in the content. |
© 2025 by the authors. Licensee MDPI, Basel, Switzerland. This article is an open access article distributed under the terms and conditions of the Creative Commons Attribution (CC BY) license (http://creativecommons.org/licenses/by/4.0/).
Copyright: This open access article is published under a Creative Commons CC BY 4.0 license, which permit the free download, distribution, and reuse, provided that the author and preprint are cited in any reuse.


